Delivering on the MANAGEMENT Promise
24
Closer Look MANAGEMENT Delivering on the Promise Measuring Internal Audit Value and Performance CBOK The Global Internal Audit Common Body of Knowledge Jane Seago Sponsored by IIA–Charlotte Chapter IIA–Raleigh-Durham Chapter IIA–Triad Chapter
Transcript of Delivering on the MANAGEMENT Promise
Closer Look
MANAGEMENT
Delivering on the PromiseMeasuring Internal Audit Value and Performance
CBOKThe Global Internal Audit Common Body of Knowledge
Jane Seago
Sponsored by
IIA–Charlotte ChapterIIA–Raleigh-Durham ChapterIIA–Triad Chapter
2 ● Delivering on the Promise
About CBOK
The Global Internal Audit Common Body of Knowledge (CBOK) is the world’s largest ongoing study of the internal audit profession, including studies of inter-
nal audit practitioners and their stakeholders. One of the key components of CBOK 2015 is the global practitioner survey, which provides a comprehensive look at the activities and characteristics of internal auditors worldwide. This project builds on two previous global surveys of internal audit practitioners conducted by The IIA Research Foundation in 2006 (9,366 responses) and 2010 (13,582 responses).
Reports will be released on a monthly basis through July 2016 and can be downloaded free of charge thanks to the generous contributions and support from individuals, professional organizations, IIA chapters, and IIA institutes. More than 25 reports are planned in three formats: 1) core reports, which discuss broad topics, 2) closer looks, which dive deeper into key issues, and 3) fast facts, which focus on a specific region or idea. These reports will explore different aspects of eight knowledge tracks, including technology, risk, talent, and others.
Visit the CBOK Resource Exchange at www.theiia.org/goto/CBOK to download the latest reports as they become available.
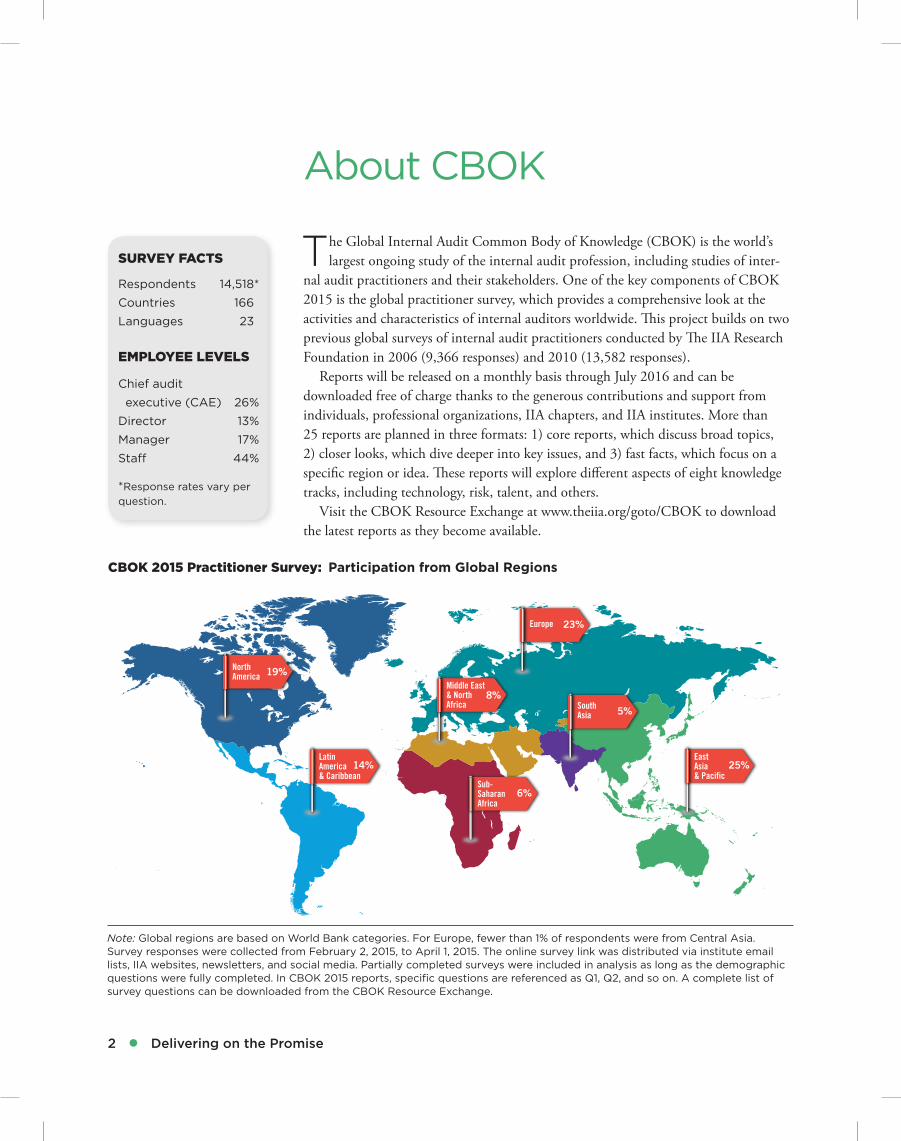
Middle East & North Africa
8%
Sub-Saharan Africa
6%
Latin America& Caribbean
14%
North America
19%
South Asia
5%
East Asia & Pacific
25%
Europe 23%
Note: Global regions are based on World Bank categories. For Europe, fewer than 1% of respondents were from Central Asia. Survey responses were collected from February 2, 2015, to April 1, 2015. The online survey link was distributed via institute email lists, IIA websites, newsletters, and social media. Partially completed surveys were included in analysis as long as the demographic questions were fully completed. In CBOK 2015 reports, specific questions are referenced as Q1, Q2, and so on. A complete list of survey questions can be downloaded from the CBOK Resource Exchange.
CBOK 2015 Practitioner Survey: Participation from Global Regions
SURVEY FACTS
Respondents 14,518*
Countries 166
Languages 23
EMPLOYEE LEVELS
Chief audit
executive (CAE) 26%
Director 13%
Manager 17%
Staff 44%
*Response rates vary per question.
www.theiia.org/goto/CBOK ● 3
Contents
Executive Summary 4
Introduction 5
1 Delivering the Value of Internal Audit 7
2 Rating the Performance 9
3 Taking a Balanced Approach to Measurement Methods 11
4 Aligning Performance Perspectives between Internal Audit and Stakeholders 13
Conclusion 15
Appendix A 16
Resources 22
CBOK Knowledge
Tracks
Future
Global Perspective
Governance
Management
Risk
Standards & Certifications
Talent
Technology
4 ● Delivering on the Promise
The ever-increasing complexity of business in an always-on, globally connected world means that there is a growing list of ways that internal auditors can deliver
value to their organizations. They can provide assurance over specific aspects of the business, offer insights and recommendations to maximize return on organizational activities, and present objectivity to decision makers—all of which deliver on internal audit’s value proposition. However, as a practical matter, time and resources are lim-ited. How can internal auditors identify and focus on the activities that are of most value to their clients and key stakeholders?
This report presents a step-by-step process to ensure that expectations are under-stood and agreed upon, and appropriate measures are developed to drive and track performance. Readers can use it to compare their value and performance practices to other organizations based on insights from the CBOK 2015 Global Internal Audit Survey, the largest ongoing study of the internal audit profession in the world. These insights can help practitioners at all levels deliver on the internal audit value proposi-tion of assurance, insight, and objectivity.
Executive Summary
www.theiia.org/goto/CBOK ● 5
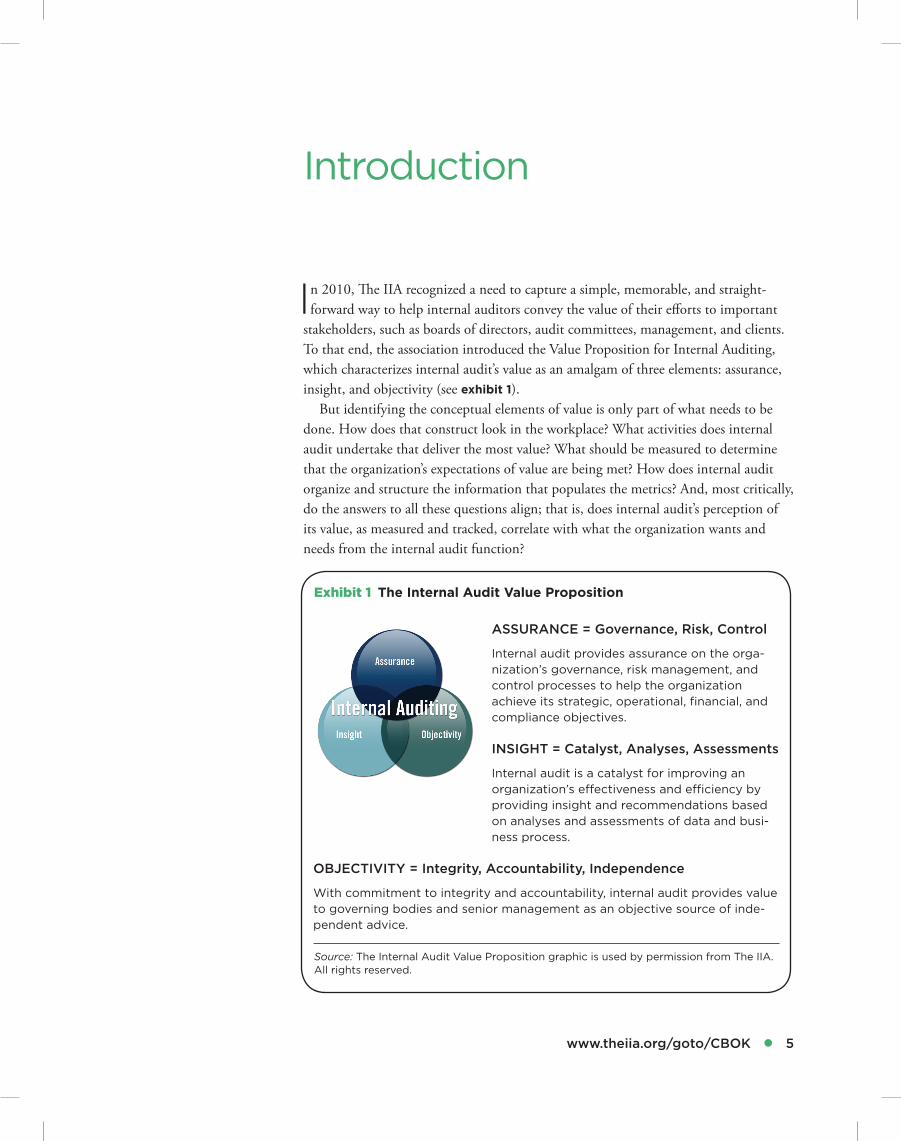
In 2010, The IIA recognized a need to capture a simple, memorable, and straight-forward way to help internal auditors convey the value of their efforts to important
stakeholders, such as boards of directors, audit committees, management, and clients. To that end, the association introduced the Value Proposition for Internal Auditing, which characterizes internal audit’s value as an amalgam of three elements: assurance, insight, and objectivity (see exhibit 1).
But identifying the conceptual elements of value is only part of what needs to be done. How does that construct look in the workplace? What activities does internal audit undertake that deliver the most value? What should be measured to determine that the organization’s expectations of value are being met? How does internal audit organize and structure the information that populates the metrics? And, most critically, do the answers to all these questions align; that is, does internal audit’s perception of its value, as measured and tracked, correlate with what the organization wants and needs from the internal audit function?
Introduction
ASSURANCE = Governance, Risk, Control
Internal audit provides assurance on the orga-nization’s governance, risk management, and control processes to help the organization achieve its strategic, operational, financial, and compliance objectives.
INSIGHT = Catalyst, Analyses, Assessments
Internal audit is a catalyst for improving an organization’s effectiveness and efficiency by providing insight and recommendations based on analyses and assessments of data and busi-ness process.
OBJECTIVITY = Integrity, Accountability, Independence
With commitment to integrity and accountability, internal audit provides value to governing bodies and senior management as an objective source of inde-pendent advice.
Exhibit 1 The Internal Audit Value Proposition
Source: The Internal Audit Value Proposition graphic is used by permission from The IIA. All rights reserved.
6 ● Delivering on the Promise
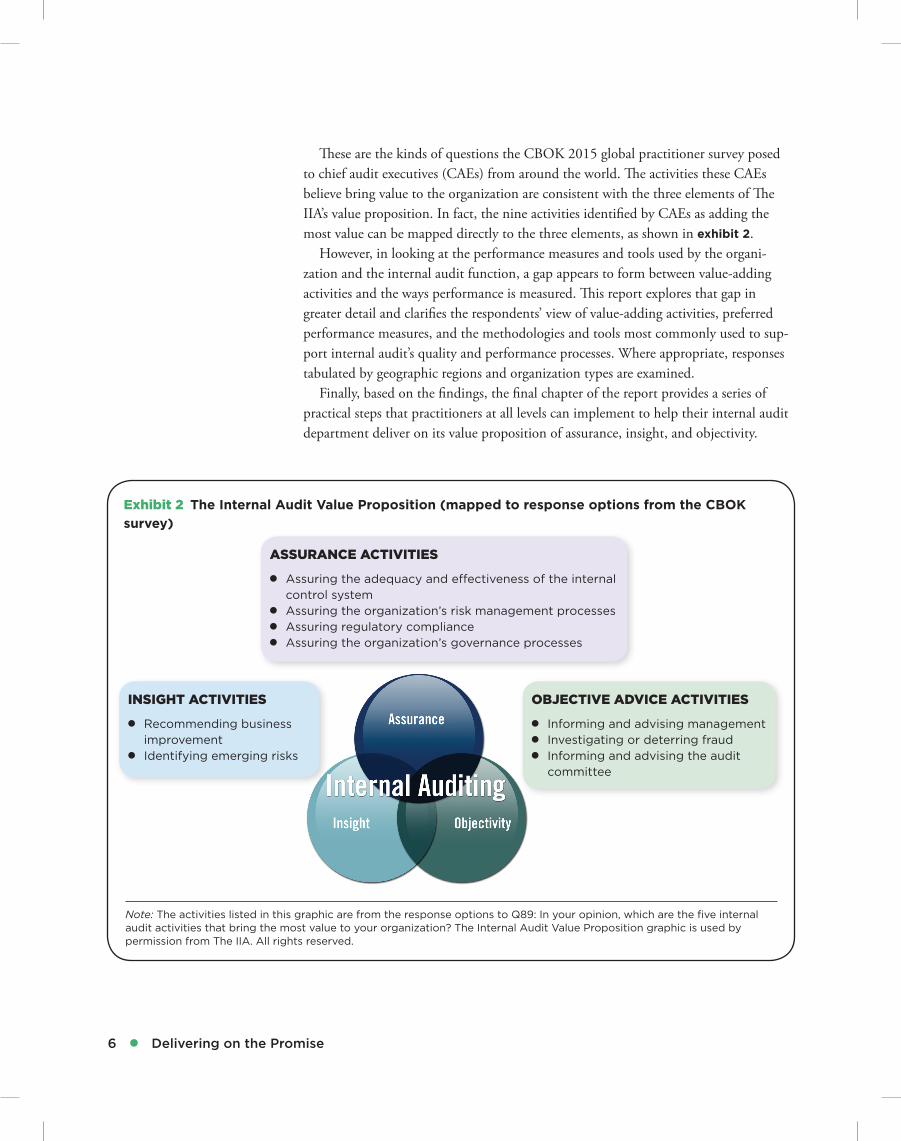
These are the kinds of questions the CBOK 2015 global practitioner survey posed to chief audit executives (CAEs) from around the world. The activities these CAEs believe bring value to the organization are consistent with the three elements of The IIA’s value proposition. In fact, the nine activities identified by CAEs as adding the most value can be mapped directly to the three elements, as shown in exhibit 2.
However, in looking at the performance measures and tools used by the organi-zation and the internal audit function, a gap appears to form between value-adding activities and the ways performance is measured. This report explores that gap in greater detail and clarifies the respondents’ view of value-adding activities, preferred performance measures, and the methodologies and tools most commonly used to sup-port internal audit’s quality and performance processes. Where appropriate, responses tabulated by geographic regions and organization types are examined.
Finally, based on the findings, the final chapter of the report provides a series of practical steps that practitioners at all levels can implement to help their internal audit department deliver on its value proposition of assurance, insight, and objectivity.
Exhibit 2 The Internal Audit Value Proposition (mapped to response options from the CBOK survey)
Note: The activities listed in this graphic are from the response options to Q89: In your opinion, which are the five internal audit activities that bring the most value to your organization? The Internal Audit Value Proposition graphic is used by permission from The IIA. All rights reserved.
ASSURANCE ACTIVITIES
●● Assuring the adequacy and effectiveness of the internal control system
●● Assuring the organization’s risk management processes●● Assuring regulatory compliance●● Assuring the organization’s governance processes
INSIGHT ACTIVITIES
●● Recommending business improvement
●● Identifying emerging risks
OBJECTIVE ADVICE ACTIVITIES
●● Informing and advising management●● Investigating or deterring fraud●● Informing and advising the audit
committee
www.theiia.org/goto/CBOK ● 7
Internal audit practitioners around the world are providing value to their orga-
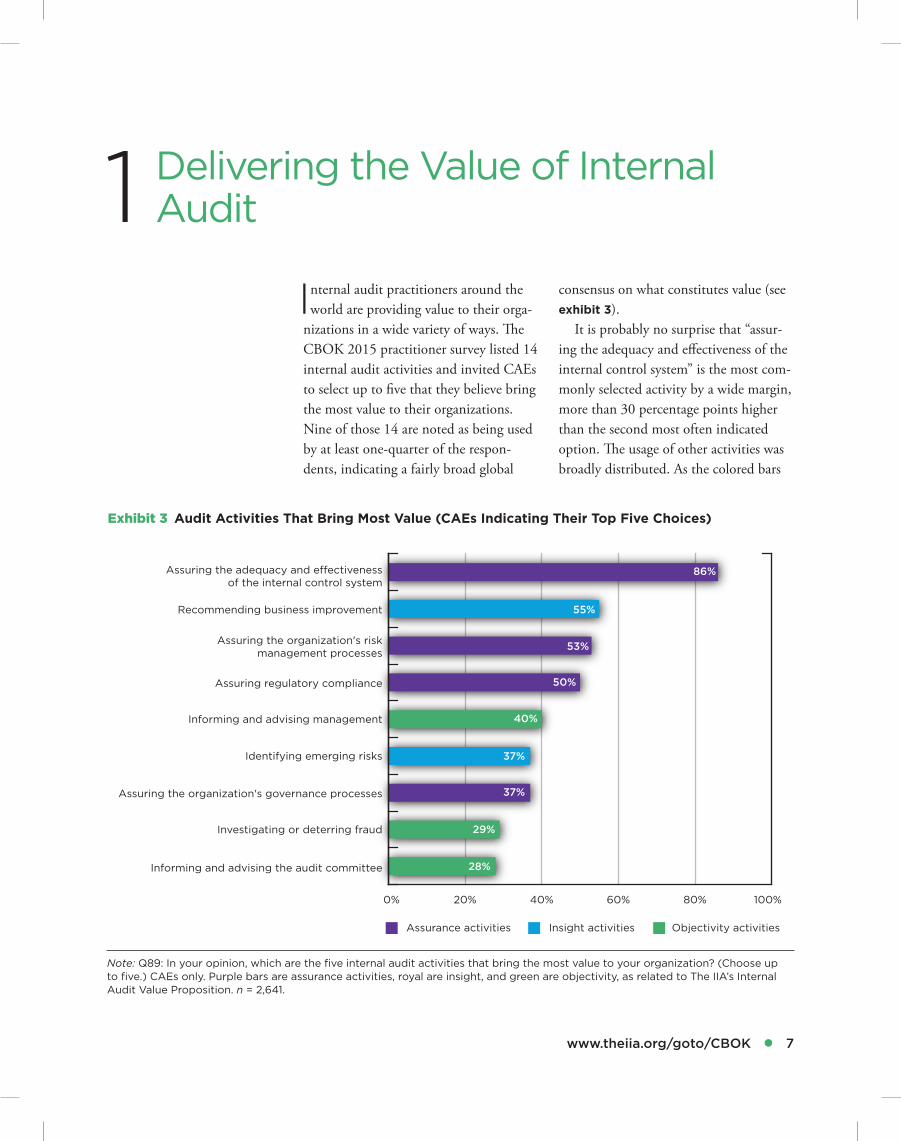
nizations in a wide variety of ways. The CBOK 2015 practitioner survey listed 14 internal audit activities and invited CAEs to select up to five that they believe bring the most value to their organizations. Nine of those 14 are noted as being used by at least one-quarter of the respon-dents, indicating a fairly broad global
consensus on what constitutes value (see exhibit 3).
It is probably no surprise that “assur-ing the adequacy and effectiveness of the internal control system” is the most com-monly selected activity by a wide margin, more than 30 percentage points higher than the second most often indicated option. The usage of other activities was broadly distributed. As the colored bars
1 Delivering the Value of Internal Audit
0% 20% 40% 60% 80% 100%
Informing and advising the audit committee
Investigating or deterring fraud
Assuring the organization's governance processes
Identifying emerging risks
Informing and advising management
Assuring regulatory compliance
Assuring the organization's risk management processes
Recommending business improvement
Assuring the adequacy and e�ectiveness of the internal control system
86%
55%
53%
50%
40%
37%
37%
29%
28%
Insight activities Objectivity activitiesAssurance activities
Exhibit 3 Audit Activities That Bring Most Value (CAEs Indicating Their Top Five Choices)
Note: Q89: In your opinion, which are the five internal audit activities that bring the most value to your organization? (Choose up to five.) CAEs only. Purple bars are assurance activities, royal are insight, and green are objectivity, as related to The IIA’s Internal Audit Value Proposition. n = 2,641.
8 ● Delivering on the Promise
❝ Most work on
assurance focuses
on assessing the
effectiveness of
controls (Is the
control followed?)
and less work or
no work at all is
done on assuring
the adequacy
of controls (Has
the control been
designed properly
to mitigate risk?).
If auditors are to
add value to the
business, they
should not only
assess whether
a procedure is
followed but also
determine whether
that procedure can
mitigate the risk.❞
—Augustino Mbogella, Chief Internal Auditor, NMB,
Dar es salaam, Tanzania
in exhibit 3 show, there is a mix of the three elements of internal audit’s value proposition—assurance (purple), insight (blue), and objectivity (green)—but the highest percentages are for assurance.
In the area of insight, more than half of respondents say that “recommending business improvement” is an important way they add value, which is a strong, positive sign that internal audit is going beyond assurance in many organiza-tions. In addition, it is significant that more than one-third of the CAEs indi-cated “identifying emerging risks” as an important value-adding activity. This aligns with the current focus on risk-based auditing, says Tania Stegemann, executive audit manager, CIMIC Group Ltd, Melbourne, Australia. “It is critical that auditors understand the key risks facing the organization as well as the key controls in place. This is fundamental to risk-based auditing and should form the basis of the annual audit plan.”
For the area of objectivity (or objective advice, represented by green bars), about a third of respondents say their top five value activities include “informing and advising management,” “investigating or deterring fraud,” or “informing and advising the audit committee.”
It is important to remember that survey respondents were asked to only choose their top five activities, so they were limited in how many activities they could select. This means that they may be involved in other areas, but they did not choose them as a top five value driver.
Value drivers can vary from one organization to the next for many rea-sons: industry sector, organization type, management preferences, geographic region, and regulatory requirements, to name a few. For details on value-adding internal audit activities by organization and region type, see exhibit A1 and exhibit A2 in the appendix.
www.theiia.org/goto/CBOK ● 9
Because of the nature of internal auditing, perhaps few professions
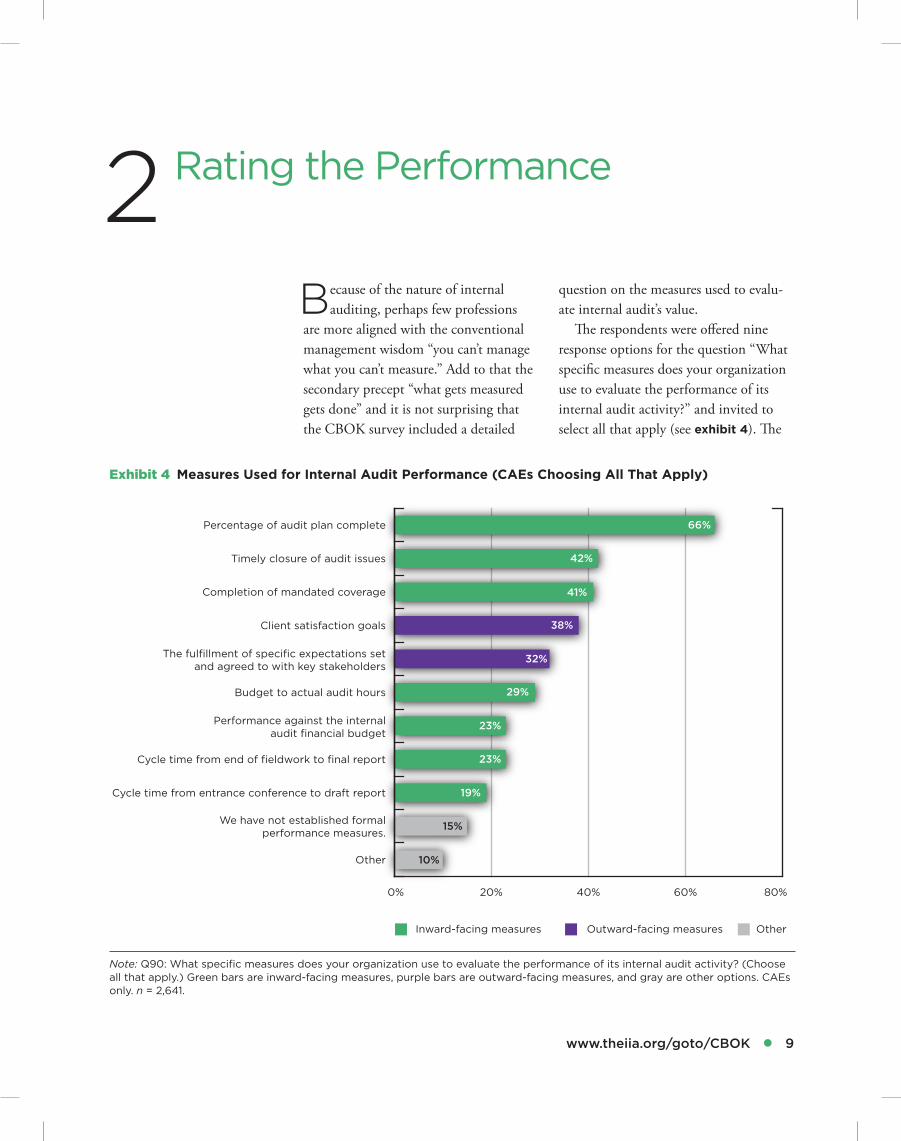
are more aligned with the conventional management wisdom “you can’t manage what you can’t measure.” Add to that the secondary precept “what gets measured gets done” and it is not surprising that the CBOK survey included a detailed
question on the measures used to evalu-ate internal audit’s value.
The respondents were offered nine response options for the question “What specific measures does your organization use to evaluate the performance of its internal audit activity?” and invited to select all that apply (see exhibit 4). The
2 Rating the Performance
0% 20% 40% 60% 80%
Other
We have not established formal performance measures.
Cycle time from entrance conference to draft report
Cycle time from end of fieldwork to final report
Performance against the internal audit financial budget
Budget to actual audit hours
The fulfillment of specific expectations set and agreed to with key stakeholders
Client satisfaction goals
Completion of mandated coverage
Timely closure of audit issues
Percentage of audit plan complete 66%
42%
41%
38%
32%
29%
23%
23%
19%
15%
10%
Outward-facing measures OtherInward-facing measures
Note: Q90: What specific measures does your organization use to evaluate the performance of its internal audit activity? (Choose all that apply.) Green bars are inward-facing measures, purple bars are outward-facing measures, and gray are other options. CAEs only. n = 2,641.
Exhibit 4 Measures Used for Internal Audit Performance (CAEs Choosing All That Apply)
10 ● Delivering on the Promise
top selection, by a considerable margin, was “percentage of audit plan complete,” chosen by 66% of respondents (this per-centage was similar to the CBOK 2010 survey results). “Timely closure of audit issues” and “completion of mandated coverage” were virtually tied for a some-what distant second at just over 40%.
In considering the meaning of these top three choices, it is useful to note the difference between inward-facing and outward-facing measures. Inward-facing measures focus on how work is done internally and, very generally speaking, tend to incline toward administrative effi-ciency. Outward-facing measures focus on the customer’s satisfaction (the ulti-mate recipient of the benefits provided by the activity) and incline toward effec-tiveness. Both types of measures reveal important and actionable information.
In the case of the results illustrated in exhibit 4, it is important to note that the top three metrics are inward-facing. They focus on completion of tasks as the primary indicators that the internal audit function is delivering value. This task-specific focus looks more at a “to-do list” and less on the perception of the
value of those activities by others. On the other hand, it is encouraging to see that one outward-facing measure—client satisfaction goals—came in at a close fourth place, selected by 38% of respon-dents. This means that many CAEs are connecting their value with their stake-holder needs. Another 32% say they also measure their value by “the fulfillment of specific expectations set and agreed to with key stakeholders,” another out-ward-facing measure.
At the same time, a cause for con-cern may be the fact that 15% indicate that no formal measures of value have been established. This fairly substantial percentage would be surprising if the responses include those who are not in management; the fact that all respon-dents to this question are CAEs makes it even more perplexing. Those in the 15% category may wish to consider the rami-fications of the absence of measures: lack of measurements make it more difficult to be in conformity with IIA Standard 1311: Internal Assessments, and they risk not knowing the quality of their efforts (or the organization’s perception of that quality).
www.theiia.org/goto/CBOK ● 11
Measures can become addictive. In their book, Measurement Madness:
Recognizing and Avoiding the Pitfalls of Performance Measurement, the authors point out the ramifications of mea-surements that are out of control.* Unrestrained measures can provide too much data but not enough information. They can proliferate and thereby add confusion and cost but little clarity. Most important, they can fail to drive perfor-mance. Measures should exist to clarify a business situation, opportunity, or chal-lenge, not simply exist for their own sake. With that in mind, how do the measures being used by organizations and internal auditors stack up against the desired goal of realizing value from the internal audit function?
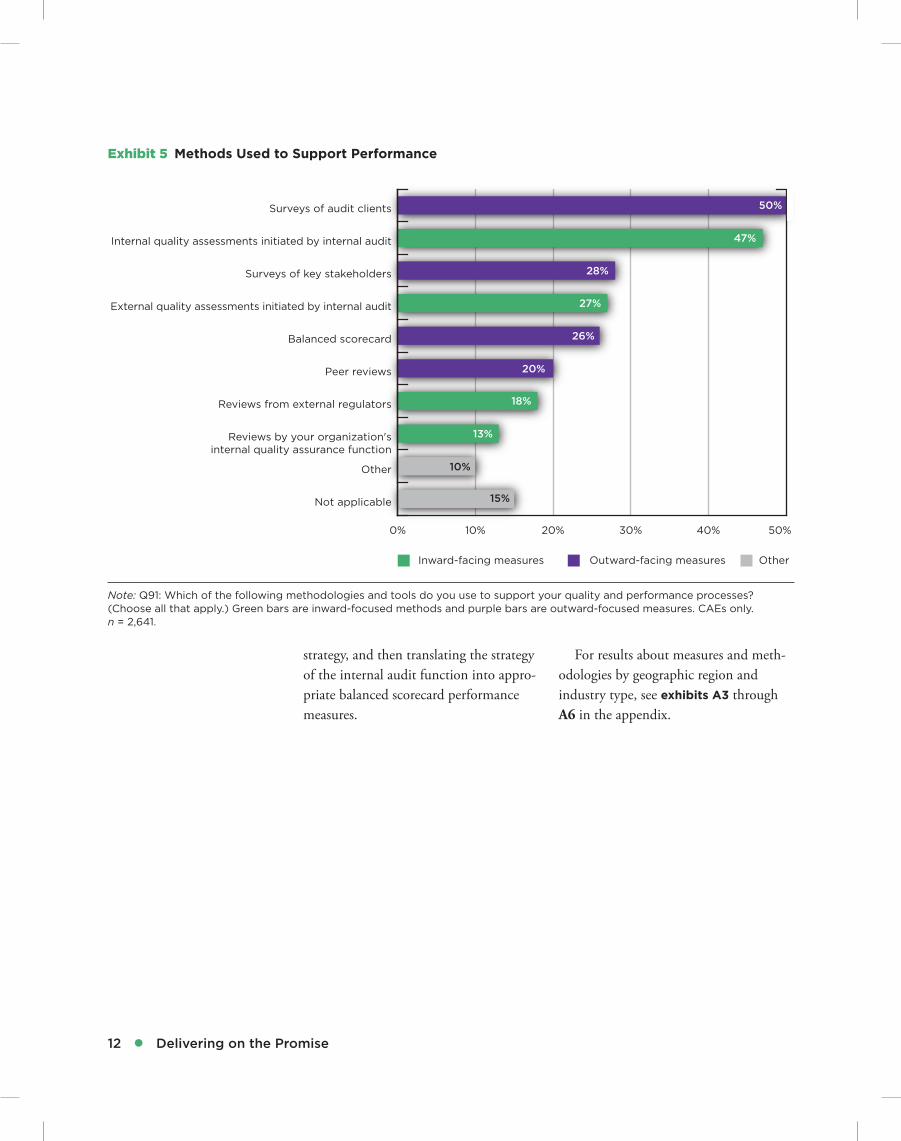
The two most popular methods among survey respondents were “surveys of audit clients” (an outward-facing approach) and “internal quality assessments initi-ated by internal audit” (an inward-facing approach) (see exhibit 5). Because these top two assessments represent both an inward-facing and an outward-facing approach, it is a positive indicator of a balanced approach among those who are gauging their performance. In addition,
* Dina Gray, Pietro Micheli, and Andrey Pavlov, Measurement Madness: Recognizing and Avoiding the Pitfalls of Performance Measurement (West Sussex, United Kingdom: John Wiley & Sons, 2015).
there is a strong, positive increase in the outward-facing measure. In the CBOK 2010 practitioner survey, only 9% indi-cated that they used customer surveys to gather information about how internal audit activities were perceived, while in 2015, the rate increased to 50%.
Another considerable change from 2010 is the use of the balanced scorecard, increasing from 4% to 26% globally. This result is in line with the expectations of the 2010 respondents who selected balanced scorecard as the approach they most anticipated would have greater usage “five years from now.”
The use of a balanced scorecard in support of internal audit’s quality and value efforts is on the rise globally, and this increased focus may help support internal audit’s efforts to be responsive to key stakeholder needs. This outcome may be achieved as a result of the balanced scorecard’s recognition that an organi-zation’s success hinges on more than simply financial outcomes. The balanced scorecard approach calls for examination of and measures for three other perspec-tives as well: customer, internal business processes, and learning and growth. This broader perspective renders the balanced scorecard a strategic leadership tool, not just a tactic to achieve a narrowly defined objective. To be successful in an internal audit environment, use of the balanced scorecard requires linking the internal audit strategy to enterprise
3 Taking a Balanced Approach to Measurement Methods
❝ In my audit
practice, we
recommend
business
improvement
through a variety
of ways. Some are
hard to measure,
such as compliance
assurance, but we
do try to estimate
a dollar value
where possible
by quantifying
cost reduction,
cost avoidance,
and the revenue
enhancement
impact of our
work.❞
—Karen Begelfer, Vice President, Corporate Audit
Services, Sprint Nextel Corporation, Kansas City,
Missouri, USA
12 ● Delivering on the Promise
strategy, and then translating the strategy of the internal audit function into appro-priate balanced scorecard performance measures.
For results about measures and meth-odologies by geographic region and industry type, see exhibits A3 through A6 in the appendix.
0% 10% 20% 30% 40% 50%
Not applicable
Other
Reviews by your organization's internal quality assurance function
Reviews from external regulators
Peer reviews
Balanced scorecard
External quality assessments initiated by internal audit
Surveys of key stakeholders
Internal quality assessments initiated by internal audit
Surveys of audit clients 50%
47%
28%
27%
26%
20%
18%
13%
10%
15%
Outward-facing measures OtherInward-facing measures
Note: Q91: Which of the following methodologies and tools do you use to support your quality and performance processes? (Choose all that apply.) Green bars are inward-focused methods and purple bars are outward-focused measures. CAEs only. n = 2,641.
Exhibit 5 Methods Used to Support Performance
www.theiia.org/goto/CBOK ● 13
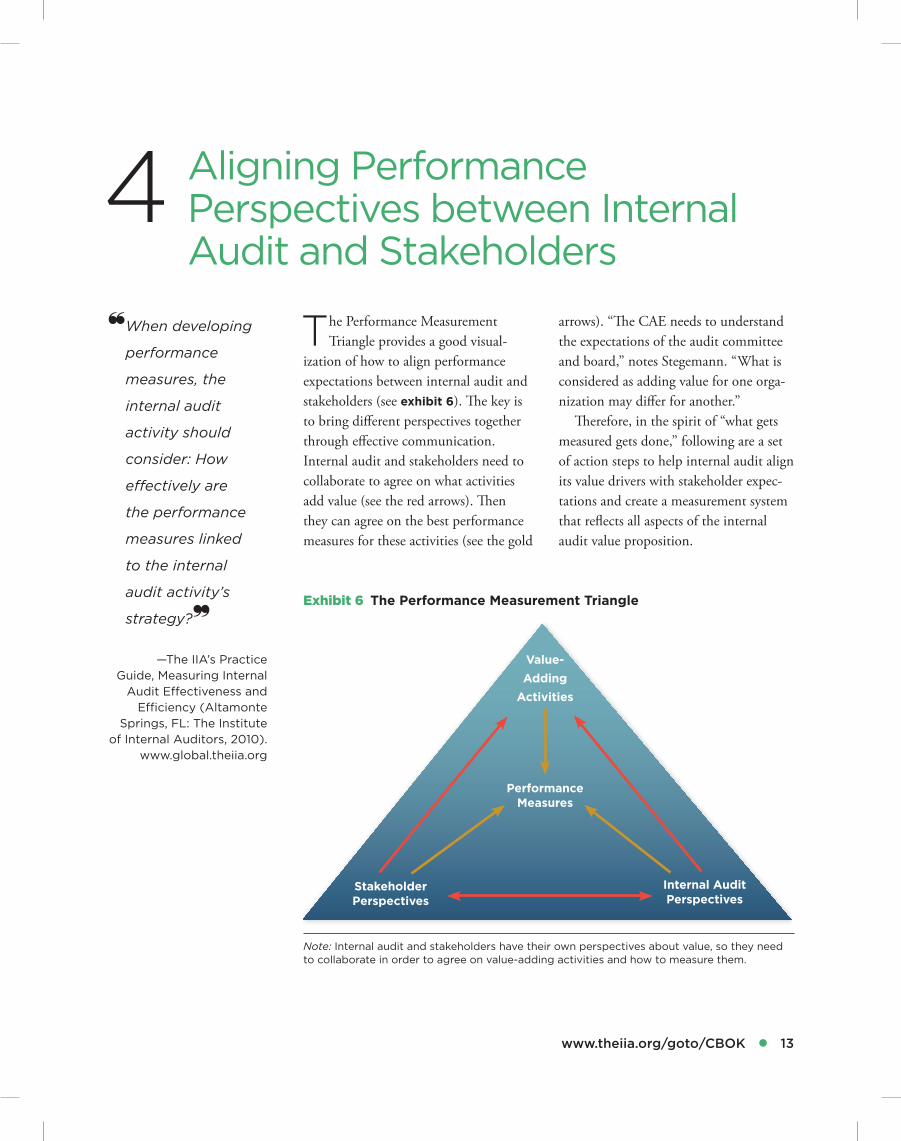
The Performance Measurement Triangle provides a good visual-
ization of how to align performance expectations between internal audit and stakeholders (see exhibit 6). The key is to bring different perspectives together through effective communication. Internal audit and stakeholders need to collaborate to agree on what activities add value (see the red arrows). Then they can agree on the best performance measures for these activities (see the gold
arrows). “The CAE needs to understand the expectations of the audit committee and board,” notes Stegemann. “What is considered as adding value for one orga-nization may differ for another.”
Therefore, in the spirit of “what gets measured gets done,” following are a set of action steps to help internal audit align its value drivers with stakeholder expec-tations and create a measurement system that reflects all aspects of the internal audit value proposition.
4 Aligning Performance Perspectives between Internal Audit and Stakeholders
❝ When developing
performance
measures, the
internal audit
activity should
consider: How
effectively are
the performance
measures linked
to the internal
audit activity’s
strategy?❞
—The IIA’s Practice Guide, Measuring Internal
Audit Effectiveness and Efficiency (Altamonte
Springs, FL: The Institute of Internal Auditors, 2010).
www.global.theiia.org
Note: Internal audit and stakeholders have their own perspectives about value, so they need to collaborate in order to agree on value-adding activities and how to measure them.
Exhibit 6 The Performance Measurement Triangle
Value-Adding
Activities
Performance Measures
Stakeholder Perspectives
Internal Audit Perspectives
14 ● Delivering on the Promise
Steps to Align Performance Measures and Value-Adding Activities
1. Learn the customer’s expectations. Internal auditors cannot deliver expected value unless they know spe-cifically how management and key stakeholders define value. The only way to find out is to ask. Interview key stakeholders (members of the board and the audit committee) and executive management and use those responses to develop a list of what they indicate are value-adding activities.
2. Validate your understanding. Review the list developed in step 1 with the key stakeholders whose interview comments helped create the list and secure their agreement that it is an accurate and complete reflection of value expected from the internal audit function.
3. Develop outward-facing and inward-facing performance measures.
a. Outward-facing measures: For each value activity, develop one or more outward-facing performance measure that provides a clear, repeatable, and accurate view of how well the activity delivered the expected value for the stakeholder.
b. Inward-facing measures: There are many critical, inward-facing activities that internal audit must undertake to keep its activities in order. Develop performance mea-sures for those activities.
4. Start measuring. Implement tools and methodologies to capture and track internal audit’s performance against the value drivers and the internal quality standards. Be sure to address the non-assurance aspects of internal audit’s work by devising a way to obtain feedback from key stakeholders on qualitative and advi-sory activities.
5. Report back. Make sure that stake-holders whose input formed the list of value-driving activities outlined in step 1 are regularly informed of the internal audit function’s status and performance against their expectations.
6. Repeat the cycle. Periodically (at least annually) reconfirm the expec-tations with the key stakeholders and update the list of value-adding activi-ties as necessary. Support any updates with new performance measures.
Remember that successful application of these steps requires use of one of the most important skills internal auditors must possess: communication. Listening to stakeholders enables internal auditors to craft measurements and methodol-ogies that reflect stakeholder priorities. Reporting back to them on status and performance of the identified activities demonstrates internal audit’s competence and collaborative spirit. Value is thus realized on both sides of the equation, and the organization is the ultimate beneficiary.
❝ When you want to
know how stake-
holders rate your
performance,
you need to do
more than send
out a feedback
survey. We ask
an independent
party to sit with
our stakeholders
for a focused
conversation.❞
—Robert Kella, Senior Vice President of Internal Audit for Emirates Group, Dubai,
United Arab Emirates
www.theiia.org/goto/CBOK ● 15
The CAEs who participated in the CBOK 2015 practitioner survey clearly under-stand that the success of the internal audit function—defined in this case as
meeting stakeholder expectations for value—depends on more than completed audits. While operational expertise (reflected in completing audits on time and closing audit issues on schedule) is valuable and therefore measured, other activities such as advising and recommending are also part of internal audit’s contribution to the organization. To provide the highest level of service to their organizations, internal auditors should col-laborate with their stakeholders to align performance measures to their top priorities.
Conclusion
16 ● Delivering on the Promise
Appendix A
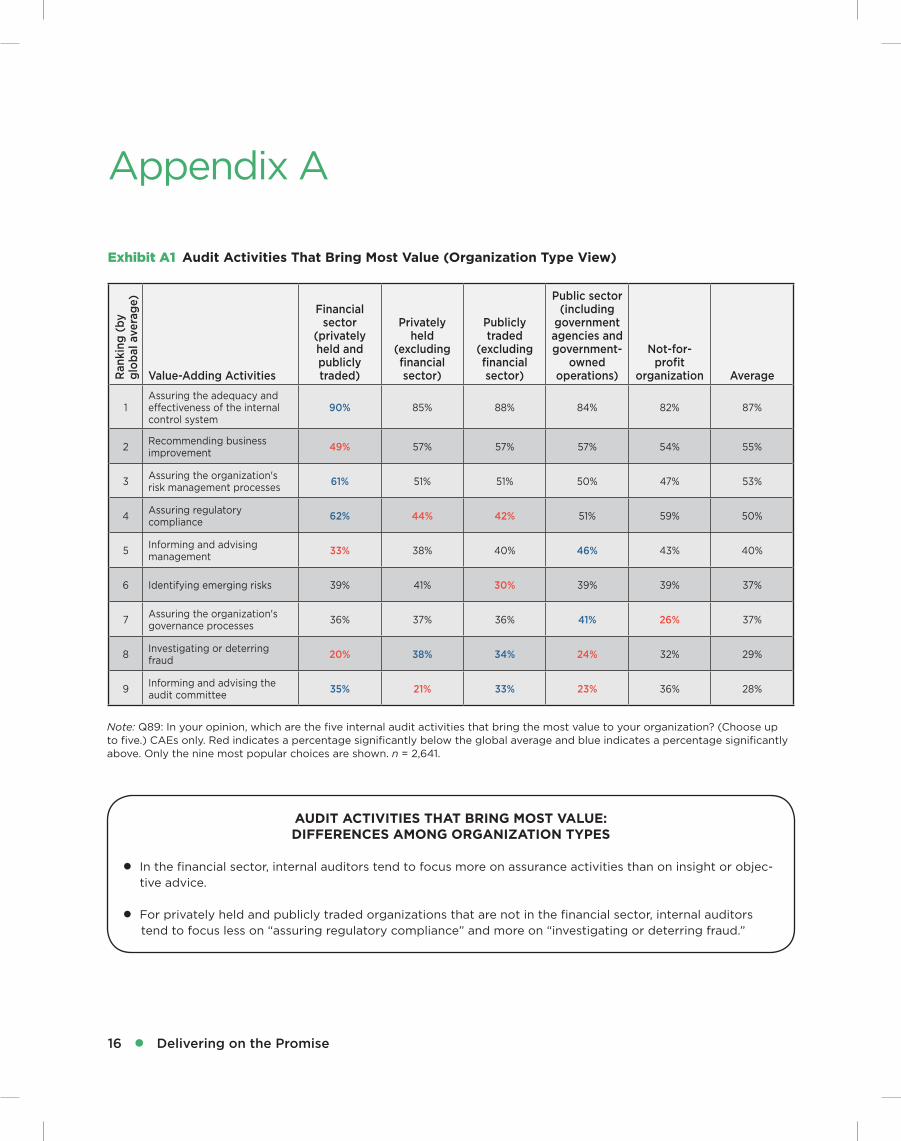
Exhibit A1 Audit Activities That Bring Most Value (Organization Type View)
Note: Q89: In your opinion, which are the five internal audit activities that bring the most value to your organization? (Choose up to five.) CAEs only. Red indicates a percentage significantly below the global average and blue indicates a percentage significantly above. Only the nine most popular choices are shown. n = 2,641.
Ran
king
(b
y g
lob
al a
vera
ge)
Value-Adding Activities
Financial sector
(privately held and publicly traded)
Privately held
(excluding financial sector)
Publicly traded
(excluding financial sector)
Public sector (including
government agencies and government-
owned operations)
Not-for-profit
organization Average
1Assuring the adequacy and effectiveness of the internal control system
90% 85% 88% 84% 82% 87%
2Recommending business improvement
49% 57% 57% 57% 54% 55%
3Assuring the organization's risk management processes
61% 51% 51% 50% 47% 53%
4Assuring regulatory compliance
62% 44% 42% 51% 59% 50%
5Informing and advising management
33% 38% 40% 46% 43% 40%
6 Identifying emerging risks 39% 41% 30% 39% 39% 37%
7Assuring the organization's governance processes
36% 37% 36% 41% 26% 37%
8Investigating or deterring fraud
20% 38% 34% 24% 32% 29%
9Informing and advising the audit committee
35% 21% 33% 23% 36% 28%
AUDIT ACTIVITIES THAT BRING MOST VALUE: DIFFERENCES AMONG ORGANIZATION TYPES
●● In the financial sector, internal auditors tend to focus more on assurance activities than on insight or objec-tive advice.
●● For privately held and publicly traded organizations that are not in the financial sector, internal auditors tend to focus less on “assuring regulatory compliance” and more on “investigating or deterring fraud.”
www.theiia.org/goto/CBOK ● 17
Ran
king
(b
y g
lob
al a
vera
ge)
Value-Adding Activities Eur
op
e
Mid
dle
Eas
t &
N
ort
h A
fric
a
Sub
-Sah
aran
A
fric
a
So
uth
Asi
a
Eas
t A
sia
&
Pac
ific
No
rth
Am
eric
a
Lati
n A
mer
ica
& C
arib
bea
n
Glo
bal
Ave
rag
e
1Assuring the adequacy and effectiveness of the internal control system
86% 82% 91% 96% 86% 85% 89% 87%
2 Recommending business improvement 57% 58% 48% 39% 55% 56% 56% 55%
3 Assuring the organization's risk management processes 56% 50% 64% 51% 62% 34% 62% 53%
4 Assuring regulatory compliance 43% 46% 57% 70% 57% 46% 57% 50%
5 Informing and advising management 43% 32% 32% 24% 38% 51% 29% 40%
6 Identifying emerging risks 42% 36% 44% 43% 29% 33% 42% 37%
7 Assuring the organization's governance processes 36% 46% 49% 39% 43% 24% 39% 37%
8 Investigating or deterring fraud 27% 25% 26% 34% 31% 28% 34% 29%
9 Informing and advising the audit committee 26% 28% 30% 21% 16% 45% 24% 28%
Note: Q89: In your opinion, which are the five internal audit activities that bring the most value to your organization? (Choose up to five.) CAEs only. Red indicates a percentage significantly below the global average and blue indicates a percentage significantly above. Only the nine most popular choices are shown. n = 2,605.
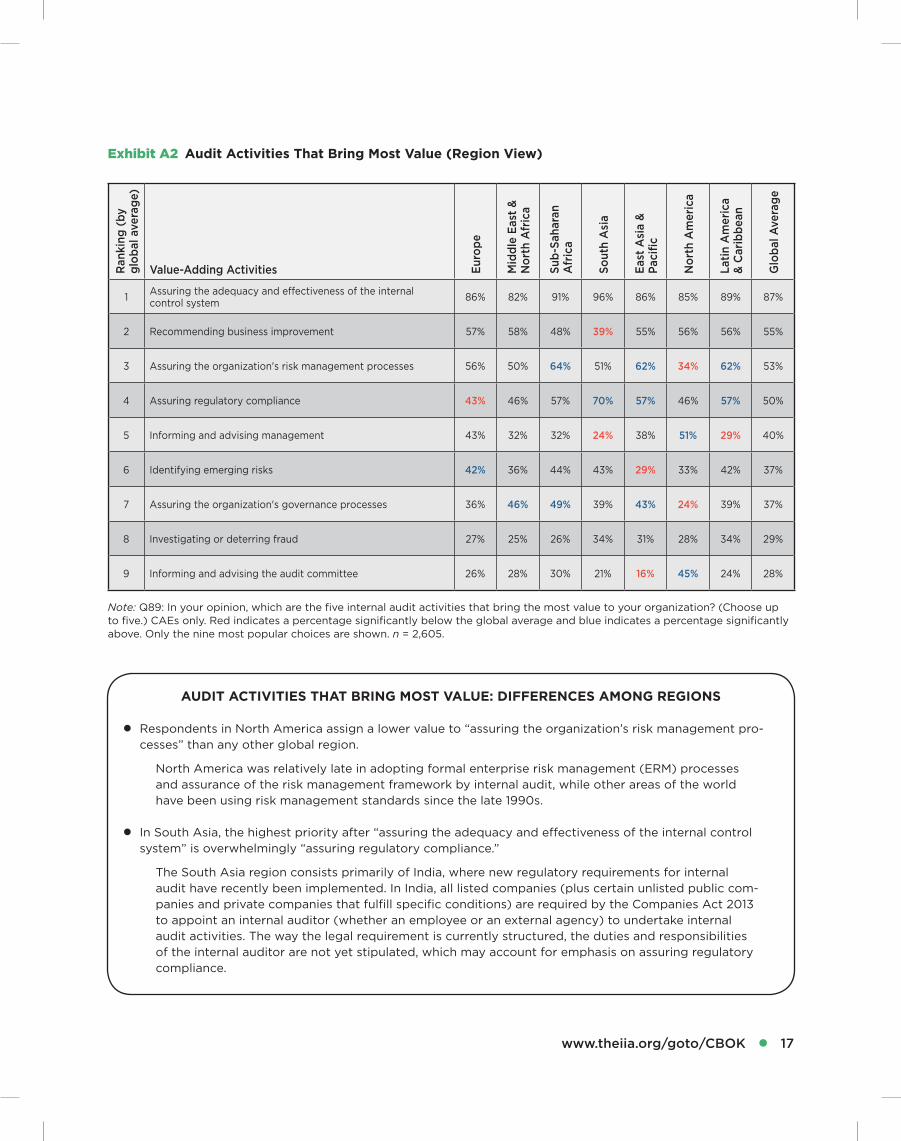
Exhibit A2 Audit Activities That Bring Most Value (Region View)
AUDIT ACTIVITIES THAT BRING MOST VALUE: DIFFERENCES AMONG REGIONS
●● Respondents in North America assign a lower value to “assuring the organization’s risk management pro-cesses” than any other global region.
North America was relatively late in adopting formal enterprise risk management (ERM) processes and assurance of the risk management framework by internal audit, while other areas of the world have been using risk management standards since the late 1990s.
●● In South Asia, the highest priority after “assuring the adequacy and effectiveness of the internal control system” is overwhelmingly “assuring regulatory compliance.”
The South Asia region consists primarily of India, where new regulatory requirements for internal audit have recently been implemented. In India, all listed companies (plus certain unlisted public com-panies and private companies that fulfill specific conditions) are required by the Companies Act 2013 to appoint an internal auditor (whether an employee or an external agency) to undertake internal audit activities. The way the legal requirement is currently structured, the duties and responsibilities of the internal auditor are not yet stipulated, which may account for emphasis on assuring regulatory compliance.
18 ● Delivering on the Promise
Note: Q90: What specific measures does your organization use to evaluate the performance of its internal audit activity? (Choose all that apply.) CAEs only. Red indicates a percentage significantly below the global average and blue indicates a percentage significantly above. n = 2,641.
Performance Measures
Financial sector
(privately held and publicly traded)
Privately held
(excluding financial sector)
Publicly traded
(excluding financial sector)
Public sector (including
government agencies
and government-
owned operations)
Not-for-profit
organization Average
Percentage of audit plan complete 73% 66% 65% 65% 55% 66%
Timely closure of audit issues 46% 45% 45% 37% 37% 42%
Completion of mandated coverage 44% 39% 44% 39% 41% 41%
Client satisfaction goals 38% 36% 39% 38% 35% 38%
The fulfillment of specific expectations set and agreed to with key stakeholders
33% 34% 33% 27% 38% 32%
Budget to actual audit hours 34% 27% 26% 29% 28% 29%
Performance against the internal audit financial budget
26% 21% 25% 21% 20% 23%
Cycle time from end of fieldwork to final report
26% 21% 26% 19% 21% 23%
Cycle time from entrance conference to draft report
19% 17% 18% 23% 16% 19%
We have not established formal performance measures.
10% 15% 14% 18% 20% 15%
Other 11% 9% 11% 11% 9% 10%
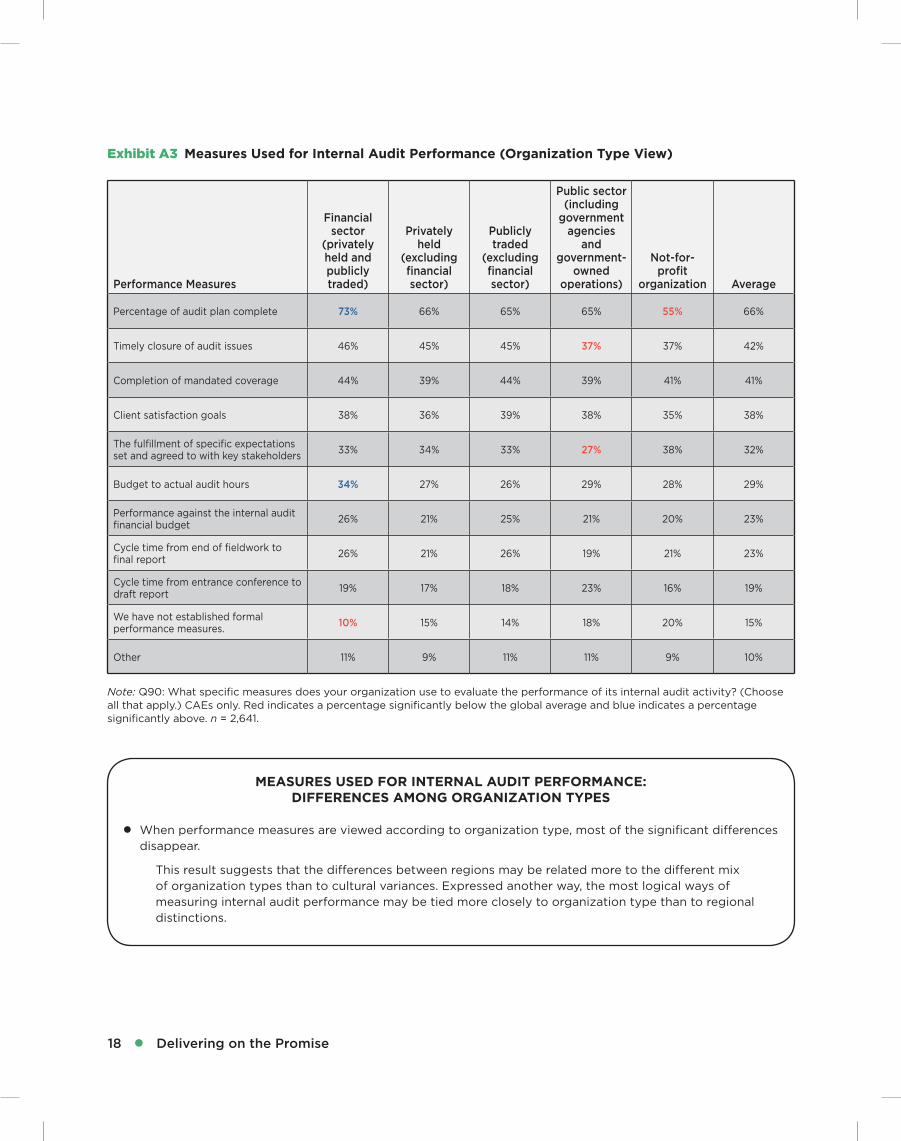
Exhibit A3 Measures Used for Internal Audit Performance (Organization Type View)
MEASURES USED FOR INTERNAL AUDIT PERFORMANCE: DIFFERENCES AMONG ORGANIZATION TYPES
●● When performance measures are viewed according to organization type, most of the significant differences disappear.
This result suggests that the differences between regions may be related more to the different mix of organization types than to cultural variances. Expressed another way, the most logical ways of measuring internal audit performance may be tied more closely to organization type than to regional distinctions.
www.theiia.org/goto/CBOK ● 19
Performance Measures Eur
op
e
Mid
dle
Eas
t &
N
ort
h A
fric
a
Sub
-Sah
aran
A
fric
a
So
uth
Asi
a
Eas
t A
sia
&
Pac
ific
No
rth
Am
eric
a
Lati
n A
mer
ica
&
Car
ibb
ean
Glo
bal
Ave
rag
e
Percentage of audit plan complete 64% 69% 82% 69% 66% 56% 76% 66%
Timely closure of audit issues 43% 46% 46% 64% 38% 41% 43% 42%
Completion of mandated coverage 34% 47% 53% 63% 52% 35% 41% 42%
Client satisfaction goals 39% 39% 45% 34% 34% 40% 33% 38%
The fulfillment of specific expectations set and agreed to with key stakeholders 28% 31% 42% 46% 26% 35% 37% 32%
Budget to actual audit hours 25% 40% 30% 30% 30% 29% 32% 29%
Performance against the internal audit financial budget 19% 20% 32% 16% 21% 31% 20% 23%
Cycle time from end of fieldwork to final report 21% 25% 24% 30% 24% 23% 22% 23%
Cycle time from entrance conference to draft report 18% 30% 17% 22% 17% 19% 22% 19%
We have not established formal performance measures. 17% 11% 7% 7% 15% 18% 13% 15%
Other 11% 8% 10% 6% 8% 13% 8% 10%
Note: Q90: What specific measures does your organization use to evaluate the performance of its internal audit activity? (Choose all that apply.) CAEs only Red indicates a percentage significantly below the global average and blue indicates a percentage significantly above. n = 2,605.
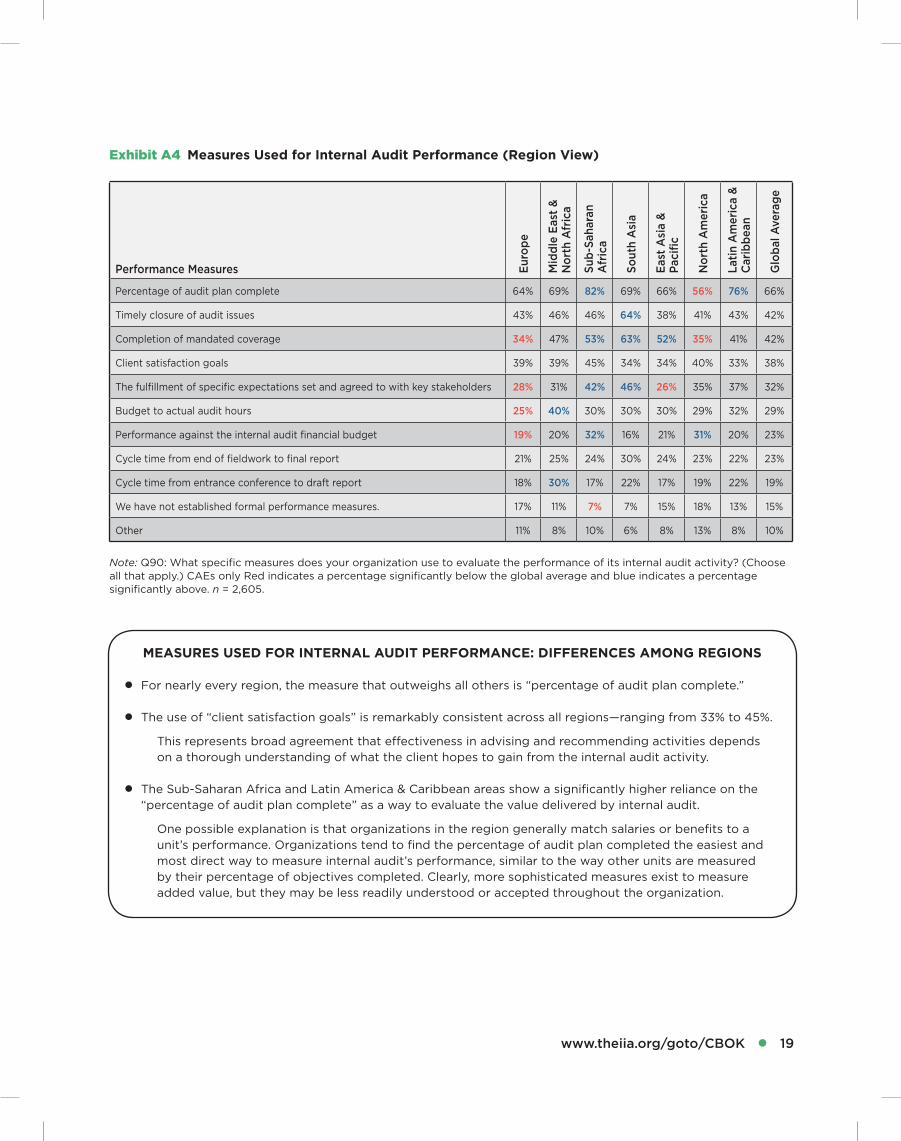
Exhibit A4 Measures Used for Internal Audit Performance (Region View)
MEASURES USED FOR INTERNAL AUDIT PERFORMANCE: DIFFERENCES AMONG REGIONS
●● For nearly every region, the measure that outweighs all others is “percentage of audit plan complete.”
●● The use of “client satisfaction goals” is remarkably consistent across all regions—ranging from 33% to 45%.
This represents broad agreement that effectiveness in advising and recommending activities depends on a thorough understanding of what the client hopes to gain from the internal audit activity.
●● The Sub-Saharan Africa and Latin America & Caribbean areas show a significantly higher reliance on the “percentage of audit plan complete” as a way to evaluate the value delivered by internal audit.
One possible explanation is that organizations in the region generally match salaries or benefits to a unit’s performance. Organizations tend to find the percentage of audit plan completed the easiest and most direct way to measure internal audit’s performance, similar to the way other units are measured by their percentage of objectives completed. Clearly, more sophisticated measures exist to measure added value, but they may be less readily understood or accepted throughout the organization.
20 ● Delivering on the Promise
Methods That Support Performance
Financial sector
(privately held and publicly traded)
Privately held
(excluding financial sector)
Publicly traded
(excluding financial sector)
Public sector (including
government agencies and government-
owned operations)
Not-for-profit
organization Average
Surveys of audit clients 52% 46% 51% 53% 47% 50%
Internal quality assessments initiated by internal audit
53% 39% 43% 52% 46% 47%
Surveys of key stakeholders 28% 28% 27% 29% 30% 28%
External quality assessments initiated by internal audit
34% 23% 23% 30% 20% 27%
Balanced scorecard 26% 29% 22% 25% 24% 26%
Peer reviews 18% 20% 17% 25% 22% 20%
Reviews from external regulators 36% 10% 8% 18% 16% 18%
Reviews by your organization's internal quality assurance function
13% 13% 10% 14% 13% 13%
Other 10% 11% 11% 10% 13% 10%
Not applicable 11% 17% 18% 12% 15% 15%
Note: Q91: Which of the following methodologies and tools do you use to support your quality and performance processes? (Choose all that apply.) CAEs only. Red indicates a percentage significantly below the global average and blue indicates a percentage significantly above. n = 2,641.
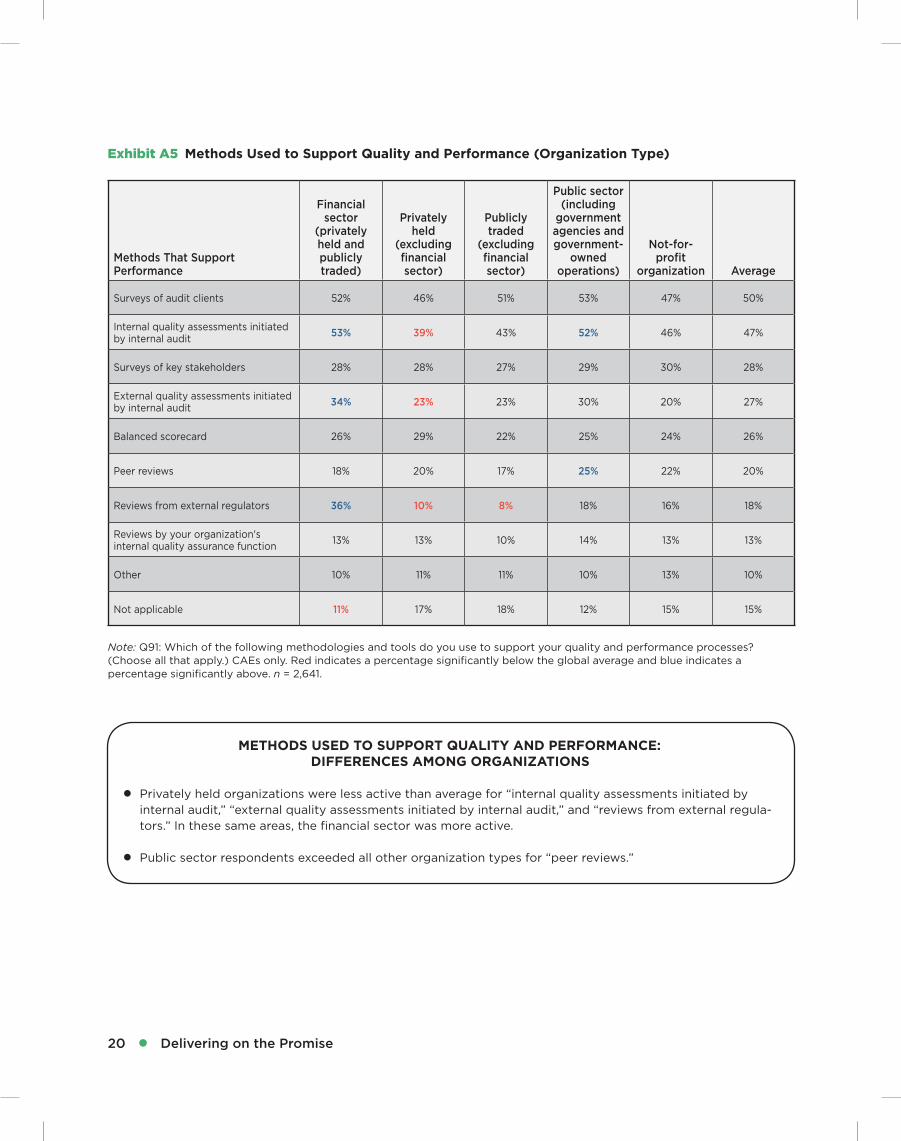
Exhibit A5 Methods Used to Support Quality and Performance (Organization Type)
METHODS USED TO SUPPORT QUALITY AND PERFORMANCE: DIFFERENCES AMONG ORGANIZATIONS
●● Privately held organizations were less active than average for “internal quality assessments initiated by internal audit,” “external quality assessments initiated by internal audit,” and “reviews from external regula-tors.” In these same areas, the financial sector was more active.
●● Public sector respondents exceeded all other organization types for “peer reviews.”
www.theiia.org/goto/CBOK ● 21
Methods That Support Performance Eur
op
e
Mid
dle
Eas
t &
N
ort
h A
fric
a
Sub
-Sah
aran
A
fric
a
So
uth
Asi
a
Eas
t A
sia
&
Pac
ific
No
rth
Am
eric
a
Lati
n A
mer
ica
& C
arib
bea
n
Glo
bal
A
vera
ge
Surveys of audit clients 51% 47% 53% 51% 43% 56% 51% 50%
Internal quality assessments initiated by internal audit 48% 49% 55% 37% 43% 51% 39% 47%
Surveys of key stakeholders 26% 30% 31% 34% 26% 32% 26% 28%
External quality assessments initiated by internal audit 35% 28% 25% 21% 17% 33% 18% 27%
Balanced scorecard 22% 31% 39% 31% 23% 20% 34% 26%
Peer reviews 19% 20% 28% 36% 18% 19% 21% 20%
Reviews from external regulators 17% 20% 22% 12% 15% 18% 21% 18%
Reviews by your organization's internal quality assurance function 9% 13% 19% 16% 20% 5% 18% 13%
Other 11% 6% 9% 12% 9% 12% 11% 10%
Not applicable 14% 17% 5% 15% 20% 16% 12% 15%
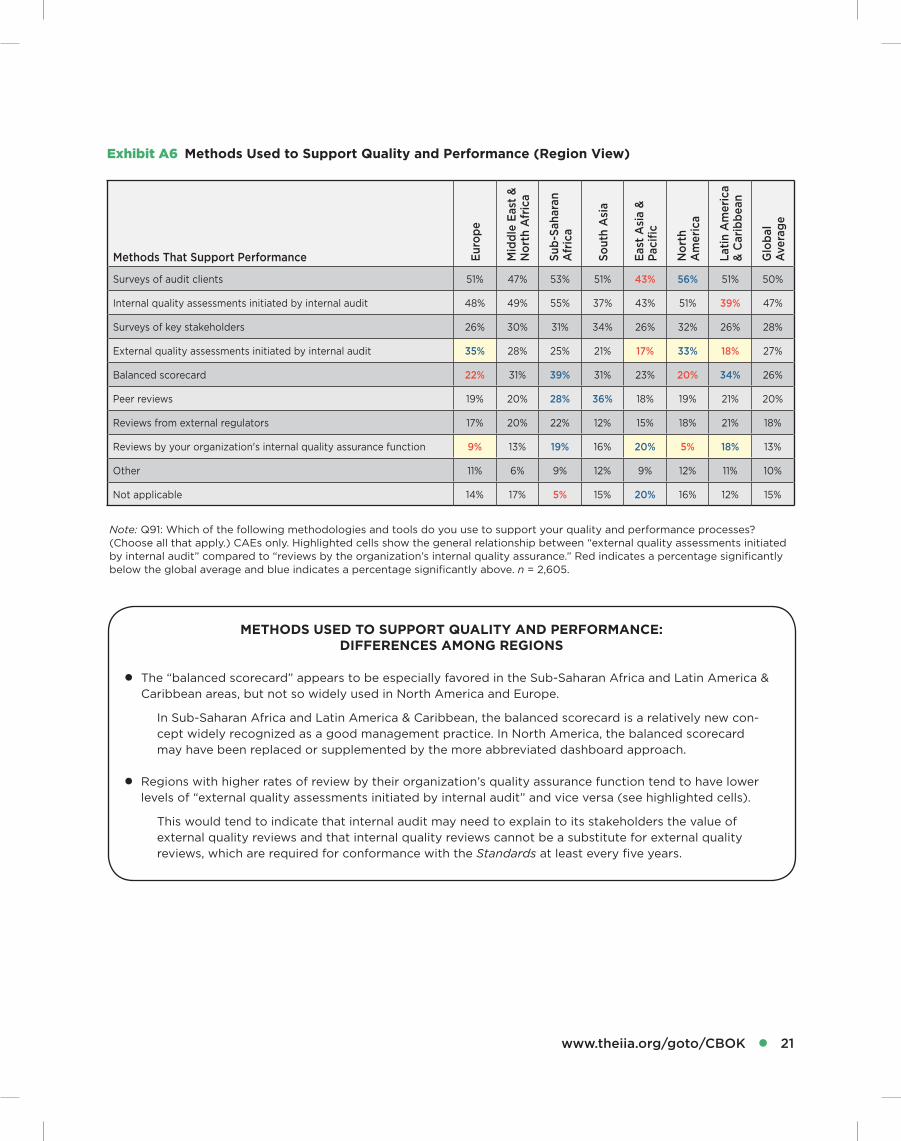
Note: Q91: Which of the following methodologies and tools do you use to support your quality and performance processes? (Choose all that apply.) CAEs only. Highlighted cells show the general relationship between “external quality assessments initiated by internal audit” compared to “reviews by the organization’s internal quality assurance.” Red indicates a percentage significantly below the global average and blue indicates a percentage significantly above. n = 2,605.
Exhibit A6 Methods Used to Support Quality and Performance (Region View)
METHODS USED TO SUPPORT QUALITY AND PERFORMANCE: DIFFERENCES AMONG REGIONS
●● The “balanced scorecard” appears to be especially favored in the Sub-Saharan Africa and Latin America & Caribbean areas, but not so widely used in North America and Europe.
In Sub-Saharan Africa and Latin America & Caribbean, the balanced scorecard is a relatively new con-cept widely recognized as a good management practice. In North America, the balanced scorecard may have been replaced or supplemented by the more abbreviated dashboard approach.
●● Regions with higher rates of review by their organization’s quality assurance function tend to have lower levels of “external quality assessments initiated by internal audit” and vice versa (see highlighted cells).
This would tend to indicate that internal audit may need to explain to its stakeholders the value of external quality reviews and that internal quality reviews cannot be a substitute for external quality reviews, which are required for conformance with the Standards at least every five years.
22 ● Delivering on the Promise
The Balanced Scorecard: Applications in Internal Auditing and Risk Management by Mark L. Frigo (Altamonte Springs, FL: The Institute of Internal Auditors Research Foundation, 2014).
Become a Strategic Internal Auditor: Tying Risk to Strategy by Paul L. Walker (Altamonte Springs, FL: The Institute of Internal Auditors Research Foundation, 2014).
The IIA’s Practice Guide, Measuring Internal Audit Effectiveness and Efficiency (Altamonte Springs, FL: The Institute of Internal Auditors, 2010). www.global.theiia.org
Insight: Delivering Value to Stakeholders by Patty Miller and Tara Smith (Altamonte Springs, FL: The Institute of Internal Auditors Research Foundation, 2011).
Job Satisfaction for Internal Auditors: How to Retain Top Talent by Venkataraman Iyer (Altamonte Springs, FL: The Institute of Internal Auditors Research Foundation, 2014).
Keeping Quality in Focus Through Internal Assessments (Altamonte Springs, FL: The Institute of Internal Auditors, Audit Executive Center, 2014). www.theiia.org/cae
“Options for Using the Value Proposition for Internal Auditing” (Altamonte Springs, FL: The Institute of Internal Auditors, 2012).
Quality Assessment Manual for the Internal Audit Activity by Patrick Copeland, Donald Espersen, Martha Catherine Judith Grobler, and James Roth (Altamonte Springs, FL: The Institute of Internal Auditors Research Foundation, 2013).
Value and Competency—The Stakeholder Perspective: Insights for Internal Auditors and Management by Vu H. Pham and Betsy Bosak (Altamonte Springs, FL: The Institute of Internal Auditors Research Foundation, 2013).
Resources
www.theiia.org/goto/CBOK ● 23
About the Author
Jane Seago is a technical and business writer who focuses on information systems audit, information security, IT governance, internal audit, enterprise risk, data privacy, and cybersecurity topics.
CBOK Development Team
CBOK Co-Chairs: Primary Data Analyst: Dr. Po-ju Chen Dick Anderson (United States) Content Developer: Deborah Poulalion Jean Coroller (France) Project Managers: Selma Kuurstra andPractitioner Survey Subcommittee Chair: Kayla Manning Michael Parkinson (Australia) Senior Editor: Lee Ann CampbellIIARF Vice President: Bonnie Ulmer
Report Review Committee
Karen Begelfer (United States) Charles Saunders (United States) María José Ferres (Uruguay) Tania Stegemann (Australia) Augustino Mbogella (Tanzania)
Acknowledgments
The IIARF appreciates contributions to the development of this report made by Dick Anderson (United States) and Serge Van Herpen (Netherlands). In addition, The IIARF thanks Jørgen Bock (Norway), Robert Kella (United Arab Emirates), and Karen Begelfer (United States) for providing their perspectives for this report via interviews.
Sponsorship
The IIARF thanks IIA–Charlotte Chapter, IIA–Raleigh-Durham Chapter, and IIA–Triad Chapter for partnering together to sponsor this project.
About the Project Team
About The IIA Research Foundation
CBOK is administered through The IIA Research Foundation (IIARF), which has provided groundbreaking research for the internal audit profession for the past four decades. Through initiatives that explore current issues, emerging trends, and future needs, The IIARF has been a driving force behind the evolution and advancement of the profession.
Limit of Liability
The IIARF publishes this document for information and educational purposes only. IIARF does not provide legal or accounting advice and makes no warranty as to any legal or accounting results through its publication of this document. When legal or accounting issues arise, professional assistance should be sought and retained.
Contact Us
The Institute of Internal Auditors Global Headquarters247 Maitland AvenueAltamonte Springs, Florida 32701-4201, USA
Copyright © 2015 by The Institute of Internal Auditors Research Foundation (IIARF). All rights reserved. For permission to reproduce or quote, please contact [email protected]. ID # 2015-1484
Your Donation Dollars at WorkCBOK reports are available free to the public thanks to generous contributions from individuals, organizations, IIA chapters, and IIA institutes around the world.
Donate to CBOKwww.theiia.org/goto/CBOK