Delayed discharges and hospital type: evidence from the ... · PDF file1 Economics of Social...
27
CHE Research Paper 133 Delayed Discharges and Hospital Type: Evidence from the English NHS James Gaughan, Hugh Gravelle, Luigi Siciliani
Transcript of Delayed discharges and hospital type: evidence from the ... · PDF file1 Economics of Social...

CHE Research Paper 133
Delayed Discharges and Hospital Type: Evidence from the English NHS
James Gaughan, Hugh Gravelle,Luigi Siciliani

Delayed discharges and hospital type: Evidence from the English NHS
1James Gaughan 1Hugh Gravelle 12Luigi Siciliani
1 Economics of Social and Health Care Research Unit, Centre for Health Economics, University of York, York UK. 2 Department of Economics and Related Studies, University of York, York, UK July 2016

Background to series
CHE Discussion Papers (DPs) began publication in 1983 as a means of making current research material more widely available to health economists and other potential users. So as to speed up the dissemination process, papers were originally published by CHE and distributed by post to a worldwide readership. The CHE Research Paper series takes over that function and provides access to current research output via web-based publication, although hard copy will continue to be available (but subject to charge). Acknowledgements
The work was funded by a grant from the Department of Health to the Policy Research Unit in the Economics of Health and Social Care Systems 103/0001. The views expressed are those of the authors and not necessarily those of the funders. We are grateful for suggestions from discussants Joshua Pink and Francesco D’Amico and participants at the HESG meeting held in Lancaster in June 2015 and at the workshop Public Financing of Long Term Care held at the London School of Economics in August 2015. No ethical approval was sought as we deal only with publicly available secondary data. The LaingBuisson data is at provider level. Further copies
Copies of this paper are freely available to download from the CHE website www.york.ac.uk/che/publications/ Access to downloaded material is provided on the understanding that it is intended for personal use. Copies of downloaded papers may be distributed to third-parties subject to the proviso that the CHE publication source is properly acknowledged and that such distribution is not subject to any payment. Printed copies are available on request at a charge of £5.00 per copy. Please contact the CHE Publications Office, email [email protected], telephone 01904 321405 for further details. Centre for Health Economics Alcuin College University of York York, UK www.york.ac.uk/che © James Gaughan, Hugh Gravelle, Luigi Siciliani
Delayed Discharges and Hospital Type: Evidence from the English NHS i
Abstract
Delayed discharges of patients from hospital, commonly known as bed-blocking, is a long standing policy concern. Delays can increase the overall cost of treatment and may worsen patient outcomes. We investigate how delayed discharges vary by hospital type (Acute, Specialist, Mental Health, Teaching), and the extent to which such differences can be explained by demography, case-mix, the availability of long-term care and hospital governance as reflected in whether the hospital has Foundation Trust status, which gives greater financial autonomy and flexibility in staffing and pay. We use a new panel database of delays in all English NHS hospital Trusts from 2011/12 to 2013/14. Employing count data models, we find that a greater local supply of long-term care (care home beds) is associated with fewer delays. Hospitals which are Foundation Trusts have fewer delayed discharges and might therefore be used as exemplars of good practice in managing delays. Mental Health Trusts have more delayed discharges than Acute Trusts but a smaller proportion of them are attributed to the NHS, possibly indicating a relatively greater lack of adequate community care for mental health patients.

ii CHE Research Paper 133

Delayed Discharges and Hospital Type: Evidence from the English NHS 1
1. Introduction
In England in 2013/14 over 1.2 million bed-days were lost because patients remained in hospital after they were medically ready to be discharged. Such delayed discharges, often referred to as bed-blocking, are a long standing policy concern. In the U.K. the issue is as old as the National Health Service (NHS). Lowe and McKeown (1949) noted that the creation of the NHS divided the responsibility for health and other forms of care and allocation of patients to appropriate care setting began to increase in importance.1 Despite subsequent changes in the provision and organisation of health and long-term care (LTC) services, including attempts to improve integration between the sectors (Glasby et al. 2011), the problem of delayed discharges persists. As the King’s Fund reported, delayed discharges remain an important concern among NHS managers (Appleby et al. 2013). A recent report of the House of Commons Health Committee pointed to delayed discharges as one of the reasons for hospital accident and emergency departments missing their access targets (House of Commons Health Committee 2013). Concern about delays is also not limited to the U.K. In many member countries of the Organisation for Economic Co-operation and Development (OECD), hospital and long-term care provision is frequently divided between different sets of institutions. The funding and organisation of these two sectors often differ, with each acting independently of the other. The separation of responsibilities can lead to delays due to lack of communication and coordination. The supply of long-term care is not controlled by the hospitals. But if a care home bed is not available when a hospital patient is ready to be transferred, the patient is forced to remain in hospital until a bed becomes free or they are sufficiently recovered to go home. In either case, additional costs from delayed discharges fall on the hospital provider. A growing elderly population, measured both absolutely and as a proportion of the total population (European Commission Economic Policy Committee 2009), suggests that the problem is likely to become worse because use of health and LTC services is concentrated among the elderly (de Maijer et al. 2011). Bardsley et al. (2012) found that 10% of people aged over 75 in 2005/6 used both hospital and LTC in the same year. This demand pressure increases the importance of allocating patients to the appropriate care setting (see Kuhn and Nuscheler 2011 for a theoretical analysis). The cost of delays in discharging patients from hospital is financial and clinical. Since hospital care is more expensive than care in other settings, a patient who can be appropriately cared for in another setting, such as a LTC institution (residential home or nursing home) or with support in their own home (homecare) will be less costly to treat if discharged from hospital. There are also clinical risks to the patient of being in hospital when medically ready to be discharged including hospital acquired infection and pressure sores. Patient outcomes may be worsened by a prolonged stay in hospital, compared to discharge home or to LTC institution (Health Foundation 2013). Previous research suggests that provision of LTC affects the extent of bed blocking (Fernandez and Forder 2008, Gaughan et al. 2015). But hospitals can also reduce bed blocking through good discharge planning and communication with LTC providers. For example, an internal analysis of delays in the Sheffield Teaching Trust (Health Foundation 2013) resulted in changes in procedure
1 Before the creation of the NHS, Poor Law Authorities were responsible for the social (long-term care) and medical
(hospital) needs of people in their area. The difference in cost between caring for an elderly person in hospital and elsewhere may have been small, due to the limited differences between settings in terms of equipment and staff at the time. The National Health Service Act in 1946 specifically set the remit of the new hospital boards created to be providers of hospital care, creating a division of responsibility for the different services
2 CHE Research Paper 133
which reduced delays without increasing readmissions, an indication that the more prompt discharges were appropriate.
1.1. Aims and hypotheses
We investigate how delayed discharges vary by type of NHS hospital. NHS hospitals are classified for administrative and regulatory purposes in two main ways. First, depending on their patient group and functions they are designated as Acute, Specialist, Teaching or Mental Health. Second, depending on their governance structure, they may have Foundation Trusts (FT) status, which gives them greater autonomy. We focus on hospital type since hospital type is readily observed and many existing NHS policies are defined in terms of hospital type. For example, Specialist hospitals receive top-up payments over and above the standard payments for each patient treated.2 Mental Health providers have different payment rules from other providers. Teaching hospitals receive additional payments for teaching services. Hospitals with Foundation Trust status face a less constraining regulatory regime system than other hospitals: they do not have to break even each year, can borrow to invest, and have greater freedom in paying their staff. Hospital types with smaller delays could be used as examples of good practice. Those with higher delays could be targeted by specific policy interventions. Moreover, our data on delayed discharges is at hospital rather than individual patient level We compare differences in delays across types of provider before and after controlling for a range of factors such as patient demographics, case-mix, size and long-term care availability. Any remaining differences across hospital type after allowing for these factors may be due to the different type of organisation (due to specialisation or greater autonomy), different services (acute, mental health services) or having responsibilities (such as teaching) The a priori effect of hospital type on delays is unclear. Foundation Trust (FT) status requires that the hospital demonstrates quality of care and financial viability (Monitor 2007, Monitor 2013). FT status can be considered a label of good quality care. Higher quality, driven by more efficient management of patient pathways, may reduce delays of discharge but might also attract more severe and complex patients with a higher risk of suffering delay. Specialist Trusts may obtain efficiency gains and provide higher quality by focussing on a narrower range of patients, such as those with cardiovascular or orthopaedics conditions. This may lead to smaller delays for these patients. But specialist hospitals may also attract more complex patients who may have more requirements for post treatment long-term care services which may take longer to arrange. Teaching Trusts also educate medical students as well as treating patients and this reduces the amount of attention that senior staff can devote to patient care once immediate medical needs are met. Teaching hospitals may also attract more complex patients who are more prone to delays. Mental Health Trusts treat patients with serious mental illness rather than physical health problems. These patients are often managed partly by community facilities such as Crisis Resolution Teams and Home Treatment Teams. Thus they may have better links to community and long-term care than other types of hospital but their patients may be more difficult to place in suitable facilities outside hospital. There is also concern that mental health services are relatively underfunded. Where this
2 Acute NHS hospitals are paid by a prospective payment system with price per patient treated varying with the patient’s Health Resource Group (HRG) which is defined by diagnosis and procedure. Similar grouping with tariff systems, referred to as Diagnosis Related Group (DRG) payment systems, are used in many other European and OECD countries.
Delayed Discharges and Hospital Type: Evidence from the English NHS 3
results in insufficient resources in the hospital Trusts or provision of LTC for mental health conditions, this could increase delayed discharges.
1.2. Related literature
Forder (2009) investigated the degree of substitution between hospital and LTC in 8000 English census ward areas and estimated that a £1 increase in spending on care homes was associated with a £0.35 fall in hospital costs. Fernandez and Forder (2008) and Gaughan et al. (2015) found that English patients living in Local Authorities with fewer care home and nursing home beds were more likely to have a delayed discharge. Hospital readmissions are also higher in Local Authorities with lower care home or home help supply (Fernandez and Forder 2008). Our study contributes to the literature on the substitution of hospital and LTC. The analyses in Fernandez and Forder (2008) and Gaughan et al. (2015) were at Local Authority level and could not examine the impact of hospital characteristics as patients resident in a Local Authority are likely to be treated in several hospital Trusts. We believe ours is the first study which attempts to examine variations in delayed discharges across hospitals. There is also an extensive empirical literature on quality and efficiency differences across hospital types (for-profit versus non-profit, specialised versus non-specialised etc) as surveyed in Eggleston et al. (2008). Section 2 details the data. Section 3 provides the methods. Section 4 reports descriptive statistics and regression results. Section 5 discusses potential mechanisms underlying the findings. Section 6 concludes.

4 CHE Research Paper 133
2. Data
We employ a new database which measures delays at hospital Trust3 level and includes all NHS Hospital Trusts between 2011/12 and 2013/14.
2.1. Dependent variable
Information on hospital delays are reported at hospital, rather than individual patient, level. The “Acute and Non-Acute Delayed Transfers of Care” dataset (NHS England 2014a) contains monthly information submitted by Trusts to the Department of Health on the number of delayed transfers of patients as required by the Delayed Discharges (Community Care Etc) Act (2003).4 We use data on delays for English Acute and Mental Health Trusts in three financial years: 2011-12, 2012-13 and 2013-14. The Act covers delays among adults. We exclude specialist children’s hospitals. We also exclude hospitals specialising in maternity, gynaecology and neonatal care, sometimes referred to as ‘Women’s Hospitals’. These providers serve relatively young patients who are unlikely to require long-term care and the number of delays reported for these providers over the study period is negligible. A delay is defined as occurring when a clinical decision has been made that a patient is ready for discharge from hospital and a multidisciplinary team agrees with this decision. The multi-disciplinary team includes “nursing and other health and social care professionals caring for that patient in an acute setting” (DH 2010b). When a delayed discharge occurs, it is attributed either to the Local Authority where the patient resides, the NHS Trust where the patient was treated or to both. There is a formal dispute procedure for cases where agreement over attribution is not reached between the institutions concerned. We measure delayed discharges as the total number of bed-days lost over the month due to delayed patients and aggregate the annual number of days of delay. We measure both the total number of delays, whether allocated to the Trust or not, and those attributed to the NHS (NHS Delays).
2.2. Types of Trust
Information on type of Trust is from the National Reporting and Learning System (NHS England 2013). There are four mutually exclusive types of Trust: Acute Trusts5, Acute Specialist Trusts, Acute Teaching Trusts and Mental Health Trusts (Manhaes et al. 2013). Acute Teaching Trusts are generally large providers with a wide range of departments and connected to a University, and providing training for medical students as well as treating a full range of patients. Acute Specialist Trusts are a regional or national centre for a particular field of medicine, such as cancer or orthopaedics. They treat the most complex cases in a field and are generally small compared to Acute Trusts. Acute Trusts without a further designation provide acute hospital care without a specific focus on teaching or a specific field. Mental Health Trusts provide hospital care to patients with mental health conditions as opposed to physical conditions. In focusing on this specific
3 The unit of analysis is the hospital Trust. Some Trusts have a single hospital site but others have several.
4 The Act allows NHS Trusts to claim reimbursement from Local Authorities (LAs) in charge of care home and community
care provision in their area, if necessary services are not provided in time for the discharge of an acute patient and this is solely the responsibility of the LA. A Trust can only claim such reimbursement if it gives at least three days notice that a patient is likely to require LTC on discharge and at least 24 hours notice of the discharge (DH 2003, DH 2010b). Trusts must report all delays which occur, even when they are not entitled to reimbursement for them. 5 Within the set of Acute Trusts which are not categorised as Acute Specialist or Acute Teaching, there are three subsets:
Small Acute, Medium Acute and Large Acute. Size in this instance is defined by income (HSCIC 2013c). We ignore these subsets so that size is measured by beds for all Trust types (Acute, Acute Teaching, Acute Specialist and Mental Health Trusts).

Delayed Discharges and Hospital Type: Evidence from the English NHS 5
area of medicine, Mental Health Trusts are similar to Acute Specialists. However, Mental Health Trusts are similar in size to Acute Trusts and there are far more Mental Health Trusts than there are Acute Specialists in a specific field. Each Trust type is captured by a dummy variable with Acute Trusts used as the baseline category. Trusts of all four types can also have Foundation Trust (FT) status (Monitor 2014) which we also include as a dummy variable.
2.3. Control variables
We control for the number of beds in a Trust, taking data from “Quarterly bed availability and occupancy” submitted to the Department of Health and published by NHS England (NHS England 2014b). The average number of beds6 is given at Trust level (DH 2010a) for each quarter of a financial year. We use the average of the sum of the number of available and occupied beds reported for the four quarters of each financial year. To account for potential non-linearity in the relationship between beds and delays, beds are measured also as categorical variables: 200-399, 400-599, 600-799, 800-999, 1000-1499 and 1500+ beds. The base case is 0-199 beds. We use three case-mix variables: age, gender and emergency admissions from aggregated Hospital Episode Statistics inpatient data (HSCIC 2013b). The variables are measured as the percentage of admissions which are emergencies, the percentage of male admissions, and the percentage of patients aged 60-74 and the percentage aged 75+. We include risk-adjusted emergency readmission rates within 28 days of discharge from hospital as a measure of hospital quality.7 The data are from the Indicator Portal of the HSCIC website (HSCIC 2014) and are indirectly standardised by age, gender, method of admission, diagnoses and procedures. The denominator for the emergency readmission rate is all patients discharged alive in the year, except those with a primary specialty of mental health or any diagnosis of cancer. The latter are excluded since readmissions of these patient groups are not used as a performance indicator as they are often deemed to be necessary (HSCIC 2013a). A high readmission rate might be associated with more delays if it reflects poorer quality of care in the hospital or greater pressure to admit patients from home or long-term care settings. However, bed blocking may lead to premature discharge or worse care for other patients, thereby increasing subsequent readmissions. We therefore use two year lags of the emergency readmission rate to reduce simultaneity bias. Differences in delayed discharges may be due to different availability of long-term care. If no bed is available in a care home, then a patient may have to remain in hospital despite being clinically ready to be discharged into long-term care. Most patients also have to pay, at least in part, for long-term care and so it may take longer to find a LTC bed at a price they can afford if prices are higher. To measure the accessibility of long-term care in the area served by a hospital Trust, we use June 2011 data on care home beds and prices (Laing and Buisson 2010). We measure the number of care home beds and average price within 10km8 from the hospitals for care homes whose primary clients are people aged 65+ or with dementia. The primary client group of a care home is the group for
6 Number of beds in a quarter is the average of the sum of available and occupied beds on each day of the quarter.
7 Other measures of clinical quality such as case mix adjusted mortality are not available for all types of Trust.
8 The location of Trusts is defined by the postcode of its headquarters. The postcode of the care home provider defines the
location of LTC. Postcodes are mapped to lower super output area (LSOA) which have a mean population of 1500. The straight line distance between the centroids of LSOAs is used to determine which care homes are within 10km of each Trust.

6 CHE Research Paper 133
which the largest number of beds are registered with the Care Quality Commission which regulates the sector. There were eight mergers between Trusts during the study period. We compute annual values for dependent and explanatory variables for Trusts which merged at some point in a year as if they were a single Trust at the start of the year.
Delayed Discharges and Hospital Type: Evidence from the English NHS 7
3. Methods
The dependent variable yit is days of delay in hospital i in year t. Since yit is non-negative, integer valued and has a right skewed distribution we estimate Negative Binomial models in which the mean number of days of delay 𝜇𝑖𝑡 satisfies
ln(𝜇𝑖𝑡) = 𝛽0 + 𝐇𝑖′𝟏 + 𝛽2𝐹𝑖𝑡 + 3𝑙𝑛 (𝑏𝑖𝑡) + 𝐱𝑖𝑡
′ 𝟒 + 𝑣𝑡 + 𝜃𝑖 (1)
where 𝐇𝑖 is a vector of dummy variables for hospital types (Specialist, Teaching, Mental Health) with Acute as the baseline type. 𝐹𝑖𝑡 is a dummy variable for the hospital having Foundation Trust status. No hospital changed its type over the period but three became Foundation Trusts so that 𝐹𝑖𝑡 does
vary over time. 𝐱𝑖𝑡 is a vector of covariates. 𝑣𝑡 are year dummies. The coefficients are the proportionate changes in the number of days of delay from a one unit change in the explanatory variable if it is continuous or from a change from 0 to 1 for a dummy variable such as hospital type. We enter the logarithms of LTC beds and prices in the models so that their coefficients are the % change in delays associated with a 1% increase in beds or prices.
𝑏𝑖𝑡 is the number of beds in the hospital. We estimate (1) with beds as an exposure term i.e. with 3 = 1. This is equivalent to standardising the dependent variable for the hospital size. We could have used the number of patients (rather than beds) as the exposure term but this raises concerns about simultaneity if hospitals with more delayed discharges admit fewer patients because no beds are available. We therefore, as in Propper et al. (2004) and Kolstad and Kowalski (2012), use beds to measure hospital size. To allow for the possibility that larger hospitals are better or worse at managing delays, we also include a vector of bed size categories (200-399, 400-599,…,1000-1499, 1500 and over) in 𝐱𝑖𝑡 with unconstrained coefficients. We use the NB2 Negative Binomial model (Cameron and Trivedi, 1986) with the variance being a quadratic function of the mean: 𝑉𝑎𝑟 (𝑦𝑖𝑡|𝒙𝑖𝑡) =
𝑖𝑡+ 𝛿
𝑖𝑡2 . The main alternative count model, the
Poisson, assumes that the variance is equal to the mean and we find this strong assumption does not hold in our data. We first estimate five versions of (1) for all delays and then for delays due to the NHS. The first includes only the hospital type categories. We then allow for hospital size by adding beds as an exposure term and the bed size categories. Next we add the number and price of local care home beds and then the case-mix variables. These models are estimated with robust standard errors. Our fifth model allows for time invariant unobserved hospital effects, which are included in the model as random effects which follow a beta distribution and uses observed information matrix standard errors. Finally, we estimate models including interactions between FT status and hospital type. These are a
robustness check of the assumption made in earlier models that the impact on delays of FT status is
consistent across hospital type.

8 CHE Research Paper 133
4. Results
4.1. Descriptive statistics
The average Trust has around 6000 bed-days lost due to delays of which 4000 are attributed to the NHS. Delays increased by 2.5% per year, from 5742 days in 2011-12 to 6182 days of delay in 2013-14. Delays due solely to the NHS increased more quickly than delays due to other institutions and rose from 64% to 69% of all delays over the period. Figure 1 shows the distribution of the number of days of delay across Trusts in 2013-14. The distribution is right skewed, with a small proportion of providers with a large number of delays. The distribution is similar for the other years.
Figure 1: Days of Delay
Without accounting for size, total delays are largest in Teaching Trusts and smallest in Specialist Trusts. Acute and Mental Health Trusts have similar numbers of days of delay. However, Teaching Trusts are larger hospitals while Acute Specialist and Mental Health providers tend to be smaller. Figure 2 shows days of delay per 100 beds for the different types of Trust and by FT status. Mental Health Trusts have the highest number of days of delay per bed, around 50% more than Acute and Teaching Trusts. Specialist Trusts have the smallest number of days of delay per bed. Mental Health Trusts have a much smaller proportion of delays which are attributed to the NHS (44% versus over 70% across other types of Trust).

Delayed Discharges and Hospital Type: Evidence from the English NHS 9
Figure 2: Days of Delay per 100 Beds by Trust Type
Figure 2 also indicates that there are fewer days of delay per 100 beds in Trusts with FT status compared to non FT Trusts, particularly for delays attributed to the NHS. Overall, delays per 100 beds are 8-9% smaller in Foundation Trusts and delays attributed to the NHS are 18-19% smaller. As Table 1 shows, 57% of Trusts are Acute (ie non-teaching, non-specialist hospitals), 13% are Teaching Acute Trusts, and 25% are Mental Health Trusts. Only 6% are Specialist Trusts. 63% have Foundation Status. Trusts have on average 643 beds. 22% of patients admitted to hospital are older than 75 years and around 40% are admitted as emergencies. The standardised readmission rate is 9% on average. The average Trust has about 3100 care home beds within 10 kilometres from the Trust Headquarters. Within the same radius, the average price for a week stay in a care home is £550.

10 CHE Research Paper 133
Table 1: Descriptive Statistics
Mean Standard deviation
Observations Minimum Maximum
Days of Delay
All Trusts 5997 5294 614 0 43899
Acute Trust 5654 4050 349 97 18363
Acute Specialist Trust 613 632 36 0 2427
Acute Teaching Trust 9820 9067 78 291 43899
Mental Health Trust 6096 4396 151 228 23641
Foundation Trust 5488 4737 385 0 23641
Days of Delay Attributed to NHS
All Trusts 4002 3869 614 0 25494
Acute Trust 4262 3415 349 33 17297
Acute Specialist Trust 348 491 36 0 2115
Acute Teaching Trust 7071 6034 78 161 25494
Mental Health Trust 2688 2321 151 23 12528
Foundation Trust 3494 3526 385 0 17297
Trust type
Acute Trust 0.568 0.496 614 0 1
Acute Specialist Trust 0.059 0.235 614 0 1
Acute Teaching Trust 0.127 0.333 614 0 1
Mental Health Trust 0.246 0.431 614 0 1
Foundation Trust 0.627 0.484 614 0 1
Covariates
Hospital Beds 642.8 352.3 614 7.532 2165
Care Home Beds 3129 2182 614 118 7496
Care Home Price/Week 550.3 90.79 614 414.4 722.1
% of patients aged 60-74 20.60 6.319 614 0.977 47.00
% of patients older than 75 21.96 8.833 614 0 60.36
% male patients 45.73 5.843 614 1.554 77.35
% Emergency Admissions 39.78 14.75 614 0 97.73
% Standardised Readmissions 8.622 4.832 614 0 17.1 614 (208, 203 and 203) Trusts in 2011/12-2013/14. Mean, Standard deviation, Observations, Minimum and Maximum are over three years. Days of Delay: total days of delay experienced by all delayed patients during a year. NHS Days of Delay: total days of delay experienced by delayed patients during a year attributed to the NHS. Hospital Beds: annual average daily number of available or occupied beds. Care Home Beds: number of beds in care homes within 10km of the Trust’s headquarters in 2011 whose primary clients are patients aged 65+ or with dementia. Care Home Price/Week: average weekly price in care homes within 10km of the Trust’s headquarters in 2011 whose primary clients are patients aged 65+ or with dementia. Standardised readmissions: annual indirectly standardised emergency readmission within 28 days, lagged by two years.
4.2. Regression results
Table 2 reports the Negative Binomial regressions with total bed days lost as the dependent variable. Model 1 is a pooled model which includes only Trust type dummy variables, with Acute Trusts as the baseline type. In Model 2 we add a hospital beds exposure term with a coefficient equal to one, which effectively standardises delays by beds, and also add bed size categories. Model 3 adds measures of LTC availability (beds and prices) and model 4 also has case-mix and emergency readmissions. Model 5 includes the same explanatory variables as model 4 but allows for unobserved random hospital effects.
Delayed Discharges and Hospital Type: Evidence from the English NHS 11
Table 2: Days of Delay
Model (1): Hospital type only
Model (2): (1) plus exposure and size
categories
Model (3): (2) plus care home
beds, prices
Model (4): (3) plus covariates
Model (5): (4) with random hospital
effects
Coef p-value Coef p-value Coef p-value Coef p-value Coef p-value
Acute Specialist Trust -2.177*** (0.000) -0.727** (0.045) -0.625 (0.138) -0.620 (0.187) 0.0397 (0.886)
Acute Teaching Trust 0.540*** (0.002) 0.0967 (0.602) 0.122 (0.430) 0.121 (0.430) -0.138 (0.344)
Mental Health Trust 0.0981 (0.394) 0.481*** (0.000) 0.615*** (0.000) 0.457** (0.015) 0.205 (0.218)
Foundation Trust -0.128 (0.196) -0.125 (0.118) -0.163** (0.039) -0.147* (0.065) -0.329*** (0.000)
2012-13 0.0523* (0.084) 0.0438 (0.154) 0.0351 (0.273) 0.0256 (0.434) 0.0210 (0.539)
2013-14 0.0545 (0.174) 0.0563 (0.175) 0.0492 (0.243) 0.0418 (0.344) 0.0428 (0.224)
Hospital Beds 200-399 -0.0266 (0.931) -0.234 (0.534) -0.353 (0.350) -0.255 (0.239)
Hospital Beds 400-599 -0.0601 (0.850) -0.181 (0.636) -0.335 (0.377) -0.319 (0.152)
Hospital Beds 600-799 -0.0106 (0.974) -0.0819 (0.833) -0.215 (0.580) -0.274 (0.232)
Hospital Beds 800-999 -0.0246 (0.940) -0.0430 (0.912) -0.172 (0.663) -0.175 (0.447)
Hospital Beds 1000-1499 0.0428 (0.897) 0.0119 (0.976) -0.121 (0.756) -0.159 (0.501)
Hospital Beds 1500+ -0.426 (0.259) -0.306 (0.465) -0.407 (0.323) -0.687** (0.029)
Ln Care Home Beds -0.270*** (0.000) -0.266*** (0.000) -0.288*** (0.000)
Ln Care Home Price/Week 0.166 (0.530) 0.214 (0.438) 0.417* (0.081)
% of patients aged 60-74 -0.0126 (0.495) -0.0405*** (0.000)
% of patients older than 75 0.0127** (0.026) 0.0221*** (0.000)
% of male patients 0.0150 (0.105) 0.0146** (0.021)
% of emergency admissions 0.00136 (0.685) 0.00254 (0.352)
% standardised readmissions -0.000471 (0.973) -0.00121 (0.872)
Constant 8.676*** (0.000) 2.192*** (0.000) 3.298** (0.047) 2.359 (0.254) -4.782*** (0.007)
Ln alpha -0.401*** (0.000) -0.712*** (0.000) -0.790*** (0.000) -0.806*** (0.000)
Ln r 1.150*** (0.000)
Ln s 7.406*** (0.000)
Exposure Ln Beds in Trust Ln Beds in Trust Ln Beds in Trust Ln Beds in Trust
AIC 11747.9 11539.1 11489.4 11488.3 11183.7
BIC 11783.2 11601.0 11560.1 11581.1 11280.9
s.e. Cluster Cluster Cluster Cluster OIM
Negative binomial models: (1) to (4) pooled, (5) random effects. Dependent variable: total days of delay experienced by all delayed patients during a year. Coefficients are proportionate change in days of delay from one unit increase in explanatory variable. Standardised readmissions are lagged by two years. Exposure term has a coefficient of 1. Ln alpha: log of overdispersion. Ln r and Ln s: shape parameters of the beta (r, s) distribution of random effects. AIC: Akaike Information Criterion. BIC: Bayesian Information Criterion. s.e.: standard errors. Cluster: cluster robust standard errors. OIM: observed information matrix standard errors. Observations: 614 = 208, 203 and 203 for 2011-12, 2012-13 and 2013-14. *p < 0.1, **p < 0.05, ***p < 0.01

12 CHE Research Paper 133
In all models we find that there is over dispersion, rejecting the Poisson specification relative to the Negative Binomial. The goodness of fit measures (AIC and BIC) broadly indicate that additional variables improve the explanatory power of the models, though the improvement from adding all the case-mix controls (model 4) is small. Foundation Trust status is associated with 15-16% fewer bed-days lost after standardising for beds and controlling for long-term care and case-mix (Models 3 and 4). After controlling for unobserved heterogeneity, the difference is even larger (33%). Once bed numbers are allowed for, Teaching Trusts have similar delays to Acute Trusts. Specialist Trusts have around 60% fewer delays per bed than Acute Trusts (model 3) but the difference is not statistically significant, even at 10%, once long-term care availability and patients’ case-mix have been controlled for (model 4). Mental Health Trusts are associated with 46-62% more delayed days after accounting for size (models 2 to 4). However, this effect is smaller and insignificant after controlling for unobserved heterogeneity (model 5). The availability of long-term care beds is consistently associated with fewer delays. We use the logarithms of LTC beds and prices in the models so that their coefficients are the % change in delays associated with a 1% increase in beds or prices. Thus the results in models 3 to 5 suggest that a 1% increase in long-term care beds is associated with 0.27-0.29% fewer delays. Higher prices for long-term care beds are positively associated with delays but the coefficient is at most weakly significant (model 5). Trusts with a higher percentage of patients aged 75 years or over have more delays (models 4 and 5). Treating 1% more patients in this age category is associated with 0.01-0.02% more delays. A higher proportion of male patients is also positively associated with more delays (model 5). Given the models condition on age and men have shorter disability-free life expectancy, this variable may capture a greater likelihood of non-acute health problems which make it more difficult to discharge male patients. To capture economies or diseconomies of scale, we include hospital bed number categories with the omitted category less than 200 beds. Since we also include beds as an exposure term with a coefficient of unity, the generally negative coefficients on the bed number categories imply that delays increase less than proportionately with beds. However, the coefficients are only statistically significant in the random effects specification (5) and only for the largest size category (more than 1500).
4.3. NHS delays
Table 3 provides the results for delays attributed to the NHS. Unlike the Table 2 results for all delays, Mental Health Trusts do not differ significantly from Acute Trusts after accounting for size, long-term care and case-mix variables. As in Table 2 for all delays, there are no significant differences between other Trust types and Acute Trusts after controlling for beds. A 1% increase in long-term care beds is associated with 0.23-0.27% fewer NHS delays, a similar result to that for all delays.

Delayed Discharges and Hospital Type: Evidence from the English NHS 13
Table 3: Days of Delay Attributed to NHS
Model (1): Hospital type only
Model (2): (1) plus exposure and
size categories
Model (3): (2) plus care home
beds, prices
Model (4): (3) plus covariates
Model (5): (4) with random hospital effects
Coef p-value Coef p-value Coef p-value Coef p-value Coef p-value
Acute Specialist Trust -2.429*** (0.000) -0.717 (0.104) -0.503 (0.364) -0.723 (0.241) -0.172 (0.599)
Acute Teaching Trust 0.491*** (0.003) 0.0524 (0.784) 0.106 (0.520) 0.0694 (0.689) -0.0250 (0.874)
Mental Health Trust -0.433*** (0.001) -0.0493 (0.626) 0.0868 (0.432) -0.326 (0.174) -0.200 (0.312)
Foundation Trust -0.171 (0.125) -0.171* (0.064) -0.229** (0.013) -0.190** (0.040) -0.393*** (0.000)
2012-13 0.0967*** (0.004) 0.109*** (0.002) 0.0984*** (0.007) 0.0856** (0.021) 0.0535 (0.169)
2013-14 0.122** (0.011) 0.151*** (0.002) 0.148*** (0.003) 0.145*** (0.005) 0.0976** (0.014)
Hospital Beds 200-399 0.253 (0.483) 0.128 (0.774) -0.0183 (0.966) 0.253 (0.344)
Hospital Beds 400-599 0.213 (0.559) 0.190 (0.678) 0.0184 (0.967) 0.0581 (0.831)
Hospital Beds 600-799 0.371 (0.321) 0.372 (0.421) 0.216 (0.632) 0.198 (0.477)
Hospital Beds 800-999 0.266 (0.480) 0.304 (0.512) 0.152 (0.738) 0.204 (0.469)
Hospital Beds 1000-1499 0.325 (0.391) 0.342 (0.456) 0.203 (0.653) 0.220 (0.439)
Hospital Beds 1500+ -0.0256 (0.953) 0.0914 (0.852) 0.00967 (0.984) -0.418 (0.257)
Ln Care Home Beds -0.256*** (0.000) -0.230*** (0.004) -0.272*** (0.000)
Ln Care Home Price/Week -0.141 (0.667) 0.00136 (0.997) -0.0180 (0.944)
% of patients aged 60-74 -0.0152 (0.495) -0.0379*** (0.002)
% of patients older than 75 0.0187*** (0.001) 0.0287*** (0.000)
% of male patients 0.0331** (0.023) 0.0156** (0.031)
% of emergency admissions 0.00164 (0.715) 0.00362 (0.250)
% standardised readmissions -0.0127 (0.425) -0.00231 (0.803)
Constant 8.378*** (0.000) 1.569*** (0.000) 4.431** (0.028) 1.997 (0.471) -3.033 (0.114)
Ln alpha -0.162* (0.100) -0.416*** (0.000) -0.460*** (0.000) -0.492*** (0.000)
Ln r 0.892*** (0.000)
Ln s 6.906*** (0.000)
Exposure Ln Beds in Trust Ln Beds in Trust Ln Beds in Trust Ln Beds in Trust
AIC 11251.8 11079.9 11052.7 11040.6 10692.7
BIC 11287.2 11141.7 11123.5 11133.4 10790.0
s.e. Cluster Cluster Cluster Cluster OIM
Negative binomial models: (1) to (4) pooled, (5) random effects. Dependent variable: total days of delay in year attributed to NHS. Coefficients are proportionate change in days of delay from one unit increase in explanatory variable. Standardised readmissions are lagged by two years. Exposure term has a coefficient of 1. Ln alpha: log of overdispersion. Ln r and Ln s: shape parameters of the beta (r, s) distribution of random effects. AIC: Akaike Information Criterion. BIC: Bayesian Information Criterion. s.e.: standard errors. Cluster: cluster robust standard errors. OIM: observed information matrix standard errors. Observations: 614 = 208, 203 and 203 for 2011-12, 2012-13 and 2013-14. *p < 0.1, **p < 0.05, ***p < 0.01

14 CHE Research Paper 133
The effect of Foundation Trust status is again negative, statistically significant, and large in magnitude. Foundation Trusts incur 19-23% fewer delays after accounting for size, long-term care and case-mix in models 3 and 4. The inclusion of Random Effects to account for unobserved heterogeneous effects again increases the size of the effect (39%).
4.4. Interaction of FT status and Trust type
Models 1 to 5 assume that having Foundation Trust status has the same implications for all types of Trust. We also estimated specifications similar to models 4 and 5 but with the addition of interactions between FT status and Trust type. Results were broadly similar to those in Tables 2 and 3 and did not suggest that the association between FT status and delays varies by type of Trust. Although there was large positive and highly significant coefficients on the interaction of Specialist Trust and Foundation Trust for NHS days of delay, this was driven by the only Specialist Trust which does not have FT status and which had a very small number of delays attributed to the NHS in the study period. All other interactions between Foundation Trust status and Trust type were statistically insignificant.
Delayed Discharges and Hospital Type: Evidence from the English NHS 15
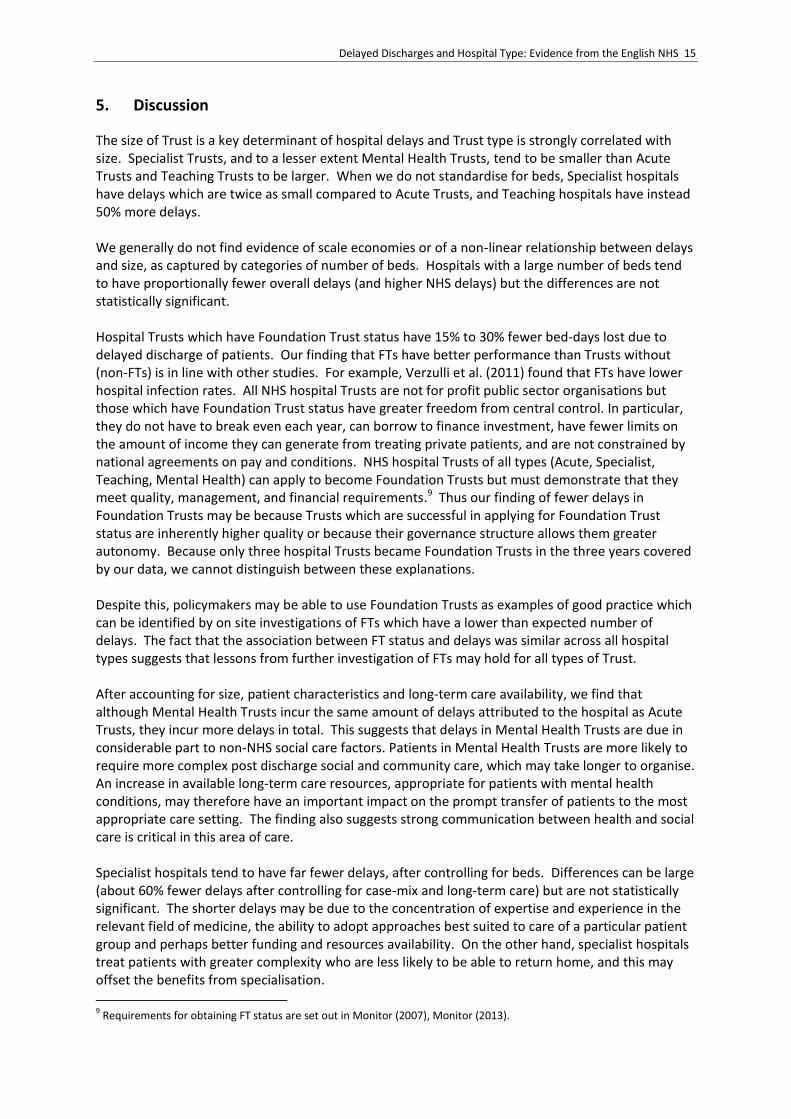
5. Discussion
The size of Trust is a key determinant of hospital delays and Trust type is strongly correlated with size. Specialist Trusts, and to a lesser extent Mental Health Trusts, tend to be smaller than Acute Trusts and Teaching Trusts to be larger. When we do not standardise for beds, Specialist hospitals have delays which are twice as small compared to Acute Trusts, and Teaching hospitals have instead 50% more delays. We generally do not find evidence of scale economies or of a non-linear relationship between delays and size, as captured by categories of number of beds. Hospitals with a large number of beds tend to have proportionally fewer overall delays (and higher NHS delays) but the differences are not statistically significant. Hospital Trusts which have Foundation Trust status have 15% to 30% fewer bed-days lost due to delayed discharge of patients. Our finding that FTs have better performance than Trusts without (non-FTs) is in line with other studies. For example, Verzulli et al. (2011) found that FTs have lower hospital infection rates. All NHS hospital Trusts are not for profit public sector organisations but those which have Foundation Trust status have greater freedom from central control. In particular, they do not have to break even each year, can borrow to finance investment, have fewer limits on the amount of income they can generate from treating private patients, and are not constrained by national agreements on pay and conditions. NHS hospital Trusts of all types (Acute, Specialist, Teaching, Mental Health) can apply to become Foundation Trusts but must demonstrate that they meet quality, management, and financial requirements.9 Thus our finding of fewer delays in Foundation Trusts may be because Trusts which are successful in applying for Foundation Trust status are inherently higher quality or because their governance structure allows them greater autonomy. Because only three hospital Trusts became Foundation Trusts in the three years covered by our data, we cannot distinguish between these explanations. Despite this, policymakers may be able to use Foundation Trusts as examples of good practice which can be identified by on site investigations of FTs which have a lower than expected number of delays. The fact that the association between FT status and delays was similar across all hospital types suggests that lessons from further investigation of FTs may hold for all types of Trust. After accounting for size, patient characteristics and long-term care availability, we find that although Mental Health Trusts incur the same amount of delays attributed to the hospital as Acute Trusts, they incur more delays in total. This suggests that delays in Mental Health Trusts are due in considerable part to non-NHS social care factors. Patients in Mental Health Trusts are more likely to require more complex post discharge social and community care, which may take longer to organise. An increase in available long-term care resources, appropriate for patients with mental health conditions, may therefore have an important impact on the prompt transfer of patients to the most appropriate care setting. The finding also suggests strong communication between health and social care is critical in this area of care. Specialist hospitals tend to have far fewer delays, after controlling for beds. Differences can be large (about 60% fewer delays after controlling for case-mix and long-term care) but are not statistically significant. The shorter delays may be due to the concentration of expertise and experience in the relevant field of medicine, the ability to adopt approaches best suited to care of a particular patient group and perhaps better funding and resources availability. On the other hand, specialist hospitals treat patients with greater complexity who are less likely to be able to return home, and this may offset the benefits from specialisation.
9 Requirements for obtaining FT status are set out in Monitor (2007), Monitor (2013).

16 CHE Research Paper 133
Teaching Trusts have similar delays to Acute Trusts after controlling for size. Teaching Status is generally considered a marker of higher quality. Teaching Trusts offer also a wider range of specialised services, attracting more severe patients. The higher quality may therefore raise demand and more complex case-mix can put an upward pressure on delays. In addition, the responsibilities of training medical students might increase the time it would otherwise have taken to discharge a patient. The higher perceived quality of teaching hospitals may also imply they have better management and more dedicated staff, which in turn may reduce delays. An increase in the supply of care home beds is associated with fewer delays, in line with the findings of Fernandez and Forder (2008) and Gaughan et al. (2015). As a patient can only be discharged to institutional long-term care when a bed is available, an increased supply of such beds would be expected to reduce delayed discharges from hospital. However, such institutional care might not always be the most appropriate setting for care immediately after discharge. Especially for less severe patients, alternatives such as support in a patient’s own home, if available, may be preferred by the patient. The price for a week of care in local care homes had a consistently positive coefficient but was not found to have a significant impact on delays. This may reflect the overriding importance of providing appropriate care in a timely manner, rather than searching for the lowest price. Trusts with a higher percentage of patients aged over 75 years have more delays. Older patients are more intensive users of hospital and LTC services (Bardsley et al. 2012 and Forder 2009), are likely to have more comorbidities and disabilities (Kasteridis et al. 2015, di Maijer 2011) and therefore require a more complex care package. This finding suggests that an aging population might put further pressure on delays in the future. A higher number of older and frailer patients may call for more sophisticated packages of care. This implies even greater value in communication between providers of health and social care.

Delayed Discharges and Hospital Type: Evidence from the English NHS 17
6. Conclusions
Reducing delays in discharge from hospital is a long standing policy concern. This study has investigated differences in delays by type of hospital. Hospital types are easily observable to the regulator and policy interventions can easily be targeted at a particular hospital type. We find that Foundation Trusts have fewer delays. Foundation Trusts might therefore be used as exemplars of good practice in managing delays. Policy makers could investigate how such reductions have been achieved and provide insights to ensure that good practice is spread throughout the NHS. There is particular value in using Foundation Trusts as exemplars as all types of Trust (Acute, Specialist, Teaching, Mental Health) have become Foundation Trusts. Mental Health Trusts have more delayed discharges due to non-NHS factors including social care. This may indicate unmet social care needs for mental health patients requiring more sophisticated care packages which take longer to organise and suggest that better coordination of hospital, community and social care would be particularly beneficial in reducing delayed discharges for mental health patients.

18 CHE Research Paper 133
References
Appleby J, Humphries R, Thompson J, Galea A. (2013), How is the health and social care system performing? February 2013: Quarterly monitoring report, London viewed on 10.04.15 http://www.kingsfund.org.uk/publications/how-health-and-social-care-system-performing-february-2013 Bardsley M, Georghiou T, Chassin L, Lewis G, Steventon A, Dixon J. (2012). Overlap of hospital use and social care in older people in England. Journal of Health Services Research & Policy;17:3:133-139. Cameron A, Trivedi P. (1986). Econometric models based on count data: Comparisons and applications of some estimators and tests. Journal of Applied Econometrics; 1:29-54. de Maijer C, Koopmanschap M, d’Uva TB, van Doorlsaer E. (2011), Determinants of long-term care spending: Age, time to death or disability? Journal of Health Economics; 30:425-438. DH (2003), Health Service Circular/Local Authority Circular, The Community Care (Delayed Discharges Etc) Act 2003: Guidance for Implementation. Viewed on 09.02.15, http://www.leeds.ac.uk/lpop/Key%20Policy%20Documents/communitycaredelayeddisc.pdf DH. (2010a). KH03 Quarterly bed Availability and Occupancy. Viewed on 21.08.14. http://www.england.nhs.uk/statistics/statistical-work-areas/bed-availability-and-occupancy/ DH. (2010b). Sitreps. Viewed on 14.11.12, http://www.england.nhs.uk/statistics/statistical-work-areas/delayed-transfers-of-care/ Eggleston K, Shen Y-C, Lau J, Schmid CH, Cha H. (2008). Hospital ownership and quality of care: what explains the different results in the literature? Health Economics;17(12):1345–1362. European Commission Economic Policy Committee. (2009). European Economy 2|2009 (2009) Ageing report: Economic and budgetary projections for the EU-27 member states (2008-2060) Brussels. Viewed on 09.04.15, http://ec.europa.eu/economy_finance/publications/publication_summary14911_en.htm Fernandez J, Forder J. (2008). Consequences of local variations in social care on the performance of the acute health care sector. Applied Economics;40(12):1503-1518. Forder J. (2009). Long-term care and hospital utilisation by older people: An analysis of substitution rates. Health Economics; 18(11):1322-1338. Gaughan J, Gravelle H, Siciliani L. (2015). Testing the bed-blocking hypothesis: Does higher supply of nursing and care homes reduce delayed hospital discharges? Health Economics;24(S1):32-44. Glasby J, Dickinson H, Miller R. (2011). Partnership working in England: where we are now and where we’ve come from. International Journal of Integrated Care; 11:1-8. Health Foundation. (2013). Improving the Flow of Older People: Sheffield teaching hospital NHS Trust’s experience of the flow cost quality improvement programme. London. Viewed on 10.04.15, http://www.health.org.uk/media_manager/public/75/publications_pdfs/Improving%20the%20flow%20of%20older%20people.pdf

Delayed Discharges and Hospital Type: Evidence from the English NHS 19
House of Commons Health Committee. (2013). Second Report of Session 2013-14 Volume I: Urgent and Emergency Care. London. Viewed on 10.04.15, http://www.publications.parliament.uk/pa/cm201314/cmselect/cmhealth/171/17102.htm HSCIC. (2013a). Emergency Readmissions to Hospital within 28 days of Discharge: Indicators Specification Document. Viewed on 30.09.15. https://indicators.ic.nhs.uk/download/NCHOD/Specification/Spec_03N_523ISP4ADP_12_V1.pdf HSCIC. (2013b). Hospital Episode Statistics, Admitted Patient Care, England 2012-13 (NS). Viewed on 08.09.14. http://www.hscic.gov.uk/catalogue/PUB12566 HSCIC. (2013c), Important updates to iView monthly workforce. Viewed on 09.09.2014, http://www.ewin2.nhs.uk.boilerhousestudio.co.uk/news/item/2335/important-updates-to-iview-monthly-workforce-nhs-earnings-is-now-live-and-benchmark-organisation-grouping-changes HSCIC. (2014). Indicator Portal. Viewed on 30.09.15. https://indicators.ic.nhs.uk/webview/ Kasteridis P, Street A, Dolman M, Gallier L, Hudson K, Martin J, Wyer I. (2015). Who would benefit most from improved integrated care? Implementing an analytical strategy in South Somerset. Journal of Integrated Care;15: 1-11. Kolstad JT, Kowalski AE. (2012). The impact of health care reform on hospital and preventive care: Evidence from Massachusetts. Journal of Public Economics;96:909-29. Kuhn M, Nuscheler R. (2011). Optimal public provision of nursing homes and the role of information. Journal of Health Economics; 30:795-810. Laing and Buisson (2010). Laing and Buisson: Care Homes Complete Dataset. Viewed on 06.01.11. www.laingbuisson.co.uk/Data/CareHomes/tabid/603/ProductID/50/Default.aspx Lowe CR, McKeown T. (1949). The care of the chronic sick: 1. Medical and nursing requirements. British Journal of Social Medicine;3:110-126. Manhaes M, Glampson B, Pryce A. (2013). Data Handling Notes: Patient Safety Organisation Patient Safety Incident Reports (NRLS official statistics): October 2012 to March 2013 (tenth release, September 2013). Viewed on 09.02.15. http://www.nrls.npsa.nhs.uk/resources/?entryid45=135262 Monitor. (2007). Compliance Framework. Viewed on 11.02.14. http://www.avantec.uk.com/downloads/government/Monitor%20Compliance%20Framework%20Apr_07_.pdf Monitor. (2013). Applying for NHS Foundation Trust Status: A Guide For Applicants. Viewed on 11.02.15, http://webarchive.nationalarchives.gov.uk/20140106173514/http://www.monitor-nhsft.gov.uk/sites/default/files/publications/ToPublishGuideforApplicants12April2013FINAL.pdf Monitor. (2014). NHS Foundation Trust Directory. Viewed on 30.10.14, https://www.gov.uk/government/publications/nhs-foundation-trust-directory/nhs-foundation-trust-directory

20 CHE Research Paper 133
NHS England. (2013). Supporting information for Organisation Patient Safety Incident Reports – March 2013. Viewed on 10.07.15. http://www.nrls.npsa.nhs.uk/resources/?entryid45=135145 NHS England. (2014a). Delayed Transfers of Care. Viewed on 18.03.14. http://www.england.nhs.uk/statistics/statistical-work-areas/delayed-transfers-of-care/ NHS England. (2014b). Quarterly Bed Availability and Occupancy. Viewed on 21.08.14. http://www.england.nhs.uk/statistics/statistical-work-areas/bed-availability-and-occupancy/ Propper C, Burgess S, Green K. (2004). Does competition between hospitals improve the quality of care?: Hospital death rates and the NHS internal market. Journal of Public Economics; 88:1247-72. Verzulli R, Jacobs R, Goddard M. (2011). Do hospitals respond to greater autonomy? Evidence from the English NHS. CHE Research Paper, no. 64. http://www.york.ac.uk/che/publications/in-house/#tab-5

Delayed Discharges and Hospital Type: Evidence from the English NHS 21
Appendix
Table A: Days of Delay with Foundation Trust-Type Interactions
Days of Delay Days of Delayed Attributed to NHS
Pooled Model Random Trust Effects
Pooled Model Random Trust Effects
Acute Specialist Trust -0.685 (0.144) 0.137 (0.816) -2.833*** (0.000) -2.815*** (0.007)
Acute Teaching Trust 0.193 (0.420) 0.0606 (0.738) 0.108 (0.657) 0.114 (0.566)
Mental Health Trust 0.501** (0.028) 0.193 (0.361) -0.222 (0.453) -0.400* (0.095)
Foundation Trust -0.120 (0.228) -0.276*** (0.003) -0.163 (0.155) -0.460*** (0.000)
Teaching Trust- FT Interaction
-0.111 (0.683) -0.366* (0.090) -0.0610 (0.832) -0.318 (0.181)
Specialist- FT Interaction
0.0605 (0.846) -0.130 (0.823) 2.241*** (0.000) 2.972*** (0.004)
Mental Health- FT Interaction
-0.0660 (0.701) -0.00124 (0.995) -0.163 (0.412) 0.269 (0.204)
Ln Care Home Beds -0.263*** (0.000) -0.287*** (0.000) -0.239*** (0.004) -0.258*** (0.000)
Ln Care Home Price/Week
0.221 (0.433) 0.418* (0.081) 0.0340 (0.923) -0.0206 (0.935)
Ln alpha -0.807*** (0.000) -0.511*** (0.000)
Ln r 1.147*** (0.000) 0.866*** (0.000)
Ln s 7.393*** (0.000) 6.831*** (0.000)
Exposure Ln Beds in Trust Ln Beds in Trust Ln Beds in Trust Ln Beds in Trust
AIC 11491.8 11186.7 11031.0 10676.3
BIC 11593.4 11297.2 11132.6 10786.8
s.e. cluster OIM cluster OIM
Negative binomial models. Days of Delay: total days of delay in year Days of Delay Attributed to NHS: total days of delay in year attributed to NHS. Coefficients are proportionate change in days of delay from one unit increase in explanatory variable. These coefficients are also conditional on year dummies, Hospital beds, age, gender emergency and readmission variables as in Tables 2 and 3 Exposure term has a coefficient of 1. Ln alpha: log of overdispersion. Ln r and Ln s: shape parameters of the beta (r, s) distribution of random effects. AIC: Akaike Information Criterion. BIC: Bayesian Information Criterion. s.e.: standard errors. Cluster: cluster robust standard errors. OIM: observed information matrix standard errors. Observations: 614 = 208, 203 and 203 for 2011-12, 2012-13 and 2013-14. *p < 0.1, **p < 0.05, ***p < 0.01.