The Integrated Biogas Agro-Ecological Revolution 20090312 Rev 1

Defining Agro-Ecological Units
Douglas Muchoney, FAO
Forum of Experts in SEEA Experimental Accounting 2018
Glen Cove, New York
18-20 June 2018

Land evaluation and planning
• The Agro‐Ecological Zones (AEZ) process is the main system for assessing agricultural resources and potential
• Can be applied at global, regional and national levels for better planning, management and monitoring of land resources
• FAO involved in methodology development since 1978
• Used as SO-2 indicator (area with improved agricultural productivity and crop suitability
http://gaez.fao.org/Main.html
GAEZ - Global Agro-Ecological Zones
▪ By FAO and the International Institute for Applied Systems Analysis (IIASA).
▪ GAEZ database is publicly available through a WEB portal.

GAEZ Data Portal capabilities
• Designed to facilitate access to the GAEZ database and resources
• Enables users management
• Delivers terabytes of spatial data, maps, tables, statistics, metadata, reports
• Fully documented (Data model, User’s Manual, GAEZ definitions, FAQ, limitations, and hints available)
• Compliant with FAO definitions, classifications and standards, ISO metadata standards to feed FAO GeoNetwork
http://gaez.fao.org/Main.html

GAEZ Data Portal• Brief summary of content:
– 5 thematic areas (Land and water resources; Agro-climatic resources; Suitability and potential yields; Actual yields and production; Yield and production gaps)
– > 300,000 global datasets at mainly 5 arc-minutes, also core layers at 30 arc-seconds
– 11 crop groups, 49 crops, 92 crop types and 280 Crop/LUTs
– yield and production gap analysis for 17 crops/commodities
– 5 water supply types
– 4 Input levels (High, Intermediate, Low, Mixed)
– Historical 1961-2000, 30 year average (1961-1990) and Future, 2020s, 2050s, 2080s)
www.fao.org/nr/gaez

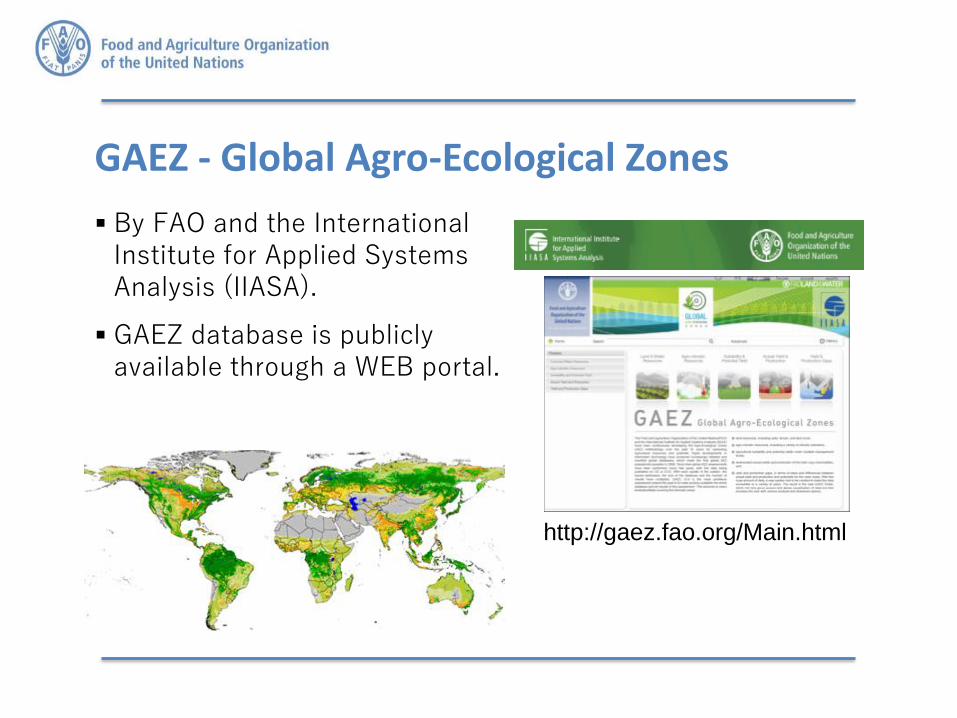
National AEZ: ThailandAgro-ecological assessment of crop suitability and productivity
• Input: resource databases; crop requirements and crop suitability criteria; crop calendars; crop statistics; industry and research data of potential attainable yields.
• Output: Mapped suitability and attainable yields by single crop and selected multi-cropping systems.
http://www.fao.org/3/a-i7077e.pdf
Agro-ecologicalSuitability
Rain-fedMajor Rice
AttainableYield (kg/ha)

Rain-fedMajor Rice
Agro-economicSuitability
Estimation of ‘optimized’ spatial production structure
Rain-fedMaize

▪ Integrated processing environment where physical and socio-economic data are analyzed;
▪ Help identify sustainable land management practices;
▪ Allows implementation of an integrated and interactive approach to land use planning;
▪ Support for technicians and policy makers;
▪ Enables assessment and modeling of land suitability and responses to potential agricultural production;
▪ Developed and applied in Libya; Currently under development in Laos, Afghanistan and Macedonia
Land Resources Information Management System (LRIMS)

Socio-Ecological Systems in Central Anatolia
i) map the ecosystems
ii) determine the ecosystem condition
iii) determine relevant ecosystem services for provisioning
and regulating services
iv) select indicators or modelled outputs of the ecosystem
services for which viable data are available
v) map the ecosystem services and service potential

National mapping

FAO’s Land Cover Mapping in AfricaSpatial resolution: 30m or better
• 2018 South Sudan
• 2018 Macedonia
• 2018 Bangladesh
• 2017 Jordan
• 2017 Afghanistan
• 2016 Lesotho
• 2013 ECONET
Ethiopia
• 2012 Fouta Djallon Highlands
Malawi
• 2011 Sudan
• 2010 South Sudan
Tunisia
Kenya Update
• 2007 Somalia
• 2006 Kenya LCC
• 2005 Senegal
• 2004 Libya
• 1998-2004 AFRICOVER
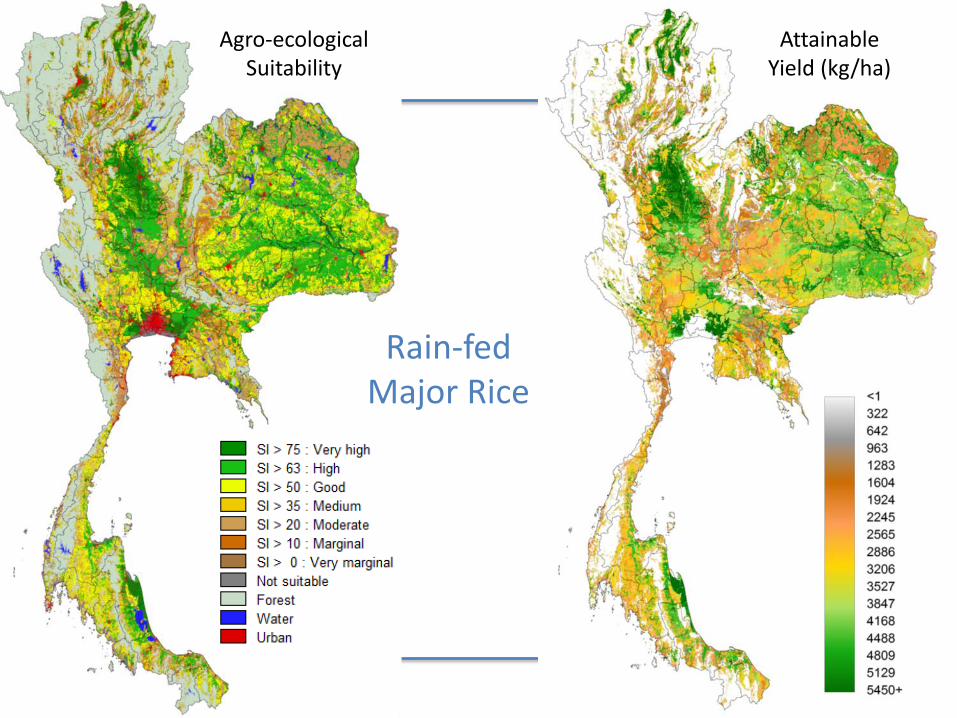
Sudan Land Cover Mapping project was implemented by FAO/NRL division to support the Food Security Information for Action (SIFSIA) program of Sudan Government funded by the European Commission.
Land Cover Mapping: Sudan
OBJECTIVE :
1. production of a detailed and harmonized national land cover database and
2. national capacity building on FAO/GLCN mapping methodology, tools and software to support the national capacity to produce the land cover database.
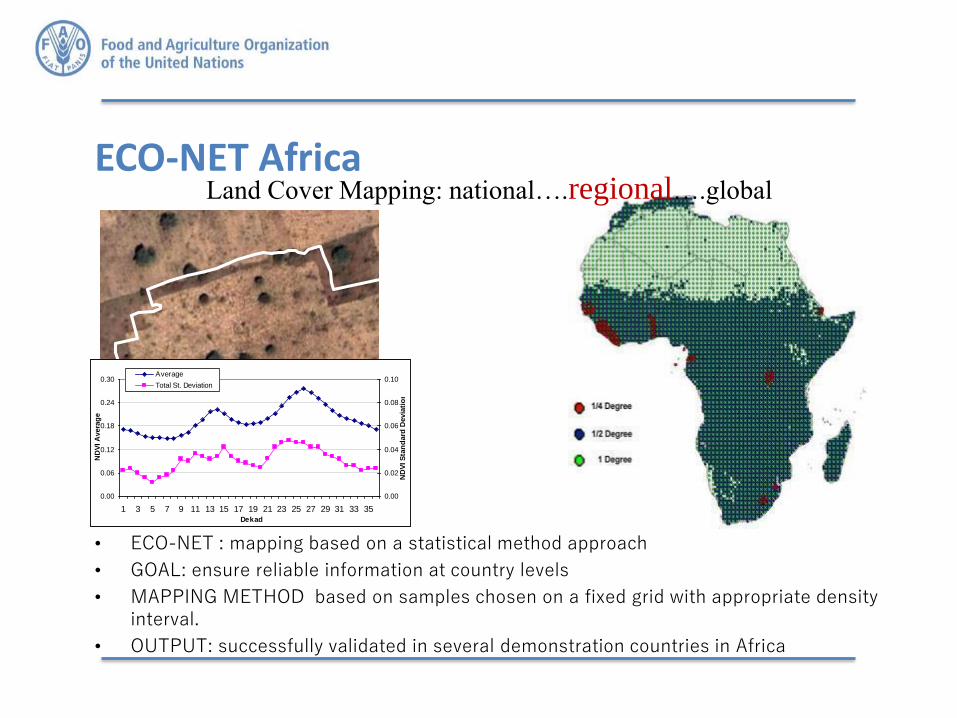
ECO-NET Africa
• ECO-NET : mapping based on a statistical method approach
• GOAL: ensure reliable information at country levels
• MAPPING METHOD based on samples chosen on a fixed grid with appropriate density interval.
• OUTPUT: successfully validated in several demonstration countries in Africa
0.00
0.06
0.12
0.18
0.24
0.30
1 3 5 7 9 11 13 15 17 19 21 23 25 27 29 31 33 35Dekad
ND
VI A
vera
ge
0.00
0.02
0.04
0.06
0.08
0.10
ND
VI S
tan
dard
Devia
tio
n
Average
Total St. Deviation
Land Cover Mapping: national….regional….global

GLC-SHARE initiative
▪ New global land cover database created by FAO in partnership and with contributions from various partners and institutions;
▪ First global product created using the ISO standard for land cover classification ISO TC 211 – 19144-2 LMCL (Land Cover Meta Language);
▪ It provides a set of eleven major thematic land cover layers (FAO SEEA LCML legend);
▪ Resulted by a combination of “best available” high resolution national, regional and/or sub-national land cover databases;
▪ The database is produced with a resolution of 30 arc-second (~1sqkm) .

Land Cover Classification System
• LCCS / LCML : Comprehensive methodology for description, characterization, classification and comparison of most land cover features identified anywhere in the world, at any scale or level of detail: basis for comparative classification. (6 UN official languages)
• Created in response to a need for a harmonized and standardized collection and reporting on the status and trends of land cover

From land cover to land use (LCML to LCHML)
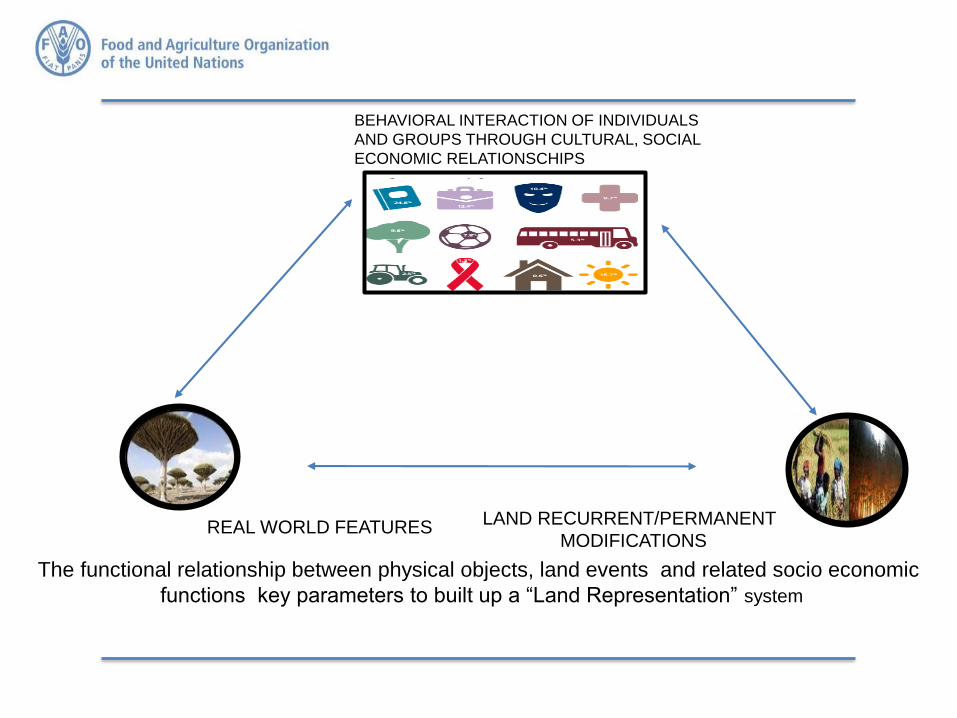
REAL WORLD FEATURESLAND RECURRENT/PERMANENT
MODIFICATIONS
The functional relationship between physical objects, land events and related socio economic
functions key parameters to built up a “Land Representation” system
BEHAVIORAL INTERACTION OF INDIVIDUALS
AND GROUPS THROUGH CULTURAL, SOCIAL
ECONOMIC RELATIONSCHIPS

New opportunities for LC
0
0.5
1
April June July August September October November
ND
VI
Month
Forest deciduous
• OBIA• Multi-temporal• Optical and radar• ARD• LCML - LCHML• Cloud computing
(SEPAL – GEE)• Machine-learning• Integration with local
knowledge and field data

Fragile ecosystem mapping: mangroves
South Myanmar: 2002 mangroves (yellow line) over 1990
image
Photo-interpreted Landsat imagery
• The World Atlas of Mangroves is a significant attempt to provide an overview of the distribution of mangroves worldwide
• NRL (now CBDS) has contributed to this initiative with its extensive experience in remote sensing and mapping, by applying mapping standards (LCCS) and tools (land cover toolbox)

Vulnerable Ecosystems: DECCMA project
DECCMA: Deltas Vulnerability and Climate Change: Migration and Adaptation” examines the vulnerability, environmental stressors and hazards of a range of climate change and biophysically driven scenarios across the study deltas.

Delta synthesis
• Complex systems with large vulnerable populations
• Multiple drivers at multiple scales
• Rapid resultant change, including significant migration
• Climate change needs to be analysed in this dynamic context, including established and emerging migration
• As climate change and sea-level rise increases, so the range of sustainable (plausible) adaptation choices diminishes

DECCMA aims
1. to assess migration as an adaptation in deltaic environments under a changing climate;
2. to deliver policy support on sustainable gender-sensitive adaptation in deltaic areas.
OR
Better understand in deltas:
1. migration processes, including the role of climate change
2. adaptation choices, with a focus on migration.
This will take a participatory and adaptive pathway approach that addresses gender dimensions.

Study sites
The analysis will guide sustainable and equitable development of deltas in Ghana (Volta), India (Mahanadi) and India-Bangladesh (Ganges-Bramaputra-Meghna) and will:
1. identify gender-differentiated stakeholder-relevant scenarios of local/regional/delta level vulnerability to climate change;
2. identify options for effective climate adaptation by the poorest groups in deltas; and
3. lead to the development of gender-sensitive adaptation funding proposals in the three deltas.

FAO in DECCMA
FAO CBDS is contributing to WP2 on vulnerability, hazard and climate change hotspot mapping.
Main outputs are:
• Development of high-resolution land cover datasets using ISO standards (LCCS) for assessment of natural and agricultural resources;
• Development of the agro-Ecological Zoning (AEZ) assessment under a range of scenarios;
• Support on the portal for geospatial data management and distribution

Crop Monitoring: land cover for Area Frame sampling
1. Area frames (AF) is used for crop acreage and yield estimation.
2. Good quality land cover data improves stratification, reduces sample size and allocation and produces more accurate estimates.
3. Ethiopia, Pakistan, Afghanistan
Sam
plin
g u
nit
Punjab South Zone broken down into PSU (red)

Area Frame System
Sampled Segments
Area Frame Sampling Survey in Pakistan
▪ To substantiate the satellite based image classification system, an area frame sampling system has been designed (see below).
▪ The spatial distribution of sampled segments as laid down by standard statistical/remote sensing techniques is shown below.

Monitoring of Rice and Cotton in Afghanistan
Objectives
• To test relevant agriculture methodologies based on recent medium and high resolution geospatial information: Proba-V, Aqua/Terra, Landsat-8, Sentinel-1, Sentinel-2, SPOT-5/6/7 and Pleiades 1A/ 1B imagery with focus on rice monitoring.
• Crop area estimation and crop mask development
Geographical Area: 41000 Sq. Km
Agriculture area: 4100 Sq. Km
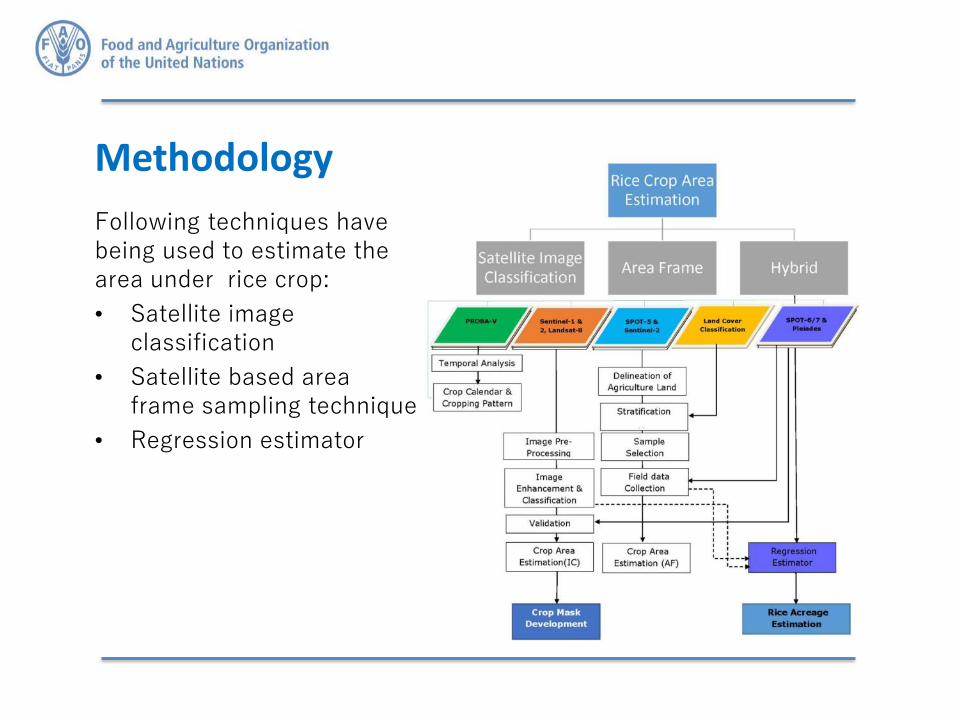
Methodology
Following techniques have being used to estimate the area under rice crop:
• Satellite image classification
• Satellite based area frame sampling technique
• Regression estimator

GeoNetwork – FAO metadata catalogue
• Internet access to interactive maps, satellite imagery and related spatial databases maintained by FAO and its partners;
• Powered by GeoNetwork opensource, which was developed by FAO and other UN agencies based on Free and Open Source Software (FOSS) principles and international standards;
• Almost 7000 records are stored;
• Ongoin upgrade to latest opensource version.
http://www.fao.org/geonetwork/srv/en/main.home

Pakistan Crop Information Portal
• The Pakistan’s Crop Portalis a component of the Pakistan Agriculture Information System;
• It is being developed to support data and information dissemination on major crops (area, yield and production) and agro-meteorological conditions affecting crop growth;
• The Crop Portal uses District based crop data (wheat, maize, sugarcane, rice and cotton) and agromet conditions
http://cip.sgs-suparco.gov.pk]

Afghanistan Agriculture Information Portal (AAIP)

Food Security/Emergencies
• FIVIMS:
– Stunting index, poverty and food security, poverty mapping atlas
• Emergency Preparedness:
– Laos, Haiti,
– Afghanistan
– Pakistan Floods

GEOGLAM
Monitoring Crop Production
• In this context a global system to monitor and assess production is seen as an important decision making tool to:
– provide timely information on crop production and yield in a standardized and regular fashion at the regional to global level.
– provide estimates as early as possible during the growing season(s) and update the estimates periodically through the season until harvest.
• Examples of current global crop estimation systems is GEOGLAM, which combines in-situ information, weather and satellite data in a convergence of evidence approach to estimate production and yield.

SIGMA
Stimulating innovation for Global Monitoring of Agriculture (SIGMA)
• FP7 EC Project.
• SIGMA’s main challenge is to develop innovative methods and indicators to monitor and assess progress towards ‘sustainable agriculture’.
• The project is a contribution to GEOGLAM initiative started by the G20.
• Reinforce awareness of the impact of agriculture on the global environment enabling the prediction of the impact of crop production on natural resources and ecosystems.
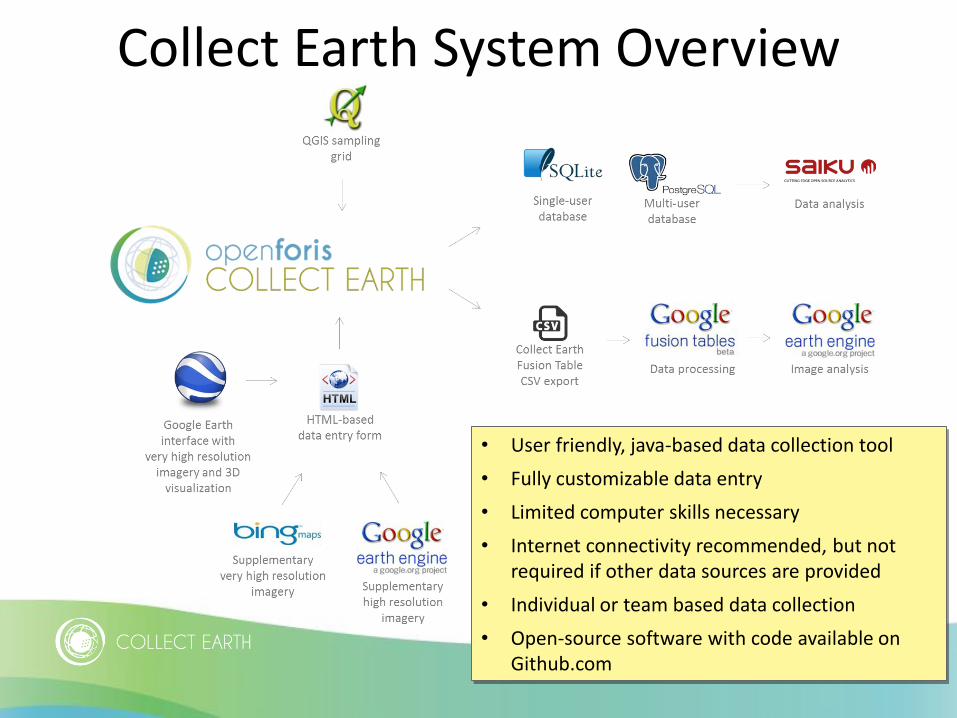
Collect Earth System Overview
• User friendly, java-based data collection tool
• Fully customizable data entry
• Limited computer skills necessary
• Internet connectivity recommended, but not required if other data sources are provided
• Individual or team based data collection
• Open-source software with code available on Github.com

Collect Earth user casesCollect Earth facilitates the analysis
of high and very high resolution satellite imagery for a wide variety of purposes, including :
• Support multi-phase National Forest Inventories
• Land Use, Land Use Change and Forestry (LULUCF) assessments (18 partnering countries)
• Monitoring agricultural land and urban areas
• Accuracy assessment of existing maps (DRC, Zambia)
• Collection of spatially explicit socio-economic data (Vietnam)
• Quantifying deforestation, reforestation and desertification

Capacity Building
• Awareness workshops, training resources and sessions
▪ Regional awareness workshops by FAO staff on land cover mapping methodology, standards and tools
▪ National on-the-job trainings to support national mapping programmes
▪ Project coordination and backstopping
Juba – January 2018
Pakistan – March 2018

Ou
treach / C
apacity
Build
ing / C
om
mun
ication
Outreach

Thank You!!
Geospatial: www.fao.org/geospatilSEPAL: https://sepal.ioGAEZ: http://gaez.fao.org/Main.html


![Sustainability issues in agro-ecology: Socio-ecological ... · tain the integrity of regional scale agro-ecological func- tions [1,3]. Some researchers have adopted a compre-hensive](https://static.fdocuments.in/doc/165x107/5e9fa0bce6362a5dae6dbcb3/sustainability-issues-in-agro-ecology-socio-ecological-tain-the-integrity-of.jpg)