
DEFERRAL AND VARIANCE ACCOUNTS - Toronto … DEFERRAL AND VARIANCE ACCOUNTS 2 3 This evidence...
110
Toronto Hydro-Electric System Limited EB-2014-0116 Exhibit 9 Tab 1 Schedule 1 ORIGINAL Page 1 of 30 DEFERRAL AND VARIANCE ACCOUNTS 1 2 This evidence provides a summary of Toronto Hydro’s deferral and variance (“DVA”) 3 accounts. The account balances, when approved for clearance, are recovered through 4 separate rate riders and not included in the revenue requirement. 5 6 Toronto Hydro’s use of these accounts, and amounts recorded in them, is in accordance 7 with the methodologies and requirements provided by the OEB as set out in the 8 Accounting Procedures Handbook (“APH”), and as set out in directions issued by the 9 OEB from time to time. 10 11 1. SUMMARY OF DVA ACCOUNT BALANCES 12 A detailed continuity of account balances in the format provided by the OEB, including 13 carrying costs, is shown in Exhibit 9, Tab 2, Schedule 1. The December 31, 2013 14 principal balances and carrying charges are summarized in Table 1 below. 15
-
Upload
trinhnguyet -
Category
Documents
-
view
223 -
download
1
Transcript of DEFERRAL AND VARIANCE ACCOUNTS - Toronto … DEFERRAL AND VARIANCE ACCOUNTS 2 3 This evidence...
Toronto Hydro-Electric System Limited EB-2014-0116
Exhibit 9 Tab 1
Schedule 1 ORIGINAL Page 1 of 30
DEFERRAL AND VARIANCE ACCOUNTS 1
2
This evidence provides a summary of Toronto Hydro’s deferral and variance (“DVA”) 3
accounts. The account balances, when approved for clearance, are recovered through 4
separate rate riders and not included in the revenue requirement. 5
6
Toronto Hydro’s use of these accounts, and amounts recorded in them, is in accordance 7
with the methodologies and requirements provided by the OEB as set out in the 8
Accounting Procedures Handbook (“APH”), and as set out in directions issued by the 9
OEB from time to time. 10
11
1. SUMMARY OF DVA ACCOUNT BALANCES 12
A detailed continuity of account balances in the format provided by the OEB, including 13
carrying costs, is shown in Exhibit 9, Tab 2, Schedule 1. The December 31, 2013 14
principal balances and carrying charges are summarized in Table 1 below. 15
Toronto Hydro-Electric System Limited EB-2014-0116
Exhibit 9 Tab 1
Schedule 1 ORIGINAL Page 2 of 30
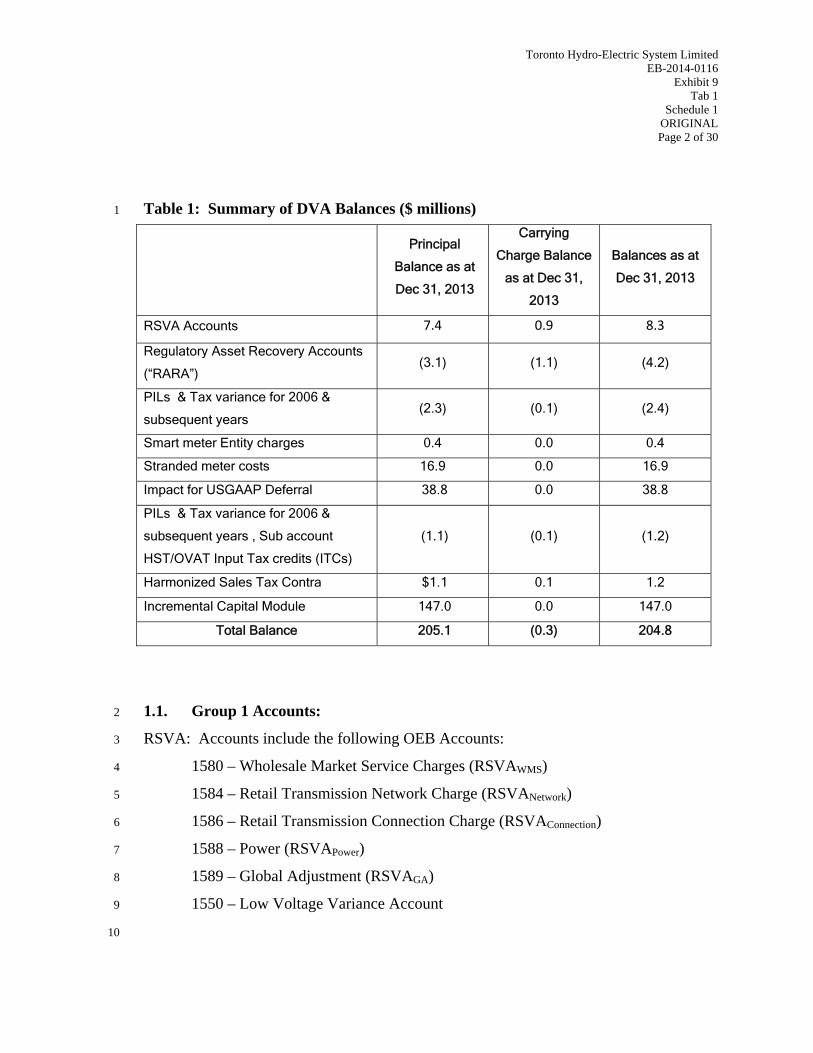
Table 1: Summary of DVA Balances ($ millions) 1
1.1. Group 1 Accounts: 2
RSVA: Accounts include the following OEB Accounts: 3
1580 – Wholesale Market Service Charges (RSVAWMS) 4
1584 – Retail Transmission Network Charge (RSVANetwork) 5
1586 – Retail Transmission Connection Charge (RSVAConnection) 6
1588 – Power (RSVAPower) 7
1589 – Global Adjustment (RSVAGA) 8
1550 – Low Voltage Variance Account 9
10
Principal
Balance as at
Dec 31, 2013
Carrying
Charge Balance
as at Dec 31,
2013
Balances as at
Dec 31, 2013
RSVA Accounts 7.4 0.9 8.3
Regulatory Asset Recovery Accounts
(“RARA”) (3.1) (1.1) (4.2)
PILs & Tax variance for 2006 &
subsequent years (2.3) (0.1) (2.4)
Smart meter Entity charges 0.4 0.0 0.4
Stranded meter costs 16.9 0.0 16.9
Impact for USGAAP Deferral 38.8 0.0 38.8
PILs & Tax variance for 2006 &
subsequent years , Sub account
HST/OVAT Input Tax credits (ITCs)
(1.1) (0.1) (1.2)
Harmonized Sales Tax Contra $1.1 0.1 1.2
Incremental Capital Module 147.0 0.0 147.0
Total Balance 205.1 (0.3) 204.8
Toronto Hydro-Electric System Limited EB-2014-0116
Exhibit 9 Tab 1
Schedule 1 ORIGINAL Page 3 of 30
RARA: Regulatory asset recovery accounts: 1
1595: RARA accounts contain residual amounts related to clearance of deferral 2
and variances accounts previously approved by the OEB for recovery through rate 3
riders. 4
5
1.2. Group 2 Accounts: 6
Other Regulatory Asset accounts for Toronto Hydro include: 7
• 1592 – PILS and Tax Variances 8
• 1592 – sub account – Harmonized Sales Tax Variances 9
• 1555 – sub account – Stranded meters 10
• 1551 – Smart meter entity charges 11
• 1575 – IFRS USGAAP Transitional PP&E Amounts 12
• 1568 – LRAM Variance account (“LRAMVA”) 13
• 1508 – sub account Gain on sale of Properties on named properties 14
• 1508 – sub account –Impact for USGAAP Deferral 15
16
With respect to Global Adjustment charges, Toronto Hydro confirms that IESO GA 17
charges are prorated into RPP and non-RPP amounts. Values in RSVA account 1589 18
reflect the non-RPP portions only. 19
20
The OEB’s July 17, 2013 Filing Requirements for Electricity Distribution Rate 21
Applications requires a breakdown of energy sales and cost of power expenses, as 22
reported in the Audited Financial Statements by distributors, mapped to a USofA account 23
number. This information can be found in Exhibit 9, Tab 2, Schedule 2. 24
Toronto Hydro-Electric System Limited EB-2014-0116
Exhibit 9 Tab 1
Schedule 1 ORIGINAL Page 4 of 30
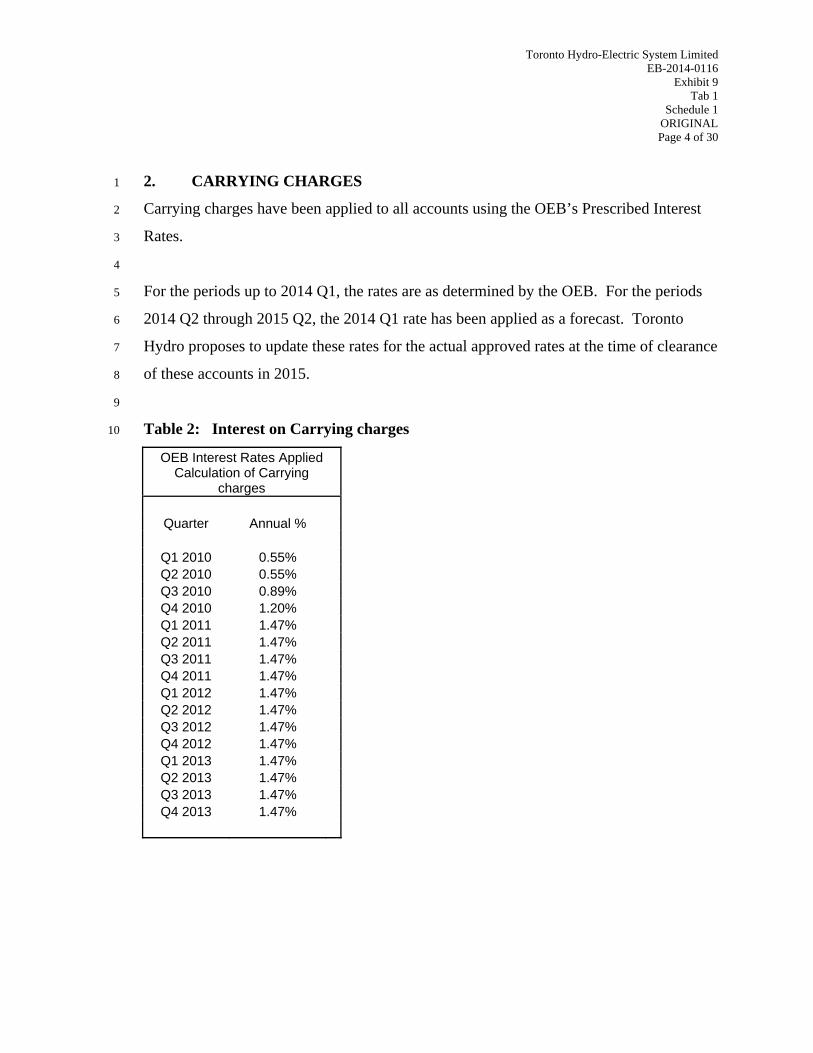
2. CARRYING CHARGES 1
Carrying charges have been applied to all accounts using the OEB’s Prescribed Interest 2
Rates. 3
4
For the periods up to 2014 Q1, the rates are as determined by the OEB. For the periods 5
2014 Q2 through 2015 Q2, the 2014 Q1 rate has been applied as a forecast. Toronto 6
Hydro proposes to update these rates for the actual approved rates at the time of clearance 7
of these accounts in 2015. 8
9
Table 2: Interest on Carrying charges 10
OEB Interest Rates Applied Calculation of Carrying
charges
Quarter Annual %
Q1 2010 0.55% Q2 2010 0.55% Q3 2010 0.89% Q4 2010 1.20% Q1 2011 1.47% Q2 2011 1.47% Q3 2011 1.47% Q4 2011 1.47% Q1 2012 1.47% Q2 2012 1.47% Q3 2012 1.47% Q4 2012 1.47% Q1 2013 1.47% Q2 2013 1.47% Q3 2013 1.47% Q4 2013 1.47%

Toronto Hydro-Electric System Limited EB-2014-0116
Exhibit 9 Tab 1
Schedule 1 ORIGINAL Page 5 of 30
3. OEB AUDIT 1
In March 2014, the OEB completed an audit of Toronto Hydro’s Group 1 and Group 2 2
Deferral and Variance accounts. The audit resulted in findings on seven items. The full 3
audit report is attached as Appendix A. Of the seven findings, five have been addressed 4
by the utility and accounts corrected. The two remaining issues are addressed below. 5
6
The first remaining issue is related to the finding that the utility has not recorded amounts 7
in RCVA accounts 1518 and 1548. Later in this exhibit the utility presents information 8
on why amounts have not been recorded, and requests relief from the OEB going forward 9
to not record amounts to these accounts. 10
11
The second remaining issue is related to the finding that Toronto Hydro has not recorded 12
amounts in 1588 RSVA Power account. As noted in Exhibit 8, Tab 1, Schedule 1, 13
Toronto Hydro agreed in its settlement for EB-2012-0064 Phase Two to provide in this 14
filing an evaluation of options to measure or estimate actual line losses and the impacts 15
on Account 1588 balances in accordance with the Accounting Procedures Handbook. 16
Toronto Hydro is progressing on this evaluation, and will file the information as an 17
update to this application. 18
19
20
4. PLANNED DISPOSITION OF REGULATORY ASSETS 21
On July 31, 2009 the OEB issued its Report of the Board on Electricity Distributors 22
Deferral and Variance Account Review Initiative (“EDDVAR”) (EB-2008-0046). The 23
OEB indicated that, “at the time of rebasing, all accounts should be reviewed and 24
disposed of unless otherwise justified by the distributor or as required by a specific OEB 25
decision or guideline” (page 2 of the Executive Summary). 26
27
Toronto Hydro-Electric System Limited EB-2014-0116
Exhibit 9 Tab 1
Schedule 1 ORIGINAL Page 6 of 30
In the OEB’s Filing Requirements for Electricity Distribution Rate Applications released 1
July 17, 2013, the OEB outlined the requirements for filing of information on Deferral 2
and Variance accounts. The following information meets those requirements. 3
4
Toronto Hydro proposes to clear the accounts below beginning May 1, 2015. Toronto 5
Hydro also proposes the method by which these accounts be cleared. The balances 6
reflect audited financial statements for the fiscal year ended December 31, 2013. The 7
amounts include the forecasted carrying costs calculated to April 30, 2015. Continuity 8
schedules for all accounts proposed for disposition are provided in Exhibit 9, Tab 2, 9
Schedule 1. 10
11
12
5. TORONTO HYDRO IS REQUESTING DISPOSITION OF THE 13
FOLLOWING REGULATORY ASSET ACCOUNTS. 14
15
5.1. All RSVA Accounts 16
The net total amount of all RSVA accounts is $8.4 million debit (collection) from 17
customers. The accounts included are Account 1550 – Low Voltage Variance Account, 18
Account 1580 – Wholesale Market Services, Account 1584 – Network, Account 1586 – 19
Connection, and Account 1588 – Power & 1589 Global Adjustment. As noted above, 20
Toronto Hydro will be filing evidence related to line losses and loss factors. If, as a result 21
of that evidence, the balances in these variance accounts are affected, Toronto Hydro will 22
update the balances and amounts proposed for clearance. 23
24
5.2. Account 1595: RARA (Regulatory asset recovery account) 25
The amount proposed for clearing is a $1.8 million credit (payment) to customers. The 26
account balances include all the residual balances pertaining to 2008 to 2011 OEB 27
approved rate riders. 28
Toronto Hydro-Electric System Limited EB-2014-0116
Exhibit 9 Tab 1
Schedule 1 ORIGINAL Page 7 of 30
1
5.3. Account 1592 – PILS and Tax variances for 2006 and subsequent years 2
The amount proposed for clearance in this account is a $2.5 million credit (payment) to 3
customers. The amounts in this account reflect the differences that have resulted from a 4
legislative or regulatory change to the tax rates or rules assumed in the rate adjustment 5
model. 6
7
5.4. Account 1592 – PILs and Tax Variances, Sub-account HST/OVAT Input Tax 8
Credits (“ITCs”) 9
The amount proposed for clearance in this account is a $1.2 million credit (payment) to 10
customers. 11
12
In the approved Settlement Agreement for EB-2009-0139, Toronto Hydro and parties 13
agreed on the following related to the establishment of an HST deferral account. 14
“In addition, as a result of the pending changes to Provincial Sales Tax 15
regulations and the introduction of the Harmonized Sales Tax (HST) as of July 1, 16
2010, THESL agrees to record in a deferral account the difference between any 17
PST on forecast capital expenditures and expenses to be incurred, and any HST 18
(8% Ontario share) on similar capital and expense actual amounts for which it 19
will be eligible for an HST Input Tax Credit (“ITC”). 20
21
Beginning July 1, 2010 and until THESL’s next cost-of-service rebasing 22
application, THESL will track in a deferral account the incremental Input Tax 23
Credit it receives on non-pass-through items (the “subject items”) that were 24
previously subject to PST and become subject to HST. The intention of this 25
account is to track the incremental change due to the shift from Provincial Sales 26
Tax to the Harmonized Sales Tax and the amounts THESL receives through the 27
incremental Input Tax Credit. Tracking of these amounts will continue in the 28
Toronto Hydro-Electric System Limited EB-2014-0116
Exhibit 9 Tab 1
Schedule 1 ORIGINAL Page 8 of 30
deferral account until THESL’s next cost of service application is determined by 1
the Board or until the Board provides guidance on this matter, whichever occurs 2
first. For example, Cost of Power and all other upstream charges applied to 3
THESL by the IESO and/or Hydro One are excluded from this calculation. 4
5
To qualify for this treatment the cost of the subject items must be in the category 6
of distribution revenue requirement. THESL will apply to clear the balance in the 7
variance account as a credit to customers at the next opportunity for a rate 8
change after the account balance information becomes available and is supported 9
by audited financial statements. 10
11
In practice, this treatment affects a refund to the ratepayer of the incremental 12
ITC. THESL will file to dispose of the balance in this account at a future date. 13
14
The parties understand that as of the date of the filing of this settlement 15
agreement, the Board has not established a deferral account to address the 16
introduction of the HST for any rate regulated distributor. Parties recognize that 17
if the Board establishes an HST account on a generic basis, the Board will likely 18
provide specific directions on the accounting guidelines to be followed with 19
regard to the HST account (“HST guidelines”). If the Board does so, the parties 20
understand that the Board’s HST guidelines will supersede the methodology noted 21
above.” 22
23
The OEB ordered in its decision that these amounts be recorded in Account 1592 PILs 24
and Tax Variances, Sub-account HST/OVAT ITCs. 25
26
In the OEB’s December 2010 Accounting Procedures Handbook Frequently Asked 27
Questions, questions 1-5 related to the accounting for the HST variance account. 28
Toronto Hydro-Electric System Limited EB-2014-0116
Exhibit 9 Tab 1
Schedule 1 ORIGINAL Page 9 of 30
Question 4 specifically indicated a methodology LDCs could use to estimate the amounts 1
for this account, if the tracking of the incremental ITCs on an individual transaction basis 2
was not practical. This is the approach Toronto Hydro has taken in determining the 3
amounts recorded in the variance account. 4
5
Toronto Hydro used the 2009 actual PST paid as the basis for the calculation. Actual 6
PST paid on aggregate operating and capital expenditure categories was used to 7
determine the PST applicable proportion of these expenses. These proportions were then 8
applied to actual expenditures for the July 1, 2010 to December 31, 2010 period to 9
determine the amounts that would have been eligible for PST in the last half of 2010. 10
The PST rate of 8% was then applied to these PST eligible amounts to estimate the 11
incremental ITCs. The following table shows the details of these calculations. 12

Toronto Hydro-Electric System Limited EB-2014-0116
Exhibit 9 Tab 1
Schedule 1 ORIGINAL
Page 10 of 30
Table 3: HST Deferral Account ($000s) 1
A B = A / 8% C D = B/C E F = E * D G = F *
8%/108%
2009 PST Paid
2009 PST Eligible
Expenses
2009 Total
Expenses
PST Eligible
proportion of
Expenses
July 1, 2010 to Dec 31,
2010 Actual
Expenses
Jul to Dec 2010
Estimated Eligible
Expenses
Jul to Dec 2010
Estimated ITCs
Operating Expenses
Inventory and Direct Purchases
1,123 14,035 10,076 139.3%** 4,216 4,216 312
External Contract Services
640 8,003 79,517 10.1% 36,185 3,655 271
Office Supplies and Postage
58 726 4,303 16.9% 1,924 325 24
Rentals and Leases
50 621 3,926 15.8% 2,109 333 25
Utilities and Communications
74 930 4,794 19.4% 1,734 336 25
Subtotal 657
Capital Expenditures
Inventory and Direct Purchases
5,949 74,364 92,953 80.0%** 75,196 75,196 5,570
External Contract Services
604 7,553 95,904 7.9% 114,565 9,051 670
Office Supplies and Postage
1 11 15 74.9% *** *** ***
Utilities and Communications
2 20 22 88.9% *** *** ***
Subtotal 6,240
Grand Total 6,897
** Note: These values were set at 100% for calculation of 2010 ITC estimate*** These amounts were not readily available, and would result in an immaterial amount of the ITC estimate

Toronto Hydro-Electric System Limited EB-2014-0116
Exhibit 9 Tab 1
Schedule 1 ORIGINAL
Page 11 of 30
During the 2010 rate year, the PST amounts for Operating Expenses would have been a 1
pass-through in rates. However, the PST amounts on Capital Expenses would have been 2
included in the Capital additions, and amortized over the life of the assets. The amount 3
recorded to the variance account is therefore calculated as the Revenue Requirement 4
consequences of the ITC calculations. The following table shows the Revenue 5
Requirement associated with the ITCs. 6
7
Table 4: Revenue Requirement Associated with ITCs 8 Amount ($M) Assumptions/Calculations
Gross Fixed Assets 3.1 50% of Capital Expenditures
ITC (half year assumption)
Accumulated
Depreciation
(0.1)
Net Fixed Assets 3.1
Working Capital
Allowance
14.12% As approved
Rate Base 3.2 Net Fixed Assets plus WCA
Return on Rate Base 0.2 7.04% times Rate Base
Operating Expenses 0.7 Operating Expenditure ITC
Depreciation Expense 0.1 Assume 25 Year Amortization
PILS 0.1 31% Effective Tax Rate
Revenue Requirement 1.1
Based on the methodology described above, Toronto Hydro proposes to clear the 9
principal amount of $1.1M plus carrying charges of $0.1M to customers. 10
Toronto Hydro-Electric System Limited EB-2014-0116
Exhibit 9 Tab 1
Schedule 1 ORIGINAL
Page 12 of 30
5.5. Account 1508 – Named Properties 1
Toronto Hydro is proposing to clear a $5.8 million debit (collection) in the current CIR 2
application. 3
4
In the OEB’s EB-2009-0139 Decision, the OEB ordered that Toronto Hydro incorporate 5
$10.3 million (plus interest) as revenue offset to 2010 revenue requirement. This amount 6
reflected a forecast of capital gains related to properties planned to be sold by Toronto 7
Hydro at the time of its EB-2007-0680 hearing. The OEB’s decision in EB-2009-0139 8
was the conclusion of an appeal process by Toronto Hydro arising from the earlier 9
decision. Accordingly, a revenue offset of $10.6 million ($10.3 million gains plus $0.3 10
million interest) was incorporated into 2010 rates. 11
12
The $10.3 million amount ordered by the OEB was composed of the forecast capital 13
gains of three named properties: 228 Wilson Avenue, 175 Goddard Street and 28 14
Underwriters Road. The related paragraph from the decision is below: 15
16
“To defray these substantial costs to the ratepayer, the Board finds that 100% of 17
the net after tax gains from the sale of 228 Wilson Avenue, 175 Goddard Street, 18
and 28 Underwriters Road, the properties that are planned to be sold in 2008, 19
should go to the ratepayer. The Company’s revenue requirement for the 2008 test 20
year shall be adjusted downward by $10.3 Million to reflect this finding. As the 21
sale of 60 Eglinton West is planned for 2010, it does not impact the rates being 22
set in this proceeding." (see EB-2007-0680 Decision with Reasons, page 27) 23
24
The OEB also ordered that a variance account be set up to record the difference between 25
the gains reflected in rates (the $10.3 million) and the actual gains achieved from the sale 26
of these properties in 2008 or beyond. In addition, the OEB further ordered that the 27
actual capital gains associated with an additional four properties – Bathurst, Birmingham, 28
Toronto Hydro-Electric System Limited EB-2014-0116
Exhibit 9 Tab 1
Schedule 1 ORIGINAL
Page 13 of 30
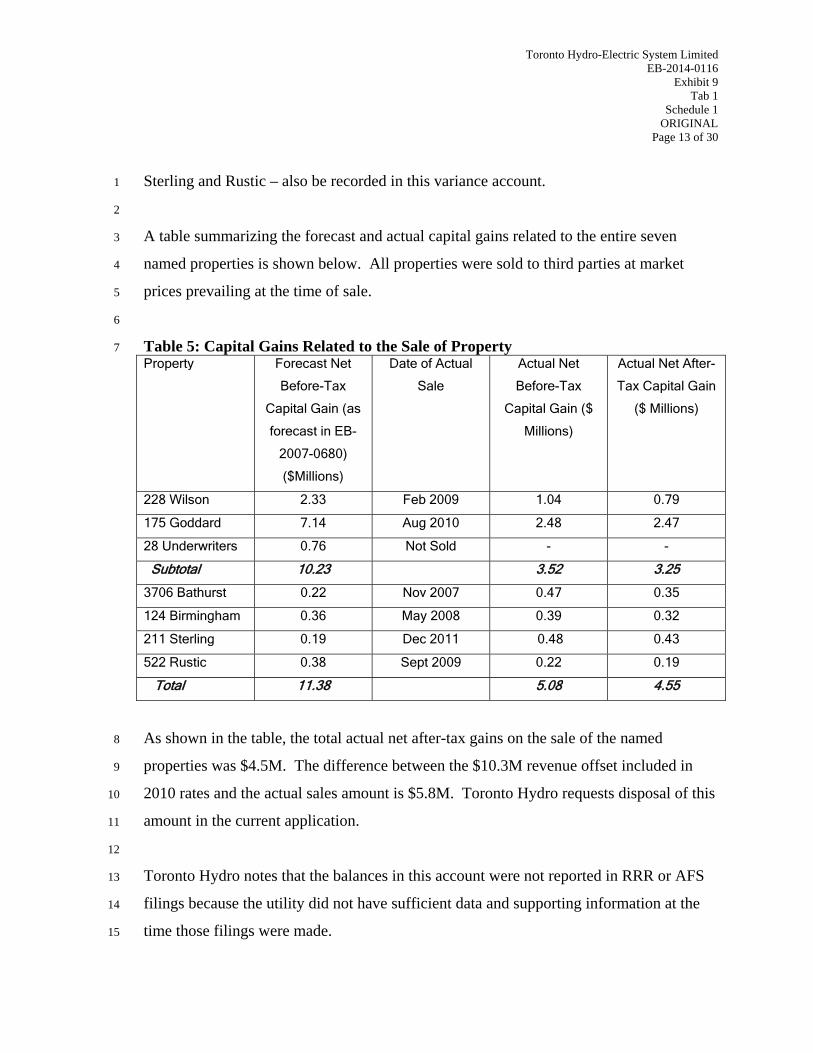
Sterling and Rustic – also be recorded in this variance account. 1
2
A table summarizing the forecast and actual capital gains related to the entire seven 3
named properties is shown below. All properties were sold to third parties at market 4
prices prevailing at the time of sale. 5
6
Table 5: Capital Gains Related to the Sale of Property 7 Property Forecast Net
Before-Tax
Capital Gain (as
forecast in EB-
2007-0680)
($Millions)
Date of Actual
Sale
Actual Net
Before-Tax
Capital Gain ($
Millions)
Actual Net After-
Tax Capital Gain
($ Millions)
228 Wilson 2.33 Feb 2009 1.04 0.79
175 Goddard 7.14 Aug 2010 2.48 2.47
28 Underwriters 0.76 Not Sold - -
Subtotal 10.23 3.52 3.25
3706 Bathurst 0.22 Nov 2007 0.47 0.35
124 Birmingham 0.36 May 2008 0.39 0.32
211 Sterling 0.19 Dec 2011 0.48 0.43
522 Rustic 0.38 Sept 2009 0.22 0.19
Total 11.38 5.08 4.55
As shown in the table, the total actual net after-tax gains on the sale of the named 8
properties was $4.5M. The difference between the $10.3M revenue offset included in 9
2010 rates and the actual sales amount is $5.8M. Toronto Hydro requests disposal of this 10
amount in the current application. 11
12
Toronto Hydro notes that the balances in this account were not reported in RRR or AFS 13
filings because the utility did not have sufficient data and supporting information at the 14
time those filings were made. 15
Toronto Hydro-Electric System Limited EB-2014-0116
Exhibit 9 Tab 1
Schedule 1 Filed: 2014 Jul 31
Corrected: 2014 Sep 23 Page 14 of 30
1
5.6. Account 1568- LRAM Variance Account (LRAMVA) 2
A balance of $3.6 million debit (collection) is proposed to be cleared related to 3
LRAMVA amounts over the 2011-2013 period. Further details of these amounts are 4
found in Exhibit 9, Tab 2, Schedule 5. 5
6
Toronto Hydro notes that the balances in this account were not reported in RRR or AFS 7
filings because the utility did not have sufficient data and supporting information at the 8
time those filings were made. 9
10
5.7. Accounts 1555– Stranded Meters 11
Pursuant to the OEB filing requirements the net book value of stranded conventional 12
meters, which was previously included in Toronto Hydro’s rate base, is now recorded as 13
a regulatory asset to be disposed of in the current application. A balance of $16.9M as of 14
December 2013 has been calculated as the NBV of stranded conventional meters. The 15
total amount for disposition is $15.79 million, which is the 2013 year end balance of 16
$16.9 M, less $1.1M of depreciation calculated from January 1, 2014 until December 17
2014. Further details of the smart meter-related amounts are found in Exhibit 2A, Tab 4. 18
19
5.8. Account 1575 – IFRS-USGAAP Transitional PP&E Amounts 20
On July 21, 2011, the Ontario Securities Commission (“OSC”) granted an exemption to 21
allow Toronto Hydro to prepare its financial statements in accordance with USGAAP for 22
fiscal years beginning January 1, 2012 but before January 1, 2015. 23
24
On March 19, 2014, the Board of Directors of Toronto Hydro Corporation (“THC”) 25
approved the adoption of IFRS for the year beginning on January 1, 2015 due to the 26
pending expiration of the above exemption. Accordingly, THC’s consolidated financial 27
statements for 2015 and onwards will be prepared in accordance with IFRS and applied 28
/C

Toronto Hydro-Electric System Limited EB-2014-0116
Exhibit 9 Tab 1
Schedule 1 ORIGINAL
Page 15 of 30
retrospectively to THC’s opening IFRS consolidated statement of financial position as at 1
January 1, 2014. 2
3
THC will be adopting IFRS 1 First-time Adoption of International Financial Reporting 4
Standards which sets forth the transitional requirements for first-time adoption of IFRS. 5
6
For financial reporting purposes, THC is required to present one year of comparative 7
information under IFRS in its first set of IFRS financial statements. The first day of the 8
comparative year is referred to as the “transition date” and the first day of the year in 9
which THC has chosen to adopt IFRS for financial reporting purposes is referred to as the 10
“changeover date”. 11
12
For Toronto Hydro, the transition date is January 1, 2014, and the changeover date is 13
January 1, 2015. 14
15
Under Article 510 Transitional Issues Relating to the Adoption of IFRS, the APH directs 16
LDCs to use mIFRS as of the changeover date and is required to compare the balances as 17
determined under previous GAAP on December 31, 2014 to the corresponding balances 18
at December 31, 2014 determined in accordance with mIFRS. Where there are 19
differences in the carrying amounts, the distributor must record journal entries such that 20
the resulting account balances are in compliance with mIFRS. 21
22
Adjustments required at the transition date are generally recognized directly in opening 23
retained earnings. However, in respect to PP&E, Article 510 directs LDCs to: 24
“…. use deferral Account 1575, IFRS-CGAAP Transitional PP&E 25
Amounts, to record differences arising as a result of accounting policy 26
changes caused by the transition from previous Canadian GAAP to 27
mIFRS.” 28

Toronto Hydro-Electric System Limited EB-2014-0116
Exhibit 9 Tab 1
Schedule 1 Filed: 2014 Jul 31
Corrected: 2014 Sep 23 Page 16 of 30
1
In Toronto Hydro’s case, account 1575 has been used to record the transitional 2
differences as a result of the transition from USGAAP to IFRS. 3
4
As a result of the adoption of IFRS 1 and in compliance to APH 510, Toronto Hydro has 5
identified and recorded in account 1575 the following transitional differences impacting 6
PP&E: 7
• Derecognition - $25.7 million 8
• AFUDC/Borrowing Costs – ($0.8) million 9
• ARO – $0.9 million 10
• Other depreciation expense and transfer differences - $0.02 million. 11
12
Toronto Hydro is proposing to clear $30.5 million relating to IFRS-USGAAP transitional 13
balances. 14
15
Details are shown in Exhibit 9, Tab 2, Schedule 4 (OEB Appendix 2-EC Account 1575 - 16
IFRS-GAAP Transitional PP&E Amounts). 17
18
5.9. Account 1508 - Hydro One Capital Contributions 19
This account, proposed and approved in Toronto Hydro’s 2010 decision (EB-2009-0139) 20
captures the difference between amounts included in rates for Hydro One capital 21
contributions and actual contributions. Toronto Hydro proposed this account, which was 22
approved, on the basis that capital contributions for Hydro One projects can be 23
substantial but are subject to uncertainty related to timing and magnitude. 24
25
Table 6 below shows the Hydro One capital contribution amounts which were included in 26
rates for each of 2010 and 2011, compared with the actual capital contributions made for 27
those periods. 28
/C

Toronto Hydro-Electric System Limited EB-2014-0116
Exhibit 9 Tab 1
Schedule 1 ORIGINAL
Page 17 of 30
1
Table 6: Hydro One Capital Contributions included in Rates vs. Actual 2 2010 Rate Year
($ millions)
2011 Rate Year
($ millions)
Hydro One Capital Contributions included in
Approved Rate Base
1.4 1.4
Actual Hydro One Capital Contributions 0.0 10.0
Variance -1.4 8.6
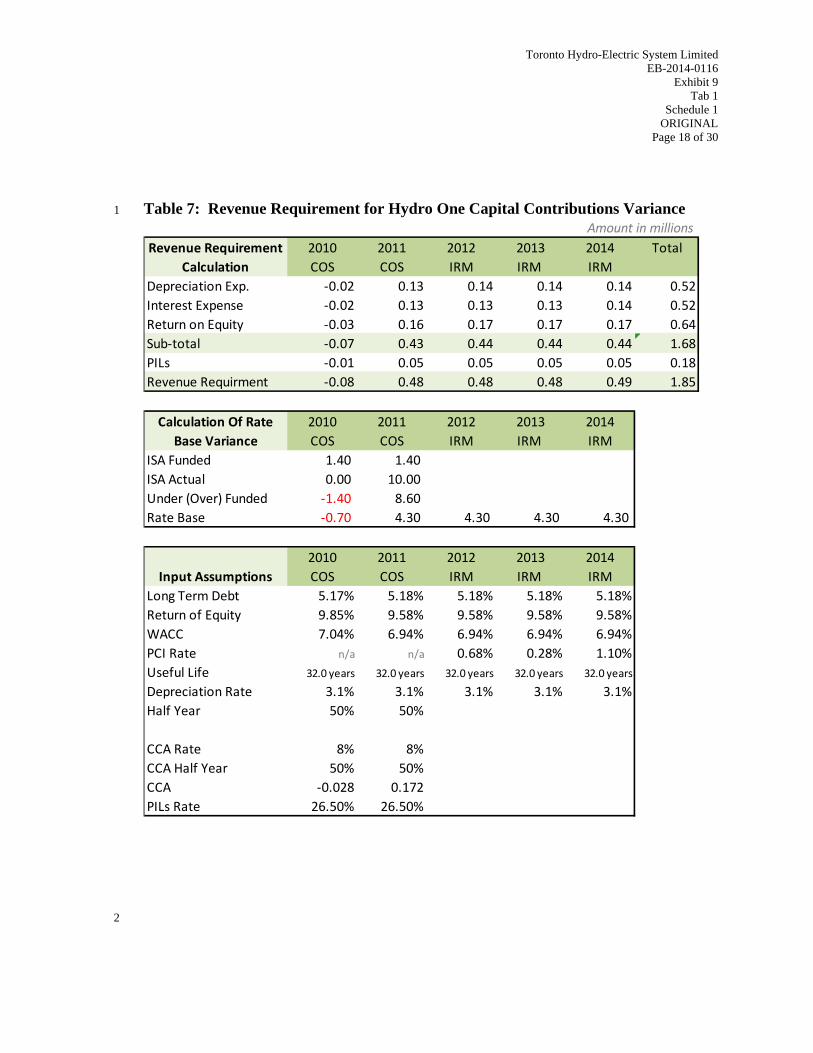
The revenue requirement associated with this variance is the basis for the amounts 3
requested to be cleared. The following table summarizes the calculation. Since the 2011 4
approved rate base amount of $1.4M carried through the IRM period, the revenue 5
requirement has been calculated for this period. The proposed amount to be cleared is a 6
$1.9M debit (collection from) customers. 7
8
Toronto Hydro notes that the balances in this account were not reported in RRR or AFS 9
filings because the utility did not have sufficient data and supporting information at the 10
time those filings were made. 11
Toronto Hydro-Electric System Limited EB-2014-0116
Exhibit 9 Tab 1
Schedule 1 ORIGINAL
Page 18 of 30
Table 7: Revenue Requirement for Hydro One Capital Contributions Variance 1 Amount in millions
2010 2011 2012 2013 2014 TotalCOS COS IRM IRM IRM
Depreciation Exp. ‐0.02 0.13 0.14 0.14 0.14 0.52Interest Expense ‐0.02 0.13 0.13 0.13 0.14 0.52Return on Equity ‐0.03 0.16 0.17 0.17 0.17 0.64Sub‐total ‐0.07 0.43 0.44 0.44 0.44 1.68PILs ‐0.01 0.05 0.05 0.05 0.05 0.18Revenue Requirment ‐0.08 0.48 0.48 0.48 0.49 1.85
2010 2011 2012 2013 2014COS COS IRM IRM IRM
ISA Funded 1.40 1.40ISA Actual 0.00 10.00Under (Over) Funded ‐1.40 8.60Rate Base ‐0.70 4.30 4.30 4.30 4.30
2010 2011 2012 2013 2014COS COS IRM IRM IRM
Long Term Debt 5.17% 5.18% 5.18% 5.18% 5.18%Return of Equity 9.85% 9.58% 9.58% 9.58% 9.58%WACC 7.04% 6.94% 6.94% 6.94% 6.94%PCI Rate n/a n/a 0.68% 0.28% 1.10%Useful Life 32.0 years 32.0 years 32.0 years 32.0 years 32.0 years
Depreciation Rate 3.1% 3.1% 3.1% 3.1% 3.1%Half Year 50% 50%
CCA Rate 8% 8%CCA Half Year 50% 50%CCA ‐0.028 0.172PILs Rate 26.50% 26.50%
Calculation Of Rate Base Variance
Revenue Requirement Calculation
Input Assumptions
2
Toronto Hydro-Electric System Limited EB-2014-0116
Exhibit 9 Tab 1
Schedule 1 ORIGINAL
Page 19 of 30
6. TORONTO HYDRO IS NOT SEEKING CLEARANCE IN THIS 1
APPLICATION OF BALANCES IN THE FOLLOWING ACCOUNTS: 2
3
6.1. Accounts 1518 And 1548 - Retail Cost Variance Accounts (“RCVA”) 4
In the OEB’s Regulatory Assets Phase Two hearings (RP-2004-0117, 0118, 0100, 0069, 5
and 0064), Toronto Hydro presented evidence that the variance between the costs of 6
serving the retail market and the revenues received through the approved charges to 7
retailers did not meet the materiality threshold. In its decision, the OEB stated the 8
following: “… given the relative insignificance of the balances in the RCVA accounts as 9
revealed in this proceeding, the Board will not require recording and filing of this 10
information if a distributor has not already done so.” 11
12
Toronto Hydro interpreted the OEB’s decision, together with the evidence that the 13
variances in these accounts were immaterial, to indicate that tracking of these amounts 14
was no longer necessary. 15
16
Since the time of the Regulatory Assets Phase II decision, Toronto Hydro has included in 17
its determination of revenue requirement in Toronto Hydro’s Cost of Service rate filings 18
both the costs of providing retail services (through the various relevant cost categories) 19
and the revenues received (through revenue offsets), but has not recorded amounts in 20
Accounts 1518 or 1548. 21
22
For the current filing, Toronto Hydro estimated its most recent costs and revenue 23
associated with the retail market. The following table provides details of these costs and 24
revenues for 2011-13. 25
Toronto Hydro-Electric System Limited EB-2014-0116
Exhibit 9 Tab 1
Schedule 1 ORIGINAL
Page 20 of 30
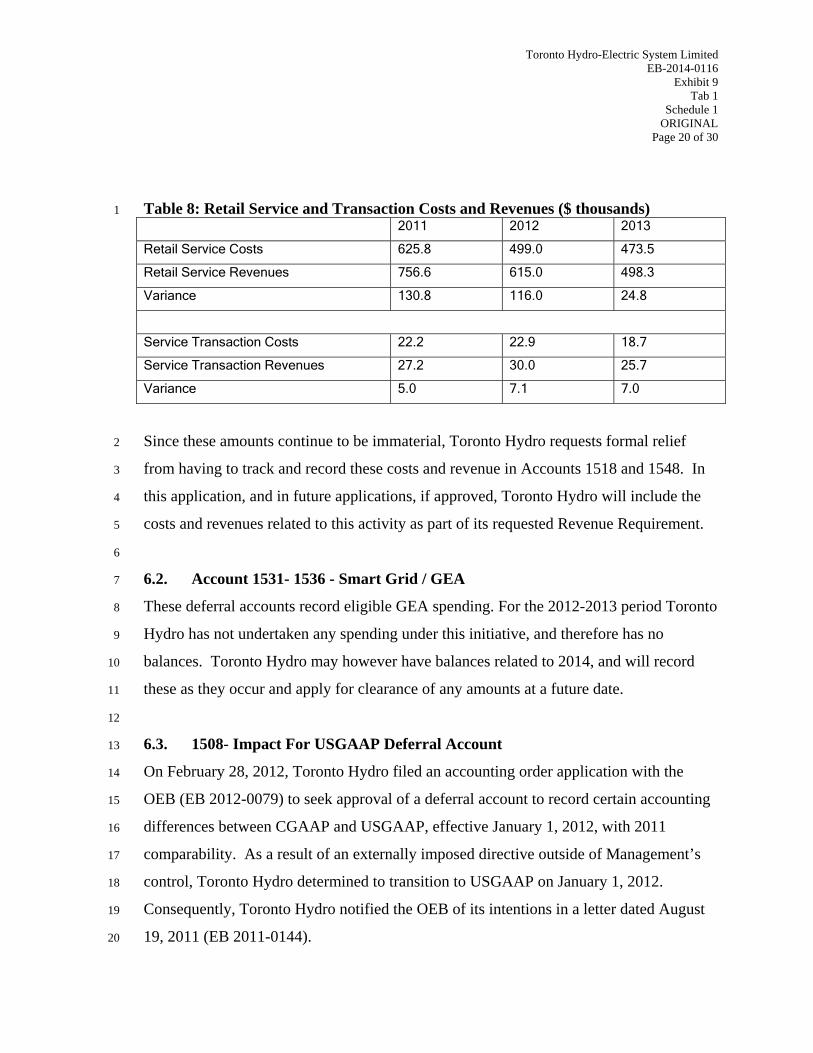
Table 8: Retail Service and Transaction Costs and Revenues ($ thousands) 1 2011 2012 2013
Retail Service Costs 625.8 499.0 473.5
Retail Service Revenues 756.6 615.0 498.3
Variance 130.8 116.0 24.8
Service Transaction Costs 22.2 22.9 18.7
Service Transaction Revenues 27.2 30.0 25.7
Variance 5.0 7.1 7.0
Since these amounts continue to be immaterial, Toronto Hydro requests formal relief 2
from having to track and record these costs and revenue in Accounts 1518 and 1548. In 3
this application, and in future applications, if approved, Toronto Hydro will include the 4
costs and revenues related to this activity as part of its requested Revenue Requirement. 5
6
6.2. Account 1531- 1536 - Smart Grid / GEA 7
These deferral accounts record eligible GEA spending. For the 2012-2013 period Toronto 8
Hydro has not undertaken any spending under this initiative, and therefore has no 9
balances. Toronto Hydro may however have balances related to 2014, and will record 10
these as they occur and apply for clearance of any amounts at a future date. 11
12
6.3. 1508- Impact For USGAAP Deferral Account 13
On February 28, 2012, Toronto Hydro filed an accounting order application with the 14
OEB (EB 2012-0079) to seek approval of a deferral account to record certain accounting 15
differences between CGAAP and USGAAP, effective January 1, 2012, with 2011 16
comparability. As a result of an externally imposed directive outside of Management’s 17
control, Toronto Hydro determined to transition to USGAAP on January 1, 2012. 18
Consequently, Toronto Hydro notified the OEB of its intentions in a letter dated August 19
19, 2011 (EB 2011-0144). 20
Toronto Hydro-Electric System Limited EB-2014-0116
Exhibit 9 Tab 1
Schedule 1 ORIGINAL
Page 21 of 30
1
The establishment of a deferral account to manage the USGAAP difference was justified 2
and consistent with the OEB’s principles governing the transition to a different regulatory 3
accounting standard. 4
5
In its accounting order application, Toronto Hydro determined that the main difference 6
between CGAAP and USGAAP pertained to post-employment benefits. At that time, the 7
difference was estimated to be approximately $30 million. 8
9
Had Toronto Hydro been denied the use of the deferral account, there would have been a 10
significant negative impact on the shareholder’s equity reported in Toronto Hydro’s 11
general purpose financial statements given that for regulatory purposes, the costs would 12
have been recognized immediately in other comprehensive income and amortized using 13
the corridor method into profit and loss as out-of-period costs over the average remaining 14
service periods of active employees. 15
16
In its Decision and Order (EB 2012-0079) issued on June 7, 2012, the OEB agreed with 17
Toronto Hydro and approved the use of account 1508 to capture the post-employment 18
benefit difference arising from its transition from CGAAP to USGAAP. As of Dec 31, 19
2013, the value in this account was $38.8 million. 20
21
Similar to the transition from CGAAP to USGAAP, there is a post-employment benefit 22
difference as a result of Toronto Hydro’s transition from USGAAP to IFRS in the Test 23
Year. Actuarial gains and losses related to post-employment benefits continue to be 24
recognized immediately to other comprehensive income; however, amortization into 25
profit or loss is not permitted under IFRS. For the end of 2014, the estimated balance in 26
this account, under IFRS accounting, is expected to be $36.0 million. 27
28

Toronto Hydro-Electric System Limited EB-2014-0116
Exhibit 9 Tab 1
Schedule 1 ORIGINAL
Page 22 of 30
Toronto Hydro is requesting the OEB’s approval to continue to use account 1508, or 1
establishment of a similar account, to capture the ongoing differences in post-2
employment benefits as a result of its transition from USGAAP to IFRS. 3
4
At this time, Toronto Hydro does not intend to seek recovery. 5
6
6.4. Account 1508 – Transit City 7
This account, which was approved by the OEB as part of the EB-2009-0139 settlement 8
agree, was set up to capture 2010 revenue requirement consequences of any spending by 9
Toronto Hydro for Transit City program. The account was set up since at the time of 10
filing, costs and timing around the City’s proposed Transit City program were relatively 11
uncertain. Based on Toronto Hydro’s records, no capital spending occurred on projects 12
related to Transit City in 2010. Therefore Toronto Hydro has no amounts to clear in this 13
application or future applications, and requests the OEB approve closing of this account. 14
15
6.5. Account 1508 : Other Regulatory Asset, Incremental Capital Expenditures, 16
Amortization and Revenues 17
In Toronto Hydro’s EB-2012-0064 decision, the OEB authorized recording of ICM 18
approved capital expenditures, and associated amortization and revenues received 19
through the ICM rate riders. Toronto Hydro has been recording amounts in these 20
accounts as directed, and will apply through a separate application for clearance of these 21
balances, at the conclusion of 2014 (the final approved ICM year). 22
23
24
7. SUMMARY OF PROPOSED DVA DISPOSITION 25
Toronto Hydro’s proposed disposition of regulatory assets is summarized in the 26
following table. 27
28
Toronto Hydro-Electric System Limited EB-2014-0116
Exhibit 9 Tab 1
Schedule 1 Filed: 2014 Jul 31
Corrected: 2014 Sep 23 Page 23 of 30
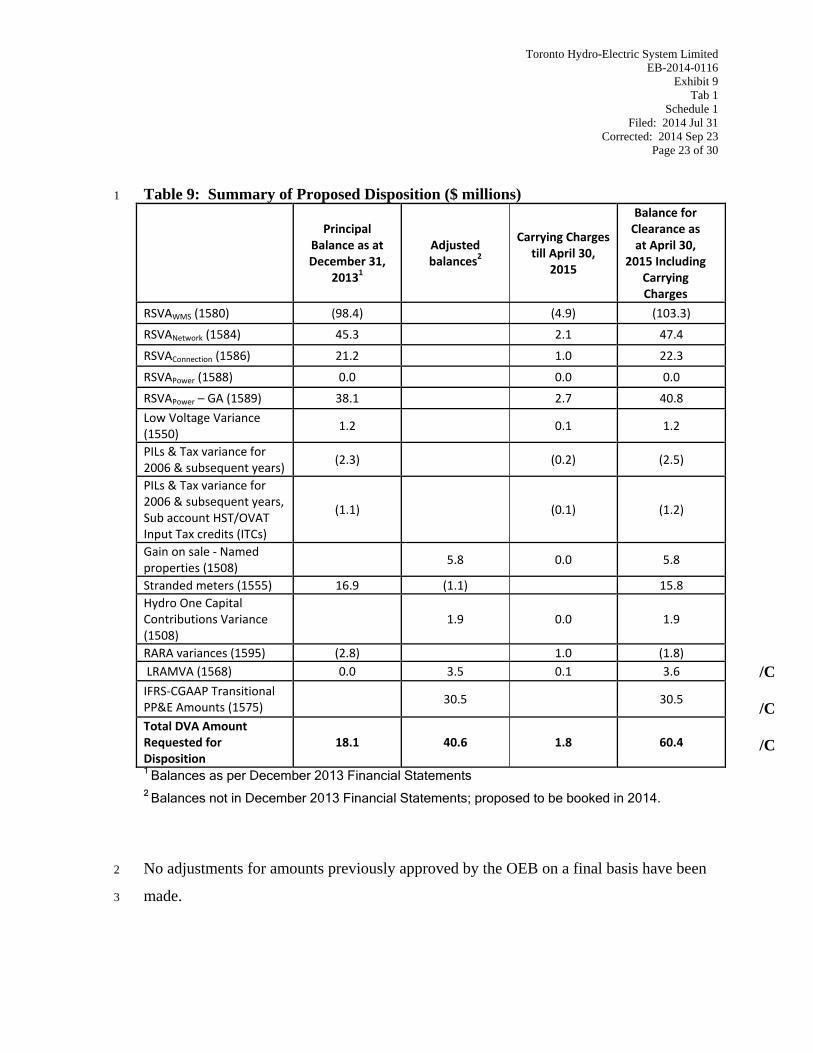
Table 9: Summary of Proposed Disposition ($ millions) 1
Principal Balance as at December 31,
20131
Adjusted balances2
Carrying Charges till April 30,
2015
Balance for Clearance as at April 30,
2015 Including Carrying Charges
RSVAWMS (1580) (98.4) (4.9) (103.3)
RSVANetwork (1584) 45.3 2.1 47.4
RSVAConnection (1586) 21.2 1.0 22.3
RSVAPower (1588) 0.0 0.0 0.0
RSVAPower – GA (1589) 38.1 2.7 40.8
Low Voltage Variance (1550)
1.2 0.1 1.2
PILs & Tax variance for 2006 & subsequent years)
(2.3) (0.2) (2.5)
PILs & Tax variance for 2006 & subsequent years, Sub account HST/OVAT Input Tax credits (ITCs)
(1.1) (0.1) (1.2)
Gain on sale ‐ Named properties (1508)
5.8 0.0 5.8
Stranded meters (1555) 16.9 (1.1) 15.8Hydro One Capital Contributions Variance (1508)
1.9 0.0 1.9
RARA variances (1595) (2.8) 1.0 (1.8) LRAMVA (1568) 0.0 3.5 0.1 3.6
IFRS‐CGAAP Transitional PP&E Amounts (1575)
30.5 30.5
Total DVA Amount Requested for Disposition
18.1 40.6 1.8 60.4
1 Balances as per December 2013 Financial Statements
2 Balances not in December 2013 Financial Statements; proposed to be booked in 2014.
No adjustments for amounts previously approved by the OEB on a final basis have been 2
made. 3
/C /C /C
Toronto Hydro-Electric System Limited EB-2014-0116
Exhibit 9 Tab 1
Schedule 1 ORIGINAL
Page 24 of 30
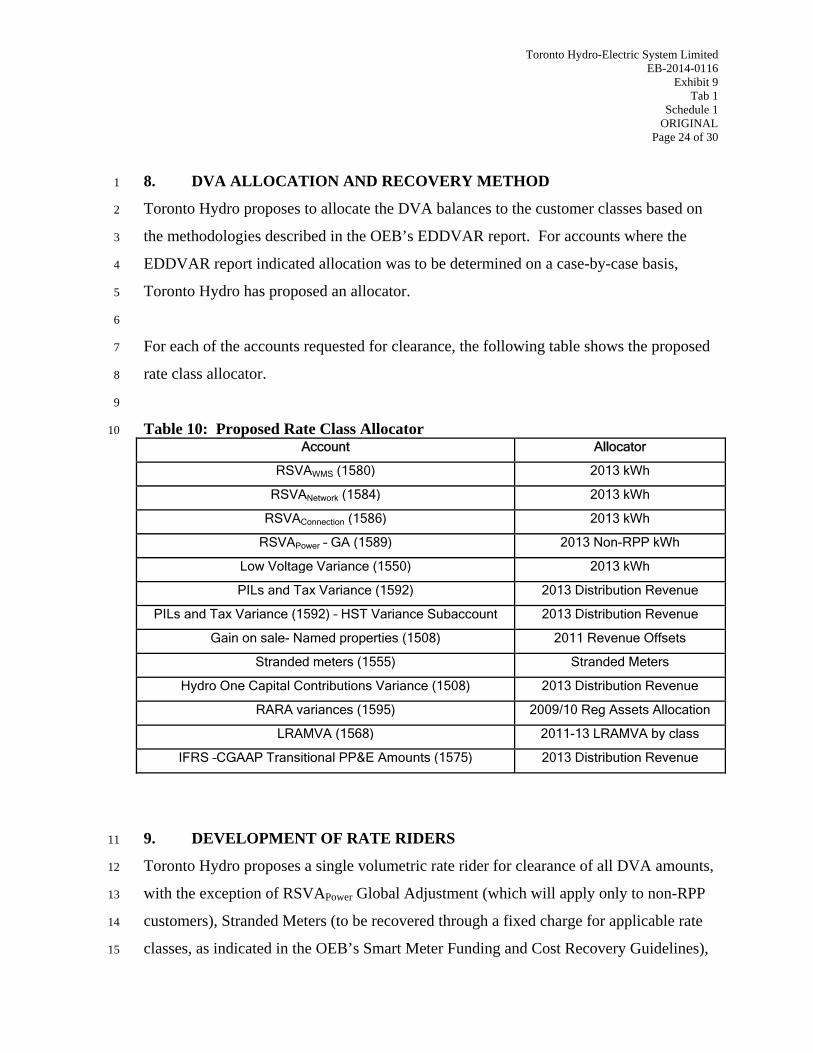
8. DVA ALLOCATION AND RECOVERY METHOD 1
Toronto Hydro proposes to allocate the DVA balances to the customer classes based on 2
the methodologies described in the OEB’s EDDVAR report. For accounts where the 3
EDDVAR report indicated allocation was to be determined on a case-by-case basis, 4
Toronto Hydro has proposed an allocator. 5
6
For each of the accounts requested for clearance, the following table shows the proposed 7
rate class allocator. 8
9
Table 10: Proposed Rate Class Allocator 10 Account Allocator
RSVAWMS (1580) 2013 kWh
RSVANetwork (1584) 2013 kWh
RSVAConnection (1586) 2013 kWh
RSVAPower – GA (1589) 2013 Non-RPP kWh
Low Voltage Variance (1550) 2013 kWh
PILs and Tax Variance (1592) 2013 Distribution Revenue
PILs and Tax Variance (1592) – HST Variance Subaccount 2013 Distribution Revenue
Gain on sale- Named properties (1508) 2011 Revenue Offsets
Stranded meters (1555) Stranded Meters
Hydro One Capital Contributions Variance (1508) 2013 Distribution Revenue
RARA variances (1595) 2009/10 Reg Assets Allocation
LRAMVA (1568) 2011-13 LRAMVA by class
IFRS –CGAAP Transitional PP&E Amounts (1575) 2013 Distribution Revenue
9. DEVELOPMENT OF RATE RIDERS 11
Toronto Hydro proposes a single volumetric rate rider for clearance of all DVA amounts, 12
with the exception of RSVAPower Global Adjustment (which will apply only to non-RPP 13
customers), Stranded Meters (to be recovered through a fixed charge for applicable rate 14
classes, as indicated in the OEB’s Smart Meter Funding and Cost Recovery Guidelines), 15

Toronto Hydro-Electric System Limited EB-2014-0116
Exhibit 9 Tab 1
Schedule 1 ORIGINAL
Page 25 of 30
and IFRS-CGAAP Transitional PP&E Amounts (which the OEB’s filing requirements 1
indicate a separate rider is required). 2
3
Toronto Hydro is proposing that for all DVA accounts, except RSVAPower Global 4
Adjustment, IRFS-CGAAP Transitional PP&E Amounts, and Stranded Meters, clearance 5
is over a 12-month period beginning May 1, 2015. 6
7
For the RSVAPower Global Adjustment balance, Toronto Hydro proposes a 24-month 8
clearance, beginning May 1, 2015. The balances in this account are large enough to 9
warrant clearance over two years to minimize bill impacts to affected customers. 10
11
For the IRFS-CGAAP Transitional PP&E Amounts, Toronto Hydro is proposing a 48-12
month clearance beginning January 1, 2016. This account, combined with the requested 13
amounts related to the Lost Revenue associated with IRM Framework 2012-14 (see 14
Exhibit 8, Tab 1, Schedule 1), is significant enough to warrant clearance over a longer 15
time period and beginning in the second year of the utility’s application in order to 16
smooth the bill impacts to affected customers. 17
18
For the Stranded Meters, Toronto Hydro is proposing a recovery period of 60 months, 19
beginning May 2015. Because the balances in this account are significant and being 20
cleared only to three rate classes, clearing over this longer time period in order to smooth 21
the bill impacts to affected customers is appropriate. 22
23
The derivation of the rate riders is shown in Exhibit 9, Tab 3, Schedule 1. 24
25
The impacts of all proposed rate riders combined with the distribution rate changes are 26
found in Exhibit 8, Tab 7, Schedule 1. 27
28

Toronto Hydro-Electric System Limited EB-2014-0116
Exhibit 9 Tab 1
Schedule 1 ORIGINAL
Page 26 of 30
10. NEW DEFERRAL AND/OR VARIANCE ACCOUNTS 1
Toronto Hydro is seeking OEB approval for the following new Deferral and Variance 2
Accounts. 3
4
10.1. Variance Account For Externally Driven Capital 5
Toronto Hydro requests a variance account to track the difference between the capital 6
embedded in base distribution rates related to third party initiated relocation and 7
expansion capital spending (“Relocation Spending”) and the capital related to actual 8
Relocation Spending as it occurs over the 2015 to 2019 CIR period. 9
10
As noted in more detail in Exhibit 2B, E5.3, every year Toronto Hydro is required to 11
respond to requests from a variety of third parties to relocate parts of the existing 12
distribution systems, causing Toronto Hydro to undertake capital projects of varying sizes 13
and scopes. 14
15
Relocation Spending is non-discretionary, as third parties request the relocation of 16
Toronto Hydro’s assets to accommodate their own infrastructure plans. Relocation 17
Spending is also volatile in terms of its scope, cost, and timing, as it is the third party in 18
each instance that is primarily responsible for dictating these parameters to Toronto 19
Hydro. This category of capital work does not manifest within the planning of Toronto 20
Hydro without having been initiated by third parties. 21
22
Table 3 from Exhibit 2B, E5.3 (reproduced below as Table 11), sets out the historical and 23
currently forecasted Relocation Spending from 2012 to 2019: 24
Toronto Hydro-Electric System Limited EB-2014-0116
Exhibit 9 Tab 1
Schedule 1 ORIGINAL
Page 27 of 30
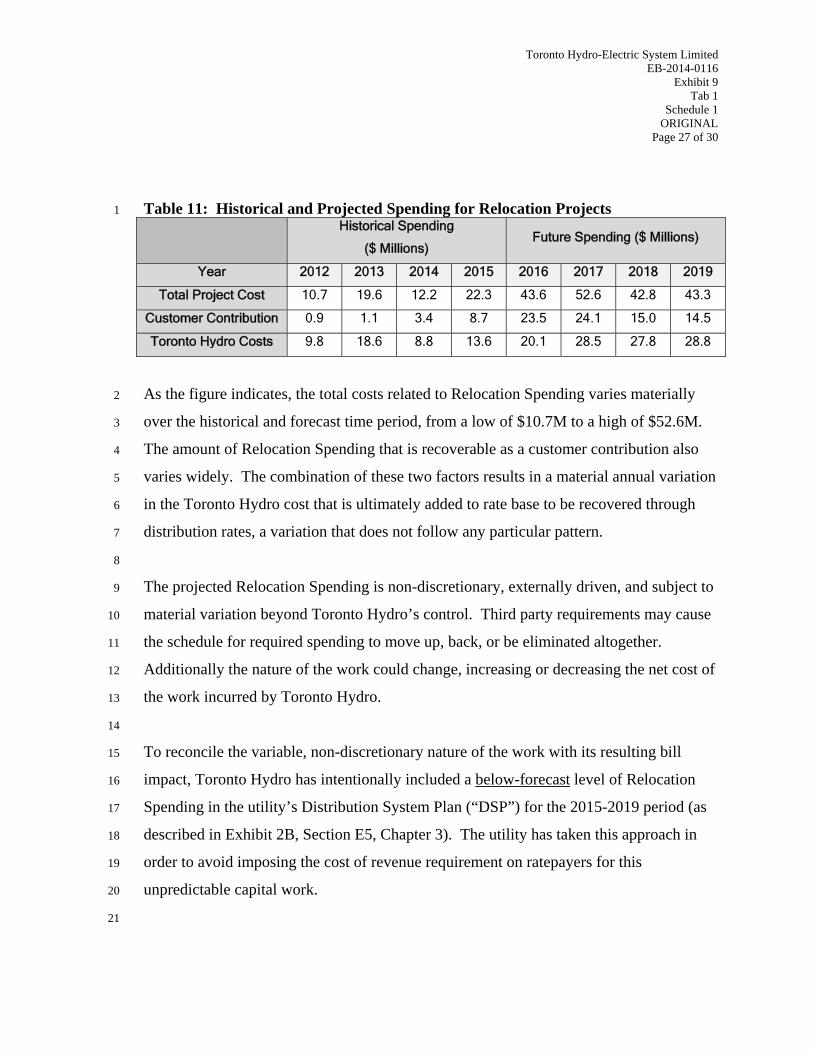
Table 11: Historical and Projected Spending for Relocation Projects 1
Historical Spending
($ Millions) Future Spending ($ Millions)
Year 2012 2013 2014 2015 2016 2017 2018 2019
Total Project Cost 10.7 19.6 12.2 22.3 43.6 52.6 42.8 43.3
Customer Contribution 0.9 1.1 3.4 8.7 23.5 24.1 15.0 14.5
Toronto Hydro Costs 9.8 18.6 8.8 13.6 20.1 28.5 27.8 28.8
As the figure indicates, the total costs related to Relocation Spending varies materially 2
over the historical and forecast time period, from a low of $10.7M to a high of $52.6M. 3
The amount of Relocation Spending that is recoverable as a customer contribution also 4
varies widely. The combination of these two factors results in a material annual variation 5
in the Toronto Hydro cost that is ultimately added to rate base to be recovered through 6
distribution rates, a variation that does not follow any particular pattern. 7
8
The projected Relocation Spending is non-discretionary, externally driven, and subject to 9
material variation beyond Toronto Hydro’s control. Third party requirements may cause 10
the schedule for required spending to move up, back, or be eliminated altogether. 11
Additionally the nature of the work could change, increasing or decreasing the net cost of 12
the work incurred by Toronto Hydro. 13
14
To reconcile the variable, non-discretionary nature of the work with its resulting bill 15
impact, Toronto Hydro has intentionally included a below-forecast level of Relocation 16
Spending in the utility’s Distribution System Plan (“DSP”) for the 2015-2019 period (as 17
described in Exhibit 2B, Section E5, Chapter 3). The utility has taken this approach in 18
order to avoid imposing the cost of revenue requirement on ratepayers for this 19
unpredictable capital work. 20
21
Toronto Hydro-Electric System Limited EB-2014-0116
Exhibit 9 Tab 1
Schedule 1 ORIGINAL
Page 28 of 30
For all these reasons Toronto Hydro is seeking the OEB’s approval to establish a variance 1
account to ensure that ratepayers are protected from the potentially material variations in 2
the actual Relocation Spending, and to fund such work that Toronto Hydro may be 3
required to undertake in the 2015 to 2019 period, beyond the below-forecast amount 4
included in the utility’s DSP. 5
6
10.2. Variance Account for Derecognition: 7
As described in Exhibit 4B, Tab 1, Schedule 2, under Modified IFRS, the gain or loss 8
arising from the derecognition of assets is required to be recorded as a depreciation 9
expense during the period in which the item is derecognized. Due to the dynamic nature 10
of Toronto Hydro’s capital program and operating environment, the utility is likely to 11
experience a significant degree of ongoing volatility in year over year losses on 12
derecognition over the 2015-2019 rate period. The previously noted relocations work is 13
one source of this volatility. To manage this volatility responsibly for both the utility and 14
its rate payers, Toronto Hydro requests a variance account to track the actual costs 15
associated with derecognition of assets. 16
17
Toronto Hydro’s 2015 Revenue Requirement includes a forecast of derecognition 18
amounts of $33.9M, which is included as part of depreciation expense. Toronto Hydro is 19
seeking this variance account to record annual differences from this amount in 2015, and 20
in the amounts included as part of the C-factor calculation over the 2016-19 period, in 21
order that ratepayers and the utility are held harmless from any variances in this amount. 22
The difficulty of accurately forecasting this amount and the associated potential volatility 23
are described fully in Exhibit 4B, Tab 1, Schedule 2. 24
25
10.3. Renewable Enabling Investments Provincial Rate Protection Recovery 26
As set out in Exhibit 2A, Tab 8, Schedule 1, Toronto Hydro is seeking approval for 27
Provincial Rate Protection Recovery of amounts related to renewable enabling 28
Toronto Hydro-Electric System Limited EB-2014-0116
Exhibit 9 Tab 1
Schedule 1 ORIGINAL
Page 29 of 30
investments. The amounts sought have been calculated using OEB Appendices 2-FA 1
through 2-FC. The approval would be granted through an OEB order directing the IESO 2
to remit the calculated amounts/revenues to Toronto Hydro. 3
4
Toronto Hydro requests approval for the establishment of a new variance account for the 5
purpose of tracking the variance between Toronto Hydro's revenue requirement required 6
to support the portion of the investments that are eligible for the provincial rate 7
protection, and the actual Provincial Rate Protection amounts collected from the IESO. 8
9
Toronto Hydro submits that the new variance account would meet the eligibility criteria 10
of causation, materiality and prudence as set out in the Filing Requirements. The 11
forecasted capital investments are outside the base upon which Toronto Hydro is seeking 12
2015 base revenue requirement. In addition, the proposed variance account is being 13
requested in accordance with the OEB's guidance in the Filing Requirements and 14
supporting appendices. Note 1 to Appendix 2-FB states: 15
“The difference between the actual costs of approved eligible investments and 16
revenue received from the IESO should be recorded in a variance account. The 17
Board may provide regulatory accounting guidance regarding a variance account 18
either in an individual proceeding or on a general basis.” 19
20
In the absence of a general variance account for this purpose, Toronto Hydro requests 21
that the OEB approve an Accounting Order for Toronto Hydro as part of this proceeding, 22
and that such an Accounting Order include the following: 23
• Toronto Hydro will calculate and record as a debit to the variance account, the 24
revenue requirement associated with the portion of the capital costs that are 25
eligible for provincial rate protection, as incurred by the utility for eligible 26
renewable enabling investments for the period of 2015 through 2019. 27

Toronto Hydro-Electric System Limited EB-2014-0116
Exhibit 9 Tab 1
Schedule 1 ORIGINAL
Page 30 of 30
• Toronto Hydro will record as a credit to the variance account, the amounts 1
collected from the IESO as a result of any OEB order directing such payments 2
from the IESO to Toronto Hydro. 3
• The balance will not attract carrying charges. 4
5
10.4. Draft Accounting Orders 6
Draft Accounting Orders for the requested Externally Driven Capital and Derecognition 7
Variance accounts requested are found in Appendix B. 8
ACrespo
Typewritten Text
Toronto Hydro-Electric System Limited EB-2014-0116 Exhibit 9A, Tab 1, Schedule 1, Appendix A ORIGINAL (24 pages)


ONTARIO ENERGY BOARD
Audit Report on Deferral and Variance Accounts
Toronto Hydro Electric-System Limited (“THESL”)
Audit and Performance Assessment Date of Issuance: March 2014

1
Audit of Deferral and Variance Accounts
Toronto Hydro Electric-System Limited (“THESL”) March 2014
Executive Summary The Ontario Energy Board (the “Board”) authorized an audit (“Audit”) of Toronto Hydro Electric-System Limited. (“THESL”) Group 1 and Group 2 deferral and variance accounts (each a “DVA”). This Audit was conducted by the Board’s Audit team (“Audit”) of the Board’s Audit and Performance Assessment during July 2013 to January 2014 and the audit report (“Report”) is being issued in March 2014. THESL’s Group1 DVAs except for Account 1588 RSVA Power (“Account 1588”) and Account 1589 Global Adjustment (“Account 1589”) and all Group 2 DVAs were last disposed in its 2011 CoS rate application EB-2010-0142 for 2009 year-end principle balances. Account 1588 and Account 1589 balances were last disposed in THESL’s 2010 Cost of Service (“CoS”) rate application EB-2009-0139 for 2008 year-end principle balances. The Audit focused on the balances of Group 1 and Group 2 DVAs as at December 31, 2012. Audit has concluded that some of the balances of the regulatory accounts as of December 31, 2012 were not accurately recorded in THESL’s general ledger (“GL”) and not accurately reflected in the Board’s Reporting and Record Keeping Requirements (“RRR”) 2.1.7 (Annual Trial Balance Filing). In addition, Audit has noted that THESL has not followed some of the accounting procedures as stated in Accounting Procedures Handbook (“APH”) and its related guidance in recording the transactions in certain of its DVAs. The audit findings of this Audit are found in Sections 8 and 9 of this Report. Audit noted that THESL’s 2012 DVA balances were not disposed in its 2014 IRM rate application EB-2012-0064 since the IRM threshold was not met. Therefore, Audit expects that THESL will incorporate necessary adjustments in its DVA balances as at December 31, 2013 that will be requested for disposition in its 2015 CoS rate application. Findings Summary Findings Impacting DVA balances:
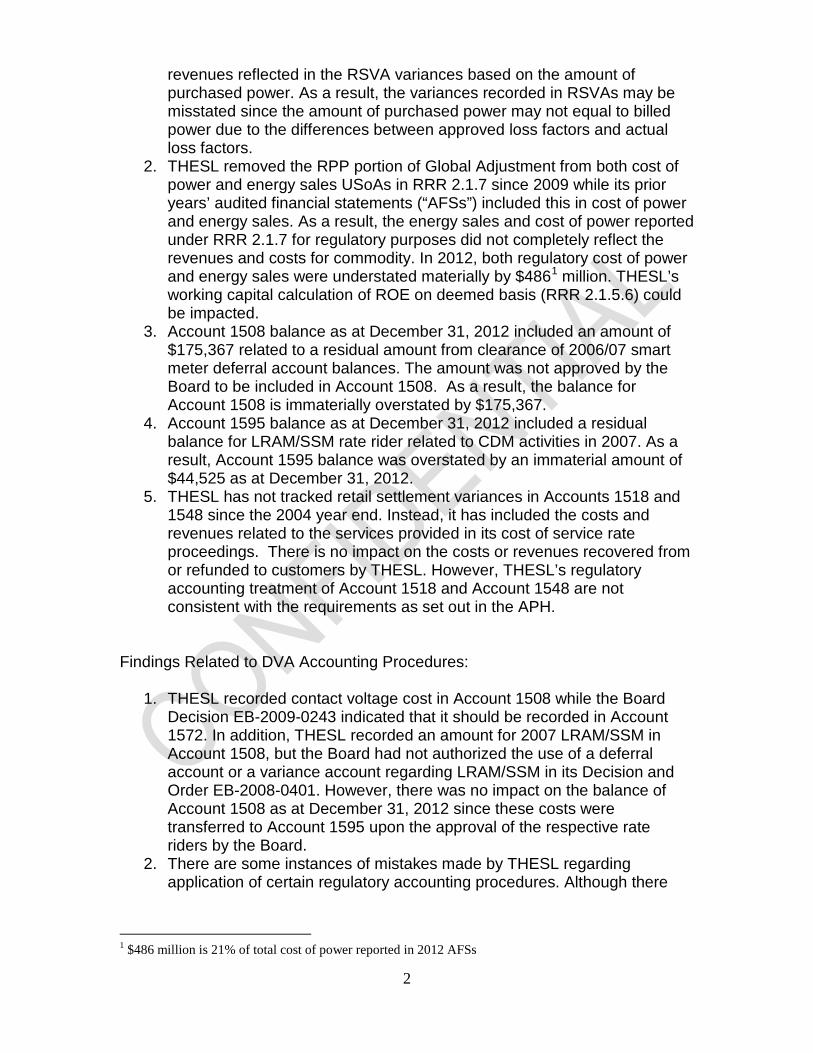
1. THESL does not use the amount billed to the customers to record the revenues reflected in the RSVA variances. Instead, it calculates the
2
revenues reflected in the RSVA variances based on the amount of purchased power. As a result, the variances recorded in RSVAs may be misstated since the amount of purchased power may not equal to billed power due to the differences between approved loss factors and actual loss factors.
2. THESL removed the RPP portion of Global Adjustment from both cost of power and energy sales USoAs in RRR 2.1.7 since 2009 while its prior years’ audited financial statements (“AFSs”) included this in cost of power and energy sales. As a result, the energy sales and cost of power reported under RRR 2.1.7 for regulatory purposes did not completely reflect the revenues and costs for commodity. In 2012, both regulatory cost of power and energy sales were understated materially by $4861 million. THESL’s working capital calculation of ROE on deemed basis (RRR 2.1.5.6) could be impacted.
3. Account 1508 balance as at December 31, 2012 included an amount of $175,367 related to a residual amount from clearance of 2006/07 smart meter deferral account balances. The amount was not approved by the Board to be included in Account 1508. As a result, the balance for Account 1508 is immaterially overstated by $175,367.
4. Account 1595 balance as at December 31, 2012 included a residual balance for LRAM/SSM rate rider related to CDM activities in 2007. As a result, Account 1595 balance was overstated by an immaterial amount of $44,525 as at December 31, 2012.
5. THESL has not tracked retail settlement variances in Accounts 1518 and 1548 since the 2004 year end. Instead, it has included the costs and revenues related to the services provided in its cost of service rate proceedings. There is no impact on the costs or revenues recovered from or refunded to customers by THESL. However, THESL’s regulatory accounting treatment of Account 1518 and Account 1548 are not consistent with the requirements as set out in the APH.
Findings Related to DVA Accounting Procedures:
1. THESL recorded contact voltage cost in Account 1508 while the Board Decision EB-2009-0243 indicated that it should be recorded in Account 1572. In addition, THESL recorded an amount for 2007 LRAM/SSM in Account 1508, but the Board had not authorized the use of a deferral account or a variance account regarding LRAM/SSM in its Decision and Order EB-2008-0401. However, there was no impact on the balance of Account 1508 as at December 31, 2012 since these costs were transferred to Account 1595 upon the approval of the respective rate riders by the Board.
2. There are some instances of mistakes made by THESL regarding application of certain regulatory accounting procedures. Although there
1 $486 million is 21% of total cost of power reported in 2012 AFSs

3
might not be any impact on the DVA balances, future errors may result in incorrect accounting.
1. Background THESL commenced operations in 1999. It is a wholly owned subsidiary of THESL Corporation. The company delivers electricity to more than 718,6612 residential and business customers in the city of Toronto. THESL’s approved base revenue requirement for distribution revenues was approximately $522 million in its 2011 CoS proceeding EB-2010-0142. The materiality threshold, calculated as per 2014 CoS filing requirements, is 1 million.
2. Authority for Audit To the extent that this Audit required THESL to provide documents, records or information, Audit acted under its inspection powers under Part VII of the Ontario Energy Board Act, 1998. During the Incentive Regulation Mechanism (“IRM”) plan term, the Board decided that the revised Group 1 Account balances would be reviewed and that a pre-set disposition threshold of $0.001/kWh (debit or credit) would trigger their disposition. The Board has decided that at the time of rebasing all account balances should be reviewed and disposed of unless otherwise justified by the distributor or as required by a specific Board decision or guidance. The Board also required that the distributors bring all account balances, including Group 2 DVAs at the time of rebasing.3 To assist the Board in discharging its responsibilities related to DVAs, Audit initiated an audit of THESL’s DVAs balances in order to mitigate the risk associated with the incorrect disposition of these account balances.
3. Reason for Audit The Board’s audit function is a regulatory instrument of the Board to ensure that the regulated licensed entities conform to the APH and the Board’s issued regulatory accounting guidelines and policies. The Board requires electric utilities to report certain information to the Board at specific intervals. The Board relies on this information for industry monitoring, replying to stakeholders’ requests, assisting in the review of applications and many other purposes. The DVA balance information is important to the Board, as it assists the Board in ensuring that accurate amounts are cleared through 2 Per 2012 RRR reported number 3 July 31, 2009 Report of the Board on Electricity Distributors’ Deferral and Variance Account Review Initiative (EDDVAR) (EB-2008-0046)
4
rates to customers. It is important that distributors file information that is complete, accurate and on time.
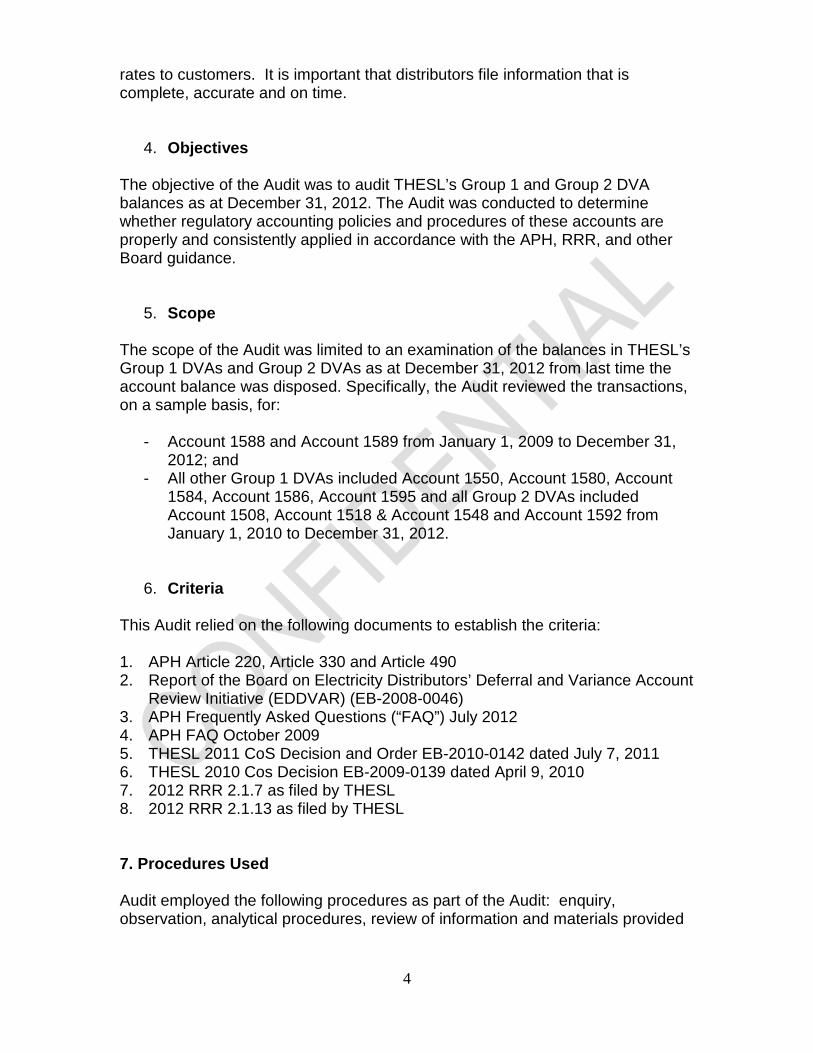
4. Objectives The objective of the Audit was to audit THESL’s Group 1 and Group 2 DVA balances as at December 31, 2012. The Audit was conducted to determine whether regulatory accounting policies and procedures of these accounts are properly and consistently applied in accordance with the APH, RRR, and other Board guidance.
5. Scope The scope of the Audit was limited to an examination of the balances in THESL’s Group 1 DVAs and Group 2 DVAs as at December 31, 2012 from last time the account balance was disposed. Specifically, the Audit reviewed the transactions, on a sample basis, for:
- Account 1588 and Account 1589 from January 1, 2009 to December 31, 2012; and
- All other Group 1 DVAs included Account 1550, Account 1580, Account 1584, Account 1586, Account 1595 and all Group 2 DVAs included Account 1508, Account 1518 & Account 1548 and Account 1592 from January 1, 2010 to December 31, 2012.
6. Criteria This Audit relied on the following documents to establish the criteria: 1. APH Article 220, Article 330 and Article 490 2. Report of the Board on Electricity Distributors’ Deferral and Variance Account
Review Initiative (EDDVAR) (EB-2008-0046) 3. APH Frequently Asked Questions (“FAQ”) July 2012 4. APH FAQ October 2009 5. THESL 2011 CoS Decision and Order EB-2010-0142 dated July 7, 2011 6. THESL 2010 Cos Decision EB-2009-0139 dated April 9, 2010 7. 2012 RRR 2.1.7 as filed by THESL 8. 2012 RRR 2.1.13 as filed by THESL
7. Procedures Used Audit employed the following procedures as part of the Audit: enquiry, observation, analytical procedures, review of information and materials provided
5
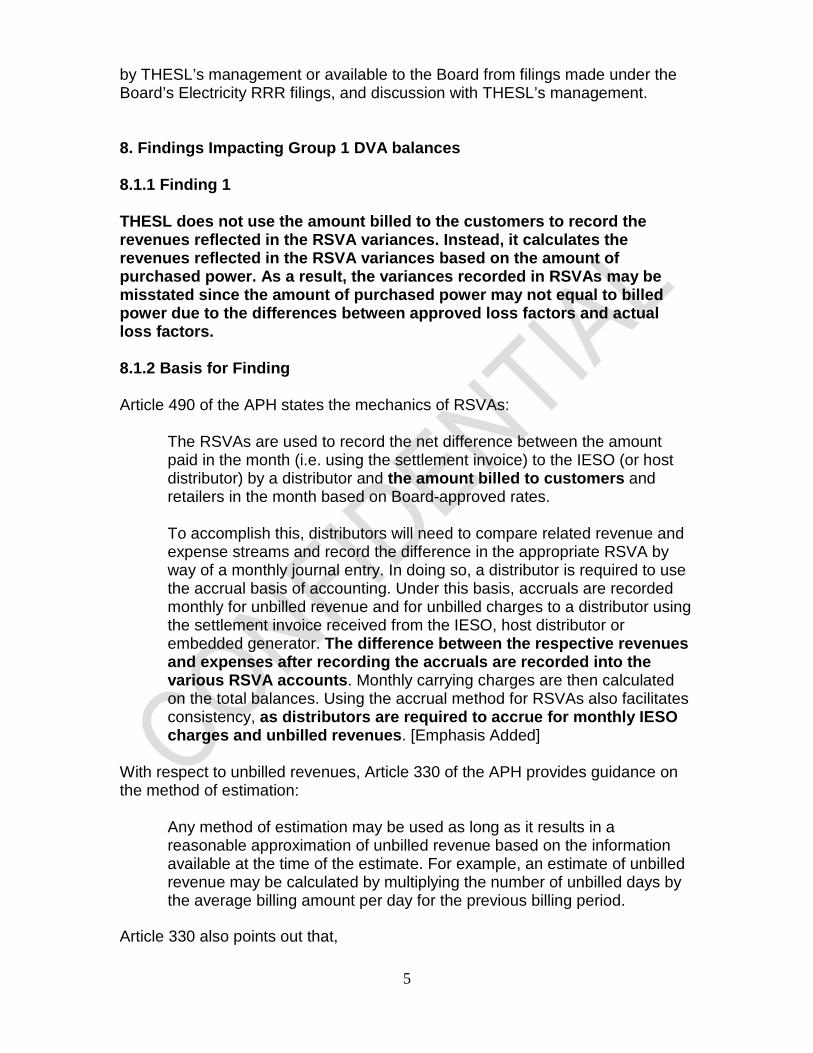
by THESL’s management or available to the Board from filings made under the Board’s Electricity RRR filings, and discussion with THESL’s management. 8. Findings Impacting Group 1 DVA balances 8.1.1 Finding 1 THESL does not use the amount billed to the customers to record the revenues reflected in the RSVA variances. Instead, it calculates the revenues reflected in the RSVA variances based on the amount of purchased power. As a result, the variances recorded in RSVAs may be misstated since the amount of purchased power may not equal to billed power due to the differences between approved loss factors and actual loss factors. 8.1.2 Basis for Finding Article 490 of the APH states the mechanics of RSVAs:
The RSVAs are used to record the net difference between the amount paid in the month (i.e. using the settlement invoice) to the IESO (or host distributor) by a distributor and the amount billed to customers and retailers in the month based on Board-approved rates. To accomplish this, distributors will need to compare related revenue and expense streams and record the difference in the appropriate RSVA by way of a monthly journal entry. In doing so, a distributor is required to use the accrual basis of accounting. Under this basis, accruals are recorded monthly for unbilled revenue and for unbilled charges to a distributor using the settlement invoice received from the IESO, host distributor or embedded generator. The difference between the respective revenues and expenses after recording the accruals are recorded into the various RSVA accounts. Monthly carrying charges are then calculated on the total balances. Using the accrual method for RSVAs also facilitates consistency, as distributors are required to accrue for monthly IESO charges and unbilled revenues. [Emphasis Added]
With respect to unbilled revenues, Article 330 of the APH provides guidance on the method of estimation:
Any method of estimation may be used as long as it results in a reasonable approximation of unbilled revenue based on the information available at the time of the estimate. For example, an estimate of unbilled revenue may be calculated by multiplying the number of unbilled days by the average billing amount per day for the previous billing period.
Article 330 also points out that,

6
With the increased deployment of smart meters, the need for estimating the amount of electricity distributed since the last meter reading should be decreasing, as smart meters may eventually permit more up to date or real time reading of meters. For purposes of estimating unbilled revenue, distributors should use which ever estimation method (or combination of methods) produces the most reliably and accurate result.
With respect to the RSVA Account 1588 power, APH Article 490 specifically states that the account is established for the purpose of recording the “net difference” in energy cost only and the net difference could be composed of differences in energy price and/or energy quantities as well as the difference between estimated and actual line loss factors4. [Emphasis Added] The methodology from the APH indicates that distributors should record the revenues billed to customers and accrue the unbilled revenues for the period. The distributors should also record the charges from upstream suppliers of power and accrue the charges for the period. The difference of the revenues and charges after the accruals for the period should then be recorded in the RSVAs. However, Audit noted that THESL’s methodology for RSVAs accounting is not in accordance with the APH based on its audit testing of information gathered from THESL. THESL’s accounting procedure document indicated that the energy revenue is calculated in its Revenue Model based on the total power purchased (primarily from the monthly IESO invoice) for the calendar month and retail rates approved by the Board. THESL also stated in its procedure document that the RSVA account is the difference between what THESL is charged by the IESO and the energy revenue calculated from THESL’s Revenue Model. If the monthly wholesale rate is lower than the retail rate, the RSVA account attracts a credit balance and if the wholesale rate is higher than the retail rate, the RSVA account attracts a debit balance.5 Audit reviewed a sample6 of supporting calculations for the RSVAs and confirmed that THESL’s RSVA variances are only determined by the differences in rates for the relevant services. As a result of THESL’s methodology, Account 1588 does not attract any variance given that there is no difference between wholesale and retail rates for energy theoretically. THESL only recorded and reported a $5k balance as at Dec 31,
4 Page 19 of APH Article 490 5 Per THESL’s internal accounting procedures for the Group 1 DVAs received on July 18, 2013 6 The supporting documents and calculations were reviewed for RSVAs for the months of November 2010, December 2010, June 2011, July 2011, March 2012 and December 2012. In addition, Audit reviewed a sample month of March 2009 for Account 1589 Global Adjustment since this account’s last disposition was for its 2008 year-end balance. Audit applied professional judgement in randomly selecting the sample months for testing.
7
2012 under Account 1588 per THESL’s General Ledger (“GL”). This balance represents a residual amount from THESL’s last disposition of 2008 balance for Account 1588 that THESL included in its 2010 rate application EB-2009-0139. Besides this residual balance, Account 1588 showed $0 transactions recorded in THESL’s GL for the period of 2009 to 2012. Similarly, any differences in purchased volumes and billed volumes are not captured in the other RSVA account balances: Account 1580 - WMS, Account 1584 - Network, Account 1586 - Connection and Account 1589 - Global adjustment. With respect to Account 1588, it is noted that the line loss differences in Account 1588 was explored in THESL’s 2011 CoS rate application EB-2010-0142. The Board indicated in that Decision and Order that managing line losses is a generic issue to be dealt with. The Board stated that in the interim, Account 1588 be continued for THESL and THESL should not be treated any differently from other distributors in the sector. Upon further inquiry by Audit regarding its rational and references to Board Decisions for not recording any variances in the Account 1588, THESL stated that:
As a check on the validity of this methodology, THESL does monitor unbilled revenue on a monthly basis, as this is where any variances between approved vs. actual energy losses would accrue. Any sustained bias in actual vs. approved losses would show in this account, and to date has not. Additionally, THESL files high level annual estimates of actual losses in its annual rate filings to support its approved loss factors. These filings have not exhibited losses which are systematically or materially different than the approved loss factors.7
THESL stated that due to the billing cycle data not matching exactly with the period of purchased energy data, direct observation of actual losses is not possible8. In a webcast held with THESL on September 25, 2013, THESL clarified that the unbilled revenue on a monthly basis does not exactly represent the variance between approved vs. actual energy losses because of the differences in time periods (i.e. the billing cycle for billed revenues vs. the calendar month for earned revenues). THESL also indicated in the webcast that the line loss factors submitted in its past rate proceedings were only estimates for the line losses. The estimated line loss factors for the period of 2009 to 2012 that were provided by THESL9 and the approved line loss factors for the same period as per Board rate orders are listed below: 7 Per THESL’s response received on August 13, 2013 for Audit’s request of information dated July 26, 2013 8 Per THESL’s response received on September 9, 2013 for Audit’s follow-up questions 9 Per THESL’s response received on October 25, 2013 for Audit’s follow-up questions

8
Total Loss Factor non-Large Use Customers 2009 2010 2011 2012
Estimated Figure Percentage as provided by THESL 3.74% 5.36% 1.92% 4.85% The approved Loss Figure Percentage from Board Rate Orders (Note 1) 3.76% 3.76% 3.76% 3.76% Note 1: per total loss factors for secondary metered customers less than 5,000 kw approved in respective rate orders EB-2009-0069 effective May 1, 2009, EB-2009-0139 effective May 1,2010, EB-2010-0142 effective May 1, 2011. Audit noted that a number of interrogatories with respect to Account 1588 were asked by Board staff in THESL’s 2013 IRM rate proceeding EB-2012-0064. The supporting documents and explanations obtained from the Audit are consistent with the interrogatory response and undertaking responses10 provided by THESL. As a result of THESL’s methodology to account for RSVAs, the balances in RSVAs may not be accurate and therefore may be misstated. It is not clear to Audit whether or not THESL’s methodology could have a material impact on its RSVA balances. In addition, THESL and its customers may not be kept as a whole since the differences between the estimated line losses and the actual line losses are not tracked and recorded in the RSVAs. Audit notes that THESL agreed in its EB-2012-0064 proceeding to evaluate options to measure or estimate actual line losses as a part of a settlement:11
THESL agrees to evaluate options to measure or estimate actual line losses and the impacts on Account 1588 balances in accordance with the Accounting Procedures Handbook. THESL will file the results in its application for 2015 rates.
10 EB-2012-0064, THESL’s phase 2 interrogatory response, Tab 10B, Schedule 1-14 & Schedule 2-14; THESL’s undertaking response JT3.10 11 EB-2012-0064, Phase 2 Settlement Agreement, Filed 2013-12-18, Page 6 of 11.

9
8.1.3 Area of Non-Conformity Requiring Action THESL should have followed the APH in recording the RSVA variances. As a part of this Audit process, THESL needs measure or estimate the balances for the RSVAs and address concerns raised in this Audit. Furthermore, THESL is expected to quantify the impact of its methodology on account balances for RSVAs from the last time the accounts were disposed by the Board using proxy methods or any other methods that would provide an estimate for the account balances. Specifically, the impact of this methodology on balances for Account 1580, Account 1584 and Account 1586 and any potential material impacts on customers should be quantified for the period of January 1, 2010 to December 31, 2012. The impact of THESL’s methodology on the balances for Account 1588 and Account 1589 and any potential material impact on customers should be quantified from January 1, 2009 to December 31, 2012. THESL should bring to the Board its proposed methodology in addressing the issues raised in this Audit with respect to measuring and recording the differences between actual line losses and approved line losses in RSVAs. THESL should further ensure that the balances in the RSVAs that will be sought for disposition as a part of its application for 2015 rates are properly stated in accordance with the APH. In the longer term, THESL is encouraged to benchmark with other distributors in the province to make improvements on its billing systems and accounting system. THESL should undertake necessary initiatives to ensure its regulatory accounting treatment of RSVAs are in conformity with the APH and as a result, more accurate balances are reflected in RSVAs for the purpose of disposition in rate proceedings. 8.1.4 Management Responses THESL agrees with the finding that amounts billed to customers are not used to record revenues reflected in the RSVA variance accounts. As noted by the Auditors, THESL explained its revenue recognition methodology and indicated during the audit our reasons for not recording amounts into this account, namely the inability to accurately match purchases and sales for a given period due to billing cycles and our revenue recognition methodology. THESL continues to be concerned that proxy approaches to estimating actual losses implies a degree of accuracy that is not necessarily any more accurate than THESL’s current approach of assuming actual losses are the same as approved losses.

10
8.1.5 Management Action Plan As noted by Audit staff, THESL has agreed, as part of its 2014 IRM Settlement agreement which was accepted by the Board, to evaluate options to measure or estimate actual line losses and the impacts on Account 1588 balances in accordance with the Accounting Procedures Handbook. THESL believes that the data that is starting to becoming available as a result of the smart meter program will allow for a more accurate and timely reflection of total system sales on the same period basis as its information on power purchases, so that actual losses may be calculated with a greater degree of accuracy, and a robust method of reflecting billed revenue as per the APH will be utilized to record variances to the RSVA accounts in the future Notwithstanding the above, THESL agrees to explore options, based on research on other utilities’ methodologies (including Hydro One and Enersource, etc) to develop a methodology in the interim period which will allow for a proxy estimate to record balances in Account 1588 for the period 2009 to 2013. THESL will propose a methodology and estimate to OEB Audit staff within the next 1-3 months, and record any estimated balances for disposal at its next Rate Filing. THESL will also evaluate the results of this methodology as the basis for any potential adjustments to Accounts 1580, 1584 and 1586. 8.2.1 Finding 2 THESL removed the RPP portion of Global Adjustment from both cost of power and energy sales USoAs in RRR 2.1.7 since 2009 while its prior years’ audited financial statements (“AFSs”) included this in cost of power and energy sales. As a result, the energy sales and cost of power reported under RRR 2.1.7 for regulatory purposes did not completely reflect the revenues and costs for commodity. In 2012, both regulatory cost of power and energy sales were understated materially by $48612 million. THESL’s working capital calculation of ROE on deemed basis (RRR 2.1.5.6) could be impacted. 8.2.2 Basis for Finding RRR 2.1.7 states that “A distributor shall provide the Board annually, by April 30, a trial balance in uniform system of accounts format supporting the audited financial statements, for the preceding calendar year.” Audit noted the difference of $486 million in cost of power between AFS and RRR 2.1.7 for 2012, per its review of mapping document RRR 2.1.13 that THESL filed with the Board. THESL explained that the difference is due to an adjusting entry made for regulatory reporting to remove the RPP portion of global
12 $486 million is 21% of total cost of power reported in 2012 AFSs
11
adjustment from both energy sales and cost of power. THESL further explained that the adjusting entry was made per the company’s accounting policy “Global Adjustment Charge for Regulated Price Plan Customers – Recommended Accounting Treatment”13. Audit reviewed the THESL’s internal accounting policy memo14 dated November 24, 2009. Audit notes that the adjusting entry was done in accordance with the THESL’s policy. According to THESL’s policy, the adjustment to remove the RPP portion of global adjustment was to be adopted by THESL effective from the 2009 year-end. THESL’s policy referred to the APH FAQs October 2009 Q11 &12 reflecting the OEB direction for the accounting treatment of the RPP portion of global adjustment. THESL’s policy refers to the following excerpt in Q12 for not treating RPP portion of global adjustment as cost of power:
Since the distributor will recover through charge type 142 the global adjustment portion attributable to the RPP customers paid on the IESO settlement invoices, a journal entry for the charge type 142 amount should be posted to account 4705, Power Purchased. As a result, this journal entry would have an offsetting effect on the global adjustment (attributable to the RPP customers) amount that was included and paid under charge type 146 also posted to account 4705 (as discussed in A.11 above).15 [underlined for emphasis]
Audit noted that THESL’s accounting policy relied on the underlined statement in the APH FAQs cited above. However, in Audit’s view, the above statements including the underlined statement from Q12 of APH FAQs indicate that Account 4705 should include two components below:
1) Charge type 142 on IESO invoice (representing the amount for RPP – HOEP-RPP portion of global adjustment)
2) RPP portion of global adjustment (part of Charge type 146) Sum of 1) and 2) = RPP – HOEP due to the offsetting effect on the RPP portion of GA
However, THESL did not record the charge type 142 in Account 4705. Furthermore, at year-end, THESL removed the RPP portion of Global adjustment on its IESO RPP funds settlement forms for a year from both energy sales and cost of power through an adjusting entry for regulatory reporting purpose. As a result, the adjustment resulted in an understatement of both energy sales and the cost of power for regulatory reporting. Although there is no net impact on the regulatory net income since both energy sales and cost of power were understated, energy sales and cost of power reported under RRR 2.1.7 for regulatory purposes are significantly understated. This practice may cause a misalignment of AFS and RRR and result in an 13 Per THESL’s response received September 13, 2013 14 Provided as per Audit’s request on September 13, 2013 15 APH FAQs October 2009 Q12

12
inaccurate calculation for any ratio that uses cost of power for regulatory reporting. In addition, the understatement of cost of power may impact the working capital calculation of ROE on deemed basis (RRR2.1.5.6) and hence may lead to an inaccurate calculation of ROE on deemed basis. 8.2.3 Area of Non-Conformity Requiring Action THESL should not have made the year-end adjustments for both energy sales and cost of power in RRR. THESL should re-file the RRR balances for its relevant energy sales and cost of power accounts for 2012. THESL should also assess the impact of this adjustment on its ROE on deemed basis for both 2011 and 2012 and resubmit RRR 2.1.5.6. Moving forward, the accounting policy of adjusting the cost of power and energy sales in reporting should be revised to reflect the appropriate cost of power and energy sales. THESL should ensure that the cost of power and energy sales are accurately recorded and aligned between AFSs and RRR. 8.2.4 Management Responses THESL agrees with the finding that the RPP portions of Global Adjustment were excluded from reporting of Cost of Power and energy sales in RRR 2.1.7, As noted in the Audit report, THESL relied on the FAQ’s issued by the Board for its treatment of the RPP portion of Global Adjustment in its Cost of Power reporting for regulatory purposes. 8.2.5 Management Action Plan Since THESL currently reports Cost of Power including the RPP amount of Global Adjustment for financial reporting purposes, THESL agrees to revise regulatory accounting policy and report Cost of Power for Regulatory reporting purposes on the same basis in future RRR filings. THESL will also re-file before the end of April 2014 the Cost of Power accounts for 2012, and RRR 2.1.5.6 for 2011 and 2012 to reflect this treatment. 8.3.1 Finding 3 Account 1508 balance as at December 31, 2012 included an amount of $175,367 related to a residual amount from clearance of 2006/07 smart meter deferral account balances. The amount was not approved by the

13
Board to be included in Account 1508. As a result, the balance for Account 1508 is immaterially overstated by $175,367. 8.3.2 Basis for Finding APH Article 330 Page 8 establishes a set of balance sheet accounts that should be used to record Board approved regulatory debits and credits. Account 1508 is one of the balance sheet accounts to record the Board approved regulatory debits. Q8 of APH FAQs August 2008 indicates, through an illustrative example, that the approved revenue requirement, net of the funding received for the period, results in a net revenue requirement amount recoverable in rates via an approved rate adder that will be recorded in the distribution revenue Account 4080. THESL’s Account 1508 reported in 2012 RRR 2.1.7 and GL included an amount of $175,367. THESL explained that the amount represents a residual balance from previous clearance of smart meter deferral accounts in its 2006/07 rate filing. Audit notes that the amount was not approved by the Board to be recorded in Account 1508. The balance for Account 1508 is immaterially overstated by $175,367 as at December 31, 2012. 8.3.3 Area of Non-Conformity Requiring Action THESL should not have made any recording of the smart meter deferral account balances in Account 1508, which had not been approved by the Board. THESL should make an adjustment to Account 1508 to write off the amount of $175,367 related to the residual balance from past smart meter disposition. THESL also needs to re-file the RRR balance for Account 1508. 8.3.4 Management Responses THESL agrees with the finding that Account 1508 balance as at December 31, 2012 included an amount of $175,367 related to a residual amount from clearance of 2006/07 smart meter deferral account balances. As noted by Audit staff, this immaterial amount is a residual amount remaining after Board approval to clear Smart Meter related costs in EB-2007-0063. THESL had intended to include this amount in its future application to clear additional Smart Meter deferral accounts, but ultimately decided not to.

14
8.3.5 Management Action Plan This amount will be removed from Account 1508 before the end of April 2014. 8.4.1 Finding 4 Account 1595 balance as at December 31, 2012 included a residual balance for LRAM/SSM rate rider related to CDM activities in 2007. As a result, Account 1595 balance was overstated by an immaterial amount of $44,525 as at December 31, 2012. 8.4.2 Basis for Finding Article 220 of the APH defines Account 1595:
This account shall be used to record the approved principal account balances on the transfer to Account 1595 of the Board-approved deferral or variance account balances. This account shall also include the amounts recovered (or refunded) in rates through regulatory asset or deferral and variance accounts rate riders. [Emphasis Added]
Q14 of APH FAQs July 2012 specifically provides the guidance on the accounting treatment of LRAM rate rider prior to 2011:
With respect to the LRAM rate riders approved for the pre-2011 CDM programs (i.e., prior to 2011 OPA-Contracted Province-Wide CDM Programs or 2011 Board-Approved CDM Programs), there was no Board-approved deferral or variance account (such as, Account 1568, LRAM Variance Account) authorized in which to record the LRAM amounts. There was also no required LRAM true-up procedure for these prior years. Distributors typically filed LRAM claims to recover LRAM amounts in applications and not through the disposition of LRAM balances recorded in a Board-approved deferral or variance account. Accordingly, the normal accounting treatment, as discussed above, using Accounts 1100 and 4080 should apply for recording the LRAM rate rider recoveries associated with the pre-2011 CDM programs. [Emphasis Added]
Per review of THESL’s breakdown of Account 1595 balance16, Audit noted that the Account 1595 balance as at December 31, 2012 included a residual balance of $44,525 related to LRAM/SSM rate rider related to CDM activities in 2007 approved by the Board in the Decision and Order EB-2008-0401 dated September 22, 2009.
16 Per THESL’s supporting documents provided on September 23, 2013

15
Although the amount included in Account 1595 for LRAM/SSM rate rider is not material, the inclusion of a rate rider that is not subject to true-up may impact the integrity of the account. 8.4.3 Area of Non-Conformity Requiring Action THESL should have removed the residual balance related to LRAM/SSM rate rider in Account 1595. THESL also needs to re-file the RRR for 2012 balance for Account 1595 as at December 31, 2012 accordingly. Moving forward, THESL should not record an amount of a rate rider in Account 1595, where the Board has not authorized it to do so. 8.4.4 Management Responses THESL agrees with the finding that Account 1595 balance as at December 31, 2012 included a residual balance of $44,525 for LRAM/SSM rate rider related to CDM activities in 2007. As noted by audit staff, this immaterial amount is related to residual balance from regulatory amounts that were approved by the Board in 2009 to clear, and hence THESL assumed should be recorded in Account 1595 to track these clearances. At the time the account that these residual balances relate to was approved for clearance, the “true-up” requirements for under or over collection of certain accounts (such as LRAM) were not clear. Audit staff have highlighted from the July 2012 FAQ, “There was also no required LRAM true-up procedure for these prior years”. 8.4.5 Management Action Plan THESL will remove this $44,525 residual balance from account 1595 before the end of April 2014. 8.5.1 Finding 5 THESL has not tracked retail settlement variances in Accounts 1518 and 1548 since the 2004 year end. Instead, it has included the costs and revenues related to the services provided in its cost of service rate proceedings. There is no impact on the costs or revenues recovered from or refunded to customers by THESL. However, THESL’s regulatory accounting treatment of Account 1518 and Account 1548 are not consistent with the requirements as set out in the APH. 8.5.2 Basis for Finding APH 490 directs the recording of incremental costs and revenues associated with the retail services provided by distributors in Account 1518 and Account 1548.

16
These accounts are collectively referred to Retail Cost Variance Accounts (RCVAs). Audit noted that there are no balances in THESL’s RCVAs as at December 31, 2012. Upon further inquiry, THESL confirmed that there have been no balances in RCVAs since the 2004 year end. THESL explained that as a result of the regulatory asset phase II hearing RP-2004-0117, THESL interpreted the Board Decision together with the evidence where the variances in these accounts were immaterial to indicate that tracking of the RCVAs was no longer necessary. THESL has included in its revenue requirement in cost of service rate filings both the costs of providing retail services and the revenues received. The Decision with reasons for RP-2004-0117 dated December 9, 2004 was related to the approval of the recovery of regulatory assets –phase 2 for 4 distributors (THESL, Hydro One, Enersource and London Hydro). The Decision discussed the issue of RCVAs and stated that:
APH 490 is more current and clearly supersedes the Rate Handbook reference. However, given the relative insignificance of the balances in the RCVA accounts as revealed in this proceeding, the Board will not require recording and filing of this information if a distributor has not already done so. [Emphasis Added]
It is in Audit’s view that the RP-2004-0117 Decision was made in the context of the information filed in the THESL’s rate filing at the time and, therefore should not be interpreted by THESL as a justification for departure from the APH on going forward basis. In addition, Audit noted that one utility, who did not claim RCVAs in the proceeding RP-2004-0117, had followed Article 490 with respect to the RCVAs and disposed the respective RCVA balances in its 2013 CoS rate application proceeding EB-2012-0033 dated December 13, 2012. There is no impact on the costs or revenues recovered from or refund to customers by THESL. However, THESL’s practice with respect to regulatory accounting treatment of RCVAs is not consistent with the APH and the practice of other distributors. The zero balances in the RCVAs will not provide the Board with the accurate information regarding these accounts that the Board gathers and monitors on an ongoing basis.
17
8.5.3 Area of Non-Conformity Requiring Action THESL did not follow Article 490 with respect to the recording RCVA costs and revenues in their respective accounts. THESL needs to follow Article 490 with respect to regulatory accounting treatment of the RCVAs. Since THESL’s last CoS Decision included the revenues and costs related to retail services in its revenue requirement, THESL should start recording the variances in Account 1518 and Account 1548 from 2015 and exclude the revenues and expenses related to retail services from the revenue requirement of its upcoming 2015 CoS rate application. 8.5.4 Management Responses THESL agrees with the finding that it has not tracked retail settlement variances in Accounts 1518 and 1548 since the 2004 year end. As noted by audit staff, THESL relied on the findings in RP-2004-0117 as the basis for not reporting amounts in RCVA accounts and including both costs and revenues related to the retail market in each of its Cost of Service filings since that decision. As a result of this audit, THESL has obtained its most recent annual costs and revenues related to the retail market. For 2013, THESL estimates total costs of $458K and total revenues of $542K. The variance between these two amounts (consistent with evidence from RP-2004-0117) is an immaterial amount of $84K. 8.5.5 Management Action Plan On the basis of the immateriality of this amount and the fact that THESL has previously included the revenues and costs as part of its normal cost of service filings, THESL prefers to continue this practice. THESL sees this approach as being the most efficient and least costly approach for ratepayers. THESL will include in its 2015 application a request of the Board to exempt THESL for recording amounts in RCVA accounts in the future. 9. Findings related to DVAs’ Accounting Procedures
9.1.1 Finding 1 THESL recorded contact voltage cost in Account 1508 while the Board Decision EB-2009-0243 indicated that it should be recorded in Account 1572. In addition, THESL recorded an amount for 2007 LRAM/SSM in Account 1508, but the Board had not authorized the use of a deferral account or a variance account regarding LRAM/SSM in its Decision and Order EB-2008-0401. However, there was no impact on the balance of Account 1508 as at December 31, 2012 since these costs were transferred

18
to Account 1595 upon the approval of the respective rate riders by the Board. 9.1.2 Basis for Finding Page 8 of the APH Article 330 establishes a set of balance sheet accounts that should be used to record Board approved regulatory debits and credits. Account 1508 is one of the balance sheet accounts to record the Board approved regulatory debits. Audit noted that THESL recorded two costs prior to 2010 in Account 1508 that had not been authorized by the Board to be recorded in Account 1508. THESL recorded contact voltage cost in Account 1508 while the Board Decision EB-2009-0243, dated December 10, 2009, indicated that it should be recorded in Account 1572. THESL recorded an amount for 2007 LRAM/SSM in Account 1508, but the Board had not authorized the use of a deferral variance account in its Decision and Order EB-2008-0401, dated September 22, 2009. Audit asked THESL to provide a reference to APH for each of the sub-accounts of Account 1508 used by THESL. THESL explained that THESL interpreted Account 1508 as an account for recording costs not otherwise included in other accounts. In the absence of explicit Board directions, THESL recorded amounts in this account for future review and disposition.17 Audit noted that the THESL’s interpretation of regulatory accounting treatment of contact voltage cost might have not been appropriate given that APH has explicitly stated that “Account 1508 is one of the balance sheet accounts to record the Board approved regulatory debits.” The costs should only be recorded in Account 1508 when the account is authorized by the Board in its Decision and Order to record the deferred costs. Audit notes that the Board established a Market Participant Enquiries (“MPEs”) process that can be used by all stakeholders including rate regulated utilities to make inquiries for various matters. THESL had an opportunity to seek guidance with respect to regulatory accounting treatment of contact voltage costs by making an inquiry through the Board’s MPEs process. Audit notes that the THESL’s practice with respect to the contact voltage and LRAM/SSM costs did not have any impact on the balance of Account 1508 since these costs were disposed in 2010 and transferred out of Account 1508 accordingly.
17 Per THESL’s response received on October 25, 2013
19
9.1.3 Area of Non-Conformity Requiring Action THESL should not have recorded any costs related to contact voltage and LRAM/SSM in Account 1508 that had not been authorized by the Board. Moving forward, THESL should only record the deferred costs in Account 1508 when the Board authorizes this account to be used in a Board Decision and Order. 9.1.4 Management Responses THESL agrees with the findings that it recorded Contact Voltage amounts in account 1508 rather than Account 1572, and that it recorded amounts related to LRAM/SSM in Account 1508 without specific Board authorization. With respect to Contact Voltage amounts recorded to Account 1508, THESL acknowledges that the Board’s decision directed amounts to be recorded in Account 1572, and THESL should have properly recorded them to that account on receipt of the Decision. With respect to LRAM/SSM amounts, Audit staff have pointed out (in Finding 8.4) that prior to 2011, there were no specific accounts approved for LRAM/SSM amounts. THESL notes that these amounts were scrutinized and approved for clearance by the Board. 9.1.5 Management Action Plan THESL will ensure to the best of its ability that future Board directions for recording amounts are properly followed. 9.2.1 Finding 2 There are some instances of mistakes made by THESL regarding application of certain regulatory accounting procedures. Although there might not be any impact on the DVA balances, future errors may result in incorrect accounting. 9.2.2 Basis for Finding Audit noted that there may be some instances of mistakes that were made by THESL regarding application of certain regulatory accounting procedures. Aside from the findings in Section 8 of this Report, Audit noted that THESL did not follow certain accounting procedures as set out in the APH, or did not use the USoAs correctly to report the DVA balances including:

20
• Charge type 142 on IESO invoices were not recorded in the cost of power expense account 4705;
• THESL used one expense account in the general ledger to record both RPP portion of GA and Non-RPP portion of GA; and
• Global adjustments variance was included in account 1588 power in 2012 RRR 2.1.7 and RRR 2.1.1 instead of in account 1589 Global adjustment.
Q12 of APH FAQs Oct 2009 FAQs requires that charge type 142 amount should be posted to Account 4705, Power Purchased. Q11 of APH FAQs October 2009 indicates that the RPP portion of global adjustment needs to be posted to Account 4705, Power Purchased, and the non-RPP portion of global adjustment be posted to Account 4705, Power Purchased, “Sub-account Global Adjustment.” Effective Jan 1, 2012, the Account 4705 sub-account Global adjustment became as the Account 4707 Charges – global Adjustment. APH revised version effective January 1, 2012 introduced a new account for global adjustment Account 1589, which was previously referred to as Account 1588 RSVA Power sub-account Global adjustment. Accordingly, the global adjustment variance is to be separately recorded and reported to the Board.
Although there might not be any impact on DVA balances as a result of THESL’s departure from the APH requirements, the THESL’s practice, as observed in this Audit, may not be consistent with the procedures required in the APH and related guidance. It may result in increased risk of incorrect accounting in the long run. 9.2.3 Area of Non-Conformity Requiring Action THESL’s application of certain accounting procedures is not consistent with the requirements set out in the APH. Moving forward, THESL should follow the accounting procedures as set out in the APH and related FAQs for its regulatory accounting. 9.2.4 Management Responses With respect to each of the bulleted findings above:
• THESL agrees that Charge Type 142 was not recorded in Cost of Power Account 4705. THESL’s USGAAP audited financial statements recognize Cost of Power (COP) expense based upon the IESO-invoiced monthly COP charges. THESL continues this accounting treatment under their regulatory reporting of COP expense. THESL acknowledges the APH and related FAQ’s require that Charge Type 142 should be included in Cost of Power Expense Account 4705.

21
• THESL’s internal general ledger accounts for financial reporting do not record both the RPP and non-RPP portion of Global Adjustment, as described by the Auditors. However, THESL does have records that allow the non-RPP and RPP portions to be posted to the appropriate Regulatory accounts (4707 and 4705 respectively), and THESL has done so.
• THESL acknowledged during the course of the Audit that amounts were recorded in error for the year end 2012 RRR 2.1.7 filing.
9.2.5 Management Action Plan THESL will correct its reporting where necessary before the end of April 2014, and endeavour to limit any future errors.

Toronto Hydro-Electric System Limited EB-2014-0116
Exhibit 9 Tab 1
Schedule 1 Appendix B ORIGINAL Page 1 of 3
NEW VARIANCE ACCOUNTS – DRAFT ACCOUNTING ORDER 1
2
1. EXTERNALLY INITIATED RELOCATES VARIANCE ACCOUNT – 3
DRAFT ACCOUNTING ORDER 4
Toronto Hydro has included in base distribution rates the revenue requirement associated 5
with $4.0 million of annual in-service amounts for work related to Externally Initiated 6
Relocates. Since expenditures under this program can be volatile and hard to predict, 7
Toronto Hydro will record to a Variance Account annually amounts for Externally 8
Initiated Relocates work that vary from the approved amount. For example, if Toronto 9
Hydro puts in service $10 million of Externally Initiated related capital in 2015, it will 10
record an amount of $6 million to the variance account. Carrying charges will apply 11
annually to the opening balances in the account (exclusive of accumulated interest) at the 12
OEB-approved rate for Deferral and Variance accounts. 13
14
At a later date, Toronto Hydro will apply to clear the Revenue Requirement 15
consequences of the balances in this account to ratepayers. The clearance of the balances 16
will be through a rate rider. 17
18
Toronto Hydro will establish the following Variance Accounts to record the amounts 19
described above: 20
• Account 1508, Other Regulatory Assets, Subaccount THESL Externally Initiated 21
Relocates Capital 22
• Account 1508, Other Regulatory Assets, Subaccount THESL Externally Initiated 23
Relocates Capital Carrying Charges 24
25
The sample accounting entries for the Variance Accounts are provided below. 26
27
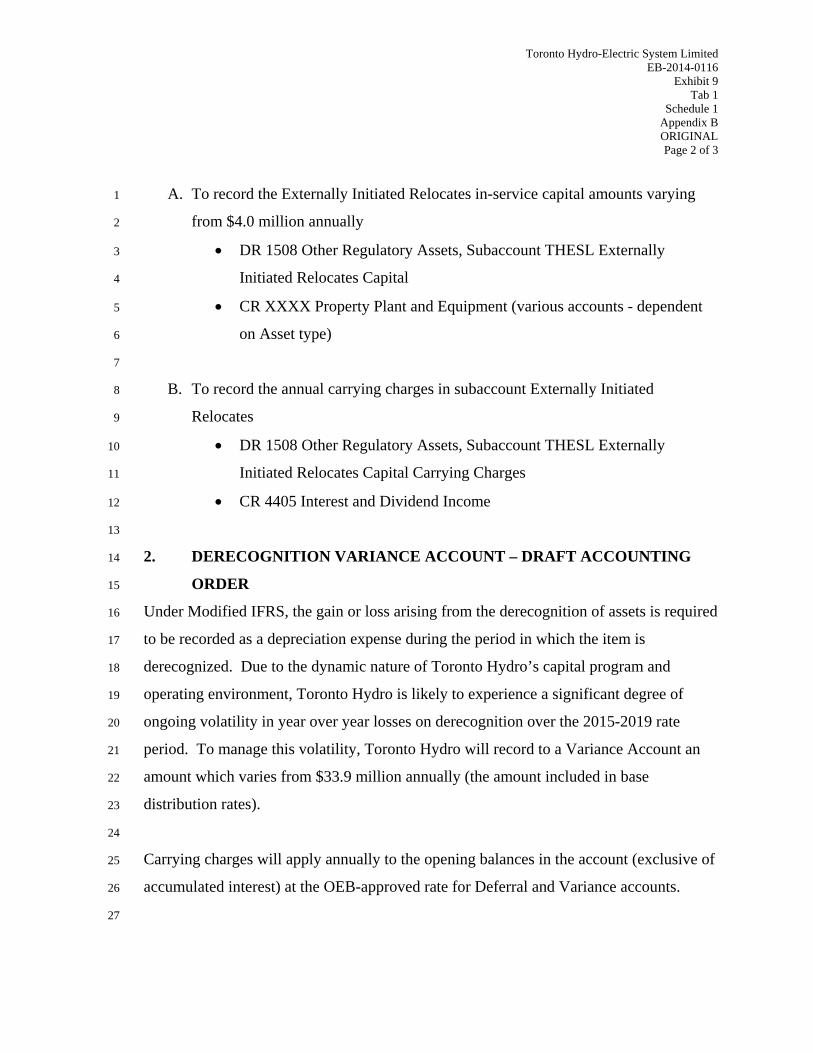
Toronto Hydro-Electric System Limited EB-2014-0116
Exhibit 9 Tab 1
Schedule 1 Appendix B ORIGINAL Page 2 of 3
A. To record the Externally Initiated Relocates in-service capital amounts varying 1
from $4.0 million annually 2
• DR 1508 Other Regulatory Assets, Subaccount THESL Externally 3
Initiated Relocates Capital 4
• CR XXXX Property Plant and Equipment (various accounts - dependent 5
on Asset type) 6
7
B. To record the annual carrying charges in subaccount Externally Initiated 8
Relocates 9
• DR 1508 Other Regulatory Assets, Subaccount THESL Externally 10
Initiated Relocates Capital Carrying Charges 11
• CR 4405 Interest and Dividend Income 12
13
2. DERECOGNITION VARIANCE ACCOUNT – DRAFT ACCOUNTING 14
ORDER 15
Under Modified IFRS, the gain or loss arising from the derecognition of assets is required 16
to be recorded as a depreciation expense during the period in which the item is 17
derecognized. Due to the dynamic nature of Toronto Hydro’s capital program and 18
operating environment, Toronto Hydro is likely to experience a significant degree of 19
ongoing volatility in year over year losses on derecognition over the 2015-2019 rate 20
period. To manage this volatility, Toronto Hydro will record to a Variance Account an 21
amount which varies from $33.9 million annually (the amount included in base 22
distribution rates). 23
24
Carrying charges will apply annually to the opening balances in the account (exclusive of 25
accumulated interest) at the OEB-approved rate for Deferral and Variance accounts. 26
27
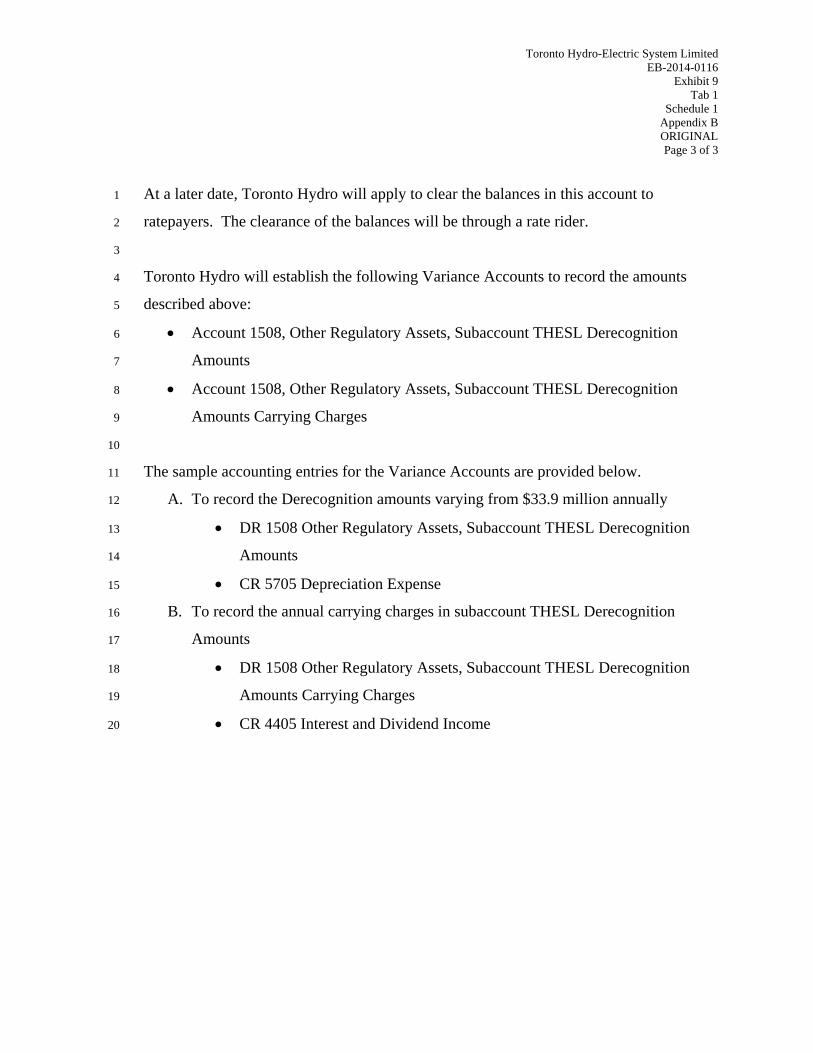
Toronto Hydro-Electric System Limited EB-2014-0116
Exhibit 9 Tab 1
Schedule 1 Appendix B ORIGINAL Page 3 of 3
At a later date, Toronto Hydro will apply to clear the balances in this account to 1
ratepayers. The clearance of the balances will be through a rate rider. 2
3
Toronto Hydro will establish the following Variance Accounts to record the amounts 4
described above: 5
• Account 1508, Other Regulatory Assets, Subaccount THESL Derecognition 6
Amounts 7
• Account 1508, Other Regulatory Assets, Subaccount THESL Derecognition 8
Amounts Carrying Charges 9
10
The sample accounting entries for the Variance Accounts are provided below. 11
A. To record the Derecognition amounts varying from $33.9 million annually 12
• DR 1508 Other Regulatory Assets, Subaccount THESL Derecognition 13
Amounts 14
• CR 5705 Depreciation Expense 15
B. To record the annual carrying charges in subaccount THESL Derecognition 16
Amounts 17
• DR 1508 Other Regulatory Assets, Subaccount THESL Derecognition 18
Amounts Carrying Charges 19
• CR 4405 Interest and Dividend Income 20
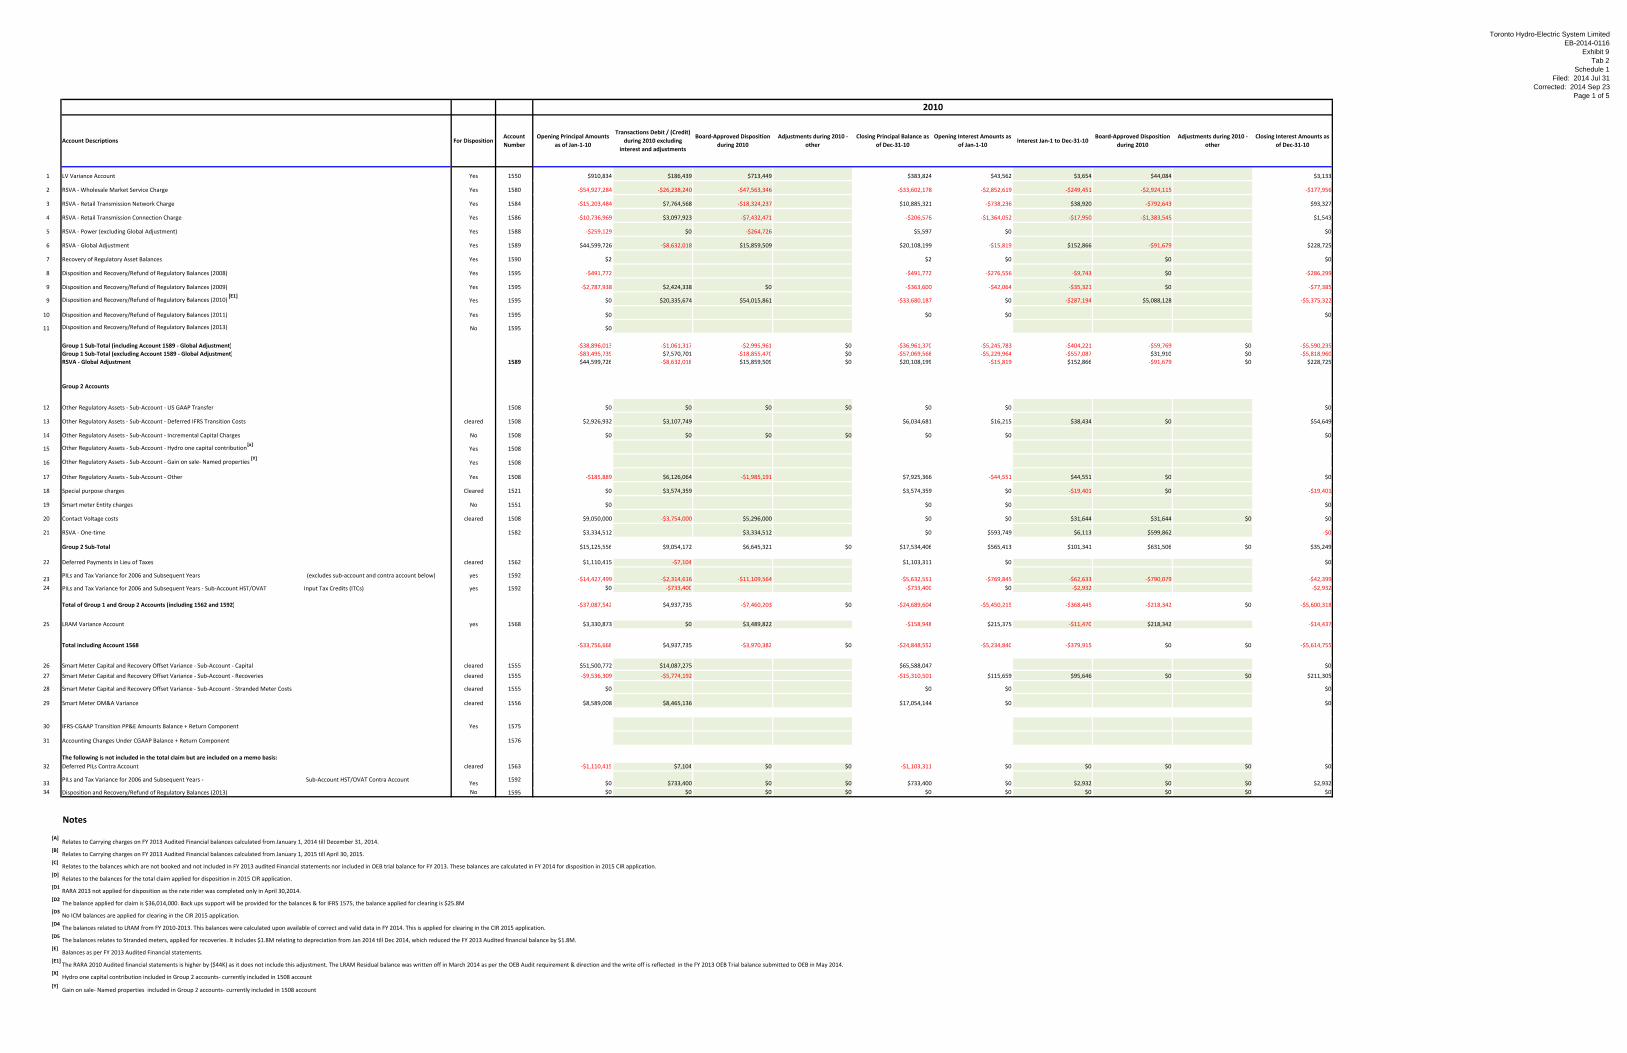
Toronto Hydro-Electric System LimitedEB-2014-0116
Exhibit 9Tab 2
Schedule 1Filed: 2014 Jul 31
Corrected: 2014 Sep 23Page 1 of 5
1 LV Variance Account Yes 1550 $910,834 $186,439 $713,449 $383,824 $43,562 $3,654 $44,084 $3,133
2 RSVA ‐ Wholesale Market Service Charge Yes 1580 ‐$54,927,284 ‐$26,238,240 ‐$47,563,346 ‐$33,602,178 ‐$2,852,619 ‐$249,451 ‐$2,924,115 ‐$177,956
3 RSVA ‐ Retail Transmission Network Charge Yes 1584 ‐$15,203,484 $7,764,568 ‐$18,324,237 $10,885,321 ‐$738,236 $38,920 ‐$792,643 $93,327
4 RSVA ‐ Retail Transmission Connection Charge Yes 1586 ‐$10,736,969 $3,097,923 ‐$7,432,471 ‐$206,576 ‐$1,364,052 ‐$17,950 ‐$1,383,545 $1,543
5 RSVA ‐ Power (excluding Global Adjustment) Yes 1588 ‐$259,129 $0 ‐$264,726 $5,597 $0 $0
6 RSVA ‐ Global Adjustment Yes 1589 $44,599,726 ‐$8,632,018 $15,859,509 $20,108,199 ‐$15,819 $152,866 ‐$91,679 $228,725
7 Recovery of Regulatory Asset Balances Yes 1590 $2 $2 $0 $0 $0
8 Disposition and Recovery/Refund of Regulatory Balances (2008) Yes 1595 ‐$491,772 ‐$491,772 ‐$276,556 ‐$9,743 $0 ‐$286,299
9 Disposition and Recovery/Refund of Regulatory Balances (2009) Yes 1595 ‐$2,787,938 $2,424,338 $0 ‐$363,600 ‐$42,064 ‐$35,321 $0 ‐$77,385
9 Disposition and Recovery/Refund of Regulatory Balances (2010) [E1]
Yes 1595 $0 $20,335,674 $54,015,861 ‐$33,680,187 $0 ‐$287,194 $5,088,128 ‐$5,375,322
10 Disposition and Recovery/Refund of Regulatory Balances (2011) Yes 1595 $0 $0 $0 $0
11 Disposition and Recovery/Refund of Regulatory Balances (2013) No 1595 $0
Group 1 Sub‐Total (including Account 1589 ‐ Global Adjustment) ‐$38,896,013 ‐$1,061,317 ‐$2,995,961 $0 ‐$36,961,370 ‐$5,245,783 ‐$404,221 ‐$59,769 $0 ‐$5,590,235Group 1 Sub‐Total (excluding Account 1589 ‐ Global Adjustment) ‐$83,495,739 $7,570,701 ‐$18,855,470 $0 ‐$57,069,568 ‐$5,229,964 ‐$557,087 $31,910 $0 ‐$5,818,960RSVA ‐ Global Adjustment 1589 $44,599,726 ‐$8,632,018 $15,859,509 $0 $20,108,199 ‐$15,819 $152,866 ‐$91,679 $0 $228,725
Group 2 Accounts
12 Other Regulatory Assets ‐ Sub‐Account ‐ US GAAP Transfer 1508 $0 $0 $0 $0 $0 $0 $0
13 Other Regulatory Assets ‐ Sub‐Account ‐ Deferred IFRS Transition Costs cleared 1508 $2,926,932 $3,107,749 $6,034,681 $16,215 $38,434 $0 $54,649
14 Other Regulatory Assets ‐ Sub‐Account ‐ Incremental Capital Charges No 1508 $0 $0 $0 $0 $0 $0 $0
15 Other Regulatory Assets ‐ Sub‐Account ‐ Hydro one capital contribution [x]
Yes 1508
16 Other Regulatory Assets ‐ Sub‐Account ‐ Gain on sale‐ Named properties [Y] Yes 1508
17 Other Regulatory Assets ‐ Sub‐Account ‐ Other Yes 1508 ‐$185,889 $6,126,064 ‐$1,985,191 $7,925,366 ‐$44,551 $44,551 $0 $0
18 Special purpose charges Cleared 1521 $0 $3,574,359 $3,574,359 $0 ‐$19,401 $0 ‐$19,401
19 Smart meter Entity charges No 1551 $0 $0 $0 $0
20 Contact Voltage costs cleared 1508 $9,050,000 ‐$3,754,000 $5,296,000 $0 $0 $31,644 $31,644 $0 $0
21 RSVA ‐ One‐time 1582 $3,334,512 $3,334,512 $0 $593,749 $6,113 $599,862 ‐$0
Group 2 Sub‐Total $15,125,556 $9,054,172 $6,645,321 $0 $17,534,406 $565,413 $101,341 $631,506 $0 $35,249
22 Deferred Payments in Lieu of Taxes cleared 1562 $1,110,415 ‐$7,104 $1,103,311 $0 $0
23PILs and Tax Variance for 2006 and Subsequent Years (excludes sub‐account and contra account below) yes 1592
‐$14,427,499 ‐$2,314,616 ‐$11,109,564 ‐$5,632,551 ‐$769,845 ‐$62,633 ‐$790,079 ‐$42,39924 PILs and Tax Variance for 2006 and Subsequent Years ‐ Sub‐Account HST/OVAT Input Tax Credits (ITCs) yes 1592 $0 ‐$733,400 ‐$733,400 $0 ‐$2,932 ‐$2,932
Total of Group 1 and Group 2 Accounts (including 1562 and 1592) ‐$37,087,542 $4,937,735 ‐$7,460,203 $0 ‐$24,689,604 ‐$5,450,215 ‐$368,445 ‐$218,342 $0 ‐$5,600,318
25 LRAM Variance Account yes 1568 $3,330,873 $0 $3,489,822 ‐$158,948 $215,375 ‐$11,470 $218,342 ‐$14,437
Total including Account 1568 ‐$33,756,668 $4,937,735 ‐$3,970,382 $0 ‐$24,848,552 ‐$5,234,840 ‐$379,915 $0 $0 ‐$5,614,755
26 Smart Meter Capital and Recovery Offset Variance ‐ Sub‐Account ‐ Capital cleared 1555 $51,500,772 $14,087,275 $65,588,047 $0
27 Smart Meter Capital and Recovery Offset Variance ‐ Sub‐Account ‐ Recoveries cleared 1555 ‐$9,536,309 ‐$5,774,192 ‐$15,310,501 $115,659 $95,646 $0 $0 $211,305
28 Smart Meter Capital and Recovery Offset Variance ‐ Sub‐Account ‐ Stranded Meter Costs cleared 1555 $0 $0 $0 $0
29 Smart Meter OM&A Variance cleared 1556 $8,589,008 $8,465,136 $17,054,144 $0 $0
30 IFRS‐CGAAP Transition PP&E Amounts Balance + Return Component Yes 1575
31 Accounting Changes Under CGAAP Balance + Return Component 1576
The following is not included in the total claim but are included on a memo basis:32 Deferred PILs Contra Account cleared 1563 ‐$1,110,415 $7,104 $0 $0 ‐$1,103,311 $0 $0 $0 $0 $0
33PILs and Tax Variance for 2006 and Subsequent Years ‐ Sub‐Account HST/OVAT Contra Account
Yes1592
$0 $733,400 $0 $0 $733,400 $0 $2,932 $0 $0 $2,93234 Disposition and Recovery/Refund of Regulatory Balances (2013) No 1595 $0 $0 $0 $0 $0 $0 $0 $0 $0 $0
Notes
[A]Relates to Carrying charges on FY 2013 Audited Financial balances calculated from January 1, 2014 till December 31, 2014.
[B]Relates to Carrying charges on FY 2013 Audited Financial balances calculated from January 1, 2015 till April 30, 2015.
[C]Relates to the balances which are not booked and not included in FY 2013 audited Financial statements nor included in OEB trial balance for FY 2013. These balances are calculated in FY 2014 for disposition in 2015 CIR application.
[D]Relates to the balances for the total claim applied for disposition in 2015 CIR application.
[D1]RARA 2013 not applied for disposition as the rate rider was completed only in April 30,2014.
[D2]The balance applied for claim is $36,014,000. Back ups support will be provided for the balances & for IFRS 1575, the balance applied for clearing is $25.8M
[D3]No ICM balances are applied for clearing in the CIR 2015 application.
[D4]The balances related to LRAM from FY 2010‐2013. This balances were calculated upon available of correct and valid data in FY 2014. This is applied for clearing in the CIR 2015 application.
[D5]The balances relates to Stranded meters, applied for recoveries. It includes $1.8M relating to depreciation from Jan 2014 till Dec 2014, which reduced the FY 2013 Audited financial balance by $1.8M.
[E]Balances as per FY 2013 Audited Financial statements.
[E1]The RARA 2010 Audited financial statements is higher by ($44K) as it does not include this adjustment. The LRAM Residual balance was written off in March 2014 as per the OEB Audit requirement & direction and the write off is reflected in the FY 2013 OEB Trial balance submitted to OEB in May 2014.
[X]Hydro one capital contribution included in Group 2 accounts‐ currently included in 1508 account
[Y]Gain on sale‐ Named properties included in Group 2 accounts‐ currently included in 1508 account
Interest Jan‐1 to Dec‐31‐10Board‐Approved Disposition
during 2010Adjustments during 2010 ‐
other Closing Interest Amounts as
of Dec‐31‐10Opening Principal Amounts
as of Jan‐1‐10
Transactions Debit / (Credit) during 2010 excluding
interest and adjustments
Board‐Approved Disposition during 2010
Adjustments during 2010 ‐ other
Closing Principal Balance as of Dec‐31‐10
Opening Interest Amounts as of Jan‐1‐10
Account Descriptions For DispositionAccount Number
2010

Toronto Hydro-Electric System LimitedEB-2014-0116
Exhibit 9Tab 2
Schedule 1Filed: 2014 Jul 31
Corrected: 2014 Sep 23Page 2 of 5
LV Variance Account Yes 1550
RSVA ‐ Wholesale Market Service Charge Yes 1580
RSVA ‐ Retail Transmission Network Charge Yes 1584
RSVA ‐ Retail Transmission Connection Charge Yes 1586
RSVA ‐ Power (excluding Global Adjustment) Yes 1588
RSVA ‐ Global Adjustment Yes 1589
Recovery of Regulatory Asset Balances Yes 1590
Disposition and Recovery/Refund of Regulatory Balances (2008) Yes 1595
Disposition and Recovery/Refund of Regulatory Balances (2009) Yes 1595
Disposition and Recovery/Refund of Regulatory Balances (2010) [E1]
Yes 1595
Disposition and Recovery/Refund of Regulatory Balances (2011) Yes 1595
Disposition and Recovery/Refund of Regulatory Balances (2013) No 1595
Group 1 Sub‐Total (including Account 1589 ‐ Global Adjustment)Group 1 Sub‐Total (excluding Account 1589 ‐ Global Adjustment)RSVA ‐ Global Adjustment 1589
Group 2 Accounts
Other Regulatory Assets ‐ Sub‐Account ‐ US GAAP Transfer 1508
Other Regulatory Assets ‐ Sub‐Account ‐ Deferred IFRS Transition Costs cleared 1508
Other Regulatory Assets ‐ Sub‐Account ‐ Incremental Capital Charges No 1508
Other Regulatory Assets ‐ Sub‐Account ‐ Hydro one capital contribution [x]
Yes 1508
Other Regulatory Assets ‐ Sub‐Account ‐ Gain on sale‐ Named properties [Y] Yes 1508
Other Regulatory Assets ‐ Sub‐Account ‐ Other Yes 1508
Special purpose charges Cleared 1521
Smart meter Entity charges No 1551
Contact Voltage costs cleared 1508
RSVA ‐ One‐time 1582
Group 2 Sub‐Total
Deferred Payments in Lieu of Taxes cleared 1562
PILs and Tax Variance for 2006 and Subsequent Years (excludes sub‐account and contra account below) yes 1592
PILs and Tax Variance for 2006 and Subsequent Years ‐ Sub‐Account HST/OVAT Input Tax Credits (ITCs) yes 1592
Total of Group 1 and Group 2 Accounts (including 1562 and 1592)
LRAM Variance Account yes 1568
Total including Account 1568
Smart Meter Capital and Recovery Offset Variance ‐ Sub‐Account ‐ Capital cleared 1555
Smart Meter Capital and Recovery Offset Variance ‐ Sub‐Account ‐ Recoveries cleared 1555
Smart Meter Capital and Recovery Offset Variance ‐ Sub‐Account ‐ Stranded Meter Costs cleared 1555
Smart Meter OM&A Variance cleared 1556
IFRS‐CGAAP Transition PP&E Amounts Balance + Return Component Yes 1575
Accounting Changes Under CGAAP Balance + Return Component 1576
The following is not included in the total claim but are included on a memo basis:Deferred PILs Contra Account cleared 1563
PILs and Tax Variance for 2006 and Subsequent Years ‐ Sub‐Account HST/OVAT Contra AccountYes
1592
Disposition and Recovery/Refund of Regulatory Balances (2013) No 1595
Notes
Relates to Carrying charges on FY 2013 Audited Financial balances calculated from January 1, 2014 till December 31, 2014.
Relates to Carrying charges on FY 2013 Audited Financial balances calculated from January 1, 2015 till April 30, 2015.
Relates to the balances which are not booked and not included in FY 2013 audited Financial statements nor included in OEB trial balance for FY 2013. These balances are calculated in
Relates to the balances for the total claim applied for disposition in 2015 CIR application.
RARA 2013 not applied for disposition as the rate rider was completed only in April 30,2014.
The balance applied for claim is $36,014,000. Back ups support will be provided for the balances & for IFRS 1575, the balance applied for clearing is $25.8M
No ICM balances are applied for clearing in the CIR 2015 application.
The balances related to LRAM from FY 2010‐2013. This balances were calculated upon available of correct and valid data in FY 2014. This is applied for clearing in the CIR 2015 applica
The balances relates to Stranded meters, applied for recoveries. It includes $1.8M relating to depreciation from Jan 2014 till Dec 2014, which reduced the FY 2013 Audited financial ba
Balances as per FY 2013 Audited Financial statements.
The RARA 2010 Audited financial statements is higher by ($44K) as it does not include this adjustment. The LRAM Residual balance was written off in March 2014 as per the OEB Audit
Hydro one capital contribution included in Group 2 accounts‐ currently included in 1508 account
Gain on sale‐ Named properties included in Group 2 accounts‐ currently included in 1508 account
Account Descriptions For DispositionAccount Number
$383,824 $265,712 $197,386 $452,150 $3,133 $6,020 $4,053 $5,100
‐$33,602,178 ‐$25,238,928 ‐$7,363,938 ‐$51,477,169 ‐$177,956 ‐$612,311 ‐$137,577 ‐$652,689
$10,885,321 $9,970,020 $3,120,753 $17,734,587 $93,327 $225,583 $72,499 $246,411
‐$206,576 $6,613,902 ‐$3,304,499 $9,711,825 $1,543 $71,215 ‐$48,830 $121,588
$5,597 $0 $5,597 $0 $0
$20,108,199 $17,222,415 $0 $37,330,613 $228,725 $412,110 $0 $640,835
$2 ‐$2 $0 $0 $0
‐$491,772 ‐$491,772 $0 ‐$286,299 ‐$10,477 ‐$296,776 $0
‐$363,600 $0 $0 ‐$363,600 ‐$77,385 ‐$60,188 ‐$137,573
‐$33,680,187 $31,838,451 $0 ‐$1,841,736 ‐$5,375,322 ‐$569,923 ‐$5,945,245
$0 $2,351,771 $2,351,771 $0 ‐$425,133 ‐$425,133
$0
‐$36,961,370 $43,023,339 ‐$7,842,070 $0 $13,904,039 ‐$5,590,235 ‐$963,103 ‐$406,631 $0 ‐$6,146,707‐$57,069,568 $25,800,924 ‐$7,842,070 $0 ‐$23,426,574 ‐$5,818,960 ‐$1,375,213 ‐$406,631 $0 ‐$6,787,542$20,108,199 $17,222,415 $0 $0 $37,330,613 $228,725 $412,110 $0 $0 $640,835
$0 $0 $0 $0
$6,034,681 ‐$3,017,341 $3,017,341 $0 $54,649 ‐$21,990 $32,659 $0
$0 $0 $0 $0
$7,925,366 ‐$224,412 $7,525,588 $175,366 ‐$44,551 $44,551 $0
$3,574,359 ‐$3,050,473 $523,886 ‐$19,401 $67,502 $48,101
$0 $0 $0 $0
$0 $0 $0 $0
$0 $0 ‐$0 ‐$0
$17,534,406 ‐$6,292,225 $10,542,929 $0 $699,252 ‐$9,302 $90,063 $32,659 $0 $48,101
$1,103,311 ‐$3,882,685 ‐$2,779,374 $0 $0
‐$5,632,551 $0 ‐$3,317,935 ‐$2,314,616 ‐$769,845 $664,971 ‐$55,042 ‐$49,832‐$733,400 ‐$366,600 ‐$1,100,000 ‐$2,932 ‐$15,046 ‐$17,979
‐$24,689,604 $32,481,829 ‐$617,075 $0 $8,409,301 ‐$6,372,315 ‐$223,116 ‐$429,013 $0 ‐$6,166,417
‐$158,948 $1,333,086 $1,174,138 ‐$14,437 $49,453 $35,016
‐$24,848,552 $33,814,915 ‐$617,075 $0 $9,583,438 ‐$6,386,752 ‐$173,663 ‐$429,013 $0 ‐$6,131,401
$65,588,047 ‐$6,361,404 $59,226,643 $0 $0
‐$15,310,501 ‐$5,866,196 ‐$21,176,697 $211,305 $59,581 $270,886
$0 $0 $0 $0
$17,054,144 $5,871,405 $22,925,549 $0 $0
‐$1,103,311 $3,882,685 $0 $0 $2,779,374 $0 $0 $0 $0 $0
$733,400 $366,600 $0 $0 $1,100,000 $2,932 $15,046 $0 $0 $17,979$0 $0 $0 $0 $0 $0 $0 $0 $0 $0
Adjustments during 2011 ‐ other
Closing Interest Amounts as of Dec‐31‐11
Board‐Approved Disposition during 2011
Adjustments during 2011 ‐ other
Closing Principal Balance as of Dec‐31‐11
Opening Interest Amounts as of Jan‐1‐11
Interest Jan‐1 to Dec‐31‐11Board‐Approved Disposition
during 2011Opening Principal Amounts
as of Jan‐1‐11
Transactions Debit / (Credit) during 2011 excluding
interest and adjustments
2011

Toronto Hydro-Electric System LimitedEB-2014-0116
Exhibit 9Tab 2
Schedule 1Filed: 2014 Jul 31
Corrected: 2014 Sep 23Page 3 of 5
LV Variance Account Yes 1550
RSVA ‐ Wholesale Market Service Charge Yes 1580
RSVA ‐ Retail Transmission Network Charge Yes 1584
RSVA ‐ Retail Transmission Connection Charge Yes 1586
RSVA ‐ Power (excluding Global Adjustment) Yes 1588
RSVA ‐ Global Adjustment Yes 1589
Recovery of Regulatory Asset Balances Yes 1590
Disposition and Recovery/Refund of Regulatory Balances (2008) Yes 1595
Disposition and Recovery/Refund of Regulatory Balances (2009) Yes 1595
Disposition and Recovery/Refund of Regulatory Balances (2010) [E1]
Yes 1595
Disposition and Recovery/Refund of Regulatory Balances (2011) Yes 1595
Disposition and Recovery/Refund of Regulatory Balances (2013) No 1595
Group 1 Sub‐Total (including Account 1589 ‐ Global Adjustment)Group 1 Sub‐Total (excluding Account 1589 ‐ Global Adjustment)RSVA ‐ Global Adjustment 1589
Group 2 Accounts
Other Regulatory Assets ‐ Sub‐Account ‐ US GAAP Transfer 1508
Other Regulatory Assets ‐ Sub‐Account ‐ Deferred IFRS Transition Costs cleared 1508
Other Regulatory Assets ‐ Sub‐Account ‐ Incremental Capital Charges No 1508
Other Regulatory Assets ‐ Sub‐Account ‐ Hydro one capital contribution [x]
Yes 1508
Other Regulatory Assets ‐ Sub‐Account ‐ Gain on sale‐ Named properties [Y] Yes 1508
Other Regulatory Assets ‐ Sub‐Account ‐ Other Yes 1508
Special purpose charges Cleared 1521
Smart meter Entity charges No 1551
Contact Voltage costs cleared 1508
RSVA ‐ One‐time 1582
Group 2 Sub‐Total
Deferred Payments in Lieu of Taxes cleared 1562
PILs and Tax Variance for 2006 and Subsequent Years (excludes sub‐account and contra account below) yes 1592
PILs and Tax Variance for 2006 and Subsequent Years ‐ Sub‐Account HST/OVAT Input Tax Credits (ITCs) yes 1592
Total of Group 1 and Group 2 Accounts (including 1562 and 1592)
LRAM Variance Account yes 1568
Total including Account 1568
Smart Meter Capital and Recovery Offset Variance ‐ Sub‐Account ‐ Capital cleared 1555
Smart Meter Capital and Recovery Offset Variance ‐ Sub‐Account ‐ Recoveries cleared 1555
Smart Meter Capital and Recovery Offset Variance ‐ Sub‐Account ‐ Stranded Meter Costs cleared 1555
Smart Meter OM&A Variance cleared 1556
IFRS‐CGAAP Transition PP&E Amounts Balance + Return Component Yes 1575
Accounting Changes Under CGAAP Balance + Return Component 1576
The following is not included in the total claim but are included on a memo basis:Deferred PILs Contra Account cleared 1563
PILs and Tax Variance for 2006 and Subsequent Years ‐ Sub‐Account HST/OVAT Contra AccountYes
1592
Disposition and Recovery/Refund of Regulatory Balances (2013) No 1595
Notes
Relates to Carrying charges on FY 2013 Audited Financial balances calculated from January 1, 2014 till December 31, 2014.
Relates to Carrying charges on FY 2013 Audited Financial balances calculated from January 1, 2015 till April 30, 2015.
Relates to the balances which are not booked and not included in FY 2013 audited Financial statements nor included in OEB trial balance for FY 2013. These balances are calculated in
Relates to the balances for the total claim applied for disposition in 2015 CIR application.
RARA 2013 not applied for disposition as the rate rider was completed only in April 30,2014.
The balance applied for claim is $36,014,000. Back ups support will be provided for the balances & for IFRS 1575, the balance applied for clearing is $25.8M
No ICM balances are applied for clearing in the CIR 2015 application.
The balances related to LRAM from FY 2010‐2013. This balances were calculated upon available of correct and valid data in FY 2014. This is applied for clearing in the CIR 2015 applica
The balances relates to Stranded meters, applied for recoveries. It includes $1.8M relating to depreciation from Jan 2014 till Dec 2014, which reduced the FY 2013 Audited financial ba
Balances as per FY 2013 Audited Financial statements.
The RARA 2010 Audited financial statements is higher by ($44K) as it does not include this adjustment. The LRAM Residual balance was written off in March 2014 as per the OEB Audit
Hydro one capital contribution included in Group 2 accounts‐ currently included in 1508 account
Gain on sale‐ Named properties included in Group 2 accounts‐ currently included in 1508 account
Account Descriptions For DispositionAccount Number
$452,150 $307,684 $759,834 $5,100 $8,732 $13,832
‐$51,477,169 ‐$31,437,375 ‐$82,914,543 ‐$652,689 ‐$951,994 ‐$1,604,683
$17,734,587 $18,283,517 $36,018,105 $246,411 $380,494 $626,905
$9,711,825 $8,440,748 $18,152,573 $121,588 $202,604 $324,191
$5,597 $0 $5,597 $0 $0
$37,330,613 ‐$8,834,554 $28,496,060 $640,835 $551,874 $1,192,708
$0 $0 $0 $0 $0
$0 $0 $0 $0 $0
‐$363,600 $0 ‐$363,600 ‐$137,573 ‐$60,188 ‐$197,761
‐$1,841,736 $2,082,389 $240,653 ‐$5,945,245 $7,441,810 $1,496,565
$2,351,771 ‐$792,427 $1,559,344 ‐$425,133 $156,110 ‐$269,023
$13,904,039 ‐$11,950,017 $0 $0 $0 $0 $0 $1,954,022 ‐$6,146,707 $7,729,441 $0 $0 $1,582,734‐$23,426,574 ‐$3,115,463 $0 $0 $0 $0 $0 ‐$26,542,037 ‐$6,787,542 $7,177,568 $0 $0 $390,026$37,330,613 ‐$8,834,554 $0 $0 $0 $0 $0 $28,496,060 $640,835 $551,874 $0 $0 $1,192,708
$0 $61,499,000 $61,499,000 $0 $0
$0 $0 $0 $0
$0 $0 $0 $0
$175,366 $175,366 $0 $0
$523,886 $523,886 $48,101 $7,701 $55,802
$0 $0 $0 $0
$0 $0 $0 $0
$0 $0 $0 ‐$0 ‐$0
$699,252 $61,499,000 $0 $0 $0 $0 $0 $62,198,252 $48,101 $7,701 $0 $0 $55,802
‐$2,779,374 ‐$4,269,014 ‐$7,048,388 $0 $0
‐$2,314,616 $0 ‐$2,314,616 ‐$49,832 ‐$34,020 ‐$83,852‐$1,100,000 $0 ‐$1,100,000 ‐$17,979 ‐$16,169 ‐$34,148
$8,409,301 $45,279,969 $0 $0 $0 $0 $0 $53,689,270 ‐$6,166,417 $7,686,953 $0 $0 $1,520,536
$1,174,138 ‐$1,174,138 $0 $35,016 ‐$35,016 $0
$9,583,438 $44,105,832 $0 $0 $0 $0 $0 $53,689,270 ‐$6,131,401 $7,651,938 $0 $0 $1,520,536
$59,226,643 $0 $59,226,643 $0 $0
‐$21,176,697 ‐$5,901,869 ‐$27,078,565 $270,886 $79,382 $350,269
$0 $0 $0 $0 $0
$22,925,549 $0 $22,925,549 $0 $0
$0 $0 $0
$0 $0 $0
$2,779,374 $4,269,014 $0 $0 $0 $0 $0 $7,048,388 $0 $0 $0 $0 $0
$1,100,000 $0 $0 $0 $0 $0 $0 $1,100,000 $17,979 $16,169 $0 $0 $34,148$0 $0 $0 $0 $0 $0 $0 $0 $0 $0 $0 $0 $0
Board‐Approved Disposition during 2012
Adjustments during 2012 ‐ other
Closing Interest Amounts as of Dec‐31‐12
Other 2 Adjustments during Q2 2012
Other 2 Adjustments during Q3 2012
Other 2 Adjustments during Q4 2012
Closing Principal Balance as of Dec‐31‐12
Opening Interest Amounts as of Jan‐1‐12
Interest Jan‐1 to Dec‐31‐12Opening Principal Amounts
as of Jan‐1‐12
Transactions Debit / (Credit) during 2012 excluding
interest and adjustments
Board‐Approved Disposition during 2012
Other 2 Adjustments during Q1 2012
2012
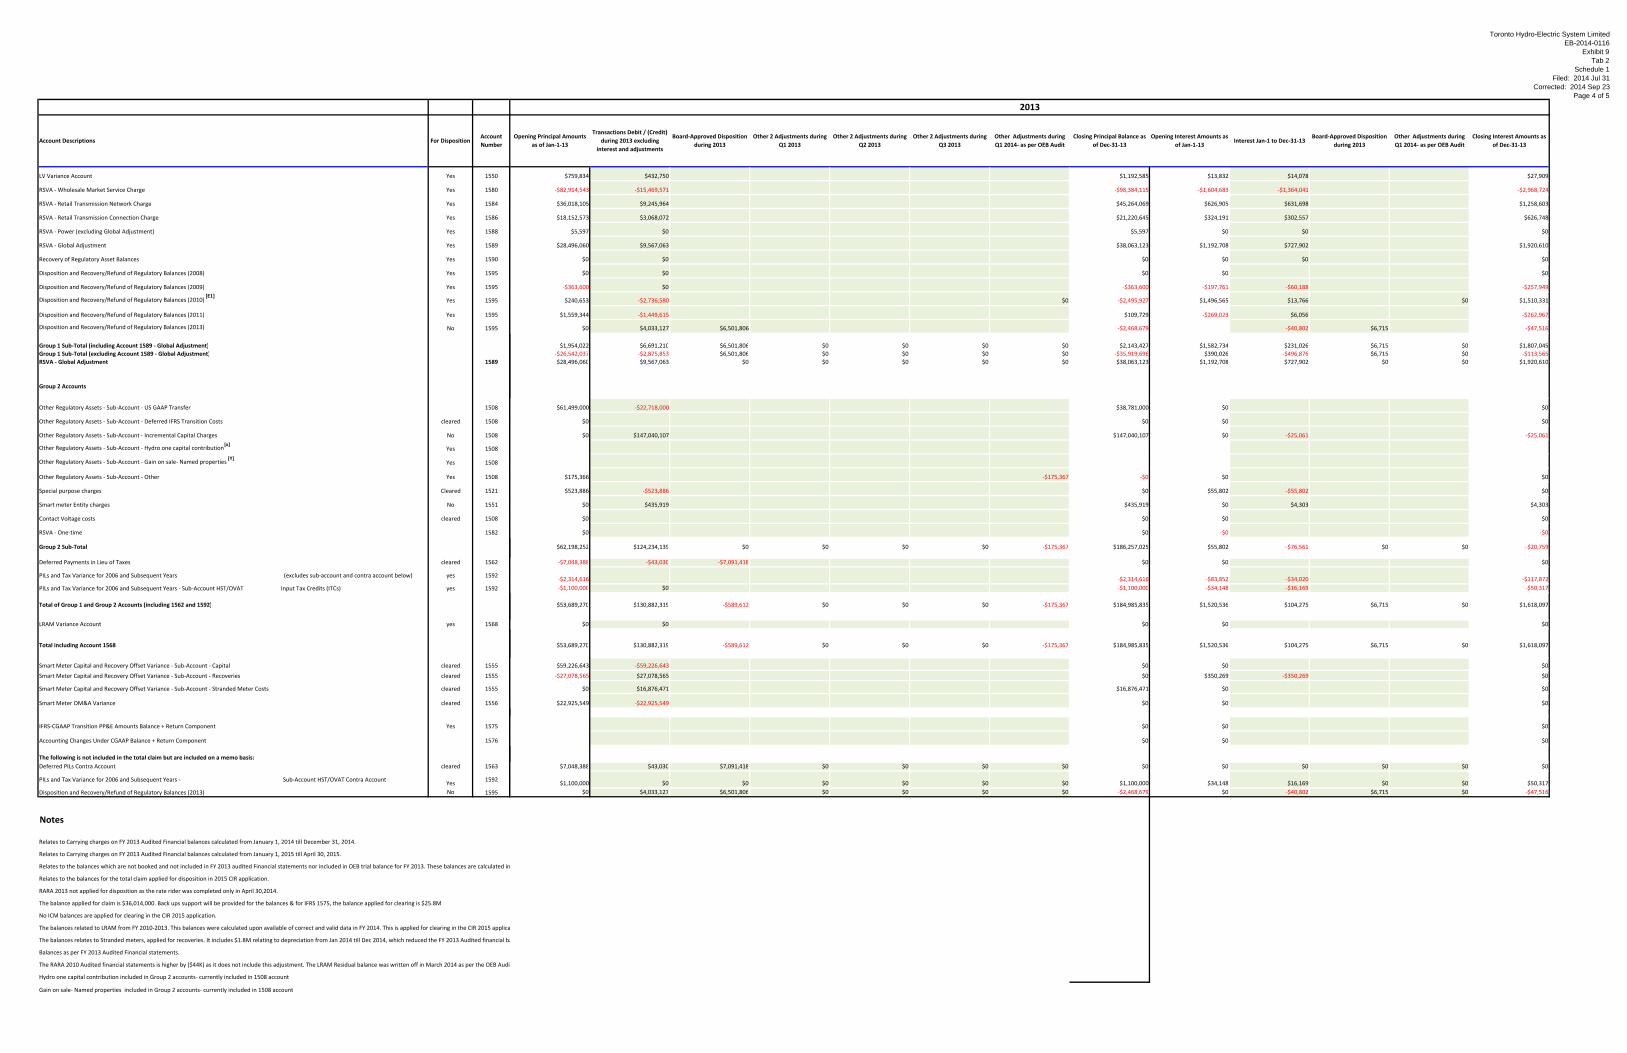
Toronto Hydro-Electric System LimitedEB-2014-0116
Exhibit 9Tab 2
Schedule 1Filed: 2014 Jul 31
Corrected: 2014 Sep 23Page 4 of 5
LV Variance Account Yes 1550
RSVA ‐ Wholesale Market Service Charge Yes 1580
RSVA ‐ Retail Transmission Network Charge Yes 1584
RSVA ‐ Retail Transmission Connection Charge Yes 1586
RSVA ‐ Power (excluding Global Adjustment) Yes 1588
RSVA ‐ Global Adjustment Yes 1589
Recovery of Regulatory Asset Balances Yes 1590
Disposition and Recovery/Refund of Regulatory Balances (2008) Yes 1595
Disposition and Recovery/Refund of Regulatory Balances (2009) Yes 1595
Disposition and Recovery/Refund of Regulatory Balances (2010) [E1]
Yes 1595
Disposition and Recovery/Refund of Regulatory Balances (2011) Yes 1595
Disposition and Recovery/Refund of Regulatory Balances (2013) No 1595
Group 1 Sub‐Total (including Account 1589 ‐ Global Adjustment)Group 1 Sub‐Total (excluding Account 1589 ‐ Global Adjustment)RSVA ‐ Global Adjustment 1589
Group 2 Accounts
Other Regulatory Assets ‐ Sub‐Account ‐ US GAAP Transfer 1508
Other Regulatory Assets ‐ Sub‐Account ‐ Deferred IFRS Transition Costs cleared 1508
Other Regulatory Assets ‐ Sub‐Account ‐ Incremental Capital Charges No 1508
Other Regulatory Assets ‐ Sub‐Account ‐ Hydro one capital contribution [x]
Yes 1508
Other Regulatory Assets ‐ Sub‐Account ‐ Gain on sale‐ Named properties [Y] Yes 1508
Other Regulatory Assets ‐ Sub‐Account ‐ Other Yes 1508
Special purpose charges Cleared 1521
Smart meter Entity charges No 1551
Contact Voltage costs cleared 1508
RSVA ‐ One‐time 1582
Group 2 Sub‐Total
Deferred Payments in Lieu of Taxes cleared 1562
PILs and Tax Variance for 2006 and Subsequent Years (excludes sub‐account and contra account below) yes 1592
PILs and Tax Variance for 2006 and Subsequent Years ‐ Sub‐Account HST/OVAT Input Tax Credits (ITCs) yes 1592
Total of Group 1 and Group 2 Accounts (including 1562 and 1592)
LRAM Variance Account yes 1568
Total including Account 1568
Smart Meter Capital and Recovery Offset Variance ‐ Sub‐Account ‐ Capital cleared 1555
Smart Meter Capital and Recovery Offset Variance ‐ Sub‐Account ‐ Recoveries cleared 1555
Smart Meter Capital and Recovery Offset Variance ‐ Sub‐Account ‐ Stranded Meter Costs cleared 1555
Smart Meter OM&A Variance cleared 1556
IFRS‐CGAAP Transition PP&E Amounts Balance + Return Component Yes 1575
Accounting Changes Under CGAAP Balance + Return Component 1576
The following is not included in the total claim but are included on a memo basis:Deferred PILs Contra Account cleared 1563
PILs and Tax Variance for 2006 and Subsequent Years ‐ Sub‐Account HST/OVAT Contra AccountYes
1592
Disposition and Recovery/Refund of Regulatory Balances (2013) No 1595
Notes
Relates to Carrying charges on FY 2013 Audited Financial balances calculated from January 1, 2014 till December 31, 2014.
Relates to Carrying charges on FY 2013 Audited Financial balances calculated from January 1, 2015 till April 30, 2015.
Relates to the balances which are not booked and not included in FY 2013 audited Financial statements nor included in OEB trial balance for FY 2013. These balances are calculated in
Relates to the balances for the total claim applied for disposition in 2015 CIR application.
RARA 2013 not applied for disposition as the rate rider was completed only in April 30,2014.
The balance applied for claim is $36,014,000. Back ups support will be provided for the balances & for IFRS 1575, the balance applied for clearing is $25.8M
No ICM balances are applied for clearing in the CIR 2015 application.
The balances related to LRAM from FY 2010‐2013. This balances were calculated upon available of correct and valid data in FY 2014. This is applied for clearing in the CIR 2015 applica
The balances relates to Stranded meters, applied for recoveries. It includes $1.8M relating to depreciation from Jan 2014 till Dec 2014, which reduced the FY 2013 Audited financial ba
Balances as per FY 2013 Audited Financial statements.
The RARA 2010 Audited financial statements is higher by ($44K) as it does not include this adjustment. The LRAM Residual balance was written off in March 2014 as per the OEB Audit
Hydro one capital contribution included in Group 2 accounts‐ currently included in 1508 account
Gain on sale‐ Named properties included in Group 2 accounts‐ currently included in 1508 account
Account Descriptions For DispositionAccount Number
$759,834 $432,750 $1,192,585 $13,832 $14,078 $27,909
‐$82,914,543 ‐$15,469,571 ‐$98,384,115 ‐$1,604,683 ‐$1,364,041 ‐$2,968,724
$36,018,105 $9,245,964 $45,264,069 $626,905 $631,698 $1,258,603
$18,152,573 $3,068,072 $21,220,645 $324,191 $302,557 $626,748
$5,597 $0 $5,597 $0 $0 $0
$28,496,060 $9,567,063 $38,063,123 $1,192,708 $727,902 $1,920,610
$0 $0 $0 $0 $0 $0
$0 $0 $0 $0 $0
‐$363,600 $0 ‐$363,600 ‐$197,761 ‐$60,188 ‐$257,949
$240,653 ‐$2,736,580 $0 ‐$2,495,927 $1,496,565 $13,766 $0 $1,510,331
$1,559,344 ‐$1,449,615 $109,729 ‐$269,023 $6,056 ‐$262,967
$0 $4,033,127 $6,501,806 ‐$2,468,679 ‐$40,802 $6,715 ‐$47,516
$1,954,022 $6,691,210 $6,501,806 $0 $0 $0 $0 $2,143,427 $1,582,734 $231,026 $6,715 $0 $1,807,045‐$26,542,037 ‐$2,875,853 $6,501,806 $0 $0 $0 $0 ‐$35,919,696 $390,026 ‐$496,876 $6,715 $0 ‐$113,565$28,496,060 $9,567,063 $0 $0 $0 $0 $0 $38,063,123 $1,192,708 $727,902 $0 $0 $1,920,610
$61,499,000 ‐$22,718,000 $38,781,000 $0 $0
$0 $0 $0 $0
$0 $147,040,107 $147,040,107 $0 ‐$25,061 ‐$25,061
$175,366 ‐$175,367 ‐$0 $0 $0
$523,886 ‐$523,886 $0 $55,802 ‐$55,802 $0
$0 $435,919 $435,919 $0 $4,303 $4,303
$0 $0 $0 $0
$0 $0 ‐$0 ‐$0
$62,198,252 $124,234,139 $0 $0 $0 $0 ‐$175,367 $186,257,025 $55,802 ‐$76,561 $0 $0 ‐$20,759
‐$7,048,388 ‐$43,030 ‐$7,091,418 $0 $0 $0
‐$2,314,616 ‐$2,314,616 ‐$83,852 ‐$34,020 ‐$117,872‐$1,100,000 $0 ‐$1,100,000 ‐$34,148 ‐$16,169 ‐$50,317
$53,689,270 $130,882,319 ‐$589,612 $0 $0 $0 ‐$175,367 $184,985,835 $1,520,536 $104,275 $6,715 $0 $1,618,097
$0 $0 $0 $0 $0
$53,689,270 $130,882,319 ‐$589,612 $0 $0 $0 ‐$175,367 $184,985,835 $1,520,536 $104,275 $6,715 $0 $1,618,097
$59,226,643 ‐$59,226,643 $0 $0 $0
‐$27,078,565 $27,078,565 $0 $350,269 ‐$350,269 $0
$0 $16,876,471 $16,876,471 $0 $0
$22,925,549 ‐$22,925,549 $0 $0 $0
$0 $0 $0
$0 $0 $0
$7,048,388 $43,030 $7,091,418 $0 $0 $0 $0 $0 $0 $0 $0 $0 $0
$1,100,000 $0 $0 $0 $0 $0 $0 $1,100,000 $34,148 $16,169 $0 $0 $50,317$0 $4,033,127 $6,501,806 $0 $0 $0 $0 ‐$2,468,679 $0 ‐$40,802 $6,715 $0 ‐$47,516
Other 2 Adjustments during Q1 2013
Other 2 Adjustments during Q2 2013
Other 2 Adjustments during Q3 2013
Other Adjustments during Q1 2014‐ as per OEB Audit
Closing Principal Balance as of Dec‐31‐13
Opening Interest Amounts as of Jan‐1‐13
Opening Principal Amounts as of Jan‐1‐13
Transactions Debit / (Credit) during 2013 excluding
interest and adjustments
Board‐Approved Disposition during 2013
Interest Jan‐1 to Dec‐31‐13Board‐Approved Disposition
during 2013Other Adjustments during Q1 2014‐ as per OEB Audit
Closing Interest Amounts as of Dec‐31‐13
2013
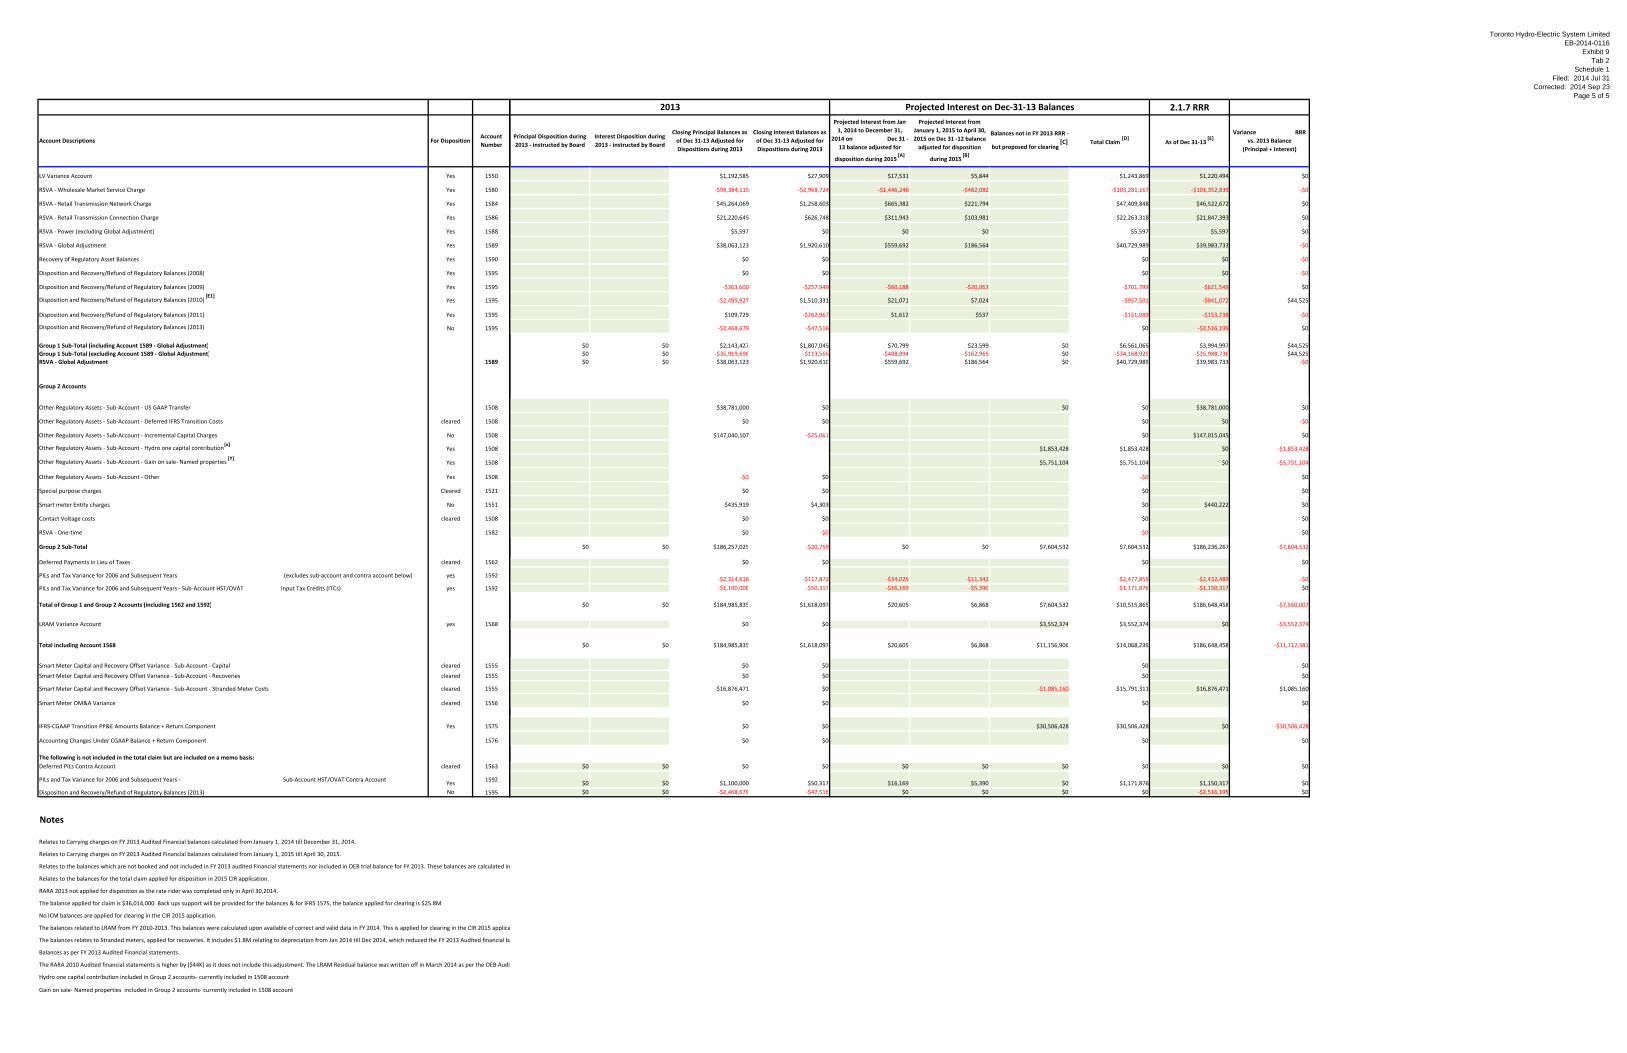
Toronto Hydro-Electric System LimitedEB-2014-0116
Exhibit 9Tab 2
Schedule 1Filed: 2014 Jul 31
Corrected: 2014 Sep 23Page 5 of 5
LV Variance Account Yes 1550
RSVA ‐ Wholesale Market Service Charge Yes 1580
RSVA ‐ Retail Transmission Network Charge Yes 1584
RSVA ‐ Retail Transmission Connection Charge Yes 1586
RSVA ‐ Power (excluding Global Adjustment) Yes 1588
RSVA ‐ Global Adjustment Yes 1589
Recovery of Regulatory Asset Balances Yes 1590
Disposition and Recovery/Refund of Regulatory Balances (2008) Yes 1595
Disposition and Recovery/Refund of Regulatory Balances (2009) Yes 1595
Disposition and Recovery/Refund of Regulatory Balances (2010) [E1]
Yes 1595
Disposition and Recovery/Refund of Regulatory Balances (2011) Yes 1595
Disposition and Recovery/Refund of Regulatory Balances (2013) No 1595
Group 1 Sub‐Total (including Account 1589 ‐ Global Adjustment)Group 1 Sub‐Total (excluding Account 1589 ‐ Global Adjustment)RSVA ‐ Global Adjustment 1589
Group 2 Accounts
Other Regulatory Assets ‐ Sub‐Account ‐ US GAAP Transfer 1508
Other Regulatory Assets ‐ Sub‐Account ‐ Deferred IFRS Transition Costs cleared 1508
Other Regulatory Assets ‐ Sub‐Account ‐ Incremental Capital Charges No 1508
Other Regulatory Assets ‐ Sub‐Account ‐ Hydro one capital contribution [x]
Yes 1508
Other Regulatory Assets ‐ Sub‐Account ‐ Gain on sale‐ Named properties [Y] Yes 1508
Other Regulatory Assets ‐ Sub‐Account ‐ Other Yes 1508
Special purpose charges Cleared 1521
Smart meter Entity charges No 1551
Contact Voltage costs cleared 1508
RSVA ‐ One‐time 1582
Group 2 Sub‐Total
Deferred Payments in Lieu of Taxes cleared 1562
PILs and Tax Variance for 2006 and Subsequent Years (excludes sub‐account and contra account below) yes 1592
PILs and Tax Variance for 2006 and Subsequent Years ‐ Sub‐Account HST/OVAT Input Tax Credits (ITCs) yes 1592
Total of Group 1 and Group 2 Accounts (including 1562 and 1592)
LRAM Variance Account yes 1568
Total including Account 1568
Smart Meter Capital and Recovery Offset Variance ‐ Sub‐Account ‐ Capital cleared 1555
Smart Meter Capital and Recovery Offset Variance ‐ Sub‐Account ‐ Recoveries cleared 1555
Smart Meter Capital and Recovery Offset Variance ‐ Sub‐Account ‐ Stranded Meter Costs cleared 1555
Smart Meter OM&A Variance cleared 1556
IFRS‐CGAAP Transition PP&E Amounts Balance + Return Component Yes 1575
Accounting Changes Under CGAAP Balance + Return Component 1576
The following is not included in the total claim but are included on a memo basis:Deferred PILs Contra Account cleared 1563
PILs and Tax Variance for 2006 and Subsequent Years ‐ Sub‐Account HST/OVAT Contra AccountYes
1592
Disposition and Recovery/Refund of Regulatory Balances (2013) No 1595
Notes
Relates to Carrying charges on FY 2013 Audited Financial balances calculated from January 1, 2014 till December 31, 2014.
Relates to Carrying charges on FY 2013 Audited Financial balances calculated from January 1, 2015 till April 30, 2015.
Relates to the balances which are not booked and not included in FY 2013 audited Financial statements nor included in OEB trial balance for FY 2013. These balances are calculated in
Relates to the balances for the total claim applied for disposition in 2015 CIR application.
RARA 2013 not applied for disposition as the rate rider was completed only in April 30,2014.
The balance applied for claim is $36,014,000. Back ups support will be provided for the balances & for IFRS 1575, the balance applied for clearing is $25.8M
No ICM balances are applied for clearing in the CIR 2015 application.
The balances related to LRAM from FY 2010‐2013. This balances were calculated upon available of correct and valid data in FY 2014. This is applied for clearing in the CIR 2015 applica
The balances relates to Stranded meters, applied for recoveries. It includes $1.8M relating to depreciation from Jan 2014 till Dec 2014, which reduced the FY 2013 Audited financial ba
Balances as per FY 2013 Audited Financial statements.
The RARA 2010 Audited financial statements is higher by ($44K) as it does not include this adjustment. The LRAM Residual balance was written off in March 2014 as per the OEB Audit
Hydro one capital contribution included in Group 2 accounts‐ currently included in 1508 account
Gain on sale‐ Named properties included in Group 2 accounts‐ currently included in 1508 account
Account Descriptions For DispositionAccount Number
2.1.7 RRR
$1,192,585 $27,909 $17,531 $5,844 $1,243,869 $1,220,494 $0
‐$98,384,115 ‐$2,968,724 ‐$1,446,246 ‐$482,082 ‐$103,281,167 ‐$101,352,839 ‐$0
$45,264,069 $1,258,603 $665,382 $221,794 $47,409,848 $46,522,672 $0
$21,220,645 $626,748 $311,943 $103,981 $22,263,318 $21,847,393 $0
$5,597 $0 $0 $0 $5,597 $5,597 $0
$38,063,123 $1,920,610 $559,692 $186,564 $40,729,989 $39,983,733 ‐$0
$0 $0 $0 $0 ‐$0
$0 $0 $0 $0 ‐$0
‐$363,600 ‐$257,949 ‐$60,188 ‐$20,063 ‐$701,799 ‐$621,549 $0
‐$2,495,927 $1,510,331 $21,071 $7,024 ‐$957,501 ‐$941,072 $44,525
$109,729 ‐$262,967 $1,612 $537 ‐$151,089 ‐$153,238 ‐$0
‐$2,468,679 ‐$47,516 $0 ‐$2,516,195 $0
$0 $0 $2,143,427 $1,807,045 $70,799 $23,599 $0 $6,561,065 $3,994,997 $44,525$0 $0 ‐$35,919,696 ‐$113,565 ‐$488,894 ‐$162,965 $0 ‐$34,168,925 ‐$35,988,736 $44,525$0 $0 $38,063,123 $1,920,610 $559,692 $186,564 $0 $40,729,989 $39,983,733 ‐$0
$38,781,000 $0 $0 $0 $38,781,000 $0
$0 $0 $0 $0 ‐$0
$147,040,107 ‐$25,061 $0 $147,015,045 $0
$1,853,428 $1,853,428 $0 ‐$1,853,428
$5,751,104 $5,751,104 $0 ‐$5,751,104
‐$0 $0 ‐$0 $0
$0 $0 $0 $0
$435,919 $4,303 $0 $440,222 $0
$0 $0 $0 $0
$0 ‐$0 ‐$0 $0
$0 $0 $186,257,025 ‐$20,759 $0 $0 $7,604,532 $7,604,532 $186,236,267 ‐$7,604,532
$0 $0 $0 $0
‐$2,314,616 ‐$117,872 ‐$34,025 ‐$11,342 ‐$2,477,855 ‐$2,432,489 ‐$0‐$1,100,000 ‐$50,317 ‐$16,169 ‐$5,390 ‐$1,171,876 ‐$1,150,317 $0
$0 $0 $184,985,835 $1,618,097 $20,605 $6,868 $7,604,532 $10,515,865 $186,648,458 ‐$7,560,007
$0 $0 $3,552,374 $3,552,374 $0 ‐$3,552,374
$0 $0 $184,985,835 $1,618,097 $20,605 $6,868 $11,156,906 $14,068,239 $186,648,458 ‐$11,112,381
$0 $0 $0 $0
$0 $0 $0 $0
$16,876,471 $0 ‐$1,085,160 $15,791,311 $16,876,471 $1,085,160
$0 $0 $0 $0
$0 $0 $30,506,428 $30,506,428 $0 ‐$30,506,428
$0 $0 $0 $0
$0 $0 $0 $0 $0 $0 $0 $0 $0 $0
$0 $0 $1,100,000 $50,317 $16,169 $5,390 $0 $1,171,876 $1,150,317 $0$0 $0 ‐$2,468,679 ‐$47,516 $0 $0 $0 $0 ‐$2,516,195 $0
As of Dec 31‐13 [E]
Variance RRR vs. 2013 Balance
(Principal + Interest)
Closing Principal Balances as of Dec 31‐13 Adjusted for Dispositions during 2013
Closing Interest Balances as of Dec 31‐13 Adjusted for Dispositions during 2013
Projected Interest from Jan 1, 2014 to December 31,
2014 on Dec 31 ‐13 balance adjusted for
disposition during 2015 [A]
Projected Interest from January 1, 2015 to April 30, 2015 on Dec 31 ‐12 balance adjusted for disposition
during 2015 [B]
Balances not in FY 2013 RRR ‐
but proposed for clearing [C] Total Claim
[D]Principal Disposition during 2013 ‐ instructed by Board
Interest Disposition during 2013 ‐ instructed by Board
2013 Projected Interest on Dec‐31‐13 Balances

Toronto Hydro‐Electric System LimitedEB‐2014‐0116
Exhibit 9Tab 2
Schedule 2ORIGINAL
Page 1 of 2December 31, 2013 ‐ Reconciliation of Sale of Electricity and Cost of Power Expense
Filing Requirement 2.12 ‐ Deferral and Variance Accounts
The sale of electricity and cost of power expense have been reconciled to the Audited Financial Statements
and the net profit is zero as shown in the tables below.
The IESO Global Adjustment charge is pro‐rated into the RPP and Non‐RPP portions.
Table 1: Sale of Electricity and Cost of Power Expense
USofADec 31 2013 RRR
($,000's)4006 Residential Energy Sales ‐419,259
4010 Commercial Energy Sales ‐1,248,557
4020 Energy Sales to Large Users ‐190,674
4025 Street Lighting Energy Sales ‐9,307
4035 General Energy Sales ‐190,062
4050 Revenue Adjustment ‐51,051
4062 Billed WMS ‐132,001
4066 Billed NW ‐175,389
4068 Billed CN ‐117,433
4075 Billed ‐ LV ‐433
Total Sale of Electricity Revenue ‐2,534,165
Board filing 2.1.13 Sale of Electricity ‐2,534,165
USofADec 31 2013 RRR
($,000's)4705 Power Purchased 1,225,4824707 Charges ‐ Global Adjustment 883,4284708 Charges‐WMS 132,0014714 Charges‐NW 175,3894716 Charges‐CN 117,4334750 Charges ‐ LV 433
Total Cost of Power Expense 2,534,165
Board filing 2.1.13 Cost of Power Expense 2,534,165
SALE OF ELECTRICITY
COST OF POWER EXPENSE
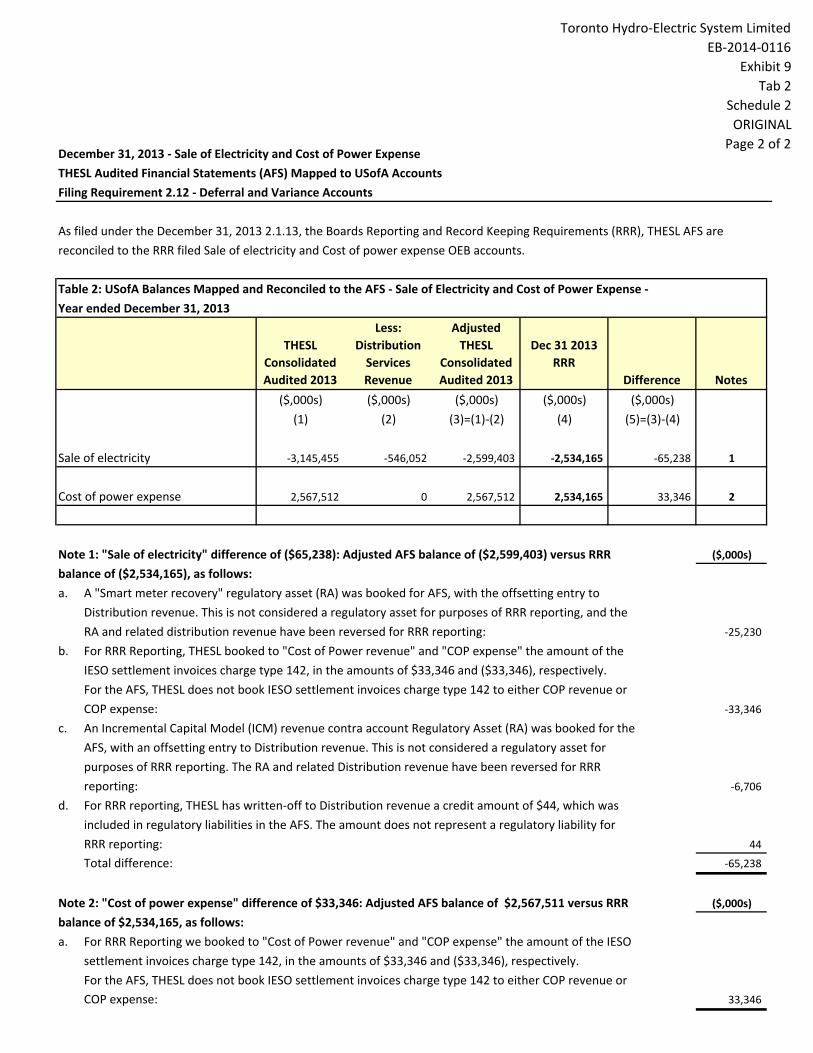
Toronto Hydro‐Electric System LimitedEB‐2014‐0116
Exhibit 9Tab 2
Schedule 2ORIGINAL
Page 2 of 2December 31, 2013 ‐ Sale of Electricity and Cost of Power Expense THESL Audited Financial Statements (AFS) Mapped to USofA Accounts
Filing Requirement 2.12 ‐ Deferral and Variance Accounts
As filed under the December 31, 2013 2.1.13, the Boards Reporting and Record Keeping Requirements (RRR), THESL AFS are
reconciled to the RRR filed Sale of electricity and Cost of power expense OEB accounts.
Table 2: USofA Balances Mapped and Reconciled to the AFS ‐ Sale of Electricity and Cost of Power Expense ‐
Year ended December 31, 2013
THESL Consolidated Audited 2013
Less: Distribution Services Revenue
Adjusted THESL
Consolidated Audited 2013
Dec 31 2013 RRR
Difference Notes
($,000s) ($,000s) ($,000s) ($,000s) ($,000s)
(1) (2) (3)=(1)‐(2) (4) (5)=(3)‐(4)
Sale of electricity ‐3,145,455 ‐546,052 ‐2,599,403 ‐2,534,165 ‐65,238 1
Cost of power expense 2,567,512 0 2,567,512 2,534,165 33,346 2
Note 1: "Sale of electricity" difference of ($65,238): Adjusted AFS balance of ($2,599,403) versus RRR ($,000s)
balance of ($2,534,165), as follows:
a. A "Smart meter recovery" regulatory asset (RA) was booked for AFS, with the offsetting entry to
Distribution revenue. This is not considered a regulatory asset for purposes of RRR reporting, and the
RA and related distribution revenue have been reversed for RRR reporting: ‐25,230
b. For RRR Reporting, THESL booked to "Cost of Power revenue" and "COP expense" the amount of the
IESO settlement invoices charge type 142, in the amounts of $33,346 and ($33,346), respectively.
For the AFS, THESL does not book IESO settlement invoices charge type 142 to either COP revenue or
COP expense: ‐33,346
c. An Incremental Capital Model (ICM) revenue contra account Regulatory Asset (RA) was booked for the
AFS, with an offsetting entry to Distribution revenue. This is not considered a regulatory asset for
purposes of RRR reporting. The RA and related Distribution revenue have been reversed for RRR
reporting: ‐6,706
d. For RRR reporting, THESL has written‐off to Distribution revenue a credit amount of $44, which was
included in regulatory liabilities in the AFS. The amount does not represent a regulatory liability for
RRR reporting: 44
Total difference: ‐65,238
Note 2: "Cost of power expense" difference of $33,346: Adjusted AFS balance of $2,567,511 versus RRR ($,000s)
balance of $2,534,165, as follows:
a. For RRR Reporting we booked to "Cost of Power revenue" and "COP expense" the amount of the IESO
settlement invoices charge type 142, in the amounts of $33,346 and ($33,346), respectively.
For the AFS, THESL does not book IESO settlement invoices charge type 142 to either COP revenue or
COP expense: 33,346
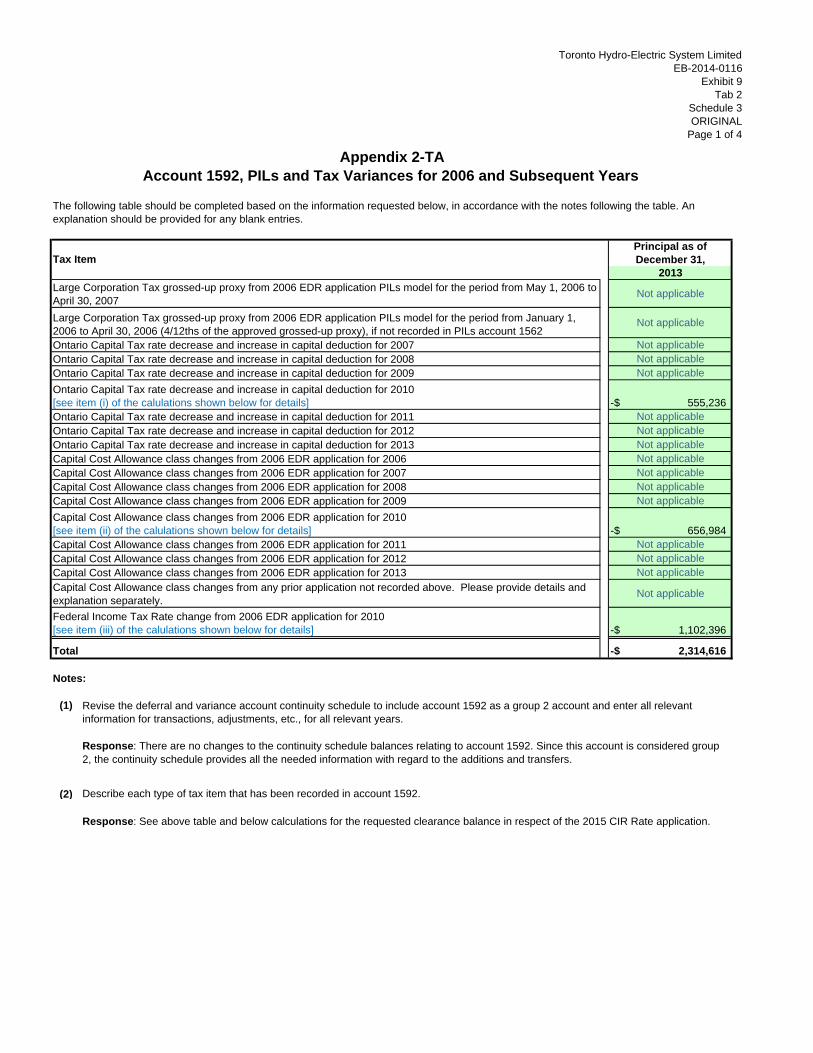
Toronto Hydro-Electric System LimitedEB-2014-0116
Exhibit 9Tab 2
Schedule 3ORIGINAL
Page 1 of 4
Principal as ofDecember 31,
2013
Not applicable
Not applicable
Not applicableNot applicableNot applicable
555,236-$ Not applicableNot applicableNot applicableNot applicableNot applicableNot applicableNot applicable
656,984-$ Not applicableNot applicableNot applicable
Not applicable
1,102,396-$
2,314,616-$
Notes:
(2)
Ontario Capital Tax rate decrease and increase in capital deduction for 2007Ontario Capital Tax rate decrease and increase in capital deduction for 2008Ontario Capital Tax rate decrease and increase in capital deduction for 2009Ontario Capital Tax rate decrease and increase in capital deduction for 2010[see item (i) of the calulations shown below for details]
Capital Cost Allowance class changes from 2006 EDR application for 2006
Large Corporation Tax grossed-up proxy from 2006 EDR application PILs model for the period from January 1, 2006 to April 30, 2006 (4/12ths of the approved grossed-up proxy), if not recorded in PILs account 1562
Appendix 2-TAAccount 1592, PILs and Tax Variances for 2006 and Subsequent Years
The following table should be completed based on the information requested below, in accordance with the notes following the table. An explanation should be provided for any blank entries.
Tax Item
Large Corporation Tax grossed-up proxy from 2006 EDR application PILs model for the period from May 1, 2006 to April 30, 2007
(1) Revise the deferral and variance account continuity schedule to include account 1592 as a group 2 account and enter all relevant information for transactions, adjustments, etc., for all relevant years.
Describe each type of tax item that has been recorded in account 1592.
Response: There are no changes to the continuity schedule balances relating to account 1592. Since this account is considered group 2, the continuity schedule provides all the needed information with regard to the additions and transfers.
Response: See above table and below calculations for the requested clearance balance in respect of the 2015 CIR Rate application.
Total
Ontario Capital Tax rate decrease and increase in capital deduction for 2011Ontario Capital Tax rate decrease and increase in capital deduction for 2012Ontario Capital Tax rate decrease and increase in capital deduction for 2013
Capital Cost Allowance class changes from 2006 EDR application for 2013
Federal Income Tax Rate change from 2006 EDR application for 2010[see item (iii) of the calulations shown below for details]
Capital Cost Allowance class changes from 2006 EDR application for 2011Capital Cost Allowance class changes from 2006 EDR application for 2012
Capital Cost Allowance class changes from 2006 EDR application for 2007Capital Cost Allowance class changes from 2006 EDR application for 2008Capital Cost Allowance class changes from 2006 EDR application for 2009Capital Cost Allowance class changes from 2006 EDR application for 2010[see item (ii) of the calulations shown below for details]
Capital Cost Allowance class changes from any prior application not recorded above. Please provide details and explanation separately.

Toronto Hydro-Electric System LimitedEB-2014-0116
Exhibit 9Tab 2
Schedule 3ORIGINAL
Page 2 of 4
Appendix 2-TAAccount 1592, PILs and Tax Variances for 2006 and Subsequent Years
(3)
Refer to the above table, see below calculations for how each item was determined:
(i)
For the period May 1, 2009 to April 30, 2010 per 2009 Rate Model Net taxable capital per 2009 rate model $ 2,220,943,135
Ontario capital tax rate per 2009 rate model 0.225%Total capital tax in the year per 2009 rate model $ 4,997,122 Divided by 12 months 12 monthsMonthly capital tax from 1/1/2010 to 4/30/2010 by using the rate per 2009 rate model $ 416,427 [A]
Net taxable capital per 2009 rate model $ 2,220,943,135 Ontario capital tax rate per 2010 Statutory rate (0.15%/2*) 0.075%Total capital tax in the year $ 1,665,707 Divided by 6 months 6 monthsMonthly capital tax from 1/1/2010 to 4/30/2010 by using the statutory tax rate $ 277,618 [B]
Increase in PILs 1592 variance liability (not grossed-up) per month (1/1/2010 - 4/30/2010) [A] - [B] $ 138,809 Multiplied by 4 months 4 monthsIncrease in PILs 1592 variance liability for the period January 1, 2010 to April 30, 2010 $ 555,236
(ii)
For the period May 1, 2008 to April 30, 2009 per 2008 Rate ModelCCA class 45 additions per 2008 rate model 6,789,452$ Half-year rule (50%) 50%Reduced CCA class 45 additions before CCA 3,394,726$
Ontario Capital Tax rate decrease and increase in capital deduction for 2010
*Note that Ontario capital tax was eliminated effective July 1, 2010. Full year capital tax rate for 2010 was 0.15%.
Capital Cost Allowance class changes from 2006 EDR application for 2010
Response: See response in Note (2).
(4) Please state whether or not the applicant followed the guidance provided in the FAQ of July 2007. If not, please provide an explanation.
(5) Identify the account balance as of December 31, 2012 as per the 2012 Audited Financial Statements. Identify the account balance as of December 31, 2012 as per the April 2013 2.1.7 RRR filing to the Board. Provide a reconciliation if the balances provided are not identical to each other and to the total shown on the continuity schedule.
(6) Complete the above table based on the answers to the previous. Add rows as required to complete the analysis in an informative manner. Please provide the completed table as a working Excel spreadsheet.
Response: THESL has followed the guidance provided in FAQ of July 2007
Response: The total account balance including cumulative carrying charges ($83,852) was $2,398,468 as of December 31, 2012 as reported in Note 9 f) of the 2012 Audited Financial Statements. This balance was reported to the Board in the April 2013 2.1.7 RRR filing.
Provide the calculations that show how each item was determined and provide any pertinent supporting evidence and documentation.
Response: See above table and below calculations for the requested clearance balance in respect of the 2015 CIR Rate application.

Toronto Hydro-Electric System LimitedEB-2014-0116
Exhibit 9Tab 2
Schedule 3ORIGINAL
Page 3 of 4
Appendix 2-TAAccount 1592, PILs and Tax Variances for 2006 and Subsequent Years
CCA on Class 45 additions as calculated in 2008 rate model $3,394,726 x 45% 1,527,627$ CCA on Class 50 additions based on Class 45 additions per 2008 rate model $3,394,726 x 55% 1,867,099 Increase in CCA due to change in CCA class 339,472$ [C]
For the period May 1, 2009 to April 30, 2010 per 2009 Rate Model
CCA class 45 additions per 2009 rate model 5,664,102$ Half-year rule (50%) 50%Reduced CCA class 45 additions before CCA 2,832,051$ [D]
CCA on Class 45 additions as calculated in 2009 rate model (45%)[D]: $2,832,051 x 45% 1,274,423$
Recalculated CCA on Class 50/52 additions in 2009 rate model Class 50 addition: $5,664,102 x 1/12 x 50% x 55% 129,802$ Class 52 addition: $5,664,102 x 11/12 x 100% 5,192,094 CCA due to change in CCA class 5,321,896$
Increase in CCA due to change in CCA class 4,047,473$ [E]
Increase in CCA due to change in CCA class per 2008 and 2009 rate models [see above item (4)] [C] + [E] 4,386,945$ 2010 statutory tax rate 31.00%Decrease in income tax before grossed-up 1,359,953$ Gross up factor [1/(1-tax rate)] 1.4492754 Decrease in income tax (grossed-up) 1,970,946$ [F]
Total increase in PILS 1592 variance liability for 2010Due to 2009 CCA class 45 additions per 2008 and 2009 rate models [F]: $1,970,946 x 4/12 656,982$ Rounding 2$ Increase in PILs 1592 variance liability for the period January 1, 2010 to April 30, 2010 656,984$
Capital Cost Allowance class changes from 2006 EDR application for 2010

Toronto Hydro-Electric System LimitedEB-2014-0116
Exhibit 9Tab 2
Schedule 3ORIGINAL
Page 4 of 4
Appendix 2-TAAccount 1592, PILs and Tax Variances for 2006 and Subsequent Years
(iii)
For the period May 1, 2009 to April 30, 2010 per 2009 Rate ModelTaxable income per 2009 rate model 50,403,073$ 2010 statutory tax rate 31.00%
15,624,953$ Less: Tax credits per 2009 rate model 200,000 Income tax before grossed-up 15,424,953$ Gross up factor [1/(1-tax rate)] 1.4492754 Income tax (grossed-up) – recalculated 22,355,004$ Income tax (grossed-up) – per 2009 rate model 25,662,189 Decrease in Income tax due to change in statutory rate 3,307,185$ [G]
Total increase in PILS 1592 variance liability for 2010Due to change in 2010 statutory income tax ratePer 2009 rate model: [G]: $3,307,185 x 4/12 1,102,395$ Rounding 1$
1,102,396$
Federal Income Tax Rate change from 2006 EDR application for 2010
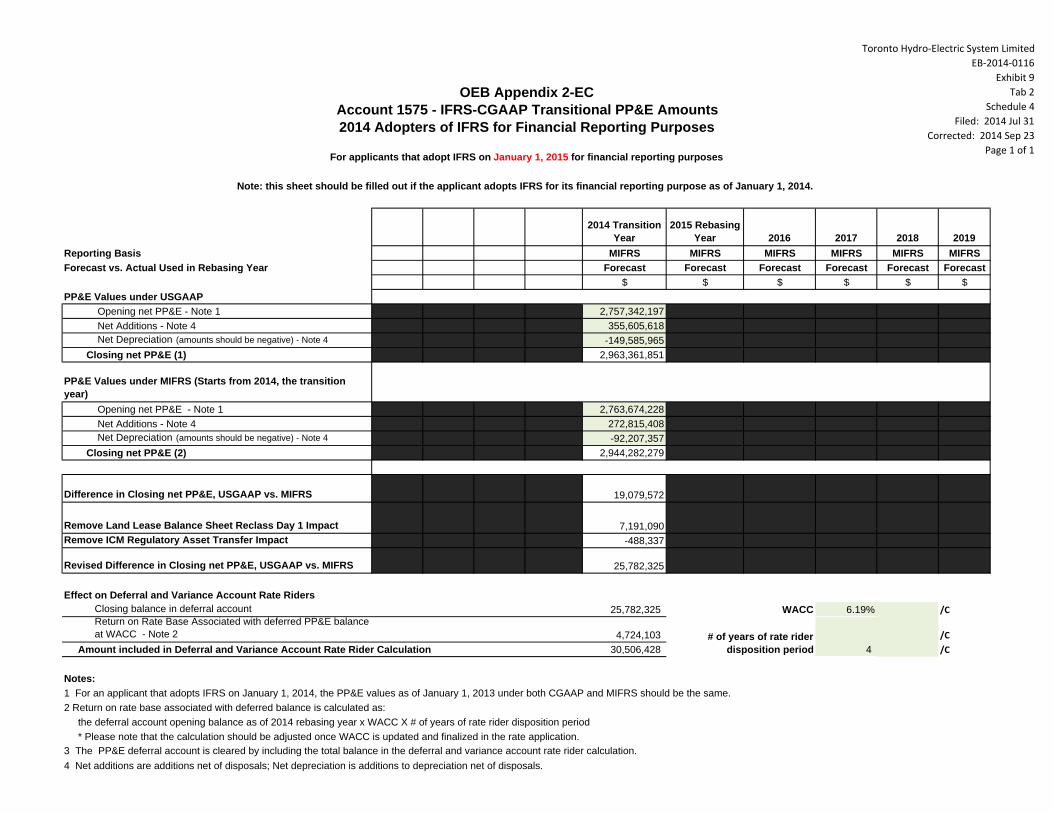
Toronto Hydro‐Electric System LimitedEB‐2014‐0116
Exhibit 9Tab 2
Schedule 4Filed: 2014 Jul 31
Corrected: 2014 Sep 23Page 1 of 1
2014 Transition Year
2015 Rebasing Year 2016 2017 2018 2019
Reporting Basis MIFRS MIFRS MIFRS MIFRS MIFRS MIFRSForecast vs. Actual Used in Rebasing Year Forecast Forecast Forecast Forecast Forecast Forecast
$ $ $ $ $ $PP&E Values under USGAAP Opening net PP&E - Note 1 2,757,342,197 Net Additions - Note 4 355,605,618 Net Depreciation (amounts should be negative) - Note 4 -149,585,965 Closing net PP&E (1) 2,963,361,851
PP&E Values under MIFRS (Starts from 2014, the transition year) Opening net PP&E - Note 1 2,763,674,228 Net Additions - Note 4 272,815,408 Net Depreciation (amounts should be negative) - Note 4 -92,207,357 Closing net PP&E (2) 2,944,282,279
Difference in Closing net PP&E, USGAAP vs. MIFRS 19,079,572
Remove Land Lease Balance Sheet Reclass Day 1 Impact 7,191,090Remove ICM Regulatory Asset Transfer Impact -488,337
Revised Difference in Closing net PP&E, USGAAP vs. MIFRS 25,782,325
Effect on Deferral and Variance Account Rate RidersClosing balance in deferral account 25,782,325 WACC 6.19% /CReturn on Rate Base Associated with deferred PP&E balance at WACC - Note 2 4,724,103 /C
Amount included in Deferral and Variance Account Rate Rider Calculation 30,506,428 /C
Notes:1 For an applicant that adopts IFRS on January 1, 2014, the PP&E values as of January 1, 2013 under both CGAAP and MIFRS should be the same. 2 Return on rate base associated with deferred balance is calculated as: the deferral account opening balance as of 2014 rebasing year x WACC X # of years of rate rider disposition period * Please note that the calculation should be adjusted once WACC is updated and finalized in the rate application.
4 Net additions are additions net of disposals; Net depreciation is additions to depreciation net of disposals.
OEB Appendix 2-EC
Note: this sheet should be filled out if the applicant adopts IFRS for its financial reporting purpose as of January 1, 2014.
For applicants that adopt IFRS on January 1, 2015 for financial reporting purposes
2014 Adopters of IFRS for Financial Reporting PurposesAccount 1575 - IFRS-CGAAP Transitional PP&E Amounts
# of years of rate rider disposition period 4
3 The PP&E deferral account is cleared by including the total balance in the deferral and variance account rate rider calculation.
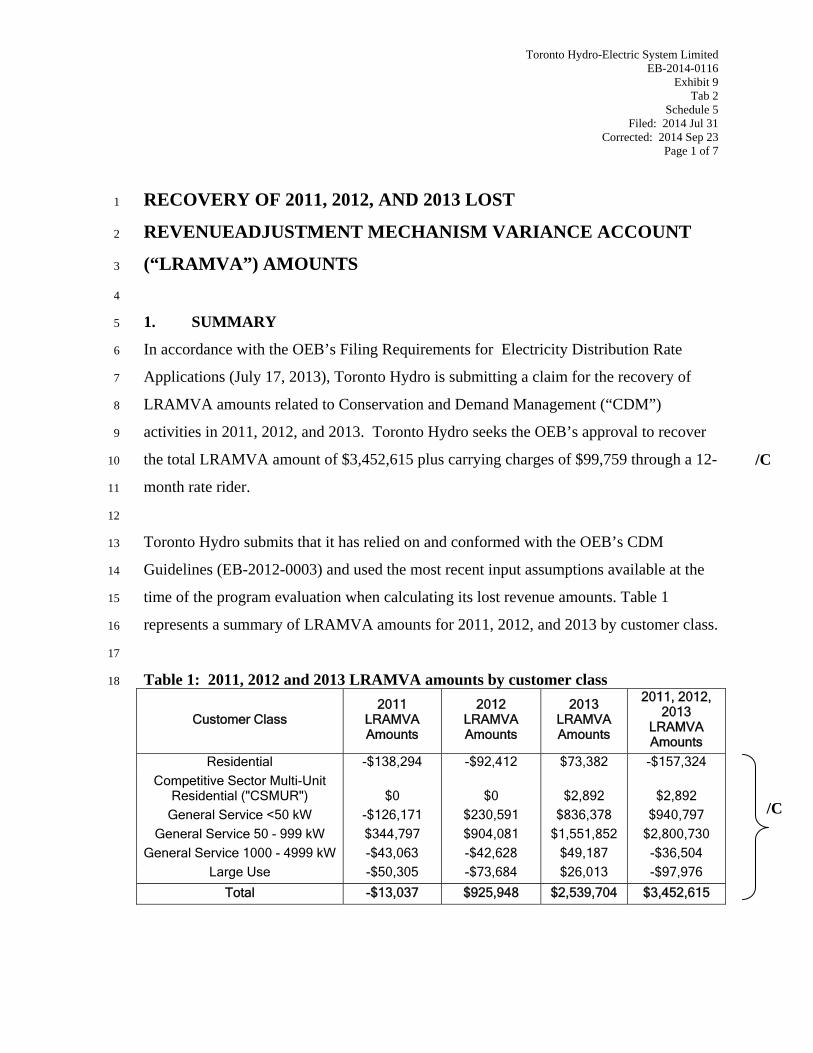
Toronto Hydro-Electric System Limited EB-2014-0116
Exhibit 9 Tab 2
Schedule 5 Filed: 2014 Jul 31
Corrected: 2014 Sep 23 Page 1 of 7
RECOVERY OF 2011, 2012, AND 2013 LOST 1
REVENUEADJUSTMENT MECHANISM VARIANCE ACCOUNT 2
(“LRAMVA”) AMOUNTS 3
4
1. SUMMARY 5
In accordance with the OEB’s Filing Requirements for Electricity Distribution Rate 6
Applications (July 17, 2013), Toronto Hydro is submitting a claim for the recovery of 7
LRAMVA amounts related to Conservation and Demand Management (“CDM”) 8
activities in 2011, 2012, and 2013. Toronto Hydro seeks the OEB’s approval to recover 9
the total LRAMVA amount of $3,452,615 plus carrying charges of $99,759 through a 12-10
month rate rider. 11
12
Toronto Hydro submits that it has relied on and conformed with the OEB’s CDM 13
Guidelines (EB-2012-0003) and used the most recent input assumptions available at the 14
time of the program evaluation when calculating its lost revenue amounts. Table 1 15
represents a summary of LRAMVA amounts for 2011, 2012, and 2013 by customer class. 16
17
Table 1: 2011, 2012 and 2013 LRAMVA amounts by customer class 18
Customer Class 2011
LRAMVA Amounts
2012 LRAMVA Amounts
2013 LRAMVA Amounts
2011, 2012, 2013
LRAMVA Amounts
Residential -$138,294 -$92,412 $73,382 -$157,324
Competitive Sector Multi-Unit Residential ("CSMUR") $0 $0 $2,892 $2,892
General Service <50 kW -$126,171 $230,591 $836,378 $940,797
General Service 50 - 999 kW $344,797 $904,081 $1,551,852 $2,800,730
General Service 1000 - 4999 kW -$43,063 -$42,628 $49,187 -$36,504
Large Use -$50,305 -$73,684 $26,013 -$97,976
Total -$13,037 $925,948 $2,539,704 $3,452,615
/C
/C

Toronto Hydro-Electric System Limited EB-2014-0116
Exhibit 9 Tab 2
Schedule 5 ORIGINAL Page 2 of 7
2. LOST REVENUE ADJUSTMENT MECHANISM (“LRAM”) FOR CDM 1
ACTIVITIES PRIOR TO 2011: 2
Toronto Hydro was last granted approval from the OEB to clear LRAM balances as part 3
of its 2010 Cost of Service (“COS”) rate application (see EB-2009-0139). These 4
amounts were previously reviewed and approved in EB-2008-0401, and related to 2007 5
CDM activities. 6
7
Toronto Hydro confirms it will not be submitting an application to recover LRAM 8
amounts related to 2008, 2009, and 2010 CDM activities consistent with the OEB 9
expectations in the CDM Guidelines (EB-2012-0003) Section 13.6, where it states: 10
“LRAM for pre-2011 CDM activities should be completed with the 2012 rate 11
applications” and if not filed for the recovery of LRAM amounts in its 2012 rate 12
application, “it will forego the opportunity to recover LRAM for this legacy 13
period of CDM activity”. 14
15
3. LRAMVA AMOUNT CALCULATIONS 16
As defined in CDM Guidelines EB-2012-0003, the LRAMVA is intended to capture the 17
difference between the level of CDM program activities included in the distributor’s load 18
forecast and the actual impacts of authorized CDM activities achieved in Toronto 19
Hydro’s service territory. 20
21
The latest Toronto Hydro OEB-approved load forecast was for 2011 and was part of 2011 22
COS rate application (EB-2010-0142). As a result, Toronto Hydro is eligible to apply for 23
recovery LRAMVA amounts related to CDM activities for 2011, 2012, 2013 and 2014. 24
In accordance with LRAM Filing Data Table from the 2012 CDM Guidelines, currently 25
Toronto Hydro is able to seek for approval of 2011-2013 LRAMVA amounts. An 26
application for 2014 LRAMVA amount will be submitted at a later date. 27
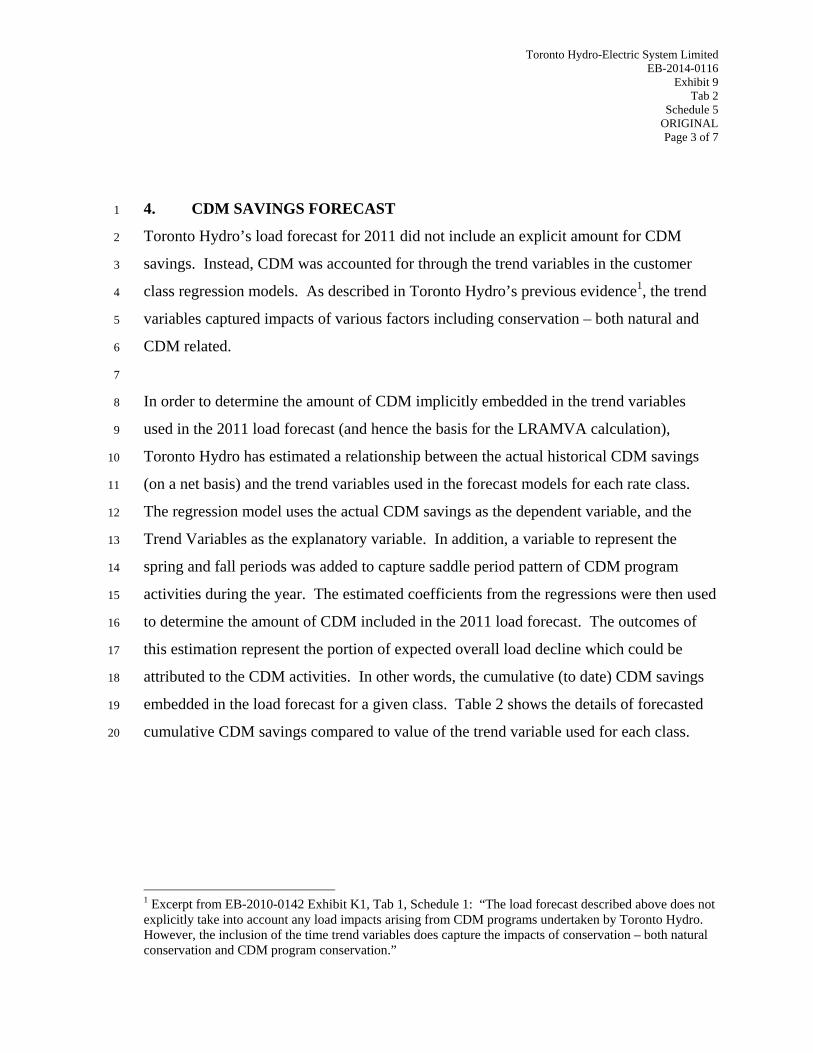
Toronto Hydro-Electric System Limited EB-2014-0116
Exhibit 9 Tab 2
Schedule 5 ORIGINAL Page 3 of 7
4. CDM SAVINGS FORECAST 1
Toronto Hydro’s load forecast for 2011 did not include an explicit amount for CDM 2
savings. Instead, CDM was accounted for through the trend variables in the customer 3
class regression models. As described in Toronto Hydro’s previous evidence1, the trend 4
variables captured impacts of various factors including conservation – both natural and 5
CDM related. 6
7
In order to determine the amount of CDM implicitly embedded in the trend variables 8
used in the 2011 load forecast (and hence the basis for the LRAMVA calculation), 9
Toronto Hydro has estimated a relationship between the actual historical CDM savings 10
(on a net basis) and the trend variables used in the forecast models for each rate class. 11
The regression model uses the actual CDM savings as the dependent variable, and the 12
Trend Variables as the explanatory variable. In addition, a variable to represent the 13
spring and fall periods was added to capture saddle period pattern of CDM program 14
activities during the year. The estimated coefficients from the regressions were then used 15
to determine the amount of CDM included in the 2011 load forecast. The outcomes of 16
this estimation represent the portion of expected overall load decline which could be 17
attributed to the CDM activities. In other words, the cumulative (to date) CDM savings 18
embedded in the load forecast for a given class. Table 2 shows the details of forecasted 19
cumulative CDM savings compared to value of the trend variable used for each class. 20
1 Excerpt from EB-2010-0142 Exhibit K1, Tab 1, Schedule 1: “The load forecast described above does not explicitly take into account any load impacts arising from CDM programs undertaken by Toronto Hydro. However, the inclusion of the time trend variables does capture the impacts of conservation – both natural conservation and CDM program conservation.”
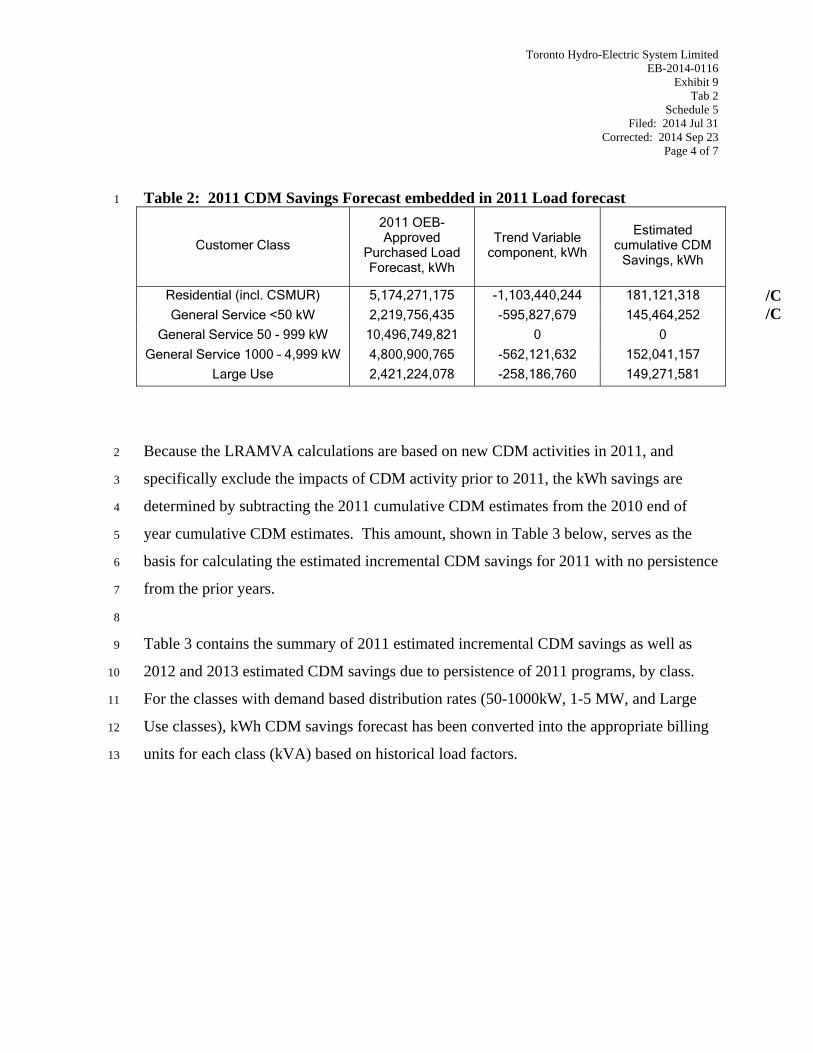
Toronto Hydro-Electric System Limited EB-2014-0116
Exhibit 9 Tab 2
Schedule 5 Filed: 2014 Jul 31
Corrected: 2014 Sep 23 Page 4 of 7
Table 2: 2011 CDM Savings Forecast embedded in 2011 Load forecast 1
Customer Class
2011 OEB-Approved
Purchased Load Forecast, kWh
Trend Variable component, kWh
Estimated cumulative CDM
Savings, kWh
Residential (incl. CSMUR) 5,174,271,175 -1,103,440,244 181,121,318
General Service <50 kW 2,219,756,435 -595,827,679 145,464,252
General Service 50 - 999 kW 10,496,749,821 0 0
General Service 1000 – 4,999 kW 4,800,900,765 -562,121,632 152,041,157
Large Use 2,421,224,078 -258,186,760 149,271,581
Because the LRAMVA calculations are based on new CDM activities in 2011, and 2
specifically exclude the impacts of CDM activity prior to 2011, the kWh savings are 3
determined by subtracting the 2011 cumulative CDM estimates from the 2010 end of 4
year cumulative CDM estimates. This amount, shown in Table 3 below, serves as the 5
basis for calculating the estimated incremental CDM savings for 2011 with no persistence 6
from the prior years. 7
8
Table 3 contains the summary of 2011 estimated incremental CDM savings as well as 9
2012 and 2013 estimated CDM savings due to persistence of 2011 programs, by class. 10
For the classes with demand based distribution rates (50-1000kW, 1-5 MW, and Large 11
Use classes), kWh CDM savings forecast has been converted into the appropriate billing 12
units for each class (kVA) based on historical load factors. 13
/C /C
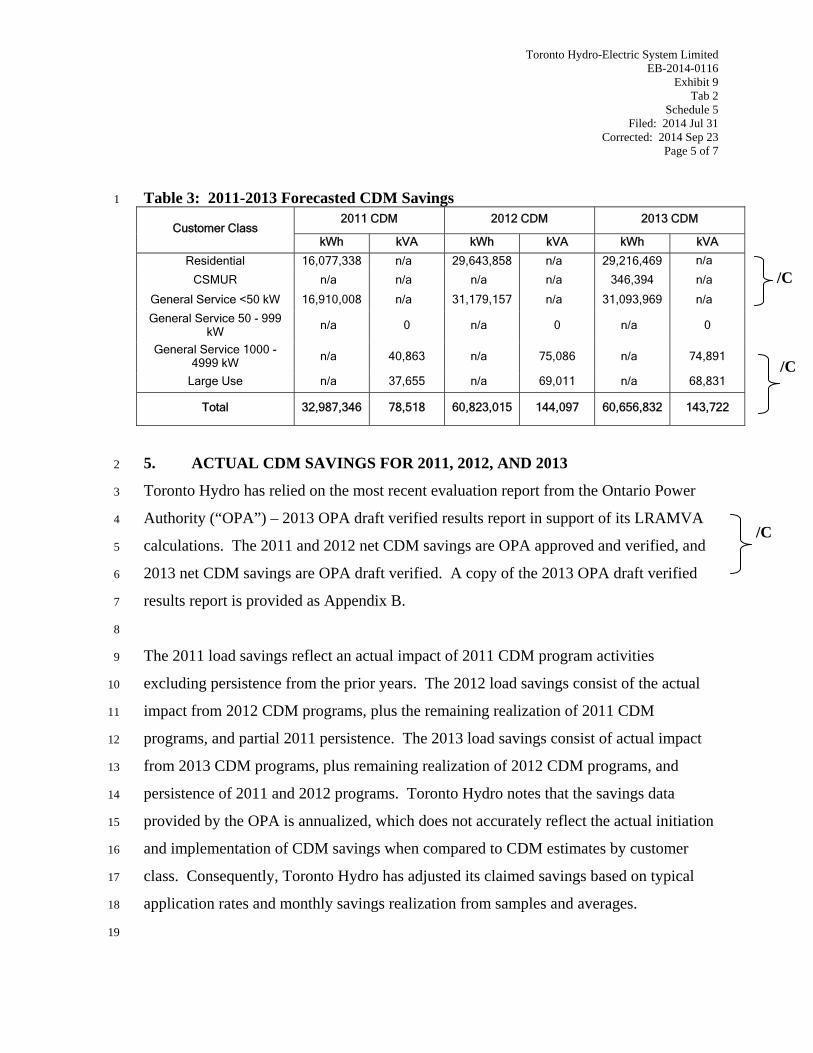
Toronto Hydro-Electric System Limited EB-2014-0116
Exhibit 9 Tab 2
Schedule 5 Filed: 2014 Jul 31
Corrected: 2014 Sep 23 Page 5 of 7
Table 3: 2011-2013 Forecasted CDM Savings 1
Customer Class 2011 CDM 2012 CDM 2013 CDM
kWh kVA kWh kVA kWh kVA
Residential 16,077,338 n/a 29,643,858 n/a 29,216,469 n/a
CSMUR n/a n/a n/a n/a 346,394 n/a
General Service <50 kW 16,910,008 n/a 31,179,157 n/a 31,093,969 n/a
General Service 50 - 999 kW
n/a 0 n/a 0 n/a 0
General Service 1000 - 4999 kW
n/a 40,863 n/a 75,086 n/a 74,891
Large Use n/a 37,655 n/a 69,011 n/a 68,831
Total 32,987,346 78,518 60,823,015 144,097 60,656,832 143,722
5. ACTUAL CDM SAVINGS FOR 2011, 2012, AND 2013 2
Toronto Hydro has relied on the most recent evaluation report from the Ontario Power 3
Authority (“OPA”) – 2013 OPA draft verified results report in support of its LRAMVA 4
calculations. The 2011 and 2012 net CDM savings are OPA approved and verified, and 5
2013 net CDM savings are OPA draft verified. A copy of the 2013 OPA draft verified 6
results report is provided as Appendix B. 7
8
The 2011 load savings reflect an actual impact of 2011 CDM program activities 9
excluding persistence from the prior years. The 2012 load savings consist of the actual 10
impact from 2012 CDM programs, plus the remaining realization of 2011 CDM 11
programs, and partial 2011 persistence. The 2013 load savings consist of actual impact 12
from 2013 CDM programs, plus remaining realization of 2012 CDM programs, and 13
persistence of 2011 and 2012 programs. Toronto Hydro notes that the savings data 14
provided by the OPA is annualized, which does not accurately reflect the actual initiation 15
and implementation of CDM savings when compared to CDM estimates by customer 16
class. Consequently, Toronto Hydro has adjusted its claimed savings based on typical 17
application rates and monthly savings realization from samples and averages. 18
19
/C
/C
/C
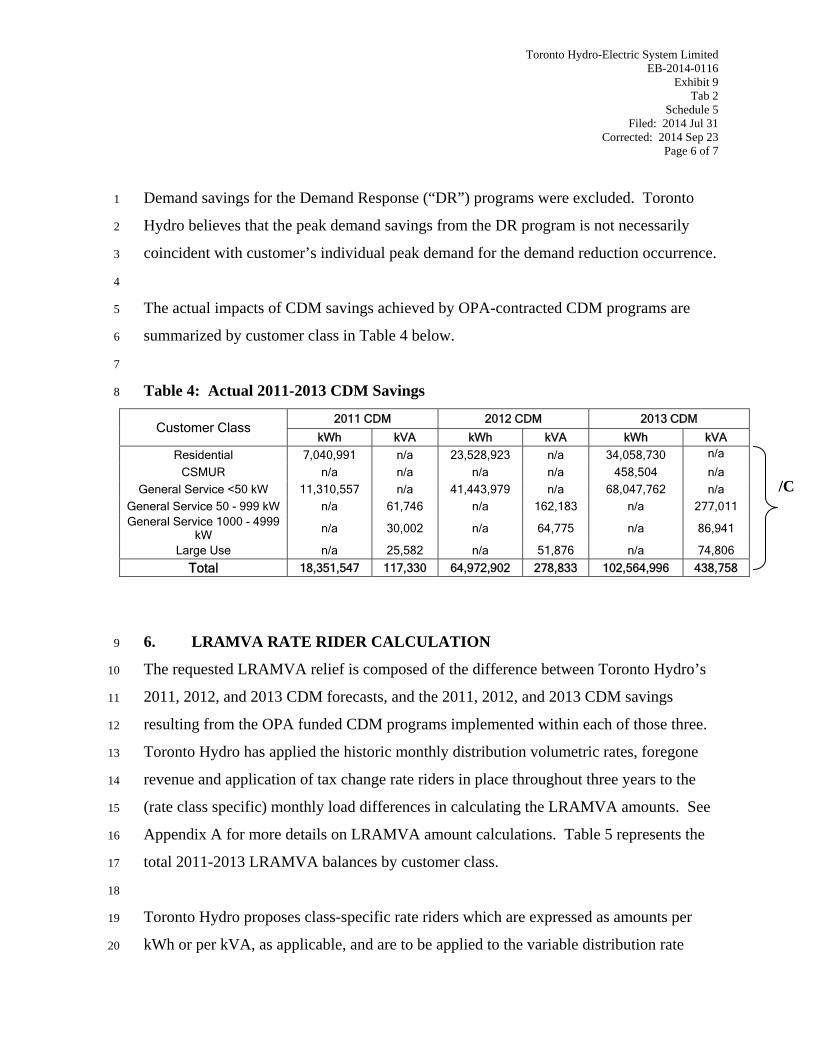
Toronto Hydro-Electric System Limited EB-2014-0116
Exhibit 9 Tab 2
Schedule 5 Filed: 2014 Jul 31
Corrected: 2014 Sep 23 Page 6 of 7
Demand savings for the Demand Response (“DR”) programs were excluded. Toronto 1
Hydro believes that the peak demand savings from the DR program is not necessarily 2
coincident with customer’s individual peak demand for the demand reduction occurrence. 3
4
The actual impacts of CDM savings achieved by OPA-contracted CDM programs are 5
summarized by customer class in Table 4 below. 6
7
Table 4: Actual 2011-2013 CDM Savings 8
Customer Class 2011 CDM 2012 CDM 2013 CDM
kWh kVA kWh kVA kWh kVA
Residential 7,040,991 n/a 23,528,923 n/a 34,058,730 n/a
CSMUR n/a n/a n/a n/a 458,504 n/a
General Service <50 kW 11,310,557 n/a 41,443,979 n/a 68,047,762 n/a
General Service 50 - 999 kW n/a 61,746 n/a 162,183 n/a 277,011 General Service 1000 - 4999
kW n/a 30,002 n/a 64,775 n/a 86,941
Large Use n/a 25,582 n/a 51,876 n/a 74,806
Total 18,351,547 117,330 64,972,902 278,833 102,564,996 438,758
6. LRAMVA RATE RIDER CALCULATION 9
The requested LRAMVA relief is composed of the difference between Toronto Hydro’s 10
2011, 2012, and 2013 CDM forecasts, and the 2011, 2012, and 2013 CDM savings 11
resulting from the OPA funded CDM programs implemented within each of those three. 12
Toronto Hydro has applied the historic monthly distribution volumetric rates, foregone 13
revenue and application of tax change rate riders in place throughout three years to the 14
(rate class specific) monthly load differences in calculating the LRAMVA amounts. See 15
Appendix A for more details on LRAMVA amount calculations. Table 5 represents the 16
total 2011-2013 LRAMVA balances by customer class. 17
18
Toronto Hydro proposes class-specific rate riders which are expressed as amounts per 19
kWh or per kVA, as applicable, and are to be applied to the variable distribution rate 20
/C
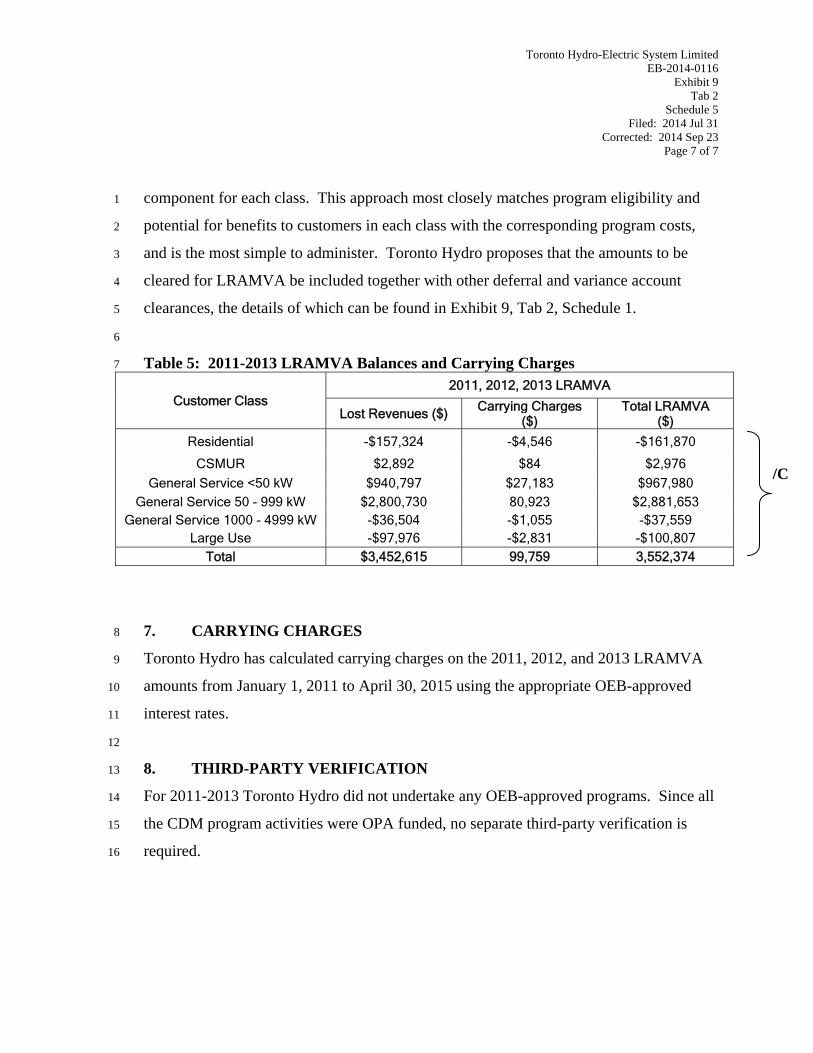
Toronto Hydro-Electric System Limited EB-2014-0116
Exhibit 9 Tab 2
Schedule 5 Filed: 2014 Jul 31
Corrected: 2014 Sep 23 Page 7 of 7
component for each class. This approach most closely matches program eligibility and 1
potential for benefits to customers in each class with the corresponding program costs, 2
and is the most simple to administer. Toronto Hydro proposes that the amounts to be 3
cleared for LRAMVA be included together with other deferral and variance account 4
clearances, the details of which can be found in Exhibit 9, Tab 2, Schedule 1. 5
6
Table 5: 2011-2013 LRAMVA Balances and Carrying Charges 7
Customer Class 2011, 2012, 2013 LRAMVA
Lost Revenues ($) Carrying Charges ($)
Total LRAMVA($)
Residential -$157,324 -$4,546 -$161,870
CSMUR $2,892 $84 $2,976
General Service <50 kW $940,797 $27,183 $967,980 General Service 50 - 999 kW $2,800,730 80,923 $2,881,653
General Service 1000 - 4999 kW -$36,504 -$1,055 -$37,559 Large Use -$97,976 -$2,831 -$100,807
Total $3,452,615 99,759 3,552,374
7. CARRYING CHARGES 8
Toronto Hydro has calculated carrying charges on the 2011, 2012, and 2013 LRAMVA 9
amounts from January 1, 2011 to April 30, 2015 using the appropriate OEB-approved 10
interest rates. 11
12
8. THIRD-PARTY VERIFICATION 13
For 2011-2013 Toronto Hydro did not undertake any OEB-approved programs. Since all 14
the CDM program activities were OPA funded, no separate third-party verification is 15
required. 16
/C

Toronto Hydro‐Electric System LimitedEB‐2014‐0116
Exhibit 9Tab 2
Schedule 5Appendix A
Filed: 2014 Jul 31Corrected: 2014 Sep 23
Page 1 of 3
THESL ‐ 2011 LRAMVA Calculation:
Year: 2011Calculation:
Customer Class kWh kW kWh kW kWh kW kVA kWh kVA kWh kVA kWh kVA kWh kVA kWh kVAResidential 16,077,338 7,040,991 -9,036,347 -3,590,854 -5,445,493 0.01572$ 0.01503$ ($138,293.99) /CGeneral Service <50 kW 16,910,008 11,310,557 -5,599,451 -2,579,903 -3,019,548 0.02270$ 0.02239$ ($126,171.48) /CGeneral Service 50 - 999 kW 0 56,357 56,357 61,746 22,289 39,456 5.5840$ 5.5998$ $352,414.68 /C
Transformer Allowance 12,045 4,324 7,721 0.62-$ 0.62-$ ($7,618.04) /CSub Total $344,796.63 /CGeneral Service 1000 - 4999 kW 37,509 27,494 -10,015 -10,861 -3,960 -6,901 4.0438$ 4.5989$ ($48,425.33) /C
Transformer Allowance -8,533 -3,107 -5,426 0.62-$ 0.62-$ $5,362.70 /CSub Total ($43,062.62) /CLarge Use 34,739 23,567 -11,171 -12,073 -4,189 -7,884 4.2852$ 4.9015$ ($57,460.93) /C
Transformer Allowance -11,375 -4,014 -7,361 0.62-$ 0.62-$ $7,155.87 /CSub Total ($50,305.06) /CTotal 32,987,346 72,248 18,351,547 107,419 -14,635,798 35,171 38,811 -6,170,758 14,140 -8,465,041 24,671 Total ($264,465.46) $246,528.42 ($17,937.04) /C
Transformer Allowance -7,864 -2,797 -5,067 Transformer Allowance $4,900.53 $4,900.53 /CTotal (Net of Transformer Allowance) ($264,465.46) $251,428.95 ($13,036.51) /C
*Volumetric Rate Riders include foregone revenue.
CDM Component of approved OEB Forecast
2011 CoS
2011 OPA approved CDM (actual impact) Energy Volume to Calculate Variance
A B C = B - A
Distribution Volumetric Rate
(Aug - Dec)*Entry for 1568 LRAM Account
Energy Volume to Calculate Variance
(Jan - Jul)
Energy Volume to Calculate Variance
(Aug - Dec)
Distribution Volumetric Rate
(Jan - Jul)*

Toronto Hydro‐Electric System LimitedEB‐2014‐0116
Exhibit 9Tab 2
Schedule 5Appendix A
Filed: 2014 Jul 31Corrected: 2014 Sep 23
Page 2 of 3
THESL ‐ 2012 LRAMVA Calculation:
Year: 2012Calculation:
Customer Class kWh kW kWh kW kWh kW kVA kWh kVA kWh kVA kWh kVA kWh kVA kWh kVAResidential 29,643,858 23,528,923 -6,114,934 -3,147,000 -2,967,935 0.01503$ 0.01520$ ($92,412.01) /CGeneral Service <50 kW 31,179,157 41,443,979 10,264,821 747,780 9,517,041 0.02239$ 0.02247$ $230,590.71 /CGeneral Service 50 - 999 kW 0 148,517 148,517 162,183 36,287 125,896 5.5998$ 5.5956$ $923,972.89 /C
Transformer Allowance 31,516 6,909 24,608 0.62-$ 0.62-$ ($19,891.43) /CSub Total $904,081.46 /CGeneral Service 1000 - 4999 kW 69,009 59,458 -9,550 -10,311 -7,319 -2,992 4.5989$ 4.4497$ ($47,694.35) /C
Transformer Allowance -8,046 -5,656 -2,390 0.62-$ 0.62-$ $5,065.88 /CSub Total ($42,628.48) /CLarge Use 63,739 47,861 -15,878 -17,135 -8,188 -8,947 4.9015$ 4.7406$ ($83,930.99) /C
Transformer Allowance -16,255 -7,788 -8,467 0.62-$ 0.62-$ $10,247.47 /CSub Total ($73,683.52) /CTotal 60,823,015 132,748 64,972,902 255,837 4,149,887 123,088 134,736 -2,399,219 20,780 6,549,106 113,956 Total $138,178.70 $792,347.54 $930,526.24 /C
Transformer Allowance 7,216 -6,535 13,751 Transformer Allowance ($4,578.08) ($4,578.08) /CTotal (Net of Transformer Allow) $138,178.70 $787,769.46 $925,948.16 /C
*Volumetric Rate Riders include foregone revenue.
Energy Volume to Calculate Variance
(Jan - Apr)
Energy Volume to Calculate Variance
(May - Dec)
Distribution Volumetric Rate
(Jan - Apr)*
Distribution Volumetric Rate
(May - Dec)*Entry for 1568 LRAM Account
A B C = B-A
CDM Component of approved OEB Forecast
2011 CoS
2012 OPA approved CDM (actual impact) Energy Volume to Calculate Variance

Toronto Hydro‐Electric System LimitedEB‐2014‐0116
Exhibit 9Tab 2
Schedule 5Appendix A
Filed: 2014 Jul 31Corrected: 2014 Sep 23
Page 3 of 3
THESL ‐ 2013 LRAMVA Calculation:
Year: 2013Calculation:
Customer Class kWh kW kWh kW kWh kW kVA kWh kVA kWh kVA kWh kVA kWh kVA kWh kVAResidential 29,216,469 34,058,730 4,842,261 -667,304 5,509,565 0.01520$ 0.01516$ $73,381.98 /CCompetitive Sector Multi-Unit Residential (CSMUR)** 346,394 458,504 112,110 112,110 $ 0.02580 $2,892.43 /C
General Service <50 kW 31,093,969 68,047,762 36,953,793 9,563,527 27,390,267 0.02247$ 0.02269$ $836,377.59 /CGeneral Service 50 - 999 kW 0 253,769 253,769 277,011 88,434 188,577 5.5956$ 5.6563$ $1,585,734.91 /C
Transformer Allowance 53,810 16,993 36,817 0.62-$ 0.62-$ ($33,883.12) /CSub Total $1,551,851.79 /CGeneral Service 1000 - 4999 kW 68,827 79,805 10,978 12,050 -1,388 13,438 4.4497$ 4.4973$ $55,178.37 /C
Transformer Allowance 9,502 -1,086 10,588 0.62-$ 0.62-$ ($5,991.30) /CSub Total $49,187.06 /CLarge Use 63,572 69,007 5,435 5,975 -4,923 10,898 4.7406$ 4.7916$ $29,567.28 /C
Transformer Allowance 5,601 -4,705 10,306 0.62-$ 0.62-$ ($3,554.61) /CSub Total $26,012.66 /CTotal 60,656,832 132,399 102,564,996 402,581 41,908,164 270,182 295,036 8,896,223 82,123 33,011,941 212,913 Total $912,652.00 $1,670,480.55 $2,583,132.55 /C
Transformer Allowance 68,913 11,201 57,711 Transformer Allowance ($43,429.04) ($43,429.04) /CTotal (Net of Transformer Allow) $912,652.00 $1,627,051.51 $2,539,703.51 /C
*Volumetric Rate Riders include foregone revenue and application of tax change.
**CSMUR rate class implementation date Jun 01, 2013. Prior years were included in Residential class.
Distribution Volumetric Rate
(Jun - Dec)*Entry for 1568 LRAM Account
Distribution Volumetric Rate
(Jan - May)*
A B C = B‐A
CDM Component of approved OEB Forecast
2011 CoS
2013 OPA draft verified CDM (actual impact) Energy Volume to Calculate Variance
Energy Volume to Calculate Variance
(Jan - May)
Energy Volume to Calculate Variance
(Jun - Dec)
Message from the Vice President:
•
•
•
•
•
•
•
Andrew Pride
Top Line Results:
Direct Install Lighting realization rate for peak demand savings has shown an increase of 19% since 2012.
These results are considered draft and may be subject to change. The OPA is committed to providing LDCs with the opportunity to
review and provide feedback. To ensure that all inquiries can be directed to the appropriate OPA contact and addressed prior to the
release of the 2013 Final Verified Results, please e-mail a list of questions and/or concerns to LDC Support
([email protected]) by Monday, August 11, 2014.
The Final 2013 Verified Results Report will be available to all LDCs on or before August 31, 2014. At that time, all results will be
considered final for 2013. Any variances in 2013 program activity not captured will be reported in the Final 2014 Verified Results
Report (to be issued in 2015), through the 2013 adjustments process.
We appreciate your collaboration and support throughout the reporting and evaluation process and we look forward to another
successful year ahead.
The OPA is pleased to provide the enclosed Draft 2013 Verified Results Report. This report is designed to provide preliminary
information on the Draft 2013 Verified Results and to help populate LDC Annual Report templates that will be submitted to the OEB
in September.
Please note that the 2013 Draft Verified Results within this report may vary from the unverified Q4 2013 Preliminary Unverified
Report for the following reasons:
Sincerely
We have achieved 85% of our cumulative energy savings target and 49% of our annual peak demand savings target to date
(Scenario 2), representing a 31% and 51% improvement over 2012 verified results respectively.
The Business Programs continue to perform well, representing 74% of the cumulative energy savings and 69% of the annual
peak demand savings (Scenario 1).
There are currently three verified Process and System Upgrades projects contributing savings. Process and System Upgrades
has a healthy pipeline of 22 contracted projects and 201 studies which will likely result in significant savings in 2014.
This report includes both the 2011 and 2012 adjustments. The adjustments analysis ensures that energy and demand
savings are properly categorized in the year that they were achieved and that any variances identified after the release of
the 2011 and 2012 Final Results Report are properly accounted for and reported to the LDCs. The adjustments will be
identified in the year following implementation, while the cumulative effect will be accounted for in the implementation
year.
Home Assistance Program realization rates have declined by 17% for peak demand and 11% for energy savings. The net-to-
gross ratios remain the same at 100%.
Retrofit realization rate for peak demand savings has declined by 2% and the net-to-gross ratio has declined by 3%. The
realization rate and net-to-gross ratio have both declined by 4% for energy savings.
ACrespo
Typewritten Text
Toronto Hydro-Electric System Limited EB-2014-0116 Exhibit 9, Tab 2, Schedule 5 Appendix B Filed: 2014 Jul 31 Corrected: 2014 Sep 23 (30 pages)
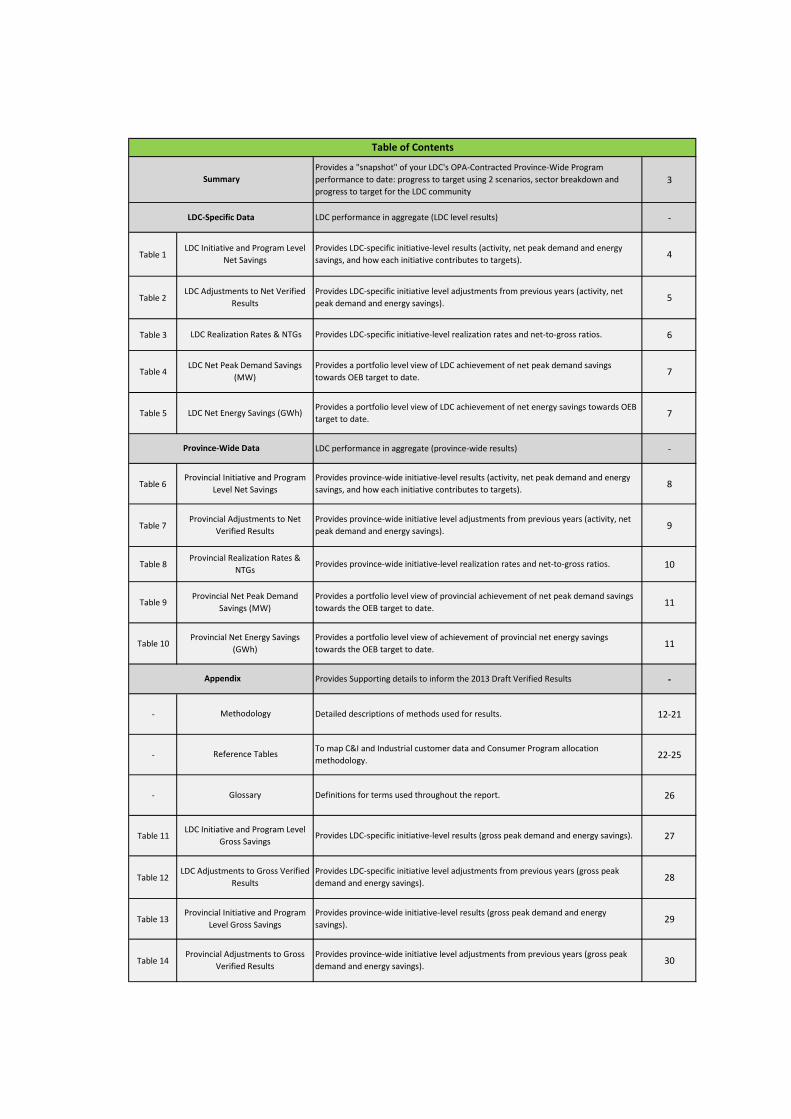
3
-
Table 1 4
Table 2 5
Table 3 6
Table 4 7
Table 5 7
-
Table 6 8
Table 7 9
Table 8 10
Table 9 11
Table 10 11
-
- 12-21
- 22-25
- 26
Table 11 27
Table 12 28
Table 13 29
Table 14 30
Detailed descriptions of methods used for results.
To map C&I and Industrial customer data and Consumer Program allocation
methodology.
Provincial Adjustments to Net
Verified Results
Provides province-wide initiative level adjustments from previous years (activity, net
peak demand and energy savings).
Provides province-wide initiative level adjustments from previous years (gross peak
demand and energy savings).
Provides province-wide initiative-level results (gross peak demand and energy
savings).
LDC Initiative and Program Level
Gross Savings
LDC Adjustments to Gross Verified
Results
Provincial Initiative and Program
Level Gross Savings
Provincial Adjustments to Gross
Verified Results
Provides LDC-specific initiative level adjustments from previous years (gross peak
demand and energy savings).
LDC Adjustments to Net Verified
Results
LDC Realization Rates & NTGs
LDC Net Peak Demand Savings
(MW)
LDC Net Energy Savings (GWh)
Provides LDC-specific initiative-level results (gross peak demand and energy savings).
Provides province-wide initiative-level realization rates and net-to-gross ratios.Provincial Realization Rates &
NTGs
Provincial Net Peak Demand
Savings (MW)
Provincial Net Energy Savings
(GWh)
Methodology
Reference Tables
Glossary
Provincial Initiative and Program
Level Net Savings
Definitions for terms used throughout the report.
Appendix Provides Supporting details to inform the 2013 Draft Verified Results
Provides a portfolio level view of LDC achievement of net peak demand savings
towards OEB target to date.
Provides a portfolio level view of LDC achievement of net energy savings towards OEB
target to date.
Provides a portfolio level view of provincial achievement of net peak demand savings
towards the OEB target to date.
Provides a portfolio level view of achievement of provincial net energy savings
towards the OEB target to date.
Table of Contents
Provides province-wide initiative-level results (activity, net peak demand and energy
savings, and how each initiative contributes to targets).
Provides LDC-specific initiative-level results (activity, net peak demand and energy
savings, and how each initiative contributes to targets).
Provides LDC-specific initiative level adjustments from previous years (activity, net
peak demand and energy savings).
Provides LDC-specific initiative-level realization rates and net-to-gross ratios.
LDC-Specific Data LDC performance in aggregate (LDC level results)
Province-Wide Data
Summary
Provides a "snapshot" of your LDC's OPA-Contracted Province-Wide Program
performance to date: progress to target using 2 scenarios, sector breakdown and
progress to target for the LDC community
LDC performance in aggregate (province-wide results)
LDC Initiative and Program Level
Net Savings

LDC: Toronto Hydro-Electric System Limited
2013
Incremental
Program-to-Date
Progress to Target
(Scenario 1)
Scenario 1: % of
Target Achieved
Scenario 2: % of
Target Achieved
Net Annual Peak Demand Savings (MW) 94.1 84.4 29.5% 52.9%
Net Energy Savings (GWh) 127.8 1,281.8 98.3% 98.4%
Scenario 1 = Assumes that demand response resources have a persistence of 1 year
Scenario 2 = Assumes that demand response resources remain in your territory until 2014
*Other includes adjustments to previous years' results and savings from pre-2011 intiatives
# of LDCs (Peak Demand Savings Achievement)Your Progress # of LDCs (Energy Savings Achievement)Your Progress
0 0-5% 9 0
5% 5-10% 20 4
10% 10-15% 24 3
15% 15-20% 10 11
20% 20-25% 5 4
25% 25-30% 2 10
30% 30-35% 3 14
35% 35-40% 0 14
40% 40-45% 0 3
45% 45-50% 0 4
50% 50-55% 0 0 5
55% 55-60% 0 1
60% >60% 4 4 4
(aligns with Scenario 2)
OPA-Contracted Province-Wide CDM Programs Draft Verified 2013 Results
The following graphs assume that demand response resources remain in your territory until 2014
Achievement by Sector
Comparison: Your Achievement vs. LDC Community Achievement (Progress to Target)
FINAL 2013 Progress to Targets
0
2
4
6
8
10
12
14
16
0-5
%
10
-15
%
20
-25
%
30
-35
%
40
-45
%
50
-55
%
60
-65
%
70
-75
%
80
-85
%
90
-95
%
>10
0%
# o
f LD
Cs
in E
ach
Pro
gre
ss B
uck
et
% of OEB Target Achieved
% of OEB Peak Demand Savings Target Achieved
# of LDCs Your Progress
0
2
4
6
8
10
12
14
16
18
0-5
%
10
-15
%
20
-25
%
30
-35
%
40
-45
%
50
-55
%
60
-65
%
70
-75
%
80
-85
%
90
-95
%
>10
0%
# o
f LD
Cs
in E
ach
Pro
gre
ss B
uck
et
% of OEB Target Achieved
% of OEB Energy Savings Target Achieved
# of LDCs Your Progress --- Provincial Progress
40%
28%
27%
0% 0% 3% 2%
2013 Incremental
Peak Demand Savings (MW)
Consumer Business Industrial HAP ACP Program Enabled Other*
7%
80%
3% 1% 0%
0% 9%
2013 Incremental Energy Savings (GWh)
--- Provincial Progress
Toronto Hydro-Electric System Limited 2013 Draft Verified Results 3
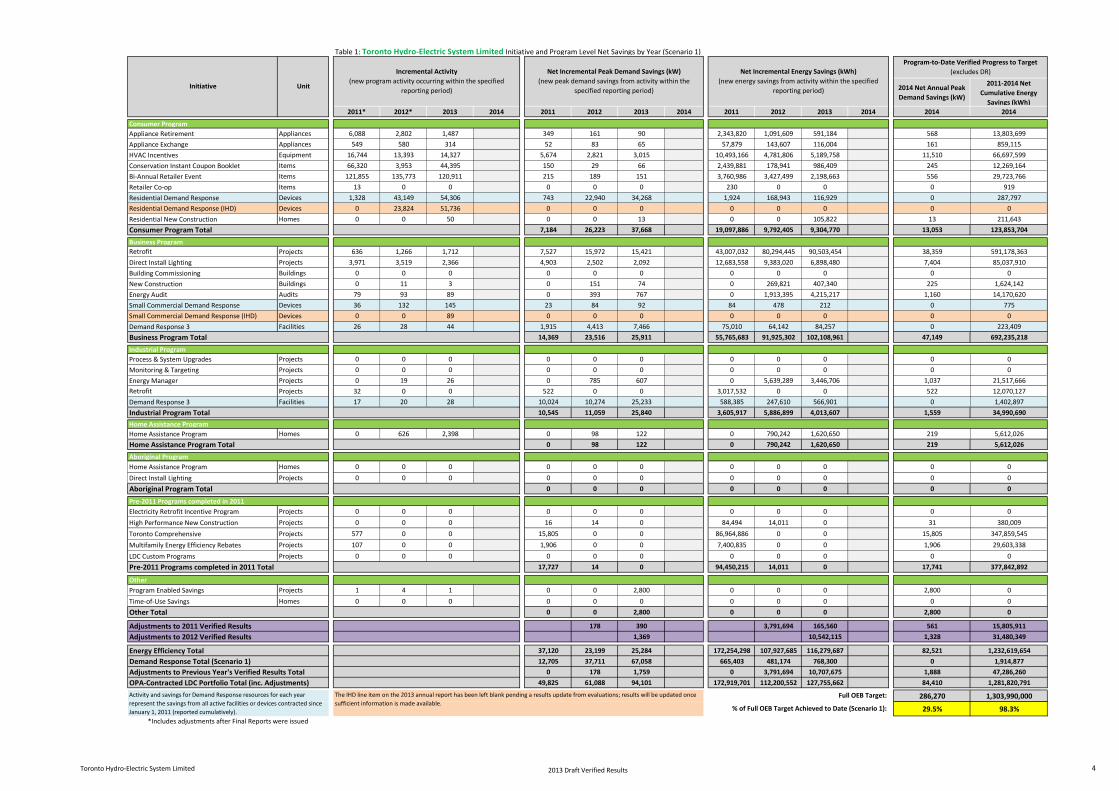
Table 1: Toronto Hydro-Electric System Limited Initiative and Program Level Net Savings by Year (Scenario 1)
2014 Net Annual Peak
Demand Savings (kW)
2011-2014 Net
Cumulative Energy
Savings (kWh)
2011* 2012* 2013 2014 2011 2012 2013 2014 2011 2012 2013 2014 2014 2014
Consumer Program
Appliance Retirement Appliances 6,088 2,802 1,487 349 161 90 2,343,820 1,091,609 591,184 568 13,803,699
Appliance Exchange Appliances 549 580 314 52 83 65 57,879 143,607 116,004 161 859,115
HVAC Incentives Equipment 16,744 13,393 14,327 5,674 2,821 3,015 10,493,166 4,781,806 5,189,758 11,510 66,697,599
Conservation Instant Coupon Booklet Items 66,320 3,953 44,395 150 29 66 2,439,881 178,941 986,409 245 12,269,164
Bi-Annual Retailer Event Items 121,855 135,773 120,911 215 189 151 3,760,986 3,427,499 2,198,663 556 29,723,766
Retailer Co-op Items 13 0 0 0 0 0 230 0 0 0 919
Residential Demand Response Devices 1,328 43,149 54,306 743 22,940 34,268 1,924 168,943 116,929 0 287,797
Residential Demand Response (IHD) Devices 0 23,824 51,736 0 0 0 0 0 0 0 0
Residential New Construction Homes 0 0 50 0 0 13 0 0 105,822 13 211,643
Consumer Program Total 7,184 26,223 37,668 19,097,886 9,792,405 9,304,770 13,053 123,853,704
Business Program
Retrofit Projects 636 1,266 1,712 7,527 15,972 15,421 43,007,032 80,294,445 90,503,454 38,359 591,178,363
Direct Install Lighting Projects 3,971 3,519 2,366 4,903 2,502 2,092 12,683,558 9,383,020 6,898,480 7,404 85,037,910
Building Commissioning Buildings 0 0 0 0 0 0 0 0 0 0 0
New Construction Buildings 0 11 3 0 151 74 0 269,821 407,340 225 1,624,142
Energy Audit Audits 79 93 89 0 393 767 0 1,913,395 4,215,217 1,160 14,170,620
Small Commercial Demand Response Devices 36 132 145 23 84 92 84 478 212 0 775
Small Commercial Demand Response (IHD) Devices 0 0 89 0 0 0 0 0 0 0 0
Demand Response 3 Facilities 26 28 44 1,915 4,413 7,466 75,010 64,142 84,257 0 223,409
Business Program Total 14,369 23,516 25,911 55,765,683 91,925,302 102,108,961 47,149 692,235,218
Industrial Program
Process & System Upgrades Projects 0 0 0 0 0 0 0 0 0 0 0
Monitoring & Targeting Projects 0 0 0 0 0 0 0 0 0 0 0
Energy Manager Projects 0 19 26 0 785 607 0 5,639,289 3,446,706 1,037 21,517,666
Retrofit Projects 32 0 0 522 0 0 3,017,532 0 0 522 12,070,127
Demand Response 3 Facilities 17 20 28 10,024 10,274 25,233 588,385 247,610 566,901 0 1,402,897
Industrial Program Total 10,545 11,059 25,840 3,605,917 5,886,899 4,013,607 1,559 34,990,690
Home Assistance Program
Home Assistance Program Homes 0 626 2,398 0 98 122 0 790,242 1,620,650 219 5,612,026
Home Assistance Program Total 0 98 122 0 790,242 1,620,650 219 5,612,026
Aboriginal Program
Home Assistance Program Homes 0 0 0 0 0 0 0 0 0 0 0
Direct Install Lighting Projects 0 0 0 0 0 0 0 0 0 0 0
Aboriginal Program Total 0 0 0 0 0 0 0 0
Pre-2011 Programs completed in 2011
Electricity Retrofit Incentive Program Projects 0 0 0 0 0 0 0 0 0 0 0
High Performance New Construction Projects 0 0 0 16 14 0 84,494 14,011 0 31 380,009
Toronto Comprehensive Projects 577 0 0 15,805 0 0 86,964,886 0 0 15,805 347,859,545
Multifamily Energy Efficiency Rebates Projects 107 0 0 1,906 0 0 7,400,835 0 0 1,906 29,603,338
LDC Custom Programs Projects 0 0 0 0 0 0 0 0 0 0 0
Pre-2011 Programs completed in 2011 Total 17,727 14 0 94,450,215 14,011 0 17,741 377,842,892
Other
Program Enabled Savings Projects 1 4 1 0 0 2,800 0 0 0 2,800 0
Time-of-Use Savings Homes 0 0 0 0 0 0 0 0 0 0 0
Other Total 0 0 2,800 0 0 0 2,800 0
Adjustments to 2011 Verified Results 178 390 3,791,694 165,560 561 15,805,911
Adjustments to 2012 Verified Results 1,369 10,542,115 1,328 31,480,349
Energy Efficiency Total 37,120 23,199 25,284 172,254,298 107,927,685 116,279,687 82,521 1,232,619,654
Demand Response Total (Scenario 1) 12,705 37,711 67,058 665,403 481,174 768,300 0 1,914,877
Adjustments to Previous Year's Verified Results Total 0 178 1,759 0 3,791,694 10,707,675 1,888 47,286,260
OPA-Contracted LDC Portfolio Total (inc. Adjustments) 49,825 61,088 94,101 172,919,701 112,200,552 127,755,662 84,410 1,281,820,791
286,270 1,303,990,000
29.5% 98.3%
*Includes adjustments after Final Reports were issued
Activity and savings for Demand Response resources for each year
represent the savings from all active facilities or devices contracted since
January 1, 2011 (reported cumulatively).
Program-to-Date Verified Progress to Target
(excludes DR)
Initiative Unit
Incremental Activity
(new program activity occurring within the specified
reporting period)
Net Incremental Peak Demand Savings (kW)
(new peak demand savings from activity within the
specified reporting period)
Net Incremental Energy Savings (kWh)
(new energy savings from activity within the specified
reporting period)
The IHD line item on the 2013 annual report has been left blank pending a results update from evaluations; results will be updated once
sufficient information is made available.% of Full OEB Target Achieved to Date (Scenario 1):
Full OEB Target:
Toronto Hydro-Electric System Limited 2013 Draft Verified Results 4

Table 2: Adjustments to Toronto Hydro-Electric System Limited Net Verified Results due to Variances
2011* 2012* 2013 2014 2011 2012 2013 2014 2011 2012 2013 2014
Consumer Program
Appliance Retirement Appliances 0 0 0 0 0 0
Appliance Exchange Appliances 0 0 0 0 0 0
HVAC Incentives Equipment -3,164 346 -863 70 -1,572,488 138,411
Conservation Instant Coupon Booklet Items 1,051 0 2 0 35,278 0
Bi-Annual Retailer Event Items 10,471 0 14 0 279,429 0
Retailer Co-op Items 0 0 0 0 0 0
Residential Demand Response Devices 0 0 0 0 0 0
Residential Demand Response (IHD) Devices 0 0 0 0 0 0
Residential New Construction Homes 0 0 0 0 0 0
Consumer Program Total -847 70 -1,257,781 138,411
Business Program
Retrofit Projects 54 98 905 1,050 4,543,720 7,525,905
Direct Install Lighting Projects 25 21 32 48 78,682 164,080
Building Commissioning Buildings 0 0 0 0 0 0
New Construction Buildings 0 0 0 0 0 0
Energy Audit Audits 19 17 88 0 427,996 0
Small Commercial Demand Response Devices 0 0 0 0 0 0
Small Commercial Demand Response (IHD) Devices 0 0 0 0 0 0
Demand Response 3 Facilities 0 0 0 0 0 0
Business Program Total 1,025 1,098 5,050,398 7,689,985
Industrial Program
Process & System Upgrades Projects 0 0 0 0 0 0
Monitoring & Targeting Projects 0 0 0 0 0 0
Energy Manager Projects 0 0 0 0 0 0
Retrofit Projects 0 0 0 0 0 0
Demand Response 3 Facilities 0 0 0 0 0 0
Industrial Program Total 0 0 0 0
Home Assistance Program
Home Assistance Program Homes 0 0 0 0 0 0
Home Assistance Program Total 0 0 0 0
Aboriginal Program
Home Assistance Program Homes 0 0 0 0 0 0
Direct Install Lighting Projects 0 0 0 0 0 0
Aboriginal Program Total 0 0 0 0
Pre-2011 Programs completed in 2011
Electricity Retrofit Incentive Program Projects 0 0 0 0 0 0
High Performance New Construction Projects 0 0 0 0 0 0
Toronto Comprehensive Projects 0 0 0 0 0 0
Multifamily Energy Efficiency Rebates Projects 0 0 0 0 0 0
LDC Custom Programs Projects 0 0 0 0 0 0
Pre-2011 Programs completed in 2011 Total 0 0 0 0
Other
Program Enabled Savings Projects 1 3 390 202 164,800 2,713,720
Time-of-Use Savings Homes 0 0 0 0 0 0
Other Total 390 202 164,800 2,713,720
Adjustments to 2011 Verified Results 568 3,957,417
Adjustments to 2012 Verified Results 1,369 10,542,115
Total Adjustments to Previous Year's Verified Results 568 1,369 3,957,417 10,542,115
Activity and savings for Demand Response resources for each year represent the
savings from all active facilities or devices contracted since January 1, 2011
(reported cumulatively).
Net Incremental Peak Demand Savings (kW)
(new peak demand savings from activity within the specified
reporting period)
Net Incremental Energy Savings (kWh)
(new energy savings from activity within the specified reporting
period)Initiative Unit
Incremental Activity
(new program activity occurring within the specified reporting
period)
The IHD line item on the 2013 annual report has been left blank pending a results update from evaluations;
results will be updated once sufficient information is made available.Adjustments to previous years' results shown in this table will not align to adjustments shown in Table 1 as
the information presented above does not consider persistence of savings
Toronto Hydro-Electric System Limited 2013 Draft Verified Results 5
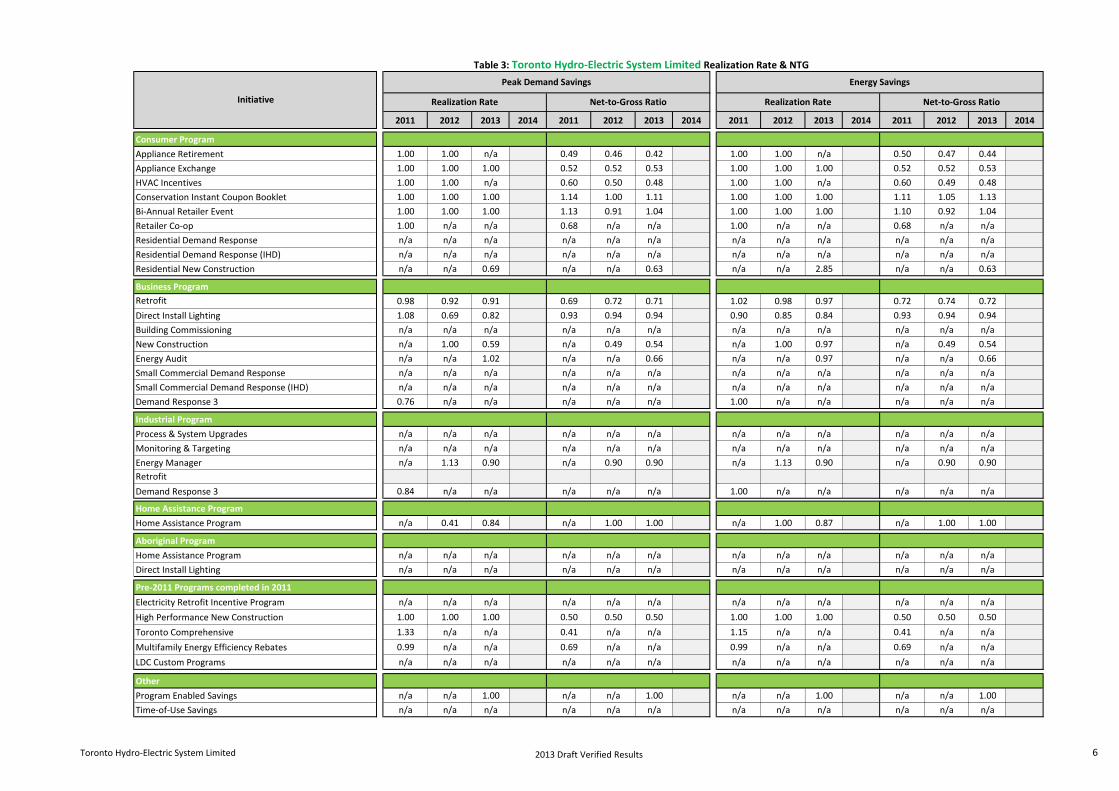
Table 3: Toronto Hydro-Electric System Limited Realization Rate & NTG
2011 2012 2013 2014 2011 2012 2013 2014 2011 2012 2013 2014 2011 2012 2013 2014
Consumer Program
Appliance Retirement 1.00 1.00 n/a 0.49 0.46 0.42 1.00 1.00 n/a 0.50 0.47 0.44
Appliance Exchange 1.00 1.00 1.00 0.52 0.52 0.53 1.00 1.00 1.00 0.52 0.52 0.53
HVAC Incentives 1.00 1.00 n/a 0.60 0.50 0.48 1.00 1.00 n/a 0.60 0.49 0.48
Conservation Instant Coupon Booklet 1.00 1.00 1.00 1.14 1.00 1.11 1.00 1.00 1.00 1.11 1.05 1.13
Bi-Annual Retailer Event 1.00 1.00 1.00 1.13 0.91 1.04 1.00 1.00 1.00 1.10 0.92 1.04
Retailer Co-op 1.00 n/a n/a 0.68 n/a n/a 1.00 n/a n/a 0.68 n/a n/a
Residential Demand Response n/a n/a n/a n/a n/a n/a n/a n/a n/a n/a n/a n/a
Residential Demand Response (IHD) n/a n/a n/a n/a n/a n/a n/a n/a n/a n/a n/a n/a
Residential New Construction n/a n/a 0.69 n/a n/a 0.63 n/a n/a 2.85 n/a n/a 0.63
Business Program
Retrofit 0.98 0.92 0.91 0.69 0.72 0.71 1.02 0.98 0.97 0.72 0.74 0.72
Direct Install Lighting 1.08 0.69 0.82 0.93 0.94 0.94 0.90 0.85 0.84 0.93 0.94 0.94
Building Commissioning n/a n/a n/a n/a n/a n/a n/a n/a n/a n/a n/a n/a
New Construction n/a 1.00 0.59 n/a 0.49 0.54 n/a 1.00 0.97 n/a 0.49 0.54
Energy Audit n/a n/a 1.02 n/a n/a 0.66 n/a n/a 0.97 n/a n/a 0.66
Small Commercial Demand Response n/a n/a n/a n/a n/a n/a n/a n/a n/a n/a n/a n/a
Small Commercial Demand Response (IHD) n/a n/a n/a n/a n/a n/a n/a n/a n/a n/a n/a n/a
Demand Response 3 0.76 n/a n/a n/a n/a n/a 1.00 n/a n/a n/a n/a n/a
Industrial Program
Process & System Upgrades n/a n/a n/a n/a n/a n/a n/a n/a n/a n/a n/a n/a
Monitoring & Targeting n/a n/a n/a n/a n/a n/a n/a n/a n/a n/a n/a n/a
Energy Manager n/a 1.13 0.90 n/a 0.90 0.90 n/a 1.13 0.90 n/a 0.90 0.90
Retrofit
Demand Response 3 0.84 n/a n/a n/a n/a n/a 1.00 n/a n/a n/a n/a n/a
Home Assistance Program
Home Assistance Program n/a 0.41 0.84 n/a 1.00 1.00 n/a 1.00 0.87 n/a 1.00 1.00
Aboriginal Program
Home Assistance Program n/a n/a n/a n/a n/a n/a n/a n/a n/a n/a n/a n/a
Direct Install Lighting n/a n/a n/a n/a n/a n/a n/a n/a n/a n/a n/a n/a
Pre-2011 Programs completed in 2011
Electricity Retrofit Incentive Program n/a n/a n/a n/a n/a n/a n/a n/a n/a n/a n/a n/a
High Performance New Construction 1.00 1.00 1.00 0.50 0.50 0.50 1.00 1.00 1.00 0.50 0.50 0.50
Toronto Comprehensive 1.33 n/a n/a 0.41 n/a n/a 1.15 n/a n/a 0.41 n/a n/a
Multifamily Energy Efficiency Rebates 0.99 n/a n/a 0.69 n/a n/a 0.99 n/a n/a 0.69 n/a n/a
LDC Custom Programs n/a n/a n/a n/a n/a n/a n/a n/a n/a n/a n/a n/a
Other
Program Enabled Savings n/a n/a 1.00 n/a n/a 1.00 n/a n/a 1.00 n/a n/a 1.00
Time-of-Use Savings n/a n/a n/a n/a n/a n/a n/a n/a n/a n/a n/a n/a
Initiative Realization Rate Net-to-Gross Ratio
Peak Demand Savings Energy Savings
Realization Rate Net-to-Gross Ratio
Toronto Hydro-Electric System Limited 2013 Draft Verified Results 6
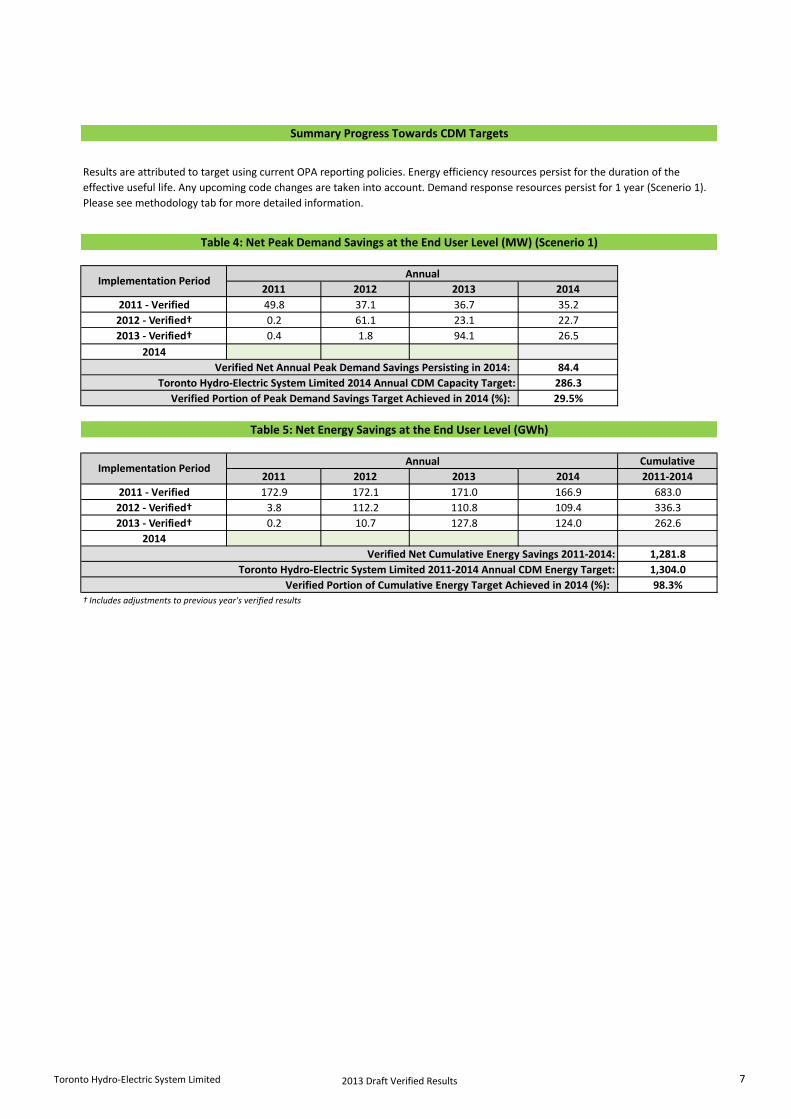
2011 2012 2013 2014
2011 - Verified 49.8 37.1 36.7 35.2
2012 - Verified† 0.2 61.1 23.1 22.7
2013 - Verified† 0.4 1.8 94.1 26.5
2014
84.4
286.3
29.5%
Cumulative
2011 2012 2013 2014 2011-2014
2011 - Verified 172.9 172.1 171.0 166.9 683.0
2012 - Verified† 3.8 112.2 110.8 109.4 336.3
2013 - Verified† 0.2 10.7 127.8 124.0 262.6
2014
1,281.8
1,304.0
98.3%
† Includes adjustments to previous year's verified results
Toronto Hydro-Electric System Limited 2011-2014 Annual CDM Energy Target:
Verified Portion of Cumulative Energy Target Achieved in 2014 (%):
Table 5: Net Energy Savings at the End User Level (GWh)
Verified Portion of Peak Demand Savings Target Achieved in 2014 (%):
Implementation PeriodAnnual
Verified Net Cumulative Energy Savings 2011-2014:
Toronto Hydro-Electric System Limited 2014 Annual CDM Capacity Target:
Summary Progress Towards CDM Targets
Implementation PeriodAnnual
Verified Net Annual Peak Demand Savings Persisting in 2014:
Table 4: Net Peak Demand Savings at the End User Level (MW) (Scenerio 1)
Results are attributed to target using current OPA reporting policies. Energy efficiency resources persist for the duration of the
effective useful life. Any upcoming code changes are taken into account. Demand response resources persist for 1 year (Scenerio 1).
Please see methodology tab for more detailed information.
Toronto Hydro-Electric System Limited 2013 Draft Verified Results 7
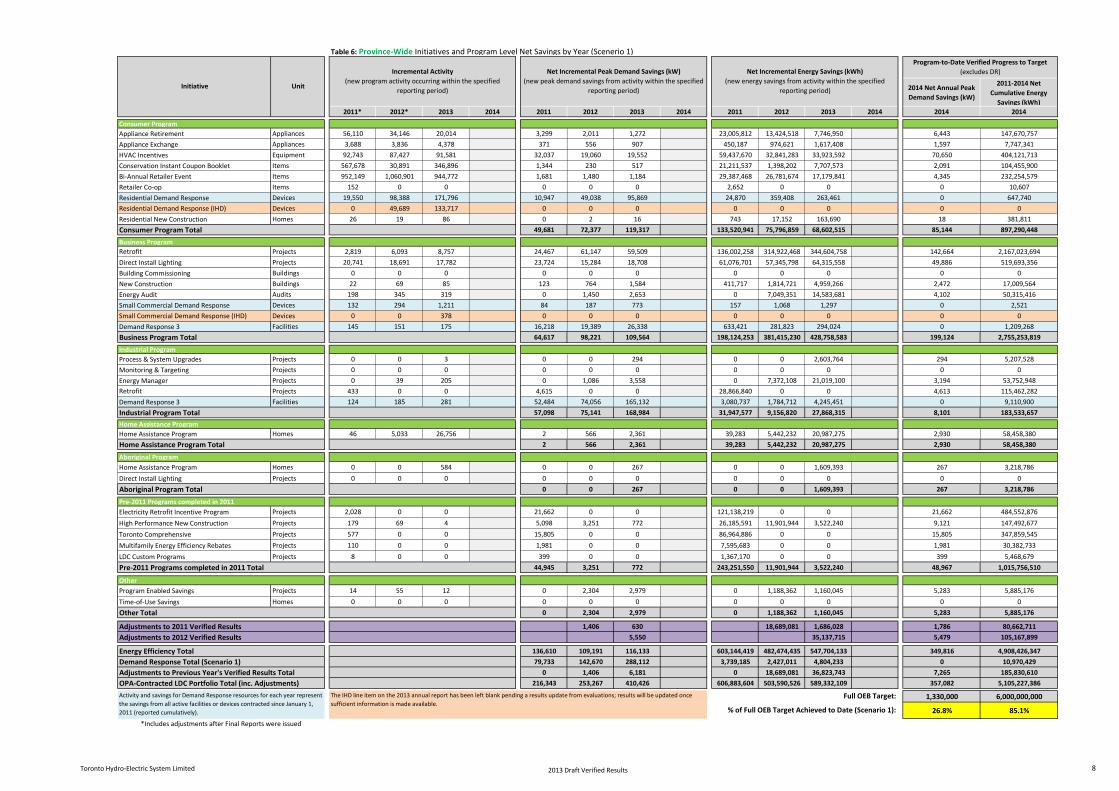
Table 6: Province-Wide Initiatives and Program Level Net Savings by Year (Scenerio 1)
2014 Net Annual Peak
Demand Savings (kW)
2011-2014 Net
Cumulative Energy
Savings (kWh)
2011* 2012* 2013 2014 2011 2012 2013 2014 2011 2012 2013 2014 2014 2014
Consumer Program
Appliance Retirement Appliances 56,110 34,146 20,014 3,299 2,011 1,272 23,005,812 13,424,518 7,746,950 6,443 147,670,757
Appliance Exchange Appliances 3,688 3,836 4,378 371 556 907 450,187 974,621 1,617,408 1,597 7,747,341
HVAC Incentives Equipment 92,743 87,427 91,581 32,037 19,060 19,552 59,437,670 32,841,283 33,923,592 70,650 404,121,713
Conservation Instant Coupon Booklet Items 567,678 30,891 346,896 1,344 230 517 21,211,537 1,398,202 7,707,573 2,091 104,455,900
Bi-Annual Retailer Event Items 952,149 1,060,901 944,772 1,681 1,480 1,184 29,387,468 26,781,674 17,179,841 4,345 232,254,579
Retailer Co-op Items 152 0 0 0 0 0 2,652 0 0 0 10,607
Residential Demand Response Devices 19,550 98,388 171,796 10,947 49,038 95,869 24,870 359,408 263,461 0 647,740
Residential Demand Response (IHD) Devices 0 49,689 133,717 0 0 0 0 0 0 0 0
Residential New Construction Homes 26 19 86 0 2 16 743 17,152 163,690 18 381,811
Consumer Program Total 49,681 72,377 119,317 133,520,941 75,796,859 68,602,515 85,144 897,290,448
Business Program
Retrofit Projects 2,819 6,093 8,757 24,467 61,147 59,509 136,002,258 314,922,468 344,604,758 142,664 2,167,023,694
Direct Install Lighting Projects 20,741 18,691 17,782 23,724 15,284 18,708 61,076,701 57,345,798 64,315,558 49,886 519,693,356
Building Commissioning Buildings 0 0 0 0 0 0 0 0 0 0 0
New Construction Buildings 22 69 85 123 764 1,584 411,717 1,814,721 4,959,266 2,472 17,009,564
Energy Audit Audits 198 345 319 0 1,450 2,653 0 7,049,351 14,583,681 4,102 50,315,416
Small Commercial Demand Response Devices 132 294 1,211 84 187 773 157 1,068 1,297 0 2,521
Small Commercial Demand Response (IHD) Devices 0 0 378 0 0 0 0 0 0 0 0
Demand Response 3 Facilities 145 151 175 16,218 19,389 26,338 633,421 281,823 294,024 0 1,209,268
Business Program Total 64,617 98,221 109,564 198,124,253 381,415,230 428,758,583 199,124 2,755,253,819
Industrial Program
Process & System Upgrades Projects 0 0 3 0 0 294 0 0 2,603,764 294 5,207,528
Monitoring & Targeting Projects 0 0 0 0 0 0 0 0 0 0 0
Energy Manager Projects 0 39 205 0 1,086 3,558 0 7,372,108 21,019,100 3,194 53,752,948
Retrofit Projects 433 0 0 4,615 0 0 28,866,840 0 0 4,613 115,462,282
Demand Response 3 Facilities 124 185 281 52,484 74,056 165,132 3,080,737 1,784,712 4,245,451 0 9,110,900
Industrial Program Total 57,098 75,141 168,984 31,947,577 9,156,820 27,868,315 8,101 183,533,657
Home Assistance Program
Home Assistance Program Homes 46 5,033 26,756 2 566 2,361 39,283 5,442,232 20,987,275 2,930 58,458,380
Home Assistance Program Total 2 566 2,361 39,283 5,442,232 20,987,275 2,930 58,458,380
Aboriginal Program
Home Assistance Program Homes 0 0 584 0 0 267 0 0 1,609,393 267 3,218,786
Direct Install Lighting Projects 0 0 0 0 0 0 0 0 0 0 0
Aboriginal Program Total 0 0 267 0 0 1,609,393 267 3,218,786
Pre-2011 Programs completed in 2011
Electricity Retrofit Incentive Program Projects 2,028 0 0 21,662 0 0 121,138,219 0 0 21,662 484,552,876
High Performance New Construction Projects 179 69 4 5,098 3,251 772 26,185,591 11,901,944 3,522,240 9,121 147,492,677
Toronto Comprehensive Projects 577 0 0 15,805 0 0 86,964,886 0 0 15,805 347,859,545
Multifamily Energy Efficiency Rebates Projects 110 0 0 1,981 0 0 7,595,683 0 0 1,981 30,382,733
LDC Custom Programs Projects 8 0 0 399 0 0 1,367,170 0 0 399 5,468,679
Pre-2011 Programs completed in 2011 Total 44,945 3,251 772 243,251,550 11,901,944 3,522,240 48,967 1,015,756,510
Other
Program Enabled Savings Projects 14 55 12 0 2,304 2,979 0 1,188,362 1,160,045 5,283 5,885,176
Time-of-Use Savings Homes 0 0 0 0 0 0 0 0 0 0 0
Other Total 0 2,304 2,979 0 1,188,362 1,160,045 5,283 5,885,176
Adjustments to 2011 Verified Results 1,406 630 18,689,081 1,686,028 1,786 80,662,711
Adjustments to 2012 Verified Results 5,550 35,137,715 5,479 105,167,899
Energy Efficiency Total 136,610 109,191 116,133 603,144,419 482,474,435 547,704,133 349,816 4,908,426,347
Demand Response Total (Scenario 1) 79,733 142,670 288,112 3,739,185 2,427,011 4,804,233 0 10,970,429
Adjustments to Previous Year's Verified Results Total 0 1,406 6,181 0 18,689,081 36,823,743 7,265 185,830,610
OPA-Contracted LDC Portfolio Total (inc. Adjustments) 216,343 253,267 410,426 606,883,604 503,590,526 589,332,109 357,082 5,105,227,386
1,330,000 6,000,000,000
26.8% 85.1%
*Includes adjustments after Final Reports were issued
Program-to-Date Verified Progress to Target
(excludes DR)
Activity and savings for Demand Response resources for each year represent
the savings from all active facilities or devices contracted since January 1,
2011 (reported cumulatively).
Initiative Unit
Incremental Activity
(new program activity occurring within the specified
reporting period)
Net Incremental Peak Demand Savings (kW)
(new peak demand savings from activity within the specified
reporting period)
Net Incremental Energy Savings (kWh)
(new energy savings from activity within the specified
reporting period)
% of Full OEB Target Achieved to Date (Scenario 1):
Full OEB Target:The IHD line item on the 2013 annual report has been left blank pending a results update from evaluations; results will be updated once
sufficient information is made available.
Toronto Hydro-Electric System Limited 2013 Draft Verified Results 8

Table 7: Adjustments to Province-Wide Net Verified Results due to Variances
2011* 2012* 2013 2014 2011 2012 2013 2014 2011 2012 2013 2014
Consumer Program
Appliance Retirement Appliances 0 0 0 0 0 0
Appliance Exchange Appliances 0 0 0 0 0 0
HVAC Incentives Equipment -18,844 2,206 -5,271 452 -9,709,500 907,735
Conservation Instant Coupon Booklet Items 8,216 0 16 0 275,655 0
Bi-Annual Retailer Event Items 81,817 0 108 0 2,183,391 0
Retailer Co-op Items 0 0 0 0 0 0
Residential Demand Response Devices 0 0 0 0 0 0
Residential Demand Response (IHD) Devices 0 0 0 0 0 0
Residential New Construction Homes 19 0 1 0 13,767 0
Consumer Program Total -5,146 452 -7,236,687 907,735
Business Program
Retrofit Projects 303 488 3,204 4,183 16,216,165 27,458,566
Direct Install Lighting Projects 444 197 501 204 1,250,388 736,541
Building Commissioning Buildings 0 0 0 0 0 0
New Construction Buildings 12 0 828 0 3,520,620 0
Energy Audit Audits 95 65 481 0 2,341,392 0
Small Commercial Demand Response Devices 0 0 0 0 0 0
Small Commercial Demand Response (IHD) Devices 0 0 0 0 0 0
Demand Response 3 Facilities 0 0 0 0 0 0
Business Program Total 5,014 4,387 23,328,565 28,195,107
Industrial Program
Process & System Upgrades Projects 0 0 0 0 0 0
Monitoring & Targeting Projects 0 0 0 0 0 0
Energy Manager Projects 0 0 0 0 0 0
Retrofit Projects 0 0 0 0 0 0
Demand Response 3 Facilities 0 0 0 0 0 0
Industrial Program Total 0 0 0 0
Home Assistance Program
Home Assistance Program Homes 0 0 0 0 0 0
Home Assistance Program Total 0 0 0 0
Aboriginal Program
Home Assistance Program Homes 0 0 0 0 0 0
Direct Install Lighting Projects 0 0 0 0 0 0
Aboriginal Program Total 0 0 0 0
Pre-2011 Programs completed in 2011
Electricity Retrofit Incentive Program Projects 12 0 138 0 545,536 0
High Performance New Construction Projects 34 0 1,407 0 2,065,200 0
Toronto Comprehensive Projects 0 0 0 0 0 0
Multifamily Energy Efficiency Rebates Projects 0 0 0 0 0 0
LDC Custom Programs Projects 0 0 0 0 0 0
Pre-2011 Programs completed in 2011 Total 1,545 0 2,610,736 0
Other
Program Enabled Savings Projects 14 39 624 711 1,673,712 6,034,873
Time-of-Use Savings Homes 0 0 0 0 0 0
Other Total 624 711 1,673,712 6,034,873
Adjustments to 2011 Verified Results 2,037 20,376,325
Adjustments to 2012 Verified Results 5,550 35,137,715
Adjustments to Previous Year's Verified Results Total 2,037 5,550 20,376,325 35,137,715
Activity and savings for Demand Response resources for each year represent the savings
from all active facilities or devices contracted since January 1, 2011 (reported
cumulatively).
Initiative Unit
Net Incremental Peak Demand Savings (kW)
(new peak demand savings from activity within the specified
reporting period)
Net Incremental Energy Savings (kWh)
(new energy savings from activity within the specified
reporting period)
Incremental Activity
(new program activity occurring within the specified reporting
period)
The IHD line item on the 2013 annual report has been left blank pending a results update from
evaluations; results will be updated once sufficient information is made available.Adjustments to previous years' results shown in this table will not align to adjustments shown in Table 1
as the information presented above does not consider persistence of savings
Toronto Hydro-Electric System Limited 2013 Draft Verified Results 9

Table 8: Province-Wide Realization Rate & NTG
2011 2012 2013 2014 2011 2012 2013 2014 2011 2012 2013 2014 2011 2012 2013 2014
Consumer Program
Appliance Retirement 1.00 1.00 1.00 0.51 0.46 0.42 1.00 1.00 1.00 0.46 0.47 0.44
Appliance Exchange 1.00 1.00 1.00 0.51 0.52 0.53 1.00 1.00 1.00 0.52 0.52 0.53
HVAC Incentives 1.00 1.00 1.00 0.60 0.50 0.48 1.00 1.00 1.00 0.50 0.49 0.48
Conservation Instant Coupon Booklet 1.00 1.00 1.00 1.14 1.00 1.11 1.00 1.00 1.00 1.00 1.05 1.13
Bi-Annual Retailer Event 1.00 1.00 1.00 1.12 0.91 1.04 1.00 1.00 1.00 0.91 0.92 1.04
Retailer Co-op 1.00 n/a n/a 0.68 n/a n/a n/a n/a n/a n/a n/a n/a
Residential Demand Response n/a n/a n/a n/a n/a n/a n/a n/a n/a n/a n/a n/a
Residential Demand Response (IHD) n/a n/a n/a n/a n/a n/a n/a n/a n/a n/a n/a n/a
Residential New Construction 1.00 3.65 0.78 0.41 0.49 0.63 3.65 7.17 3.09 0.49 0.49 0.63
Business Program
Retrofit 1.06 0.93 0.92 0.72 0.75 0.73 0.93 1.05 1.01 0.75 0.76 0.73
Direct Install Lighting 1.08 0.69 0.82 1.08 0.94 0.94 0.69 0.85 0.84 0.94 0.94 0.94
Building Commissioning n/a n/a n/a n/a n/a n/a n/a n/a n/a n/a n/a n/a
New Construction 0.50 0.98 0.68 0.50 0.49 0.54 0.98 0.99 0.76 0.49 0.49 0.54
Energy Audit n/a n/a 1.02 n/a n/a 0.66 n/a n/a 0.97 n/a n/a 0.66
Small Commercial Demand Response n/a n/a n/a n/a n/a n/a n/a n/a n/a n/a n/a n/a
Small Commercial Demand Response (IHD) n/a n/a n/a n/a n/a n/a n/a n/a n/a n/a n/a n/a
Demand Response 3 0.76 n/a n/a n/a n/a n/a n/a n/a n/a n/a n/a n/a
Industrial Program
Process & System Upgrades n/a n/a 0.85 n/a n/a 0.94 n/a n/a 0.87 n/a n/a 0.93
Monitoring & Targeting n/a n/a n/a n/a n/a n/a n/a n/a n/a n/a n/a n/a
Energy Manager n/a 1.16 0.90 n/a 0.90 0.90 1.16 1.16 0.90 0.90 0.90 0.90
Retrofit 1.11 n/a n/a 0.72 n/a n/a 0.91 n/a n/a 0.75 n/a n/a
Demand Response 3 0.84 n/a n/a n/a n/a n/a n/a n/a n/a n/a n/a n/a
Home Assistance Program
Home Assistance Program 1.00 0.32 0.26 0.70 1.00 1.00 0.32 0.99 0.88 1.00 1.00 1.00
Aboriginal Program
Home Assistance Program n/a n/a 0.05 n/a n/a 1.00 n/a n/a 0.95 n/a n/a 1.00
Direct Install Lighting n/a n/a n/a n/a n/a n/a n/a n/a n/a n/a n/a n/a
Pre-2011 Programs completed in 2011
Electricity Retrofit Incentive Program 0.80 n/a n/a 0.54 n/a n/a n/a n/a n/a n/a n/a n/a
High Performance New Construction 1.00 1.00 1.00 0.49 0.50 0.50 1.00 1.00 1.00 0.50 0.50 0.50
Toronto Comprehensive 1.13 n/a n/a 0.50 n/a n/a n/a n/a n/a n/a n/a n/a
Multifamily Energy Efficiency Rebates 0.93 n/a n/a 0.78 n/a n/a n/a n/a n/a n/a n/a n/a
LDC Custom Programs 1.00 n/a n/a 1.00 n/a n/a n/a n/a n/a n/a n/a n/a
Other
Program Enabled Savings n/a 1.06 1.00 n/a 1.00 1.00 1.06 2.26 1.00 1.00 1.00 1.00
Time-of-Use Savings n/a n/a n/a n/a n/a n/a n/a n/a n/a n/a n/a n/a
Initiative
Peak Demand Savings Energy Savings
Realization Rate Net-to-Gross Ratio Realization Rate Net-to-Gross Ratio
Toronto Hydro-Electric System Limited 2013 Draft Verified Results 10
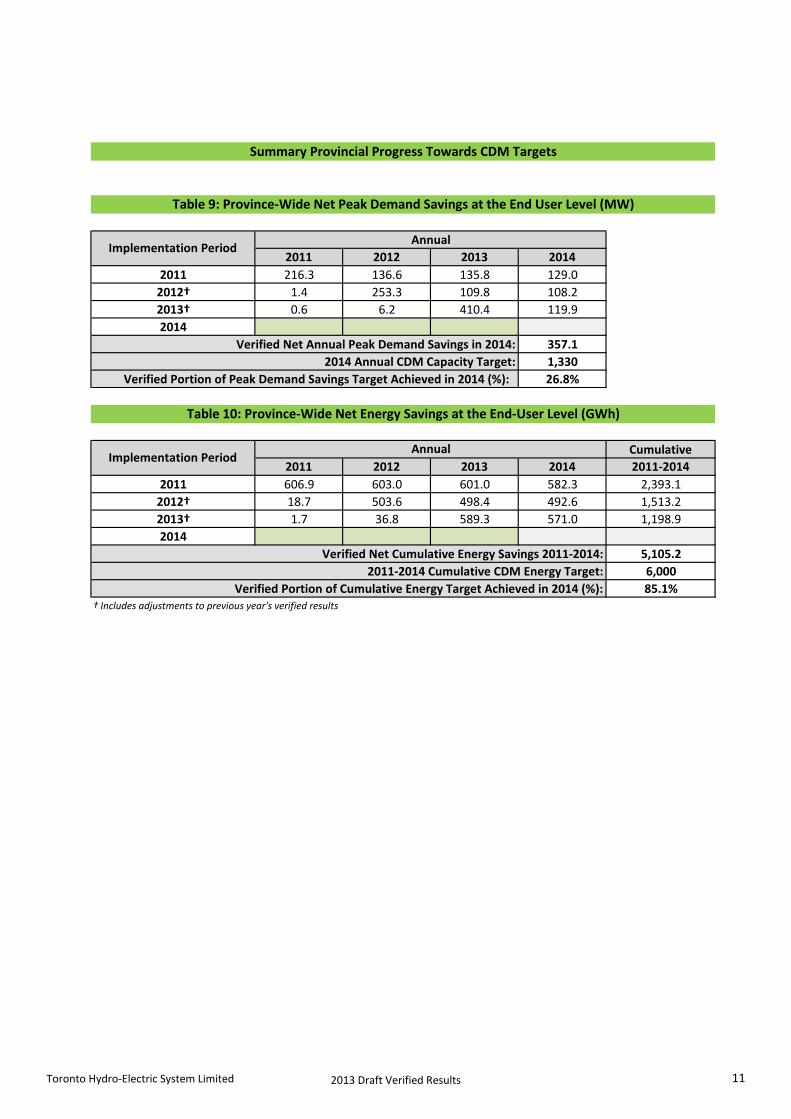
2011 2012 2013 2014
2011 216.3 136.6 135.8 129.0
2012† 1.4 253.3 109.8 108.2
2013† 0.6 6.2 410.4 119.9
2014
357.1
1,330
26.8%
Cumulative
2011 2012 2013 2014 2011-2014
2011 606.9 603.0 601.0 582.3 2,393.1
2012† 18.7 503.6 498.4 492.6 1,513.2
2013† 1.7 36.8 589.3 571.0 1,198.9
2014
5,105.2
6,000
85.1%† Includes adjustments to previous year's verified results
2011-2014 Cumulative CDM Energy Target:
Verified Portion of Cumulative Energy Target Achieved in 2014 (%):
Verified Net Annual Peak Demand Savings in 2014:
2014 Annual CDM Capacity Target:
Verified Portion of Peak Demand Savings Target Achieved in 2014 (%):
Table 10: Province-Wide Net Energy Savings at the End-User Level (GWh)
Implementation PeriodAnnual
Summary Provincial Progress Towards CDM Targets
Implementation PeriodAnnual
Table 9: Province-Wide Net Peak Demand Savings at the End User Level (MW)
Verified Net Cumulative Energy Savings 2011-2014:
Toronto Hydro-Electric System Limited 2013 Draft Verified Results 11
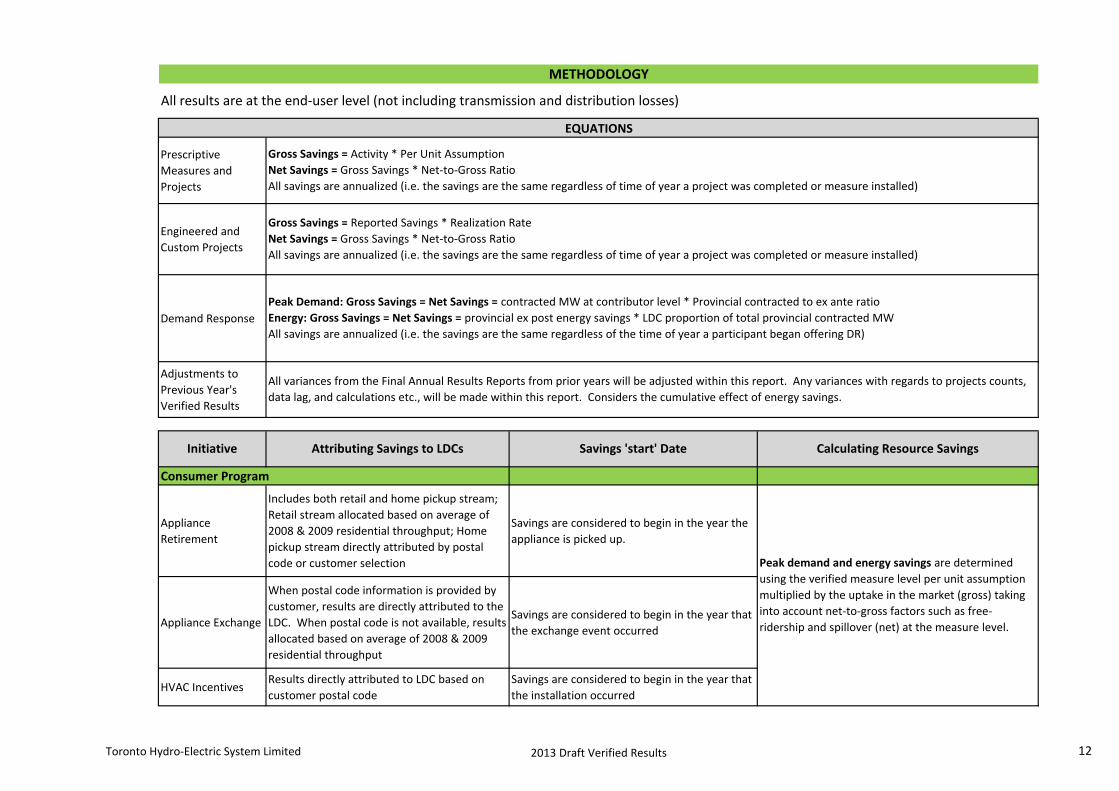
Prescriptive
Measures and
Projects
Engineered and
Custom Projects
Demand Response
Adjustments to
Previous Year's
Verified Results
Consumer Program
Appliance
Retirement
Includes both retail and home pickup stream;
Retail stream allocated based on average of
2008 & 2009 residential throughput; Home
pickup stream directly attributed by postal
code or customer selection
Savings are considered to begin in the year the
appliance is picked up.
Appliance Exchange
When postal code information is provided by
customer, results are directly attributed to the
LDC. When postal code is not available, results
allocated based on average of 2008 & 2009
residential throughput
Savings are considered to begin in the year that
the exchange event occurred
HVAC IncentivesResults directly attributed to LDC based on
customer postal code
Savings are considered to begin in the year that
the installation occurred
Initiative Attributing Savings to LDCs
Peak demand and energy savings are determined
using the verified measure level per unit assumption
multiplied by the uptake in the market (gross) taking
into account net-to-gross factors such as free-
ridership and spillover (net) at the measure level.
All variances from the Final Annual Results Reports from prior years will be adjusted within this report. Any variances with regards to projects counts,
data lag, and calculations etc., will be made within this report. Considers the cumulative effect of energy savings.
Savings 'start' Date Calculating Resource Savings
Gross Savings = Reported Savings * Realization Rate
Net Savings = Gross Savings * Net-to-Gross Ratio
All savings are annualized (i.e. the savings are the same regardless of time of year a project was completed or measure installed)
Peak Demand: Gross Savings = Net Savings = contracted MW at contributor level * Provincial contracted to ex ante ratio
Energy: Gross Savings = Net Savings = provincial ex post energy savings * LDC proportion of total provincial contracted MW
All savings are annualized (i.e. the savings are the same regardless of the time of year a participant began offering DR)
METHODOLOGY
All results are at the end-user level (not including transmission and distribution losses)
EQUATIONS
Gross Savings = Activity * Per Unit Assumption
Net Savings = Gross Savings * Net-to-Gross Ratio
All savings are annualized (i.e. the savings are the same regardless of time of year a project was completed or measure installed)
Toronto Hydro-Electric System Limited 2013 Draft Verified Results 12
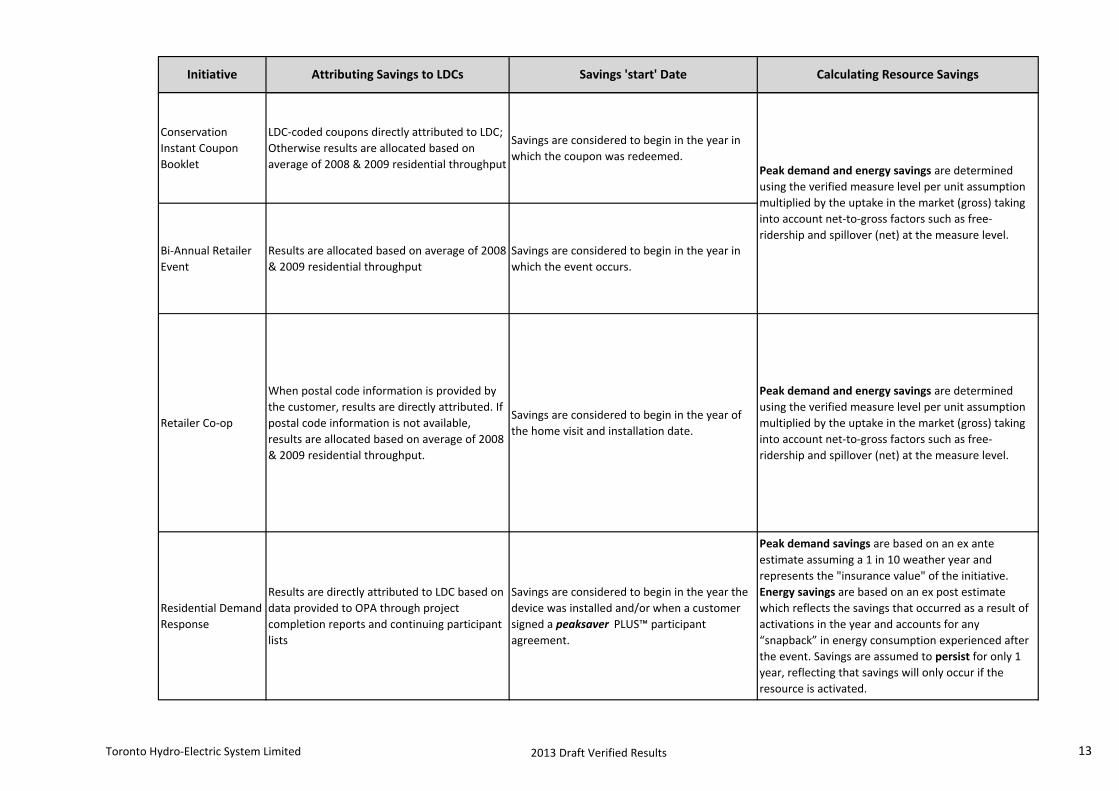
Initiative Attributing Savings to LDCs Savings 'start' Date Calculating Resource Savings
Conservation
Instant Coupon
Booklet
LDC-coded coupons directly attributed to LDC;
Otherwise results are allocated based on
average of 2008 & 2009 residential throughput
Savings are considered to begin in the year in
which the coupon was redeemed.
Bi-Annual Retailer
Event
Results are allocated based on average of 2008
& 2009 residential throughput
Savings are considered to begin in the year in
which the event occurs.
Retailer Co-op
When postal code information is provided by
the customer, results are directly attributed. If
postal code information is not available,
results are allocated based on average of 2008
& 2009 residential throughput.
Savings are considered to begin in the year of
the home visit and installation date.
Peak demand and energy savings are determined
using the verified measure level per unit assumption
multiplied by the uptake in the market (gross) taking
into account net-to-gross factors such as free-
ridership and spillover (net) at the measure level.
Residential Demand
Response
Results are directly attributed to LDC based on
data provided to OPA through project
completion reports and continuing participant
lists
Savings are considered to begin in the year the
device was installed and/or when a customer
signed a peaksaver PLUS™ participant
agreement.
Peak demand savings are based on an ex ante
estimate assuming a 1 in 10 weather year and
represents the "insurance value" of the initiative.
Energy savings are based on an ex post estimate
which reflects the savings that occurred as a result of
activations in the year and accounts for any
“snapback” in energy consumption experienced after
the event. Savings are assumed to persist for only 1
year, reflecting that savings will only occur if the
resource is activated.
Peak demand and energy savings are determined
using the verified measure level per unit assumption
multiplied by the uptake in the market (gross) taking
into account net-to-gross factors such as free-
ridership and spillover (net) at the measure level.
Toronto Hydro-Electric System Limited 2013 Draft Verified Results 13
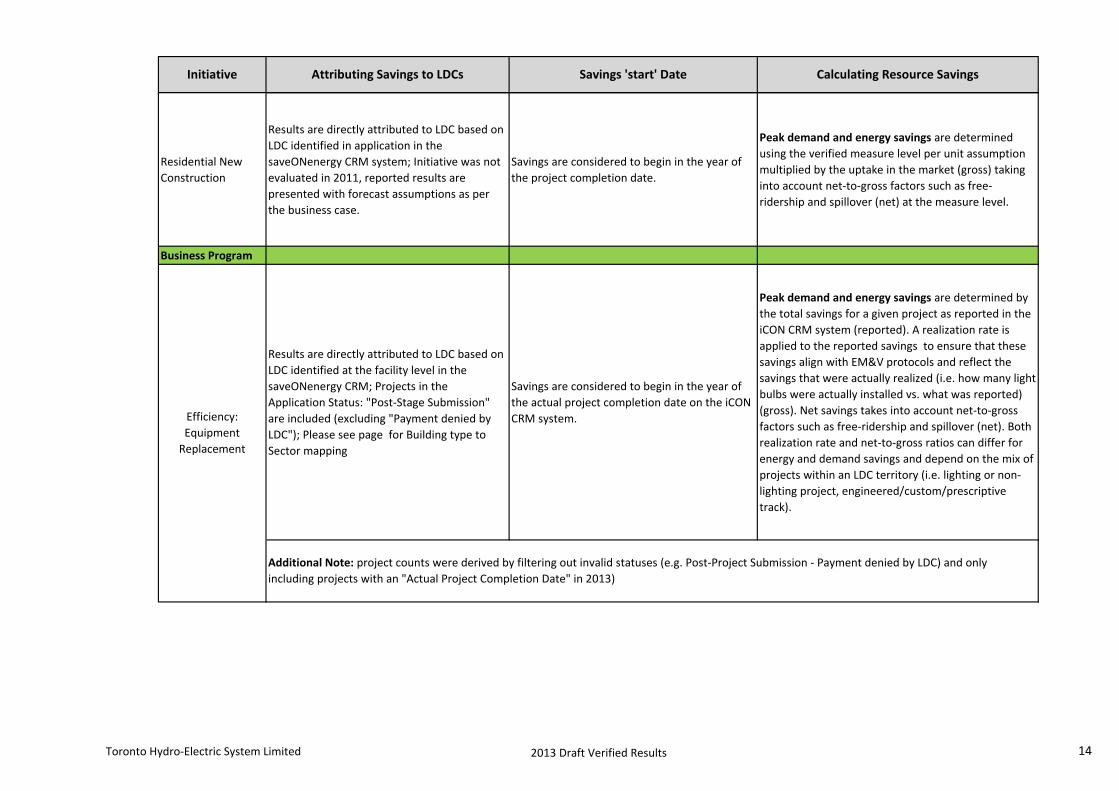
Initiative Attributing Savings to LDCs Savings 'start' Date Calculating Resource Savings
Residential New
Construction
Results are directly attributed to LDC based on
LDC identified in application in the
saveONenergy CRM system; Initiative was not
evaluated in 2011, reported results are
presented with forecast assumptions as per
the business case.
Savings are considered to begin in the year of
the project completion date.
Peak demand and energy savings are determined
using the verified measure level per unit assumption
multiplied by the uptake in the market (gross) taking
into account net-to-gross factors such as free-
ridership and spillover (net) at the measure level.
Business Program
Results are directly attributed to LDC based on
LDC identified at the facility level in the
saveONenergy CRM; Projects in the
Application Status: "Post-Stage Submission"
are included (excluding "Payment denied by
LDC"); Please see page for Building type to
Sector mapping
Savings are considered to begin in the year of
the actual project completion date on the iCON
CRM system.
Peak demand and energy savings are determined by
the total savings for a given project as reported in the
iCON CRM system (reported). A realization rate is
applied to the reported savings to ensure that these
savings align with EM&V protocols and reflect the
savings that were actually realized (i.e. how many light
bulbs were actually installed vs. what was reported)
(gross). Net savings takes into account net-to-gross
factors such as free-ridership and spillover (net). Both
realization rate and net-to-gross ratios can differ for
energy and demand savings and depend on the mix of
projects within an LDC territory (i.e. lighting or non-
lighting project, engineered/custom/prescriptive
track).
Efficiency:
Equipment
Replacement
Additional Note: project counts were derived by filtering out invalid statuses (e.g. Post-Project Submission - Payment denied by LDC) and only
including projects with an "Actual Project Completion Date" in 2013)
Toronto Hydro-Electric System Limited 2013 Draft Verified Results 14

Initiative Attributing Savings to LDCs Savings 'start' Date Calculating Resource Savings
Direct Installed
Lighting
Results are directly attributed to LDC based on
the LDC specified on the work order
Savings are considered to begin in the year of
the actual project completion date.
Peak demand and energy savings are determined
using the verified measure level per unit assumptions
multiplied by the uptake of each measure accounting
for the realization rate for both peak demand and
energy to reflect the savings that were actually
realized (i.e. how many light bulbs were actually
installed vs. what was reported) (gross). Net savings
take into account net-to-gross factors such as free-
ridership and spillover for both peak demand and
energy savings at the program level (net).
Existing Building
Commissioning
Incentive
Results are directly attributed to LDC based on
LDC identified in the application; Initiative was
not evaluated, no completed projects in 2011
or 2012.
Savings are considered to begin in the year of
the actual project completion date.
New Construction
and Major
Renovation
Incentive
Results are directly attributed to LDC based on
LDC identified in the application.
Savings are considered to begin in the year of
the actual project completion date.
Energy AuditProjects are directly attributed to LDC based
on LDC identified in the application
Savings are considered to begin in the year of
the audit date.
Peak demand and energy savings are determined by
the total savings resulting from an audit as reported
(reported). A realization rate is applied to the
reported savings to ensure that these savings align
with EM&V protocols and reflect the savings that
were actually realized (i.e. how many light bulbs were
actually installed vs. what was reported) (gross). Net
savings takes into account net-to-gross factors such as
free-ridership and spillover (net).
Peak demand and energy savings are determined by
the total savings for a given project as reported
(reported). A realization rate is applied to the
reported savings to ensure that these savings align
with EM&V protocols and reflect the savings that
were actually realized (i.e. how many light bulbs were
actually installed vs. what was reported) (gross). Net
savings takes into account net-to-gross factors such as
free-ridership and spillover (net).
Toronto Hydro-Electric System Limited 2013 Draft Verified Results 15

Initiative Attributing Savings to LDCs Savings 'start' Date Calculating Resource Savings
Commercial
Demand Response
(part of the
Residential program
schedule)
Results are directly attributed to LDC based on
data provided to OPA through project
completion reports and continuing participant
lists
Savings are considered to begin in the year the
device was installed and/or when a customer
signed a peaksaver PLUS™ participant
agreement.
Peak demand savings are based on an ex ante
estimate assuming a 1 in 10 weather year and
represents the "insurance value" of the initiative.
Energy savings are based on an ex post estimate
which reflects the savings that occurred as a result of
activations in the year. Savings are assumed to persist
for only 1 year, reflecting that savings will only occur if
the resource is activated.
Demand Response
3 (part of the
Industrial program
schedule)
Results are attributed to LDCs based on the
total contracted megawatts at the contributor
level as of December 31st, applying the
provincial ex ante to contracted ratio (ex ante
estimate/contracted megawatts); Ex post
energy savings are attributed to the LDC based
on their proportion of the total contracted
megawatts at the contributor level.
Savings are considered to begin in the year in
which the contributor signed up to participate
in demand response.
Peak demand savings are ex ante estimates based on
the load reduction capability that can be expected for
the purposes of planning. The ex ante estimates factor
in both scheduled non-performances (i.e.
maintenance) and historical performance. Energy
savings are based on an ex post estimate which
reflects the savings that actually occurred as a results
of activations in the year. Savings are assumed to
persist for 1 year, reflecting that savings will not occur
if the resource is not activated and additional costs
are incurred to activate the resource.
Industrial Program
Process & System
Upgrades
Results are directly attributed to LDC based on
LDC identified in application in the
saveONenergy CRM system.
Savings are considered to begin in the year in
which the incentive project was completed.
Peak demand and energy savings are determined by
the total savings from a given project as reported
(reported). A realization rate is applied to the
reported savings to ensure that these savings align
with EM&V protocols and reflect the savings that
were actually realized (i.e. how many light bulbs were
actually installed vs. what was reported) (gross). Net
savings takes into account net-to-gross factors such as
free-ridership and spillover (net).
Toronto Hydro-Electric System Limited 2013 Draft Verified Results 16

Initiative Attributing Savings to LDCs Savings 'start' Date Calculating Resource Savings
Monitoring &
Targeting
Results are directly attributed to LDC based on
LDC identified in the application; Initiative was
not evaluated, no completed projects in 2011,
2012 or 2013.
Savings are considered to begin in the year in
which the incentive project was completed.
Peak demand and energy savings are determined by
the total savings from a given project as reported
(reported). A realization rate is applied to the
reported savings to ensure that these savings align
with EM&V protocols and reflect the savings that
were actually realized (i.e. how many light bulbs were
actually installed vs. what was reported) (gross). Net
savings takes into account net-to-gross factors such as
free-ridership and spillover (net).
Energy ManagerResults are directly attributed to LDC based on
LDC identified in the application.
Savings are considered to begin in the year in
which the project was completed by the energy
manager. If no date is specified the savings will
begin the year of the Quarterly Report
submitted by the energy manager.
Peak demand and energy savings are determined by
the total savings from a given project as reported
(reported). A realization rate is applied to the
reported savings to ensure that these savings align
with EM&V protocols and reflect the savings that
were actually realized (i.e. how many light bulbs were
actually installed vs. what was reported) (gross). Net
savings takes into account net-to-gross factors such as
free-ridership and spillover (net).
Toronto Hydro-Electric System Limited 2013 Draft Verified Results 17
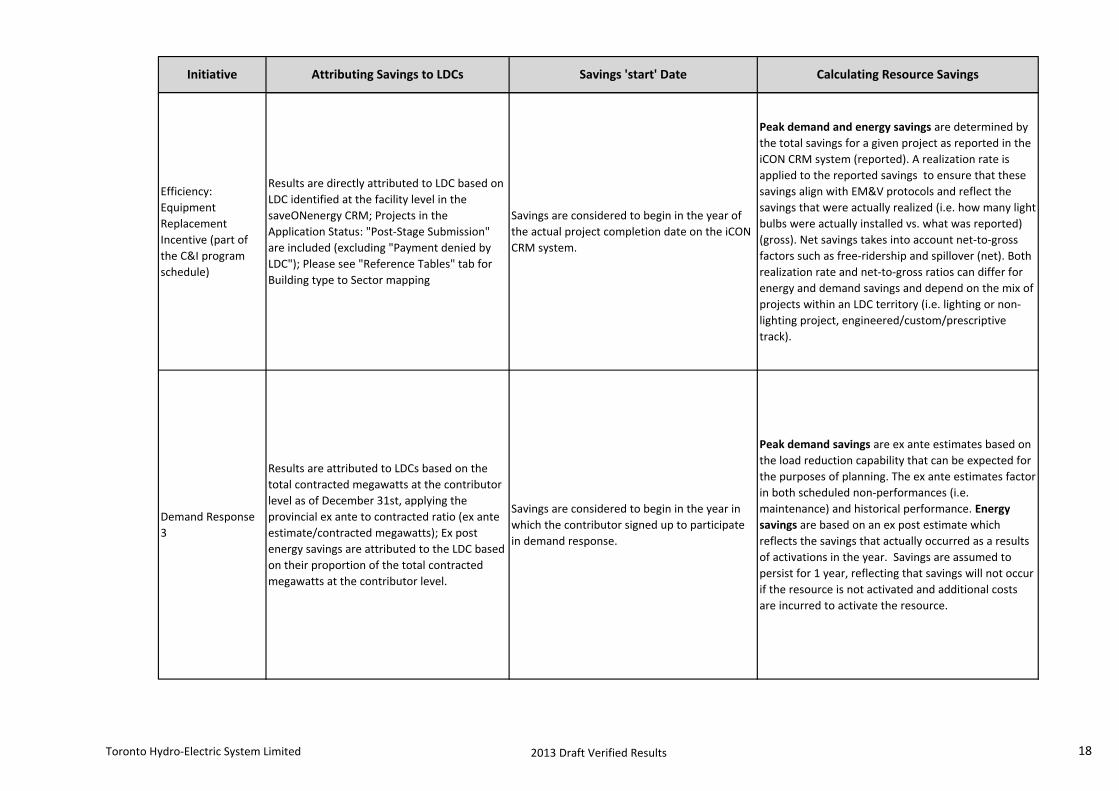
Initiative Attributing Savings to LDCs Savings 'start' Date Calculating Resource Savings
Efficiency:
Equipment
Replacement
Incentive (part of
the C&I program
schedule)
Results are directly attributed to LDC based on
LDC identified at the facility level in the
saveONenergy CRM; Projects in the
Application Status: "Post-Stage Submission"
are included (excluding "Payment denied by
LDC"); Please see "Reference Tables" tab for
Building type to Sector mapping
Savings are considered to begin in the year of
the actual project completion date on the iCON
CRM system.
Peak demand and energy savings are determined by
the total savings for a given project as reported in the
iCON CRM system (reported). A realization rate is
applied to the reported savings to ensure that these
savings align with EM&V protocols and reflect the
savings that were actually realized (i.e. how many light
bulbs were actually installed vs. what was reported)
(gross). Net savings takes into account net-to-gross
factors such as free-ridership and spillover (net). Both
realization rate and net-to-gross ratios can differ for
energy and demand savings and depend on the mix of
projects within an LDC territory (i.e. lighting or non-
lighting project, engineered/custom/prescriptive
track).
Demand Response
3
Results are attributed to LDCs based on the
total contracted megawatts at the contributor
level as of December 31st, applying the
provincial ex ante to contracted ratio (ex ante
estimate/contracted megawatts); Ex post
energy savings are attributed to the LDC based
on their proportion of the total contracted
megawatts at the contributor level.
Savings are considered to begin in the year in
which the contributor signed up to participate
in demand response.
Peak demand savings are ex ante estimates based on
the load reduction capability that can be expected for
the purposes of planning. The ex ante estimates factor
in both scheduled non-performances (i.e.
maintenance) and historical performance. Energy
savings are based on an ex post estimate which
reflects the savings that actually occurred as a results
of activations in the year. Savings are assumed to
persist for 1 year, reflecting that savings will not occur
if the resource is not activated and additional costs
are incurred to activate the resource.
Toronto Hydro-Electric System Limited 2013 Draft Verified Results 18
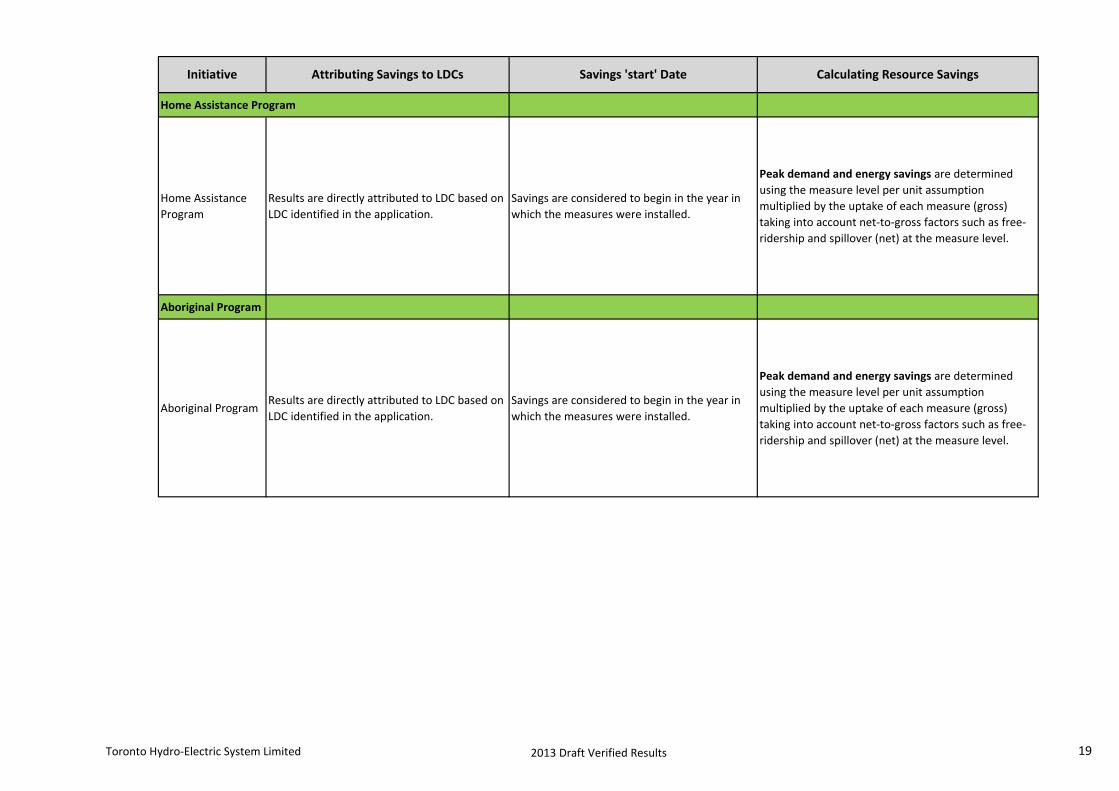
Initiative Attributing Savings to LDCs Savings 'start' Date Calculating Resource Savings
Home Assistance Program
Home Assistance
Program
Results are directly attributed to LDC based on
LDC identified in the application.
Savings are considered to begin in the year in
which the measures were installed.
Peak demand and energy savings are determined
using the measure level per unit assumption
multiplied by the uptake of each measure (gross)
taking into account net-to-gross factors such as free-
ridership and spillover (net) at the measure level.
Aboriginal Program
Aboriginal ProgramResults are directly attributed to LDC based on
LDC identified in the application.
Savings are considered to begin in the year in
which the measures were installed.
Peak demand and energy savings are determined
using the measure level per unit assumption
multiplied by the uptake of each measure (gross)
taking into account net-to-gross factors such as free-
ridership and spillover (net) at the measure level.
Toronto Hydro-Electric System Limited 2013 Draft Verified Results 19

Initiative Attributing Savings to LDCs Savings 'start' Date Calculating Resource Savings
Pre-2011 Programs completed in 2011
Electricity Retrofit
Incentive Program
Results are directly attributed to LDC based on
LDC identified in the application; Initiative was
not evaluated in 2011, 2012 or 2013
assumptions as per 2010 evaluation
Savings are considered to begin in the year in
which a project was completed.
High Performance
New Construction
Results are directly attributed to LDC based on
customer data provided to the OPA from
Enbridge; Initiative was not evaluated in 2011,
2012 or 2013, assumptions as per 2010
evaluation
Toronto
Comprehensive
Program run exclusively in Toronto Hydro-
Electric System Limited service territory;
Initiative was not evaluated in 2011, 2012 or
2013, assumptions as per 2010 evaluation
Peak demand and energy savings are determined by
the total savings from a given project as reported
(reported). A realization rate is applied to the
reported savings to ensure that these savings align
with EM&V protocols and reflect the savings that
were actually realized (i.e. how many light bulbs were
actually installed vs. what was reported) (gross). Net
savings takes into account net-to-gross factors such as
free-ridership and spillover (net). If energy savings are
not available, an estimate is made based on the kWh
to kW ratio in the provincial results from the 2010
evaluated results
(http://www.powerauthority.on.ca/evaluation-
measurement-and-verification/evaluation-reports).
Savings are considered to begin in the year in
which a project was completed.
Toronto Hydro-Electric System Limited 2013 Draft Verified Results 20

Initiative Attributing Savings to LDCs Savings 'start' Date Calculating Resource Savings
Multifamily Energy
Efficiency Rebates
Results are directly attributed to LDC based on
LDC identified in the application; Initiative was
not evaluated in 2011, 2012 or 2013,
assumptions as per 2010 evaluation
Data Centre
Incentive Program
Program run exclusively in PowerStream Inc.
service territory; Initiative was not evaluated
in 2011, assumptions as per 2009 evaluation
EnWin Green Suites
Program run exclusively in ENWIN Utilities Ltd.
service territory; Initiative was not evaluated
in 2011 or 2012, assumptions as per 2010
evaluation
Savings are considered to begin in the year in
which a project was completed.
Peak demand and energy savings are determined by
the total savings from a given project as reported
(reported). A realization rate is applied to the
reported savings to ensure that these savings align
with EM&V protocols and reflect the savings that
were actually realized (i.e. how many light bulbs were
actually installed vs. what was reported) (gross). Net
savings takes into account net-to-gross factors such as
free-ridership and spillover (net). If energy savings are
not available, an estimate is made based on the kWh
to kW ratio in the provincial results from the 2010
evaluated results
(http://www.powerauthority.on.ca/evaluation-
measurement-and-verification/evaluation-reports).
Toronto Hydro-Electric System Limited 2013 Draft Verified Results 21

Building Type Sector
Agribusiness - Cattle Farm C&I
Agribusiness - Dairy Farm C&I
Agribusiness - Greenhouse C&I
Agribusiness - Other C&I
Agribusiness - Other,Mixed-Use - Office/Retail C&I
Agribusiness - Other,Office,Retail,Warehouse C&I
Agribusiness - Other,Office,Warehouse C&I
Agribusiness - Poultry C&I
Agribusiness - Poultry,Hospitality - Motel C&I
Agribusiness - Swine C&I
Convenience Store C&I
Education - College / Trade School C&I
Education - College / Trade School,Multi-Residential - Condominium C&I
Education - College / Trade School,Multi-Residential - Rental Apartment C&I
Education - College / Trade School,Retail C&I
Education - Primary School C&I
Education - Primary School,Education - Secondary School C&I
Education - Primary School,Multi-Residential - Rental Apartment C&I
Education - Primary School,Not-for-Profit C&I
Education - Secondary School C&I
Education - University C&I
Education - University,Office C&I
Hospital/Healthcare - Clinic C&I
Hospital/Healthcare - Clinic,Hospital/Healthcare - Long-term Care,Hospital/Healthcare -
Medical BuildingC&I
Hospital/Healthcare - Clinic,Industrial C&I
Hospital/Healthcare - Clinic,Retail C&I
Hospital/Healthcare - Long-term Care C&I
Hospital/Healthcare - Long-term Care,Hospital/Healthcare - Medical Building C&I
Hospital/Healthcare - Medical Building C&I
Hospital/Healthcare - Medical Building,Mixed-Use - Office/Retail C&I
Hospital/Healthcare - Medical Building,Mixed-Use - Office/Retail,Office C&I
Hospitality - Hotel C&I
Hospitality - Hotel,Restaurant - Dining C&I
Hospitality - Motel C&I
Industrial Industrial
Mixed-Use - Office/Retail C&I
Mixed-Use - Office/Retail,Industrial Industrial
Mixed-Use - Office/Retail,Mixed-Use - Other C&I
Mixed-Use - Office/Retail,Mixed-Use - Other,Not-for-Profit,Warehouse C&I
Mixed-Use - Office/Retail,Mixed-Use - Residential/Retail C&I
Mixed-Use - Office/Retail,Office,Restaurant - Dining,Restaurant - Quick
Serve,Retail,WarehouseC&I
Retrofit Sector (C&I vs. Industrial Mapping)
Toronto Hydro-Electric System Limited 2013 Draft Verified Results 22

Mixed-Use - Office/Retail,Office,Warehouse C&I
Mixed-Use - Office/Retail,Retail C&I
Mixed-Use - Office/Retail,Warehouse C&I
Mixed-Use - Office/Retail,Warehouse,Industrial Industrial
Mixed-Use - Other C&I
Mixed-Use - Other,Industrial Industrial
Mixed-Use - Other,Not-for-Profit,Office C&I
Mixed-Use - Other,Office C&I
Mixed-Use - Other,Other: Please specify C&I
Mixed-Use - Other,Retail,Warehouse C&I
Mixed-Use - Other,Warehouse C&I
Mixed-Use - Residential/Retail C&I
Mixed-Use - Residential/Retail,Multi-Residential - Condominium C&I
Mixed-Use - Residential/Retail,Multi-Residential - Rental Apartment C&I
Mixed-Use - Residential/Retail,Retail C&I
Multi-Residential - Condominium C&I
Multi-Residential - Condominium,Multi-Residential - Rental Apartment C&I
Multi-Residential - Condominium,Other: Please specify C&I
Multi-Residential - Rental Apartment C&I
Multi-Residential - Rental Apartment,Multi-Residential - Social Housing Provider,Not-for-
ProfitC&I
Multi-Residential - Rental Apartment,Not-for-Profit C&I
Multi-Residential - Rental Apartment,Warehouse C&I
Multi-Residential - Social Housing Provider C&I
Multi-Residential - Social Housing Provider,Industrial C&I
Multi-Residential - Social Housing Provider,Not-for-Profit C&I
Not-for-Profit C&I
Not-for-Profit,Office C&I
Not-for-Profit,Other: Please specify C&I
Not-for-Profit,Warehouse C&I
Office C&I
Office,Industrial Industrial
Office,Other: Please specify C&I
Office,Other: Please specify,Warehouse C&I
Office,Restaurant - Dining C&I
Office,Restaurant - Dining,Industrial Industrial
Office,Retail C&I
Office,Retail,Industrial C&I
Office,Retail,Warehouse C&I
Office,Warehouse C&I
Office,Warehouse,Industrial Industrial
Other: Please specify C&I
Other: Please specify,Industrial Industrial
Other: Please specify,Retail C&I
Other: Please specify,Warehouse C&I
Restaurant - Dining C&I
Restaurant - Dining,Retail C&I
Toronto Hydro-Electric System Limited 2013 Draft Verified Results 23

Restaurant - Quick Serve C&I
Restaurant - Quick Serve,Retail C&I
Retail C&I
Retail,Industrial Industrial
Retail,Warehouse C&I
Warehouse C&I
Warehouse,Industrial Industrial
Local Distribution Company Allocation
Algoma Power Inc. 0.2%
Atikokan Hydro Inc. 0.0%
Attawapiskat Power Corporation 0.0%
Bluewater Power Distribution Corporation 0.6%
Brant County Power Inc. 0.2%
Brantford Power Inc. 0.7%
Burlington Hydro Inc. 1.4%
Cambridge and North Dumfries Hydro Inc. 1.0%
Canadian Niagara Power Inc. 0.5%
Centre Wellington Hydro Ltd. 0.1%
Chapleau Public Utilities Corporation 0.0%
COLLUS Power Corporation 0.3%
Cooperative Hydro Embrun Inc. 0.0%
E.L.K. Energy Inc. 0.2%
Enersource Hydro Mississauga Inc. 3.9%
ENTEGRUS 0.6%
ENWIN Utilities Ltd. 1.6%
Erie Thames Powerlines Corporation 0.4%
Espanola Regional Hydro Distribution Corporation 0.1%
Essex Powerlines Corporation 0.7%
Festival Hydro Inc. 0.3%
Fort Albany Power Corporation 0.0%
Fort Frances Power Corporation 0.1%
Greater Sudbury Hydro Inc. 1.0%
Grimsby Power Inc. 0.2%
Guelph Hydro Electric Systems Inc. 0.9%
Haldimand County Hydro Inc. 0.4%
Halton Hills Hydro Inc. 0.5%
Hearst Power Distribution Company Limited 0.1%
Horizon Utilities Corporation 4.0%
Hydro 2000 Inc. 0.0%
Hydro Hawkesbury Inc. 0.1%
Hydro One Brampton Networks Inc. 2.8%
Hydro One Networks Inc. 30.0%
Consumer Program Allocation Methodology
Results can be allocated based on average of 2008 & 2009 residential throughput for each LDC (below) when
additional information is not available. Source: OEB Yearbook Data 2008 & 2009
Toronto Hydro-Electric System Limited 2013 Draft Verified Results 24
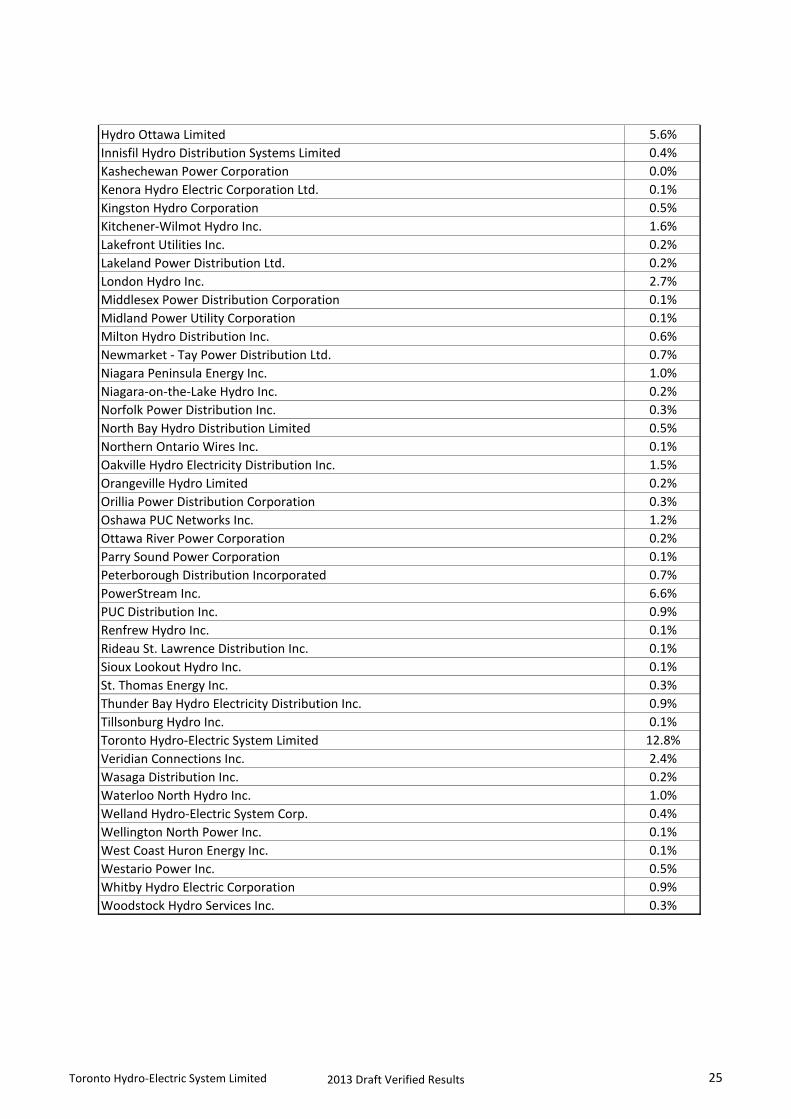
Hydro Ottawa Limited 5.6%
Innisfil Hydro Distribution Systems Limited 0.4%
Kashechewan Power Corporation 0.0%
Kenora Hydro Electric Corporation Ltd. 0.1%
Kingston Hydro Corporation 0.5%
Kitchener-Wilmot Hydro Inc. 1.6%
Lakefront Utilities Inc. 0.2%
Lakeland Power Distribution Ltd. 0.2%
London Hydro Inc. 2.7%
Middlesex Power Distribution Corporation 0.1%
Midland Power Utility Corporation 0.1%
Milton Hydro Distribution Inc. 0.6%
Newmarket - Tay Power Distribution Ltd. 0.7%
Niagara Peninsula Energy Inc. 1.0%
Niagara-on-the-Lake Hydro Inc. 0.2%
Norfolk Power Distribution Inc. 0.3%
North Bay Hydro Distribution Limited 0.5%
Northern Ontario Wires Inc. 0.1%
Oakville Hydro Electricity Distribution Inc. 1.5%
Orangeville Hydro Limited 0.2%
Orillia Power Distribution Corporation 0.3%
Oshawa PUC Networks Inc. 1.2%
Ottawa River Power Corporation 0.2%
Parry Sound Power Corporation 0.1%
Peterborough Distribution Incorporated 0.7%
PowerStream Inc. 6.6%
PUC Distribution Inc. 0.9%
Renfrew Hydro Inc. 0.1%
Rideau St. Lawrence Distribution Inc. 0.1%
Sioux Lookout Hydro Inc. 0.1%
St. Thomas Energy Inc. 0.3%
Thunder Bay Hydro Electricity Distribution Inc. 0.9%
Tillsonburg Hydro Inc. 0.1%
Toronto Hydro-Electric System Limited 12.8%
Veridian Connections Inc. 2.4%
Wasaga Distribution Inc. 0.2%
Waterloo North Hydro Inc. 1.0%
Welland Hydro-Electric System Corp. 0.4%
Wellington North Power Inc. 0.1%
West Coast Huron Energy Inc. 0.1%
Westario Power Inc. 0.5%
Whitby Hydro Electric Corporation 0.9%
Woodstock Hydro Services Inc. 0.3%
Toronto Hydro-Electric System Limited 2013 Draft Verified Results 25
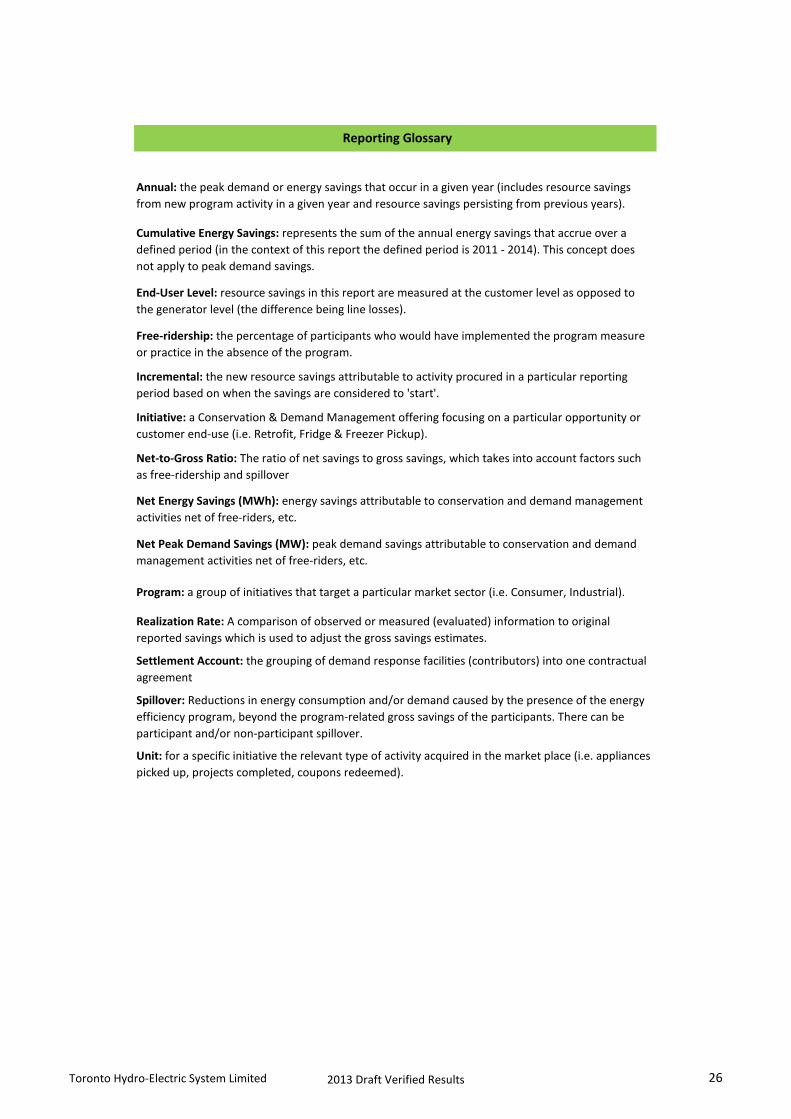
Free-ridership: the percentage of participants who would have implemented the program measure
or practice in the absence of the program.
Spillover: Reductions in energy consumption and/or demand caused by the presence of the energy
efficiency program, beyond the program-related gross savings of the participants. There can be
participant and/or non-participant spillover.
Realization Rate: A comparison of observed or measured (evaluated) information to original
reported savings which is used to adjust the gross savings estimates.
Net-to-Gross Ratio: The ratio of net savings to gross savings, which takes into account factors such
as free‐ridership and spillover
Reporting Glossary
Annual: the peak demand or energy savings that occur in a given year (includes resource savings
from new program activity in a given year and resource savings persisting from previous years).
Cumulative Energy Savings: represents the sum of the annual energy savings that accrue over a
defined period (in the context of this report the defined period is 2011 - 2014). This concept does
not apply to peak demand savings.
End-User Level: resource savings in this report are measured at the customer level as opposed to
the generator level (the difference being line losses).
Settlement Account: the grouping of demand response facilities (contributors) into one contractual
agreement
Program: a group of initiatives that target a particular market sector (i.e. Consumer, Industrial).
Unit: for a specific initiative the relevant type of activity acquired in the market place (i.e. appliances
picked up, projects completed, coupons redeemed).
Incremental: the new resource savings attributable to activity procured in a particular reporting
period based on when the savings are considered to 'start'.
Initiative: a Conservation & Demand Management offering focusing on a particular opportunity or
customer end-use (i.e. Retrofit, Fridge & Freezer Pickup).
Net Energy Savings (MWh): energy savings attributable to conservation and demand management
activities net of free-riders, etc.
Net Peak Demand Savings (MW): peak demand savings attributable to conservation and demand
management activities net of free-riders, etc.
Toronto Hydro-Electric System Limited 2013 Draft Verified Results 26
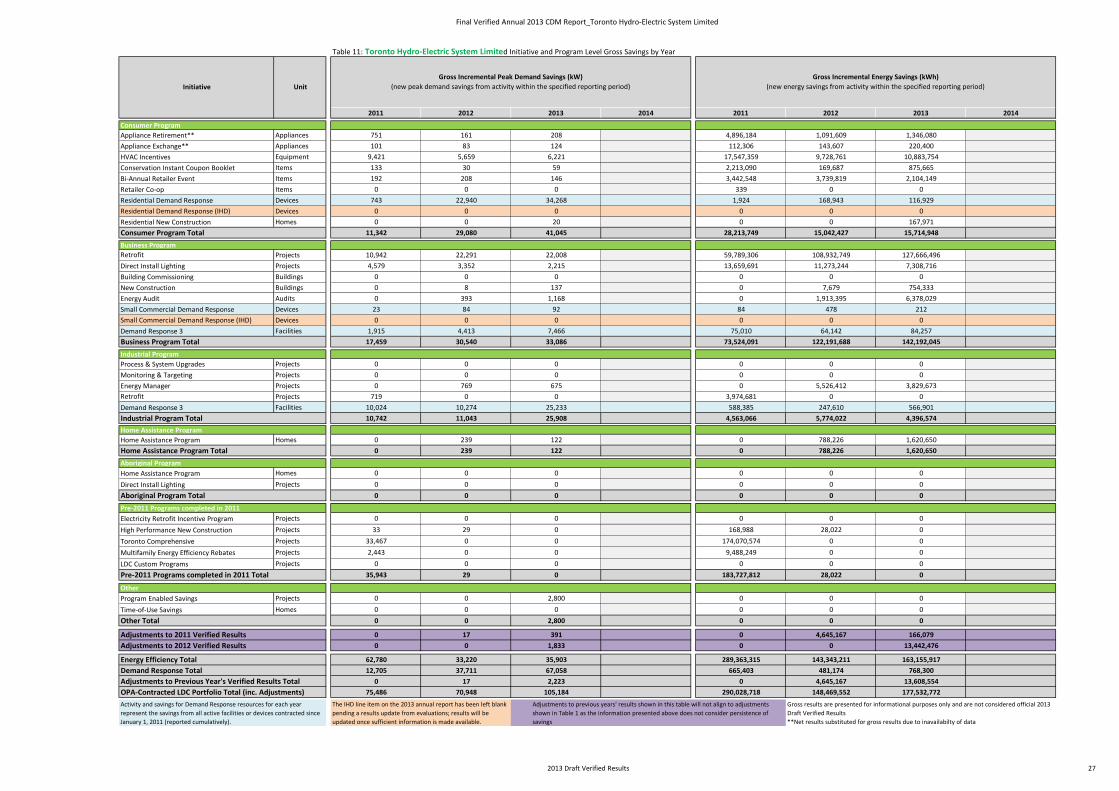
Final Verified Annual 2013 CDM Report_Toronto Hydro-Electric System Limited
Table 11: Toronto Hydro-Electric System Limited Initiative and Program Level Gross Savings by Year
2011 2012 2013 2014 2011 2012 2013 2014
Consumer Program
Appliance Retirement** Appliances 751 161 208 4,896,184 1,091,609 1,346,080
Appliance Exchange** Appliances 101 83 124 112,306 143,607 220,400
HVAC Incentives Equipment 9,421 5,659 6,221 17,547,359 9,728,761 10,883,754
Conservation Instant Coupon Booklet Items 133 30 59 2,213,090 169,687 875,665
Bi-Annual Retailer Event Items 192 208 146 3,442,548 3,739,819 2,104,149
Retailer Co-op Items 0 0 0 339 0 0
Residential Demand Response Devices 743 22,940 34,268 1,924 168,943 116,929
Residential Demand Response (IHD) Devices 0 0 0 0 0 0
Residential New Construction Homes 0 0 20 0 0 167,971
Consumer Program Total 11,342 29,080 41,045 28,213,749 15,042,427 15,714,948
Business Program
Retrofit Projects 10,942 22,291 22,008 59,789,306 108,932,749 127,666,496
Direct Install Lighting Projects 4,579 3,352 2,215 13,659,691 11,273,244 7,308,716
Building Commissioning Buildings 0 0 0 0 0 0
New Construction Buildings 0 8 137 0 7,679 754,333
Energy Audit Audits 0 393 1,168 0 1,913,395 6,378,029
Small Commercial Demand Response Devices 23 84 92 84 478 212
Small Commercial Demand Response (IHD) Devices 0 0 0 0 0 0
Demand Response 3 Facilities 1,915 4,413 7,466 75,010 64,142 84,257
Business Program Total 17,459 30,540 33,086 73,524,091 122,191,688 142,192,045
Industrial Program
Process & System Upgrades Projects 0 0 0 0 0 0
Monitoring & Targeting Projects 0 0 0 0 0 0
Energy Manager Projects 0 769 675 0 5,526,412 3,829,673
Retrofit Projects 719 0 0 3,974,681 0 0
Demand Response 3 Facilities 10,024 10,274 25,233 588,385 247,610 566,901
Industrial Program Total 10,742 11,043 25,908 4,563,066 5,774,022 4,396,574
Home Assistance Program
Home Assistance Program Homes 0 239 122 0 788,226 1,620,650
Home Assistance Program Total 0 239 122 0 788,226 1,620,650
Aboriginal Program
Home Assistance Program Homes 0 0 0 0 0 0
Direct Install Lighting Projects 0 0 0 0 0 0
Aboriginal Program Total 0 0 0 0 0 0
Pre-2011 Programs completed in 2011
Electricity Retrofit Incentive Program Projects 0 0 0 0 0 0
High Performance New Construction Projects 33 29 0 168,988 28,022 0
Toronto Comprehensive Projects 33,467 0 0 174,070,574 0 0
Multifamily Energy Efficiency Rebates Projects 2,443 0 0 9,488,249 0 0
LDC Custom Programs Projects 0 0 0 0 0 0
Pre-2011 Programs completed in 2011 Total 35,943 29 0 183,727,812 28,022 0
Other
Program Enabled Savings Projects 0 0 2,800 0 0 0
Time-of-Use Savings Homes 0 0 0 0 0 0
Other Total 0 0 2,800 0 0 0
Adjustments to 2011 Verified Results 0 17 391 0 4,645,167 166,079
Adjustments to 2012 Verified Results 0 0 1,833 0 0 13,442,476
Energy Efficiency Total 62,780 33,220 35,903 289,363,315 143,343,211 163,155,917
Demand Response Total 12,705 37,711 67,058 665,403 481,174 768,300
Adjustments to Previous Year's Verified Results Total 0 17 2,223 0 4,645,167 13,608,554
OPA-Contracted LDC Portfolio Total (inc. Adjustments) 75,486 70,948 105,184 290,028,718 148,469,552 177,532,772
Initiative Unit
Gross Incremental Peak Demand Savings (kW)
(new peak demand savings from activity within the specified reporting period)
Gross Incremental Energy Savings (kWh)
(new energy savings from activity within the specified reporting period)
Activity and savings for Demand Response resources for each year
represent the savings from all active facilities or devices contracted since
January 1, 2011 (reported cumulatively).
Gross results are presented for informational purposes only and are not considered official 2013
Draft Verified Results
**Net results substituted for gross results due to inavailabilty of data
The IHD line item on the 2013 annual report has been left blank
pending a results update from evaluations; results will be
updated once sufficient information is made available.
Adjustments to previous years' results shown in this table will not align to adjustments
shown in Table 1 as the information presented above does not consider persistence of
savings
2013 Draft Verified Results 27

Final Verified Annual 2013 CDM Report_Toronto Hydro-Electric System Limited
Table 12: Adjustments to Toronto Hydro-Electric System Limited Gross Verified Results due to Variances
2011 2012 2013 2014 2011 2012 2013 2014
Consumer Program
Appliance Retirement Appliances 0 0 0 0
Appliance Exchange Appliances 0 0 0 0
HVAC Incentives Equipment -1,433 159 -2,629,958 282,613
Conservation Instant Coupon Booklet Items 2 0 32,760 0
Bi-Annual Retailer Event Items 15 0 303,774 0
Retailer Co-op Items 0 0 0 0
Residential Demand Response Devices 0 0 0 0
Residential Demand Response (IHD) Devices 0 0 0 0
Residential New Construction Homes 0 0 0 0
Consumer Program Total -1,417 159 -2,293,425 282,613
Business Program
Retrofit Projects 1,312 1,421 6,427,137 10,271,968
Direct Install Lighting Projects 35 51 84,737 174,175
Building Commissioning Buildings 0 0 0 0
New Construction Buildings 0 0 0 0
Energy Audit Audits 88 0 427,996 0
Small Commercial Demand Response Devices 0 0 0 0
Small Commercial Demand Response (IHD) Devices 0 0 0 0
Demand Response 3 Facilities 0 0 0 0
Business Program Total 1,435 1,472 6,939,870 10,446,143
Industrial Program
Process & System Upgrades Projects 0 0 0 0
Monitoring & Targeting Projects 0 0 0 0
Energy Manager Projects 0 0 0 0
Retrofit Projects 0 0 0 0
Demand Response 3 Facilities 0 0 0 0
Industrial Program Total 0 0 0 0
Home Assistance Program
Home Assistance Program Homes 0 0 0 0
Home Assistance Program Total 0 0 0 0
Aboriginal Program
Home Assistance Program Homes 0 0 0 0
Direct Install Lighting Projects 0 0 0 0
Aboriginal Program Total
Pre-2011 Programs completed in 2011
Electricity Retrofit Incentive Program Projects 0 0 0 0
High Performance New Construction Projects 0 0 0 0
Toronto Comprehensive Projects 0 0 0 0
Multifamily Energy Efficiency Rebates Projects 0 0 0 0
LDC Custom Programs Projects 0 0 0 0
Pre-2011 Programs completed in 2011 Total 0 0 0 0
Other
Program Enabled Savings Projects 390 202 164,800 2,713,720
Time-of-Use Savings Homes 0 0 0 0
Other Total 390 202 164,800 2,713,720
Adjustments to 2011 Verified Results 408 4,811,245
Adjustments to 2012 Verified Results 1,833 13,442,476
Total Adjustments to Previous Year's Verified Results 408 1,833 4,811,245 13,442,476
Gross results are presented for informational purposes only and
are not considered official 2013 Draft Verified Results
The IHD line item on the 2013 annual report has been left blank pending a results update
from evaluations; results will be updated once sufficient information is made available.
Activity and savings for Demand Response resources for each year represent the
savings from all active facilities or devices contracted since January 1, 2011
(reported cumulatively).
Initiative Unit
Gross Incremental Peak Demand Savings (kW)
(new peak demand savings from activity within the specified reporting period)
Gross Incremental Energy Savings (kWh)
(new energy savings from activity within the specified reporting period)
2013 Draft Verified Results 28
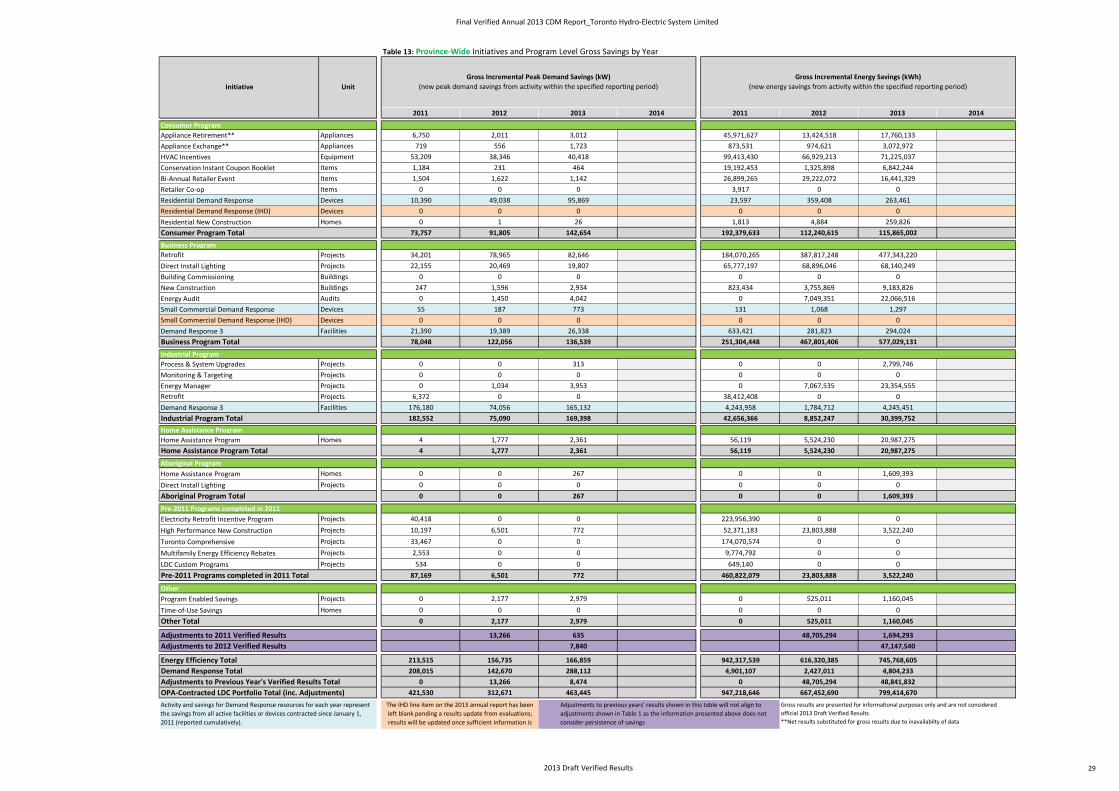
Final Verified Annual 2013 CDM Report_Toronto Hydro-Electric System Limited
Table 13: Province-Wide Initiatives and Program Level Gross Savings by Year
2011 2012 2013 2014 2011 2012 2013 2014
Consumer Program
Appliance Retirement** Appliances 6,750 2,011 3,012 45,971,627 13,424,518 17,760,133
Appliance Exchange** Appliances 719 556 1,723 873,531 974,621 3,072,972
HVAC Incentives Equipment 53,209 38,346 40,418 99,413,430 66,929,213 71,225,037
Conservation Instant Coupon Booklet Items 1,184 231 464 19,192,453 1,325,898 6,842,244
Bi-Annual Retailer Event Items 1,504 1,622 1,142 26,899,265 29,222,072 16,441,329
Retailer Co-op Items 0 0 0 3,917 0 0
Residential Demand Response Devices 10,390 49,038 95,869 23,597 359,408 263,461
Residential Demand Response (IHD) Devices 0 0 0 0 0 0
Residential New Construction Homes 0 1 26 1,813 4,884 259,826
Consumer Program Total 73,757 91,805 142,654 192,379,633 112,240,615 115,865,002
Business Program
Retrofit Projects 34,201 78,965 82,646 184,070,265 387,817,248 477,343,220
Direct Install Lighting Projects 22,155 20,469 19,807 65,777,197 68,896,046 68,140,249
Building Commissioning Buildings 0 0 0 0 0 0
New Construction Buildings 247 1,596 2,934 823,434 3,755,869 9,183,826
Energy Audit Audits 0 1,450 4,042 0 7,049,351 22,066,516
Small Commercial Demand Response Devices 55 187 773 131 1,068 1,297
Small Commercial Demand Response (IHD) Devices 0 0 0 0 0 0
Demand Response 3 Facilities 21,390 19,389 26,338 633,421 281,823 294,024
Business Program Total 78,048 122,056 136,539 251,304,448 467,801,406 577,029,131
Industrial Program
Process & System Upgrades Projects 0 0 313 0 0 2,799,746
Monitoring & Targeting Projects 0 0 0 0 0 0
Energy Manager Projects 0 1,034 3,953 0 7,067,535 23,354,555
Retrofit Projects 6,372 0 0 38,412,408 0 0
Demand Response 3 Facilities 176,180 74,056 165,132 4,243,958 1,784,712 4,245,451
Industrial Program Total 182,552 75,090 169,398 42,656,366 8,852,247 30,399,752
Home Assistance Program
Home Assistance Program Homes 4 1,777 2,361 56,119 5,524,230 20,987,275
Home Assistance Program Total 4 1,777 2,361 56,119 5,524,230 20,987,275
Aboriginal Program
Home Assistance Program Homes 0 0 267 0 0 1,609,393
Direct Install Lighting Projects 0 0 0 0 0 0
Aboriginal Program Total 0 0 267 0 0 1,609,393
Pre-2011 Programs completed in 2011
Electricity Retrofit Incentive Program Projects 40,418 0 0 223,956,390 0 0
High Performance New Construction Projects 10,197 6,501 772 52,371,183 23,803,888 3,522,240
Toronto Comprehensive Projects 33,467 0 0 174,070,574 0 0
Multifamily Energy Efficiency Rebates Projects 2,553 0 0 9,774,792 0 0
LDC Custom Programs Projects 534 0 0 649,140 0 0
Pre-2011 Programs completed in 2011 Total 87,169 6,501 772 460,822,079 23,803,888 3,522,240
Other
Program Enabled Savings Projects 0 2,177 2,979 0 525,011 1,160,045
Time-of-Use Savings Homes 0 0 0 0 0 0
Other Total 0 2,177 2,979 0 525,011 1,160,045
Adjustments to 2011 Verified Results 13,266 635 48,705,294 1,694,293
Adjustments to 2012 Verified Results 7,840 47,147,540
Energy Efficiency Total 213,515 156,735 166,859 942,317,539 616,320,385 745,768,605
Demand Response Total 208,015 142,670 288,112 4,901,107 2,427,011 4,804,233
Adjustments to Previous Year's Verified Results Total 0 13,266 8,474 0 48,705,294 48,841,832
OPA-Contracted LDC Portfolio Total (inc. Adjustments) 421,530 312,671 463,445 947,218,646 667,452,690 799,414,670
Activity and savings for Demand Response resources for each year represent
the savings from all active facilities or devices contracted since January 1,
2011 (reported cumulatively).
Initiative Unit
Gross Incremental Peak Demand Savings (kW)
(new peak demand savings from activity within the specified reporting period)
Gross Incremental Energy Savings (kWh)
(new energy savings from activity within the specified reporting period)
The IHD line item on the 2013 annual report has been
left blank pending a results update from evaluations;
results will be updated once sufficient information is
made available.
Gross results are presented for informational purposes only and are not considered
official 2013 Draft Verified Results
**Net results substituted for gross results due to inavailabilty of data
Adjustments to previous years' results shown in this table will not align to
adjustments shown in Table 1 as the information presented above does not
consider persistence of savings
2013 Draft Verified Results 29

Final Verified Annual 2013 CDM Report_Toronto Hydro-Electric System Limited
Table 14: Adjustments to Province-Wide Gross Verified Results due to Variances
2011 2012 2013 2014 2011 2012 2013 2014
Consumer Program
Appliance Retirement Appliances 0 0 0 0
Appliance Exchange Appliances 0 0 0 0
HVAC Incentives Equipment -8,762 1,036 -16,245,279 1,854,833
Conservation Instant Coupon Booklet Items 15 0 255,975 0
Bi-Annual Retailer Event Items 117 0 2,373,616 0
Retailer Co-op Items 0 0 0 0
Residential Demand Response Devices 0 0 0 0
Residential Demand Response (IHD) Devices 0 0 0 0
Residential New Construction Homes 0 0 328,256 0
Consumer Program Total -8,630 1,036 -13,287,430 1,854,833
Business Program
Retrofit Projects 4,504 5,876 22,046,931 38,475,976
Direct Install Lighting Projects 541 217 1,346,618 781,858
Building Commissioning Buildings 0 0 0 0
New Construction Buildings 3,243 0 11,323,593 0
Energy Audit Audits 481 0 2,341,392 0
Small Commercial Demand Response Devices 0 0 0 0
Small Commercial Demand Response (IHD) Devices 0 0 0 0
Demand Response 3 Facilities 0 0 0 0
Business Program Total 8,769 6,092 37,058,534 39,257,834
Industrial Program
Process & System Upgrades Projects 0 0 0 0
Monitoring & Targeting Projects 0 0 0 0
Energy Manager Projects 0 0 0 0
Retrofit Projects 0 0 0 0
Demand Response 3 Facilities 0 0 0 0
Industrial Program Total 0 0 0 0
Home Assistance Program
Home Assistance Program Homes 0 0 0 0
Home Assistance Program Total 0 0 0 0
Aboriginal Program
Home Assistance Program Homes 0 0 0 0
Direct Install Lighting Projects 0 0 0 0
Aboriginal Program Total 0 0 0 0
Pre-2011 Programs completed in 2011
Electricity Retrofit Incentive Program Projects 266 0 1,049,108 0
High Performance New Construction Projects 12,872 0 23,905,663 0
Toronto Comprehensive Projects 0 0 0 0
Multifamily Energy Efficiency Rebates Projects 0 0 0 0
LDC Custom Programs Projects 0 0 0 0
Pre-2011 Programs completed in 2011 Total 13,137 0 24,954,771 0
Other
Program Enabled Savings Projects 624 711 1,673,712 6,034,873
Time-of-Use Savings Homes 0 0 0 0
Other Total 624 711 1,673,712 6,034,873
Adjustments to 2011 Verified Results 13,900 50,399,586
Adjustments to 2012 Verified Results 7,840 47,147,540
Adjustments to Previous Year's Verified Results Total 13,900 7,840 50,399,586 47,147,540
Activity and savings for Demand Response resources for each year represent the savings
from all active facilities or devices contracted since January 1, 2011 (reported
cumulatively).
Initiative Unit
Gross Incremental Peak Demand Savings (kW)
(new peak demand savings from activity within the specified reporting period)
Gross Incremental Energy Savings (kWh)
(new energy savings from activity within the specified reporting period)
The IHD line item on the 2013 annual report has been left blank pending a results update from evaluations; results
will be updated once sufficient information is made available.Gross results are presented for informational purposes only and are not considered official
2013 Draft Verified Results
2013 Draft Verified Results 30
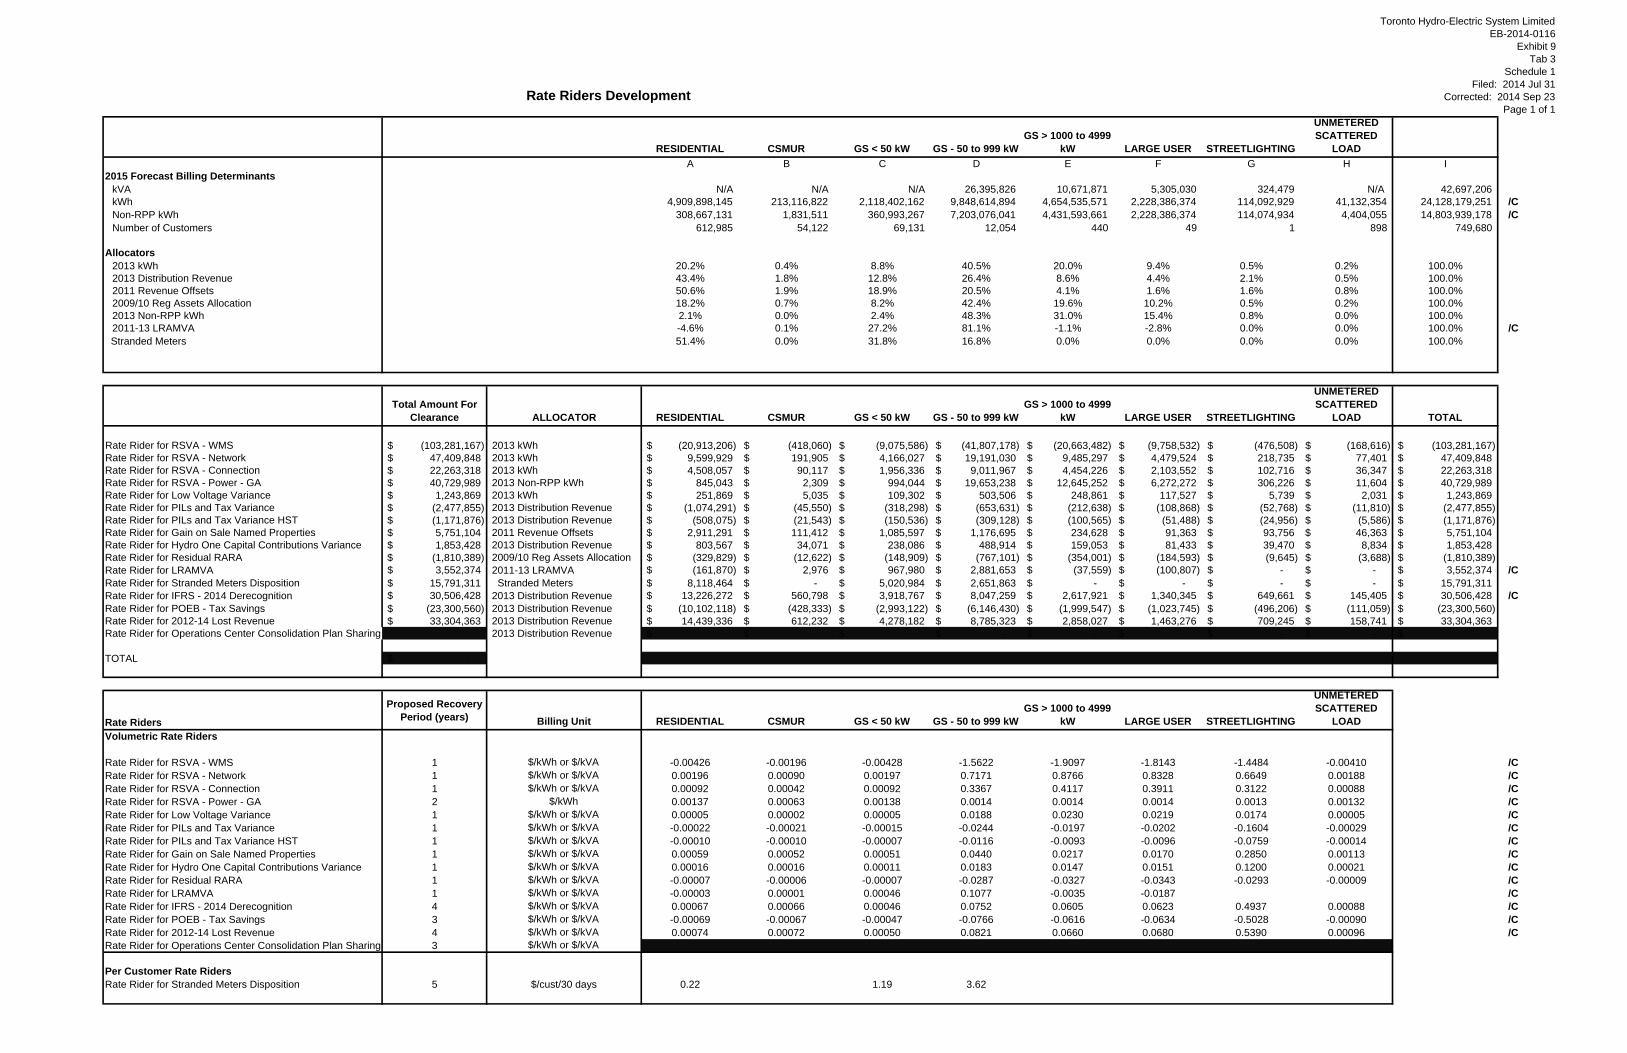
Toronto Hydro-Electric System LimitedEB-2014-0116
Exhibit 9Tab 3
Schedule 1Filed: 2014 Jul 31
Corrected: 2014 Sep 23Page 1 of 1
RESIDENTIAL CSMUR GS < 50 kW GS - 50 to 999 kW
GS > 1000 to 4999 kW LARGE USER STREETLIGHTING
UNMETERED SCATTERED
LOADA B C D E F G H I
2015 Forecast Billing Determinants kVA N/A N/A N/A 26,395,826 10,671,871 5,305,030 324,479 N/A 42,697,206 kWh 4,909,898,145 213,116,822 2,118,402,162 9,848,614,894 4,654,535,571 2,228,386,374 114,092,929 41,132,354 24,128,179,251 /CNon-RPP kWh 308,667,131 1,831,511 360,993,267 7,203,076,041 4,431,593,661 2,228,386,374 114,074,934 4,404,055 14,803,939,178 /CNumber of Customers 612,985 54,122 69,131 12,054 440 49 1 898 749,680
Allocators2013 kWh 20.2% 0.4% 8.8% 40.5% 20.0% 9.4% 0.5% 0.2% 100.0%2013 Distribution Revenue 43.4% 1.8% 12.8% 26.4% 8.6% 4.4% 2.1% 0.5% 100.0%2011 Revenue Offsets 50.6% 1.9% 18.9% 20.5% 4.1% 1.6% 1.6% 0.8% 100.0%2009/10 Reg Assets Allocation 18.2% 0.7% 8.2% 42.4% 19.6% 10.2% 0.5% 0.2% 100.0%2013 Non-RPP kWh 2.1% 0.0% 2.4% 48.3% 31.0% 15.4% 0.8% 0.0% 100.0%2011-13 LRAMVA -4.6% 0.1% 27.2% 81.1% -1.1% -2.8% 0.0% 0.0% 100.0% /C
Stranded Meters 51.4% 0.0% 31.8% 16.8% 0.0% 0.0% 0.0% 0.0% 100.0%
Total Amount For
Clearance ALLOCATOR RESIDENTIAL CSMUR GS < 50 kW GS - 50 to 999 kW GS > 1000 to 4999
kW LARGE USER STREETLIGHTING
UNMETERED SCATTERED
LOAD TOTAL
Rate Rider for RSVA - WMS (103,281,167)$ 2013 kWh (20,913,206)$ (418,060)$ (9,075,586)$ (41,807,178)$ (20,663,482)$ (9,758,532)$ (476,508)$ (168,616)$ (103,281,167)$ Rate Rider for RSVA - Network 47,409,848$ 2013 kWh 9,599,929$ 191,905$ 4,166,027$ 19,191,030$ 9,485,297$ 4,479,524$ 218,735$ 77,401$ 47,409,848$ Rate Rider for RSVA - Connection 22,263,318$ 2013 kWh 4,508,057$ 90,117$ 1,956,336$ 9,011,967$ 4,454,226$ 2,103,552$ 102,716$ 36,347$ 22,263,318$ Rate Rider for RSVA - Power - GA 40,729,989$ 2013 Non-RPP kWh 845,043$ 2,309$ 994,044$ 19,653,238$ 12,645,252$ 6,272,272$ 306,226$ 11,604$ 40,729,989$ Rate Rider for Low Voltage Variance 1,243,869$ 2013 kWh 251,869$ 5,035$ 109,302$ 503,506$ 248,861$ 117,527$ 5,739$ 2,031$ 1,243,869$ Rate Rider for PILs and Tax Variance (2,477,855)$ 2013 Distribution Revenue (1,074,291)$ (45,550)$ (318,298)$ (653,631)$ (212,638)$ (108,868)$ (52,768)$ (11,810)$ (2,477,855)$ Rate Rider for PILs and Tax Variance HST (1,171,876)$ 2013 Distribution Revenue (508,075)$ (21,543)$ (150,536)$ (309,128)$ (100,565)$ (51,488)$ (24,956)$ (5,586)$ (1,171,876)$ Rate Rider for Gain on Sale Named Properties 5,751,104$ 2011 Revenue Offsets 2,911,291$ 111,412$ 1,085,597$ 1,176,695$ 234,628$ 91,363$ 93,756$ 46,363$ 5,751,104$ Rate Rider for Hydro One Capital Contributions Variance 1,853,428$ 2013 Distribution Revenue 803,567$ 34,071$ 238,086$ 488,914$ 159,053$ 81,433$ 39,470$ 8,834$ 1,853,428$ Rate Rider for Residual RARA (1,810,389)$ 2009/10 Reg Assets Allocation (329,829)$ (12,622)$ (148,909)$ (767,101)$ (354,001)$ (184,593)$ (9,645)$ (3,688)$ (1,810,389)$ Rate Rider for LRAMVA 3,552,374$ 2011-13 LRAMVA (161,870)$ 2,976$ 967,980$ 2,881,653$ (37,559)$ (100,807)$ -$ -$ 3,552,374$ /CRate Rider for Stranded Meters Disposition 15,791,311$ Stranded Meters 8,118,464$ -$ 5,020,984$ 2,651,863$ -$ -$ -$ -$ 15,791,311$ Rate Rider for IFRS - 2014 Derecognition 30,506,428$ 2013 Distribution Revenue 13,226,272$ 560,798$ 3,918,767$ 8,047,259$ 2,617,921$ 1,340,345$ 649,661$ 145,405$ 30,506,428$ /CRate Rider for POEB - Tax Savings (23,300,560)$ 2013 Distribution Revenue (10,102,118)$ (428,333)$ (2,993,122)$ (6,146,430)$ (1,999,547)$ (1,023,745)$ (496,206)$ (111,059)$ (23,300,560)$ Rate Rider for 2012-14 Lost Revenue 33,304,363$ 2013 Distribution Revenue 14,439,336$ 612,232$ 4,278,182$ 8,785,323$ 2,858,027$ 1,463,276$ 709,245$ 158,741$ 33,304,363$ Rate Rider for Operations Center Consolidation Plan Sharing 2013 Distribution Revenue -$ -$ -$ -$ -$ -$ -$ -$ -$
TOTAL -$
Rate Riders
Proposed Recovery Period (years) Billing Unit RESIDENTIAL CSMUR GS < 50 kW GS - 50 to 999 kW
GS > 1000 to 4999 kW LARGE USER STREETLIGHTING
UNMETERED SCATTERED
LOADVolumetric Rate Riders
Rate Rider for RSVA - WMS 1 $/kWh or $/kVA -0.00426 -0.00196 -0.00428 -1.5622 -1.9097 -1.8143 -1.4484 -0.00410 /CRate Rider for RSVA - Network 1 $/kWh or $/kVA 0.00196 0.00090 0.00197 0.7171 0.8766 0.8328 0.6649 0.00188 /CRate Rider for RSVA - Connection 1 $/kWh or $/kVA 0.00092 0.00042 0.00092 0.3367 0.4117 0.3911 0.3122 0.00088 /CRate Rider for RSVA - Power - GA 2 $/kWh 0.00137 0.00063 0.00138 0.0014 0.0014 0.0014 0.0013 0.00132 /CRate Rider for Low Voltage Variance 1 $/kWh or $/kVA 0.00005 0.00002 0.00005 0.0188 0.0230 0.0219 0.0174 0.00005 /CRate Rider for PILs and Tax Variance 1 $/kWh or $/kVA -0.00022 -0.00021 -0.00015 -0.0244 -0.0197 -0.0202 -0.1604 -0.00029 /CRate Rider for PILs and Tax Variance HST 1 $/kWh or $/kVA -0.00010 -0.00010 -0.00007 -0.0116 -0.0093 -0.0096 -0.0759 -0.00014 /CRate Rider for Gain on Sale Named Properties 1 $/kWh or $/kVA 0.00059 0.00052 0.00051 0.0440 0.0217 0.0170 0.2850 0.00113 /CRate Rider for Hydro One Capital Contributions Variance 1 $/kWh or $/kVA 0.00016 0.00016 0.00011 0.0183 0.0147 0.0151 0.1200 0.00021 /CRate Rider for Residual RARA 1 $/kWh or $/kVA -0.00007 -0.00006 -0.00007 -0.0287 -0.0327 -0.0343 -0.0293 -0.00009 /CRate Rider for LRAMVA 1 $/kWh or $/kVA -0.00003 0.00001 0.00046 0.1077 -0.0035 -0.0187 /CRate Rider for IFRS - 2014 Derecognition 4 $/kWh or $/kVA 0.00067 0.00066 0.00046 0.0752 0.0605 0.0623 0.4937 0.00088 /CRate Rider for POEB - Tax Savings 3 $/kWh or $/kVA -0.00069 -0.00067 -0.00047 -0.0766 -0.0616 -0.0634 -0.5028 -0.00090 /CRate Rider for 2012-14 Lost Revenue 4 $/kWh or $/kVA 0.00074 0.00072 0.00050 0.0821 0.0660 0.0680 0.5390 0.00096 /CRate Rider for Operations Center Consolidation Plan Sharing 3 $/kWh or $/kVA
Per Customer Rate RidersRate Rider for Stranded Meters Disposition 5 $/cust/30 days 0.22 1.19 3.62
Rate Riders Development