Decision Tree- M.B.A -DecSci
20
Decision Tree Report By: Ms.Lesly Anne Lising Mr. Kevin Chester Cajigas
-
Upload
lesly-lising -
Category
Presentations & Public Speaking
-
view
293 -
download
0
Transcript of Decision Tree- M.B.A -DecSci
Decision Tree
Report By: Ms.Lesly Anne Lising Mr. Kevin Chester Cajigas
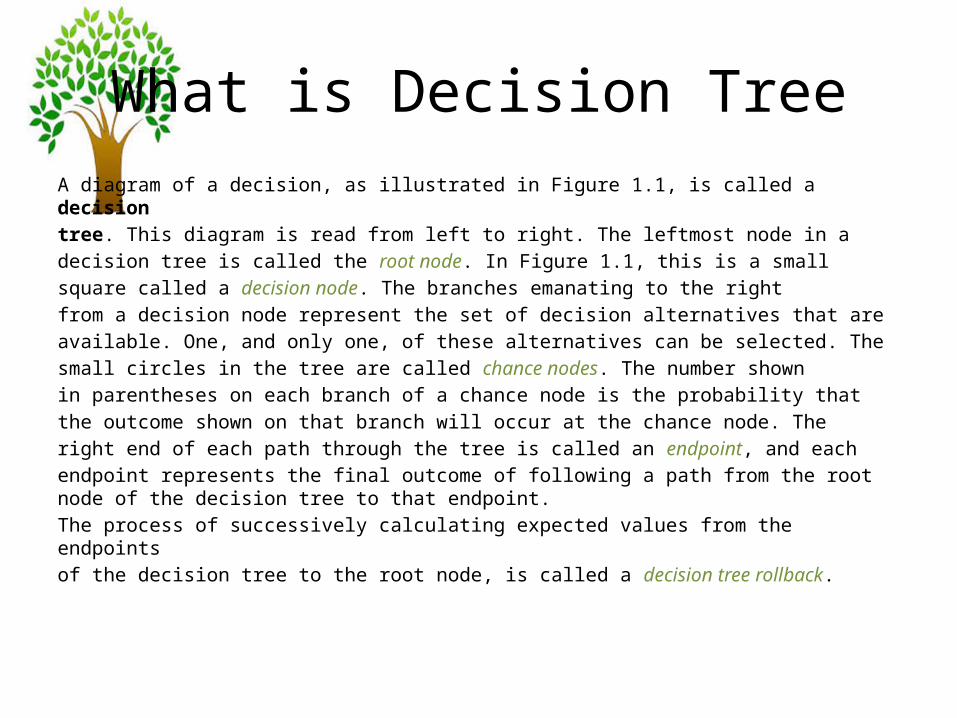
What is Decision TreeA diagram of a decision, as illustrated in Figure 1.1, is called a decisiontree. This diagram is read from left to right. The leftmost node in adecision tree is called the root node. In Figure 1.1, this is a smallsquare called a decision node. The branches emanating to the rightfrom a decision node represent the set of decision alternatives that areavailable. One, and only one, of these alternatives can be selected. Thesmall circles in the tree are called chance nodes. The number shownin parentheses on each branch of a chance node is the probability thatthe outcome shown on that branch will occur at the chance node. Theright end of each path through the tree is called an endpoint, and eachendpoint represents the final outcome of following a path from the root node of the decision tree to that endpoint.The process of successively calculating expected values from the endpointsof the decision tree to the root node, is called a decision tree rollback.
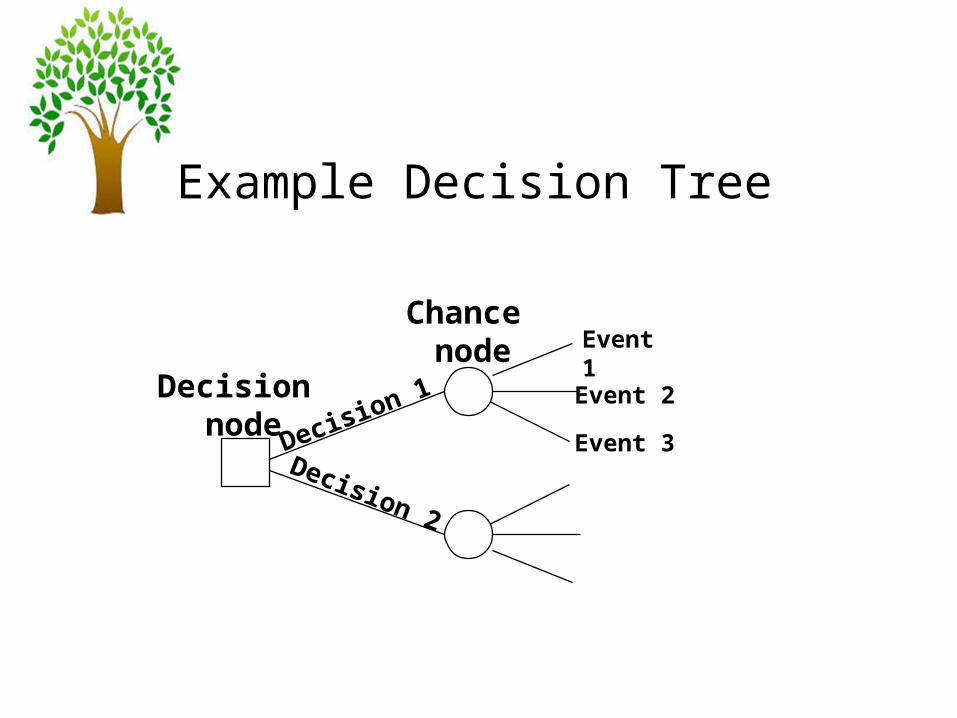
Example Decision Tree
Decision node
Chance node
Decision 1
Decision 2
Event 1
Event 2
Event 3
• Solving the tree involves pruning all but the best decisions at decision nodes, and finding expected values of all possible states of nature at chance nodes
• Create the tree from left to right • Solve the tree from right to left

Types of Nodes
Decision node: Often represented by squares showing decisions that can be made. Lines emanating from a square show all distinct options available at a node.
Chance node: Often represented by circles showing chance outcomes. Chance outcomes are events that can occur but are outside the ability of the decision maker to control.
Terminal node: Often represented by triangles or by lines having no further decision nodes or chance nodes. Terminal nodes depict the final outcomes of the decision making process.

Problem I Manly Plastics Inc. Product Decision
Product decision. To absorb some short-term excess production capacityat its Malabon plant, Manly Plastics Inc. is considering a short manufacturingrun for either of two new products, a Deck Type Pallet Mold or a Reversible Type Pallet Mold. The market for each product is known if the products can be successfully developed. However, there is some chance that it will not be possible tosuccessfully develop them.
Revenue of Php1,000,000 would be realized from selling the Deck Type Pallet Mold and revenue of Php400,000 would be realized from selling the Reversible Type Pallet Mold. Both of these amounts are net of production cost but do not include development cost.If development is unsuccessful for a product, then there will be no sales, and thedevelopment cost will be totally lost. Development cost would be Php100,000 forthe Deck Type Pallet Mold and Php10,000 for the Reversible Type Pallet Mold.
The probability of development success is 0.5 for the Deck Type Pallet Mold and 0.8 for the Reversible Type Pallet Mold
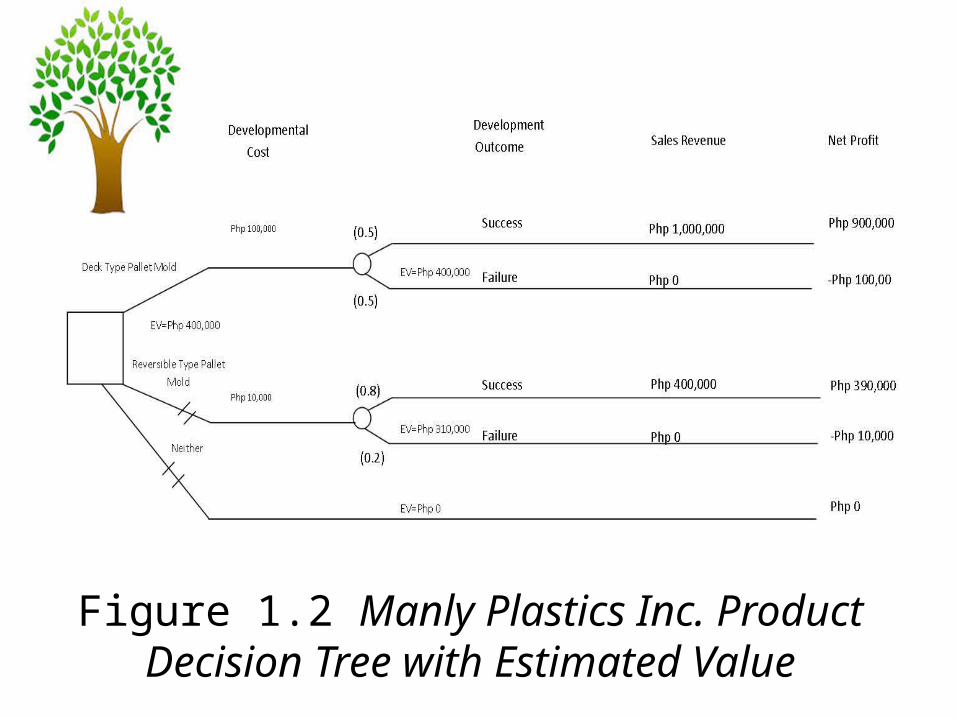
Figure 1.2 Manly Plastics Inc. Product Decision Tree with Estimated Value
What is EV (Expected Value)?
The expected value for an uncertain alternative is calculated by multiplying each possible outcome of the uncertain alternative by its probability, and summing the results. The expected value decision criterion selects the alternative that has the best expected value. In situations involving profits where more is better, the alternative with the highest expected value is best, and in situations involving costs, where less is better, the alternative with the lowest expected value is best.Let’s review Figure 1.2
Answer; Problem 1 Manly Plastics Inc. Product Decision
The expected values for the Special Instrument Productsdecision are designated by “EV" in Figure 1.2. These are determined as follows: 1) For the Deck Type Pallet Mold, 0.5 (Php900,000) + 0.5 (Php100,000) = Php400, 000 2) for the Reversible Type Pallet Mold , 0.8(390, 000)+0.2 (Php10,000) = Php310,000, and 3) for doing neither of these Php0. Thus, the alternative with the highest expected value is developing the temperature sensor,and if the expected value criterion is applied, then the Deck Type Pallet Mold should be developed.
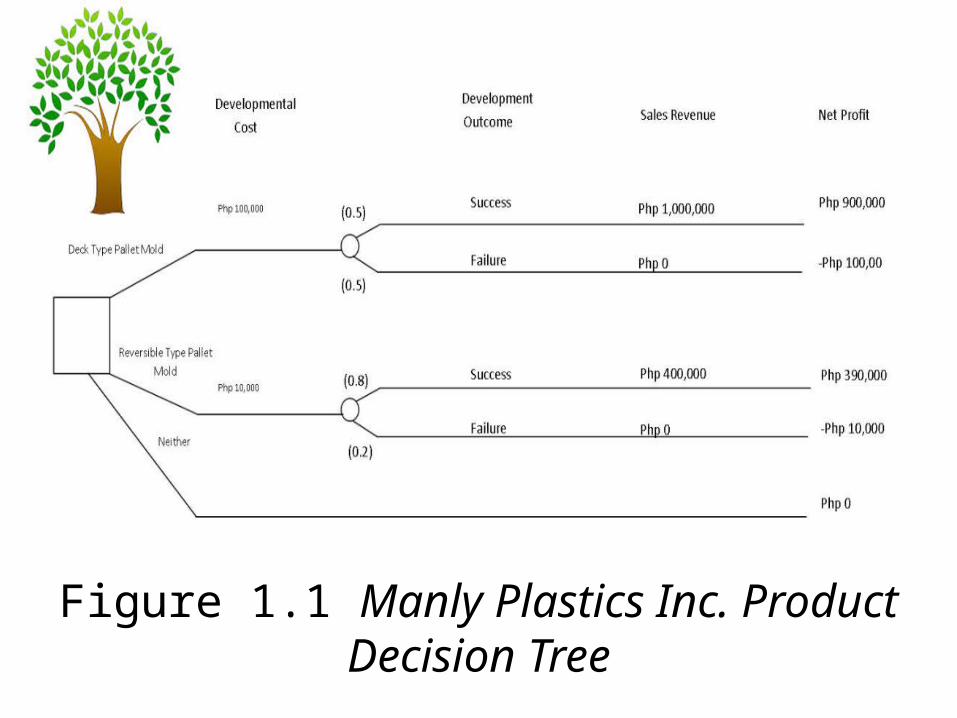
Figure 1.1 Manly Plastics Inc. Product Decision Tree
Problem II Vine Dessert Inc. Brownies Kiosk
Consider a situation in which the management of Vine Dessert Inc. must decide in choosing an ideal location to open a new branch of Brownies Kiosk.The table below shows the different cost to operate the business in different location and probability on sales event.
Problem II Vine Dessert Inc. Brownies Kiosk
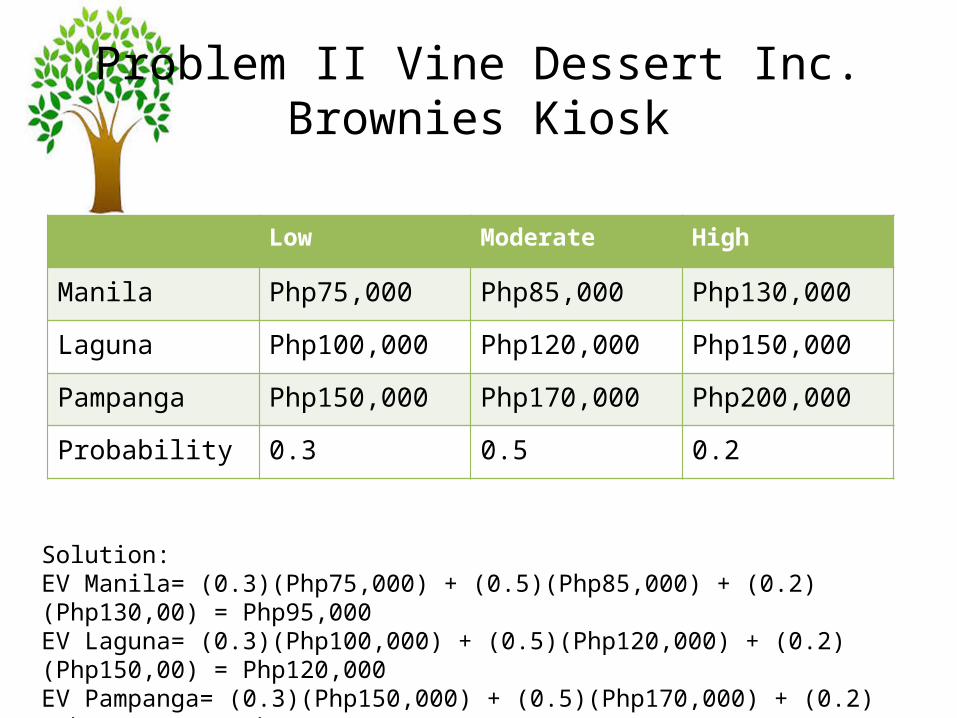
Low Moderate High
Manila Php75,000 Php85,000 Php130,000
Laguna Php100,000 Php120,000 Php150,000
Pampanga Php150,000 Php170,000 Php200,000
Probability 0.3 0.5 0.2
Solution:EV Manila= (0.3)(Php75,000) + (0.5)(Php85,000) + (0.2)(Php130,00) = Php95,000EV Laguna= (0.3)(Php100,000) + (0.5)(Php120,000) + (0.2)(Php150,00) = Php120,000EV Pampanga= (0.3)(Php150,000) + (0.5)(Php170,000) + (0.2)(Php200,00) = Php170,000
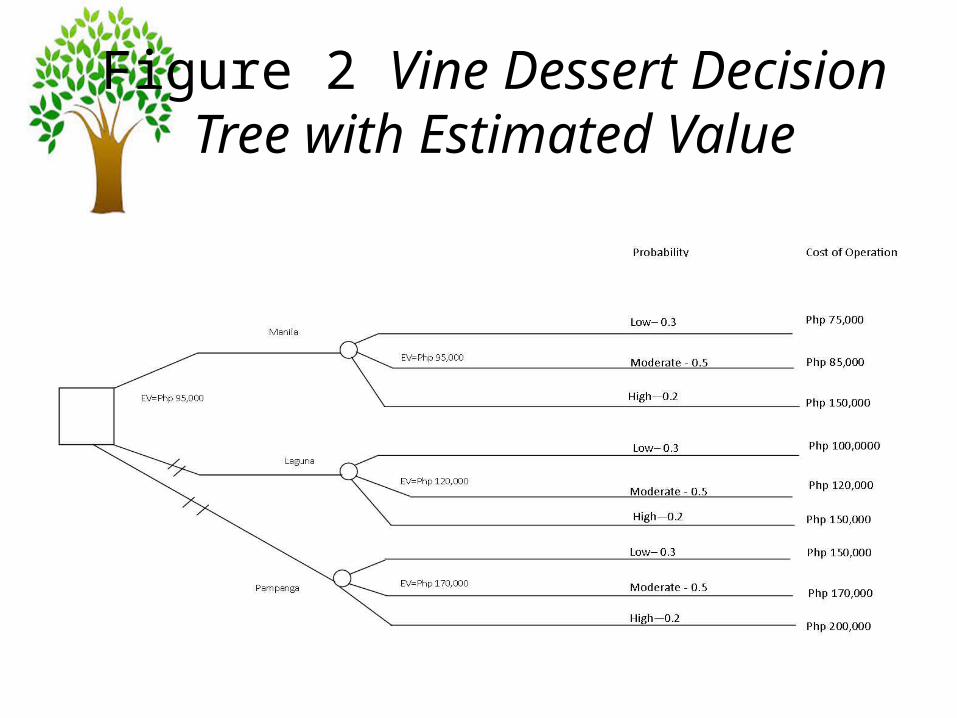
Figure 2 Vine Dessert Decision Tree with Estimated Value
Answer; Problem II Vine Dessert Inc. Brownies Kiosk
The problem has three alternatives one where to open new kiosk of Brownies. There are three states of nature or sales event in which of the said states of nature will occur because it is not under his control. He is just definite that any one among these will happen. Considering the problem is about the cost, thus the decision maker must choose whichever is lower.The management of Vine Dessert Inc. should open the new Brownies Kiosk at Manila since it has the lowest cost of business operation
Regression TreesDecision trees can also be used to analyse data when the y-outcome is a continuous measurement (such as age, blood pressure, ejection fraction for the heart, etc.). Such trees are called regression trees. Regression trees can be constructed using recursive partitioning similar to classification trees. Impurity is measured using mean-square error. The terminal node values in a regression tree are defined as the mean value (average) of outcomes for patients within the terminal node. This is the predicted value for the outcome
Survival TreesTime-to-event data are often encountered in the medical sciences. For such data, the analysis focuses on understanding how time-to-event varies in terms of different variables that might be collected for a patient. Time-to-event can be time to death from a certain disease, time until recurrence (for cancer), time until first occurrence of a symptom, or simple all-cause mortality.
http://www.ccs.miami.edu/~hishwaran/papers/decisionTree_intro_IR2009_EMDM.pdhttp://www.treeplan.com/chapters/introduction-to-decision-trees.pdfQuantitative Techniques in Business ( rex bookstore)