Decision Tree XLRI
20
Bayesian Decision Theory
description
How to make a decision tree
Transcript of Decision Tree XLRI

Bayesian Decision Theory
1. Prior Analysis
Decision-maker(DM) uses the available information and his subjective estimates of probabilities as the basis of business decision.
If the DM wants to improve or to revise his probabilities, he needs a market survey for that. But, the survey cost should not exceed the value of the additional information obtained. Hence, he needs step-2.
2. Pre-posterior analysis
It employs Baye’s theorem to revise the prior probabilities, given certain facts about the additional data(survey). If and only if, the value of additional information exceeds the total survey cost, the survey is justified.

3. Posterior analysis
The DM will use the revised probabilities as the basis for selecting the best strategy.
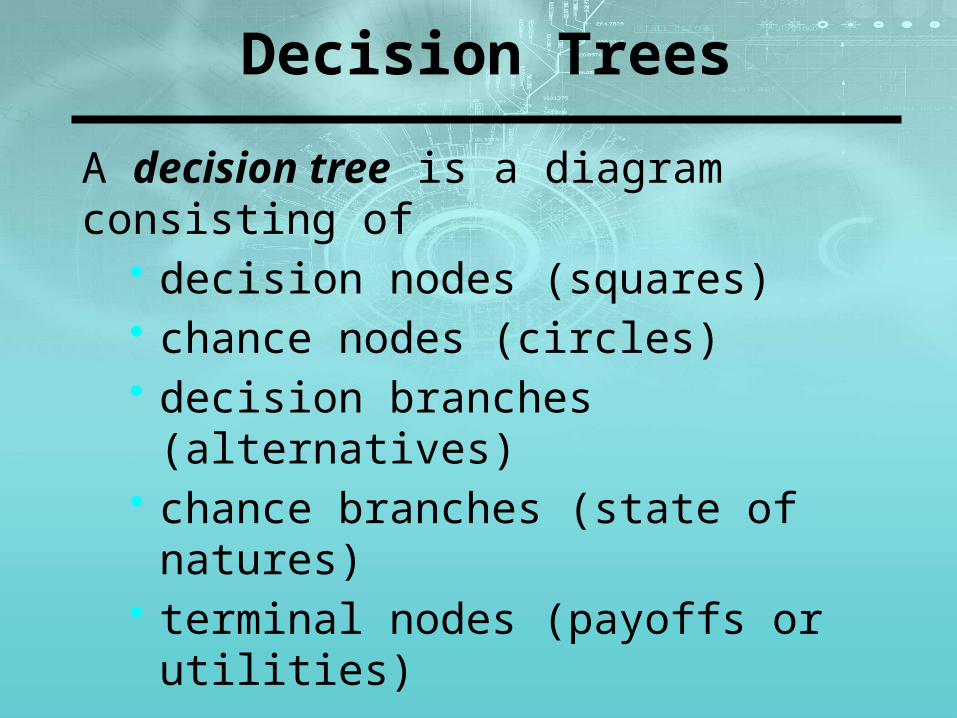
Decision Trees
A decision tree is a diagram consisting of• decision nodes (squares)• chance nodes (circles)• decision branches (alternatives)• chance branches (state of natures)• terminal nodes (payoffs or utilities)
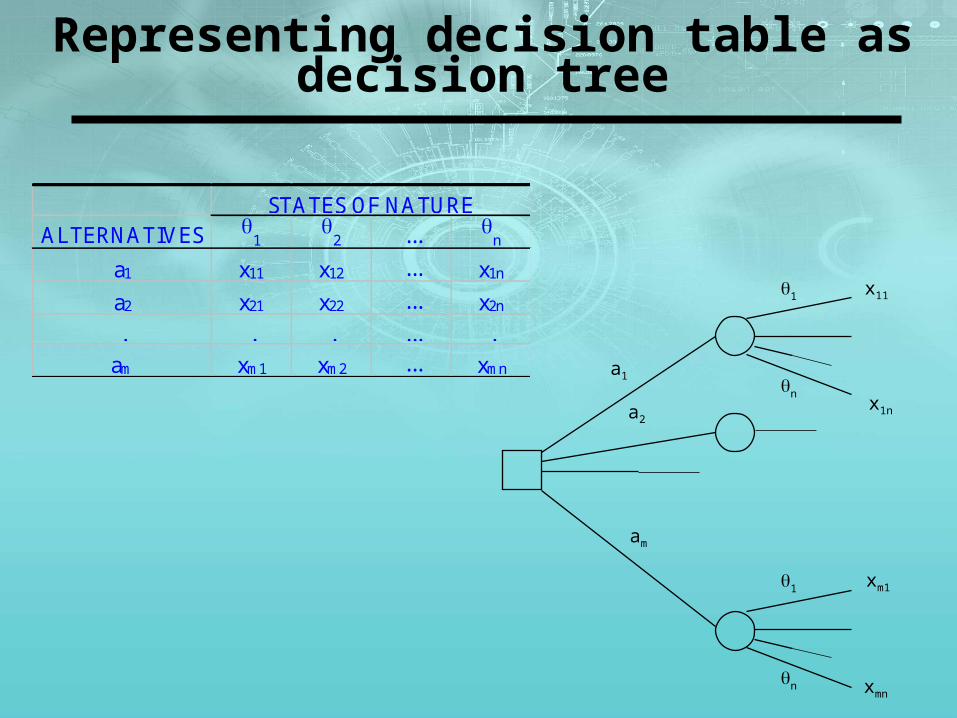
Representing decision table as decision tree
ALTERNATIVES 1
2 ...
n
a1 x11 x12 ... x1n
a2 x21 x22 ... x2n
. . . ... .
am xm1 xm2 ... xmn
STATES OF NATURE
a1
a2
am
q1 x11
qn x1n
q1 xm1
qn xmn
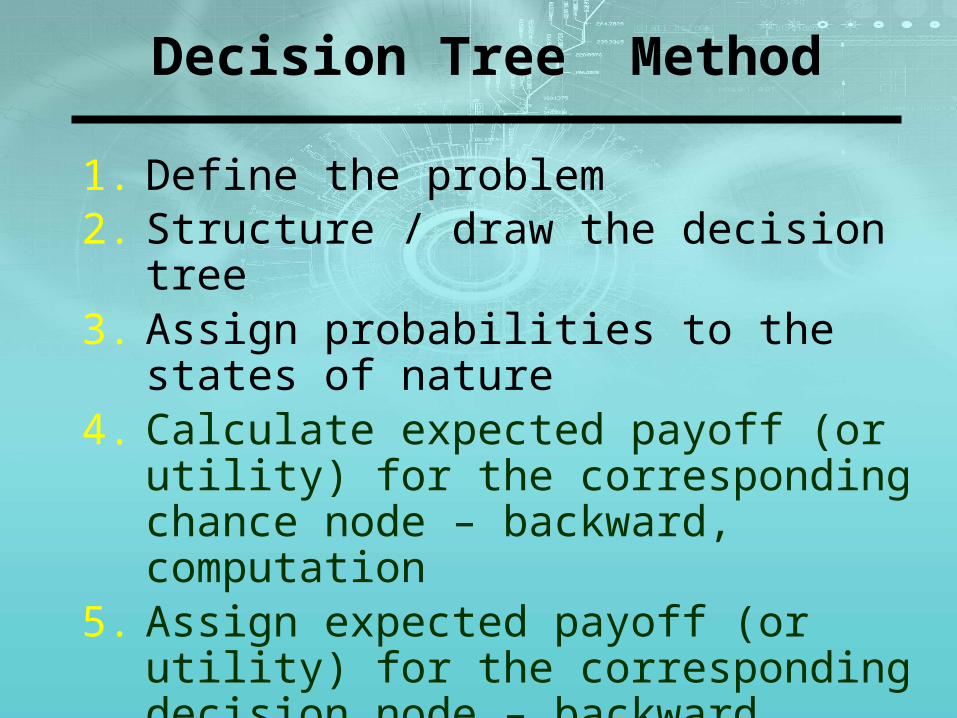
Decision Tree Method
1. Define the problem2. Structure / draw the decision tree3. Assign probabilities to the states of nature4. Calculate expected payoff (or utility) for the
corresponding chance node – backward, computation
5. Assign expected payoff (or utility) for the corresponding decision node – backward, comparison
6. Represent the recommendation
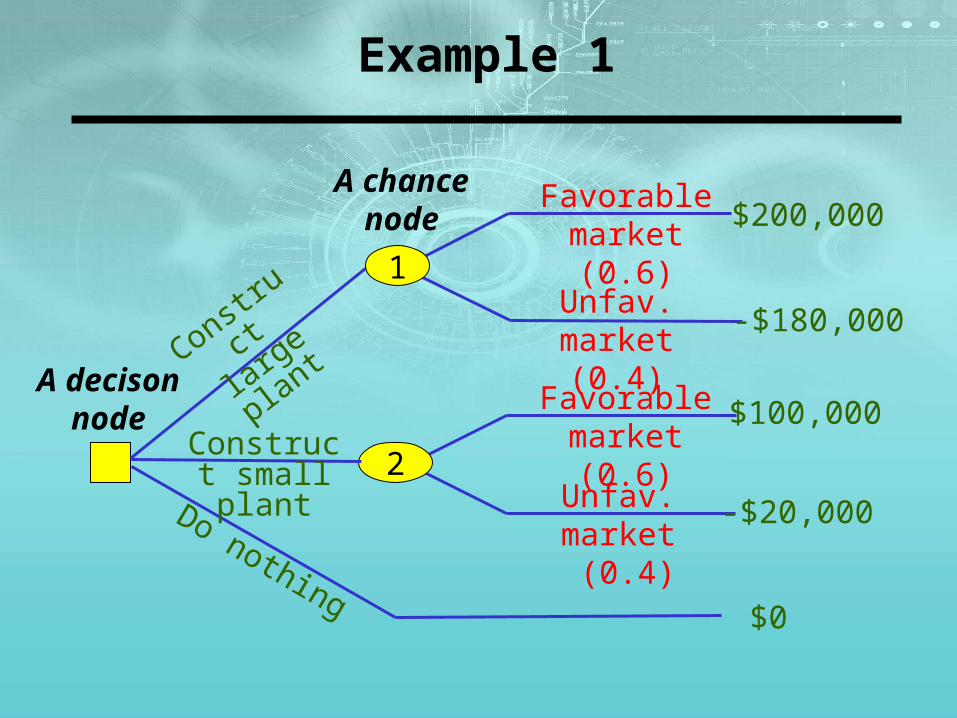
Example 1
A decison node
A chance node
Favorable market (0.6)
Unfav. market (0.4)
Construct
large p
lant
Do nothing
$200,000
-$180,000
$100,000
-$20,000
1
2Construct
small plant
$0
Unfav. market (0.4)
Favorable market (0.6)
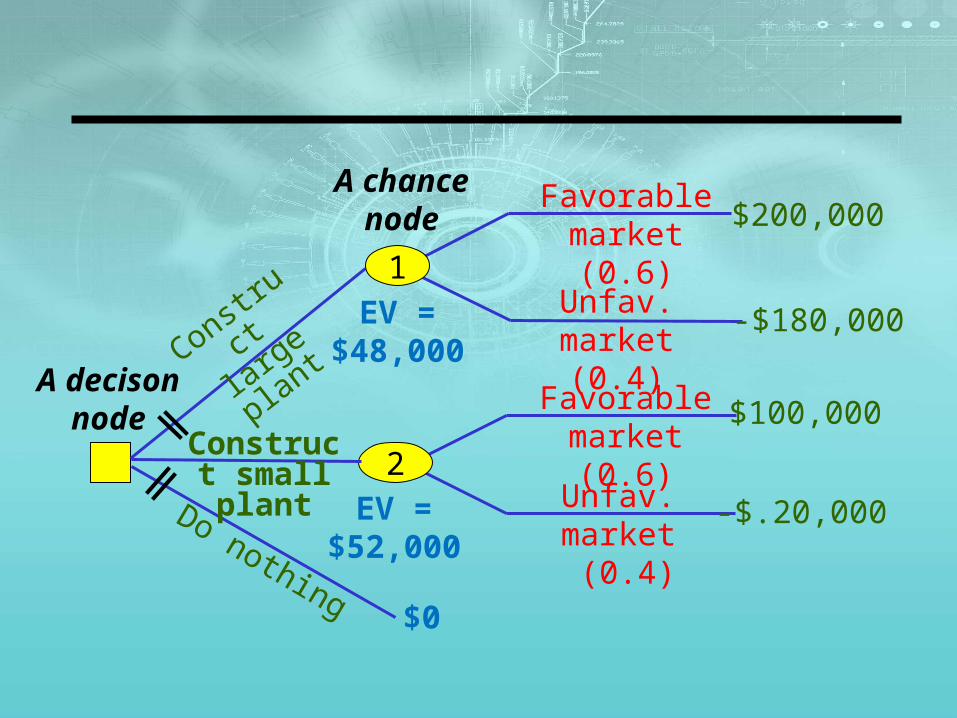
A decison node
A chance node
Favorable market (0.6)
Unfav. market (0.4)
Construct
large p
lant
Do nothing
$200,000
-$180,000
$100,000
-$.20,000
1
2Construct small plant
$0
Unfav. market (0.4)
Favorable market (0.6)
EV =$48,000
EV =$52,000
Sequential Decision Tree
• A sequential decision tree is used to illustrate a situation requiring a series of decisions (multi-stage decision making) and it is used where a payoff matrix (limited to a single-stage decision) cannot be used
Example 2
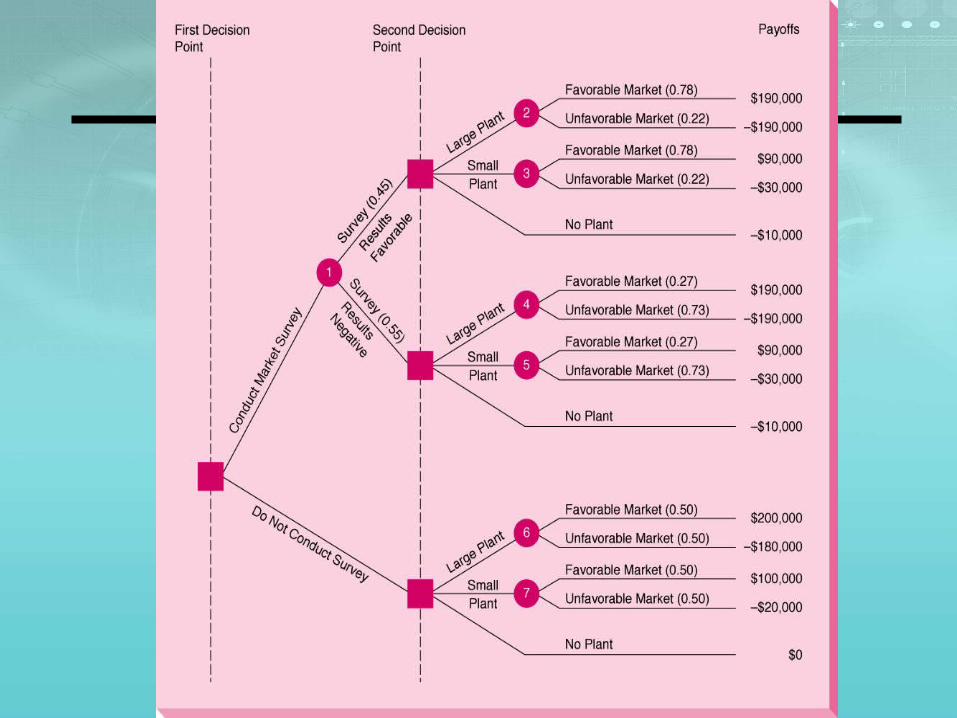
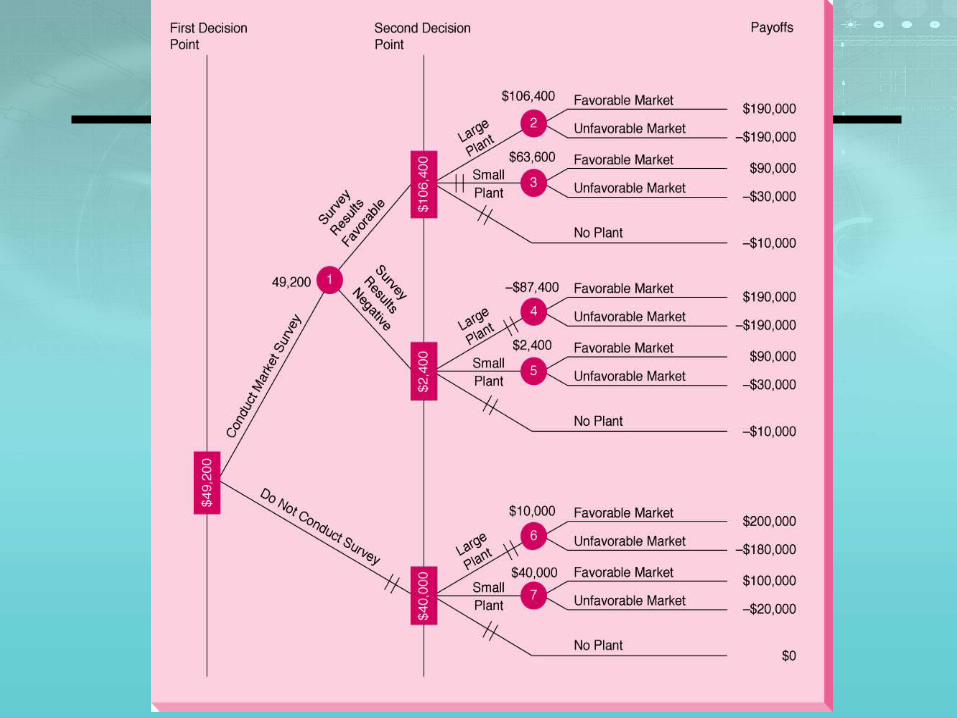
• Let’s say that DM has two decisions to make, with the second decision dependent on the outcome of the first.
• Before deciding about building a new plant, DM has the option of conducting his own marketing research survey, at a cost of $10,000.
• The information from his survey could help him decide whether to construct a large plant, a small plant, or not to build at all.

• Before survey, DM believes that the probability of a favorable market is exactly the same as the probability of an unfavorable market: each state of nature has a 50% probability
• There is a 45% chance that the survey results will indicate a favorable market
• Such a market survey will not provide DM with perfect information, but it may help quite a bit nevertheless by conditional (posterior) probabilities: • 78% is the probability of a favorable market given a
favorable result from the market survey• 27% is the probability of a favorable market given a
negative result from the market survey
Example
Example
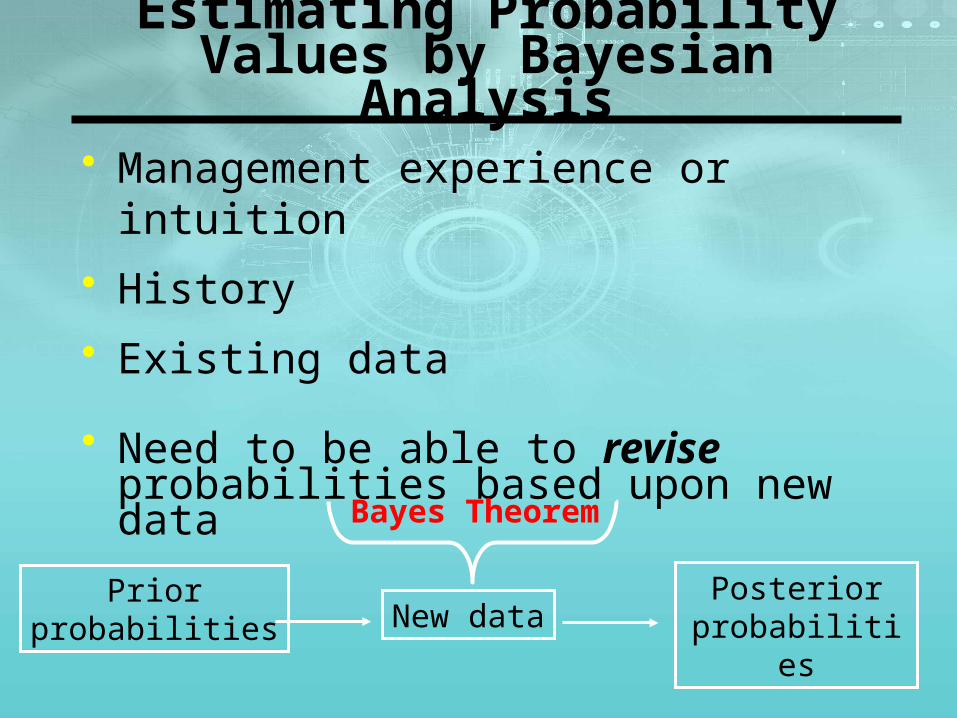
Estimating Probability Values by Bayesian Analysis
• Management experience or intuition
• History
• Existing data
• Need to be able to revise probabilities based upon new data
Posteriorprobabilities
Priorprobabilities New data
Bayes Theorem

Example:• Market research specialists have told DM that,
statistically, of all new products with a favorable market, market surveys were positive and predicted success correctly 70% of the time.
• 30% of the time the surveys falsely predicted negative result
• On the other hand, when there was actually an unfavorable market for a new product, 80% of the surveys correctly predicted the negative results.
• The surveys incorrectly predicted positive results the remaining 20% of the time.
Bayesian Analysis
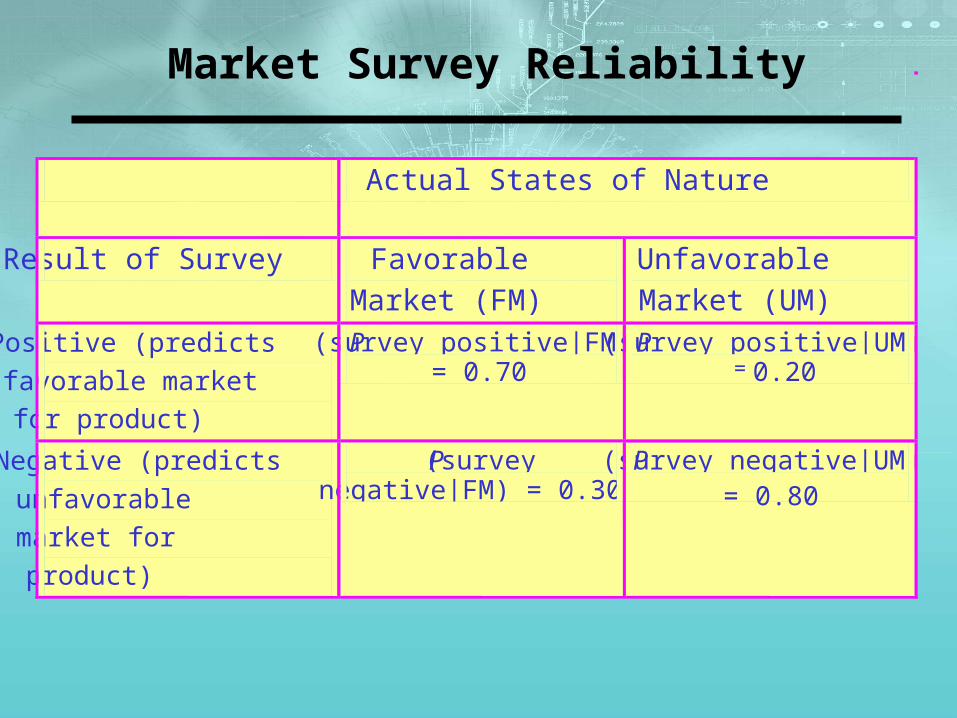
Market Survey Reliability
Actual States of Nature
Result of Survey Favorable
Market (FM)
Unfavorable
Market (UM)
Positive (predicts
favorable market
for product)
P(survey positive|FM) = 0.70
P(survey positive|UM) = 0.20
Negative (predicts
unfavorable
market for
product)
P(survey negative|FM) = 0.30
P(survey negative|UM) = 0.80
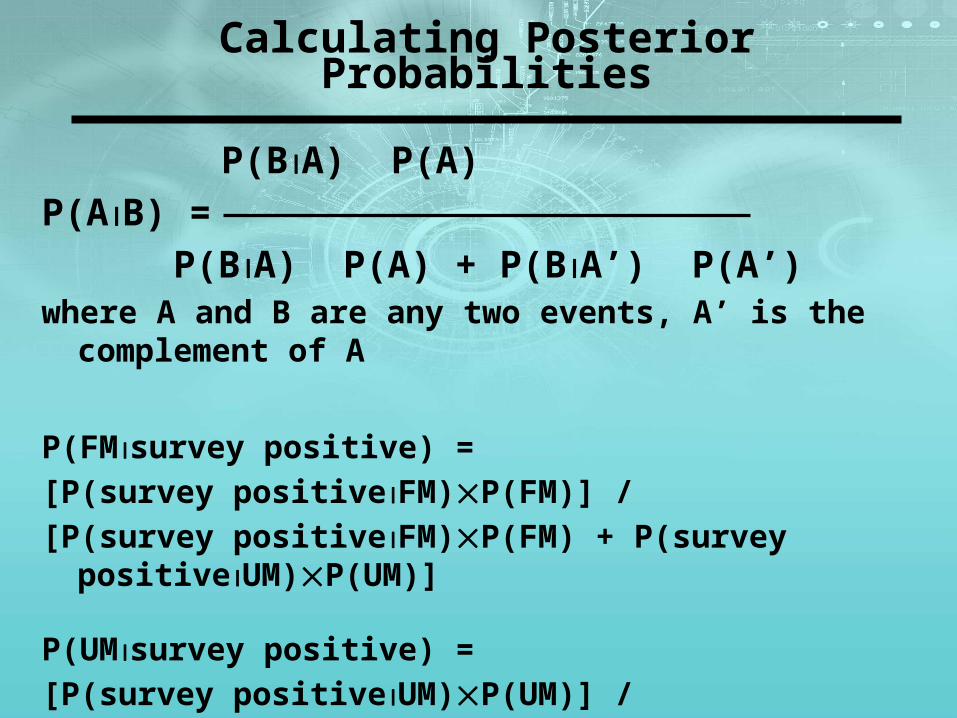
Calculating Posterior Probabilities
P(BA) P(A)
P(AB) =
P(BA) P(A) + P(BA’) P(A’)where A and B are any two events, A’ is the complement of A
P(FMsurvey positive) =
[P(survey positiveFM)P(FM)] /
[P(survey positiveFM)P(FM) + P(survey positiveUM)P(UM)]
P(UMsurvey positive) =
[P(survey positiveUM)P(UM)] /
[P(survey positiveFM)P(FM) + P(survey positiveUM)P(UM)]
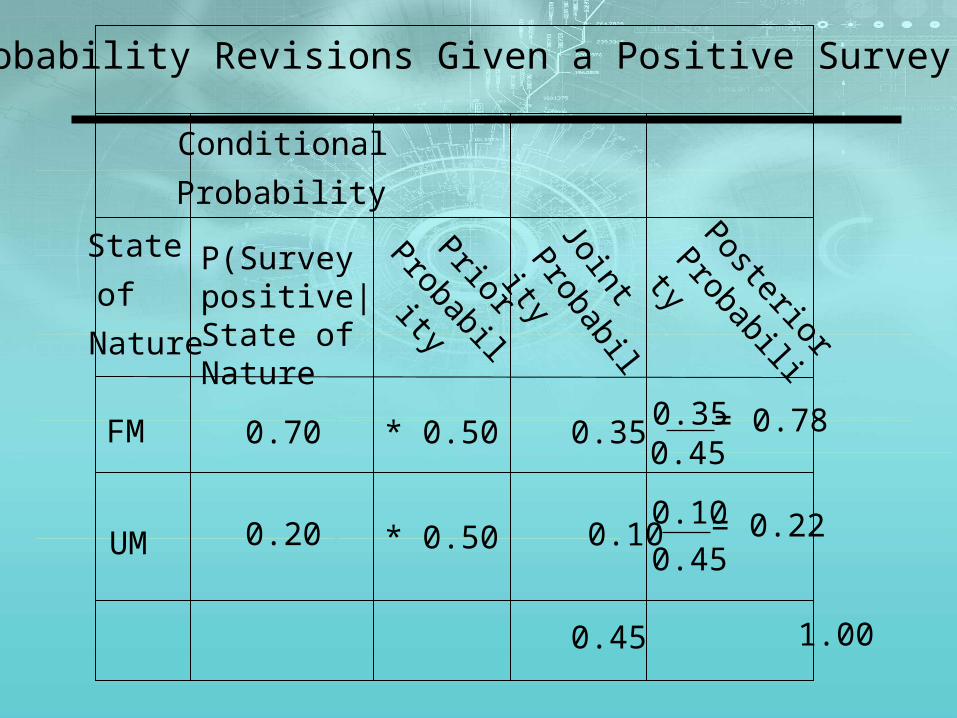
Probability Revisions Given a Positive Survey
Conditional
Probability
Posterior
Probability
State
of
Nature
P(Survey positive|State of Nature
Prior
Probability
Joint
Probability
FM 0.70 * 0.50 0.350.450.35 = 0.78
UM 0.20 * 0.500.45
0.10 0.10 = 0.22
0.45 1.00
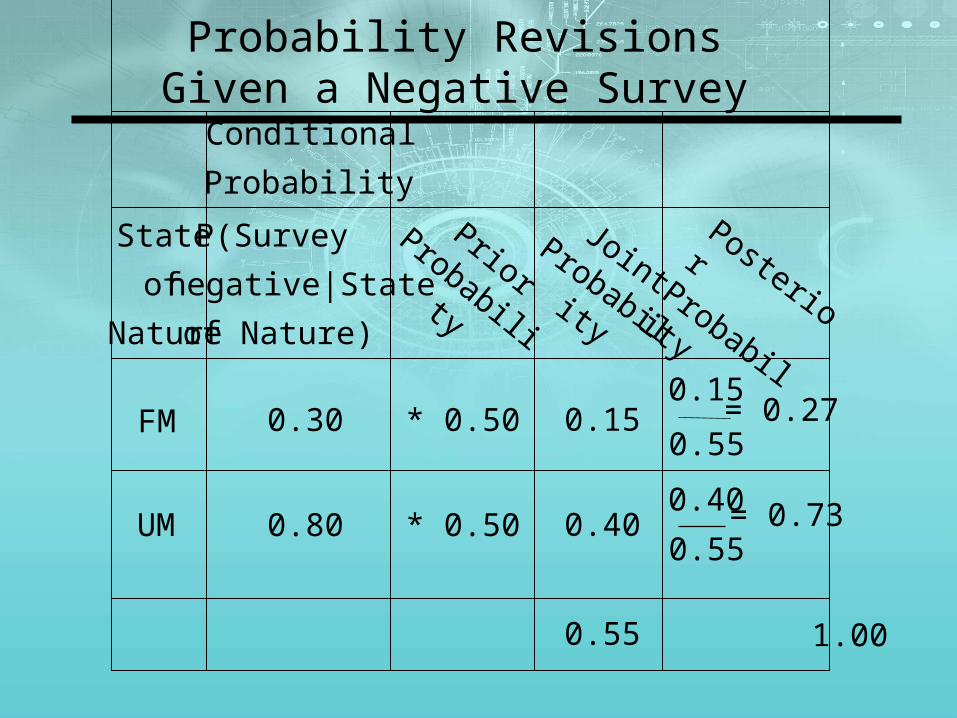
Probability Revisions Given a Negative Survey
Conditional
ProbabilityPosterior
Probability
State
of
Nature
P(Survey
negative|State
of Nature)
Prior Probability
Joint Probability
FM 0.30 * 0.50 0.150.55
0.15 = 0.27
UM 0.80 * 0.50 0.400.55
0.40 = 0.73
0.55 1.00