Dec. 2017 EPE report - Middle East Technical …dbe.metu.edu.tr/port/documents/Dec. 2017 EPE...
10
January 2, 2018 A RESEARCH REPORT ON DECEMBER 2017 EPE Özlem Atalay Director, School of Foreign Languages The new EPE was officially administered on December 13, 2017 to approximately 1000 graduate students seeking admission to graduate programs at METU. Since the December exams were given to comparable populations, a comparative study was warranted using the data of two consecutive DECEMBER EPEs (2017,2016, (2015 added in table 1). Another source of data was a group of test takers, who took both the September and December 2017 EPEs (table 4). The purpose of this report is to look at success rates and investigate the item discrimination and difficulty levels of the new exam. Approximately 10.000 students enter the EPE each year for reasons of admission to either freshman or graduate studies. This alone shows that it has a profound impact on test takers. This report will contribute to test validation and is the first in a series of reports concerning validity and reliability of EPE. 1 1 This report uses statistical work by Zeynep Akşit and Özlem Atalay, and was edited by Naz Dino.
Transcript of Dec. 2017 EPE report - Middle East Technical …dbe.metu.edu.tr/port/documents/Dec. 2017 EPE...

January 2, 2018
A RESEARCH REPORT ON DECEMBER 2017 EPE
Özlem Atalay
Director, School of Foreign Languages
The new EPE was officially administered on December 13, 2017 to approximately 1000 graduate students
seeking admission to graduate programs at METU. Since the December exams were given to comparable
populations, a comparative study was warranted using the data of two consecutive DECEMBER EPEs (2017,2016,
(2015 added in table 1). Another source of data was a group of test takers, who took both the September and
December 2017 EPEs (table 4). The purpose of this report is to
look at success rates and
investigate the item discrimination and difficulty levels of the new exam.
Approximately 10.000 students enter the EPE each year for reasons of admission to either freshman or graduate
studies. This alone shows that it has a profound impact on test takers. This report will contribute to test
validation and is the first in a series of reports concerning validity and reliability of EPE. 1
1 This report uses statistical work by Zeynep Akşit and Özlem Atalay, and was edited by Naz Dino.
I. A Comparison of Success Rates
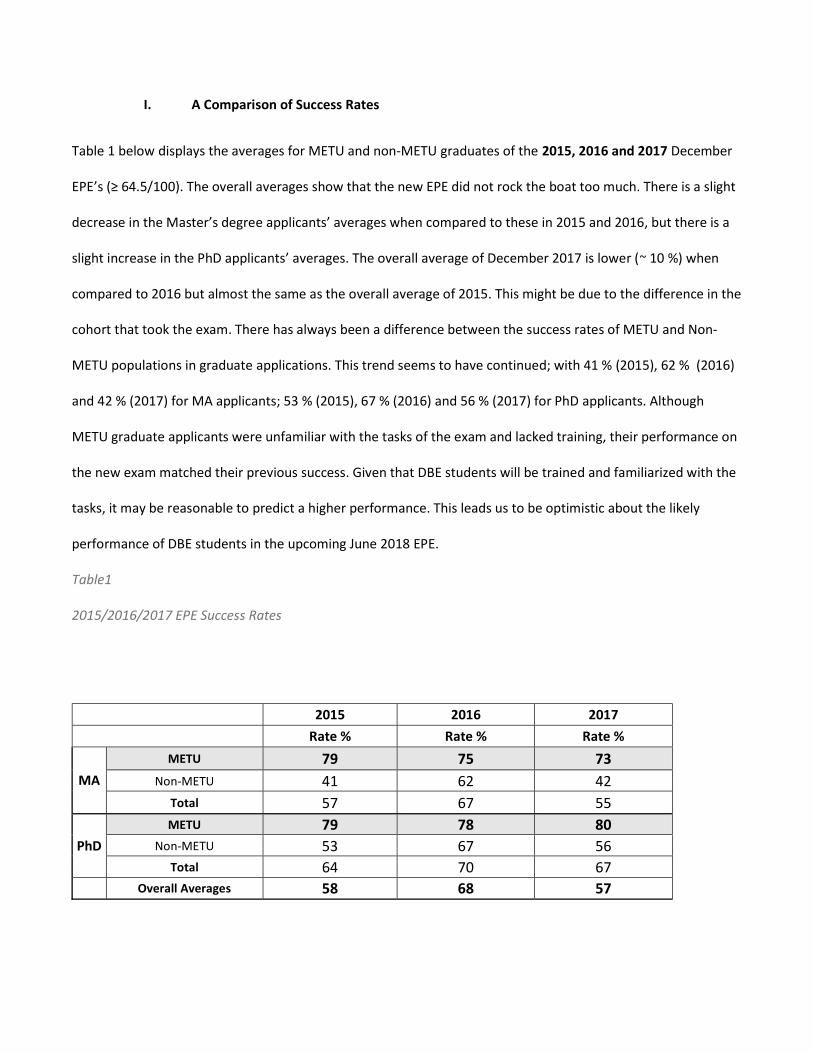
Table 1 below displays the averages for METU and non-METU graduates of the 2015, 2016 and 2017 December
EPE’s (≥ 64.5/100). The overall averages show that the new EPE did not rock the boat too much. There is a slight
decrease in the Master’s degree applicants’ averages when compared to these in 2015 and 2016, but there is a
slight increase in the PhD applicants’ averages. The overall average of December 2017 is lower (~ 10 %) when
compared to 2016 but almost the same as the overall average of 2015. This might be due to the difference in the
cohort that took the exam. There has always been a difference between the success rates of METU and Non-
METU populations in graduate applications. This trend seems to have continued; with 41 % (2015), 62 % (2016)
and 42 % (2017) for MA applicants; 53 % (2015), 67 % (2016) and 56 % (2017) for PhD applicants. Although
METU graduate applicants were unfamiliar with the tasks of the exam and lacked training, their performance on
the new exam matched their previous success. Given that DBE students will be trained and familiarized with the
tasks, it may be reasonable to predict a higher performance. This leads us to be optimistic about the likely
performance of DBE students in the upcoming June 2018 EPE.
Table1
2015/2016/2017 EPE Success Rates
2015 2016 2017 Rate % Rate % Rate %
MA METU 79 75 73
Non-METU 41 62 42 Total 57 67 55
PhD METU 79 78 80
Non-METU 53 67 56 Total 64 70 67
Overall Averages 58 68 57
II. A Comparison of the Sections of the Exam
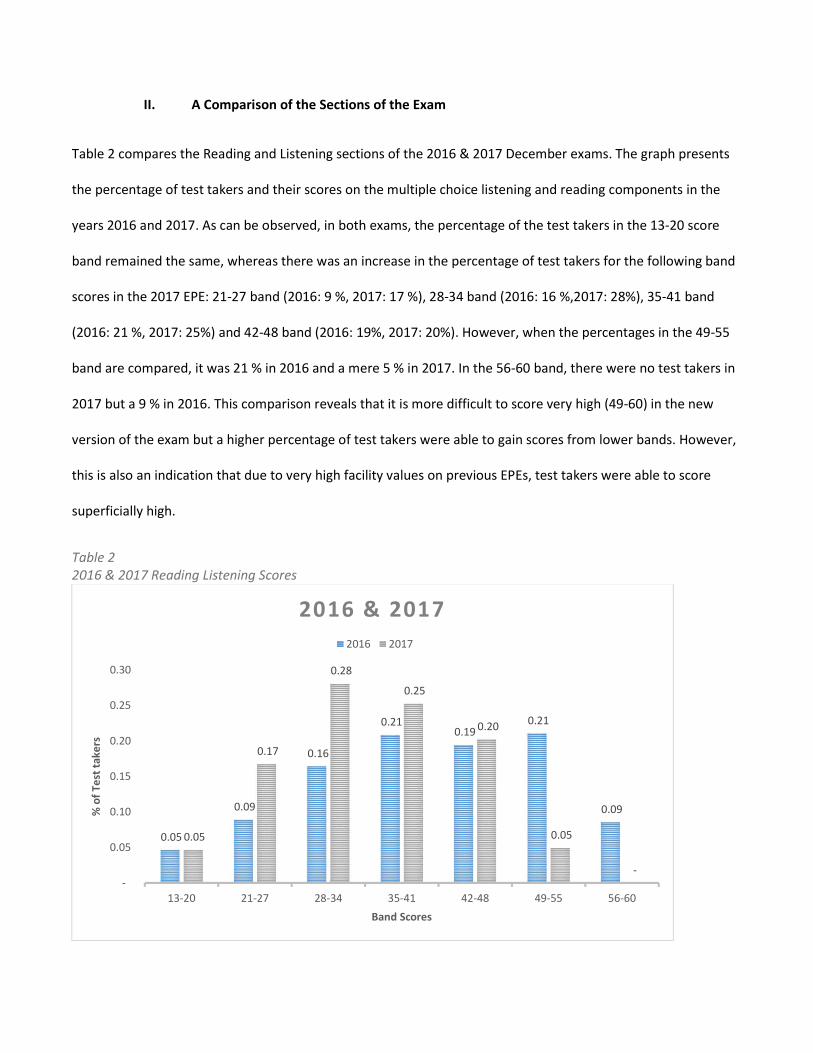
Table 2 compares the Reading and Listening sections of the 2016 & 2017 December exams. The graph presents
the percentage of test takers and their scores on the multiple choice listening and reading components in the
years 2016 and 2017. As can be observed, in both exams, the percentage of the test takers in the 13-20 score
band remained the same, whereas there was an increase in the percentage of test takers for the following band
scores in the 2017 EPE: 21-27 band (2016: 9 %, 2017: 17 %), 28-34 band (2016: 16 %,2017: 28%), 35-41 band
(2016: 21 %, 2017: 25%) and 42-48 band (2016: 19%, 2017: 20%). However, when the percentages in the 49-55
band are compared, it was 21 % in 2016 and a mere 5 % in 2017. In the 56-60 band, there were no test takers in
2017 but a 9 % in 2016. This comparison reveals that it is more difficult to score very high (49-60) in the new
version of the exam but a higher percentage of test takers were able to gain scores from lower bands. However,
this is also an indication that due to very high facility values on previous EPEs, test takers were able to score
superficially high.
Table 2 2016 & 2017 Reading Listening Scores
0.05
0.09
0.16
0.21 0.19
0.21
0.09
0.05
0.17
0.28
0.25
0.20
0.05
- -
0.05
0.10
0.15
0.20
0.25
0.30
13-20 21-27 28-34 35-41 42-48 49-55 56-60
% o
f Tes
t tak
ers
Band Scores
2016 & 20172016 2017

III. Descriptive Statistics of the 2016 & 2017 EPEs
Table 3 presents the minimum - maximum scores, mean scores and standard deviations of the parts of the 2017
exam. Comparing the mean scores of 2016 and 2017, the mean score of the Listening section remained almost
the same M = 19.54 (SD = 6,04), M = 19.14 (SD = 4,68), respectively. The Reading section mean in 2016 (M =
21.18, SD = 5.57) was 2.79 points higher than the 2017 mean score (overall M = 18.39, SD = 4.32 & 1.79).
Table 3 Descriptive statistics of 2017 EPE
N
Minimum
Maximum
Mean
Std. Deviation
Listening 1094 6,00 30,00 19,14 4,68
Reading 1094 3,75 24,00 15,53 4,32
Search Reading 1094 0,00 6,00 2,86 1,79
READING TOTAL 1095 3,75 30,00 18,39 --
Vocabulary 1095 0,00 10,00 5,15 2,22
Writing 1095 0,00 9,50 4,38 1,93
Performance Task 1095 0,00 19,50 10,50 5,40
OVERALL 1095 19,50 94,75 57,53 16,60
IV. Construct Validity of December 2017 EPE
One form of construct validation is based on correlational investigations. Correlation indicates the extent of
the relationship between two variables. The magnitude of a relationship between the components is
expressed as a coefficient of correlation, which ranges between r: 0.00 and 1.00. The higher the correlation,
the higher the degree of the relationship. The assumption is that if a test taker is good in one ability, or
section of the exam, they are likely to do well in another section as well. The underlying rationale is that
language proficiency predicts the rate of success to a certain degree. Test validation, therefore, involves

comparing the test to similar tests, i.e. TOEFL IBT, or comparing parts of the exam. In this case, a breakdown
of the exam to reveal the correlation between the components and their correlation coefficient are
displayed in Table 4.
Table 4 Inter-Componential Correlations in December 2017 EPE
Listening Reading Vocabulary Search Reading Writing Performance
Listening 1 .743** .665** .619** .308** .604** Reading .743** 1 .709** .663** .323** .594**
Vocabulary .665** .709** 1 .631** .293** .528**
Search R. .619** .663** .631** 1 .326** .542**
Writing .308** .323** .293** .326** 1 .426**
Performance .604** .594** .528** .542** .426** 1 TOTAL GRADE .873** .876** .788** .760** .495** .830** **. Correlation is significant at the 0.01 level (2-tailed).
In the Social Sciences, we interpret Pearson Correlation coefficients between -.20 and .20 generally
as weak, between .20 and .50 as moderate, and above .50 as strong. The correlation coefficient
between the components ranges from r: 0.743 and r: 0.293, the highest relationship (r: 0.743) between
Reading and Listening, and the lowest between Vocabulary and Writing. The correlations in our case,
except for the writing section, can be considered as strong, meaning the different sections draw from
similar skills and abilities. However, the writing scores do not correlate well with the other scores, and
therefore, there is a need to examine variables affecting writing scores, such as the task, the scale or
the rating process. The Performance task correlates highest with Listening and Reading (r: 0.604, r:
0.594) which is expected as the test taker is required to both listen, read and then to write to
accomplish the task. The vocabulary section, as expected, shows high correlation with Listening,
Reading and Search Reading (r: 0.665, r: 0.709, r: 0.631), respectively.
The correlation analysis for the Total Grade and the components of the exam revealed that the correlation of

each component with the TOTAL GRADE differs slightly. When rank ordered, Reading followed immediately by
Listening and the Performance task are the components that correlate with the overall grade the most (ranging
from .876 - .830). They are followed by Vocabulary and Search Reading ( .788, .760 respectively); Writing is the
component that shows the lowest correlation (r: .495).
V. A Comparison of September and December 2017 EPEs
We also investigated if there were participants who took both the September 2017 and the December 2017
exams. A total of 175 students were identified. Table 5 compares the percentages of items that test takers were
able to correctly answer on the Listening, Reading and Writing sections of September and December 2017 EPEs.
A higher percentage of scores was obtained from on the new EPE (NEPE) Listening section compared to the EPE
Listening section (NEPE L 56%, EPE L 47%). In the Reading section, the score ratio was slightly lower in NEPE
(NEPE R 50%, EPE R 53%). As for the Writing section, on both EPEs test takers received 42 % of the available
score. This comparison of the September and December 2017 EPEs using the data of a cohort of 175 test takers
(please note that these were low achieving test takers), reveals that the new test had a similar difficulty level for
these particular test takers in the Reading, Listening and Writing sections, which account for 90/100 points of
the exam.
Table 5 September 2017 and December 2017 EPE sections in %
NEPE L EPE L NEPE R EPE R NEPE W EPE W
0.56
0.47
0.50
0.53
0.42
0.42
VI. A Comparison of the Item Difficulty of the Exam
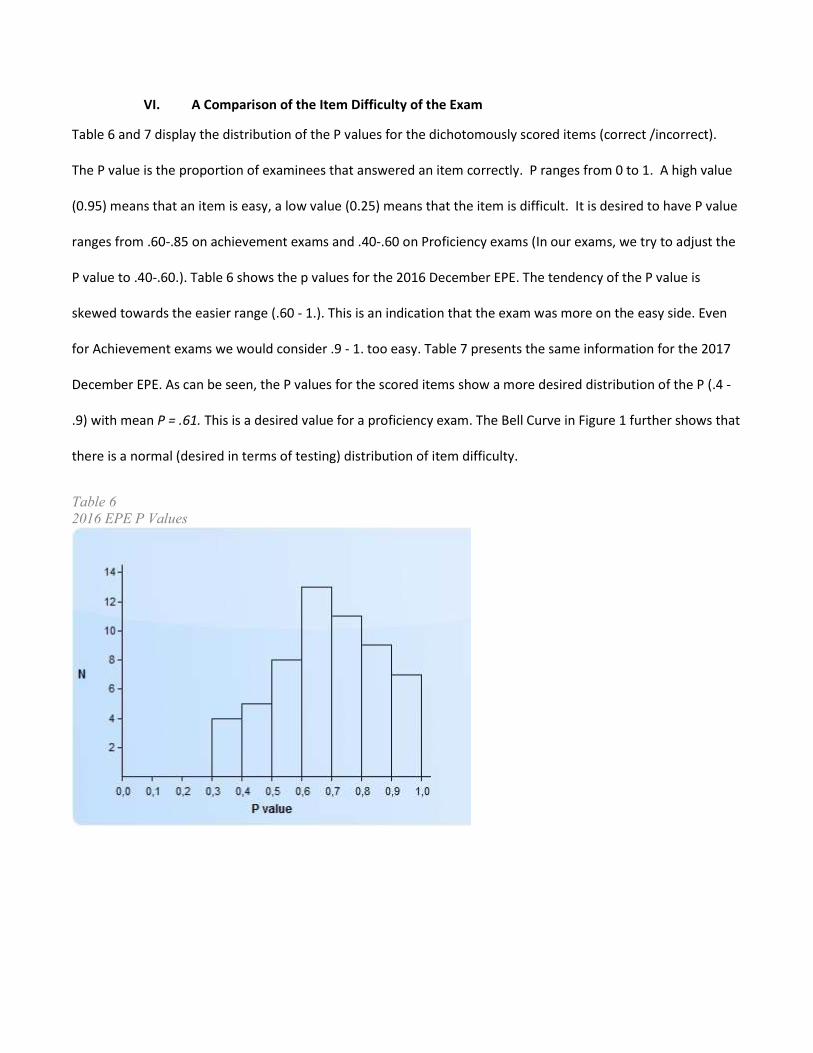
Table 6 and 7 display the distribution of the P values for the dichotomously scored items (correct /incorrect).
The P value is the proportion of examinees that answered an item correctly. P ranges from 0 to 1. A high value
(0.95) means that an item is easy, a low value (0.25) means that the item is difficult. It is desired to have P value
ranges from .60-.85 on achievement exams and .40-.60 on Proficiency exams (In our exams, we try to adjust the
P value to .40-.60.). Table 6 shows the p values for the 2016 December EPE. The tendency of the P value is
skewed towards the easier range (.60 - 1.). This is an indication that the exam was more on the easy side. Even
for Achievement exams we would consider .9 - 1. too easy. Table 7 presents the same information for the 2017
December EPE. As can be seen, the P values for the scored items show a more desired distribution of the P (.4 -
.9) with mean P = .61. This is a desired value for a proficiency exam. The Bell Curve in Figure 1 further shows that
there is a normal (desired in terms of testing) distribution of item difficulty.
Table 6 2016 EPE P Values

Table 7 2017 EPE P Values
Figure 1 The Bell Curve for 2017 EPE

VII. Reliability of December 2017 EPE
A - Item Discrimination
The point-biserial correlation (Rpbi) is a measure of the discriminating, or differentiating, power of an item.
Rpbis ranges from -1 to 1. A negative Rpbi is indicative of a bad item as lower scoring examinees are more likely
than higher scoring examinees to respond in the keyed direction. A .25 and above Rpbi shows that the item
discriminates the test takers well. The Rpbi mean for the multiple choice items of the 2017 exam was found to
be Rpbi .33, meaning that the exam discriminated well between higher and lower proficiency levels.
Psychometricians consider items with Rpbi in the .30 - .49 range to be strong discriminators.
B- Reliability
Cronbach’s alpha measures the internal consistency of a group of items by measuring the homogeneity of the
group of items. It tells us how well the different items in one section or on the whole exam are in harmony with
each other and measure different aspects of the same variable. Cronbach’s alpha ranges in value between 0 and
1. Values closer to 1 indicate a higher internal consistency; values closer to 0 indicate a lower internal
consistency. An alpha coefficient of ≥70 is considered as high. Our analysis revealed that the internal reliability
of the exam can be considered high (α= .81).
VIII. Concluding Remarks
Further analysis to gain insight into the predictive validity of the new EPE will be conducted in due course. As
you all know, we did a comparative study last year and shared its findings with you at our general staff meeting
in September. Our findings were one form of proof for construct validity, i.e. we compared the components of
EPE to the components of the TOEFL IBT. The analysis had revealed high correlations, which would be expected
and desired as both exams claim to be testing language proficiency.

From our present analysis, we can conclude that the construct validity of the whole test improved (when
compared to the previous EPE) as the components represent more authentic tasks that students will be required
to do in their departments. The correlations of the components are quite high, item discrimination correlation
(Rpbis.33) and reliability measure (Cronbach Alpha .81) reveal that the exam is enhanced. Therefore, it is
believed that the backwash effect of the exam on instruction at DBE will be positive.
However, there is also room for improvement. It was observed that the time for both the multiple choice
Reading and the Search Reading section was insufficient. Therefore, in future exams time allocated for these
sections will be increased by 5 minutes each. The Vocabulary (M = 5.15, SD = 2.22) section item analysis revealed
that there were some flagged items (too difficult). The items in this exam were chosen from the academic word
list (AWL). In future exams, vocabulary from the K2 and K3 (2000-3000 word families) will also be included. This
will automatically set the vocabulary section in a lower difficulty band. Another observation was that the writing
section grades showed low correlation when compared to the overall scores of test takers. So we went back and
examined scored writing papers of test takers. This revealed the necessity to revise the rating scale to better
emphasize the aspects of writing we wish to assess. It is believed that with these changes the exam will be a
better predictor of our students’ future success in their academic studies.