De novo repeat classification and fragment assembly: from de
61
De novo repeat classification and fragment assembly: from de Bruijn to A-Bruijn graphs
Transcript of De novo repeat classification and fragment assembly: from de
De novo repeat classification and fragment assembly:
from de Bruijn to A-Bruijn graphs
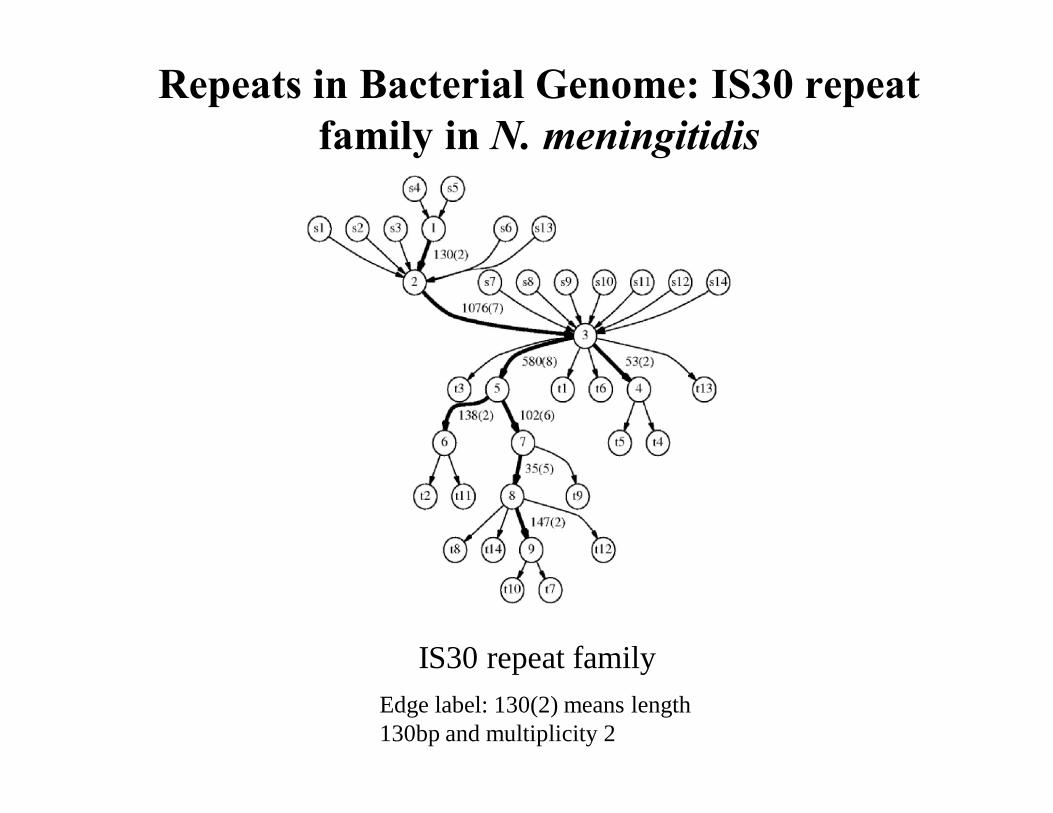
IS30 repeat family
Repeats in Bacterial Genome: IS30 repeat family in N. meningitidis
Edge label: 130(2) means length 130bp and multiplicity 2

De novo repeat classification and fragment assembly with A-Bruijn
graph approach
Pavel Pevzner1, Haixu Tang2, Glenn Tesler3
1Department of Computer Science and Engineering, UCSD2Department of Computer Science, University of Indiana
3Department of Mathematics, UCSD

Adapted from http://www.hhmi.org/research/investigators/eichler.html
Duplication landscape of 2p11
Mosaic Arrangements in Segmental Duplications in Human Genome

Two-step model of segmental duplications (Evan Eichler, 1997)
Adapted from Horvath et al 2005
Ancestral duplication units are called duplicons

Mosaic repeats structure: an imaginary example
A B C D E F G H I J
A B C D E F G H I JC
A B C D E F G H I JC B C D
A B C D E F G H I JC B C D F GC
• The mosaic structure of segmental duplications in human genome is revealed using the A-Bruijn graph approach:Jiang, Tang, She, P.P, Eichler. Evolutionary reconstruction of segmental duplications
reveals punctuated cores of human gene innovations (Nature Genetics, 2007)

The Segmental Duplication in Human Genome: The Ancestral Duplicon Problem
• The duplicon problem: can we identify duplicons?• Case-by-case studies:
* Jackson et al 1999; …, Stankiewicz et al 2004; Horvath et al 2005• All duplicons: Hard
* Eichler group •only had limited success with chr22 (Bailey et al 2002),
• The mosaic structure of segmental duplications in human genome is revealed using the A-Bruijn graph approach:
Zhaoshi Jiang, Haixu Tang, Xinwei She, PP, Evan Eichler. Evolutionary reconstruction of segmental duplications reveals punctuated cores of human gene innovations (Nature Genetics, in press)

The Duplicon Problem• Tang et al 2007 proposed a computational method for identifying all duplicons.
Adapted from Tang et al 2005
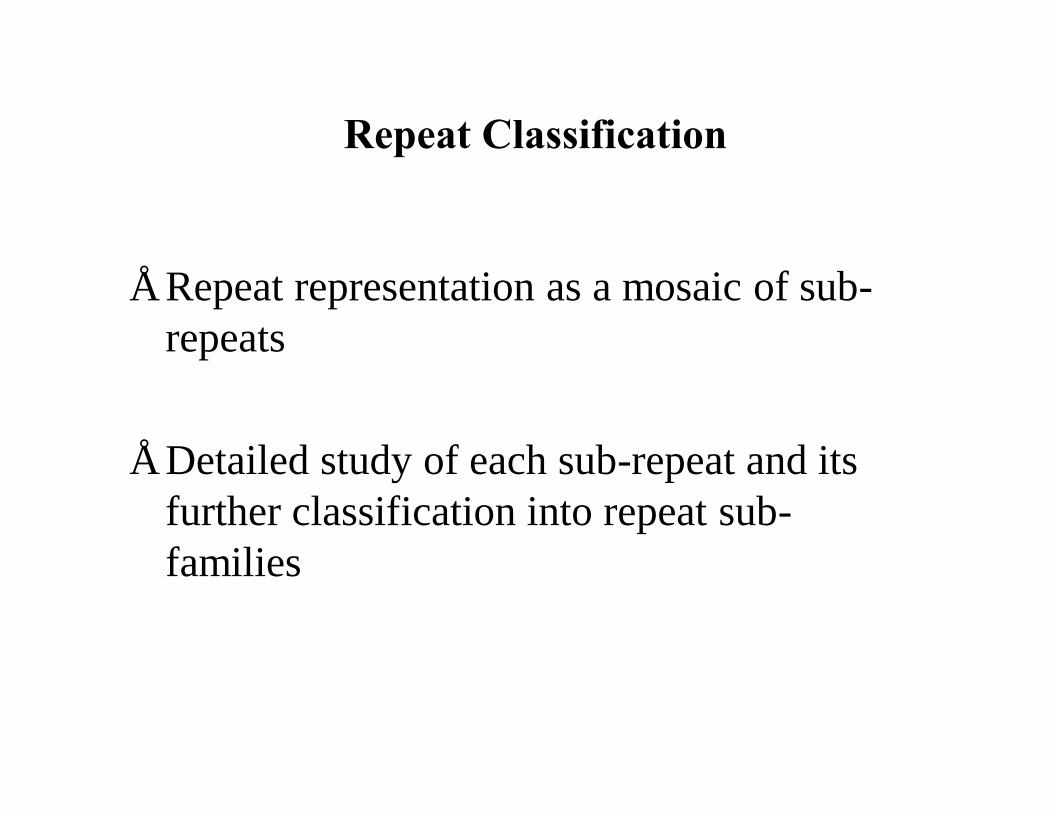
Repeat Classification
• Repeat representation as a mosaic of sub-repeats
• Detailed study of each sub-repeat and its further classification into repeat sub-families

Mosaic Structure of Segmental Duplication in Human Chromosome 22
Bailey et. al. 2002, Am. J. Hum. Genet.

Algorithmic Challenge
• Problem: find all repeat elements and reveal the sub-repeat mosaic structure.– Perfect repeats: de Bruijn graph, suffix tree.– Imperfect repeats: OPEN PROBLEM.
• Goal: Generalize the de Bruijn graph for imperfect repeats.

De Novo Repeat Classification: messy and ill-defined problem
“The problem of automated repeat sequence family classification is inherently messy and ill-defined and does not appear to be amenable to a clean algorithmic attack.”
Bao & Eddy 2002, Genome Research

De Novo Repeat Classification: messy and ill-defined problem
“The problem of automated repeat sequence family classification is inherently messy and ill-defined and does not appear to be amenable to a clean algorithmic attack.”
Bao & Eddy 2002, Genome Research

De Novo Repeat Classification
Library of repeat elements
Element 1 AGCCTACG … …
… …
Element 2 TGCATTTT … …Element 3 GAACTCAC … …
De novo compilation
?
Reputer
Pairwise similarity

Similarity matrix
A B C D E F G H I JC B C D F GC
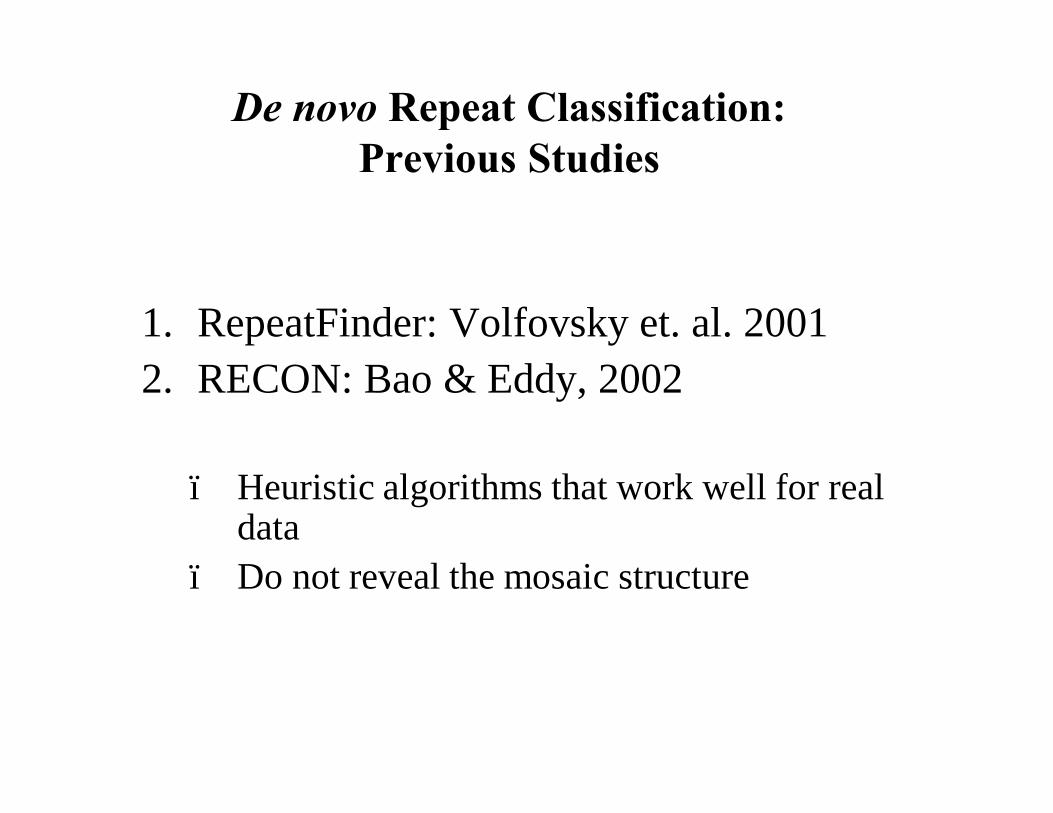
De novo Repeat Classification: Previous Studies
1. RepeatFinder: Volfovsky et. al. 20012. RECON: Bao & Eddy, 2002
– Heuristic algorithms that work well for real data
– Do not reveal the mosaic structure

Annotating Known Repeat Elements
Library of (known) repeat elements
Element 1 AGCCTACG … …
… …
Element 2 TGCATTTT … …Element 3 GAACTCAC … …
De novo Repeat Classification Problem: Given a newly sequenced genome, find all repeat elements (sub-repeats) in this genome.
Genome
RepeatMasker
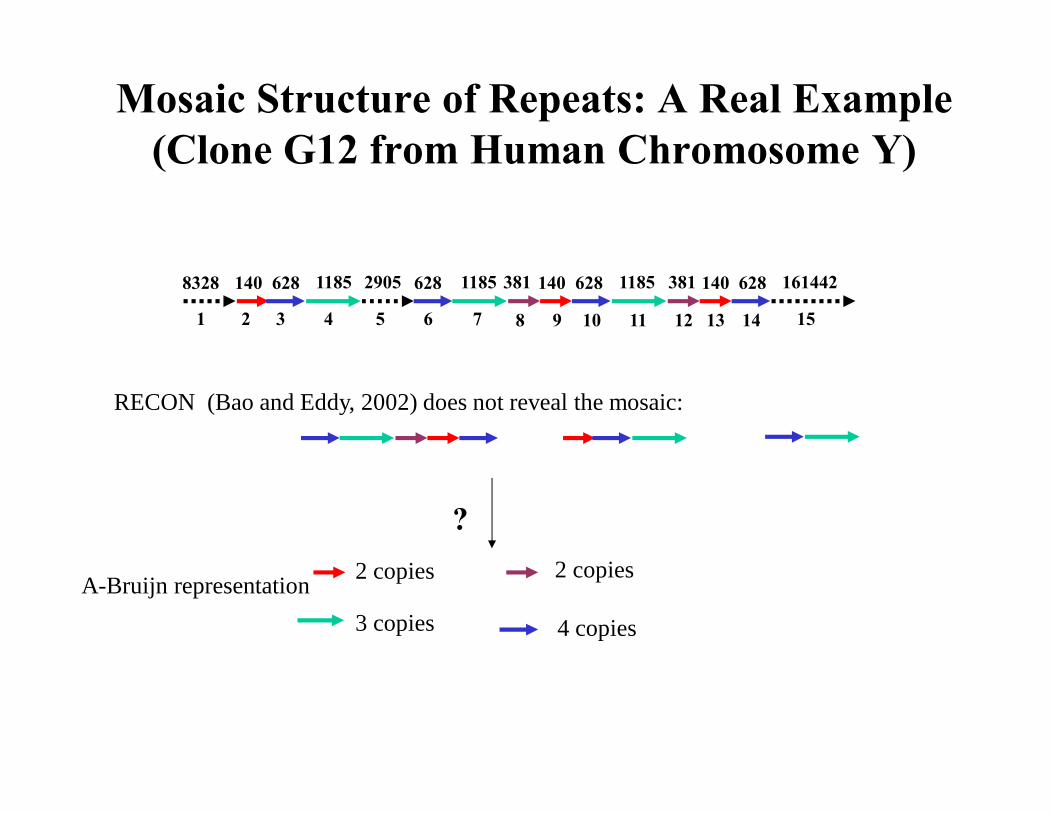
Mosaic Structure of Repeats: A Real Example(Clone G12 from Human Chromosome Y)
8328 140 628 1185 2905 381 161442628 1185 140 628 1185 381 140 628
1 2 3 4 5 6 7 8 9 10 11 12 13 14 15
RECON (Bao and Eddy, 2002) does not reveal the mosaic:
A-Bruijn representation 2 copies
3 copies
2 copies
4 copies
?

De Bruijn Graph: Applications in Bioinformatics
• Sequencing by hybridization (Pevzner, 1989)• Re-sequencing with DNA arrays (Shamir and
Tsur, 2001, Peer et al., 2002)• Fragment assembly (Idury and Waterman, 1995,
Pevzner et. al. 2001)• EST analysis (Heber, et. al., 2002)• Computational mass-spectrometry (Bocker, 2003,
Bandeira et al., 2007)

De Bruijn Graph: Classification of Perfect Repeats
ABCDEFCGHBCDIFCGJ
Vertices: (k-1)-mers from the sequence
AB BC CD DE EF FC CG
GHHB
DI IF
GJ
Every sub-repeat is represented as a repeat edge in the graph.
BCD FCG
Edges: k-mers from the sequence

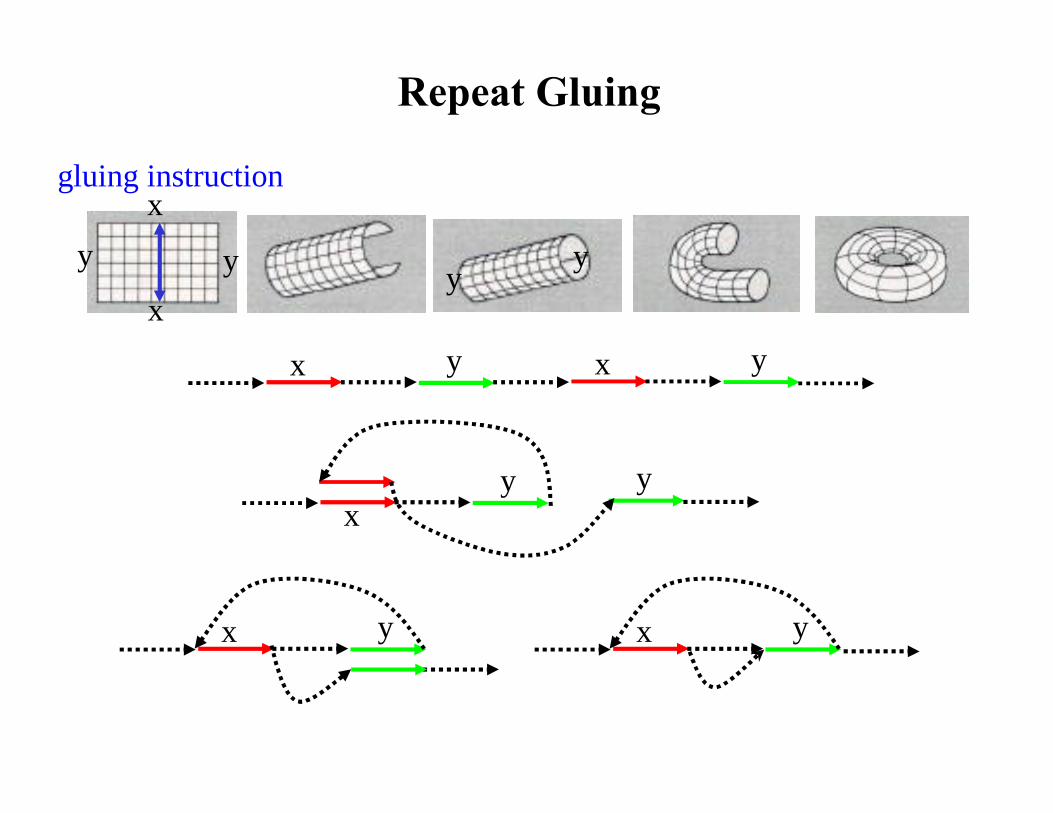
Repeat Gluing
y y
x
xy
y
x y x y
x y
xy y
x y
Repeat Gluing
y y
x
xy
y
x y x y
x y
xy y
x y
gluing instruction

Similarity matrix
A B C D E F G H I JC B C D F GC

A B C D E F G H I JC B C D F GC
CA B
FG
D
I
E
HJ
Sub-repeats:edges in the
repeatgraph
2 copies
2 copies
2 copies
2 copies4 copiesC
FB
D G
repeat graph
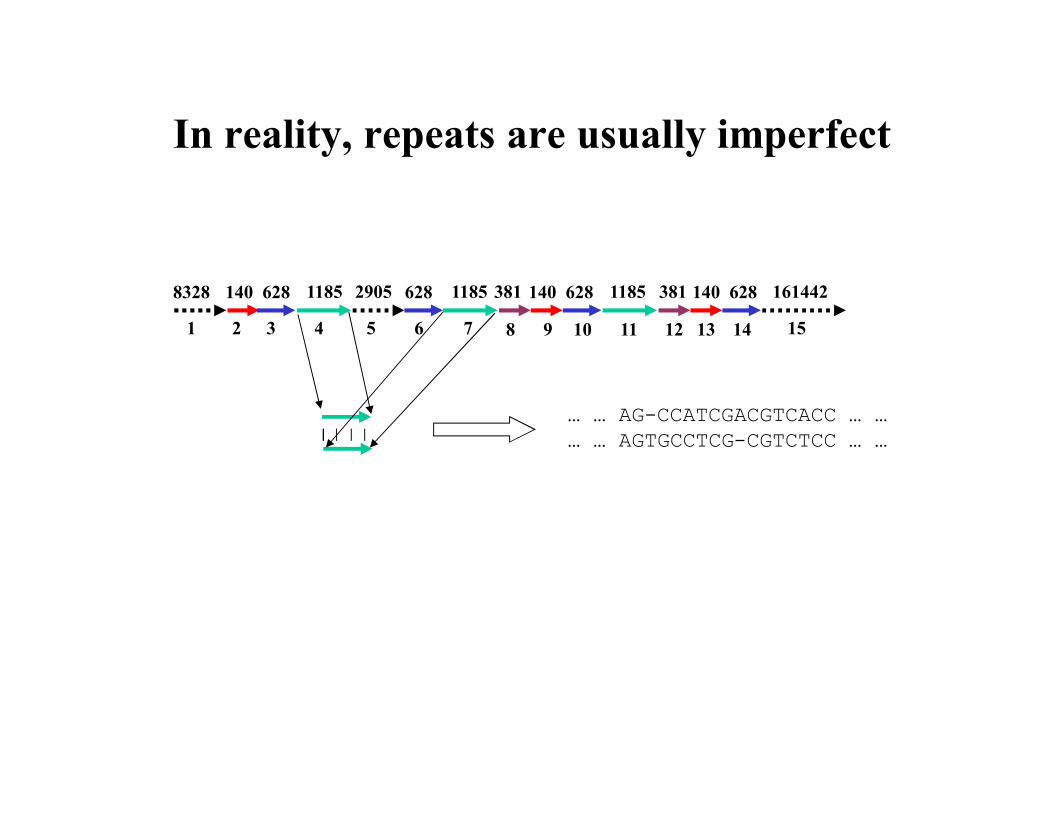
In reality, repeats are usually imperfect
8328 140 628 1185 2905 381 161442628 1185 140 628 1185 381 140 628
1 2 3 4 5 6 7 8 9 10 11 12 13 14 15
… … AG-CCATCGACGTCACC … …… … AGTGCCTCG-CGTCTCC … …

Similarity matrix
A B C D E F G H I JC B C D F GC

y y
x
x
Inconsistent Gluing
y y
x
x
Consistent Gluing

Challenge: Generalize the Notion of De Bruijn Graph for Imperfect Repeats
• Input– a genomic sequence– all significant local pairwise alignments
• Output– repeat graph representing all repeats as a
mosaic of sub-repeats

A-Bruijn Graph Construction
… acat … acgt … ccat …Genomic sequence
a c a ta c g t
c c a t
A-graph
acatacgt
1 acgtccat
2 acatccat
3
Pairwise localalignment
cA-Bruijn graph
a,c a,g t
… a c a t … a c g t … c c a t …… a c a t… a c g t… c c a t…
Similarity matrix

A-Bruijn Graph Construction: Bulges
… at … act … acat …Genomic sequence
a ta c t
a c a t
A-graph
c
A-Bruijn graph
a a t
a-tact
1 ac-tacat
2 a--tacat
3
Consistent pairwise localalignment
Similarity matrix… a t … a c t … a c a t …
… a t… a c t… a c a t…

A-Bruijn Graph Construction: Whirls
… at … act … acat …Genomic sequence
a ta c t
a c a t
A-graph
c
A-Bruijn graph
a t
a-tact
1 ac-tacat
2 --atacat
3
Inconsistent pairwise localalignment
Similarity matrix… a t … a c t … a c a t …
… a t… a c t… a c a t…

8328 140 628 1185 2905 381 161442628 1185 140 628 1185 381 140 628
1 2 3 4 5 6 7 8 9 10 11 12 13 14 15
y y
x
x
repeat graph
Repeat Graph
A-Bruijn graph
A-Bruijn graph
repeat graph
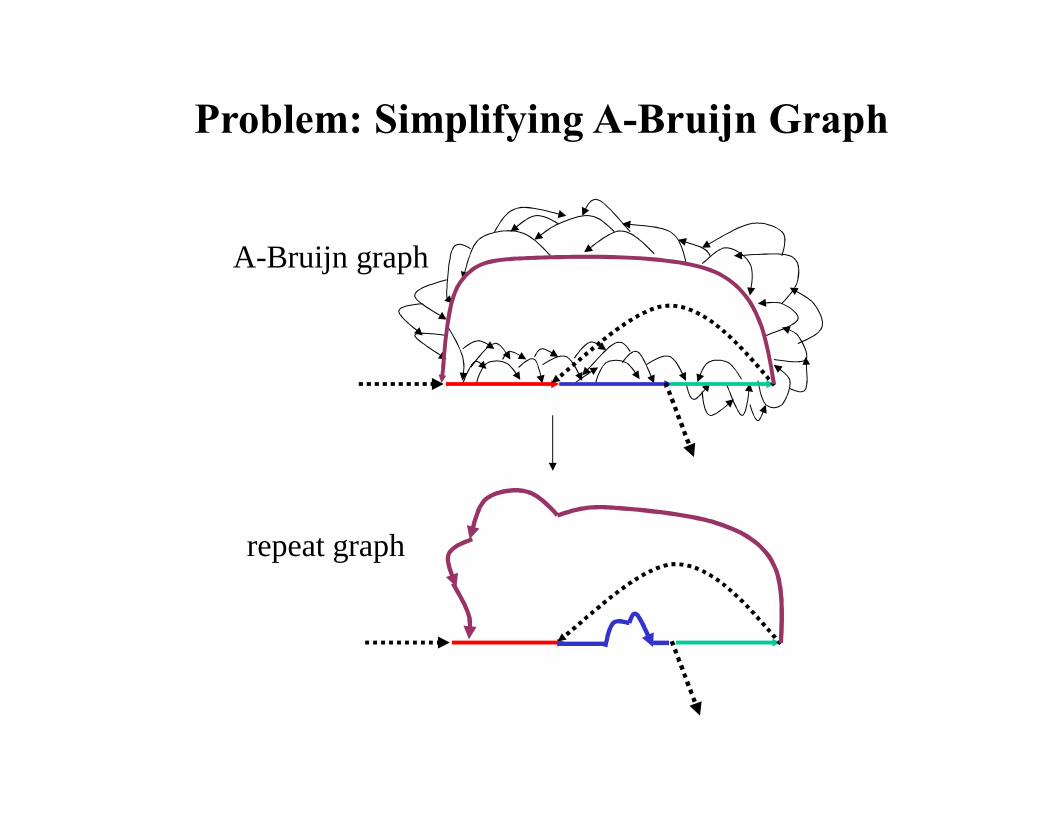
Problem: Simplifying A-Bruijn Graph
Removing Bulges and Whirls: Solving MSLG Problem
Maximum Subgraph with Large Girth (MSLG) Problem:
Input: a graph;Output: a maximum weight subgraph that does not contain short cycles, i. e. cycles of length less than a parameter girth.
Solution known only when the girth is infinite -- Maximum Spanning Tree Problem (maximum weight acyclic subgraph).
NP-hard problem (Skiena, 2002).

Minimum (or Maximum) Spanning Trees
• The first algorithm for finding a MST was developed by Boruvka in 1926 to minimize the cost of electrical coverage in Bohemia.
• The MST Problem– Connect all of the cities using the
least amount of wire possible

Solution: Maximum Spanning Tree Approximation to MSLG Problem
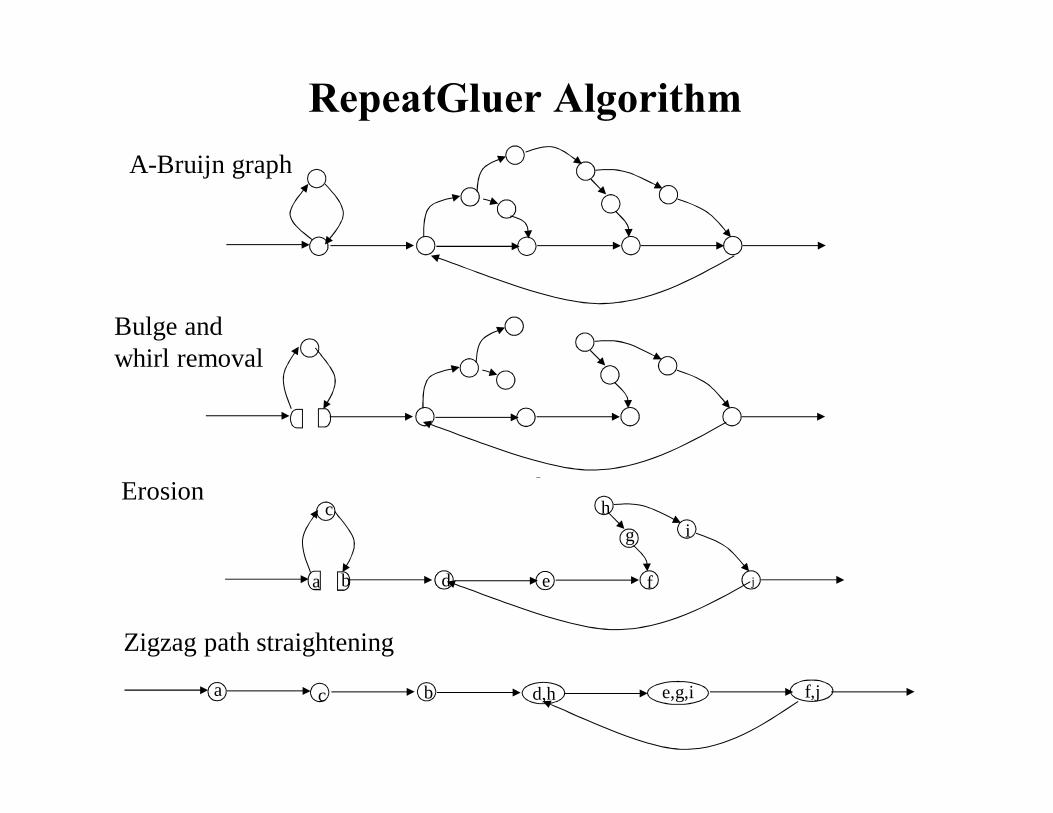
RepeatGluer AlgorithmA-Bruijn graph
Bulge andwhirl removal
a c b d,h e,g,i f,j
Zigzag path straightening
a b
c
d e f
gh
i
j
Erosion

IS30 repeat family
Repeats in Bacterial Genome: IS30 repeat family in N. meningitidis
Edge label: 130(2) means length 130bp and multiplicity 2

The Repeats Graph of N. meningitidis
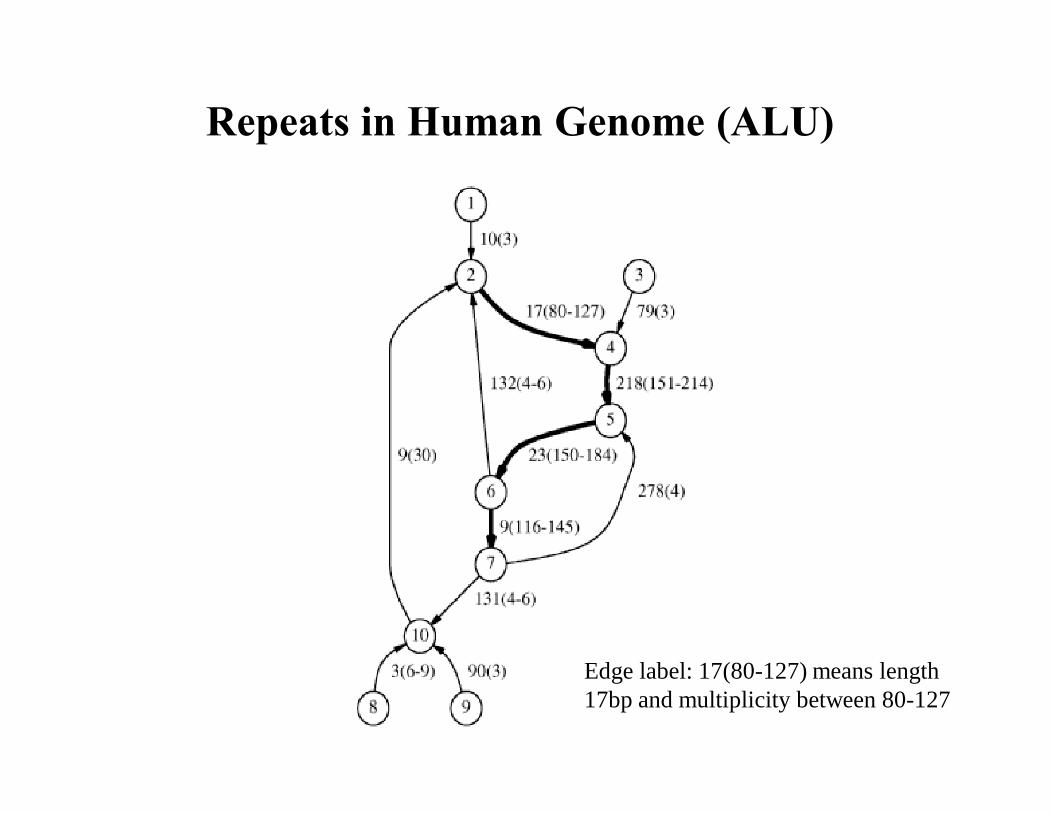
Repeats in Human Genome (ALU)
Edge label: 17(80-127) means length 17bp and multiplicity between 80-127

Multiple Alignment = Finding Repeats in a Concatenate of all Sequences
Raphael et al., 2004 (Genome Research)

Fragment Assembly in Genome Sequencing
• Genomes are very long (human genome has 3 billions base-pairs)• Current technology can only reliably “read” a short DNA fragment
(read, typically 500 – 1000 base pairs)• Whole genome shotgun sequencing: break genome into millions of
overlapping pieces (read) and sequence each read• Fragment Assembly: assembly of the genome from millions of
overlapping reads• Celera Genomics has assembled human genome (2001)• Over 100 large genomes are waiting for assembly• Current assembly programs may make mis-assembly
– Recent mammalian genome assembly, e.g. mouse, rat, etc, are estimated to have thousands of mis-assemblies
• Repeats in the genomic sequence are the main cause of mis-assembly

Fragment Assembly Using Repeat Graph
Reads
GenomeA B C D E F G H I JC B C D F GC
A B C D I F G H E JC B C D F GC
CA B
FG
D
I
E
HJ
repeat graph
Every possible genome reconstruction corresponds to an Eulerian path in the repeat graph.
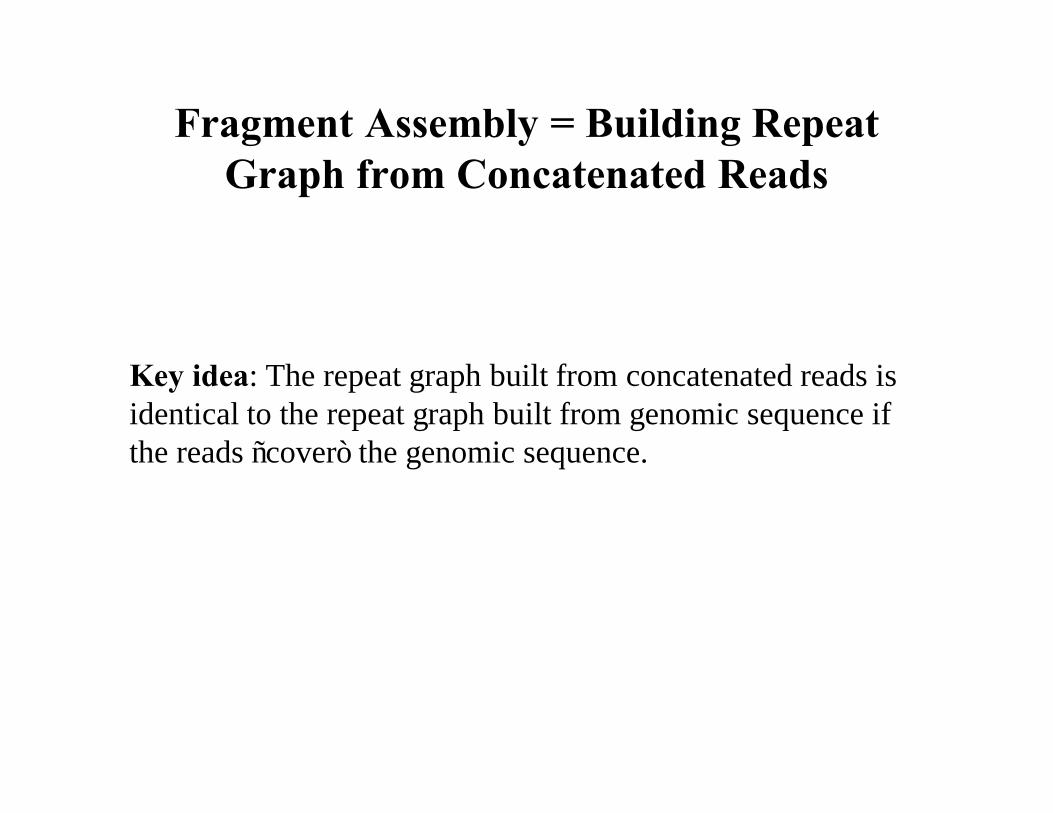
Fragment Assembly = Building Repeat Graph from Concatenated Reads
Key idea: The repeat graph built from concatenated reads is identical to the repeat graph built from genomic sequence if the reads “cover” the genomic sequence.

Similarity matrix
… 1 0 … 1 0 0 … 0 0 1 0 …… … … … … … … … … … … … …… 0 1 … 0 0 1 … 0 0 0 1 …… … … … … … … … … … … … …… 0 0 … 0 1 0 … 0 1 0 0 …… 1 0 … 1 0 0 … 1 0 0 0 …… 0 1 … 0 0 1 … 0 0 0 1 …… … … … … … … … … … … … …… 1 0 … 1 0 0 … 1 0 0 0 …… 0 0 … 0 0 0 … 0 0 1 0 …… 0 0 … 0 1 0 … 0 1 0 0 …… 0 1 … 0 0 1 … 0 0 0 1 …… … … … … … … … … … … … …
Fragment Assembly: Building Repeat Graph from Reads
ab
ca
b
c

Fragment Assembly: Building Repeat Graph from Reads
x yrepeat graph
ab
c
Snapshots of similarity matrixa
b
c

FragmentGluer Algorithm (outline)
• Concatenate reads (in an arbitrary order!) into a single sequence
• Compute the similarity matrix for this concatenated sequence (overlap detection between reads)
• Use this matrix as a “glue” to build the repeat graph with the RepeatGluer algorithm

FragmentGluer algorithm
• Identify and remove chimeric read;• Concatenate the remaining reads into a sequence and compose
similarity matrix A from the pairwise alignments of reads;• Construct the A-Bruijn graph from the similarity matrix A;• Remove bulges and whirls;• Thread each read through the resulting graph and form the consensus
sequence from reads;• Define the coverage of a vertex in the graph as the number of reads
that are threaded through this vertex;• Define coverage of simple paths as average coverage of their vertices;
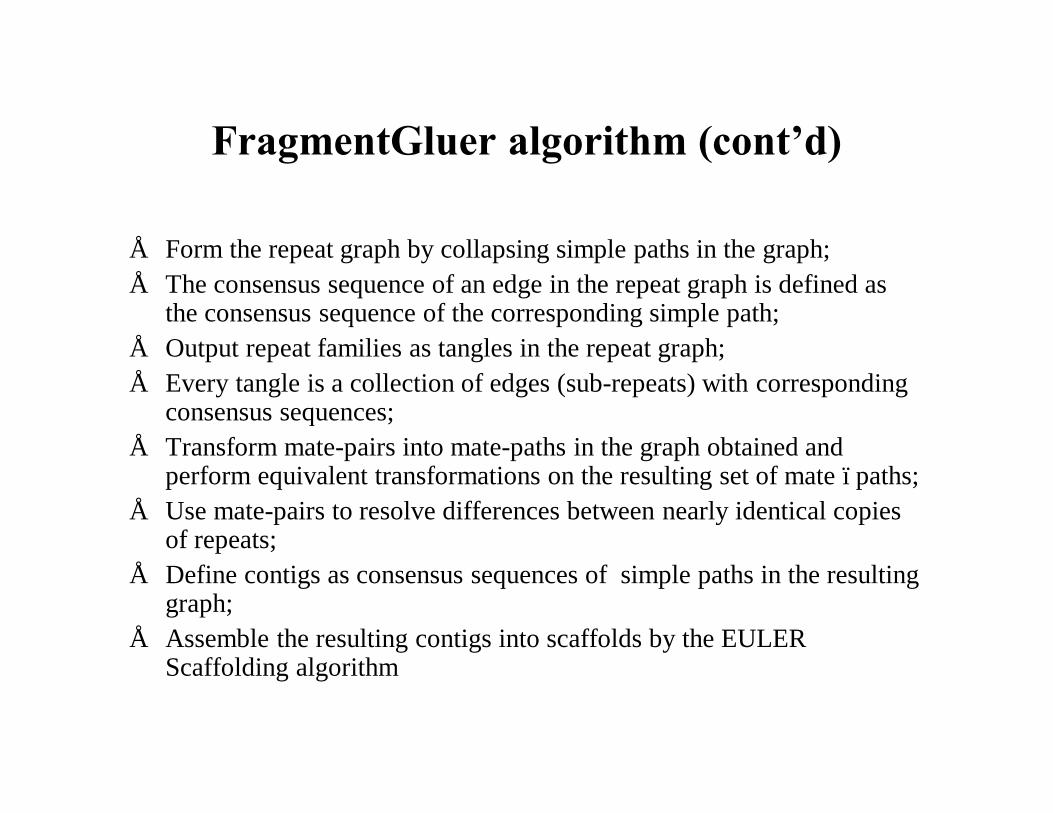
FragmentGluer algorithm (cont’d)
• Form the repeat graph by collapsing simple paths in the graph;• The consensus sequence of an edge in the repeat graph is defined as
the consensus sequence of the corresponding simple path;• Output repeat families as tangles in the repeat graph;• Every tangle is a collection of edges (sub-repeats) with corresponding
consensus sequences;• Transform mate-pairs into mate-paths in the graph obtained and
perform equivalent transformations on the resulting set of mate –paths;• Use mate-pairs to resolve differences between nearly identical copies
of repeats;• Define contigs as consensus sequences of simple paths in the resulting
graph;• Assemble the resulting contigs into scaffolds by the EULER
Scaffolding algorithm

Benchmarking EULER+, Phrap and Arachne on all BACs from Human Chromosome 20
•EULER+ produced the least number of misassembled contigsMisassembled contigs by Phrap: 37Misassembled contigs by ARACHNE: 17Misassembled contigs by EULER+: 7
•EULER+ also had the least number of collapsed repeat copies (4), ahead of Phrap (5) and Arachne (9).
•Average number of contigs per BAC was the least for EULER+ (6.2) followed by Phrap (6.8) and ARACHNE (13.8).
Pevzner et al., 2004 (Genome Research)

Comparison of Euler and Newbler Assemblies
Genome Assembler No. contigs N50 Misassembled Coverage Net size
E. coli Euler 199 46887 3 94.7 4277
Newbler 141 60757 0 99.1 4531
Repeat graph 94 125693 - 92.1 4560
S. pneumoniae Euler 127 32619 1 96.8 2001
Newbler 253 11905 0 95.0 2000
Repeat graph 136 36004 - 97.5 2091

Comparison of Euler and Newbler Assemblies(without flowgrams)
Genome Assembler No. contigs N50 Misassembled Coverage Net size
E. coli Euler 199 46887 3 94.7 4277
Newbler 311 28475 0 99.1 4531
Repeat graph 94 125693 - 92.1 4560
S. pneumoniae Euler 127 32619 1 96.8 2001
Newbler 253 11905 0 95.0 2000
Repeat graph 136 36004 - 97.5 2091
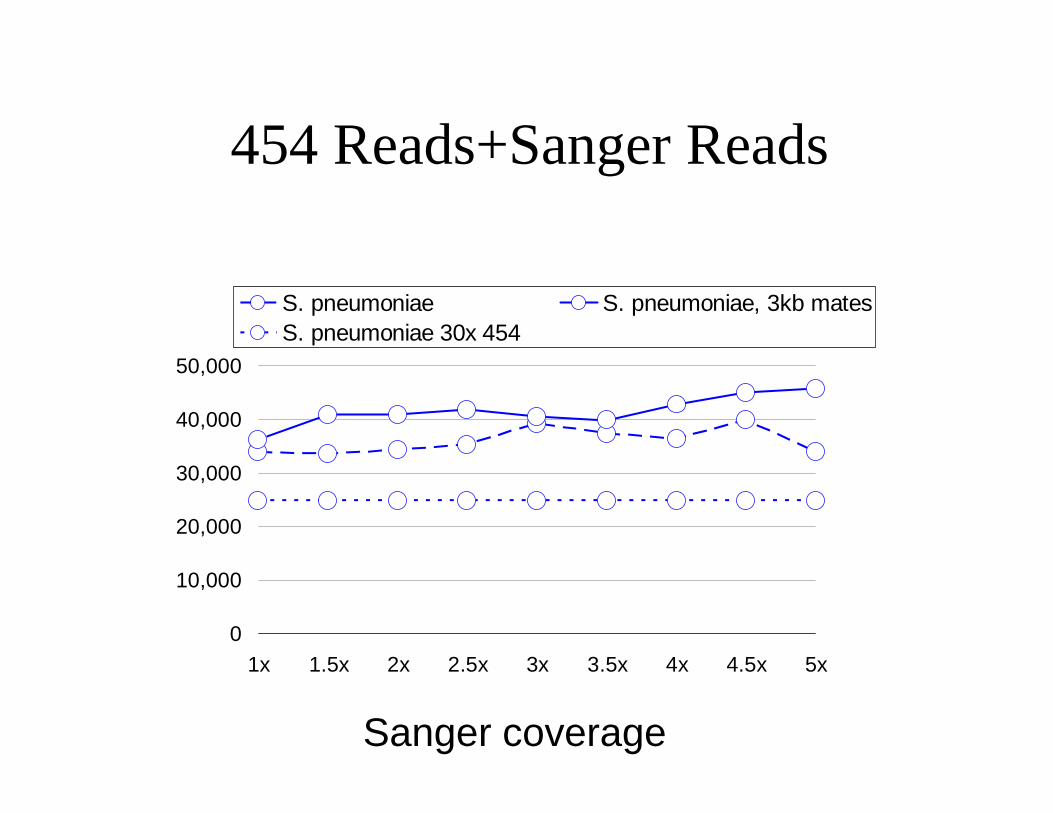
454 Reads+Sanger Reads
0
10,000
20,000
30,000
40,000
50,000
1x 1.5x 2x 2.5x 3x 3.5x 4x 4.5x 5x
S. pneumoniae S. pneumoniae, 3kb matesS. pneumoniae 30x 454
Sanger coverage

Acknowledgements
• Evan Eichler, Genome Sciences, University of Washington

A B C D E F G H I JC B C D F GC
CA B
FG
D
I
E
HJ
Sub-repeats:tangle edges
2 copies
2 copies
2 copies
2 copies4 copiesC
FB
D G
repeat graph

8328 140 628 1185 2905 381 161442628 1185 140 628 1185 381 140 628
1 2 3 4 5 6 7 8 9 10 11 12 13 14 15
1 2 3 4
56 7
9
8
10
1411
12
15
141 2,9,13 3,6,10,14 4,7,11
5
8,12
15 1614428328 140 628 1185
2905
381
repeat graph
Sub-repeats:tangle edges
3 copies
3 copies
2 copies
4 copies

Mosaic repeats structure: an imaginary example
A B C D E F G H I J
A B C D E F G H I JC
A B C D E F G H I JC B C D
A B C D E F G H I JC B C D F GC
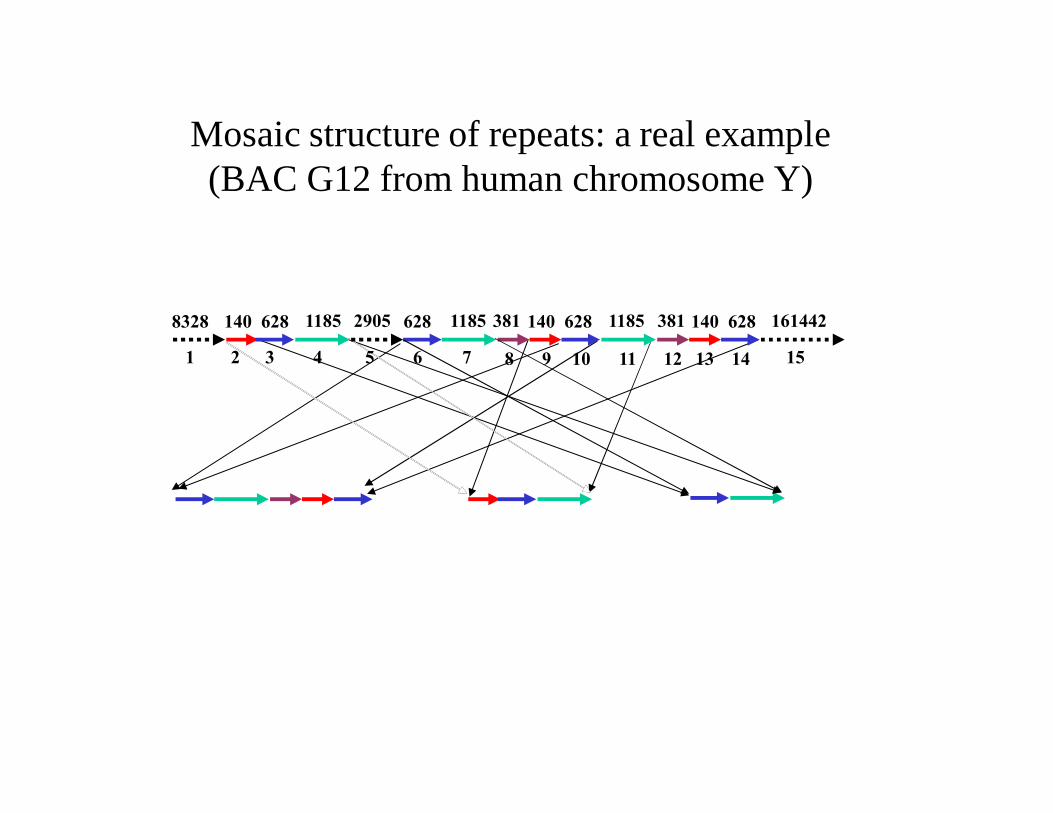
Mosaic structure of repeats: a real example(BAC G12 from human chromosome Y)
8328 140 628 1185 2905 381 161442628 1185 140 628 1185 381 140 628
1 2 3 4 5 6 7 8 9 10 11 12 13 14 15

Mosaic structure of repeats
A B C D E F G H I JC B C D F GC
Consensus repeat elements
Repeat boundary problem(Bao & Eddy, 2002)
Mosaic representation 2 copies
2 copies
2 copies
2 copies4 copies
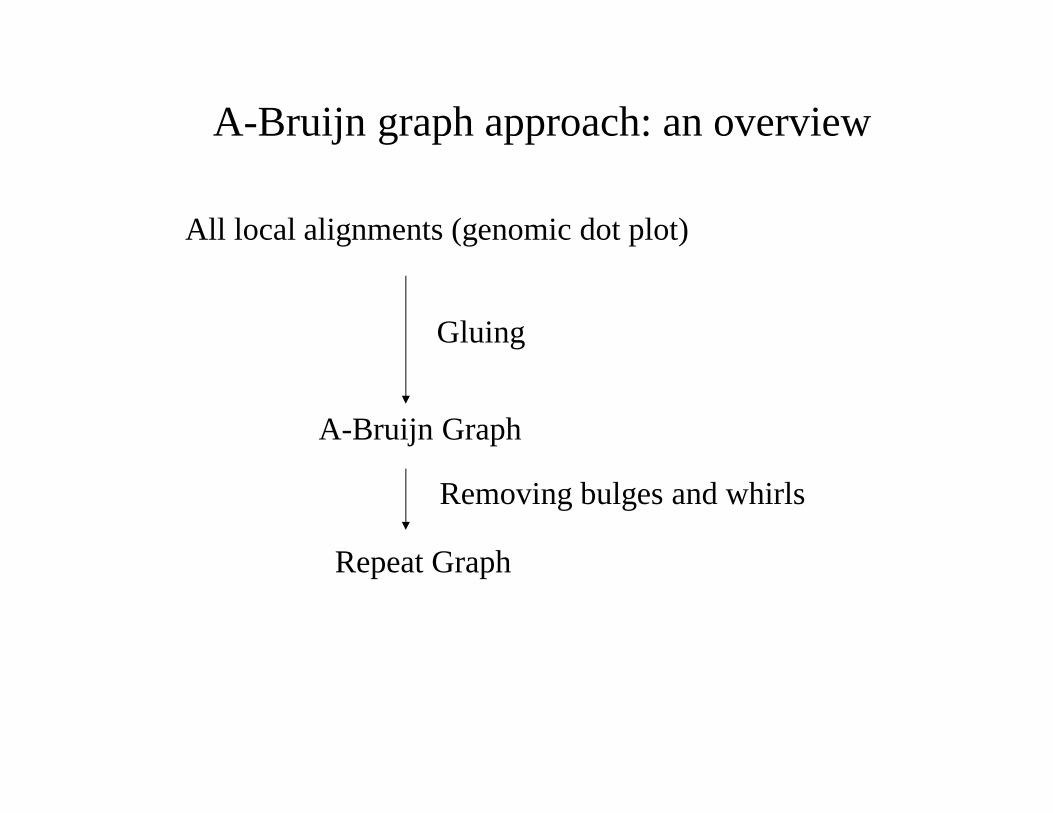
A-Bruijn graph approach: an overview
All local alignments (genomic dot plot)
A-Bruijn Graph
Repeat Graph
Removing bulges and whirls
Gluing

Bacterial genomes assembly
All 5 bacterial genomes were mis-assembled by Phrap (either repeat collapsing or joining non-contiguous regions or both). ARACHNE and EULER+ make no assembly errors except for one genome.