

De Impactvolle Data Analist
42
De impactvolle Data Analist Kevin Anderson Timothy Dieduksman 12 oktober 2016
-
Upload
kevin-anderson -
Category
Data & Analytics
-
view
374 -
download
0
Transcript of De Impactvolle Data Analist

De impactvolle Data Analist
Kevin Anderson
Timothy Dieduksman 12 oktober 2016

2
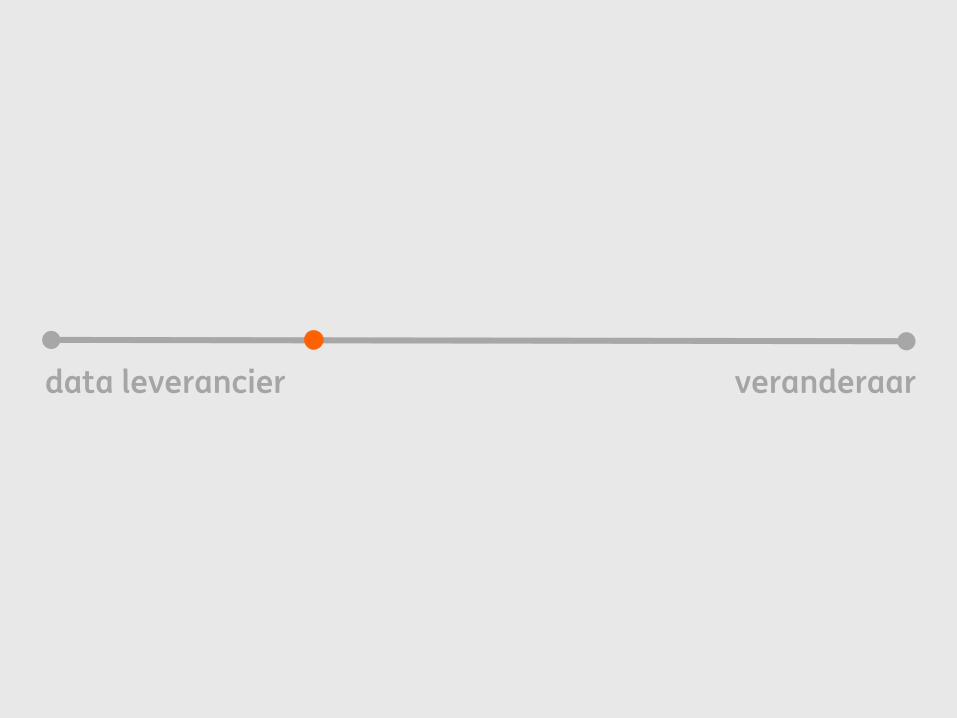
data leverancier veranderaar

3
Kevin AndersonChapter Lead Data Analyse
Timothy DieduksmanData Analist

Explosie van touchpoints
4

Purpose
5
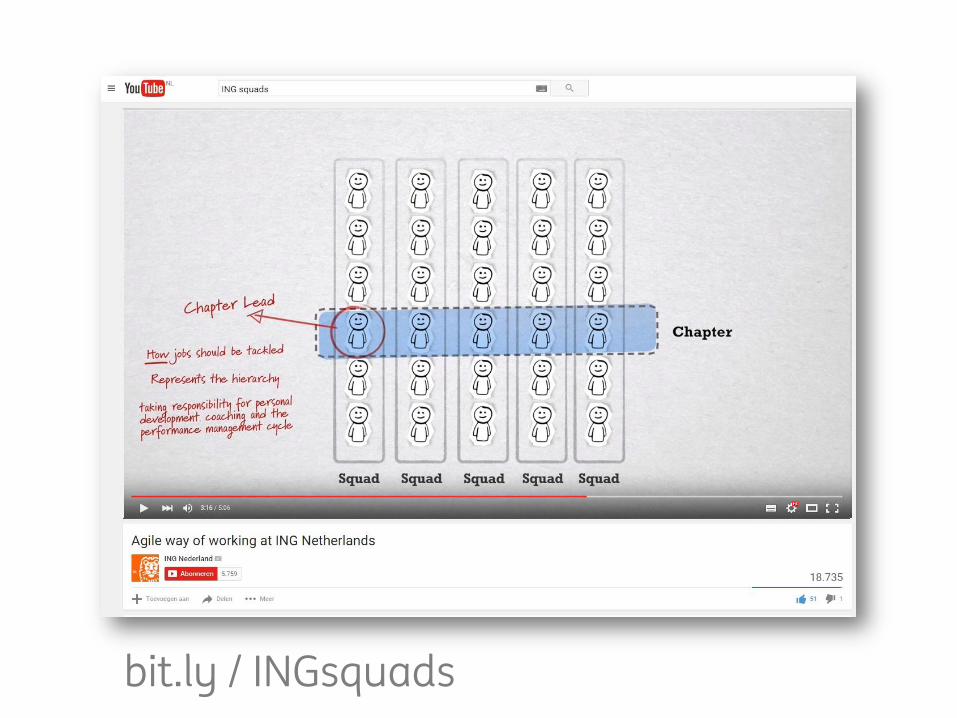
bit.ly / INGsquads

oneAnalyticsLet the data speak
1:1 personal and relevant for every
customer
Future Insights
Data driven decisions

DoAnalytics: verander de mindset

1. Governance
2. Objectives
3. Team & Expertise
4. Process & Methodology
5. Tools & Technology
Data Driven Decision Making Maturity Scan

(A/B testing)
(Digital Analytics)
(Tagmanagement)
(Dashboarding)
(SQL querying)
(models)
(1:1 communication)Versimpelen toolkit

Versimpelen & documenteren werkprocessen

Omnichannel
Hypotheken
Dagelijkse Bankzaken
Zakelijk
Kredietverlening
Betalen
Advies
55 Data Analisten
13
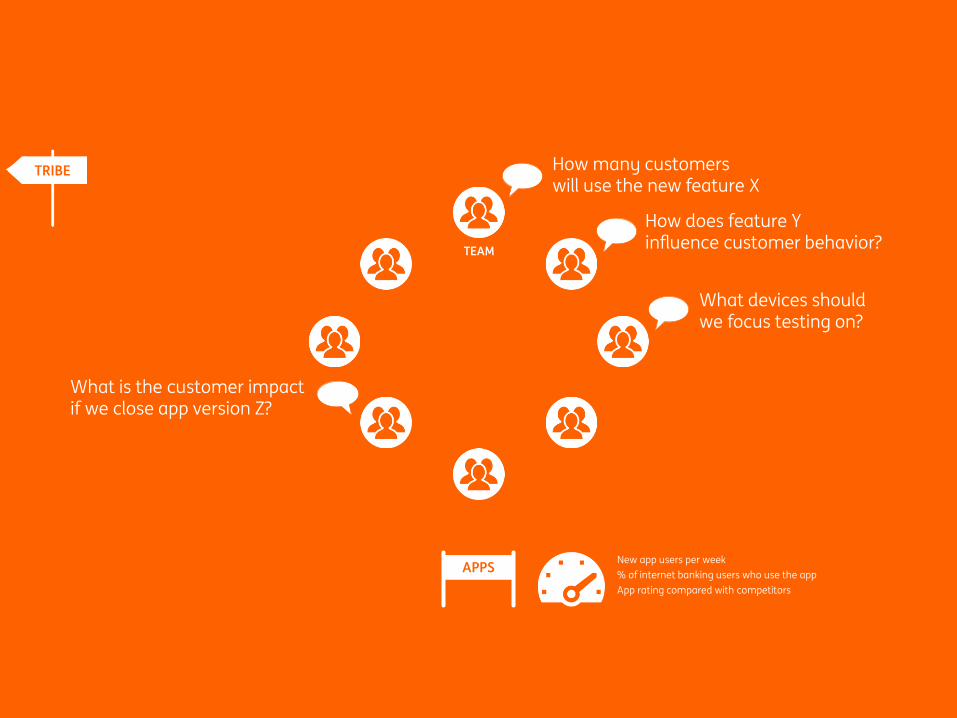
TRIBE
APPS
What devices shouldwe focus testing on?
How many customerswill use the new feature X
How does feature Y influence customer behavior?
What is the customer impact if we close app version Z?
New app users per week
% of internet banking users who use the app
App rating compared with competitors
TEAM
14
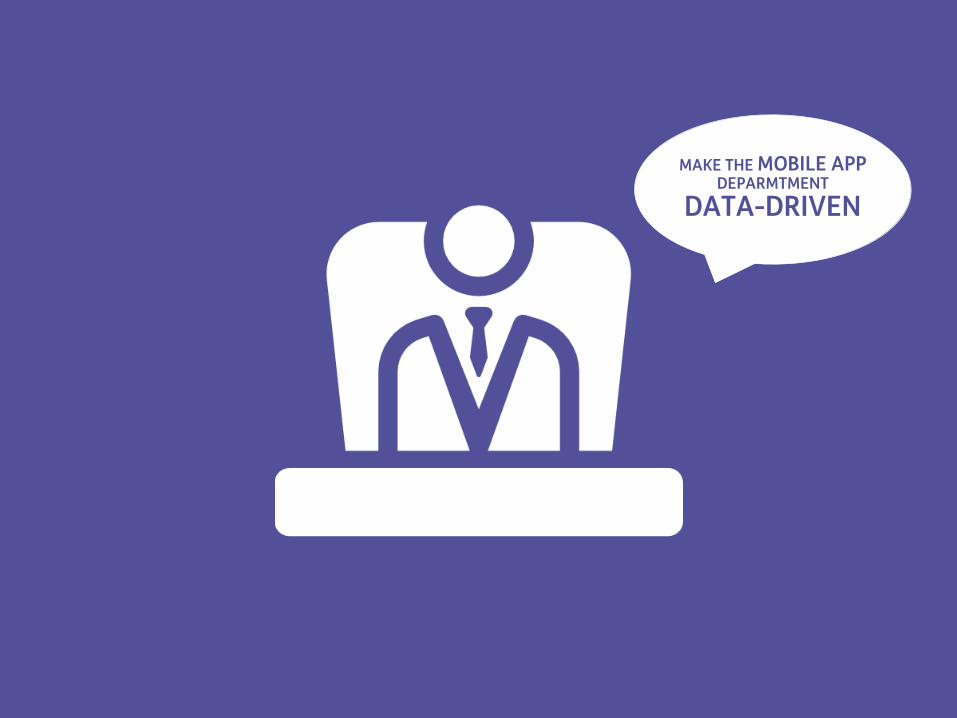
MAKE THE MOBILE APP DEPARMTMENT
DATA-DRIVEN
15
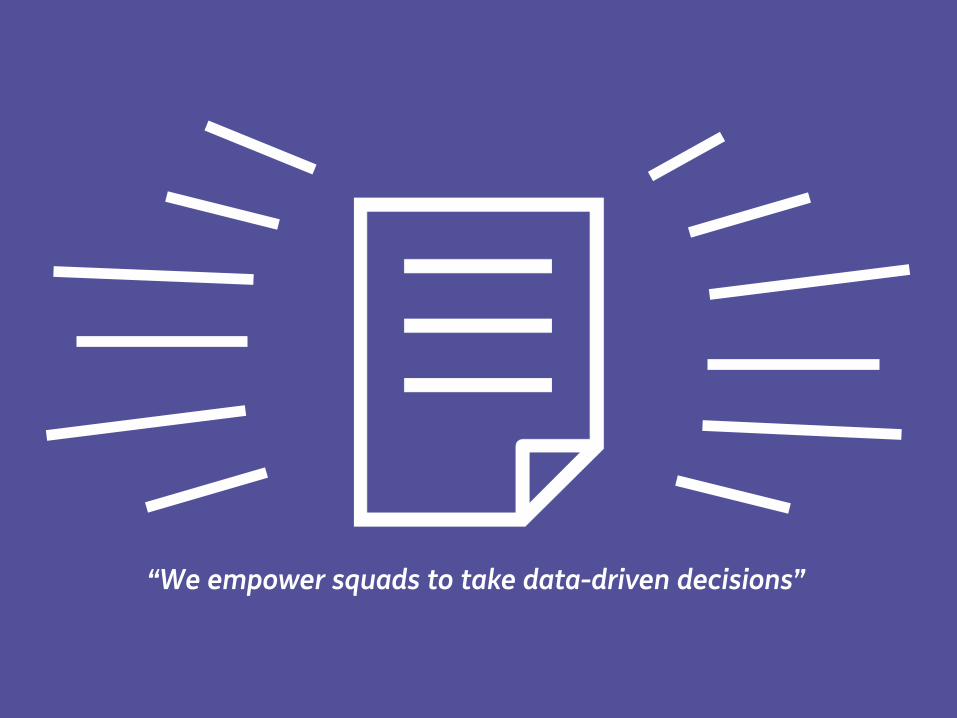
“We empower squads to take data-driven decisions”

16
DATA-DRIVEN MINDSET
ANALYSES ARE SEEN AND USED
CHALLENGES
17
6 PRACTICAL EXAMPLES
ON HOW TO SPARK
DATA-DRIVEN THINKING
18
Coffee corner
19

20
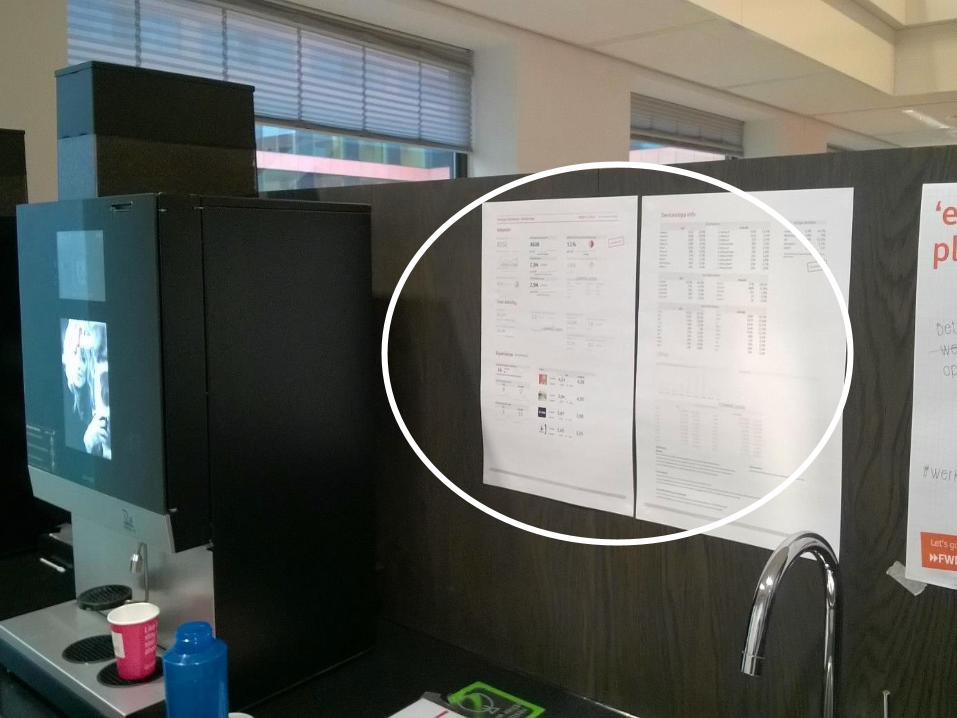
Coffee corner
Analytics update

21
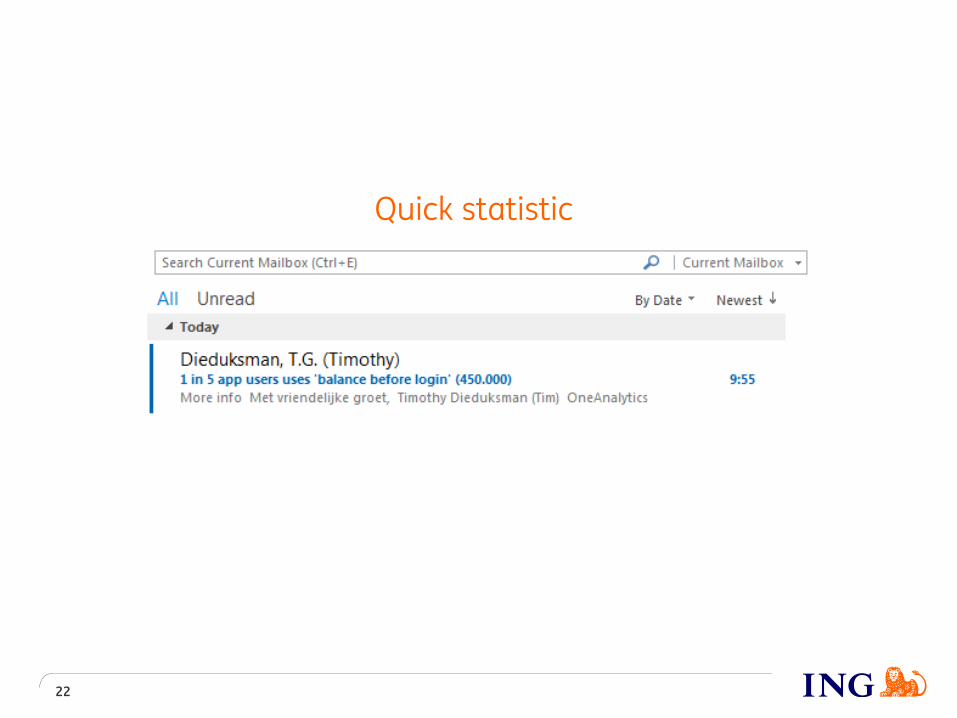
22
Quick statistic
23
Coffee corner
Inspiration session
Analytics update

24
HAVE YOU EVER WONDERED …
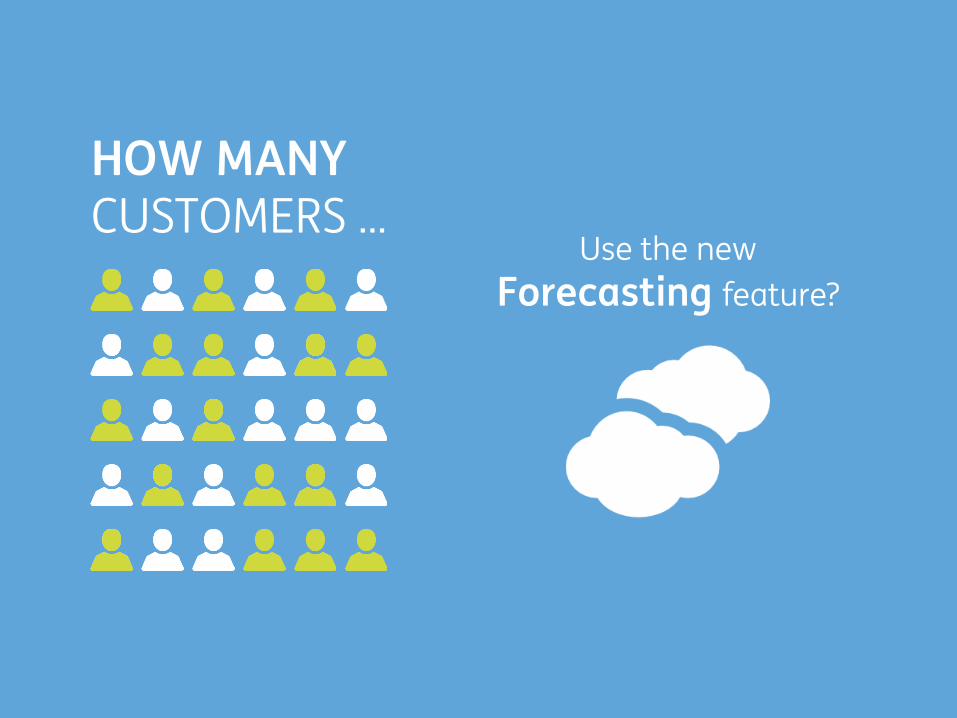
HOW MANY CUSTOMERS …
Use the new
Forecasting feature?

26
WHAT DO CUSTOMERSDO WHEN THEY… Switch CHANNELS?
27
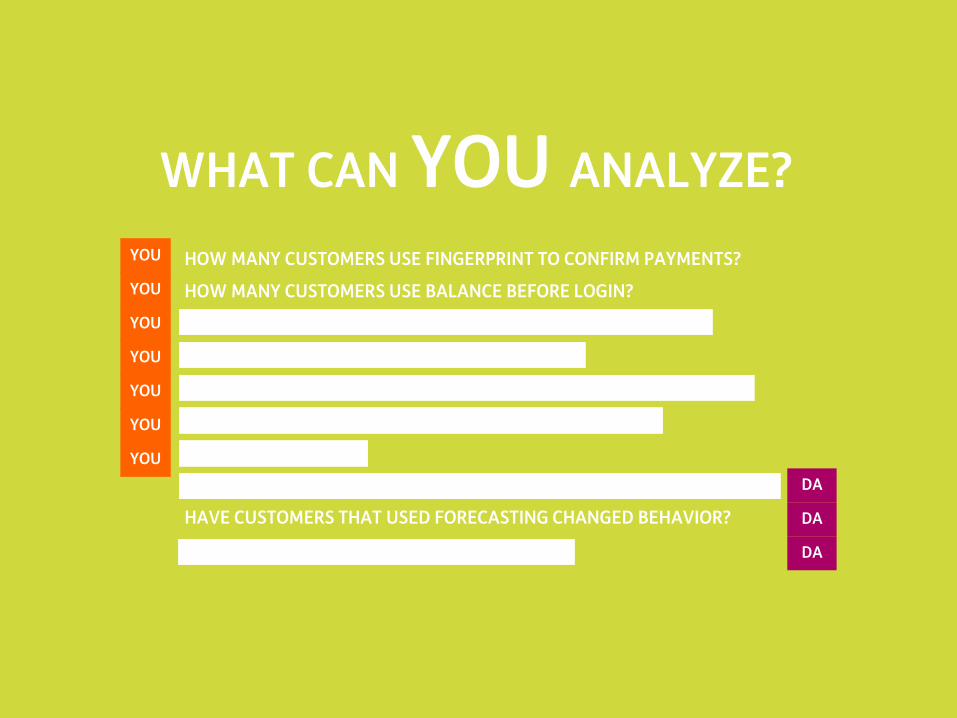
HOW MANY CUSTOMERS USE FINGERPRINT TO CONFIRM PAYMENTS?
HOW MANY CUSTOMERS USE BALANCE BEFORE LOGIN?
HOW MANY CUSTOMERS USE THE NEW FORECASTING FEATURE?
FOR WHAT DO CUSTOMERS SWITCH CHANNELS?
WHAT IS THE MAIN REASON FOR CUSTOMERS TO LOG IN TO THE APP?
HOW LONG DOES IT TAKE TO FILL IN THE TRANSFER FORM
MUCH MUCH MORE…
ARE CUSTOMERS MORE LIKELY TO STAY WITH ING BECAUSE OF THE APP?
HAVE CUSTOMERS THAT USED FORECASTING CHANGED BEHAVIOR?
WHY DO CUSTOMERS STOP USING THE ING APP
YOU
YOU
YOU
YOU
YOU
YOU
YOU
DA
DA
DA
WHAT CAN YOU ANALYZE?

28
Coffee corner
Analytics update
Inspiration session
Demo

PRESENTYOUR
ANALYSIS
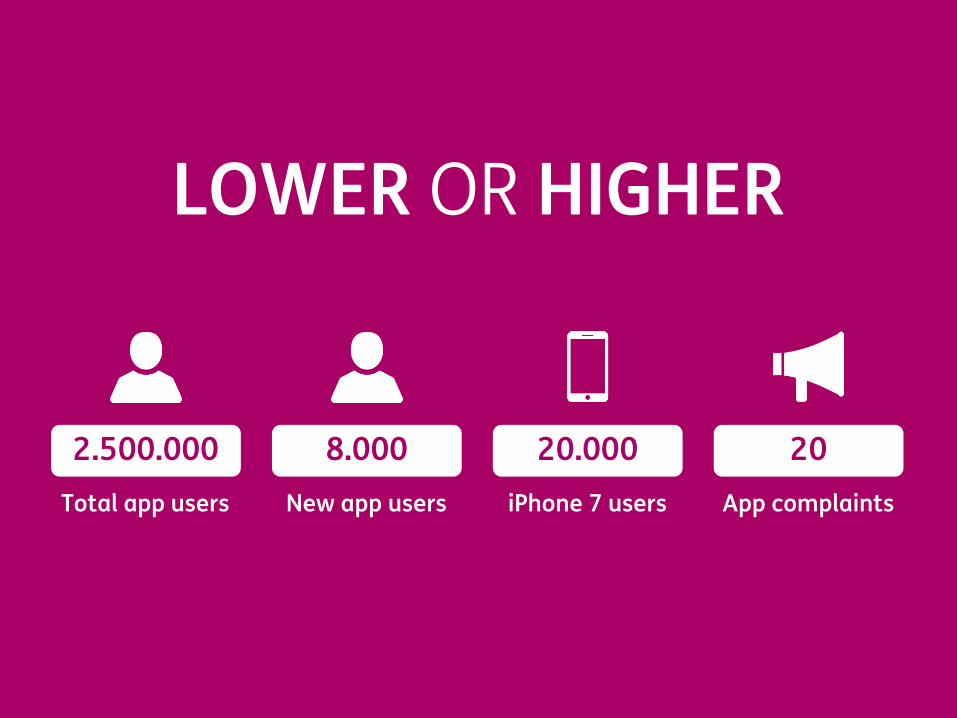
LOWER OR HIGHER
Total app users
2.500.000
New app users
8.000
App complaints
20
iPhone 7 users
20.000

31
Coffee corner
Analytics update
Inspiration session
Demo
Workshop

32

33
Coffee corner
Analytics update
Inspiration session
Demo
Workshop
Visualization
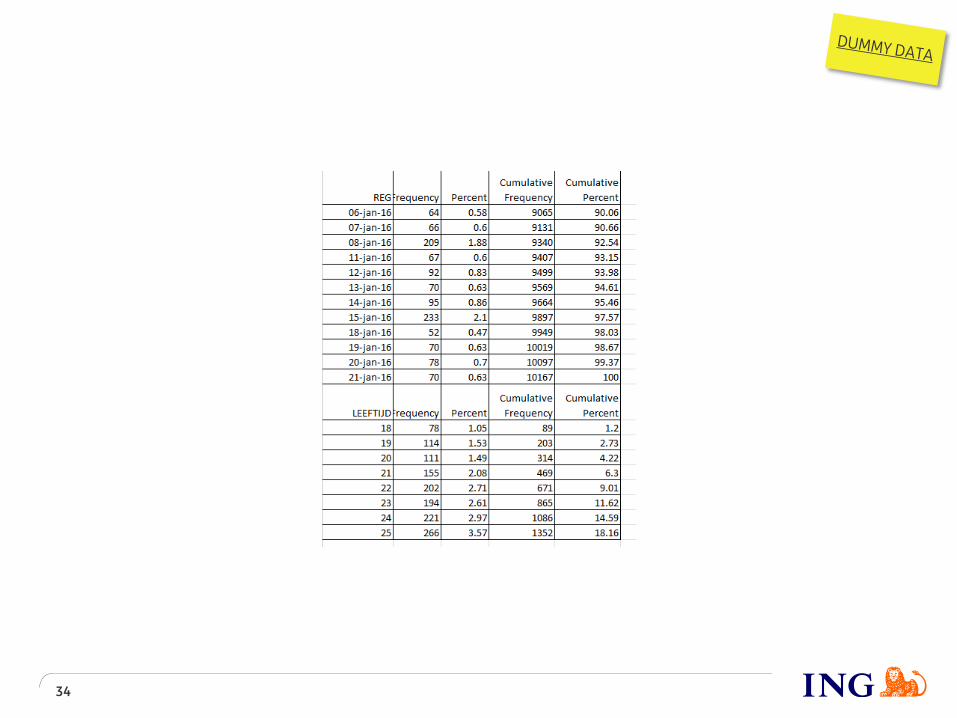
34

35
90%accept the
terms & conditions
50%tap to see
transaction details 8 MILLION
10avg. use per week
per user
10%read the Forecasting
Info page(more Android users than iOS)
1%switch Forecasting on/off
via the settings menu(twice more often turning on than off)
Analysis performed by timothy dieduksman on behalf of squad follow the money (contact: [email protected])
90%used Forecasting
on 2 different days or more
Forecasting
Used by customers
October 9th 2016
Unique customers per week(thousands)
500
300
20
862754
200
850 855 806 824

Some statistics on fingerprint and voice usage(focus on payments)
36
A FEW INSIGHTS
• Since its launch, customers have quickly adopted the use of fingerprint to confirm payments.
• On the other hand, voice is rarely used and diminishes over time (for payment confirmation).
• iOS users more quickly adopted fingerprint functionality.
• The amount of fingerprint payments will keep growing steadily as newer devices support fingerprint functionality and current users become aware of the feature.
• On a side note: the share of payments through the app compared to internet keeps increasing over time.
# FINGERPRINT PAYMENTS
FINGERPRINT PAYMENTS % OF TOTAL
# VOICE PAYMENTS
VOICE PAYMENTS % OF TOTAL
Registered voice profile 508.000
Android 258.000
iOS 250.000
# Total voice usage (incl. login) last month 39.000
# Total voice users (incl. login) last month 10.000
# Voice payments last month 6.000
# Voice users last month 5.500
VOICE USER STATISTICSFINGERPRINT USER STATISTICS
# Activated fingerprint devices - login only 217.000
# Activated fingerprint devices - login and confirm 90.000
% of Android fingerprint confirm devices activated * 33%
% of iOS fingerprint confirm devices activated * 45%
# Fingerprint payments last month 300.000
# Fingerprint payment users last month 100.000
% of total payments last month 12,5%
20 JUL. 2016
# PAYMENTS APP VS. INTERNET
contact timothy dieduksman for questions & comments (squad omnichannel experience | mobile apps | skunkworks)
82%
92%77%
86%
17% 8%
23%14%
0
50
100
150
200
250
300
350
400
2012 2013 2014 2015
mln
Total
Intern
et
0
200
400
600
800
(tsd)
Fingerprint…Customers
0
2
4
6
8
10
(%)
0
2
4
6
8
10
(%)
0
200
400
600
800
(tsd)
Fingerprint…Customers
Voice payments

38
Demo
39
data leverancier veranderaar
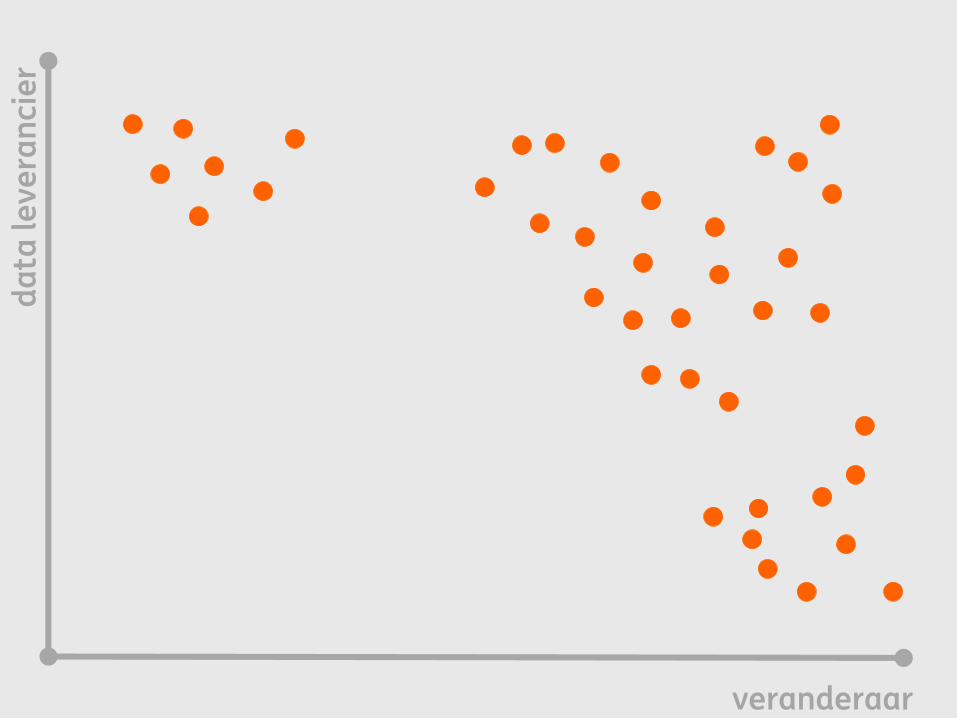
41 veranderaar
da
ta l
ev
era
nci
er
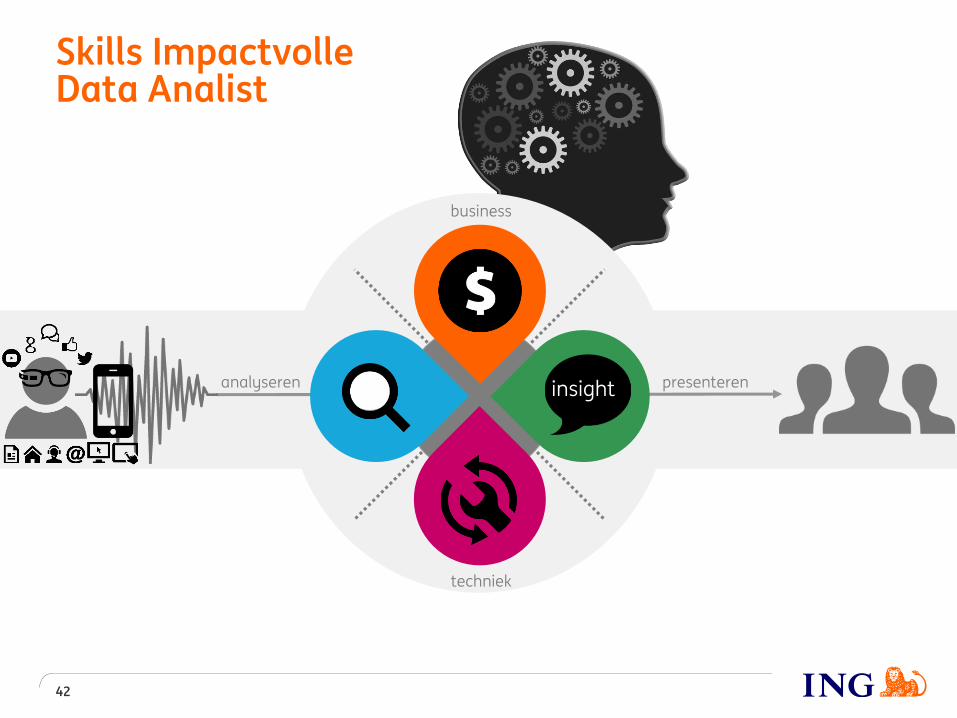
Skills ImpactvolleData Analist
42
insightanalyseren presenteren
techniek
business

We zoeken altijd goede Data Analisten.
Geïnteresseerd?
Neem contact op!