D.C. Tax Factsapp.cfo.dc.gov/services/studies/dc_taxfacts_2002.pdf · 2003-10-08 · TABLE 1 - D.C....
63
GOVERNMENT OF THE DISTRICT OF COLUMBIA OFFICE OF THE CHIEF FINANCIAL OFFICER OFFICE OF RESEARCH AND ANALYSIS D.C. Tax Facts Fiscal Years 2000, 2001 and 2002 Anthony A. Williams Mayor Natwar M. Gandhi Chief Financial Officer
Transcript of D.C. Tax Factsapp.cfo.dc.gov/services/studies/dc_taxfacts_2002.pdf · 2003-10-08 · TABLE 1 - D.C....

GOVERNMENT OF THE DISTRICT OF COLUMBIAOFFICE OF THE CHIEF FINANCIAL OFFICER
OFFICE OF RESEARCH AND ANALYSIS
D.C. Tax Facts
Fiscal Years 2000, 2001 and 2002
Anthony A. WilliamsMayor
Natwar M. GandhiChief Financial Officer

i
TABLE OF CONTENTS
SUBJECT PAGE
MESSAGE FROM THE CFO ..................................................................... iii
INTRODUCTION...................................................................................... iv
PART I -- D.C. TAX COLLECTIONS,FY 2000 AND FY 2001.............................................................................. 1FY 2002 AND FY 2003 ESTIMATES ......................................................... 2
PART II -- DISTRICT TAXESALCOHOLIC BEVERAGE TAXES ........................................................... 3CIGARETTE TAX ..................................................................................... 4INCOME TAXES
CORPORATION AND UNINCORPORATED BUSINESSFRANCHISE TAXES ..................................................................... 5INDIVIDUAL INCOME TAX ........................................................ 9
ESTATE TAXES ....................................................................................... 11INSURANCE PREMIUMS TAX ................................................................ 12MOTOR VEHICLE TAXES
MOTOR VEHICLE EXCISE TAX.................................................. 13MOTOR VEHICLE FUEL TAX...................................................... 14MOTOR VEHICLE REGISTRATION FEES ................................... 15
PROPERTY TAXESPERSONAL PROPERTY TAX....................................................... 17REAL PROPERTY TAX ................................................................ 19
PUBLIC UTILITY TAX ............................................................................. 22RECORDATION AND TRANSFER TAXES .............................................. 24SALES AND USE TAX ............................................................................. 28TOLL TELECOMMUNICATIONS TAX .................................................... 32
PART III -- SELECTED D.C. TAX STATISTICS.................................... 34
PART IV -- HISTORY OF MAJOR CHANGES IN D.C.TAX STRUCTURE, FY 1970 TO FY 2002 ............................................... 39
PART V-- FILING AND PAYMENT DATES FY 2003.......................................... 49
OFFICE LOCATIONS AND TELEPHONE NUMBERS.............................. 54

ii
STATISTICAL TABLES
SUBJECT PAGE
TABLE 1 - D.C. TAX COLLECTIONS FY 2000 AND2001 TAX COLLECTIONS ............................................................................. 1
TABLE 2 - FY 2002 TAX COLLECTIONS ANDFY 2003 REVENUE ESTIMATES ................................................................... 2
TABLE 3 - D.C. TAX COLLECTIONS........................................................... 34
TABLE 4 - 2001 D.C. INCOME TAX DISTRIBUTION................................... 35
TABLE 5 - D.C. REAL ESTATE ASSESSMENTS-TAXABLE, EXEMPT AND TOTALSTAX YEAR 2002............................................................................................ 36
TABLE 6 - DISTRICT OF COLUMBIA REAL PROPERTYTAX LEVIES AND COLLECTIONS............................................................... 37
TABLE 7 - MAJOR STATE AND LOCAL TAX BURDENS FOR A FAMILY OF FOUR RESIDING IN SELECTED WASHINGTONMETROPOLITAN AREA JURISDICTIONS, 2002 .......................................... 38
TABLE 8 - DISTRICT OF COLUMBIA RETURNSFILED BY TAX TYPE 2002............................................................................ 53

iii
MESSAGE FROM THE CFO
The District of Columbia is a single unit of government that provides the same servicestypically provided in aggregate by multiple local levels of government in the states. Typical local-level revenue sources used by the District include the property tax, personal property tax, deedtransfer and recordation taxes, traffic fines, and a variety of other taxes and fees. D.C. also usesrevenue sources usually associated with state governments, including the individual income tax,general sales and use tax, motor vehicle license fees, business net income taxes, and variousexcise taxes. Currently, the District levies 17 taxes and collects revenue from about 1,800 feeseach year. With over $3.4 billion generated by D.C. taxes and non-tax revenues, our taxpayersare an important investor in this city.
The District’s principal local revenue producers are the individual income tax, property taxes,sales tax, and gross receipts taxes. Individual income tax is the largest source of tax revenue forthe District, providing 27.8 percent of the total local source General Fund revenues for fiscal year2002. Because the individual income tax is progressive, the rate of increase for income taxrevenues is greater than the rate of increase in income subject to the tax. Personal income taxcredits include taxes paid to another state, child or dependent care, and the earned income-taxcredit.
The real property tax is the second largest source of tax receipts for the District government,accounting for 21.2 percent of its total local source General Fund revenues in fiscal year 2002. Several property tax relief options are available to eligible property owners. The most widelyused is the Homestead Deduction Program. For owner-occupied residences of five units or less,the homestead program provides a $30,000 deduction from the assessed value. Other propertytax relief measures include the Senior Citizen Homestead Tax Relief Program, which allowscertain senior citizens a 50 percent reduction in property taxes and a 25 percent cap on annualgrowth of real property tax liability for homeowners.
The District’s third largest revenue producer, the sales and use tax, is based on taxable sales inthe District, which include most retail items, construction materials, and utilities used by businessentities. Construction materials, groceries, non-prescription drugs, and dry cleaning and laundryservices are exempt from sales and use tax collections. This tax provided 17.9 percent of theDistrict’s fiscal year 2002 local revenue.
Although the District has features of a complete state/local revenue structure, it does not havethe mix of economic activity of a typical state or city revenue base. Business and industry, whichenhance the tax bases of most major cities and states, are largely lacking in the District. Theextensive suburban “ring” found near cities in other states also is missing in D.C.
This publication details the various taxes used by the District, in order to enhance citizens’awareness of their tax responsibilities.
Natwar M. GandhiChief Financial Officer
Government of the District of Columbia

iv
INTRODUCTION
Each year the Office of Research and Analysis in the Office of the Chief Financial Officerreceives numerous requests from citizens, legislators and the general public for statistics relatingto District tax collections, tax burdens and tax rates.
D.C. TAX FACTS presents a brief summary of the District's tax structure, tax rates, legalreferences and other comparative tax data. Tax rates used in this publication are those in effect asof January 1, 2003. More detailed information on these subjects may be obtained throughrequesting other publications of this office, including: (1) A Comparison of Tax Rates andBurdens in the Washington Metropolitan Area, and (2) Tax Rates and Tax Burdens in theDistrict of Columbia: A Nationwide Comparison. These publications are available on the Internetat www.cfo.dc.gov.
Questions or requests for copies of publications should be directed to: Office of the ChiefFinancial Officer, Office of Research and Analysis, 441 4th Street, NW, Suite 400 South,Washington, DC 20001. Telephone (202) 727-7775.
Julia Friedman, Ph.D.Deputy Chief Financial OfficerOffice of Research and Analysis

PART I – D.C. TAX COLLECTIONS, FY 2000, FY 2001,FY 2002, and FY 2003 (estimated)

1
TABLE 1
GENERAL FUNDD.C. TAX COLLECTIONS
FISCAL YEAR 2000 and 2001 TAX COLLECTIONS
(In Thousands of Dollars on Accrual Basis)
FY 2000 FY 2001Tax Collections CollectionsIndividual Income $1,077,346 $1,098,188Corporation Franchise 190,594 233,237Unincorporated Business Franchise 70,624 68,812
Sales and Use 640,212 617,217Alcoholic Beverages 4,779 4,743Cigarette 17,177 16,329Hotel Occupancy 0 25Motor Vehicle Excise 36,693 38,825
Real Property 610,896 633,172Public Space Rental 11,752 10,107Personal Property 70,133 64,144
Public Utility 132,849 149,125Toll Telecommunications Tax 48,280 51,259Insurance Premiums 30,882 33,356
Deed Recordation 60,418 75,936Deed Transfer 44,660 62,086Economic Interest Transfer 540 1,640Estate 35,992 1,072
Total, Tax Revenue $3,083,827 $3,209,273
Non-Tax Revenue 252,434 153.589
Other Sources /1 69,450 84,000
TOTAL, GENERAL FUNDLOCAL SOURCE REVENUE $3,405,711 $3,446,862
/1 Legalized gambling transfers

2
TABLE 2GENERAL FUND
FY 2002 TAX COLLECTIONSFY 2003 TAX REVENUE ESTIMATES
(In Thousands of Dollars on Accrual Basis)
FY 2002 FY 2003Tax Collections Estimates**Individual Income $ 949,175 $ 924,206Corporation Franchise 142,647 137,065Unincorporated Business Franchise 68,602 63,892
Sales and Use * 612,354 703,022Alcoholic Beverages 4,721 4,502Cigarette 17,189 22,863Motor Vehicle Excise 34,573 33,273
Real Property 726,014 818,936Public Space Rental 12,167 12,865Personal Property 65,208 65,271
Public Utility 140,931 151,754Toll Telecommunications Tax 55,353 64,958Insurance Premiums 35,502 34,000
Deed Recordation 89,951 93,495Deed Transfer 5,078 707Estate 125,889 39,808
Total, Tax Revenue $3,147,582 $3,241,522
Non-Tax Revenue 272,759 285,290
Other Sources 63,000 69,600
TOTAL, GENERAL FUNDLOCAL SOURCE REVENUE $3,483,341 $3,596,412
* Net of legislated transfers to the WCCA for retirement of debt.
** Estimates as of February 2003 and does not include any of the Mayor or City Councilenhancements.

3
DISTRICT TAXES
ALCOHOLIC BEVERAGE TAXES
GENERAL LIABILITY:
The tax is levied on all alcoholic beverages manufactured by a holder of a manufacturer's license andon all beverages brought into the District by the holder of a wholesaler's license.
D.C. Code Citation: Title 25, Chapter 1.
PRESENT RATES: (January 1, 2003)
Beer --$2.79 per 31 gallon barrelLight wine (14% alcohol or less) – 30¢ per gallonHeavy wine (over 14% alcohol) -- 40¢ per gallonChampagne and sparkling wine -- 45¢ per gallonSpirits -- $1.50 per gallon
REVENUE:
Fiscal Year Collections
2000 $ 4,779,0002001 $ 4,743,0002002 $ 4,721,0002003 (Est.) $ 4,502,000
COMPARATIVE DATA:
Metropolitan AreaAlcoholic Beverage Tax Facts
Item D.C. MD VA 1/Beer (per barrel) $2.79 $2.79 $7.95Spirits (per gallon) 1.50 1.50 20% of retail priceWine (per gallon) 14% or less alcohol .30 .40 .40 2/ more than 14% alcohol .40 .40 .40 2/
Sparkling wine (per gallon) 14% or less alcohol .45 .40 1.51 2/ More than 14% alcohol .45 .40 1.51 2/
1/ Sales at ABC Stores are subject to the 4.5% sales tax rate in addition to the rate below.2/ Additionally, a state tax of 4 percent of the price charged is imposed on wine sold to persons other than licenses.

4
CIGARETTE TAX
GENERAL LIABILITY:
The cigarette tax is levied on the sale or possession of all cigarettes in the District. Cigarettes soldto the military and to Congress are exempt from the tax.
D.C. Code Citation: Title 47, Chapter 24.
PRESENT RATE: (January 1, 2003)
$1.00 per package of twenty cigarettes (01/01/03 from $0.65).
REVENUE
Fiscal Year Collections
2000 $17,177,0002001 $16,329,0002002 $17,189,0002003 (Est.) $22,863,000
COMPARATIVE DATA:
Cigarette Tax Facts
State Tax Per Pack of 20
District of Columbia 1.00Maryland 1.00Virginia 1/ .025
1/ Additional local tax allowed.

5
INCOME TAXES
CORPORATION AND UNINCORPORATEDBUSINESS FRANCHISE TAXES
GENERAL LIABILITY:
The corporation franchise tax is imposed on corporations carrying on a trade, business orprofession in the District or receiving income from District sources. Effective July 1, 1981, financialinstitutions became subject to the corporation franchise tax. Prior to this date these institutions weresubject to a gross earning tax.
Whoever engages in a trade, business or profession in the District of Columbia must register. Failure to register may result in a fine of not more than $500 and a civil penalty of $50 for each andevery separate day that such failure to register continues.
The tax on unincorporated businesses is imposed on businesses with gross receipts over $12,000. A 30% salary allowance for owners and a $5,000 exemption are deductible from net income to arriveat taxable income.
No person other than a corporation shall engage in or conduct a trade, business or profession,which is excluded from the imposition of the District of Columbia tax on unincorporated businessesand whose gross income for the calendar year is expected to exceed $12,000, without first makingapplication for a trade and business license. A person who fails to obtain a trade or business licensemay be fined not more than $300 for each day that such failure continues.
Generally, persons exempt from filing an unincorporated business franchise tax return includetrade, business, or professional organizations having a gross income not in excess of $12,000 for thetaxable year, and trade, business, or professional organizations, which by law, customs, or ethicscannot be incorporated, such as doctors and lawyers.
Federal conformity is maintained pursuant to Public Law 105-100. It continues the District’slimited conformity with the Internal Revenue Code (IRC) of 1986 as amended through August 20,1996.
D.C. Code Citation: Title 47, chapter 18.
PRESENT RATES: (January 1, 2003)
The franchise tax rate is 9.975 percent of taxable income, 9.5 percent rate plus a surtax equal to5 percent of the base rate.
REVENUE:Fiscal Year Corporation Unincorporated Business
2000 $190,594,000 $ 70,624,0002001 $233,237,000 $ 68,812,0002002 $142,647,000 $ 68,602,0002003 (Est.) $137,065,000 $ 63,892,000

6
INCOME TAXES – Continued
COMPARATIVE DATA:
Corporation Income Tax Facts(January 1, 2003)
Federal Maximum Tax
State Rate Deductibility
Alabama 6.5% YesAlaska 9.4% (over $90,000) NoArizona 6.96% YesArkansas 6.5% (over $100,000) NoCalifornia 1/ 8.84% No
Colorado 4.63% NoConnecticut 2/ 7.5% NoDelaware 8.7% NoD.C. 8/ 9.975% NoFlorida 5.5% No
Georgia 6.0% NoHawaii 6.4% (over $100,000) NoIdaho 3/ 7.6% NoIllinois 7.3% NoIndiana 7.9% 4/ No
Iowa 12.0% (over $250,000) YesKansas 7.35% (over $50,000) NoKentucky 8.25% (over $250,000) NoLouisiana 8.0% (over $200,000) YesMaine 8.93% (over $250,000) No
Maryland 7.0% NoMassachusetts 5/ 9.5% NoMichigan does not levy a tax on corporate incomeMinnesota 9.8% NoMississippi 5.0% (over $10,000) No
Missouri 6.25% (over $335,000) YesMontana 6/ 6.75% NoNebraska 7.81% (over $50,000) NoNevada does not levy a tax on corporate incomeNew Hampshire 8.5% No

7
INCOME TAXES – Continued
COMPARATIVE DATA:
Corporation Income Tax Facts--Continued(January 1, 2003)
FederalMaximum Tax
State Rate Deductibility
New Jersey 2/ 9.0% (over $100,000) NoNew Mexico 7.6% (over $1,000,000) NoNew York 2/ 7.5% NoNorth Carolina 6.9% NoNorth Dakota 6.83% (over $50,000) Yes
Ohio 8.5% (over $50,000) NoOklahoma 6.0% NoOregon 7/ 6.6% NoPennsylvania 9.99% NoRhode Island 9.0% No
South Carolina 5.0% NoSouth Dakota does not levy a tax on corporate incomeTennessee 6.0% NoTexas does not levy a tax on corporate incomeUtah 8/ 5.0% No
Vermont 9/ 9.75% (over $250,000) NoVirginia 6.0% NoWashington does not levy a tax on corporate incomeWest Virginia 9.0% NoWisconsin 7.9% No
Wyoming does not levy a tax on corporate income
1/ Minimum tax $300. 2/ Minimum tax $250. 3/ Minimum tax $20. 4/ Includes supplemental net income tax rate of 4.5 percent. 5/ Single business tax. 6/ Minimum tax $50. 7/ Minimum tax $10. 8/ Minimum tax $100. 9/ Minimum tax $75.

8
INCOME TAXES – Continued
DC BUSINESS FRANCHISE TAX REVENUEADJUSTED FOR INFLATION
(IN 1996 DOLLARS)
0
50
100
150
200
250
300
84 85 86 87 88 89 90 91 92 93 94 95 96 97 98 99 00 01 02
FISCAL YEAR
($00
0,00
0)
($000,000)
DC REVENUEADJUSTED FOR
INFLATION PERCENT TO(IN 1996 TOTAL TAX
YEAR DOLLARS) COLLECTED 1984 $143.6 6.7% 1985 $156.9 7.0% 1986 $214.3 9.0% 1987 $233.5 9.1% 1988 $200.2 7.5% 1989 $196.2 7.1% 1990 $165.4 6.1% 1991 $150.5 5.6% 1992 $ 96.8 3.7% 1993 $150.3 5.9% 1994 $156.8 6.1% 1995 $164.3 6.8% 1996 $154.1 6.4% 1997 $179.1 7.4% 1998 $214.2 8.1% 1999 $206.4 7.8% 2000 $240.4 8.6% 2001 $270.8 9.4% 2002 $177.9 6.5%

9
INDIVIDUAL INCOME TAX
GENERAL LIABILITY:
The tax is imposed on every resident, defined as any individual who is domiciled in theDistrict at any time during the tax year, or who maintains an abode in the District for 183 or moredays during the year.
On June 11, 1982, D.C. Law 4-118, the District of Columbia Individual, Estates, and TrustsFederal Conformity Tax Act, which adopted the federal definition of income and made othermodifications to the D.C. income tax, became law. Provisions of this legislation are effective fortax years beginning after December 31, 1981.
Further conformity to federal provisions was made pursuant to D.C. Law 5-32, the District ofColumbia Income and Franchise Tax Conformity Act of 1983; the Conformity Act of 1984; theIncome and Franchise Tax Conformity and Revision Amendment Act of 1987.
Under current District law (DC Law 13-175) federal changes in income and deductions areadopted automatically.
The latest conformity legislation is Public Law 105-100. It maintains the District’s limitedconformity with the Internal Revenue Code (IRC) of 1986 as amended through August 20, 1996.
D.C. Code Citation: Title 47, Chapter 18.
PRESENT RATES: (January 1, 2003)
Taxable Income Tax Rate
First $10,000 5.0%
Over $10,000, but not over $ 500 + 7.5% of excess over $30,000 $10,000
Over $30,000 $ 2,000 + 9.3% of excess over$30,000
REVENUE:
Fiscal Year Net Collections
2000 $ 1,077,346,0002001 $ 1,098,188,0002002 $ 949,175,0002003 (Est.) $ 924,206,000

10
INDIVIDUAL INCOME TAX – Continued
DC INDIVIDUAL INCOME TAX REVENUEADJUSTED FOR INFLATION
( IN 1996 DOLLARS)
0
200
400
600
800
1,000
1,200
84 85 86 87 88 89 90 91 92 93 94 95 96 97 98 99 00 01 02
FISCAL YEAR
($00
0,00
0)
($000,000)
DC REVENUE ADJUSTTED FOR
INFLATION PERCENT TO (IN 1996 TOTAL TAX
YEAR DOLLARS) COLLECTED 1984 $591.9 27.6% 1985 $611.6 27.2% 1986 $630.8 26.4% 1987 $706.5 27.4% 1988 $783.2 29.3% 1989 $757.0 27.4% 1990 $754.8 28.0% 1991 $695.3 26.0% 1992 $683.0 26.0% 1993 $628.4 24.7% 1994 $679.2 26.3% 1995 $658.1 27.2% 1996 $689.4 28.7% 1997 $735.2 30.3% 1998 $832.6 31.4% 1999 $903.2 34.0% 2000 $991.5 35.6% 2001 $984.7 34.2%
2002 $836.3 30.6%

11
ESTATE TAXES
GENERAL LIABILITY:
The estate tax is imposed on the estate of every decedent of a resident who died while stilla resident of the District, and on the estate of every nonresident decedent owning propertyhaving a taxable situs in the District at the time of his or her death. Tax due is determinedby using the DC Estate Tax computation worksheet after computing the exempted amounts.
The District’s Estate Tax is no longer in conformity with the Federal Estate Tax. Exceptfor raising the filing threshold from $600,000 to $675,000 (effective January 1, 2002), theDistrict’s Inheritance and Estate Tax Act of 2002 retains all aspects of the District EstateTax, as it existed on January 1, 1986. Hence, the District Estate Tax is decoupled fromrecent and forthcoming Federal Estate Tax law changes as stipulated in the FederalEconomic Growth and Tax Relief Reconciliation Act (EGTRRA) of 2001.
An estate tax is imposed in Maryland and Virginia to absorb the maximum credit allowedunder the present federal estate tax law for taxes paid to states.
D.C. Code Citation: Title 47, Chapter 19.
REVENUES:
Fiscal Year Collections
2000 $ 35,992,0002001 $ 51,072,0002002 $125,889,0002003 (Est.) $ 39,808,000

12
INSURANCE PREMIUMS TAX
GENERAL LIABILITY:
The tax is imposed on the gross insurance premiums received on risks in the District, lesspremiums received for reinsurance assumed, returned premiums and dividends paid to policyholders. All domestic and foreign insurance companies are liable for the tax, which is in lieu of all other taxesexcept real estate taxes and fees provided for by the District's insurance law.
D.C. Code Citation: Title 35; Title 47, Chapter 26.
PRESENT: (January 1, 2003)
REVENUE:
Fiscal Year Collections
2000 $30,882,0002001 $33,356,0002002 $35,502,0002002 (Est.) $34,000,000
COMPARATIVE DATA: (as of January 1, 2003)
Type of Company/Policy DC 1/ MD VA 2/
Life insurance companies 1.70% 2.00% 2.25% 3/
Life insurance special benefits 1.70% 2.00% 2.75%Domestic mutual companies 1.70% 2.00% 1.00%Industrial sick benefit companies 1.70% 2.00% 1.00%Workmen's Companies 1.70% 2.00% 2.50%Other 1.70% 4/ 1.70% 5/ 2.25%
Legal Service Insurance Companies ---- ---- 2.25%
1/ The District levies an additional fee 0.30 percent to offset the administrative costs of regulation.2/ To offset the administrative cost of regulating each line of insurance, an additional fee up to .375 percent for providersof workmen’s compensation insurance and 0.1 percent for other insurers maybe levied.3/ 2.75 percent on premiums paid for special or additional benefits.4/ 2 percent on surplus line brokers.5/ 3 percent on unauthorized insurers. 1 percent on auto liability insurers.
.

13
MOTOR VEHICLE TAXES
MOTOR VEHICLE EXCISE TAX
GENERAL LIABILITY:
The excise tax is imposed on the issuance of every original and subsequent certificate of title onmotor vehicles and trailers. Vehicles brought into the District by new residents, who have been titledelsewhere, are exempt from the tax.
D.C. Code Citation: Title 40, Chapter 7.
PRESENT RATES: (January 1, 2003)
Based on manufacturer's shipping weight
6% of fair market value-3,499 pounds or less7% of fair market value-3,500 pounds or more
REVENUE:
Fiscal Year Collections2000 $36,693,0002000 $38,825,0002002 $34,573,0002003 (Est.) $33,273,000
COMPARATIVE DATA: (as of January 1, 2003)
Metropolitan Area Motor Vehicle Excise Tax Facts
State Rate
District of Columbia 6-7%Maryland 5%Virginia 3%

14
MOTOR VEHICLE FUEL TAX
GENERAL LIABILITY:
The tax is imposed on every importer of motor vehicle fuels, including gasoline, diesel fuel,benzol, benzene, naphtha, kerosene, heating oils, all liquefied petroleum gases and all combustiblegases and liquids suitable for the generation of power for the propulsion of motor vehicles.
Beginning on October 1, 1996, the motor vehicle fuels tax is deposited to the Highway Trust Fund,rather than to the Local General Fund.
D.C. Code Citation: Title 47, Chapter 23.
PRESENT RATES: 20¢ per gallon
REVENUE:
Fiscal Year Collections
2000 $32,650,0002001 $25,186,0002002 $27,348,0002003 (Est.) $28,960,000
COMPARATIVE DATA: (as of January 1, 2003)
Gasoline Tax Rates
State Tax Per Gallon
District of Columbia $0.20Maryland 0.235Virginia * 0.175
Note: Rates for gasoline only. Rates may vary for diesel, gasohol, or other fuels. Does not includelocal option taxes.
* Virginia also has a 2% local tax.

15
MOTOR VEHICLE REGISTRATION FEES
GENERAL LIABILITY:
Imposed on every vehicle operated over the highways of the District of Columbia by a resident. Aresident has the option of registering every two years.
D.C. Code Citation: Title 40, Chapter 1.
PRESENT RATES: (as of January 1, 2003)
Based on manufacturer's shipping weightPassenger cars 3,499 pounds or less--$72 3,500 pounds or more--$115Mopeds: $10 Motorcycles: $52 Antique vehicles: $15
Trucks and buses: Trailers:Less than 3000 pounds - $ 95 Less than 500 pounds - $ 20
3000- 3999 pounds - $105 500- 999 pounds - $ 29 4000- 4999 pounds - $123 1000- 1499 pounds - $ 48 5000- 5999 pounds - $143 1500- 2499 pounds - $ 77 6000- 6999 pounds - $163 2500- 3499 pounds - $109 7000- 7999 pounds - $176 3500- 5999 pounds - $143 8000- 8999 pounds - $200 6000- 7999 pounds - $176 9000- 9999 pounds - $228 8000- 9999 pounds - $21910000-11999 pounds - $291 10000-11999 pounds - $29112000-13999 pounds - $340 12000-15999 pounds - $36114000-15999 pounds - $408 16000 pounds and over - $43116000 pounds and over - $479
Driver’s License (1st time & renewal) - $39Driver’s license reinstatement - $98Driver instructional license - $78Vehicle titles New titles - $26 Duplicate titles - $26 Lien recordation (per lien) - $20Residential parking permits - $15Reciprocity parking permit for student - $338Personalized organization plates - $52Temporary tags - $13Inspection fee - $10
REVENUE:Fiscal Year Collections
2000 $16,601,0002001 $17,343,0002002 $17,494,0002003 (Est.) $22,700,000
Note: Registration fees increased January 1, 2003 from $55 and $88 to $72 and $115.

16
COMPARATIVE DATA: Metropolitan Area Motor Vehicle Registration Fees Vehicle Weights
Jurisdiction 3499 lbs. or less 3500-3700 lbs. 3701-4000 lbs. Over 4000 lbs.District of Columbia $72.00 $115.00 $115.00 $115.00Charles Co., MD 27.00 27.00 40.50 40.50Montgomery Co., MD 27.00 27.00 40.50 40.50Prince George's Co., MD 27.00 27.00 40.50 40.50Alexandria, VA 1/ 51.00 51.00 51.00 55.00Arlington Co., VA 1/ 31.00 31.00 31.00 35.00Fairfax City, VA 1/ 51.00 51.00 51.00 55.00Fairfax Co., VA 1/ 51.00 51.00 51.00 55.00Falls Church, VA 1/ 51.00 51.00 51.00 55.00Loudoun Co., VA 1/ 50.00 50.00 50.00 54.00Prince William Co., VA 1/ 50.00 50.00 50.00 54.00
1/ Autos subject also to personal property tax. Rates shown include a $26 state fee on vehicles weighing 4,000 pounds orless and a $30 state fee on vehicles weighing more than 4,000 pounds.

17
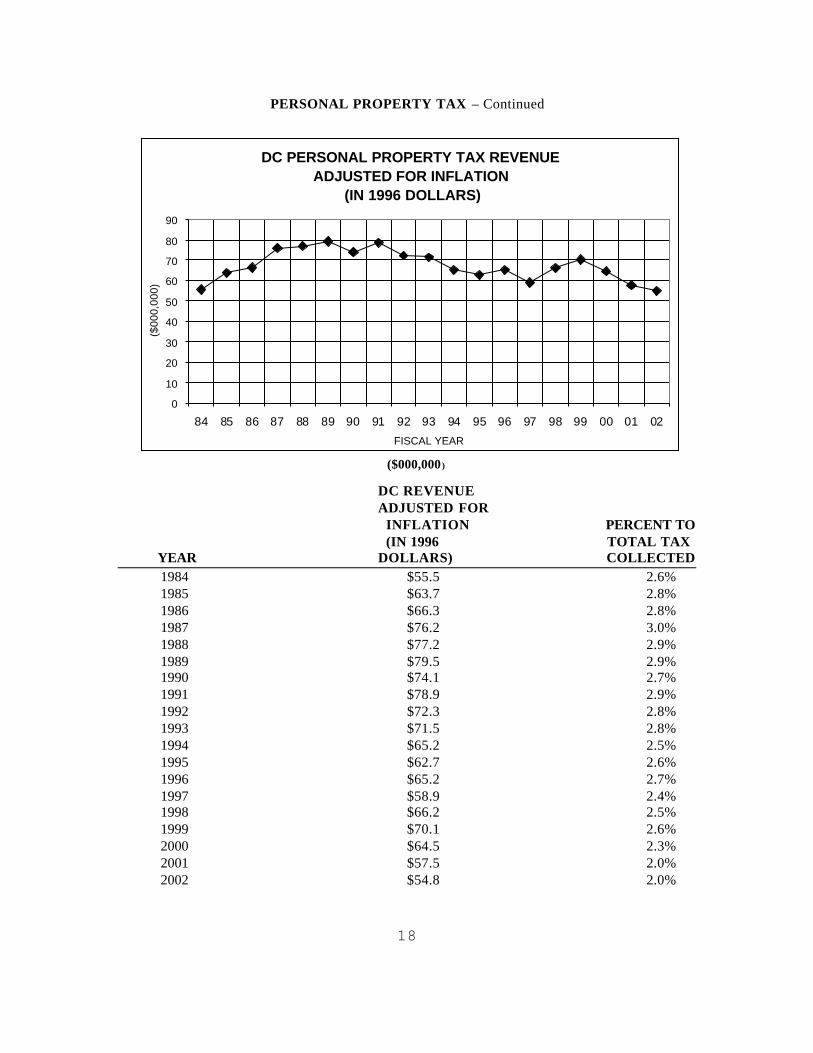
PROPERTY TAXES - PERSONAL PROPERTY TAX
GENERAL LIABILITY:
The tax is levied on all tangible property, except inventories, used in a trade or business. Suchproperty includes machinery, equipment, furniture and fixtures. Beginning July 1, 1981, financialinstitutions are included in the personal property tax base.
D.C. Code Citation: Title 47, Chapter 15 - 17.
PRESENT RATE:
$3.40 per $100 of assessed value; the first $50,000 of taxable value is excluded from tax (effectivefor personal property taxes due July 31, 2001).
REVENUE:Fiscal Year Collections
2000 $70,133,0002001 $64,144,0002002 $65,208,0002003 (Est.) $65,271,000
COMPARATIVE DATA: Metropolitan Area Personal Property Tax Facts 1/
Jurisdiction RateDistrict of Columbia $3.40Charles Co., MD $2.38 Montgomery Co., MD $1.885Prince George's Co., MD $2.404 2/
Alexandria, VA $4.75 3/ ($4.50) 7/ ($3.55) 4/Arlington Co., VA $4.40 4/Fairfax City, VA $3.29 4/ ($1.00) 5/ ($0.01) 6/
Fairfax Co., VA $4.57 4/ ($1.23) 5/ ($0.01) 6/Falls Church, VA $4.71 4/Loudoun Co., VA $4.20 4/ ($2.75) 7/ ($4.00) 8/
Prince William Co., VA $3.70 ($2.00) 9/ ($1.23) 10/ ($1.25) 11/ ($1.00) 12/
1/ The personal property tax year in the Virginia area jurisdictions is on a calendar year basis. The rates submitted by Virginiajurisdictions for this report is applicable to calendar year 2002. In the District of Columbia and the Maryland area jurisdictions, the2002 personal property tax is July 1, 2001 to June 30, 2002. The rates presented are those in effect for those periods. For 2002, theVirginia personal property tax relief was 70.0% for qualifying vehicles.
2/ Rate applies to non-town businesses. The county rate for incorporated town businesses ranges from $2.011 to $2.347. Marylandproperty tax rate is not levied against personal property.
3/ Rate applied to regular individual personal property, and business tangible personal property. 4/ Vehicles with special equipment designed to aid the handicapped are assessed at a rate of $3.55 per $100 of value. 5/ Rate applied to mobile homes and public service corporation non-vehicular personal property. 6/ Rate applied to special subclass of vehicles. 7/ Machinery and tools rate. 8/ Rate applied to heavy equipment. 9/ Rate applied to machinery and tools.10/ Rate applied to mobile homes.11/ Rate applied to computer equipment.12/ Rate applied to research and development.
18
PERSONAL PROPERTY TAX – Continued
($000,000 )
DC REVENUEADJUSTED FOR
INFLATION PERCENT TO (IN 1996 TOTAL TAX
YEAR DOLLARS) COLLECTED 1984 $55.5 2.6%
1985 $63.7 2.8% 1986 $66.3 2.8% 1987 $76.2 3.0% 1988 $77.2 2.9% 1989 $79.5 2.9% 1990 $74.1 2.7% 1991 $78.9 2.9% 1992 $72.3 2.8% 1993 $71.5 2.8% 1994 $65.2 2.5% 1995 $62.7 2.6% 1996 $65.2 2.7% 1997 $58.9 2.4% 1998 $66.2 2.5% 1999 $70.1 2.6% 2000 $64.5 2.3% 2001 $57.5 2.0% 2002 $54.8 2.0%
DC PERSONAL PROPERTY TAX REVENUEADJUSTED FOR INFLATION
(IN 1996 DOLLARS)
0
10
20
30
40
50
60
70
80
90
84 85 86 87 88 89 90 91 92 93 94 95 96 97 98 99 00 01 02
FISCAL YEAR
($00
0,00
0)

19
REAL PROPERTY TAX
GENERAL LIABILITY:
All real property, unless expressly exempted, is subject to taxation at 100% of estimated marketvalue. In FY 1999, the District began a 3-year phase-in of a triennial assessment system. Under thissystem, properties in the District were divided into three triennial groups for assessment purposes. Each tri-group represents approximately a third of the total value of taxable real property in theDistrict. One tri-group was reassessed each year: Tri-group I in FY 1999, tri-group II in FY 2000,and tri-group III in FY 2001. Under the triennial assessment system, annual decreases in assessedvalue were immediately realized if owners appealed for an adjustment. Annual increases in assessedvalue were phased in one-third at a time over a three-year period.
Beginning in FY 2002, the District began its transition back to an annual assessment system. During this transition, one triennial group shifts into annual assessment each year through FY 2004,beginning with tri-group I (1) in FY 2002. Tri-group II (2) shifted to annual assessment in FY 2003,to be followed by tri-group III (3) in FY 2004. By FY 2004, all real property in the District will,once again be reassessed on an annual basis. The return to annual assessment will result in annualassessed values and growth rates more representative of their market values.
The current District of Columbia property tax uses three classifications of property: Class I--improved residential real property that is occupied and is used exclusively for non-transientresidential dwellings purposes; Class II--commercial property; and Class III--unimproved orabandoned property.
The assessed value for each Class I owner-occupied single-family residence (includingcondominiums) is reduced by a $30,000 homeowner's exemption. The assessed value of residentialreal property owned by a cooperative housing association is reduced by 60% (but the exemption maynot exceed $30,000 multiplied by the number of units occupied by the shareholders). First-timehomeowners may be eligible for abatement of real property taxes for a period of five years under theFirst Time Homebuyers Lower Income Home Ownership Tax Abatement program. Owners ofcertified historic buildings may benefit from a special tax program for at least twenty years. TheDistrict also has a property tax relief "circuit-breaker" program for qualified homeowners and renters,which provides a tax credit for those with low and moderate income, the elderly, blind and disabled. For qualified retired senior homeowners, the District allows a one-half reduction in the amount ofreal property taxes that would otherwise be payable. In addition, a property tax deferral programallows qualified homeowners to defer a portion of their taxes. As of FY03, homeowners have a 25%annual cap on growth in their real property tax liability.
D.C. Code Citation: Title 47, Chapter 7 - 14.
The District's Real Property Tax Year is October 1 through September 30.

20
REAL PROPERTY TAX – Continued
PRESENT RATES:FY 2000
Property Class Tax Per $100 of ValueClass I (residential) $0.96 1/Class II (non-residential) $1.85Class III (vacant) $5.00
REVENUE:
Fiscal Year Collections2000 $610,896,0002001 $633,172,0002002 $726,014,0002003 (Est.) $818,936,000
COMPARATIVE DATA: (January 1, 2003)
Metropolitan Area Real Property Tax Facts
NOMINAL EFFECTIVETAX TAX RATE
JURISDICTION PER $100 ASSESSMENT PER $100VALUE VALUE
D.C.Class I (residential) 1/ $0.960 100% $0.810Class II (non-residential) $1.850 100% $1.850Class III (vacant) $5.000 100% $5.000
MarylandCharles Co. 2/3/ $0.916 100% $0.916Montgomery Co. 2/ $0.839 100% $0.839Prince George's Co. 2/ $0.962 100% $0.962
VirginiaAlexandria $1.080 100% $1.080Arlington Co. $0.990 100% $0.990Fairfax $1.000 100% $1.000Fairfax Co. $1.210 100% $1.210Falls Church $1.130 100% $1.130Loudoun Co. $1.080 100% $1.080Prince William Co. $1.230 100% $1.230
1/ The first $30,000 of Assessed Value is exempt from the tax for owner-occupied housing, and because of the $30,000Homestead Exemption for owner-occupied properties, the effective tax rate is $0.810 per $100.
2/ Rates shown does not include the 8.4 cents per $100 of assessed value Maryland state real property tax rate and specialservice area taxes.
3/ Rates are different in tax districts with various levies for fire, rescue and recreation.

21
REAL PROPERTY TAX – Continued
DC REAL PROPERTY TAX REVENUEADJUSTED FOR INFLATION
(IN 1996 DOLLARS)
0
100
200
300
400
500
600
700
800
900
1,000
84 85 86 87 88 89 90 91 92 93 94 95 96 97 98 99 00 01 02
FISCAL YEAR
($00
0,00
0)
($000,000)
DC REVENUEADJUSTED FORINFLATION PERCENT TO(IN 1996 TOTAL TAX
YEAR DOLLARS) COLLECTED 1984 $550.2 25.7% 1985 $596.7 26.5% 1986 $620.1 26.0% 1987 $661.4 25.6% 1988 $719.0 26.9% 1989 $800.6 28.9% 1990 $786.4 29.2% 1991 $905.5 33.8% 1992 $904.1 34.4% 1993 $805.2 31.7% 1994 $762.7 29.6% 1995 $669.0 27.7% 1996 $624.4 26.0% 1997 $602.7 24.8% 1998 $596.2 22.5% 1999 $566.8 21.4% 2000 $562.2 20.2% 2001 $567.8 19.7% 2002 $628.7 23.0%

22
PUBLIC UTILITY TAX
GENERAL LIABILITY:
The tax is imposed on the gross receipts of gas, electric and local telephone companies.
D.C. Code Citation: Title 47, Chapter 25.
PRESENT RATE: (January 1, 2003)
11% of gross receipts
Note: Rate increased from 10% to 11%, effective January 1, 2003.
REVENUEFiscal Year Collections
2000 $132,849,0002001 $149,125,0002002 $140,931,0002003 (Est.) $151,754,000
COMPARATIVE DATA:Metropolitan Area Utility Tax Facts
January 1, 2003
Utilities SubjectJurisdiction To Tax Rate Basis
District of Columbia Gas and telephone 11.0% Gross receipts Electric distribution $0.007 Per Kilowatt Hour
Maryland Electric, light and 2.0% Gross power, gas, oil receipts pipeline, telegraph and telephone companies
Virginia Electric, gas, heat light, power and water Up to $100,000 1.125% Gross Over $100,000 2.3% receipts
Pipeline transmission Up to $100,000 1.125% Gross Over $100,000 2.3% receipts
Telegraph and Telephone 1/
1/ Telephone companies are subject to the corporate income tax, not the utility gross receipts tax.

23
PUBLIC UTILITY TAX – Continued
DC PUBLIC UTILITY TAX REVENUEADJUSTED FOR INFLATION
(IN 1996 DOLLARS)
0
20
40
60
80
100
120
140
160
84 85 86 87 88 89 90 91 92 93 94 95 96 97 98 99 00 01 02
FISCAL YEAR
($00
0,00
0)
($000,000)
DC REVENUE ADJUSTED FOR INFLATION PERCENT TO IN 1996 TOTAL TAX
YEAR DOLLARS COLLECTED 1984 $116.7 5.4% 1985 $111.0 4.9% 1986 $102.8 4.3% 1987 $100.2 3.9% 1988 $ 96.5 3.6% 1989 $119.8 4.3% 1990 $ 88.3 3.3% 1991 $ 97.4 3.6% 1992 $127.0 4.8% 1993 $135.6 5.3% 1994 $140.1 5.4% 1995 $134.0 5.5% 1996 $144.8 6.0% 1997 $138.5 5.7% 1998 $136.3 5.1% 1999 $121.9 4.6% 2000 $122.3 4.4% 2001 $133.7 4.6% 2002 $130.4 4.8%

24
RECORDATION AND TRANSFER TAXES
GENERAL LIABILITY:
The recordation tax is imposed on the recording of all deeds to real estate in the District. Thebasis of the tax is the amount of consideration given for the property, including cash, property otherthan cash, mortgages, liens and security interest in non-residential property. Where there is noconsideration or where the consideration is nominal, the tax is imposed on the basis of the fair marketvalue of the property.
The transfer tax is imposed on each transfer of real property at the time the deed is submitted forrecordation. The tax is based upon the consideration paid for the transfer. Where there is noconsideration or where the amount is nominal, the basis of the transfer tax is the fair market valueof the property conveyed.
Originally in FY 2003, 15 percent of the District’s real estate transfer taxes and 15 percent of deedrecordation taxes were to be deposited into The Housing Production Trust Fund that providesassistance to low and moderate-income families and individuals for available housing. As a resultof the budget crisis, only 5 million in deed transfer will be transferred into the fund. Starting in FY2004, the entire 15 percent will be transferred into The Housing Production Trust Fund.
A tax of 3.0 percent is imposed on transfers of economic interest.
D.C. Code Citation: Title 45, Chapter 9.
PRESENT RATE: (January 1, 2003) (rates increased as of 01/01/03)
Note: Owner-occupied properties under $250,000 rate will remain at 1.1% for deed recordation anddeed transfer.
Deed Recordation1.5% of consideration or fair market value
Deed Transfer1.5% of consideration or fair market value
Economic Interest Transfer3.0% of consideration or fair market value
REVENUE:
Deed Recordation Deed Transfer Transfer of Economic InterestFiscal Year Collections Fiscal Year Collections Fiscal Year Collections
2000 $60,418,000 2000 $44,660,000 2000 $ 540,0002001 $75,936,000 2001 $62,086,000 2001 $ 1,640,0002002 $89,951,000 2002 $62,228,000 2002 $ 5,078,0002003 (Est.) $93,495,000 2003 (Est.) $70,905,000 2003 (Est.) $ 707,000

25
50 STATE RECORDATION/TRANSFER TAX FACTS – Continued
COMPARATIVE DATA:
Tax Per $500 of ConsiderationOptional Maximum Local Rate in Parentheses
StateState
Deed RecordationAnd Max
Realty Transfer 1/ Local Rate
Alabama $ .50Alaska --Arizona 2.00Arkansas 1.65California -- $0.55
Colorado .05Connecticut 3.05Delaware 10.00 $5.00DISTRICT OF COLUMBIA 15.00Florida 3.50
Georgia .50Hawaii .50Idaho --Illinois .50Indiana --
Iowa .80Kansas 1.30Kentucky 3.50Louisiana --Maine 1.10
MARYLAND 2.50 $10.25 2/Massachusetts 2.28 $10.25Michigan 3.75 .55%Minnesota 1.65Mississippi --
Missouri --Montana --Nebraska .875Nevada 3/ .65New Hampshire 7.50

26
50 STATE RECORDATION/TRANSFER TAX FACTS – Continued
COMPARATIVE DATA:
Tax Per $500 of ConsiderationOptional Maximum Local Rate in Parentheses
StateDeed Recordation
And MaxRealty Transfer 1/ Local Rate
New Jersey 4/ 1.75New Mexico --New York 2.00North Carolina 1.00North Dakota --
Ohio .50Oklahoma .75Oregon --Pennsylvania 5.00 $5.00Rhode Island 1.40
South Carolina 1.30South Dakota .50Tennessee 1.85Texas --Utah --
Vermont 5/ 6.50VIRGINIA .75 $0.25Washington 6.40 $2.50West Virginia 1.10 $1.10Wisconsin 1.50Wyoming --
1/ State transfer tax rate only. 2/ Additional $0.75 for each $500 of consideration over $150,000. 3/ In counties whose population is 400,000 or more, $1.25. 4/ Rate is $1.25 for first-time homebuyers. State recordation tax is only collected in certain instances and is not reflected
in this number. 5/ A $2.50 on the first $100,000.

27
RECORDATION AND TRANSFER TAXES – Continued
DC DEED RECORDATION & TRANSFER TAX REVENUE ADJUSTED FOR INFLATION (IN 1996 DOLLARS)
0
20
40
60
80
100
120
140
84 85 86 87 88 89 90 91 92 93 94 95 96 97 98 99 00 01 02
FISCAL YEAR
($00
0,00
0)
($000,000) DC REVENUE ADJUSTED FOR
INFLATION PERCENT TO (IN 1996 TOTAL TAX
YEAR DOLLARS) COLLECTED 1984 $ 59.7 2.8% 1985 $ 55.3 2.5% 1986 $ 63.4 2.7% 1987 $ 87.2 3.4% 1988 $ 82.4 3.1% 1989 $ 82.1 3.0% 1990 $ 78.6 2.9% 1991 $ 43.8 1.6% 1992 $ 41.6 1.6% 1993 $ 44.5 1.8% 1994 $ 47.5 1.8% 1995 $ 44.5 1.9% 1996 $ 59.8 2.5% 1997 $ 56.6 2.3% 1998 $ 93.2 3.5% 1999 $111.4 4.2% 2000 $ 96.7 3.5% 2001 $123.8 4.3% 2002 $124.4 4.5%

28
SALES AND USE TAX
GENERAL LIABILITY:
The District of Columbia has five tax categories that fall under the general sales and use tax. Theretail sales tax rate of 5.75% is imposed on all tangible personal property sold or rented at retail inthe District and on certain selected services. Grocery-type foods, prescription and non-prescriptiondrugs, disability appliances and residential utility services are among items exempt from the salestax. Construction materials and business purchases of public utility services are among thoseincluded. The other rate categories apply to goods and services as indicated below.
The use tax is imposed at the same rate on property sold or purchased outside the District and thenbrought into the District to be used, stored or consumed. Vendors subject to the jurisdiction of theDistrict are required to collect and pay the use tax. When the vendor is not subject to the jurisdictionof the District, or when the purchaser brings the property into the District, the purchaser is requiredto pay the tax.
D.C. Code Citation: Title 47, Chapters 20 and 22.
PRESENT RATES: (January 1, 2003)
A five-tier rate structure is presently in effect: 5.75% Retail rate for tangible personal property and selected services, alcoholic beverages sold in
stores, food sold in vending machines 9% Liquor sold for off the premises consumption
10% Restaurant meals, liquor sold for consumption on the premises, rental vehicles12% Parking motor vehicles in commercial lots
14.5% Transient accommodations
Note: Convention Center sales tax rates of 4.45% for transient accommodations and 1.0% for restaurantsare included in rates noted above.
REVENUE:
Fiscal Year Collections
2000 $640,212,0002001 $617,217,0002002 $612,354,0002003 (Est.) $703,022,000
Note: Collections net of legislative mandated transfers to the Washington Convention Center Authority.

29
SALES AND USE TAXES – Continued
COMPARATIVE DATA: (January 1, 2003)
Sales Tax Facts
Rate MaxState State Local
Alabama 4.0% (4.5%)Alaska does not levy a sales taxArizona 5.0%Arkansas 5.125% (3.0%)California 6.0% (2.5%)
Colorado 2.9% (5.0%)Connecticut 6.0%Delaware does not levy a sales taxDISTRICT OF COLUMBIA 5.75%Florida 6.0%
Georgia 4.0% (3.0%)Hawaii 4.0%Idaho 5.0%Illinois 6.25% (3.0%)Indiana 5.0%
Iowa 5.0% (1.0%)Kansas 4.9% (2.0%)Kentucky 6.0%Louisiana 4.0% (5.0%)Maine 5.0%
MARYLAND 5.0%Massachusetts 5.0%Michigan 6.0%Minnesota 6.5% (1.0%)Mississippi 7.0%
Missouri 4.225% (5.3125%)Montana does not levy a sales taxNebraska 5.5% (2.6875%)Nevada 2.0% (4.5%)New Hampshire does not levy a sales tax

30
SALES AND USE TAXES – Continued
COMPARATIVE DATA: (January 1, 2003)
Sales Tax Facts
Rate MaxState State Local
New Jersey 6.0%New Mexico 1/ 5.0%New York 4.0% (4.5%)North Carolina 4.5% (2.5%)North Dakota 5.0% (2.0%)
Ohio 5.0% (3.0%)Oklahoma 4.5% (5.0%)Oregon does not levy a sales taxPennsylvania 6.0% (1.0%)Rhode Island 7.0%
South Carolina 5.0%South Dakota 4.0% (2.0%)Tennessee 7.0% (2.75%)Texas 6.25% (2.0%)Utah 4.75% (1.85%)
Vermont 5.0%VIRGINIA 3.5% (1.0%)Washington 6.5% (2.3%)West Virginia 6.0%Wisconsin 5.0% (0.6%)
Wyoming 4.0% (1.0%)
1/ A 5% credit within municipal boundaries.

31
SALES AND USE TAXES – Continued
DC SALES AND USE TAX REVENUEADJUSTED FOR INFLATION
(IN 1996 DOLLARS)
0
100
200
300
400
500
600
84 85 86 87 88 89 90 91 92 93 94 95 96 97 98 99 00 01 02
FISCAL YEAR
($00
0,00
0)
($000,000)
DC REVENUEADJUSTED FOR INFLATION PERCENT TO (IN 1996 TOTAL TAX
YEAR DOLLARS) COLLECTED 1984 $454.6 21.2% 1985 $486.0 21.6% 1986 $511.9 21.4% 1987 $525.5 20.4% 1988 $516.1 19.3% 1989 $537.8 19.4% 1990 $552.1 20.5% 1991 $509.9 19.0% 1992 $487.3 18.6% 1993 $437.1 17.2% 1994 $478.7 18.6% 1995 $496.6 20.5% 1996 $467.5 19.5% 1997 $470.7 19.4% 1998 $507.2 19.1% 1999 $513.7 19.4% 2000 $539.0 19.3% 2001 $553.5 19.2% 2002 $530.7 19.4%

32
TOLL TELECOMMUNICATIONS TAX
GENERAL LIABILITY:
The tax is imposed on telecommunication companies for the privilege of providing tolltelecommunication service in the District, including wireless telecommunication providers.
D.C. Code Citation: Title 47, Chapter 38.
PRESENT RATE: (January 1, 2003)
11% of gross charges
Note: Rate increased from 10% to 11%, effective January 1, 2003.
REVENUE:
Fiscal Year Collections
2000 $ 48,280,0002002 $ 51,259,0002002 $ 55,353,0002003 (Est.) $ 64,958,000
COMPARATIVE DATA: (January 1, 2003)
Metropolitan Area Telecommunications Tax Facts
State RateD.C. 11.0%Maryland 2.0%Virginia 1.0%

33
TOLL TELECOMMUNICATIONS TAX – Continued
DC TOLL TELECOMMUNICATIONS TAX REVENUEADJUSTED FOR INFLATION
( IN 1996 DOLLARS)
0
10
20
30
40
50
60
89 90 91 92 93 94 95 96 97 98 99 00 01 02
FISCAL YEAR
($00
0,00
0)
($000,000)
DC REVENUEADJUSTED FORINFLATION PERCENT TO(IN 1996 TOTAL TAX
YEAR DOLLARS) COLLECTED 1989 $13.8 0.5% 1990 $22.7 0.8% 1991 $26.0 1.0% 1992 $36.5 1.4% 1993 $40.3 1.6% 1994 $41.7 1.6% 1995 $45.6 1.9% 1996 $45.5 1.9% 1997 $51.7 2.1% 1998 $54.8 2.1% 1999 $49.2 1.9% 2000 $44.4 1.6% 2001 $46.0 1.6% 2002 $49.4 1.8%

PART III – SELECTED D.C. TAX STATISTICS

34
TABLE 3D.C. TAX COLLECTIONS(In Thousands of Dollars)
Individual and Excise and GrossFiscal Total Net Corporate Property Sales and Receipts Miscellaneous Year Collections 1/ Income Taxes 2/ Use Taxes Taxes 3/ Taxes 4/
1984 1,398,812 480,453 5/ 397,449 365,587 98,449 56,8741985 1,536,027 524,620 6/ 455,097 402,743 91,445 62,1221986 1,684,535 595,964 6/ 488,849 432,969 93,799 72,9541987 1,873,667 682,788 6/ 541,211 459,418 99,786 90,4641988 2,021,912 744,326 6/ 609,425 468,942 103,285 95,9341989 2,204,598 759,883 6/ 710,766 507,169 136,680 90,1001990 2,279,127 777,651 6/ 737,138 546,823 127,573 89,9421991 2,371,732 749,025 6/ 881,878 531,004 142,562 67,2631992 2,384,300 708,085 6/ 903,319 542,750 180,192 67,9541993 2,557,852 730,519 6/ 1,011,663 504,735 229,593 7/ 81,3421994 2,470,053 800,868 6/ 811,009 557,474 243,199 7/8/ 57,5031995 2,391,041 804,355 6/ 730,343 584,107 210,912 7/9/ 61,3241996 2,402,521 843,553 6/ 701,635 530,391 234,957 7/ 91,9851997 2,490,036 936,980 6/ 687,599 540,837 229,242 7/ 95,3781998 2,773,561 1,083,102 6/ 695,440 618,500 236,637 7/ 139,8821999 2,849,873 1,169,751 6/ 679,550 645,949 207,290 147,3332000 3,083,827 1,338,564 6/ 692,781 698,861 212,011 141,6102001 3,209,273 1,400,237 6/ 707,423 677,139 233,740 190,7342002 3,147,582 1,160,424 6/ 803,389 668,837 231,786 283,146
1/ Collection is on a modified accrual basis.2/ Includes public space rental and personal property.3/ Includes Toll Telecommunication, public utility taxes and insurance companies.4/ Includes inheritance and estate, recordation and transfer, and economic interest taxes.5/ Includes one-half of corporate income surtax.6/ Includes total corporate income surtax.7/ Includes health care providers tax.8/ Includes Public Safety Fee.9/ Includes Arena Fee.

35
TABLE 42001 D.C. INCOME TAX DISTRIBUTION
Adjusted Net TaxableAdjusted Gross Number Gross Income IncomeIncome Class of Returns Percent 1/ Amount Percent 1/ Amount Percent 1/
ITEMIZED DEDUCTIONSLess Than $0 652 0.4% -111,845,193 -0.9% 0 0.0%$0- $9,999 17,514 11.5% 84,620,296 0.7% 43,596,531 0.4%$10,000-$19,999 16,424 10.8% 247,652,682 1.9% 154,229,913 1.4%$20,000-$29,999 19,197 12.7% 481,327,235 3.8% 318,697,496 3.0%$30,000-$39,999 18,407 12.1% 642,159,659 5.0% 454,824,847 4.3%$40,000-$49,999 15,007 9.9% 672,236,549 5.3% 493,587,177 4.6%$50,000 & Over 64,544 42.5% 10,725,033,675 84.2% 9,204,704,812 86.3%Total 151,745 100.0% 12,741,184,902 100.0% 10,669,640,776 100.0%
STANDARD DEDUCTIONLess Than $0 593 0.5% -34,889,531 -1.3% 0 0.0%$0- $9,999 32,540 26.3% 161,545,523 5.8% 52,076,198 2.3%$10,000-$19,999 33,254 26.9% 497,437,546 17.9% 321,726,731 14.4%$20,000-$29,999 25,577 20.7% 629,016,783 22.6% 490,986,910 21.9%$30,000-$39,999 14,983 12.1% 517,163,161 18.6% 444,743,339 19.8%$40,000-$49,999 7,885 6.4% 350,202,937 12.6% 314,300,697 14.0%$50,000 & Over 8,684 7.0% 656,667,386 23.6% 617,443,937 27.5%Total 123,516 100.0% 2,777,143,806 100.0% 2,241,277,813 100.0%
1/ Detail may not add to total due to rounding.

36
TABLE 5
DISTRICT OF COLUMBIA ASSESSMENTS – TAXABLE, EXEMPT AND TOTALS
TAX YEAR 2002
% OF ALL PROPERTIESTYPE
OF PROPERTY
TOTALACRES
LANDVALUE
IMPROVE-MENTS
TOTAL VALUE
FOREGONETAX
LANDACRES
LANDVALUE
TOTALVALE
NUMBEROF
ITEMSTotal Taxable 12,482.04 $24,296,332,134 $40,245,040,150 $64,541,372,284 $64,541,372,284 42.4 53.5 63.8 172,983
Class One (Gross) 9,278.32 $10,731,353,613 $23,266,411,044 $33,997,764,657 $283,174,410 31.5 23.6 33.6 156,745Residential/Single Family 5,488.71 6,654,054,109 15,353,079,797 22,007,133,906 193,933,190 18.7 14.7 21.7 110,447Residential/Multifamily 1,270.95 1,470,616,774 2,299,393,941 3,770,010,715 36,189,529 4.3 3.2 3.7 3,229Commercial 1/ 46.24 270,299,305 240,646,877 510,946,182 4,328,355 0.2 0.6 0.5 695Flats/Conversions 543.93 768,248,089 2,050,795,844 2,819,043,933 27,059,889 1.8 1.7 2.8 9,846Hotels/Motels 1/ 0.72 3,738,290 2,961,880 6,700,170 64,322 0.0 0.0 0.0 10Garage/Unimproved 1/ 177.69 151,727,623 171,516,839 323,244,462 3,097,596 0.6 0.3 0.3 8,978Seniors 1,750.08 1,412,669,423 3,148,015,866 4,560,685,289 18,501,529 5.9 3.1 4.5 23,540
Class Two (Gross) 3,203.72 $13,564,978521 $16,978,629,106 $30,543,607,627 $565,056,741 10.9 29.9 30.2 16,238Residential/Single Family 2/ 111.01 75,625,422 118,585,793 194,211,215 3,592,907 0.4 0.2 0.2 1,437Residential/Multifamily 2/ 75.57 15,481,366 36,022,613 51,503,979 952,824 0.3 0.0 0.1 218Commercial 2,051.75 11,466,039,489 14,896,122,894 26,362,162,383 487,700,004 7.0 25.2 26.1 7,707Flats/Conversions 2/ 32.27 18,311,297 33,953,849 52,265,146 966,905 0.1 0.0 0.1 451Hotels/Motels 101.74 1,011,708,401 1,409,652,186 2,421,360,587 44,795,171 0.3 2.2 2.4 175Garage/Unimproved 831.38 977,812,546 484,291,771 1,462,104,317 27,048,930 2.8 2.2 1.4 6,250
TOTAL EXEMPT 16,994.13 $21,117,637,169 $15,534,645,267 $36,652,282,436 $433,127,515 57.6 46.5 36.2 22,189Total US/DC Government 13,347.22 16,182,732,500 8,913,631,595 25,096,364,095 301,156,369 45.4 35.6 24.8 5,186United States 11,498.30 14,565,554,804 7,236,475,601 21,802,030,405 261,624,365 39.1 32.1 21.5 3,037District of Columbia 1,848.91 1,617,177,696 1,677,155,994 3,294,333,690 39,532,004 6.3 3.6 3.3 2,149
Total Non-US/DC Exempt 3,596.92 $4,934,904,669 $6,621,013,672 $11,555,918,341 $131,971,145 12.2 10.9 11.4 17,003W.M.A.T.A. 197.46 12,6879,320 35,084,330 161,963,650 2,996,328 0.7 0.3 0.2 444Tax Abated 0.11 545,190 1,509,620 2,054,810 24,658 0.0 0.0 0.0 18D.C.R.L.A. 46.33 22,7617,414 210,716,359 438,333,773 5,260,005 0.2 0.5 0.4 222Homestead Preservation 1.48 763,945 1,342,298 2,106,243 20,220 0.0 0.0 0.0 15Low Income-Abated 299.06 239,502,156 578,874,089 818,376,245 7,856,412 1.0 0.5 0.8 6,825Religious 604.25 568,112,693 807,053,185 1,375,165,878 16,501,991 2.1 1.3 1.4 1,188Educational 698.67 1,000,625,090 1,277,575,166 2,278,200,256 27,338,403 2.4 2.2 2.3 429Foreign Government 292.26 520,229,113 942,648,681 1,462,877,794 17,554,534 1.0 1.1 1.4 602Charitable 173.20 158,965,836 245,204,861 404,170,697 4,850,048 0.6 0.4 0.4 503Cemetery 345.68 144,552,366 2,263,747 146,816,113 2,716,098 1.2 0.3 0.1 24Hospital 34.36 28,948,211 69,131,854 98,080,065 1,814,481 0.1 0.1 0.1 7Library 1.18 3,086,760 5,587,240 8,674,000 160,469 0.0 0.0 0.0 1Miscellaneous 902.87 1,915,076,575 2,359,098,817 4,359,098,817 44,877,500 3.1 4.2 4.3 6,725TOTAL TAXABLEAND EXEMPT 29,426.17 $45,413,969,303 $55,779,685,417 $101,193,654,720 $1,281,358,666 100.0 100.0 100.0 195,172
NOTE: Detail may not add to total due to rounding.

37
TABLE 6DISTRICT OF COLUMBIA
REAL PROPERTY TAX LEVIES AND COLLECTIONSLast Ten Fiscal Years
($000)
Percent ofProperty Total OutstandingTax Tax Total Tax Collections DelinquentYear (1) Levy (2) Collections to Levy Taxes
1993 928,934 889,238 95.7 81,3851994 721,924 707,488 98.0 64,0251995 720,331 692,953 96.2 52,2771996 700,171 681,086 97.3 50,4641997 648,166 627,437 96.8 48,2701998 638,569 620,797 97.2 37,2291999 637,647 583,142 91.5 73,2862000 613,385 592,777 96.6 37,8772001 669,016 635,324 95.0 44,4372002 740,387 707,624 95.6 53,242
(1) Property tax year is from October 1 to September 30 starting in 1996. From 1986 to 1995, the property tax year wasJuly 1 to June 30.
(2) This column reflects the original tax levies for the years indicated and excludes later increases or decreases resultingprimarily from audits and judgments.

38
TABLE 7MAJOR STATE AND LOCAL TAX BURDENS FOR A HYPOTHETICAL FAMILY OF FOUR RESIDING IN
SELECTED WASHINGTON METROPOLITAN AREA JURISDICTIONS, 2002
MARYLAND VIRGINIA
TAX
DISTRICTOF
COLUMBIAMONTGOMERY
COUNTY
PRINCEGEORGE’SCOUNTY ALEXANDRIA
ARLINGTONCOUNTY
FAIRFAXCOUNTY
$25,000 INCOME LEVELIncome $ 455 $ 0 $ 0 $ 580 $ 580 $ 580Real Estate 612 1,066 1,284 1,013 931 1,134Sales & Use 397 371 365 307 316 268Automobile 213 174 174 250 218 247
TOTAL $ 1,677 $ 1,611 $ 1,824 $ 2,150 $ 2,045 $ 2,230RANK 5 6 4 2 3 1
$50,000 INCOME LEVELIncome $ 2,316 $ 2,659 $ 2,398 $ 1,758 $ 1,768 $ 1,746Real Estate 1,392 1,990 2,398 1,890 1,738 2,118Sales & Use 754 702 696 585 603 511Automobile 218 180 180 315 273 310
TOTAL $ 4,681 $ 5,531 $ 5,672 $ 4,549 $ 4,381 $ 4,685RANK 4 2 1 5 6 3
$75,000 INCOME LEVELIncome $ 4,145 $ 4,061 $ 4,094 $ 2,989 $ 3,004 $ 2,969Real Estate 2,232 2,985 3,596 2,835 2,607 3,176Sales & Use 1,131 1,052 1,044 878 904 766Automobile 363 313 313 520 451 515
TOTAL $ 7,872 $ 8,411 $ 9,047 $ 7,222 $ 6,966 $ 7,426RANK 3 2 1 4 6 5
$100,000 INCOME LEVELIncome $ 6,079 $ 5,762 $ 5,814 $ 4,252 $ 4,272 $ 4,229Real Estate 2,832 3,695 4,453 3,510 3,227 3,933Sales & Use 1,434 1,337 1,323 1,112 1,145 971Automobile 380 332 332 687 595 677
TOTAL $ 10,725 $ 11,126 $ 11,921 $ 9,561 $ 9,239 $ 9,809RANK 3 2 1 4 6 5
$150,000 INCOME LEVELIncome $ 10,068 $ 9,115 $ 9,211 $ 6,748 $ 6,776 $ 6,715Real Estate 4,032 5,117 6,165 4,860 4,469 5,445Sales & Use 2,037 1,896 1,879 1,580 1,627 1,379Automobile 380 323 323 907 775 890
TOTAL $ 16,517 $ 16,451 $ 17,579 $ 14,096 $ 13,646 $ 14,429RANK 2 3 1 4 6 5
SOURCE: A Comparison of Tax Rates and Burdens in the Washington Metropolitan Area, 2002. WWW.CFO.DC.GOV

39
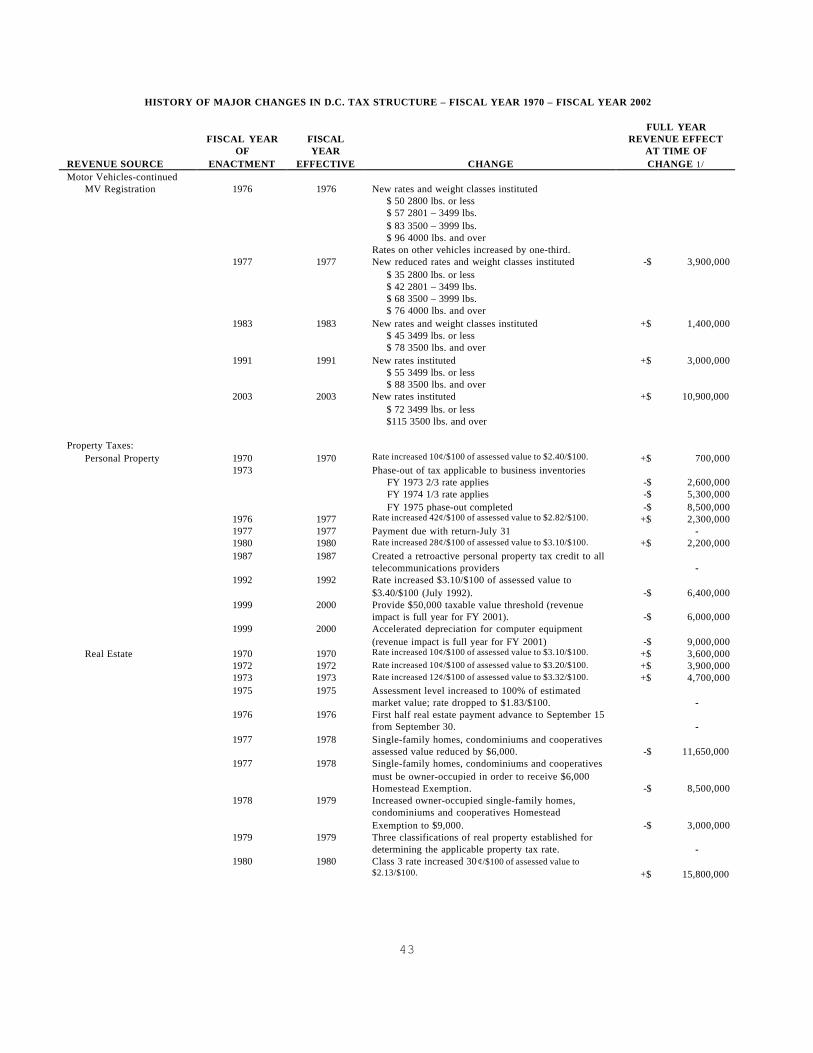
HISTORY OF MAJOR CHANGES IN D.C. TAX STRUCTURE – FISCAL YEAR 1970 – FISCAL YEAR 2002
REVENUE SOURCE
FISCAL YEAROF
ENACTMENT
FISCALYEAR
EFFECTIVE CHANGE
FULL YEARREVENUE EFFECT
AT TIME OFCHANGE 1/
Alcoholic BeverageBear 1970 1970 Rate increased 5¢/barrel to $2.25/barrel +$ 150,000
1989 1989 Rate increased 54¢/barrel to $2.79/barrel +$ 250,000Sparkling Wine 1989 1989 Rate decreased 5¢/gallon to 40¢/gallon -$ 25,000
1990 1990 Rate increased 5¢/gallon to 45¢/gallon +$ 20,000Spirits 1970 1970 Rate increased 25¢/gallon to 2.00/gallon +$ 1,500,000
1978 1978 Rate decreased 50¢/gallon to $1.50/gallon -$ 1,800,000Wine (14% or Less Alcohol) 1989 1989 Rate increased 25¢/gallon to 40¢/gallon +$ 750,000
1990 1990 Rate decreased 10¢/gallon to 30¢/gallon -$ 300,000 (More than 14%Alcohol)
1989 1989 Rate increased 7¢/gallon to 40¢/gallon +$ 25,000
Cigarette 1970 1970 Rate increased from 3¢/pack to 4¢/pack +$ 1,050,0001973 1973 Rate increased from 4¢/pack to 6¢/pack +$ 1,800,0001976 1976 Rate increased from 6¢/pack to 10¢/pack +$ 2,600,0001977 1977 Rate increased from 10¢/pack to 13¢/pack +$ 2,400,0001987 1987 Rate increased from 13¢/pack to 17¢/pack (April 1987) +$ 1,200,0001991 1992 Rate increased from 17¢/pack to 30¢/pack (April 1991) +$ 5,200,0001992 1992 Rate increased from 30¢/pack to 50¢/pack (April 1992) +$ 4,500,0001993 1993 Rate increased from 50¢/pack to 65¢/pack (July 1993) +$ 4,500,0002002 2003 Rate increased from 65¢/pack to $1.00/pack (January
2003)+$ 5,800,000
FINANCIAL INSTITUTIONS:Banks, Building 1976 1976 Rate on banks increased from 4% to 6%; rate on
buildingAssociation Gross Associations increased from 2% to 3% +$ 5,600,000Earnings Rate on building association decreased fro 3% to 2%. -$ 2,500,000
1977 1977 Payment due with return-August 1.1980 1981 Financial institutions added to corporation franchise
base/gross earnings tax phased out. 2/ +$ 3,569,000
INCOME TAXES:Individual Income 1970 1970 District taxation of capital gains and sick pay conformed
to the federal treatment.New rates and brackets From % 2 3 4 5 6
$000 1 2 2 5 over 10 to % 2 3 4 5 6 7 8 9 10 $000 1 1 1 2 3 4 5 8 over 25
1975 1976 Income tax credit for excess property taxes paid by lowincome persons
1976 1976 Personal exemptions and childcare deduction conformedto federal treatment
+$ 1,500,000
New rates and brackets % 2 3 4 5 6 7 8 9 10 11 $000 1 1 1 1 1 5 3 4 8 over 25
+$ 14,900,000
1977 1977 Income tax credit for excess property taxes paid:a) over 62, blind, disabled-income limit $20,000-credit limit $750.b) under 62-income limit $7,000-credit limit $320.
-$ 3,917,000
1978 Income tax credit for excess property taxes paid:a) over 62, blind, disabled-income limit $20,000-credit limit $750.b) under 62-income limit $10,000-credit limit $400.
-$ 2,309,000
1978 1979 Income tax credit for excess property taxes paid isincreased to $750 and the income limit is increased to$20,000 for claimants under age 62 who are not blind ordisabled.
-$ 1,000,000
1980 1980 Installment dates for payments of and declarations ofestimated tax changed from July 15 to June 15 and fromOctober 15 to September 15.
+$ 2,500,000

40
HISTORY OF MAJOR CHANGES IN D.C. TAX STRUCTURE – FISCAL YEAR 1970 – FISCAL YEAR 2002
REVENUE SOURCE
FISCAL YEAROF
ENACTMENT
FISCALYEAR
EFFECTIVE CHANGE
FULL YEARREVENUE EFFECT
AT TIME OFCHANGE 1/
Individual Income-continued
1982 1982 D.C. income tax conformed to the federal income taxwith certain modifications. -$ 6,200,000
1982 1983 Conformity to federal treatment of medical and dentalexpenses, and casualty losses. +$ 3,015,000
1987 1987 Require seizure of individual income tax refunds of theUniversity of the District of Columbia adjudicatedstudent loan defaulters. -
Estimated full YearRevenue Effect at
Time of Change 1/3/(Millions of Dollars)
FISCALYEAR OF
ENACTMENTFY’87
FY’88
FY’89
FY’90
FY’91
FY’92
FY’93
FY’94
FY’95
1987 new rates and brackets % 6 8 10 $000 10 10 over 20 for calendar year 1987 % 6 8 9.5 for calendar year 1988 $000 10 10 over 20 and subsequent years. 2.9 17.7 19.9 23.0 26.0
1987 Increased personal exemption to $885 for 1987; $1,025for 1988; $1,160 for 1989; $1,270 for 1990; and $1,370for 1991 and subsequent calendar years. -7.6 -11.9 -17.7 -22.5 -26.8
1987 Increased standard deduction from $1,000 to $2,000. -10.0 -10.0 -10.0 -10.0 -10.01987 Retained $3,000 exclusion for certain retires. -5.0 -5.0 -5.0 -5.0 -5.01987 Established low individual income tax credit. -2.0 -1.0 -1.0 -1.0 -1.01989 Repealed Political Contribution Credit - - 0.2 1.0 1.0 1.0 1.0 1.0 1.0
Required same deduction method used when filingfederal return. - - 1.5 3.0 3.0 3.0 3.0 3.0 3.0Begin taxation of lottery winnings. - - 0.5 1.0 1.0 1.0 1.0 1.0 1.0
1995 Confirm to Internal Revenue code provisions as of April 11, 1995 Minimal
FY ‘00 FY ‘01 FY ‘02 FY ‘03 FY ‘041999 Tax Parity Act of 1999 (estimates assume full
enactment)$21.2 (M)
$56.2 (M)
$77.2(M)
$99.9(M)
$148.7(M)
REDUCED TAX RATES AS FOLLOWS:
Lowest Rate$0 - $10,000 (currently 6.0%)
5.0% 5.0% 5.0% 4.5% 4.0%
Middle Rate$10,001 - $20,000 (currently 8.0%) 7.5% 7.5%
$10-$30K
7.0%
$10-$30K
7.0%
$10-$40K
6.0%
$10-$40K
Top RateOver $20,000 (currently 9.5%)
Top Bracket 4/
9.5%
$20K
9.3%
$30K
9.0%
$30K
8.7%
$40K
8.5%
$40K
REVENUE SOURCE
FISCAL YEAROF
ENACTMENT
FISCALYEAR
EFFECTIVE CHANGE
FULL YEARREVENUE EFFECT
AT TIME OFCHANGE 1/
2001 Tax Parity Act of 1999 suspended -2002 2003 Earned Income Tax Credit
Tax Year 2001 – 10% of federal credit Tax Year 2002 – 25% of federal credit -$ 18,711,000

41
HISTORY OF MAJOR CHANGES IN D.C. TAX STRUCTURE – FISCAL YEAR 1970 – FISCAL YEAR 2002
REVENUE SOURCE
FISCAL YEAROF
ENACTMENT
FISCALYEAR
EFFECTIVE CHANGE
FULL YEARREVENUE EFFECT
AT TIME OFCHANGE 1/
Corporation andUnincorporated
1970 1970 $25 minimum tax and quarterly declaration paymentrequirements
+$ 2,500,000
Business Franchise 1972 1972 Rate increased to 7% +$ 3,000,0001974 Rate increased to 8% +$ 3,000,000
1976 1976 Professional added to unincorporated businessfranchise tax base at 12% rate with new exemption andsalary allowance amounts
+$ 8,250,000(gross amount
beforeindividual
income taximpact)
Permanent corporate and unincorporated business taxrate increase from 8% to 9%. +$ 3,675,000Temporary increase for calendar year 1975 from 9% to12%. +$ 11,025,000Require professional corporations to file asunincorporated business.. +$ 1,250,00010% surtax imposed; effective rate for fiscal year 1976returns became 9.9%. +$ 6,000,000
1977 1977 Only unincorporated businesses with gross incomes inexcess of $12,000 must file a return. -$ 40,000
1978 1978 10% surtax continued indefinitely +$ 5,600,0001980 1980 Installment dates for payments and declarations of
estimated tax changed from July 15 to June 15 andfrom October 15 to September 15. +$ 2,500,000
1980 1980 Professionals deleted from unincorporated businessfranchise tax base. -$ 10,410,000
1980 1981 Financial institutions added to corporation franchisetax base. +$ 3,569,000
1983 1983 Minimum franchise tax increased from $25 to $100. +$ 800,0001984 1985 Rate increased from 9% to 10%, surtax decreased from
10% to 5% for an effective rate of 10.5%. +$ 7,000,0001986 1986 Nondeductible expenses incurred to produce, treated as
exempt income.
FY’87
FY’88
FY’89
FY’90
FY’91
FY’92
1987 Surtax decreased from 5% to 2.5%. 0 -4.4 -4.8 -5.3 -5.8 -1987 Established net operating loss. -5.0 -5.0 -5.0 -5.0 - -1989 Surtax increased from 2.5% to 5%. - 4.3 4.7 5.1 - -
1993 1993 Surtax decreased from 5% to 2.5%, effective October1, 1992. -$ 2,950,000
1994 1995 Reduce franchise tax rate to 9.5%. -$ 6,400,0001994 1995 Allow a deduction for Subpart F income. -$ 3,000,0001994 1994 Conform to provisions of omnibus budget
reconciliation act of 1993 +$ 100,0001994 1994 Add a 2.5% surtax to finance the Convention Center. +$ 3,143,0001995 1995 Conform to Internal Revenue Code provisions as of
April 11, 1995. -1999 1999 Surtax (2.5%) financing the Convention Center shifted
to general fund. 5/ +$ 6,200,0001999 2000 Eliminate carry back of net operating losses/adjust net
operating loss provisions to reflect single entity filing. -1999 2003 Reduce 9.975% rate to 9.0%. -$ 16,700,0001999 2004 Reduce 9.0% rate to 8.5% (rate reduction impact is
cumulative). -$ 28,700,0002002 2003 Tax Parity suspended. +$ 17,500,000

42
HISTORY OF MAJOR CHANGES IN D.C. TAX STRUCTURE – FISCAL YEAR 1970 – FISCAL YEAR 2002
REVENUE SOURCE
FISCAL YEAROF
ENACTMENT
FISCALYEAR
EFFECTIVE CHANGE
FULL YEARREVENUE EFFECT
AT TIME OFCHANGE 1/
Corporation andUnincorporated BusinessFranchise-continued
2002 2003 Bonus depreciation decoupling from the FederalCorporation Tax code (recently passed federal jobCreation and Worker Assistance Act of 2002). +$ 24,000,000
Inheritance and Estate 1972 1972 Rates increased to a range of 1% - 23%, Class Bmerged with Class C and exemption lowered. -$ 2,800,000
1987 1987 Inheritance tax abolished for decedents dying on orafter April 1, 1987. -$ 15,000,000
2002 2002 DC Estate Tax is no longer in conformity with theFederal Estate Tax, and the filing threshold increasesfrom $600,000 to $675,000 effective January 1, 2002. -
Insurance 1977 1977 Payment dates changed. If liability is over $2,000, atleast 25% of tax must be paid in each of 3 installmentsduring the year taxable income is received. Remainderis due by march 1 following close of calendar year. -
1992 1993 Increase insurance gross premiums tax rate from 2% to2.25% (October 1992). +$ 4,000,000
1999 1999 Decrease insurance gross premiums tax rate from2.25% to 1.7% (January 1, 1999). -$ 6,000,000
Motor Vehicles: 1970 1970 Rate increased from 3% to 4%. +$ 1,700,000Motor Vehicle Excise 1973 1973 Rate increased from 4% to 5%. +$ 1,900,000
1976 1976 Rate increased from 5% to 6%. +$ 1,800,000New rates and weight classes instituted 4% 2799 lbs. Or less 5% 2800 – 3400 lbs. 6% 3500 – 3999 lbs. 7% 4000 lbs. or over
+$ 550,000
1983 1983 New rates and weight classes instituted (June 1983) 6% 3499 lbs. or less 7% 3500 lbs. or over
+$ 2,000,000
1990 1990 Exempted taxicabs from motor vehicle excise tax andrequired new residents to pay excise tax on motorvehicles transferred into the District. +$ 700,000
1999 1999 Repeal requirement that new residents pay secondexcise tax on vehicles transferred into the District. 6/ -$ 12,000,000
Motor Vehicle Fuel 1972 1972 Rate increased from 1¢/gallon to 8¢/gallon +$ 2,400,0001976 1976 Rate increased from 2¢/gallon to 10¢/gallon +$ 4,825,0001980 1980 Rate increased from 10¢/gallon to 11¢/gallon +$ 1,512,0001980 1981 Rate increased from 11¢/gallon to 13¢/gallon (June 1981) +$ 3,024,0001980 1982 The gasoline excise tax rate becomes indexed to the
consumer price urban index.-
Rate increased from 13¢/gallon to 14¢/gallon after indexing (June 1982). +$ 1,600,000
1983 1983 Rate increased from 14¢/gallon to 14.8¢/gallon (June 1983). +$ 1,300,0001984 1984 Rate increased from 14.8¢/gallon to 15.5¢/gallon (June 1984). +$ 1,100,0001985 1985 Rate set at 15.5¢/gallon (June 1985), indexing repealed. -$ 1,700,0001989 1989 Rate increased from 15.5¢/gallon to 18¢/gallon (June 1989). +$ 4,000,0001992 1993 Rate increased from 18¢/gallon to 20¢/gallon (October 1992). +$ 3,300,0001994 1994 Temporary rate increase (4 months) from 20¢/gallon to
22.5¢/gallon (June 1994). +$ 1,300,000MV Registration 1970 1970 Rate increased from $22.50 on cars under 3500 lbs. to
$30.00 on cars under 3400 lbs.; rate increased on carsover 3500 lbs. from $32.50 to $50.00 on cars over3400 lbs.; rates on other vehicles increased by one-third. +$ 3,300,000
1976 1976 Rate increased on cars under 3400 lbs. from $30.00 to$40.00; rate increased on cars over 3400 lbs. from$50.00 to $67.00; rates on other vehicles increased byone-third. +$ 3,850,000
43
HISTORY OF MAJOR CHANGES IN D.C. TAX STRUCTURE – FISCAL YEAR 1970 – FISCAL YEAR 2002
REVENUE SOURCE
FISCAL YEAROF
ENACTMENT
FISCALYEAR
EFFECTIVE CHANGE
FULL YEARREVENUE EFFECT
AT TIME OFCHANGE 1/
Motor Vehicles-continuedMV Registration 1976 1976 New rates and weight classes instituted
$ 50 2800 lbs. or less $ 57 2801 – 3499 lbs. $ 83 3500 – 3999 lbs. $ 96 4000 lbs. and overRates on other vehicles increased by one-third.
1977 1977 New reduced rates and weight classes instituted $ 35 2800 lbs. or less $ 42 2801 – 3499 lbs. $ 68 3500 – 3999 lbs. $ 76 4000 lbs. and over
-$ 3,900,000
1983 1983 New rates and weight classes instituted $ 45 3499 lbs. or less $ 78 3500 lbs. and over
+$ 1,400,000
1991 1991 New rates instituted $ 55 3499 lbs. or less $ 88 3500 lbs. and over
+$ 3,000,000
2003 2003 New rates instituted $ 72 3499 lbs. or less $115 3500 lbs. and over
+$ 10,900,000
Property Taxes:Personal Property 1970 1970 Rate increased 10¢/$100 of assessed value to $2.40/$100. +$ 700,000
1973 Phase-out of tax applicable to business inventories FY 1973 2/3 rate applies FY 1974 1/3 rate applies FY 1975 phase-out completed
-$-$-$
2,600,0005,300,0008,500,000
1976 1977 Rate increased 42¢/$100 of assessed value to $2.82/$100. +$ 2,300,0001977 1977 Payment due with return-July 31 -1980 1980 Rate increased 28¢/$100 of assessed value to $3.10/$100. +$ 2,200,0001987 1987 Created a retroactive personal property tax credit to all
telecommunications providers -1992 1992 Rate increased $3.10/$100 of assessed value to
$3.40/$100 (July 1992). -$ 6,400,0001999 2000 Provide $50,000 taxable value threshold (revenue
impact is full year for FY 2001). -$ 6,000,0001999 2000 Accelerated depreciation for computer equipment
(revenue impact is full year for FY 2001) -$ 9,000,000Real Estate 1970 1970 Rate increased 10¢/$100 of assessed value to $3.10/$100. +$ 3,600,000
1972 1972 Rate increased 10¢/$100 of assessed value to $3.20/$100. +$ 3,900,0001973 1973 Rate increased 12¢/$100 of assessed value to $3.32/$100. +$ 4,700,0001975 1975 Assessment level increased to 100% of estimated
market value; rate dropped to $1.83/$100. -1976 1976 First half real estate payment advance to September 15
from September 30. -1977 1978 Single-family homes, condominiums and cooperatives
assessed value reduced by $6,000. -$ 11,650,0001977 1978 Single-family homes, condominiums and cooperatives
must be owner-occupied in order to receive $6,000Homestead Exemption. -$ 8,500,000
1978 1979 Increased owner-occupied single-family homes,condominiums and cooperatives HomesteadExemption to $9,000. -$ 3,000,000
1979 1979 Three classifications of real property established fordetermining the applicable property tax rate. -
1980 1980 Class 3 rate increased 30¢/$100 of assessed value to$2.13/$100. +$ 15,800,000

44
HISTORY OF MAJOR CHANGES IN D.C. TAX STRUCTURE – FISCAL YEAR 1970 – FISCAL YEAR 2002
REVENUE SOURCE
FISCAL YEAROF
ENACTMENT
FISCALYEAR
EFFECTIVE CHANGE
FULL YEARREVENUE EFFECT
AT TIME OFCHANGE 1/
Real Estate-continued 1982 1982 A quinquennial (every 5 years) filing permitted for the$9,000 homeowner’s exemption. -
1984 1984 Class 3 rate decreased 10¢/$100 of assessed value to$2.03/$100. -$ 11,200,000
1984 1984 Public space rental formula changed from a fractionalassessment basis (65%) to a method based upon theproperty’s full assessed value. +$ 900,000
1985 1985 Four classifications of real property established fordetermining the applicable property tax rate. -$ 3,400,000
1986 1987 Established a July Nuisance Tax Sale in addition to theannual January Real Property Tax Sale. -
1986 1987 Retired Senior Citizens, 65 or older, receive 50%reduction on real property taxes (January 1987). -$ 6,400,000
1987 1987 Increased owner-occupied single-family homes,condominiums and cooperatives HomesteadExemption to $15,000 (January 1987). -$ 6,500,000
1988 1989 Increased owner-occupied single-family homes,condominiums and cooperatives HomesteadExemption to $22,000 (June 1988). -$ 7,600,000
1990 1990 Increased owner-occupied single-family homes,condominiums and Cooperatives HomesteadExemption to $30,000 (June 1990). -$ 7,100,000
1990 1990 Class 1 rate decreased from $1.06 to $0.96. -$ 14,100,000Established Class 5 for unimproved vacant land at rateof $3.29. +$ 5,800,000
1992 1992 Expand eligibility for senior citizen property tax reliefand cap eligibility at $100,000 income (July 1992). +$ 2,500,000
1993 1994 Increase Class 5 rate from $3.29 to $5.00. +$ 5,100,0001995 1995 Calculated rates go into effect for the 1st half of year.
Class 1 rate = $0.96 Class 2 rate = $1.62 Class 3 rate = $1.81 Class 4 rate = $2.31 Class 5 rate = $5.35
+$ 40,100,000
1996 1996 Eliminated January Nuisance Tax Sale. -1997 1997 Replace January Real Property Sale to a July Real
Property Tax Sale. -1997 1999 The District began 3-year phase-in of a triennial
assessment system. Properties were divided into threetriennial groups for assessment purposes. One tri-group is reassessed each year. Tri-group I in FY 1999,tri-group II in FY 2000, and tri-group III in FY 2001. -
1999 2000 Reduce Class 2 rate as follows: FY 2000 - from $1.54 to $1.34 FY 2001 - from $1.34 to $1.15 FY 2002 - from $1.15 to $0.96
-$-$-$
13,100,00025,600,00038,100,000
Reduce Class 4 rate as follows: FY 2000 - from $2.15 to $2.05 FY 2001 - from $2.05 to $1.95 FY 2002 - from $1.95 to $1.85
-$-$-$
16,800,00033,500,00050,300,000
Reduce Class 5 rate as follows: FY 2000 - from $5.00 to $2.05 FY 2001 - from $2.05 to $1.95 FY 2002 - from $1.95 to $1.85
-$-$-$
4,100,000 4,300,000 4,400,000
2000 2000 Purchaser of tax sale property does not receive deeduntil Court judgment forecloses right of redemption. -
2002 2003 Created a new Class 3 for abandoned and vacantproperty, rate increased from $1.85 to $5.00. +$ 15,900,000

45
HISTORY OF MAJOR CHANGES IN D.C. TAX STRUCTURE – FISCAL YEAR 1970 – FISCAL YEAR 2002
REVENUE SOURCE
FISCAL YEAROF
ENACTMENT
FISCALYEAR
EFFECTIVE CHANGE
FULL YEARREVENUE EFFECT
AT TIME OFCHANGE 1/
Real Estate-continued 2002 2002 Return to annual assessment and instituting a 25percent cap on annual tax growth of residentialproperties. One triennial group shifts into annualassessment each year through FY 2004, beginning withtri-group I, tri-group II in FY 2003, and tri-group III inFY 2004. By FY 2004, all property in the District willonce again be reassessed on an annual basis. +$ 55,000,000
Public Utilities 1973 1973 Rate increased from 4% to 5%. +$ 3,000,0001976 1976 Rate increased from 5% to 6%. +$ 4,800,0001977 1977 Payment due with return August 1. -1983 1983 Rate increased from 6% to 6.7%. +$ 8,200,0001983 1984 Repealed estimated reporting and payment provisions. -1983 1984 Payment dates changed from annually on or before
August 1 to monthly by the 20t h day of each month. -1987 1987 Gross receipts tax imposed on all telecommunications
service providers.+$
20,000,0001989 1989 Gross receipts tax repealed on all telecommunications
service providers.-$
20,000,0001991 1991 Gross receipts tax rate increased, by temporary
legislation, from 6.7% to 9.7% (estimated revenueeffect is for three months). +$ 12,200,000
1992 1992 Gross receipts tax rate of 9.7% mad permanent (April1992). +$ 44,300,000
1992 1992 Expand public utility gross receipts tax to include cableTV, video, radio and other services (July 1992). +$ 4,200,000
1994 1994 Gross receipts rate increases to 10% (June 1994). +$ 3,900,0001994 1994 Expand gross receipts tax to heating oil (June 1994). +$ 1,800,0001997 1997 Tax base expanded to 3rd party providers of natural gas. +$ 800,0001998 1999 Tax base narrowed to exclude gross receipts tax
collected from consumers. -$ 14,000,0002002 2003 Rate increased from 10% to 11%. +$ 10,400,000
Toll Telecommunications 1989 1989 Effective March 3, 1989, toll telecommunications grosscharges subjected to a tax of 6.7%. This replaced thegross receipts tax on all telecommunication serviceproviders and also provided partial sales and personalproperty tax exemptions. +$ 20,000,000
1991 1991 Toll telecommunication gross charges tax rateincreased by temporary legislation, from 6.7% to 9.7%. +$ 2,500,000
1992 1992 Gross charges tax rate of 9.7% made permanent (April1992). +$ 10,000,000
1994 1994 Gross charges tax rate increases to 10% (June 1994). +$ 2,700,0001996 1997 Toll telecommunications tax base expanded to include
commercial mobile cellular service. +$ 4,800,0001998 1999 Toll telecommunications tax base for commercial
mobile cellular service changed.. -$ 500,0001998 1999 Tax base narrowed to exclude gross receipts tax
collected from consumers. -$ 5,000,0002002 2003 Rate increased from 10% to 11%. +$ 4,900,000
Deed Recordation and Transfer:Recordation 1976 1976 Rate increased from .5% to 1% of consideration. +$ 1,200,000
1978 1978 An excise tax is imposed on the transferrers ofresidential real property containing 4 or fewer dwellingunits at rates ranging from 3% to 97% of gain. -
1978 1982 Excise tax on transferrers of residential real propertyexpired. -

46
HISTORY OF MAJOR CHANGES IN D.C. TAX STRUCTURE – FISCAL YEAR 1970 – FISCAL YEAR 2002
REVENUE SOURCE
FISCAL YEAROF
ENACTMENT
FISCALYEAR
EFFECTIVE CHANGE
FULL YEARREVENUE EFFECT
AT TIME OFCHANGE 1/
Deed Recordation and Transfer-continuedRecordation 1980 1980 Tax base expanded to include construction loan deeds
of trust on mortgages permanent loan deeds of trust onmortgages and purchase mortgages. +$ 1,000,000
1989 1989 Rage increased from 1% to 1.1% of consideration. +$ 4,000,0001989 1990 Established recordation tax on transfers of economic
interests at the rate of 2.2%. +$ 5,500,0001994 1994 Expand recordation tax base to security interest (June
1994). +$ 1,800,0002002 2003 Rate increased from 1.1% to 1.5%. 7/ +$ 16,722,0002002 2003 15% of the District’s real estate recordation taxes will
be deposited in The Housing Production Trust Fund toprovide financial assistance for housing available tolow and moderate-income families and individuals. -$ 2,529,000
Transfer 1980 1980 A transfer tax is imposed on each transfer of realproperty at the rate of 1% of the consideration paid. +$ 12,000,000
1989 1989 Rate increased from 1% to 1.1% of consideration. +$ 3,300,0002000 2000 Clarifies that the transfer tax will be based on the sales
price of real property. -2002 2003 Rate increased from 1.1% to 1.5%. 7/ +$ 11,072,0002002 2003 15% of the District’s real estate recordation taxes will
be deposited in The Housing Production Trust Fund toprovide financial assistance for housing available tolow and moderate-income families and individuals. -$ 2,471,000
Sales and Use Tax 1970 1970 Rate of 5% imposed on all restaurant meals and salesof alcoholic beverages. +$ 3,400,000Rate of 2% applies to: Groceries-with a sales tax credit for residents earnings Below $6,000. Laundry and dry cleaning Non-prescription drugs
+$+$+$
1,300,0001,000,000
350,0001970 1970 Rate of 4% applies to:
Admissions to theaters and public events Repair of tangible personal property Duplicating, addressing and mailing services
+$+$+$
700,0002,200,000
800,0001972 1972 Rentals of linens added to base at 2%. +$ 125,0001973 1973 General rate increased from 4% to 5%. +$ 13,000,000
Transient accommodations sale of alcoholic beveragesand restaurant meals increased from 5% to 6%. +$ 2,800,000
1976 1976 Groceries, non-prescription drugs and laundry and drycleaning exempted. -$ 6,800,000Rental of linens increased from 2% to 5%. +$ 300,000Motor vehicle parking subject to tax at 8%. +$ 3,300,000Motor vehicle parking increased from 8% to 12%. +$ 1,600,000Transient accommodations, restaurant meals increasedfrom 6% to 8%. +$ 9,400,000
1980 1980 General rate increased from 5% to 6%. Sales of motorfuel subjected to general sales tax rate of 6%. Rate ontransit accommodations increased from 8% to 10%. +$ 29,000,000
1980 1980 Candy, confectionery, chewing gum and soft drinksales are taxable at 8%. Rental or leasing of rentalvehicles and utility trailers subject to 8% use tax. +$ 2,500,000
1981 1981 Sales tax on motor fuel sales repealed effective,December 1, 1990. -$ 13,000,000
1982 1982 Repeal of the blanket 8% tax on candy, confectionery,chewing gum and soft drinks. -$ 2,500,000
1984 1985 Sales tax rate on items sold in vending machinesincreased from 2% to 6%. +$ 1,000,000

47
HISTORY OF MAJOR CHANGES IN D.C. TAX STRUCTURE – FISCAL YEAR 1970 – FISCAL YEAR 2002
REVENUE SOURCE
FISCAL YEAROF
ENACTMENT
FISCALYEAR
EFFECTIVE CHANGE
FULL YEARREVENUE EFFECT
AT TIME OFCHANGE 1/
Sales and Use-continued 1987 1987 Exempt certain food items to maintain conformity tofederal food stamp laws. -Examine District of Columbia sales exemption statusorganization exempt under Internal Revenue Code501©(4). -
1989 1989 Established tax on real property services at the rate of6%. +$ 10,000,000
1989 1989 Established tax on data processing and informationservices at the rate of 6%. +$ 25,000,000
1989 1989 Established vendor credit of 1% of sales. -$ 1,600,0001989 1989 Restaurant meals and sales of alcoholic beverages
increased from 8% to 9%. +$ 11,000,0001989 1989 Transient accommodations increased from 10% to
11%. +$ 7,000,0001990 1990 Clarified tax on services not to apply to services
provided to affiliated companies. -$ 1,000,0001991 1991 Sales tax on residential utility services repealed by
temporary legislation. (estimated revenue effect is forthree months). -$ 3,900,000
1992 1992 Increase sales tax rate on off-sale alcoholic beveragesfrom 6% to 8% (June 1992). +$ 2,900,000
1992 1992 Expand 6% sales tax base to include launderingservices (July 1992). +$ 3,000,000
1992 1992 Make repeal of sales tax on residential servicespermanent (April 1992). -$ 15,700,000
1993 1993 Expand 6% sales tax base to include the following: Snack foods Selected telecommunications services All publications and newspapers
+$+$+$
2,700,0007,600,0002,700,000
1994 1994 Temporally increase general sales tax rate to 7% (June1994). +$ 10,800,000
1994 1994 Expand sales tax base to courier services (June 1994). +$ 2,000,0001994 1994 Expand sales tax base to employment services (June
1994). +$ 2,500,0001994 1995 Permanently reduce general sales tax rate to 5.75%
(October 1994). -$ 9,200,0001994 1995 Restaurant meals and alcohol for on premise
consumption increased from 9% to 10% with the 1%increase to finance the Convention Center (October1994). +$ 12,400,000
1994 1995 Hotel sales tax increased from 11% to 13% with 2.5%to finance the Convention Center (October 1994). +$ 10,960,000
1999 1999 Hotel sales tax increased from 13% to 14.5% toincrease funding for new Convention Center. However, general fund tax portion of hotel sales taxreduced from 10.2% to 10.05% (October 1999). 8/ -$ 4,000,000
1999 2000 Sales tax on Internet access eliminated. -2001 2001 Repeal the sales tax on snack foods. -$ 3,300,0002001 2001 Eliminates the 1% sales tax credit allowed to vendors
for timely filing their returns. -2001 2001 Sales tax holiday (10 days: August 3r d to August 12th. -$ 908,0002002 2003 Increased retail alcoholic beverage from 8% to 9%. +$ 1,350,000
Hotel Occupancy 1978 1978 Hotel occupancy tax of $0.80 per room per dayenacted. +$ 3,000,000
1982 1983 Rate increased to $1 per room per day. +$ 938,0001989 1989 Rate increased from $1.00 to $1.50 per room per day. +$ 3,000,0001999 1999 Repeal of hotel occupancy tax (October 1, 1998). 8/ -$ 5,400,000

48
HISTORY OF MAJOR CHANGES IN D.C. TAX STRUCTURE – FISCAL YEAR 1970 – FISCAL YEAR 2002
REVENUE SOURCE
FISCAL YEAROF
ENACTMENT
FISCALYEAR
EFFECTIVE CHANGE
FULL YEARREVENUE EFFECT
AT TIME OFCHANGE 1/
Special Programs: 1985 1985 District of Columbia Rental Housing Act of 1985. 9/ -1987 1987 Tax Amnesty Program (July1, 1987 – September 30,
1987). 10/ +$ 10,000,0001994 1994 One year public safety fee implementation +$ 34,000,0001994 1995 Arena fee, to finance a downtown sports arena. +$ 9,100,0001999 2000 Arena Fee rates changed as follows: +$ 3,000,000
CURRENT RATES NEW RATESDC Gross Arena fee DC Gross Arena FeeReceipts Rate Receipts Rate
$0-$200K $25 $2M - $3M $1,000$200K - $500K $50 $3M - $10M $3,300$500K - $1M $100 $10M - $15M $6,500$1M - $3M $825 Over $15M $11,000$3M - $10M $2,500$10M - $15M $5,000$15M & over $8,400
2001 2001 Arena Fee terminated in fiscal year 2001. -$ 12,000,000
1/ The revenue effects of each law change is mutually exclusive. 2/ The revenue effect of adding financial institutions to the corporation franchise tax base resulted in a revenue loss of $7.2 million annually by FY1985. The increase shown results from the mechanisms of phasing in the change. 3/ Increase tax change effective on a calendar year basis. 4/ Top bracket may be reduced as low an 8.0%, depending upon revenue and economic performance. 5/ Revenue impact represents increase in general fund (local) revenues. 6/ Estimate provided by Department of Public Works. 7/ For owner-occupied, property sold under $250,000, the rate will remain at 1.1%. 8/ Revenue effect reflects loss to general fund (local) revenues. 9/ Department of Finance and Revenue required to provide Tax Standing Evaluation Reports.10/ Amnesty from penalties and interest for all taxes except real property tax and unemployment compensation. Effective October 1, 1987, penalties and interest for all taxes except real property and unemployment compensation increases.

0
PART V – FILING AND PAYMENT DATES IN FY 2003

49
FILING AND PAYMENT DATESFY 2003
Alcoholic Beverage Tax
The tax is due by the 15th day of each month on the preceding month's sales.
Cigarette Tax
Payment is made by the purchase of stamps.
Estate Tax
Returns and tax are due 10 months after death of decedent. A District of Columbia Estate TaxReturn must be filed if a Federal Estate Tax Return is required to be filed. Generally, the amount ofthe tax is the credit for state death tax allowed on the federal return.
A penalty of 5% per month, but not more than 25% in the aggregate, of the tax due is imposed forthe failure to timely file the return or pay the tax. Interest is assessed on any tax not paid by the duedate at the rate of 1.5% per month.
Income Taxes:
Corporate and Unincorporated Business Franchise Taxes
Corporate returns are due and payment of the tax must be made on or before the 15th day of thethird month following the close of the taxable year. Unincorporated business franchise tax returnsare due and payment of tax must be made on or before the 15th day of the fourth month followingthe close of the taxable year. A penalty of 5%, but not more than 25% in the aggregate, is imposedfor failure to timely file returns. Interest is imposed for any tax not paid when due at the rate of 1.5%per month until the tax is paid.
Individual Income Tax
Calendar year returns are due on or before April 15 of the succeeding year while fiscal yearreturns are due on or before the 15th day of the fourth month following the close of the fiscal year.
The penalty for failure to file a return on time is 5% of the tax due, but not more than 25% in theaggregate. Interest is charged at the rate of 1.5% per month from the due date of the return to the datethe tax is paid.
The penalty for failure to file in a timely manner a declaration of estimated tax is 5% per monthof the estimated tax, but not more than 25% in the aggregate. Interest is imposed for failure to payany installment when due at the rate of 1.5% per month.

50
FILING AND PAYMENT DATES – Continued
Individual Income Tax – continued
The penalty for failure to file in a timely manner a declaration of estimated tax is 5% per monthof the estimated tax, but not more than 25% in the aggregate. Interest is imposed for failure to payany installment when due at the rate of 1.5% per month.
Employers must withhold District individual income taxes from employees who are subject to thetax. If such withholding is less than $50 per month, the employer must remit the tax by the last dayof the month following the close of the tax year; if withholding is $50 or more per month, it must beremitted on the 20th day of the following month.
The penalty for failure to file the withholding tax return or to pay the tax when due is 5% of thetax withheld during the reporting period, but not more than 25% in the aggregate. Interest is chargedfor late payment at the rate of 1.5% per month from the due date of the return to the date the tax ispaid.
Insurance Tax
If tax liability is less than $1,000, the tax must be paid before March 1 of the succeeding calendaryear. If tax liability is $1,000 or more, at least 50% of tax must be paid by June 1 of the calendaryear in which the taxable income is received. The remainder is due on or before March 1 followingthe close of the calendar year. A penalty of 8% per month of the tax due is charged for failure totimely pay the insurance tax.
Motor Vehicle Fuel Tax
Reports and tax are due on the 25th day of each month on the preceding month's sales ordispositions.
Motor Vehicle Registration Fee
Under the staggered motor vehicle registration system, motorists will pay their registration feesupon assumption of ownership of the vehicle or on an assigned day of the year.
Personal Property Tax
The return, accompanied by the tax payment, is due on or before July 31 of each year on thetangible personal property remaining cost (current value) as of July 1. A penalty of 5% per month,but not more than 25% in the aggregate, is imposed for failure to timely file returns. Interest at therate of 1.5% per month is charged until the tax is paid.

51
FILING AND PAYMENT DATES – Continued
Real Property Tax – continued
appeal such assessments before the Assessment Division. If the assessor and the property owner, orparty of interest, do not resolve a disputed value, the property owner may proceed to the Board ofReal Property Assessments and Appeals (BRPAA). BRPAA will not accept an appeal unless therehas first been an appeal to the Assessment Division.
The tax may be paid in full or in two equal installments. One-half the tax is payable on or beforeMarch 31 and the other half tax is due on or before September 15. A 10% penalty is imposed for latepayment of real estate tax bills. Interest at the rate of 1% per month is charged from the date the taxis due until the date the tax is paid.
Public Utility Tax
Returns are due on the 20th day of each month on the preceding month's gross receipt. A penaltyof 5% per month, but not more than 25% in the aggregate, is charged for failure to file return or paytaxes on time. Interest is charged at the rate of 1.5% per month until the tax is paid.
Recordation Tax
The deed recordation tax is due when the deed is recorded. Each deed must be accompanied bya return before it can be recorded. The penalty for failure to make and file a correct return is 5% permonth, but not more than 25% in the aggregate. Interest at the rate of ½ of one percent per monthis charged on any recordation tax not paid when due.
Real Property Transfer Tax
The transfer tax is due when the deed is recorded and each deed must be accompanied by atransfer tax return. A penalty of 4% of the tax due is imposed for failure to file the transfer tax return. Interest is charged at the rate of 1.25% per month.
Economic Interest Transfer
The economic interest transfer tax is triggered by two elements. These elements are 1) 80% of theassets of a corporation consist of real property located in the District of Columbia, and 2) more than50% of the controlling interest of the corporation is being transferred. If these two elements are metthen the tax rate is 3.0% of the consideration. The consideration is not always equal to the assessedvalue of the property. The consideration is what is paid for the interest being transferred. If thereis no tangible consideration, then the tax basis will be the assessed value of the property owned bythe corporation. The tax is due at the time of recordation.

52
FILING AND PAYMENT DATES – Continued
Sales and Use Taxes
Monthly returns and tax are due on the 20th day of each month following the reporting period. If the due date falls on Saturday, Sunday or a legal holiday, the return is due on the next businessday. To avoid a delinquency notice, a return must be filed even if no sales were made or no sales or usetax is due.
An annual return is due on or before January 20th. To avoid delinquency notices, a return mustbe filed even if no sales were made or no sales or use tax is due.
A penalty of 5% per month, but not more than 25% in the aggregate, is charged for failure to filesales and use tax returns or to pay sales and use taxes on time. Interest is charged at the rate of 1.5%per month until the tax is paid. There is a 20% penalty on any understatement of taxes due if the understatement exceeds either10% of the tax determined to be due or $2,000, whichever is the greater. (Understatement of taxesis the difference between the amount shown on the original or amended return and any greateramount of tax determined to be due as a result of an audit or review.)
Toll Telecommunications Tax
Returns and tax are due on the 20th day of each month on the preceding month's charges. Anannual return must be filed on or before 30 days after the end of the tax year.
A penalty of 5% per month, but not more than 25% in the aggregate, is charged for failure to filetax returns or to pay toll telecommunications taxes on time. Interest is charged at the rate of 1.5%per month until the tax is paid.

53
TABLE 8DISTRICT OF COLUMBIA
RETURNS FILED BY TAX TYPE2002
TAX RETURN VOLUME
Individual Income Tax 316,500 1/Franchise Taxes 57,554 1/Employer Withholding 363,986 1/2/Personal Property 17,515 1/Estate 473Sales and Use 150,720 1/2/Income Declarations 58,250 3/Franchise Declarations 21,041 3/Real Property 281,249 4/Arena Fee 1,342 1/Total Volume 1,268,630
1/ Returns filed annually.2/ Returns filed monthly. 3/ Returns filed quarterly.4/ Tax is due in two equal installments on or before March 31 and on or before September 15 of each year.

54
OFFICE LOCATIONS AND TELEPHONE NUMBERS
Government of the District of ColumbiaOffice of the Chief Financial Officer
The John A. Wilson Building1350 Pennsylvania Avenue, NW, Suite 203
Washington, DC 20004
Office hours: (Monday - Friday) 8:00 a.m. – 6:00 p.m.(202) 727-2476
Office of the Chief Financial OfficerNatwar M. Gandhi, Chief Financial OfficerLucille Dickinson, Chief of StaffJerry Malone, General CounselMaynard Gambrell, Chief Information OfficerJo Ann Smoak, Executive Director for Management and AdministrationClarice Nassif Ransom, Director of CommunicationsBen Lorigo, Executive Director for Integrity and Oversight
Office of Research and Analysis (202) 727-7775Julia Friedman, Deputy Chief Financial Officer441 4th Street, NW, Suite 400 South, Washington, DC 20001
Office of Budget and Planning (202) 727-6343Bert Molina, Deputy Chief Financial Officer1350 Pennsylvania Avenue, NW, Suite 229, Washington, DC 20004
Office of Finance and Treasury (202) 727-6055N. Anthony Calhoun, Deputy Chief Financial Officer441 4th Street, NW, Suite 360 North, Washington, DC 20001
Office of Financial Operations and Systems (202) 442-8200Anthony F. Pompa, Deputy Chief Financial Officer810 1st Street, NE, Suite 200, Washington, DC 20002
Office of Tax and Revenue (202) 442-6200Phil Brand, Deputy Chief Financial Officer941 North Capitol Street, NE, Suite 800, Washington, DC 20002
Economic Development and RegulationHenry W. Mosley, Associate Chief Financial Officer
Government Direction and OperationsBarbara D. Jumper, Associate Chief Financial Officer
Government ServicesPamela D. Graham, Associate Chief Financial Officer
Human Support ServicesDeloras A. Shepherd, Associate Chief Financial Officer
Public Safety and JusticeSteward Beckham, Associate Chief Financial Officer

Prepared by:
Government of the District of ColumbiaOffice of the Chief Financial Officer
Office of Research and Analysis441 4th Street, NWSuite 400 South
Washington, D.C. 20001(202) 727-7775 - Voice(202) 727-9459 - Fax
www.cfo.dc.gov


![3. 4 Allegany County, MD FY 2016 Proposed Tax Rates NO INCREASE IN RATES Income Tax Rate3.05% Real Property Tax Rate [Reduced 1/10 of $ 0.01]$0.9780 Recordation.](https://static.fdocuments.in/doc/165x107/56649f385503460f94c54c7d/3-4-allegany-county-md-fy-2016-proposed-tax-rates-no-increase-in-rates-income.jpg)