DC-EEG FOR ROUTINE CLINICAL USE: METHODS AND CLINICAL …
51
Helsinki University of Technology Applied Electronics Laboratory Series B: Research Reports B15 Teknillisen Korkeakoulun Sovelletun elektroniikan laboratorion, Sarja B: Tutkimusraportteja B15 Espoo 2006 DC-EEG FOR ROUTINE CLINICAL USE: METHODS AND CLINICAL IMPACT Pekka Tallgren Dissertation for the degree of Doctor of Science in Technology to be presented with due permission of the Department of Electrical Engineering, for public examination and debate in auditorium S4 at Helsinki University of Technology (Espoo, Finland) on the 15 th of December, 2006, at 12 o´clock noon. Helsinki University of Technology Department of Electrical and Communications Engineering Applied Electronics Laboratory Teknillinen korkeakoulu Sähkö- ja tietoliikennetekniikan osasto Sovelletun Elektroniikan laboratorio
Transcript of DC-EEG FOR ROUTINE CLINICAL USE: METHODS AND CLINICAL …
Helsinki University of Technology Applied Electronics Laboratory Series B: Research Reports B15 Teknillisen Korkeakoulun Sovelletun elektroniikan laboratorion, Sarja B: Tutkimusraportteja B15 Espoo 2006 DC-EEG FOR ROUTINE CLINICAL USE: METHODS AND CLINICAL IMPACT Pekka Tallgren Dissertation for the degree of Doctor of Science in Technology to be presented with due permission of the Department of Electrical Engineering, for public examination and debate in auditorium S4 at Helsinki University of Technology (Espoo, Finland) on the 15th of December, 2006, at 12 o´clock noon. Helsinki University of Technology Department of Electrical and Communications Engineering Applied Electronics Laboratory Teknillinen korkeakoulu Sähkö- ja tietoliikennetekniikan osasto Sovelletun Elektroniikan laboratorio

Distribution:
Helsinki University of Technology
Applied Electronics Laboratory
P.O.Box 3000
FIN-02015 HUT, Finland
Pekka Tallgren
ISBN 951-22-6955-4ISBN 951-22-6956-2 (PDF)ISSN 1456-1174 Otamedia Oy Espoo 2006

HELSINKI UNIVERSITY OF TECHNOLOGYP.O. BOX 1000, FI-02015 TKK
http://www.tkk.fi
ABSTRACT OF DOCTORAL DISSERTATION
Author
Name of the dissertation
Date of manuscript Date of the dissertation
Monograph Article dissertation (summary + original articles)
Department
Laboratory
Field of research
Opponent(s)
Supervisor
(Instructor)
Abstract
Keywords
ISBN (printed) ISSN (printed)
ISBN (pdf) ISSN (pdf)
ISBN (others) Number of pages
Publisher
Print distribution
The dissertation can be read at http://lib.tkk.fi/Diss/


TEKNILLINEN KORKEAKOULUPL 1000, 02015 TKK
http://www.tkk.fi
VÄITÖSKIRJAN TIIVISTELMÄ
Tekijä
Väitöskirjan nimi
Käsikirjoituksen jättämispäivämäärä Väitöstilaisuuden ajankohta
Monografia Yhdistelmäväitöskirja (yhteenveto + erillisartikkelit)
Osasto
Laboratorio
Tutkimusala
Vastaväittäjä(t)
Työn valvoja
(Työn ohjaaja)
Tiivistelmä
Asiasanat
ISBN (painettu) ISSN (painettu)
ISBN (pdf) ISSN (pdf)
ISBN (muut) Sivumäärä
Julkaisija
Painetun väitöskirjan jakelu
Luettavissa verkossa osoitteessa http://lib.tkk.fi/Diss/


Preface
This work has been carried out at the Department of Biological and Environmental Sciences, University of Helsinki, Finland. I am most grateful to professor Juha Voipio for his leadership during the past years and for supervising this thesis. I am most grateful to professor Kai Kaila for his support and for giving me the possibility to carry out this research. The research reported in this Thesis has been carried out as a team effort, and especially I want to thank Dr. Sampsa Vanhatalo for his contribution. I want to thank all my co-authors, and all the others who have spurred me forward in this seemingly never-ending work. I am grateful to the official pre-examiners of this thesis, professors Matti Weckström and Pekka Meriläinen, for their constructive comments. I am thankful for MeriHukka sailing team. I'm lucky having such a wonderful team. These sailors continuously show me that sailing is even better than making research . Many of the crew members during the years has come a very good personal friends to me. I am grateful to my wife Mai for patience. Looking after three daughters… I hope I will now owe more time to you Mai, Vilja, Heini and Elli.
Pekka Tallgren
Helsinki, 2006

Contents
Abstract (English)............................................................................................................ 3
Abstract (Finnish)............................................................................................................ 5
Preface.............................................................................................................................. 7
Contents ........................................................................................................................... 8
List of publications .......................................................................................................... 9
Author's contribution .................................................................................................... 10
Abbreviations ................................................................................................................. 11
The aims of the study..................................................................................................... 12
1. Introduction ............................................................................................................. 13 1.0 Clinical EEG: a Preface ............................................................................................................13 1.1 History of EEG..........................................................................................................................13 1.2 EEG frequency bands................................................................................................................14 1.3 EEG analysis .............................................................................................................................16 1.4 DC-EEG terminology................................................................................................................16 1.5 The origin of the EEG signal.....................................................................................................17 1.6 Magnetoencephalography .........................................................................................................18 1.7 Slow oscillation / standing potential recorded from the human scalp .......................................18 1.8 Slow oscillation (DC-potential) sources, intracranial studies ...................................................21 1.9 Blood-brain barrier: the forgotten factor ...................................................................................24
2. Methods.................................................................................................................... 24 2.0 DC-EEG hardware ....................................................................................................................24 2.1 DC-EEG data acquisition and software.....................................................................................29 2.2 Electrodes..................................................................................................................................30 2.3 Skin ...........................................................................................................................................34
3. Summary of publications......................................................................................... 38 3.1 P1: Hyperventilation induces a millivolt scale shift in DC-EEG ..............................................38 3.2 P2: Changes in brain haemodynamics causes DC-shifts...........................................................38 3.3 P3: Ag|AgCl electrodes are needed to record DC-EEG ............................................................39 3.4 P4: DC-stable electrode-skin interface for human EEG recordings..........................................39 3.5 P5: A novel type of slow EEG on preterm human infants ........................................................40 3.6 P6: Temporal lobe seizures are associated with negative DC-shifts .........................................40
4. Discussion ................................................................................................................ 41 4.0 True DC-EEG or long time constant AC-EEG? .......................................................................41 4.1 DC-EEG and skin as a source of artifacts .................................................................................41 4.2 Origin and interpretation of infraslow EEG signals ..................................................................42 4.3 Potential clinical applications of DC-EEG................................................................................43
5. Conclusion ............................................................................................................... 44
References ...................................................................................................................... 45

List of publications
This Thesis consists of an introduction and publications P1 to P6, which are presented in a non-chronological order. Papers P1-P2 introduce a novel non-neuronal mechanism of low-frequency EEG signal generation. The focus in P3-P4 is on electrodes and the electrode-skin interface, both of which play a critical role in reliable DC-coupled recording of EEG. Finally, P5 and P6 present results which suggest future applications of DC-EEG in clinical work.
P1 Voipio J, Tallgren P, Heinonen E, Vanhatalo S, Kaila K. Millivolt-scale DC shifts in the human scalp EEG: evidence for a non-neuronal generator. Journal of Neurophysiology, 2003, 89: 2208-2214.
P2 Vanhatalo S, Tallgren P, Becker C, Holmes MD, Miller JW, Voipio J, Kaila K. Scalp-recorded slow EEG responses generated in response to hemodynamic changes in the human brain. Clinical Neurophysiology, 2003, 114: 1744-1754.
P3 Tallgren P, Vanhatalo S, Kaila K, Voipio J. Evaluation of commercially available electrodes and gels for recording of slow EEG potentials. Clinical Neurophysiology, 2005, 116: 799-806.
P4 Tallgren P. DC-stable electrode-skin interface for human EEG recordings. HUT Applied Electronics laboratory series, 2005, E5: 3-12.
P5 Vanhatalo S, Tallgren P, Andersson S, Sainio K, Voipio J, Kaila K. DC-EEG discloses prominent, very slow activity patterns during sleep in preterm infants. Clinical Neurophysiology, 2002, 113:1822-1825.
P6 Vanhatalo S, Holmes MD, Tallgren P, Voipio J, Kaila K, Miller JW. Very slow EEG responses lateralize temporal lobe seizures: an evaluation of non-invasive DC-EEG. Neurology, 2003, 60:1098-1104.
Author's contribution
1. Equipment. DC-EEG hardware that was used throughout the study was designed and constructed by the author, making some use of earlier work carried out in this laboratory (Department of Biological and Environmental Sciences, University of Helsinki, Finland). The devices that were finally used in the clinics are a result of the authors’ extensive prototyping work that is not described in this thesis. The author also programmed all the software that was used for data acquisition and analysis, as well as responsible for the functionality and safety of equipment used with human subjects.
2. Experiments. The author has done most of the experiments that were carried out on healthy human volunteers at the Department of Biosciences (currently Department of Biological and Environmental Sciences), University of Helsinki, and participated in some of the experiments made by medical doctors on patients in a hospital environment. The author did all the experimental work that is presented in P3 and P4 and all multichannel recordings of P1. Throughout the study, all experimental strategies were discussed and designed as part of our team work. However, the author had a central role in designing the experiments in P3 and P4.
3. Writing. The author has contributed in the preparation of the manuscripts as follows: by writing sections of different versions of the manuscript and by preparing all the figures in P1; by writing sections to manuscripts and giving comments on different versions of the manuscripts in P2, P5 and P6; by writing P4 and making its figures; and by writing the first drafts of P3 and creating all its figures.
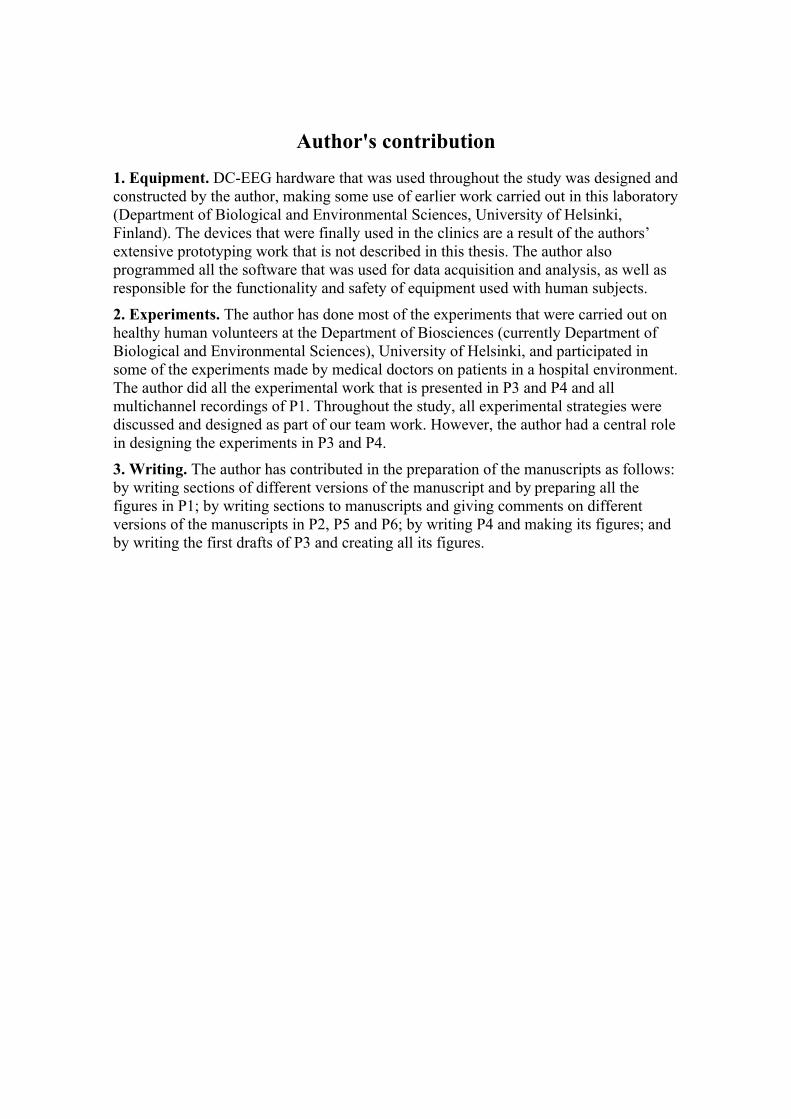
Abbreviations
AC alternating current AD analog/digital (conversion) Ag|AgCl silver|silverchloride BBB blood brain barrier CBF cerebral blood flow CBV cerebral blood volume CMRR common mode rejection ratio CNS central nervous system CNV contingent negative variation CO2 carbon dioxide CSF cerebrospinal fluid CSP cephalic skin potential CT computed tomography DAQ data acquisition card DC direct current DC-EEG direct current electroencephalography DMSO dimethylsulphoxide EEG electroencephalography EMG electromyography F Faraday constant (9.65×10⁵ C/mol) FFT Fast Fourier Transformation GSR galvanic skin response HP high pass; also Hewlet-Packard HV hyperventilation IC integrated circuit IQ intelligence quotient ISPO infraslow potential oscillation LF low frequency LP low pass MEG magnetoencephalography MRI magnetic resonance imaging NIRS near infrared spectroscopy PET positron emission tomography R gas constant, 8.31 J/(mol×K) R&D research and design r correlation coefficient SPECT single photon emission computed tomography SCP slowly changing potential or slow cortical potential SP steady potential or standing potential or stationary potential or
slow potential SPR skin potential response i.e. a change in potential T absolute temperature TL temporal lobe

The aims of the study
This study was carried out to shed light over the origin of infra-slow EEG phenomena and to develop a practical method that would allow a routine bedside recording of DC-EEG in a clinic. This work included construction of a multi-channel DC-EEG amplifier, designing the data acquisition and programming the software. Further, research work was done to characterize EEG electrodes and gels as well as to develop a method to short circuit skin originated signals. Finally, the applicability of the methods as well as the potential diagnostic value of DC-EEG was demonstrated.
13
1. Introduction
1.0 Clinical EEG: a Preface Electroencephalography (EEG) is a common clinical method that is carried out to assess e.g. epilepsy or brain damage. It is also used to study basic neurological functions or to carry out experiments in psychology in order to study phenomena like contingent negative variation (CNV), bereichtschaftspotential and other event-related potentials. The EEG data are measured by electrodes positioned typically according to the international 10-20 method (Jasper, 1958), amplified and presented on a computer screen or paper. In the clinic, interpretation of the traces is still today often based on visual inspection by experienced neurologists.
In clinical EEG, electrodes are held in place by an electrode hat or mesh. Electrodes are usually of tin, silver or gold plated silver. Preparing a patient for EEG recording is simple: the skin is wiped with alcohol, the electrode hat is put on the scalp and electrode gel is added. This method is fast and easy to perform and is well-suited for clinical use. Due to electrode-skin interface instability, conventional EEG amplifiers have a passband filter with cut-off frequencies of around 0.5 and 60 Hz. In earlier decades, the amplifiers were alternating current (AC) coupled due to instable components. Nowadays, the amplifier can be designed to be direct current (DC) stable and to accept high offset voltages, both being prerequisites for DC-EEG.
The results that will be presented later in this thesis clearly demonstrate that relevant information is not confined to the above mentioned bandwidth only, but exists also at lower (and higher; see Curio, 2005) frequencies. The origin of these low frequency signals has been an enigmatic question. In light of the prevailing view according to which slow frequency oscillations are generated directly by neuronal activity (Caspers et al, 1984), it is interesting to note that several earlier studies (references given in sections 1.7-1.8 below) have demonstrated a pH sensitive DC-voltage across the blood-brain barrier. This suggests that ignoring non-neuronal mechanisms as potential sources of slow EEG activity may lead to misinterpretations when analyzing DC-EEG data.
1.1 History of EEG The spontaneous electrical activity of the brain (on cats, rabbits and monkeys) was discovered in 1875 by Richard Caton (1875). At that time, galvanometers were used to measure these tiny currents. Caton was looking for a light induced response from the cortex and to his delight, he found it. He also found something unexpected, the "waxing and vaning" of current in the absence of stimulations (reviewed in Brazier, 1963). This was the discovery of electroencephalogram (EEG). Caton proved that the fluctuations were unrelated to respiratory or cardiac rhythm, but were biologic in origin. This was due to the fact that they were vulnerable to anaesthesia and anoxia, as well as abolished in death. Caton's work received no immediate attention among English-speaking physiologists (Brazier, 1992).
Fifteen years later (independent of Caton's work) Pole Adolf Beck was looking for the electrical responses in the cortex, induced by stimulation of the sense organs. Like
14
Caton, Beck found responses, and published his research in his doctoral thesis in 1890. According to later reviews (e.g. Brazier, 1963) his doctoral thesis was scientifically impressive. He describes the existence of a standing DC potential (between rostral and caudal parts of the nerves), the blocking off EEG by afferent stimulation, the localized change of EEG evoked by specific sensory stimuli, and the effect of anesthesia on these.
The early work of Caton and Beck were carried out on animals. Hans Berger was the first to publish a report on human EEG in 1929. Berger wrote a total of 14 articles and reports on e.g. polygraphic and evoked responses (1930), merits of unipolar and bipolar recordings (1935), frequency analysis (1936) and 50 Hz mains interference (1937).
In the early days of the EEG, no other hardcopy was available but those made with regular handwriting. In 1930, galvanometers were replaced by tube amplifiers, which required AC-coupling due to their lacking stability and narrow linear range. At that same time, hardcopy facilities become available. First, by the photographing of oscilloscope screens, and later on in 1940, pen-writers became available. The differential amplifier was also invented, which eliminated much of the noise from external sources that appeared as a common mode signal. In the 1950's, the introduction of chopper-stabilized amplifiers provided a technology for DC-recordings. Due to the lack of stable electrodes and the need to manually cancel offset voltages the method never became popular (Cooper, 1980).
1.2 EEG frequency bands The EEG signal can be measured from the scalp, from the brain surface or by depth electrodes from brain tissue. Throughout this study, “EEG” refers to the scalp measured EEG, which has amplitudes that are lower than observed with invasive methods: with the conventional bandwidth (0.5…60 Hz) amplitudes recorded from the scalp are in the order of <200 µV. Most of the time the EEG signal fluctuates randomly and no general pattern can be observed. However, at other times distinct oscillations are present, which have been assigned to different cognitive states, or specific abnormalities of the brain. Due to such characteristics, the oscillating EEG signal is classified according to the dominant frequencies present.

15
Fig. 1. Different EEG oscillation rhythms. (Adapted from Clark, J. (Jr), 1978.)
The frequency division into subgroups is not strict. Frequency ranges (see e.g. Niedermayer, 1998) given at different references differ a bit. What remains more essential is the reactivity of the wave which helps to classify it. Classification makes use of Greek letters but the frequency bands are not in alphabetical order, but rather, in the order of their discovery. At first, alpha and beta rhythms were found, and named by Berger in 1929. Jasper and Andrews followed in 1938 by naming higher frequency beta rhythms as "gamma" rhythms. The delta rhythm was named by Walter (1936) to cover all frequencies below the alpha rhythms. Later, he renamed the oscillations in 4-7 Hz range as theta rhythms. Alpha waves occur at frequencies of 8 to 13 Hz. Alpha activity is prominent in the occipital region (back of the head) when a person is relaxed with eyes closed. Alpha activity diminishes if the eyes are open. Beta waves occur at frequencies of 14 to 30 Hz. Beta activity is commonly seen in the frontal and central regions of the brain. Beta waves often appear when the nervous system is active, i.e. during mental activity and sensory input. Theta waves occur at frequencies of 4 to 7 Hz. During sleep, these waves are usually more prominent in the temporal areas of the brain. Theta waves may appear during emotional stress. Delta waves are slow waves and refer to any wave with a frequency of around 0.1 to 4 Hz. Delta waves occur during sleep but are often considered pathological when observed in a normal awake adult. Gamma waves are frequencies around 40 (30-90) Hz and they may be present during “random” or “desynchronised” EEGs. Gamma waves are very localized and associated with (demanding) cognitive tasks (Singer, 2001). According to current opinion, the highest frequencies present at scalp are ~1 kHz (Curio, 2005).

16
name frequency [Hz]
region state
alpha 8…13 occipital relaxed, eyes closed beta 14…30 frontal, central mental activity, sensory input
gamma 30-90 e.g hippocampus,
auditory, frontal cortex demanding cognitive tasks, “awareness”
delta
0.1-4 during sleep, in infancy, brain diseases
theta
4-7 in children parietal & temporal
during emotional stress; disappointment & frustration
Table 1.
The scalp recorded EEG may also contain signals from muscle activity (electromyography, EMG). The spectrum of the EEG and the EMG overlap (Goncharova et al, 2003; Freeman et al, 2003) but at higher frequencies (>30Hz), at least during anesthesia, the EMG dominates (Viertiö-Oja et al, 2004). Skin is the major source of low frequency (<0.5Hz) signal, see chapter 2.3.
1.3 EEG analysis EEG signal analysis is still today based on visual inspection by experienced neurologists who may make use of analyzing tools. For example, one such analyzing tool is the Fast Fourier Transformation (FFT) that is used to convert time domain signals into frequency domain. Another important area of signal processing is information obtained by “inverse” solution, i.e. locating the EEG current source by analyzing the EEG data (e.g., Berg and Scherg, 1994). This method is commonly used to locate epileptic brain areas. One more example is the so-called bispectral analysis that estimates the degree of phase coupling between the components of a signal (Sigl and Chamoun, 1994). And further, entropy algorithm is used to estimate the depth of anesthesia (Viertiö-Oja et al, 2004). However, the analyzing methods do not belong to the area of this thesis. For references of common analysis methods see e.g. Da Silva (2005).
1.4 DC-EEG terminology Different researchers have used varying terminologies to describe phenomena observed at frequencies below the lower limit of conventional EEG. One unequivocal definition was proposed by Sano in 1968 (see Manaka and Sano, 1979). EEG is a signal in the frequency range of 0.5 Hz upward. At lower frequencies the signal consists of standing potential (SP) and slow changes of it are named slowly changing potentials (SCP). The term "DC-EEG" refers to both standing potential and slowly changing potential, i.e. DC-EEG = SP+SCP. However, DC-EEG is also called (imprecisely) "steady-potential" (Manaka and Sano, 1979). In the decades thereafter, changes in standing potential is often replaced by the term “DC potential shifts” (Caspers et al, 1984; Birbaumer et al,

17
1990) to emphasize the need of a DC-coupled amplifier. Recently is proposed the term FbEEG (Vanhatalo et al, 2005) that covers the “full physiologically and clinically relevant EEG bandwidth”, i.e. it starts from 0 Hz and extends to the highest EEG frequencies that can be detected (see Curio, 2005). The use of abbreviations is also varying: "SP" can be "standing potential" or "slow potential" or "steady-potential" or "stationary potential". SCP as well, is either "slowly changing potential" or "slow cortical potential" (Birbaumer et al, 1990). In this thesis, the term "DC-EEG" is used in the meaning of slow changes in EEG potential.
To measure absolute DC-level accurately, an arrangement is required in which electrode potentials can be measured (periodically) face-to-face to offset electrode potentials. Such a method is presented by Girton and Kamiya (1974) and Bauer et al (1989). In the studies presented in this thesis absolute DC-level was not aimed to detect, even though it was measured with some accuracy.
1.5 The origin of the EEG signal Nerve cells have a membrane potential of around -60 to -70 mV (inside negative), and the signals they generate can be divided into two categories. Action potentials are fast (<=1 ms), regenerative all-or-none signals that travel along axons and thereby mediate fast long-range data transmission, but they play only a minor role in the generation of EEG signal. Postsynaptic potentials and currents, however, are generated in dendrites, which are the input structures in a neuron. The laminar organization of cortical neurons, and the intracellular spread of postsynaptic (apical dendritic) currents towards cell bodies, together give rise to extracellular return currents that add up to form significant volume currents. EEG is mainly generated by these volume currents in the resistive extracellular space, while magnetoencephalography (MEG) is mainly considered to monitor magnetic fields associated with these synaptic volume currents.
The prevailing view of the origin of the DC-EEG shifts is given in e.g. Speckmann and Elger, (2005); Caspers et al (1984) and Speckmann et al, (1984). DC shifts reflect extracellular currents that may originate either from neuronal synaptic activity or glial cell potentials. Glial cell potential is highly dependent on extracellular potassium concentration and thus potential gradients may build up along the glial cell syncytium (Kofuji et al, 2004).
Fig. 2 DC-shift correlates to discharge rate. (Adapted from Speckmann and Elger, 2005.)
18
1.6 Magnetoencephalography Magnetoencephalography is a method that measures magnetic fields generated by currents induced by electrical activity in the brain. Due to the orthogonality of electrical and magnetic fields, the method detects best the currents that are parallel to the scalp, while the EEG is most sensitive to currents that are orthogonal to the scalp. The cortex is folded forming fissures with dipole layers, orthogonal to the surface so that both MEG and EEG signals can be measured outside of the brain. Similarities in data are to be expected. MEG has some advantages over EEG. The EEG signal is distorted (smeared) in its way from the brain to the scalp, and it needs an “electrically inactive” reference electrode. The MEG however, is a reference free method and the skull and other extra-cerebral tissues are transparent for low frequency magnetic fields. On the other hand, a uniformly distributed current density does not generate an external magnetic field and, correspondingly, MEG is sensitive only to spatial gradients in the volume current. The inverse method (of the current source) is easier to calculate from MEG – it is sufficient to use a model consisting of the brain only, while EEG calculations require a full multicompartment model of the brain, skull, cerebrospinal fluid and scalp with known properties (Hari, 2005). However, Malmivuo (2004) comes to the conclusion that the spatial resolution of EEG is better than that of the MEG. With regards to the topic of this thesis, it is worth pointing out that DC-MEG, i.e. detection of standing and infra-slow magnetic fields generated by currents within the brain is not technically feasible. The MEG devices are special instruments requiring e.g. magnetically shielded rooms and liquid helium cooling, while EEG and DC-EEG amplifiers are compact and reasonably priced. As a conclusion, if information with similar value can be obtained either by EEG or by MEG the information is usually much more easily obtained with EEG.
1.7 Slow oscillation / standing potential recorded from the human scalp Neuronal currents are likely to play some role in the generation of slow DC-EEG signals. However, they can not explain slow shifts with amplitudes in the millivolt range at the scalp. Therefore, studies suggesting other possible signal sources are worth a brief overview.
Aladjalova (1964) intensively studied infraslow potential oscillations (ISPO). She did a lot of invasive studies on animals with microelectrodes and nearly always either found or could induce ISPOs. She recorded ISPOs also from the human scalp. According to her results ISPOs are not linked to cerebral haemodynamics. ISPOs are characteristic of a wakeful animal. Narcosis inhibits ISPOs, while ISPOs are intensified by activating cortical metabolism. Defense reaction and stress intensifies the ISPOs.
Cowen (1967a,b) used a wide range of manipulations and stimuli (taste, smell, sound, touch, swallowing, tilt, changes in respiration, etc.) to affect the psychophysiological state in 80 normal men. He found potential shifts in the range of 10 to 25 mV and they were assumed to be generated by a neuronal source. In light of the methods used (no skin-preparation was done) and the huge amplitude of the signals compared to those observed in later studies e.g., <60 µV associated with sweet and bitter tastes (Schmitt et

19
al., 2000), it is likely that the recorded signals originated mainly from the skin, i.e. they were mainly due to the galvanic skin response (GSR; see chapter 2.3.2).
Girton et al (1973) observed very slow potential oscillation in humans. The oscillation, that was 50-75 µV in amplitude and had a frequency of less than 10 cycles/minute, was often synchronized to breathing. This continued even when breathing was interrupted. Out of their 15 subjects, 11 generated such oscillations within a 1 hour recording session, but some showed only a few cycles during the session. Sometimes oscillations occurred frequently, and sometimes they could not be seen. Girton and co-workers could not explain the mechanism behind oscillations but suggested that they are neural in origin or reflect neural activity, operate fairly independently of the respiratory centers and, under certain conditions, will synchronize with respiratory centers (or vice versa). Girton and co-workers also refereed to other studies in which oscillations in physiological variables, like cerebral blood flow (Naumenko and Benua, 1970) and systemic blood pressure (Dornhurst et al, 1952) have been found to be a direct result of breathing. The results of Girton et al. (1973) as well as of Aladjalova (1964) are early demonstrations of EEG frequency components that fall below the conventional high-pass cut-off frequency of 0.5 Hz and are of unknown origin.
Fuchinoue et al (1974) measured standing potential gradients in head-injured patients. Local positive potential change was usually seen (around 10 mV) with mild cortical compression and with sub-cortical lesions. Local negative potential change occurred in almost all cases of cortical damage. Changes in standing potential were recorded with different types of brain damage, but the polarity of the voltage gradient was varied.
Caspers et al (1987) reviewed the early invasive observations that focal epileptic activity produced slow potential changes. DC shifts coincided with convulsive discharges, and the negative shift of DC baseline coincided with sustained depolarization of glial cells. In addition, there were a close correlation between DC-shifts and changes in interstitial potassium concentration [K+
o] during seizure activity. Caspers et al also reiterated that changes in the partial pressure of CO2 (pCO2) and/or pH markedly changed the DC-potential. It was found too, that intracranial pressure was related to DC-responses, thus suggesting the possibility of a "generator structure other than neurons." Although this study did not provide sufficient mechanistic data, it clearly pointed out that the possible contribution of non-neuronal sources should not be excluded without careful consideration.
Radilová et al (1987) recorded DC potential shifts during repeated, fixed interval, visual stimulus in humans. Subjects were asked to press one of the two buttons presented, depending on the figure shown. In all subjects (7/7) at least in some of the FPz, Cz, Pz and Oz (referenced to mastoid) a more or less linear DC-potential shift developed gradually before stimulus onset. The mean amplitude of the negative shift was 11 µV with a mean duration of 2.5 s. This has been used as an argument to support the glial cell origin of DC shifts. Even if this is of reasonable amplitude to be generated by neuronal activity or glial responses, one should remember that, as shown in study P1 of this thesis, even minor changes in breath rate may induce effects on the DC potential of the same order.
Rockstroh (1990) studied the effect of the anticonvulsant drug clonazepam (used in the treatment of seizure disorders; a member of a class of benzodiazepines) towards potential shifts induced by 3-minute hyperventilation (HV). Clonazepam reduced the

20
amplitude of the DC shift and changed the spectrum of the EEG signal. This correlation was speculated as possibly indicating a causal link and, therefore, the DC shifts were assumed to have a neuronal origin. Compared to the large inter-individual, but small intra-individual variability presented in this thesis (see P1) it is worth to point out that the effect of clonazepam was not studied within individuals but by using two groups of subjects. Another important point to note is that the mean amplitude of the hyperventilation-induced DC-shifts was only 36 µV – 10-50 times less what we observed in study P1. It is likely that the hyperventilation did not induce a prompt hypocapnia. Unfortunately, end-tidal CO2 that would have indicated the effectiveness of hyperventilation, was not measured.
Birbaumer et al (1990) review the current, neuronal-originating view of slow potential changes in psychological studies. The so called orienting response is a negative wave that decreases while habituating into the stimulus. According to the review, task relevant stimuli evoke slow positive going waves. If voluntary movement of the index finger is required, a negative signal will be seen 500-800 ms before the onset of motor activity. This kind of a signal is called Bereitschaftspotential. Contingent Negative Variation is the negativity recorded during the interstimulus period in a two-pulse stimulus test (Walter et al, 1964). In their review, Birbaumer et al assign the origin of all these phenomena to the cortex because of "the capacity of the cortex to activate large layers of dipoles synchronously". In light of the results of the present study, the small amplitude (~20µV) of the signals makes the signals subject to contaminants from non-neuronal generators. In future work, it is important to monitor breathing rate/depth in these kinds of studies to exclude the possibility that the observed slow potentials are not due to the changes in pH.
Trimmel et al (1990) studied the occurrence of infraslow (0.1-0.17 Hz) potential (>50 µVpp) oscillation in relation to the task, the ability to concentrate (Konzentrations-Leistungs-Test, Düker and Lienert, 1959) and for intelligence. Thirty-six percent of the subjects were found to generate infra-slow oscillations. In subjects with a high ability to concentrate, the occurrence of infraslow oscillations did not differ when listening or resting. However, subjects with a low ability of concentrating had infraslow oscillation only when listening. Infraslow oscillations were found to be subject-specific. Some people generated them, while others did not. It was not possible to find a method to evoke the infraslow oscillations. Subjects having stable infraslow oscillation were found to have a higher Intelligence Quotient (I.Q.) compared to subjects without infraslow oscillations. However, the ability to concentrate was not related to intelligence.
Marshall et al (1994) reported a DC-potential shift upon the transition of a person from being awake to sleep. A -500…-800 µV shift was observed when the subject fell asleep. The measuring electrode was at vertex (Cz) and it was referenced to mastoids. Marshall et al explained the shifts by associating them with membrane depolarizations lowering the excitability threshold. They also speculated about the effect of changes in blood gas tension, but assumed that this effect played a minor role. Somewhat surprisingly, they did not speculate about changes in cerebral blood flow, which had been shown to take place during transition from wakefulness to sleep (see below Wurtz, 1967; Wurtz and O’Flaherty, 1967).
Tomita-Gotoh and Hayashida (1996) studied the relation of DC-potential to end-tidal pCO2 during hyperventilation, hypoventilation or while inhaling 4% or 6% CO2 air

21
during the same procedures. DC potentials were measured at Cz against linked earlobes. Hyperventilation induced a prompt negative DC-shift while hyperventilation like breathing of 6% CO2 air did not induce a clear effect. A positive shift was recorded when hypoventilating 6% CO2 air. The results they obtained were in line with P1, even though they did "not abrade the skin to avoid injury potential". However, they reported that, "conducting paste was rubbed to the skin". The small electrode impedance they obtained, together with their results, suggests that eventually the skin may have been partly or even sufficiently short-circuited. However, the possibility of contamination by skin-borne signals can not be fully excluded.
1.8 Slow oscillation (DC-potential) sources, intracranial studies Invasive studies are an important source of information that can be used when interpreting findings made from the scalp. It is often the best method for verification of a theory that is proposed on the basis of findings from scalp EEG-studies. Most of the invasive studies have been made on animals, but there were some on humans, as well. Many of these studies support the idea that the blood-brain barrier acts as the source of large-amplitude DC potentials observed on the scalp.
Tschirgi and Taylor (1958) found in animal studies that the potential difference between the central nervous system and blood was -1…-5 mV and it correlated directly with the depth of anesthesia, changing to positive polarity when the depth of anesthesia increased. If the animal was artificially ventilated, the potential difference was usually more negative, and anesthesia had no effect on CNS potential. They could not find a correlation between cerebrospinal fluid pressure and the potential. Furthermore, they studied the effect of respiratory gases on the potential difference. Without exception, increasing CO2 concentration shifted CNS potential to a positive direction in artificially ventilated curarized animals. A gas mixture change from 100 O2 to 80% O2+20% CO2 shifted the potential from –7 mV to –2.5 mV in about 5 minutes. A plot of potential difference versus stepwise increases of CO2 indicated a monotonic dependence until cardiac failure, which led to a voltage step to a value much more negative than ever in the normal situation.
Held et al (1964) found that in dogs and goats cerebrospinal fluid (CSF) is normally 2-7 mV positive with respect to blood plasma. This is not consistent with the findings of Tschirgi and Taylor (1958) described above, and they suggested a likely methodological explanation for the difference. Tschirgi and Taylor used 0.9% NaCl-bridge to make the electrode-tissue connections, while Held et al used 3 M KCl in 2.5% agar. The difference might be explained by different Cl- concentrations in CSF and blood; also because unequal mobility of sodium and chloride gives asymmetrical diffusion potentials. Held et al also found a linear pH dependence of the blood-brain barrier (BBB) voltage that was different if the pH-change was due to respiratory or metabolic acidosis/alcalosis. They concluded that the voltage depended on H+ rather than on CO2 concentration, and that the CSF potential was not associated with the rate of formation of CSF (nor with ion transport from capillaries to glial elements). More probably, the potential difference was derived from ion transport across the ependymal linings of the ventricular system.
22
Wurtz (1967) recorded the potential between CSF and venous blood during sleep and wakefulness, its dependence on brain temperature, blood pressure and potential across ependyma in cats. The temperature could account for the steady potential, but even fluctuating temperature was not found to be associated with changes in steady potential (SP). However, voltage shifts recorded between the CSF and blood, and between the surface of brain and bone were of the same polarity and amplitude. The conclusion was that no voltage was generated across ependymal lining. Neither was the blood pressure related to variations in SP. Wurtz suggested that changes in SP could reflect changes in blood flow, and that both the membrane potential of glial cells and the blood-brain barrier contributed to the generation of SP.
Wurtz and O'Flaherty (1967) recorded alveolar CO2 and DC-potential shifts from the cortex and subcortical layers during sleep/wakefulness-cycle in cats and dogs. CO2 was found to vary consistently with changes in standing potential. They also noticed that a raise in alveolar CO2 concentration produced a positive SP shift. They suggested that changes in CO2 contributed to SP shifts but concluded that CO2 was not primarily responsible (due to the observed latency) for the SP changes during sleep-wakefulness cycle.
Cowen et al (1967) recorded the transcephalic DC potential invasively. They compared potentials recorded from the brain, skull and scalp of cats and rabbits. Reference was intraoral. They induced DC shifts with chemical injections (e.g. histamine, serotonine, heparin) to the left common carotid artery. The shifts were found to be of different polarity in the skull and cortex, but the same in the cortex and scalp. They suggested that DC-potentials are coupled via emissary veins from the cortex to the scalp and considered the cortex to be the main generator of the DC-shifts.
Cowen and Ross (1967) found that the standing potential in the frontal area of the scalp shifts to a positive direction when the depth of anesthesia deepens. Pain caused a negative shift. Intracarotid injections of histamine or a histamine releaser produced a negative frontal shift while heparin, serotonin and nembutal produced positive shifts. Experiments were done on cats, rabbits and rats. In the discussion, they reiterated, that many paradoxical results are due to the fact that no part of the body is inert electrically, and the position of the reference electrode may lead to a contradictory result from the same active site.
Woody et al (1970) found induced brain potential shifts of a different polarity in cats and monkeys compared to previous studies on rats, rabbits, goats and dogs. However, the difference can be accounted for by different mechanisms underlying the potential shifts. They suggest that the positive shift during respiratory acidosis is associated with the H+ gradient across the blood-brain-barrier, while the negative shift would be closely related to the blood flow. They also found that the DC potential was unaffected after a marked change in neuronal activity, which strongly supports the non-neuronal origin of the shifts. Furthermore, the polarity of CO2 induced DC shifts changed following mild hypoxia or manipulation of intracranial pressure in a manner that was accounted for by altered changes in blood flow and pH. Woody and co-workers concluded that the potential shifts were generated by the blood-brain barrier.
Besson et al (1968; 1970) discovered in cats that an increase in cerebral blood flow is associated with a DC-potential shift to a negative direction. They used inhalation of CO2
and drugs that alter the blood flow in a predictable fashion. They concluded that

23
changes in cerebral blood flow rather than alterations in neuronal activity, are principally involved in the DC-shifts seen during sleep, arousal and administration of certain drugs.
Loeschcke (1970) presented a summary of all earlier studies on DC potentials between CSF and blood. He also added data to previous findings on the difference in pH dependence seen during respiratory or metabolic acidosis. He injected HCl intravenously to mimic metabolic acidosis and NaHCO3 to mimic metabolic alkalosis. Together with responses induced by inhalation of CO2, the data suggested an explicit dependence of potential on plasma bicarbonate concentration. The existence of a voltage gradient (~15 mV) between blood and the CSF was not questioned but the exact identity of the voltage source remained unknown.
Messeter and Siesjö (1971) measured the DC potential between cerebrospinal fluid and blood during prolonged respiratory acidosis. Anesthesised rats were exposed to 5% or 11% CO2 for 3 to 48 hours. The recorded potential varied linearly with the plasma pH with a slope of about –27 mV/pH unit. The potential difference did not deviate significantly in sustained and acute acidosis, i.e. potential difference remained as long as acidosis remained.
Sorensen et al (1978) measured the potential difference between CSF and blood in a unanesthetized man. The potential difference ranged (N=13) from 1 to 5 mV, CSF being more positive. The voltage change against arterial pH was found to be –4.16 mV/pH. As a potential application for this method, they suggested that it could be relevant to an adaptation to high altitudes, detect chronic respiratory insufficiency or other disturbances in the acid-base balance.
Manaka and Sano (1979) measured the stationary potential in different animal species and found the potential to vary from +7.6 mV (rat) to +14 mV (monkey) between the brain and tongue. They also found a strong correlation between brain extracellular potassium and SP change. Because extracellular potassium is directly correlated to neuronal activity, they strongly argued for the idea that neurons are the essential component responsible for the generation of SP shifts.
In their review, Caspers et al (1984) describe the neuronal mechanism of the generation of field potentials. The potential fluctuations measured from the scalp have their origin in the extracellular return currents. Most of the EEG signal must reflect field potentials from the upper layers of the cortex because signals deeper from the brain attenuate heavily before reaching the scalp. According to the review, there is evidence that DC shifts are derived across the blood-brain barrier, but neuronal membrane potential correlate with DC-shifts, too. Therefore different generator structures may be involved in producing the shifts.
Lehmenkühler et al (1999) affected to the standing potential in artificially ventilated anaesthetized rats by inducing hypoxia or hypercapnia. They found that the potential shifts were of the same polarity in the skull and the scalp, but of different polarity in the cortex. The reference electrode was at the skin of the nose, which may account for the reversal of responses recorded from the cortex (see Discussion in P1). They concluded that DC shifts do not always reflect a change in neuronal activation.
Taken together, several studies have detected EEG activity below 0.5 Hz or demonstrated non-neuronal potential generators within the brain. However, the

24
interpretation of these signals in terms of concepts used in psychology, neurobiology or neurology, have remained quite unclear. It is also evident that the results of early invasive studies should have been considered more carefully in the interpretation of data of many later noninvasive studies in which slow EEG shifts have been assumed to result from purely neuronal sources. Further, these early studies are also interesting when considering the differences of EEG and MEG at low frequencies. The geometry of synaptic current loops underlying “traditional” EEG or MEG signals is, of course, not similar for currents generated by the blood-brain barrier. Therefore, the information that can be obtained from analyzing the lowest MEG and EEG frequencies may turn out to differ significantly.
1.9 Blood-brain barrier: the forgotten factor The view of origin of slow EEG oscillations that was prevailing at the time when the original papers of this thesis were published has limited ability to explain the huge observed amplitudes of slow shifts and oscillations. In this view, neuronal activity correlates with synaptic current loops and glial cell potential (Caspers et al, 1984; Speckmann et al, 1984) that together produce DC level shifts. This type of a DC deflection may be assumed to have amplitude of a few hundred microvolts at highest. On the other hand, slow EEG shifts in the mV-range were observed in e.g. P1. Further, the electrical potential difference over the blood-brain barrier is around 1…15 mV and it is highly sensitive to pH changes (Messeter and Siesjö, 1971; Sorensen et al, 1978).
Based on this study and the earlier work, the blood-brain barrier potential should be considered as a major source of slow EEG signals. Blood-brain barrier potential is highly dependent on pH gradient as well as cerebral blood flow. This does not exclude the possibility that neuronal sources contribute to DC shifts. In this thesis, "neuronal" means extracellular volume currents or any other currents that are directly generated by nerves/glial cells and produce intracortical voltage gradients. "Non-neuronal" refers to any other mechanisms that can generate voltage signals, such as the blood-brain barrier. Considered this way, DC-shifts may reflect neuronal activity, even when the generator is non-neuronal. A problem related to the experimental approach is how to separate the contribution of different generators when they are closely coupled to. pH and CBF modify both neuronal activity (Kaila and Ransom, 1998) and the voltage gradient across the blood-brain barrier (Woody et al, 1970). Therefore, distinguishing the contribution of each is difficult, if even possible.
2. Methods
An overview of relevant aspects of the DC-EEG amplifier (see also Bauer et al 1989), electrodes, skin contact and data processing are given in this chapter.
2.0 DC-EEG hardware To record DC-EEG safely and successfully, the amplifier must meet the specifications given below.
25
The device must meet the requirements given in electrical standards for medical devices (IEC 60601-1) at class BF. The standard requires that the patient connection (isolated electronics) withstands voltages of at least 4000 V, has an air gap of >5 mm and a creepage distance of >8mm. Significant voltages may occur during the use of an electric knife or through an amplifier from power lines during e.g. lighting induced voltage peaks. The AC-leakage current through the patient must not exceed 0.1 mA in normal operation and 0.5 mA in a single fault situation e.g. mains connected to the patient. The corresponding limits are 0.01 and 0.05 mA for DC currents. These set the limits for conductance between grounded and isolated electronics. One kind of fault occurs if the power supply of isolated electronics (typically ± 12 V or less) directly connects to the patient. A straightforward way to limit the current through patient is to connect a resistor in series with the amplifier input. Unfortunately such a resistor limits the performance (current noise, CMRR-degrading) of a DC coupled amplifier compared to its otherwise equivalent AC coupled amplifier. In an AC-coupled amplifier, a capacitor at the passive high pass filtering input rejects the direct current.
The use of an isolated amplifier stage connected to the patient makes the EEG-signal prone to pick-up interference from mains. Capacitive coupling of the mains to isolated electronics may connect capacitively to ground via the subject, and the resulting current converts to voltage at the electrode-skin interface impedance. This type of interference is seen in an EEG signal if any electrode-skin impedance-mismatch exists and the capacitive current exists. In order to decrease the mains coupling to an un-amplified EEG signal, it is beneficial to integrate the preamplifier on the electrode. Studies of successful designs of such active electrodes is presented by Ko (1998) and Taheri et al (1994) who used dry electrodes which unfortunately are limited in bandwidth to signals over 0.01 Hz.
The input resistance of the amplifier should be high, 1000 MΩ or higher. With a high input resistance, the electrode resistances do not cause a signal attenuation. However, even with a high input resistance, electrode resistance mismatch degrade the signal to noise ratio due to capacitive loading, i.e. input impedance is often much lower than input resistance.
Amplifier input bias current should be less than 0.1 nA. The IEC 60601-1 standard limits the patient leakage current to 0.01 mA. Input bias currents, together with electrode resistances, account for one source of offset voltage. If for any reason, the bias current or the electrode resistance changes, a corresponding error voltage is recorded. This may be seen as drift or a stepwise level shift. For these reasons, multi-channel amplifiers should preferably have input bias current in the pA-range. Further, the smaller the bias current the smaller the degrading of electrode material due to the current. When using Ag|AgCl-electrodes, the bias current should rather be directed out of the amplifier than into the input to maintain a slow formation of AgCl in electrodes. Bias current excludes the use of polarizable electrodes in most DC-coupled applications (see P4).
The amplifier should be able to record signals up to ±100 mV with = 1µV resolution which is common in commercial AC-coupled EEG-amplifiers. There are two methods to achieve this rather demanding requirement. The first one is to use an AD-converter that is capable of this, which requires at least an 18-bit conversion. The other approach, which was used in this study, is to use a less accurate AD-converter, but with a

26
selectable scale, i.e. the ± 100 mV scale is divided in subdivisions, e.g. ± 10 mV in which the converter works at a time. This allows the use of much cheaper converters, but requires a somewhat more complex circuit design. The requirement for the ±100 mV offset range is based on electrode offset voltages, which are less than 10 mV with Ag|AgCl electrodes. Electrode drift over time is less than tens of millivolts. However, the skin potential difference between electrodes can be relatively high, up to 50-70 mV.
The amplifier should have a noise level of < 1 µVpp reduced to input at 0.5-200 Hz. This is a typical value for commercial EEG-amplifiers. Currently it is unclear how many electrodes/channels will be needed in different DC-EEG applications to collect a sufficient amount of information. One estimation method is presented by Vaidyanathan and Buckley (1997). According to them, the required number of channels basically depends on signal to noise ratio. In this particular case, the “noise” is the EEG from adjacent brain areas. However, for the sake of compatibility with conventional EEG, 64...128 channels are in demand. The amplifier generated drift should be less than 5 µV/h. The drift of the amplifier is not a big issue, because the most dominant drift is generated at the electrode|skin –interface. The given limit calls for a proper design. The amplifier common mode rejection ratio (CMRR) should be more than 100 dB.
With current technology, amplifiers that qualify for the requirements listed above can be constructed using standard integrated circuits. If recordings are expanded to intracranial recordings, more demanding specifications are required to be fulfilled. True intracranial DC-recordings would require the use of salt bridges and Ag|AgCl electrodes due to the lack of non-polarizing, intracranial biocompatible electrodes.
In this context it is worth pointing out that recordings made with irreversible electrodes are always high-pass filtered due to capacitive coupling at the electrode interface, and the finite input impedance of the amplifier. In some cases this cut-off frequency might be significantly higher than the "intended", known cut-off frequency of the amplifier.
2.0.1 Commercial DC-EEG amplifiers Nearly all studies referred to in this thesis are recorded with custom made amplifiers. At present (2003, updated 2005), the first commercial EEG amplifiers designed for DC-EEG recordings are finally coming to market. One of the first commercial DC-EEG amplifiers was Neuroscan NuAmps (Compumedics; 7850 Paseo del Norte, El Paso, Texas 79912, USA). It has up to 140 channels, a 22-bit resolution, ±130 mV range and a voltage noise of 4 µVpp (DC-262 Hz). Sensorium (Sensorium Inc., 617 Dorset St. Charlotte, VT, USA) is a recently introduced amplifier, which has up to 288 channels with an 18-bit resolution and programmable four step gain. The voltage noise is <300 nVpp (DC-100Hz). The next alternative is from Biosemi (WG-Plein 129, 1054SC Amsterdam, Netherland). They offer a system in which the first stage of amplifier is integrated into an active electrode. The amplifier has up to 256 channels with 24-bit resolution and the input range is ±262 mV. The voltage noise is 5 µVpp (DC-2048 Hz). The fourth DC capable EEG amplifier is from Eldith GmbH (Gustav-Kirchhoff-Str. 5, D-98693 Ilmenau, Germany). They sell their devices for neuro feedback. Their amplifier, Neuro Prax, has 32 channels, a bandwidth from DC and sampling rates from 512 to 64 Hz. The noise is 1.35 µV (0-110 Hz.)

27
2.0.2 The amplifiers used in this study In this work, 6- and 16-channel medical-grade DC-EEG amplifiers were constructed and used. The amplifiers were based on a 2-channel preamplifier circuit that was originally intended for DC-electroretinography (Carlson et al, 1990) and later used in this laboratory during the years 1993-1994 (see Ekman, 1994). The input-stage of the amplifier consists of a differential amplifier integrated circuit (IC) chip AD620BN (Analog Devices, Norwood, M.A., USA) with 33kΩ resistors in series with inputs. These resistors degrade the performance, but are needed to fulfill the medical standard IEC 60601-1 in case of a fault. The offset facility is done using a sample-and-hold circuit, with a femtoampere-bias current voltage follower combined with a sufficiently large low leakage capacitance. This design has a drift rate down to 1 µV/h. The amplifier can offset electrode voltages over the full input scale, ±130 mV. Electrode resistance can be measured with a 1 µA sinusoidal current at 20 Hz. The amplifier is equipped with an internal 10 µV test/calibration signal.
After the author had made improvements to the preamplifier board layout, the amplifier proved to be as good as commercial EEG amplifiers in relevant aspects, with the additional features of a wide dynamic range and a bandwidth extending down to true DC level. As the next step, the author sketched the requirements for a multi-channel amplifier. The author's work that followed included all subfields of amplifier design (circuit, lay-out of components and traces, and mechanical design) as well as the construction work. The amplifier boards were differential amplifiers, each channel having a signal, reference and ground leads. This kind of arrangement turned out not to be practical in a multi-channel amplifier, and not even beneficial. For this reason the reference inputs were coupled together. The disadvantage of coupled references was that the total bias current through the reference electrode increased proportionally to the number of channels. The changes necessary for buffering the reference signal would have required a completely new circuit design to maintain electrode impedance measurement. Therefore, the changes were not done. The initial aim was to develop a prototype of a medical-grade DC-EEG amplifier. At that time the most important thing was to have a full setup that would allow bedside recordings of clinical patients.
Fig. 3. The first generation amplifier, electrodes and electrode holders.

28
The first amplifier built (see Fig 3) was intended for experimental use and method development. It had six channels with differential inputs and separate outputs for DC (bandwidth DC-160 Hz) and AC (0.2-1600 Hz) EEG signal, with DC and AC amplifications of 1000 and 10 000, respectively. The unit could be operated with manual controls only. It was used for research and development purposes in the laboratory of the University of Helsinki, and also at the Department of Clinical Neurophysiology, Helsinki University Central Hospital in year 2000. According to medical doctors, the performance of the amplifier was adequate, and there was no need to improve the amplifier design. However, more channels and computer controlled operations were asked.
For these reasons the second generation of the amplifier was built. This unit had 16 channels and it was completely computer controlled. Controlling the amplifier from the PC-software was time saving. Differential signals were derived by a computer and this approach turned out to be useful in the off-line analysis. This second generation amplifier had been in active clinical use in Helsinki (Department of Child Neurology, Hospital for Children and Adolescents, Helsinki University Central Hospital, Finland) in 2001 and in Seattle (Harborview Medical Center, UW Regional Epilepsy Center, Seattle, WA, USA) during the years 2001-2003.
2.0.3 Power supply of the amplifier Isolated electronics were in first prototype powered using a commercial linear-type, medical power supply (type Powerbox MBAA-40W-A. Powerbox Int. AB. Box 148, Gnesta, Sweden). Unfortunately, the power supply fulfilled only the old international medical safety standard IEC 601, which does not guarantee sufficient isolation. Therefore, it would have needed an additional DC/DC-supply to make the isolation, and for this reason the power supply was discarded and a new one was designed and constructed. The isolation was acquired by a sectorically wounded toroidal transformer having an earth grounded shield between primary and secondary windings to prevent capacitive coupling. Both the isolated and ground-referenced electronics was powered by linear-type regulators. Even though linear-type power supplies are space and power consuming units, they often generate less noise than switched mode regulators. Unfortunately, intrinsic noise of linear power supply is often within the EEG frequencies. Thus, high quality switched-mode power supply might be a good choice because the noise it generates is out of the EEG-frequencies.
2.0.4 Electrical isolation Signal isolation (between floating electronics and grounded electronics) was made with the isolation chip ISO106 (Burr-Brown, Tucson, AZ, USA; currently part of Texas Instruments, Dallas, TX, USA) that capacitively transfers analog signal over the isolation barrier with high precision. Digital signals used to trigger automatic offsetting and electrode resistance measurement were isolated by optoisolators.

29
2.0.5 Headbox The first 6-channel amplifier had no headbox, but electrode connectors were in the front panel. A passive headbox, i.e. a connector block, was made for the second amplifier and it was found useful in bedside recording.
2.1 DC-EEG data acquisition and software A laptop computer (pentium running at 500 MHz) with a data acquisition card (DaqCard-700 from National Instruments, 11500 N Mopac Expwy, Austin, TX 78759-3504, USA) was used for data collecting. The data acquisition card had only a 12 bit resolution, which did not provide a good combination of resolution and dynamic range without offsetting. However, the fixed gain together with a software adjustable input range and an addressable offset range turned out to offer a feasible combination of performance. Typical recording parameters were 6-16 channels sampled at 500 Hz with a ± 5 mV input range that offers 2.4 µV resolution.
The computer programs for data recording, retrieving and analyzing were programmed under Labview 4 (National Instruments). The recording program allowed software controlled offsetting of the (2nd generation) amplifier, measuring electrode resistances and displaying both clinical high pass filtered EEG signals and DC-signals. In addition to the usual clinical EEG program features, the analyzing program allowed for correction of the linear electrode drift, change of the signal baseline level, and other DC specific features to enhance the readability of traces.
2.1.0 DC-EEG software special requirements DC-EEG traces are often interpreted from 10 seconds to 15 minutes. With a high sampling rate and multiple channels, this produces millions of points of data. For this reason, some kind of data reduction is required to limit the transfer of data to output, screen or printer. Standard clinical EEG is high-pass filtered and therefore remains at the same baseline level. DC-EEG-signals, however, are not fixed to any constant baseline level and the signal amplitudes are typically much higher than those in the conventional EEG. This makes presenting the DC-EEG data, with good readability, demanding. DC-EEG signals overlap, drift and vary in amplitude. Typical amplitudes of clinical EEG are 10-100 µV at its highest, but the pathological DC signal amplitudes can be even up to 20 mV in animal studies (Manaka and Sano, 1979), while 2 mV is an upper limit in our results. If skin-originated signals are not short-circuited, a galvanic skin response (GSR) signal of up to tens of millivolts is often present.
At the time this work began, the computer capabilities were far from what is common today. Due to limited computer power, the data flow to the computer screen was limited to approximately 4k points/ch per refresh by undersampling data. Averaging was also possible, but it was seldom needed, because DC-EEG signals were found not to be prone to aliasing error even when undersampled. This finding was confirmed throughout the study. The likely explanation for the non-visible aliasing error is the decreasing power that the EEG had at higher frequencies. For this reason, the clinical EEG signal is small when the signal is scaled according to the infra-slow oscillations.

30
The only circumstance when data reduction by averaging was required (to prevent aliasing), was when the signal suffered from the noise of mains.
2.2 Electrodes Electrodes are transducers that transfer electrical signals from electrolyte solutions to solid state conductors. A perfect electrode conducts equally well in both directions with zero resistance, and has a constant electrode potential. Unfortunately, such a perfectly reversible electrode does not exist. Silver|silverchloride electrode behaves nearly perfectly at low current density. Electrodes that do not conduct direct current at all are perfectly polarizable, i.e. they are capacitive electrodes. With small currents, electrodes made of noble metals approach such a behavior (McAdams et al., 1992). However, at higher current densities, noble metals may adsorb monoatomic oxygen from electrolyte and exchange charge. As a consequence, they may suffer less from polarization than some other metallic electrodes (Kahn and Greatbach, 1974) that do not exchange charges with this mechanism.
Electrodes can be made in many different shapes, like cup, and some electrodes are equipped with holder and/or adhesive. To improve skin contact, "spiky" electrodes have been proposed (Griss et al, 2002). Throughout this work, In Vivo Metric (P.O. Box 397, Healdsburg, CA 95448, USA.) LP220 Ag|AgCl sintered electrodes were used.
2.2.0 Performance of common EEG-electrode materials Since clinical EEG signals are high-pass filtered, capacitively coupled electrodes may be used. Real electrodes (see P4), whether polarizable or not, exhibit resistance, may generate wide bandwidth noise and may have varying electrode potentials which depend on temperature, electrolyte concentration and other, more or less uncontrollable variables. The user should be aware of the properties of the electrodes. Geddes and Roeder (2001) have measured the DC-resistance of commonly used electrode materials in contact with saline (0.9% NaCl) at room temperature. They found that by chloriding silver the direct current resistance decreased sixfold, and the remaining resistance was the lowest compared to clean silver, either clean or chlorided tin, nickel, silver, clean copper or carbon. Aronson and Geddes (1985) found that residues in pure metal electrodes of other metal produced large fluctuations in electrode potentials compared to electrodes made of pure metal. Ikeda et al (1998) pointed out that even stainless steel electrodes can be used to record low frequency potentials, if a high input impedance amplifier is used and baseline fluctuation is accepted. Huigen et al (2002) have measured electrode noise (0.5…500 Hz), and found that the noise level decreased exponentially with time after gelling. If no pre-gelling was performed, Ag|AgCl was the only material that exhibited a nearly noiseless, stable contact potential with skin within 1 minute, while silver took 1 h and stainless-steel took 3 h to achieve a low noise (>0.5 Hz) state. In most respects Ag|AgCl electrodes have the best AC-performance, with a face to face (with gel) noise less than 1 µV at 0.5-500 Hz bandwidth (Fernandez and Pallas-Areny, 2000).
Gold, silver, tin and Ag|AgCl electrodes are common in conventional clinical EEG scalp recordings. Gold electrodes are made of silver that are coated with a thin layer of

31
gold. Gold, being a chemically very stable material, should be highly polarizable. However, according to the results obtained, this is not the case. The gold electrodes tested were stable and passed DC-current rather well – all too well to be accounted for by any chemical reaction with gold (see P3). The gold layer was also seen to deteriorate. The likely explanation for the good conduction is due to the minor cracks in gold and its gradual deterioration. This exposed the silver below the gold layer, which thereafter spontaneously chloridized, and the electrode became an Ag|AgCl electrode that was only partially gold coated.
According to the same study, silver-electrodes had a behavior that varied with time. A new silver electrode was like a capacitive electrode with a poor DC conductance, but as the electrode had longer periods of contact with the electrode gel, its performance was getting closer to the behavior of Ag|AgCl electrodes, thus being stable and showing a reasonable DC-conductance. This change in performance can be accounted for by a change from silver to Ag|AgCl electrode, depending on the total net current that flows through the electrode. Tin electrodes were poor in performance. Even though their DC-conductance was reasonably good, the electrode potential was very highly varying in the <0.5 Hz range. Even after long stabilizing times (hours, even days) their potential fluctuated. Such electrodes are not suitable for slow signal recording. Ag|AgCl electrodes were always superior. Sintered Ag|AgCl electrodes had a very low DC-resistance and a stable electrode potential (see P3). Among electrochemically coated Ag|AgCl electrodes, the small polarizing effect seemed to depend on the area of the AgCl-material, but it was sufficiently low compared to typical amplifier input parameters. Electrode potential was stable with sintered Ag|AgCl electrodes, as well.
The above mentioned electrode types can not be used in intracranial recordings due to a risk of toxic effects. In intracranial EEG recordings, platinum and stainless steel electrodes are in use. According to this study, the DC-conductance of both types was poor; electrodes were highly polarizable with the relatively small current (±5nA) that was used for testing. Stainless steel electrodes showed spontaneous fluctuations in the low frequency (<0.5 Hz) range but to a less extent than did tin.
2.2.1 The Silver|SilverChloride electrode Of currently available EEG-electrode types, Ag|AgCl-electrode is the only adequate electrode type to record frequencies below 0.1 Hz from the scalp (see P3 and Picton et al, 2000). Ag|AgCl electrodes are well suited for biological applications, since body fluids have plenty of Cl- ions. Although AgCl is considered to be somewhat toxic, its solubility to tissue fluid is low (Koryta, 1991) and its contribution to skin irritation is unlikely (Tam and Webster, 1977). Throughout this study, the six millimeter distance from the electrode to the skin surface was filled with electrode gel, which decreased the likelihood of any diffusional material transfer between the skin and the electrode. As shown in this study (P3), Ag|AgCl electrodes are the proper choice for DC-EEG recordings because they are stable enough, have a long life-time, do not suffer from significant polarization, and have a low resistance. The main disadvantage is the high price of sintered Ag|AgCl electrodes which does not allow the use of disposable sintered electrodes in a routine clinical use. Ag|AgCl electrodes can be sterilized by the ethylene oxide method (Griss et al, 2002; guide from In Vivo Metric (P.O. Box 397, Healdsburg, CA 95448, USA)).

32
2.2.2 Chemistry of the Ag|AgCl electrode Silverchloride electrode is composed of a pure silver body that is coated with silverchloride. Silverchloride is deposited on the electrode surface as a solid electrolyte and it creates a conducting media in which silver-ions act as charge carriers (Koryta, 1991). An electrode wire (usually of other metal than silver) is fixed to the silver and insulated water tightly. The sealing is needed due to the unstable electrode potential that will result if watertight sealing is not obtained between different metals.
Ag
electrolyte
AgCl-layer
e-
e-
e-e-
e-e-
e-e-
e-
e-
e-
Cl-Cl-
Cl-
Cl-Cl-
Cl-Cl-
Cl-
Cl-
Cl-
Fig. 4. Silverchloride coated silver in an electrolyte solution.
At the electrode-solution interface, the current is carried by Cl- ions. If the silver electrode is made positive (with respect to its electrode potential in a chloride containing electrolyte solution) it will attract Cl- ions and AgCl is deposited over silver. At the same time, electrons are freed and current flows in the solid conductor. Reaction [1] proceeds to the right.
Cl- + Ag ⇔AgCl + e- [1]
If the current direction is reversed, the reaction is reversed and goes to the left.
The electrode potential of silver|silverchloride electrode is (Koryta, 1991)
−+=ClAgAgClAgCl a
FRT
EE ln0/ [2]
where the symbols have the following meanings: E0 – standard electrode potential (constant); R - gas constant, 8.31 J/(mol×K); F - Faraday constant (9.65×10⁵ C/mol); T – temperature in Kelvins; aCl = activity of Cl-. The requirement for constant temperature and concentration of chloride is obvious from Eq [2].
2.2.3 Silver|silverchloride electrode manufacturing Silver|silverchloride electrodes can be made by immersing pure silver in a chloride containing aqueous solution, and passing current through the silver-solution interface.

33
The process is studied in Geddes et al (1969). Silver|silver chloride electrodes are stable, as long as silver is not in contact with the electrolyte solution. Even microscopic fractures (e.g. due to deformations) in silver chloride spoils the stability (references given in Aronson and Geddes, 1985; see also Geddes and Baker, 1967).
To overcome problems related to the small amount of silver chloride in electrochemically produced electrodes, Ag|AgCl electrodes can be produced of sintered silverchloride to increase the effective volume and surface area. Sintered Ag|AgCl electrodes are manufactured from silverchloride pellets, and a silver wire is fixed to them. The pellets are made from fine-grounded silverchloride that is baked and compressed with high pressure. Electrodes are then cut from the material. Sintered Ag|AgCl electrodes usually give better performance compared to electrochemically produced electrodes because of their higher volume of Ag|AgCl (see P3) and larger effective surface area. Interestingly, sintered electrodes have smaller impedance than what would be expected from a plain area comparison (McAdams et al, 1996).
In practice, Ag|AgCl electrodes have a slightly changing electrode potential, i.e. they are not fully free from drift. As can be seen from equation [2] the electrode potential is dependent only on temperature and chloride concentration. Unfortunately, even in laboratory conditions, where those parameters can be controlled, the electrode potential is not perfectly constant. This indicates that other factors, such as impurities in materials and perhaps also other charge transfer reactions, make a small contribution to the electrode potential. Girton and Kamiya (1974) measured an electrode potential versus temperature coefficient of 450 µV/°C in physiological saline and a shift ∆EAgCl = 500 µV upon drying of the gel by 1%. They also raised a question concerning electrode drift related to electrolyte composition. Comparable data on the effects of electrode gels on Ag|AgCl electrode potentials are presented in publication P3. The average temperature coefficient difference between individual electrodes has been reported to be around 20 µV/°C (Girton and Kamiya, 1974).
2.2.4 Electrode attachment to skin A tight contact between the electrode and skin decreases the rate of electrode gel concentration change, and thereby is a pre-requisite to the DC-stability. On non-hairy regions, electrodes can be attached in an airtight manner e.g. with adhesive collars. In hairy regions, one of the following methods can be used. Electrodes are fixed to an elastic cap or net, forming an electrode cap. The advantage is that electrode cap is fast to wrap up and all electrodes are readily in position. Possible disadvantages include the need for many caps of different sizes and the difficulty to obtain an airtight electrode skin contact. Further, the cap should allow electrode sterilizing and skin short circuiting. Electrode caps are available from e.g. Falk Minow Services (Herrsching-Breitbrunn, Germany) or Nexstim Ltd (Helsinki, Finland). If the cap option is not available a plastic electrode holder can be cemented to the skin with collodion. After positioning the holders the electrodes are snapped to the holder (Bauer et al, 1989). With a suitable agent the method can be used both on hairy and non-hairy regions. Although collodion keeps the electrodes well fixed, it is slow to apply and not easily rinsed from hair. These are the severe disadvantages if the number of electrodes is high.
34
2.3 Skin 2.3.0 Barrier function Clinical EEG is measured from the skin surface. Skin, however, is a defensive barrier that shelters the body, restricts the loss of water, regulates temperature and reflects emotions. Due to these functions, skin is an electrically active organ, and creates electrical signals across itself in the low frequency range. Skin potential shifts can consist of negative, positive or biphasic waves (Tarchanoff, 1890; Yokota et al, 1959). A list of different stimuli and the shape of waveforms are given by Toyokura (1999). The resistance of dry skin is high, which further complicates recordings. The methods for skin impedance measurements are presented e.g. by Yamamoto (1994) and Grimnes (1983a).
2.3.1 Structure of the skin Skin consists of three layers, epidermis, dermis and subcutaneous layer (Tam and Webster, 1977), see fig. 5. The epidermis consists of three layers: stratum corneum, stratum granulosum and stratum germinativum. The surface layer, stratum corneum, is the layer of dead cells. The thickness of stratum corneum varies between 0.01… 0.7 mm. The poorly conducting barrier of mammalian skin is principally attributed to the stratum corneum (Scheuplein, 1971 and 1978), which is essentially a poorly-conductive lipophilic layer (McAdams et al, 1996) of dead keratinized epithelial cells. Beneath it are the stratum granulosum and stratum germinativum, which are conductive aqueous tissues. This transition from a lipophilic layer to an aqueous solution gives rise to the skin's barrier properties (McAdams et al, 1996). A molecule should have an appreciable solubility in both lipids and water to be capable of penetrating the skin. A voltage gradient of ~30 mV prevails between the surface and deeper layers of the skin. Sensory nerves reach up to the stratum granulosum. The dermis consists of the corium layer, living cells and elastic tissues. Sweat glands are deep in the dermis, while the sweat ducts reach the skin’s surface. Grimnes (1984) suggests that ionic pathways through the skin are localized towards the sweat ducts and other "weak spots" of the skin.

35
Fig. 5. A schematic drawing of skin structures (from Tam and Webster, 1977).
2.3.2 Mechanism of generation of skin-borne signals A widely accepted model to account for the electrical skin potential is presented in Fig. 6.
E s E E
R E R s
skin surface
subcutaneous tissues
"sweat gland potential"
sweat duct and gland resistance
skin resistance
"epidermal potential"
Fig. 6. The electrical model of skin proposed by Edelberg (1977). A change in any of the four variables changes the skin potential.

36
The epidermal generator EE (Fig. 6) is the electromagnetic force across the barrier formed by the epidermis. The generator mechanism is not fully understood. One possible mechanism is proposed by Thakor and Webster (1978), and further developed by Talhouet and Webster (1996). They suggest that a potential gradient arises from injured transitional cells. When a distal part of a cell is damaged, sodium leaks to the cell at the distal end and it is pumped out at the proximal end. The resulting current flow through the resistive extracellular medium causes an ohmic voltage gradient. RE is the total resistance of the epidermis. Since electrode gel can affect the conductivity of the epidermis by hydration and providing a source of electrolytes, RE is dependent on gel. Motion artifacts, which are common during EEG recordings, are originated from a barrier layer between the stratum corneum and the stratum granulosum (Edelberg, 1977; Talhouet and Webster, 1996; Tam and Webster, 1977). This is in agreement with the idea that motion artifacts reflect changes in the epidermal source resistance RE, even though motion artifacts and changes in skin resistance have a somewhat different time course (Martin and Venables, 1966; Wilcott, 1964; Talhouet and Webster, 1996). However, they are closely related to each other and a change in RE can be considered as the main cause of motion artifacts.
ES is the potential across sweat gland membranes and it is varying due to changes in sweat ingredients and concentrations. RS is the source resistance of ES and contributes to the skin potential. RS is made up of the resistance across the sweat gland epithelia and resistance along the sweat duct. This suggests that sweating leads to an increased contribution of ES on skin potential. Thomas and Korr (1957) nicely show the linear relationship (r=0.91) between skin resistance change and the number of active sweat gland. Every active sweat gland adds a parallel conductance pathway lowering the total resistance.
Sweat glands generate a voltage that is much higher than that of the epidermal source. In intact skin, if no eccrine sweat gland activity is present and sweat ducts are nearly empty, the potential over skin is set mostly by the epidermal source EE and epidermal resistance. Both variables are dependent on electrode gel composition. Eccrine sweat gland activity makes the potential on the skin surface highly dependent on the amount of fluid in sweat ducts (Edelberg, 1977) because this decreases the resistance RS. In literature there is no consensus about the dependence of epidermal voltage on electrode gel composition (see Christie and Venables, 1971a,b). One view is presented by Woodrough and Watson (1975). They suggested that epidermal voltage gets more negative while sweat gland potential gets more positive upon increasing the gel Cl- concentration. As a consequence, the skin potential is not barely dependent on gel concentration of electrolytes in gel, but on the relative contribution of mechanisms (epidermal & sweat gland potentials) behind it. Galvanic skin response (also called sympathetic skin response) originates from changes in the above mentioned variables. The following is the likely mechanism: Filling of sweat ducts creates an increase in skin negativity potential, while the hydrating of skin by sweat or gel (decrease in RE) returns the potential to less negative levels ("positive deflection"). The time course of these two phenomenon are different, which is in line with the observed phasic galvanic skin potential responses (Yokota et al, 1959; Martin and Venables, 1966; Toyokura, 1999).

37
2.3.3 Eliminating of skin borne signals Skin-borne signals i.e. GSR and motion artifacts must be eliminated in order to record artifact-free DC-EEG. A few experiments were carried out by the author to test whether aluminiumchloride, which is used in antiperspirants to prevent sweating, could be used to make skin potential constant. Unfortunately, the results were disappointing. The voltage at skin surface was not stable. This was because only the skin conductance decreased, but the skin prevailed the propensity to generate voltage signals. Corby et al (1974) suggested that skin potential responses (SPR) could be eliminated by local anesthesia or by using subdermal needle electrodes. They also found that SPR was not present in earlobes and at Cz – which is contrary to our unpublished results on GSR (see also P1) and would mean that between these positions skin potentials should not seriously contaminate the EEG. Furthermore, their study shows that cephalic skin potential (CSP) artifact is a significant contaminant in studies on low frequency EEG data, which may enhance the magnitude of CNV. In another study, Wilcott (1971) suggests that electrically stimulating the sensory system at a low frequency decreases or inhibits skin potential responses in cats. Unfortunately, such a method does not sound acceptable for use on humans.
Skin potential and/or the GSR signals do not have constant amplitude at different locations on the scalp (Picton and Hillyard, 1972; Tam and Webster, 1977), and as a consequence they cannot be eliminated by computational methods. Due to these reasons in DC-EEG applications the barrier of the stratum corneum must be short-circuited. Different methods to short-circuit the skin have been proposed, e.g. repeated tape stripping (Pinkus, 1951), lightly 'drilling' the skin by a dental burr until a shallow, circular depression is made in the epidermis (Shackel, 1959), sandpaper stroking (Tam and Webster, 1977), as well as puncturing the skin by a needle (Kahn and Greatbatch, 1974; Burbank and Webster, 1978). Atropine driven through the skin by iontophoresis has been shown to block the GSR (Wilcott, 1964; for further references, see Cowen, 1967; and below). Picton and Hillyard (1972) found that scratching the skin by a needle abolished signals generated by the skin, as did driving atropine through the skin by iontophoresis. Atropine laid on the skin was without effect.
An impedance controlled drill that stops when a preset impedance level is achieved is presented by Zipp (1983). The problem with most methods is that they are heavily dependent on the intensity they are used. Therefore, the result depends on the person who does the skin preparation and on the skin type of the subject under operation. Tape stripping and sandpaper abrasion cause discomfort and pain and may irritate the skin. Skin takes days to heal from skin tape stripping (Lykken, 1971). From a clinical point of view, these methods are slow to use. Scratching the skin with a needle is an effective, less irritant method to short-circuit skin signals. But it requires practice and is difficult to operate due to hairs. However, with a limited number of channels (<20) it is readily applicable.
Skin puncturing was proposed by Burbank and Webster (1978) to prevent movement artifacts. On the basis of their results, they recommended using ten 0.5 mm deep skin punctures, and they asked for a commercial lancet for this. Unfortunately, such a lancet is not commercially available (see also P4). Puncturing the skin is usually less painful than abrasion and leaves marks less frequently (Picton et al, 2000). None of the current methods are optimal. The lack of a reliable, stardardized skin-preparation method that
38
would be quick to use, is a significant practical problem that may hinder the DC-EEG from becoming widely used in clinical work.
2.3.4 Skin irritation Biological tissues do not tolerate prolonged exposure to salt concentrations that are significantly higher than the physiological level (0.9% or 150 mM NaCl) without irritation. Higher salt concentrations in gel, like 1 M, would, however, have certain technical advantages. The higher the conductivity, or salt concentration in the gel, the faster the decrease of skin resistance (McAdams and Jossinet, 1991; McAdams et al, 1996). However, such aggressive gels should be used with caution. In the light of DC-EEG, even the use of aggressive gel does not exclude the need to short circuit the skin, and no advantage is obtained because a properly prepared skin contact already has a low resistance.
Throughout this study, SignaGel was used, because it was not irritating on punctured skin. Irritation is not only a function of Cl- concentration. Tam and Webster (1977) found that abraded skin heals (i.e. skin potential recovers) within days under isotonic paste (0.9 % NaCl) but the injury remained if a high chloride (9 % NaCl) gel was used. They also found that gel pH does not affect to skin irritation if isotonic gel is used.
Further studies are needed to cover how the skin could be kept short-circuited but not irritated in long-term recordings of DC-EEG.
3. Summary of publications
3.1 P1: Hyperventilation induces a millivolt scale shift in DC-EEG DC-voltage shifts (induced by a three minute lasting voluntary hyperventilation) were recorded with up to six channels, using a DC-coupled amplifier. In some experiments end-tidal partial pressure of CO2 (pCO2) was recorded simultaneously. A very large voltage gradient shift of over 100 µV/cm at the vertex versus temporal deviation during the hyperventilation was observed. This DC-shift had a time course that was very closely correlated with the associated pCO2 change. Hyperventilation-like breathing of 5% CO2 in 95% air resulted in a near-complete block of the DC-shift. The recorded shifts are far too large to be purely from neuronal origin. In the light of published data, the data strongly supports the conclusion that the shifts are generated across epithelia separating cerebrospinal fluid and blood, i.e. the shifts are driven by the blood-brain barrier. A model that describes the generation of potential gradients on the scalp is presented in the discussion of P1.
3.2 P2: Changes in brain haemodynamics causes DC-shifts Further evidence supporting the non-neuronal origin of DC shifts was obtained using near infrared spectroscopy (NIRS) with DC-EEG during manipulations that affect intracranial pressure with different mechanisms. NIRS measures intracranial diffraction
39
of near-infrared light and gives a fairly good estimate of total cerebral blood volume. A correlation between changes in blood flow and volume has been shown (for references, see P2). The following maneuvers were used: Valsalva and Mueller maneuvers, bilateral jugular vein compression, head up tilt and head down tilt. All manipulations evoked clear DC-shifts. The shifts were largest (around 150 µV) at midline electrodes referenced to mastoids, and a clear temporal correlation was observed with NIRS. As the manipulations are not associated with significant changes in cortical excitability, this finding further supports the non-neuronal origin of DC-shifts, and it is consistent with the model put forward in P1 with the blood-brain barrier potential reflecting changes in blood flow and/or pH.
3.3 P3: Ag|AgCl electrodes are needed to record DC-EEG This study was carried out to find the applicability in DC-EEG recordings of six different commercially available electrode types and nine EEG-gels. The polarization of gold, silver, tin, platinum, stainless steel and Ag|AgCl electrodes were measured by passing a ±5 nA current through electrodes placed with electrode gel on a conducting NaCl-agar block. The spontaneous fluctuations of electrode potential were found to differ significantly between electrode types. Tin and stainless steel electrodes were found unsuitable for the recording of slow EEG signals due to their spontaneous low frequency (LF, 5 mHz…500 mHz) noise and polarization of stainless steel. Tin had a very high varying electrode potential, which easily saturates DC-coupled amplifier. Platinum and gold electrodes had a low LF noise level, but suffered from polarization that makes measurements prone to long-term baseline instability (frequency components <5 mHz) and thus saturation of the amplifier. Sintered and electrochemically coated disposable Ag|AgCl electrodes are the only electrode types enabling high-quality recordings in the low-frequency range. Silver, and even gold, electrodes were sometimes found to attain the properties of Ag|AgCl electrodes. This is most probably due to spontaneous chloridizing since the tested gold electrodes were gold plated silver electrodes.
Nine different electrode gels from which two were chloride free were studied. No major differences were found among those containing chloride in low frequency coupling properties. Ag|AgCl electrodes were unstable with both chloride-free gels and thus chloride-free gels must not be used with Ag|AgCl electrodes.
3.4 P4: DC-stable electrode-skin interface for human EEG recordings Study P4 presents the developed and evaluated methods to short-circuit skin originated signals. The extremely steep voltage gradient (+15…-65 mV) across the skin is the origin of major instability and artifacts in DC-EEG recordings. Reliable recording of DC-EEG requires the elimination of this artifact. Earlier method that had been used was scratching the skin until a minor amount of blood was seen (P1). Due to the practical difficulties of this approach a better method was looked for. In this study was six different methods compared to obtain the goal. Skin scratching with a hypodermic needle served as a reference method (the results of this method were also verified) and it was compared against five different methods utilizing 3 allergy prick needles and a self-

40
developed mini-puncturing method enabling a depth controlled puncturing. Skin short circuited was assessed by recording transepidermal potential (TEP) immediately after the operation, as well as one day later. The most reliable method for overnight recording was scratching. Most puncturing methods produced a short circuit sufficient for acute recordings. Puncturing methods were quick and easy to operate being practical for clinical use and thus some of them could be used for short-term recordings. Interestingly, it was found that visible blood is not a guarantee of sufficient short circuit, and vice versa, a visible blood is not required for a short circuit.
In addition, this study presents a method that can be used to estimate the need to repeat the short circuit. The method is based on calculating signal power in low frequencies (0.05-0.5 Hz) to indicate electrodes that generate intense low frequency noise. Such monitoring proved to have a high correlation with skin voltage and it gives a good estimate of skin voltage recovery and therefore, the propensity of the skin to generate noise.
3.5 P5: A novel type of slow EEG on preterm human infants Publication P5 presents a novel finding that the immature human brain exhibits slow electrical activity that is severely distorted or not even detected by conventional EEG. Six healthy preterm infants were recorded during sleep. In all infants, DC-EEG showed that delta frequency bursts are superimposed on a large (200–700 µV) and long lasting (1–5 s) occipitally negative transient, which is not seen in conventional EEG. The study demonstrates that the most prominent form of spontaneous EEG activity in a sleeping preterm infant consists of very slow, large amplitude transients, and these transients are filtered out in conventional EEG. This observation highlights the potential clinical value of DC-EEG in applications related to preterm infants.
3.6 P6: Temporal lobe seizures are associated with negative DC-shifts Publication P6 points to the potential clinical value of DC-EEG in epilepsy diagnostics. Seven patients with temporal lobe (TL) epilepsy were recorded with scalp DC-EEG technique at bedside. DC-shifts could be detected during TL seizures on the scalp, and these shifts gave lateralizing information consistent with that obtained with other clinical methods. Recordings were high-pass filtered off-line in order to generate conventional looking EEG signals that could be compared in parallel with DC-EEG data. Negative DC shifts of 30-150 µV were seen at temporal derivations relative to vertex during all of the 35 seizures. The shifts began within a few seconds of the seizure onset as seen in clinical EEG, and lasted for the whole seizure. In patients with documented mesial TL onset, the polarity of the DC shift was initially positive followed by a negative shift after lateral spread of seizure activity. Routine EEG and other presurgical diagnostic tests (like scalp EEG and intracranial EEG, neuropsychological tests and neuroimaging methods like magnetic resonance imaging (MRI), single photon emission computed tomography (SPECT), positron emission tomography (PET) and computer tomography (CT)) were used to find out the side of seizure onset as usual, which was then compared to the lateralization of the observed ictal DC shifts. The time courses of the DC shifts and the ictal discharges were also compared. In all cases, the

41
side of the DC shift alone predicted lateralization of the seizure onset. Since the recordings on epileptic patients proved to be practical at bedside, these results clearly indicate that DC-EEG holds promise as a presurgical diagnostic method in TL epilepsy that may reduce the need of intracranial EEG monitoring.
4. Discussion
4.0 True DC-EEG or long time constant AC-EEG? In theory, infra-slow signals can be recorded using conventional AC-coupled amplifiers, provided that the time constant of the RC high-pass filter is made long enough. Unfortunately, AC-coupled amplifiers show an exponential recovery from saturation that could be induced e.g. by movement artifacts. The exponential recovery takes place with the time constant of the input high pass filter and does not indicate a slow recovery of the electrode. Therefore, increasing the time constant of input HP filters in order to allow detection of infra-slow EEG frequencies results in an artifact recovery time of dozens of seconds during which the data may be completely lost. This problem can be avoided by using DC-coupled amplifiers with automatic offset cancellation.
It may happen that a commercial recording system with AC-coupled inputs is supplied with data acquisition software, in which the lowest HP cut off frequency is zero Hz. This, of course, causes misinterpretation of low-frequency data, if the user of such a system is not aware of the high-pass filtering by hardware.
The interface of DC unstable electrodes with skin can be primarily capacitive (see P3). Since this interface capacitance is in series with the amplifier input, it can unintentionally form a HP filter at the (AC- or DC-coupled) amplifier input, i.e. it can result in unpredictable loss or distortion of slow signals and thereby cause misinterpretation of data. It is also evident that low frequency data can be collected without distortion only if the skin-electrode interface can faithfully transfer slow signals to the amplifier. Data in P3 indicates that this condition most likely prevails when a stable DC baseline is observed with Ag|AgCl electrodes. This supports the use of DC-coupled amplifiers even when the signals of interest are slow but without a DC component.
Taken together, all low frequency studies should be carried out with a truly DC-coupled high quality amplifier. Any high-pass filter may attenuate and distort the signals of interest, and in the worst case, all essential low-frequency information may be completely filtered out. Off-line reconstruction of data that has been lost is not possible.
4.1 DC-EEG and skin as a source of artifacts Signals that have a biological origin but are not generated by the brain are a common source of artifacts in conventional clinical EEG. Muscle activity, caused by e.g. chewing, and eye movements, induce large-amplitude signals with characteristic waveforms and they are easily recognized by an experienced clinician. When the recording bandwidth is extended to zero Hz, transdermal potential changes across the

42
skin become a significant source of low-frequency artifacts. The time course and amplitude of skin-borne signals can be highly variable and unpredictable, and therefore it is necessary to eliminate the generation of these signals in DC-EEG studies.
Mechanical scratching of the skin (by any method) is a simple and effective method for short-circuiting the transdermal potential. However, from a practical point of view, it is not an ideal method to be applied to patients in the clinic. Could more sophisticated methods be found that would short circuit the barrier without mechanical manoeuvres? Many studies have been carried out to improve transdermal drug delivery, and these studies might provide novel ideas for developing methods for short-circuiting the skin. Since these reports (e.g. Foley et al, 1992; Kelly, 1985; Knepp et al, 1987; Nolan et al, 1993) have not included skin potential measurement, the applicability of the methods in view of DC-EEG is unknown. The so called penetration/permeability enhancer (for refs. see e.g. Sharata and Burnette, 1988; or Astley and Levine, 1976) might also give help. Penetration enhancers are agents that increase the permeability of the skin. Some of them hydrate the skin, while others aggressively dissolve lipids. Surfectants (McAdams et al, 1996) are one type of penetration enhancers that have hydrophilic and lipophilic groups. At water-oil interface, these molecules facilitate a transition between the polar and non-polar phases. An example of such an agent is dimethylsulphoxide (DMSO). The problem with agents that have destructive effects on the skin is how to limit tissue deterioration to a desired level. Electrical current can also be used to enhance ionic permeability in the skin (Panescu et al, 1994). At a certain current level, the skin barrier breaks and the skin resistance collapses. With small currents, changes are reversible, while higher currents cause irreversible changes (Grimnes, 1983b). One presented idea is to use iontophoresis to force a suitable agent into the skin in order to short circuit it (Wilcott, 1964). By this approach the degree of skin damage could perhaps be controlled.
While it is easy to speculate about chemical or electrical maneuvers for short-circuiting of skin-borne artifacts, addressing this issue would require systematic animal experiments before tests on human skin. Therefore, this question was beyond the scope of the present study.
4.2 Origin and interpretation of infraslow EEG signals In standard textbooks, the generation of EEG signals is accounted for by postsynaptic excitatory currents, which flow into and along the dendrites of cortical neurons. Such intracellular currents give rise to a return current and an ohmic voltage gradient in the extracellular space. In line with this view, slow and stationary EEG signals have until recently been assumed to reflect slow changes and the steady level of cortical excitation (Caspers et al, 1984). This prevailing view was challenged in P1 and P2, where large DC shifts were recorded without any obvious changes in gross excitability. The manipulations used in P1 and P2 to evoke DC shifts, pointed to structures and signal generation mechanisms that are associated with brain haemodynamics.
The view that assumes a neuronal source for all slow EEG signals seems to ignore the invasive studies that were carried out in earlier decades (see chapter 1.8). In spite of differences between the species used and the results obtained, these studies demonstrated a mV-scale potential difference across the blood-brain barrier and its

43
possible dependence on factors such as blood flow or pH. The volume conduction model presented in P1 (see Fig. 5 in P1) predicts that changes in the blood-brain barrier potential are bound to be seen in scalp DC-EEG recordings.
An important finding, with respect to the interpretation of the data, was the strong influence of changes in breathing patterns on the recorded DC-EEG signal levels. Even a minor change in pH can produce a DC shift that is in the same order as the EEG response. It is evident that the monitoring of breathing should be carried out as a control measurement when recording task-related slow EEG events such as those already discussed in more detail in the chapters 1.7-1.8.
Taken together, the blood-brain barrier potential should be considered as a significant non-neuronal source of slow EEG signals. This does not, of course, exclude the possibility that neuronal sources may contribute to DC shifts. However, the amplitudes of slow shifts may exceed by far those of the largest spikes seen during epileptic events. This suggests a major role for the non-neuronal source at least when using experimental manipulations such as those in P1 and P2. It may also turn out that changes in neuronal activity are coupled with the control of blood flow in a manner that can be seen with DC-EEG as a mixture of neuronal and non-neuronal signals.
4.3 Potential clinical applications of DC-EEG The convention of high-pass filtering of EEG signals causes low frequency signal distortion. Therefore, extending the recording bandwidth to 0 Hz is likely to improve the existing EEG methods as more accurate as well as form a basis for novel applications.
It was shown in P5 that DC-EEG recordings show characteristically slow but large-amplitude deflections in preterm human babies. High-pass filtering used in conventional EEG effectively prevented this finding from being made earlier.
Identification of the site of seizure onset is an important task in presurgical diagnostics in epilepsies that do not respond to pharmacotherapy. DC-EEG has recently been shown to hold promise as a non-invasive means for lateralization of seizure onset even in cases where conventional EEG is ineffective. (see P6; Lagerlund and Gross, 2003).
DC-potential over the blood-brain barrier may reflect the barrier permeability. In normal situations, BBB blocks many pharmacotherapy substances from reaching their targets in the brain. If the state of the barrier is monitored and could be altered, new pharmacotherapy methods could possibly be found. The structure and function of the blood-brain barrier is reviewed in e.g. Bradbury (1984).
One possible future application of the DC-EEG is likely to include the monitoring of sleep (Marshall et al., 2003; Vanhatalo et al., 2004).
Further studies are needed to find out what clinical applications could be based on the spontaneous low frequency oscillations that have been recorded in many studies (Aladjalova, 1964, Girton et al,1973; Trimmel et al, 1990)

44
5. Conclusion
There are no longer any unsolved technical or methodological problems that could prohibit routine bedside recording of DC-EEG in the clinic. DC-stable skin contact can be obtained with clinically available methods and commercial DC-EEG amplifiers are available from multiple vendors. One result of this study is a purchasing of DC-EEG amplifiers to Hospital District of Helsinki and Uusimaa at Departments of Clinical Neurophysiology and at Children´s Hospital. A practical pre-requisite of DC-EEG recording is the combination of a chloride-containing gel and silver|silverchloride (Ag|AgCl) electrodes.
The huge amplitudes of the infra-slow EEG signals are generated across epithelia separating cerebrospinal fluid and blood, i.e. the shifts are driven by the blood-brain barrier. New applications may emerge utilizing this information. A model that describes the generation of potential gradients on the scalp is presented in the discussion of P1.
Immature human brain exhibits slow electrical activity (see P5) that is severely distorted or not even detected by conventional EEG. The study demonstrates that the most prominent form of spontaneous EEG activity in a sleeping preterm infant consists of very slow, large amplitude transients, and these transients are filtered out in conventional EEG.
Infra-slow EEG signals present useful information in e.g. epilepsy diagnostics. DC shifts could be detected during temporal lobe seizures on the scalp, and these shifts gave lateralizing information consistent with that obtained with other clinical methods (see P6). Since the recordings on epileptic patients proved to be practical at bedside, these results clearly indicate that DC-EEG holds promise as a presurgical diagnostic method in temporal lobe epilepsy that may reduce the need of intracranial EEG monitoring.
There were two clinical trials presented in this work. In addition to completely new applications of DC-EEG, it is likely that DC-EEG will add useful information in every field that EEG is currently applied.

45
References
Aronson S. and Geddes L.A., Electrode Potential Stability. IEEE Transactions on biomedical engineering, 1985, Vol. BME-32, No. 11:987-988.
Aladjalova, N.A. Slow electrical processes in the brain. Progress in Brain Research, Vol 7, Elsevier, Amsterdam, 1964.
Astley JP. Levine M. Effect of dimethyl sulfoxide on permeability of human skin in vitro. Journal of Pharmaceutical Sciences, 1976, 65(2):210-5.
Berg P, Scherg M. A fast method for forward computation of multiple-shell spherical head models. Electroencephalogr Clin Neurophysiol., 1994, Jan. 90(1):58-64. Birbaumer N., Elbert T., Canavan A.G.M and Rockstroh B. Slow potentials of the cerebral cortex and behavior. Physiological Reviews, 1990, Vol 70. No 1:1-41.
Bauer H., Korunka C. and Leodolter M., Technical requirements for high-quality scalp DC recordings. Electroencephalography and clinical neurophysiology, 1989, 72:545-547.
Besson JM. Marshall WH. Relations between CBF and DC potential. Scandinavian Journal of Clinical & Laboratory Investigation – Supplement, 1968, 102:I:D.
Besson J.M, Woody C.D, Aleonard P., Thompson H.K., Albe-Fessard D., Marshall W.H. Correlations Of Brain D-C Shifts With Changes In Cerebral Blood flow. Am J Physiol, 1970, 218: 284-291.
Bradbury MW. The structure and function of the blood-brain barrier. Federation Proceedings, 1984, 43(2):186-90.
Brazier M.A.B. Historical introduction: the discoverers of the steady potentials of the brain: Caton and Beck. Proc. UCLA Forum in Medical Sciences. 1:1-13, 1963.
Brazier M.A.B. The Emergence of Electrophysiology as an Aid to Neurology, in M.J Aminoff (ed), Electrodiagnosis in Clinical Neurology. Churchill Livingstone, 1992.
Burbank D.P., Webster J.G., Reducing skin potential motion artefact by skin abrasion. Med. & Biol. Eng. & Comput., 1978, 16:31-38.
Carlson S., Raitta C., Kommonen B. and Voipio J., A DC electroretinography method for the recording of human a-, b- and c-waves. Journal of Neuroscience Methods, 1990, 35(2):107-13.
Caspers H, Speckmann E.J. and Lehmenkühler A., Electrogenesis of Slow Potentials of Brain, in T. Elbert (ed), Self-Regulation of the Brain and Behavior, Springer Verlag, 1984.
Caspers H. Speckmann E.J. and Lehmenkuhler A. DC potentials of the cerebral cortex. Seizure activity and changes in gas pressures. Reviews of Physiology Biochemistry & Pharmacology, 1987, 106:127-78.
Caton R. The electric currents of the brain. Brit. Med. J., 1875, 2:278.
Christie MJ. Venables PH. Sodium and potassium electrolytes and "basal" skin potential levels in male and female subjects. Japanese Journal of Physiology, 1971a, 21(6):659-68.

46
Christie MJ. Venables PH. Effects on "basal" skin potential level of varying the concentration of an external electrolyte. Journal of Psychosomatic Research, 1971b, 15(3):343-8.
Clark, J. (Jr). The origin of biopotentials. In: “Medical Instrumentation, Application and design”, Webster J.G. (ed.), pp. 143-214. Houghton Mifflin Company, Boston, 1978.
Cooper R, Osselton JW, Shaw JC. Electrodes. EEG technology, 3rd ed. London: Butterworths, 1980.
Corby JC, Roth WT, Kopell BS. Prevalence and methods of control of the cephalic skin potential EEG artifact. Psychophysiology, 1974, 11(3):350-60.
Cowen M.A. Elementary functional correlates of the transephalic DC circuit. Psychophysiology, 1967a, 3(3):262-271.
Cowen M.A. The baseline transcephalic D.C. potential in normals. Journal of Psychiatric Research, 1967b, 5(4):307-15.
Cowen M.A., Ross J. Some biochemical factors that modify the transephalic DC-potential. Psychophysiology, 1967, Vol 4, No 1:90-97.
Cowen M.A., Ross J. and McDonald R. Some aspects of the transephalic DC circuit. Psychophysiology, 1967, Vol. 4, No 2:207-215.
Curio C. Ultrafast EEG Activities. In: "Electroencephalography. Basic Principles, Clinical Applications, and Related Fields", 5th edition, E. Niedermeyer and F. Lopes da Silva, editors, pp. 495-504. Lippincott Williams & Wilkins, Philadelphia, 2005.
Dornhurst A.C., Howard P. and Leathart G.L. Respiratory variations in blood pressure. Circulation, 1952, 6:553-558.
Düker H and Lienert G.A. Der Konzentrations-Leistungs-Test, Hogrefe, Göttingen, 1959.
Edelberg R. Relation of electrical properties of skin to structure and physiologic state. The Journal of Investigative Dermatology, 1977, 69:324-327.
Ekman, H. Elektroenkefalografian hitaimpien komponenttien mittaamiseen tarkoitetun laitteiston suunnittelu. Diplomityö, TKK, Espoo, 1994.
Fernandez M and Pallas-Areny R., Ag-AgCl Electrode Noise In High-Resolution ECG Measurements. Biomecal Instrumentation & Technology, 2000, 34:125-130.
Foley D., Corish J. and Corrigan O.I. Iontophoretic delivery of drugs through menranes insluding human stratum corneum. Solid State Ionics, 1992, pp. 53-56, 184-196.
Freeman WJ, Holmes MD, Burke BC, Vanhatalo S. Spatial spectra of scalp EEG and EMG from awake humans. Clin Neurophysiol., 2003 Jun;114(6):1053-68.
Fuchinoue T., Manaka S., Hirakawa K. and Sano K. Diagnostic value of stationary potential measurement in head injuries. Neurologia Medico-Chirurgica, 1974, 14(pt1):19-27.
Geddes L.A. and Baker L.A. Chlorided silver electrodes. Med. Res. Eng., 1967, Vol. 6, no 3:33-34.

47
Geddes L.A., Baker L.E. and Moore A.G. Optimum electrolytic chloriding of silver electrodes. Med. Biol. Eng., 1969, Vol 7, no 1:49-56.
Geddes L.A., and Roeder R., Measurement of the Direct-Current (Faradic) Resistance of the Electrode-Electrolyte Interface for Commonly Used Electrode Materials. Annals of Biomedical Engineering, 2001, Vol 29:181-186.
Girton D.G. and Kamiya J. A very stable electrode system for recording human scalp potentials with direct-coupled amplifiers. Electroencephalography and Clinical Neurophysiology, 1974, 37:85-88.
Girton D.G., Benson K.L., Kamiya J. Observation of very slow potential oscillations in human scalp recordings. Electroencephalography & Clinical Neurophysiology, 1973, Vol 35, No 6:561-8.
Goncharova I.I., McFarland D.J., Vaughan T.M., Wolpaw J.R. EMG contamination of EEG: spectral and topographical characteristics. Clinical Neurophysiology, 2003 Sep;114(9):1580-93.
Grimnes S. Impedance measurement of individual skin surface electrodes. Med.& Biol. Eng. & Comput., 1983a, 21:750-755.
Grimnes S. Dielectric breakdown of human skin in vivo. Med. Biol. Eng. & Computing., 1983b, 21:379-381.
Grimnes S. Pathways of Ionic Flow through Human Skin in vivo. Acta Derm. Venereol., 1984, 64:93-98.
Griss P, Tolvanen-Laakso H, Meriläinen P, and Stemme G. Characterization Of Micromachined Spiked Biopotential Electrodes. IEEE Transactions on biomedical engineering., 2002, Vol. 49, No 6:597-604.
Huigen E., Peper A. and Grimbergen C.A., Investigation into the origin of the noise of surface electrodes. Med. Biol. Comput., 2002, 40:332-338.
Held D, Fencl V, Pappenheimer J.R., Electric potential of cerebrospinal fluid. J. Neurophysiol., 1964, 27: 942-959.
Hari R,. Magnetoencephalography in Clinical Neurophysiological Assessment of Human Cortical Functions. In"Electroencephalography. Basic Principles, Clinical Applications, and Related Fields", 5th edition, E. Niedermeyer and F. Lopes da Silva, editors, pp. 1165-1197. Lippincott Williams & Wilkins, Philadelphia, 2005.
Ikeda A, Nagamine T, Yarita M, Terada K, Kimura J. and Shibasaki H. Reappraisal of the effect of electrode property on recording slow potentials. Electroencephalography and clinical Neurophysiology, 1998, 107:59-64.
Jasper H. The ten-twenty Electrode System of the International Federation in Electroencephalography and Clinical Neurophysiology. EEG Journal, 1958, 10 (appendix): 371-375.
Kahn, A., Greatbatch, W. Physiologic electrodes. Medical Engineering Ed. C. D. Ray. Yearbook Medical Publishers, Chicago, 1974.
Kaila K and Ransom B., editors. pH and Brain Function, 1st ed., Wiley-Liss. Inc., 694 p., ISBN-0-471-11838-9, 1998.
48
Kelly H.W. Controlled-release transdermal drug delivery. Cutis, 1985, 35: 204-207.
Knepp V., M., Hadgraft J., Guy R.H. Transdermal drug delivery: problems and possibilities. CRC Crit. Rev. Therapeutic Drug Carrier Syst. 1987, 4(1): 13-37.
Ko W.H. Active electrodes for EEG and evoked potential. Proc. of the 20th An. Int. Conf. of the IEEE Eng. in Medicine and Biology Soc. 20(4): 2221-2224, 1998.
Kofuji P, Newman. Potassium buffering in the central nervous system. Neuroscience, 2004, 29:1045-1056.
Koryta J. Ions, Electrodes and membranes. 2nd ed., Chichester, John Wiley & Sons, 1991, 198 p. ISBN-0-471-93079-2.
Lagerlund T.D. and Gross R.A. DC-EEG recording: a paradigm shift in seizure location? Neurology, 2003,60(7):1062-1063.
Lehmenkühler A, Richter F and Pöppelmann T. Hypoxia- and hypercapnia-induced DC potential shifts in rat at the scalp and the skull are opposite in polarity to those at the cerebral cortex. Neuroscience Letters., 1999, 270(2):67-70.
Loeschchke H.H., DC Potentials between CSF and Blood, in B.K. Siesjö & S.C. Sorensen, ed., Proceedings of the Alfred Benzon Symposium III, 1970.
Lykken D.T., Square-wave analysis of skin impedance. Psychophysiology, 1971,Vol 7, No 2:262-275.
Malmivuo, J.A. & Suihko, V.E. Effect of skull resistivity on the spatial resolutions of EEG and MEG. IEEE Transactions on Biomedical Engineering, 2004, 51, 7, pp. 1276-1280.
Manaka S. and Sano K. Stationary Potential of the brain: Part I. Basic studies. Neurol. Med. Chir., 1979, 19:643-653.
Marshall L., Molle M. and Born J. Spindle and slow wave rhythms at slow wave sleep transitions are linked to strong shifts in the cortical direct current potential. Neuroscience, 2003, 121: 1047-1053.
Marshall L. Molle M. Schreiber H. Fehm HL. Born J. Scalp recorded direct current potential shifts associated with the transition to sleep in man. Electroencephalography & Clinical Neurophysiology, 1994, Vol 91, No 5:346-52.
Martin I. and Venables P.H., Mechanisms of palmar skin resistance and skin potential. Psychological Bulletin, 1966, Vol 65, No 6:347-357.
McAdams E.T., Jossinet J., Lackermeier A., Risacher F., Factors affecting electrode-gel-skin interface impedance in electrical impedance tomography. Medical & Biological Engineering & Computing, 1996, 34:397-408.
McAdams E.T., Jossinet J., The importance of electrode-skin impedance in high resolution electrocardiography. Automedica., 1991, 13:187-208.
McAdams E.T., Jossinet J., DC nonlinearity of the electrode-electrolyte interface impedance. Innov. Technol. Biol. Med., 1992, 12(3):329-343.
Messeter K. Siesjo BK. The DC potential between CSF and plasma in respiratory acidosis. Acta Physiologica Scandinavica, 1971, 83(1):13-20.

49
Naumenko A.I., and Benua N.N. The physiological mechanims of cerebral blood circulation. Thomas, Springfield, Ill. 14-20, 1970.
Niedermeyer E., The Normal EEG of the Waking Adult, in E. Niedermeyer and F. Lopes Da Silva F, ed., Electroencephalography: Basic Principles, Clinical Applications, and Related Fields, 4th ed., Baltimore, USA, Williams & Wilkins, 1998, 149-173.
Nolan L.M.A., Corish J. and Corrigan O.I. Electrical properties of human stratum corneum and transdermal drug transport. J. Chem. Soc. Faraday Trans.,1993, 89(15):2839-2845.
Panescu D, Webster JG and Stratbucker RA. A Nonlinear Finite Element Model of the Electrode-Electrolyte-Skin system. IEEE Transactions on biomedical engineering. 1994, 41(7): 681-687.
Pasquali E. and Roveri R. Measurement of the electrical skin resistance during skin drilling. Psychophysiology, 1971, 8(2):236-8.
Picton T.W. and Hillyard S.A., Cephalic skin potentials in electroencephalography. Electroencephalography and Clinical Neurophysiology, 1972, 33:419-424.
Picton T.W., Bentin S, Berg P, Donchin E, Hillyard S.A., Johnson Jr R,. Miller G.A., Ritter W., Ruchkin D.S., Rugg M.D., Taylor M.J., Guidelines for using human event-related potentials to study cognition: recording standards and publication criteria. Psychophysiology, 2000, 37:127-152.
Pinkus, H. Examination of the epidermis by the strip method of removing horny layers. J. Invest. Dermatol. 1951, 16:383-386.
Radilova J. Pocock PV. Cooper R. Radil T. Cortical DC potential shifts and their possible glial origin. Activitas Nervosa Superior., 1987, 29(4):308-9.
Rockstroh B. Hyperventilation-induced EEG changes in humans and their modulation by an anticolvulsant drug. Epilepsy Research, 1990, 7:146-154.
Sano K. Recent advances in clinical neurophysiology. Advances in Neurological Science, 1968, 12:419-436.
Scheuplein R.J., Blank I.H., Permeability of the skin, Physiol. Rev., 1971, 51:702-747.
Scheuplein R.J., Permeability of the skin: A review of major concepts. Current problems in dermatology, 1978, 7:172-186.
Schmitt B, Marshall L, Nitsche M, Hallschmid M, Eulitz C, Born J,. Slow cortical DC-potential responses to sweet and bitter tastes in humans. Physiol. Behav., 2000, 71: 581–587.
Shackel B., Skin drilling: a method of diminishing galvanic skin potentials. Amer. J. Psych., 1959, 72:114-121.
Sharata HH. Burnette RR. Effect of dipolar aprotic permeability enhancers on the basal stratum corneum. Journal of Pharmaceutical Sciences, 1988, 77(1):27-32.
Sigl J.C, Chamoun N.G., An introduction to bispectral analysis for the electroencephalogram. J Clin Monit., 1994, Nov;10(6):392-404.

50
Da Silva. EEG analysis: Theory and Practise. In"Electroencephalography. Basic Principles, Clinical Applications, and Related Fields", 5th edition, E. Niedermeyer and F. Lopes da Silva, editors, pp. 1199-1232. Lippincott Williams & Wilkins, Philadelphia, 2005.
Singer W., Consciousness and the binding problem. Annals of the New York Academy of Sciences., 2001, 929:123-46.
Speckmann E.J. and Elger E.E. Introduction to the neurophysiological basis of the EEG and DC potentials. In"Electroencephalography. Basic Principles, Clinical Applications, and Related Fields", 5th edition, E. Niedermeyer and F. Lopes da Silva, editors, pp. 1199-1232. Lippincott Williams & Wilkins, Philadelphia, 2005.
Speckmann E.J., Caspers H. and Elger C.E. Neuronal Mechanisms Underlying the Generation of Field Potentials, in T. Elbert, ed., Self-Regulation of the Brain and Behavior, Springer Verlag, 1984.
Sorensen E, Olesen J, Rask-Madsen J, Rask-Andersen H. The electrical potential difference and impedance between CSF and blood in unanesthetized man. Scand J Clin Lab Invest., 1978, 38: 203-207.
Taheri B.A., Knight R.T., Smith R.L. A dry electrode for EEG recording. Electroencephalogr Clin Neurophysiol., 1994, 90(5):376-83.
Talhouet H. and Webster J.G., The origin of skin-stretch-caused motion artifacts under electrodes. Physiol. Meas, 1996, 17:81-93.
Tam H.K., Webster J.G., Minimizing Electrode Motion Artifact by Skin Abrasion, IEEE Transactions on Biomedical Engineering, 1977, Vol. BME-24, No 2:134-139.
Tarchanoff J. Ueber die galvanischen Ersscheinungen in der Haut des Menschen bei Reizungen der Sinnesorgane und bei verschiedenen Formen der psychischen Thätigkeit. Archiv für die gesammte Physiologie des Menschens, 1890, 46:46-55.
Thakor N.V., and Webster J.G., The origin of skin potential and its variation. Proc. Ann. Conf. Eng. Biol. Med., 1978, 20:212.
Thomas P.E., and Korr I. M., Relationship Between Sweat Gland Activity And Electrical Resistance of The Skin. J. Appl. Physol., 1957, 10(3):505-510.
Tomita-Gotoh S. and Hayashida Y. Scalp-recorded direct current potential shifts induced by hypocapnia and hypercapnia in humans. Electroenceph. and Clinical Neuroph., 1996, 99:90-97.
Toyokura M. Waveform variation and size of sympathetic skin response: regional difference between the sole and palm recordings. Clinical Neurophysiology., 1999, 110:765-771.
Trimmel M. Mikowitsch A. Groll-Knapp E. Haider M. Occurrence of infraslow potential oscillations in relation to task, ability to concentrate and intelligence. International Journal of Psychophysiology., 1990, Vol 9, No 2:167-70.
Tschirgi R.D., Taylor J.L. Slowly Changing Bioelectric Potentials Associated With The Blood-Brain Barrier. Am. J. Physiol, 1958, 195: 7-22.
51
Vanhatalo S., Palva J.M., Holmes M.D., Voipio J. and Kaila K. Infraslow oscillations modulate excitability and interictal epileptic activity in the human cortex during sleep. Proc. Natl. Acad. Sci. USA. 2004, 101(14):5053-5057.
Vanhatalo S, Voipio J. and Kaila K. Full-band EEG (FbEEG): an emerging standard in electroencephalography. Clinical Neurophysiology, 2005, 116:1-8.
Vaidyanathan C. and Buckley K. A Sampling theorem for EEG electrode configuration. IEEE Transaction on Biomedical Eng., 1997, 44(1): 94-97.
Viertio-Oja H, Maja V, Sarkela M, Talja P, Tenkanen N, Tolvanen-Laakso H, Paloheimo M, Vakkuri A, Yli-Hankala A, Merilainen P. Description of the EntropyTM algorithm as applied in the Datex-Ohmeda S/5TM Entropy Module. Acta Anaesthesiol Scand., 2004, Feb;48(2):154-61. Walter W.G., Cooper R, Aldridge V.J., McCallum W.C. Winter, A.L. Contingent negative variation: An electric sign of sensorimotor association and expectancy in the human brain. Nature, 1964, 203:380-384.
Wilcott R.C., A partial independence of skin potential and skin resistance from sweating. Phychophysiology, 1964, 1:55-66.
Wilcott R.C. Inhibition of the cat's skin potential response by sensory stimulation pulsating at a low frequency. Exp Neurol., 1971, 32(1):22-9.
Woody C.D., Marshall W.H., Besson J.M., Thompson H.K., Aleonard P. and Albe-fessard D. Brain potential shift with respiratory acidosis in the cat and monkey. Am. J. Physiol., 1970, 218:275-283.
Woodrough R.E. and Watson B.W. The Effect of the Electrolyte Applied to the Surface of the Skin on the Measured Electrical Potential Difference in vivo; an Explanation of the Apparently Contradictory Results in the Literature. Phys. Med. Biol., 1975, 20(6):1021-1024.
Wurtz R.H. Physiological correlates of steady potential shifts during sleep and wakefulness. II. Brain temperature, blood pressure, and potential changes across the ependyma. Electroencephalogr. Clin. Neurophysiol., 1967, 22: 43-53.
Wurtz R.H., O'Flaherty J.J. Physiological correlates of steady potential shifts during sleep and wakefulness. I. Sensitivity of the steady potential to alterations in carbon dioxide. Electroencephalogr. Clin. Neurophysiol., 1967, 22: 30-42.
Yamamoto Y. Measurement and Analysis of Skin Electrical Impedance. Acta Derm. Venereol., 1994, Suppl 185:34-38.
Yokota T., Takahashi T., Kondo M., Fujimori B. Studies on the diphasic wave form of the galvanic skin reflex. EEG Clin. Neurophysiol., 1959, 11:687-696.
Zipp P. Impedance controlled skin drilling. Medical & Biological Engineering & Computing., 1983, 21(3):382-4.