Day2_Understanding Reactive Power
78
CHAPTER 1 UNDERSTANDING REACTIVE POWER
-
Upload
juzaili-js -
Category
Documents
-
view
228 -
download
3
Transcript of Day2_Understanding Reactive Power

CHAPTER 1
UNDERSTANDING REACTIVE POWER
CIGRE and IEEE define reactive power as “the portion of electricity that establishes
and sustains magnetic field of alternating current equipment, such as motors and transformers.
It also must supply reactive losses on transmission facilities. Reactive power is provided by generator,
synchronous condensers or electrostatic equipment such as capacitors, and directly
influence electric system voltage”.
REACTIVE POWER

For a DC circuit, power is : Pdc = V x I
For AC, power is:Pac = V x I cos
Cos is the power factor.
DC AND AC POWER
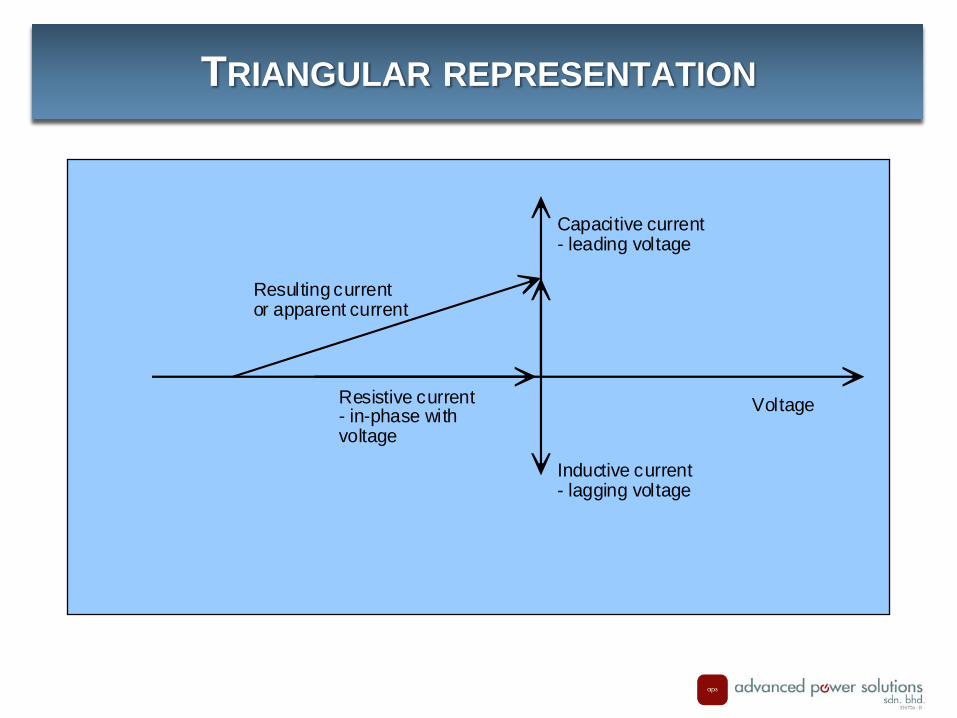
TRIANGULAR REPRESENTATION
Capacitive current- leading voltage
Voltage
Inductive current- lagging voltage
Resistive current- in-phase withvoltage
Resulting currentor apparent current

The basic relationship using Pythagoras theorem is applicable.
APPARENT CURRENT AND POWER
( )( )
( ) ( )22
22
22
sincos
,
φφ VIVIVI
orQPP
III
reactiveactiveapparent
reactiveactiveapparent
+=
+=
+=
Active Power (P) = 300kW
Reactive Power (Q) = 310kVAr
Apparent Power (S) = 431kVA
M, Power Factor Angle

A three-phase customer has a maximum demand of 300kW and draws current of 600 A at 415V. What is the power factor of the customer ?
Solution:
Power factor is defined as the cosine of the angle between the real and apparent power.
kVA = √3 VI = √3 x 0.415 x 600 = 431.3 kVA
Power factor = kW / kVA = 300/431.3 = 0.695Reactive power consumption,
kVAr = √(431.32 - 3002) = 309.8 kVAr
From the above information, do you know whether the reactive power is lagging or leading ?
EXAMPLE 1.1

No. Load Typical Power Factor
1. Incandescent lamp 1.00
2. Fluorescent lamp 0.95 – 0.97
3. Synchronous motors 1.00 to 0.80 lag & lead
4. Squirrel-cage motorsHigh-speedLow-speed
0.75 – 0.9 (at full speed)0.85 – 0.90 (at full speed)
5. Wound rotor induction motor 0.80 – 0.90 (at full speed)
6. Induction motorsFractional HP1 – 10 HP
0.55 – 0.750.75 – 0.85
7. Arc furnace 0.65 – 0.83
8. Aircond – 3-phase central 0.90
9. Aircond – 1-phase central 0.96
10. Aircond – window/split 0.82
11. Water heaters, oven, deep fryer 1.00
12. Dishwasher 0.99
13. Clothes dryer 0.99
14. Refrigerator 0.80
15. Television 0.80
16. Fan motors 0.87
17. Agricultural pump 0.85
18. Unloaded transformer 0.64

Reactive power for a distribution system are obtained from four major sources:
• Transmission system - generators and transmission elements• Distribution elements - lines and cables• Embedded generators• Capacitors - shunt or series
SOURCE OF REACTIVE POWER

Gen1136.00 kV150.00°
2.93 MW
12.19 Mvar
Gen2135.96 kV150.05°
-10
.00
M
6.6
9 M
v
-9.14 MW
5.35 Mvar
9.1
4 M
W
-5.5
7 M
va
r
Ma inIntak e13 5.40 k V14 9.74°
12.07 MW
6.81 Mvar
-12.05 MW
-7.88 Mvar
Gen3135.96 kV150.02°
-20
.00
M
-9.9
5 M
v
-20 .83 MW
- 11.22 Mvar
20
.86
MW
10.6
8 M
va
r
0.86 MW
-1.12 Mvar
-0 .8 6 MW
-0.73 Mvar
Mai n1 111.40 kV177.82°
- 14 .8 0 MW
- 9.61 Mvar
14 .8 7 MW
10.38 MvarLoa d11.20 kV177.63°
EmGen1 1.52 k V178.74°
3.0 2 MW
1.19 Mvar
-2.98 MW
-1.33 Mvar
1 .00 MW
-0.80 Mvar
-0 .98 MW
0.52 Mvar
12.75 MW
7.90 Mvar
2.97 MW
1.84 Mvar
-1.00 MW
0.80 Mvar
18.0 0 MW
8.72 Mvar -0 .00 MW
-0.52 Mvar
TRANSMISSION SYSTEM
DISTR IBUTION SYSTEM
EMBEDDEDGENERATION
GEN ERATION
SHUNT CAPACITOR

Transmission main intake purchase tariff:• energy charge, RM 0.13/kWh• demand charge, RM 20/kW
Energy charge in RM/kWh - reflects the fuel and operating costs for the generating units in the system.
Demand charge RM/kW reflects the cost of generation and transmission infrastructure.
In the new electricity market environment:• may also be charged for the reactive power from the system
Since reactive power required by the customers could be provided locally using shunt capacitors - this option is important.
IMPACTS OF REACTIVE POWER

Reduced transmission purchase Released capacity and delaying upgrade Reduction in losses Improved voltage level
BENEFITS OF LOCAL REACTIVE SUPPLY

A feeder comprising of 5km of 185 sq.mm. PILC Al cable is supplying a peak load of 3000 kVA at 0.85 power factor
Transmission purchase tariff is:Energy charge (Ec) = RM 0.13/kWhDemand charge (Dc) = RM 20/kW/month
Assume LF = 0.7, LLF = 0.5 .
EXAMPLE 1.2
NODE111.50 k V150. 00°
2613.36 kW
1465.68 k var
NODE211.22 k V150. 19°
2618.04 kW
1468.56 k var
-2550.01 kW
-1580.36 k var
2550.00 kW
1580.35 k var
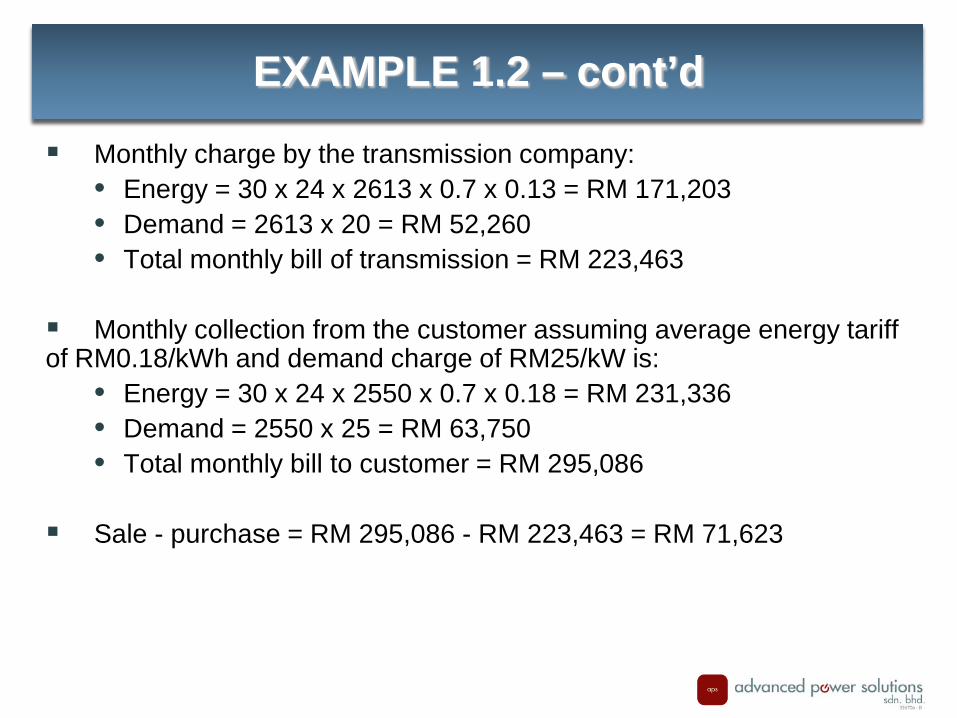
Monthly charge by the transmission company:• Energy = 30 x 24 x 2613 x 0.7 x 0.13 = RM 171,203• Demand = 2613 x 20 = RM 52,260• Total monthly bill of transmission = RM 223,463
Monthly collection from the customer assuming average energy tariff of RM0.18/kWh and demand charge of RM25/kW is:
• Energy = 30 x 24 x 2550 x 0.7 x 0.18 = RM 231,336• Demand = 2550 x 25 = RM 63,750• Total monthly bill to customer = RM 295,086
Sale - purchase = RM 295,086 - RM 223,463 = RM 71,623
EXAMPLE 1.2 – cont’d

List the differences ?
EXAMPLE 1.2 – INSTALL 1000kVAr CAPACITOR
NODE111.50 k V150. 00°
2613.36 kW
1465.68 k var
NODE211.22 k V150. 19°
2618.04 kW
1468.56 k var
-2550.01 kW
-1580.36 k var
2550.00 kW
1580.35 k var
Without Capacitor
NODE111.50 k V150. 00°
2596.19 kW
409.41 kv ar
NODE211.26 k V149. 73°
2601.65 kW
412.89 kv ar
-2550.01 kW
-532.14 kv ar
2550.00 kW
1580.35 kv ar
0.00 kW
-1048.22 kv ar
With Capacitor
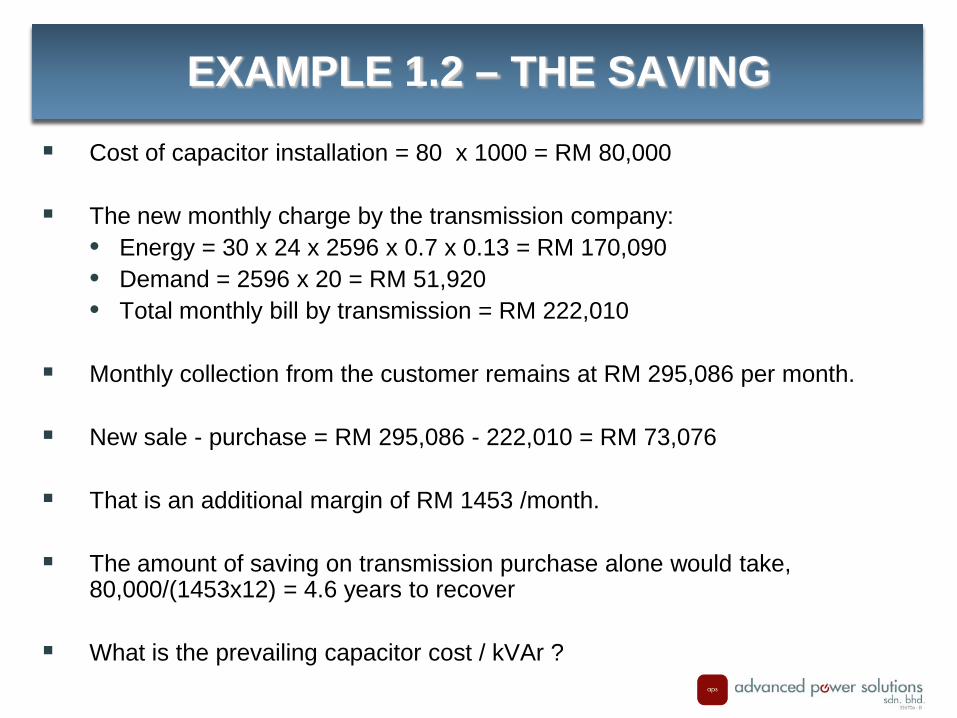
Cost of capacitor installation = 80 x 1000 = RM 80,000
The new monthly charge by the transmission company:• Energy = 30 x 24 x 2596 x 0.7 x 0.13 = RM 170,090• Demand = 2596 x 20 = RM 51,920• Total monthly bill by transmission = RM 222,010
Monthly collection from the customer remains at RM 295,086 per month.
New sale - purchase = RM 295,086 - 222,010 = RM 73,076
That is an additional margin of RM 1453 /month.
The amount of saving on transmission purchase alone would take, 80,000/(1453x12) = 4.6 years to recover
What is the prevailing capacitor cost / kVAr ?
EXAMPLE 1.2 – THE SAVING

Without capacitor - loading almost 50%
Assume that installation of a second feeder is the preferred option at the cost of RM 122,000/km.
• Cost of investment is 5 x 122,000 = RM 610,000
EXAMPLE 1.2 - RELEASED CAPACITY & DELAYUPGRADE
NODE111.50 kV150.00°
150.43 A
90.71°
NODE211.22 kV150.19°
150.70 A
90.71°
154.34 A
268.40°
89.11 A
118.40°

Install capacitor
With growth rate of 5% /year, the reinforcement delayed for 5 years. • Investment deferred = 610,000 - 80,000 = RM 530,000• Accumulated for 5 years at 8% is:
530,000 x (1 + 0.08)5 = RM 778.740• Total interest collected /avoided = 778,740 - 530,000 = RM 248,740
EXAMPLE 1.2 - RELEASED CAPACITY & DELAYUPGRADE
NODE111.50 kV150.00°
131.95 A
111.04°
NODE211.26 kV149.73°
132.25 A
110.98°
133.54 A
287.94°
88.79 A
117.94°
53.74 A
209.73°
Not the normal way of calculating the benefit of shunt capacitor installation.
It serves to illustrate the significant amount of financial benefit of loss reduction. While saving purchase of power from the transmission company provides only a modest benefit, the most significant benefit is released in capacity which means that:
• Additional load could be accommodated without significant new investment, or
• Reinforcement required could be significantly delayed avoiding early investment and cost of financing
Think of your overloaded solution !!
EXAMPLE 1.2 – MESSAGE

A more rigorous approach to the economic evaluation procedure is as follows:
• Model the system snapshots for peak, medium and light load conditions.
• Perform capacitor placement using CAPO to determine saving due to loss reduction - saving in transmission purchase.
• Evaluate separately benefit of released capacity/delayed investment -if necessary.
Chapter 3 provides more detailed discussions on planning of capacitor installations and economic evaluations.
ECONOMIC EVALUATION METHOD

REACTIVE/ACTIVE POWER RATIO
Country/RegionSystem Reactive / Active Power
At system peak At system troughGermany 0.415 0.431U.K 0.274 0.362Japan 0.276 0.088Australia 0.428 0.617Denmark 0.478 0.539Norway 0.455 0.478U.S.A 0.197 0.080Ref: A.S Pabla, Electric Power Distribution, Tata-McGraw Hill, 1997
Peninsular Malaysia TNB 1997 Load SurveyCentral 0.486 0.372Eastern 0.344 0.311North 0.413 0.364South 0.477 0.416

Generally the cost of producing 1 kVAr of reactive power at the generator end is about 4% of producing 1kW.
Assuming an average generation cost of 12 cent / kWh, the cost for 1kVArh is about 0.5 cent. As compared to an average cost of medium voltage capacitor of about RM 80/kVAr, reactive generation cost is insignificant.
Question: What are the economic reasons for the emphasis on reactive
compensation?
COST OF REACTIVE GENERATION

Spread the cost of 8000 cent plus 3% for O&M uniformly over 5 years (assumed life of the capacitor), assuming 8% discount rate.
Annual cost / kVAr = 8240/3.9927 = 2064 cent
Total kVArh produced/year assuming 100% availability = 8760 kVArh.
Therefore, cost / kVArh = 2064/8760 = 0.24 cent.
SPREAD THE COST OF THE CAPACITOR OVER THE LIFE
( )∑= +
= 5
1 08.011
8240cost Annual
jj

Local (shunt capacitor) production of reactive power is half of the cost producing it at the generator end.
Can be further justified if the cost of using the transmission and distribution network to deliver the reactive power from the generator, those are, cost of losses and additional capacity - TUOS & DUOS
CAPACITOR COST

Countries that depend significantly on oil and gas for power generation tend to focus on local shunt compensation and controls
Those countries blessed with cheap energy resources such as hydros tend to bother less.
What about Malaysia, particularly TNBD ? Where do we stand ? Which is the best example to follow ?
WHERE ARE WE?

CHAPTER 2
REACTIVE POWER PLANNING
REACTIVE POWER PLANNING (RPP)
• Reactive power planning is concerned with the installation or removal of reactive power equipment in a power system. Typically, this effort is directed at system conditions from several months to several years in the future
• The key is the optimal allocation of reactive power sources considering location and size. Traditionally, the locations for placing new Var sources were either simply estimated or directly assumed.
• The optimization formulation of reactive power planning consists of the objective functions and the constraints.
OBJECTIVES OF RPP
• The objective function of reactive power planning may be cost-based, which means to minimize the possible cost associated with reactive power planning such as;– To minimize Var cost– To minimize power loss cost– To minimize operation cost (generation fuel cost)
• Other possible objectives include;– To minimize the deviation from a given schedule of a control variable (such
as voltage) – To maximize voltage stability margin
CONSTRAINTS OF RPP
• Constraints may include; – Normal state (base case) power flow limits and the contingency
state power flow limits– Voltage stability limits under both normal state and contingency
state (due to increased pressure of voltage stability and stressed transmission systems)

OPTIMIZATION MODELS
• Different constraints are the key of various optimization models normally identified as;
• Optimal Power Flow (OPF) model• Security-constrained OPF (SCOPF)• SCOPF with voltage-stability consideration
• Optimization-based models will be categorized as;• Conventional algorithms – linear programming, non-linear
programming, mixed-integer programming, etc• Intelligent searches – simulated annealing, evolutionary
algorithms, tabu search• Fuzzy set applications – address the uncertainties in objectives
and constraints

PLANNING PROBLEMS
• Usually, the planning problem is divided in two sub-problems;– The operation planning problem
• The reactive power sources are dispatched and the transformer tap values explored to ensure minimum costs
– The investment planning problem• The optimal location of new reactive power sources is explored
over a long-term planning horizon for a minimum total cost (operation & investment)

CHAPTER 3
TYPE OF SHUNT CAPACITOR AND INSTALLATION

Reactive power compensation:• series• shunt
Each can be divided into:• active • passive
Common forms of reactive compensation:• series capacitor banks• shunt reactor• shunt capacitor• static var compensators
Under-load transformer tap changing also provides voltage/reactive power control Series reactors are used for short-circuit level containment.
TYPES OF COMPENSATION

Reactive power flow depends mainly on voltage magnitudes and flows from the highest voltage to the lowest voltage.
Question: What is the reason for the reactive power received at Node 2 is greater than the reactive power sent by Node 1 ?
REACTIVE POWER FLOWS
NODE111.50 kV150.00°
NODE211.22 kV150.19°
2.61 MW
1.47 Mvar
2.62 MW
1.47 Mv ar
-2.55 MW
-1.58 Mvar
2.55 MW
1.58 Mvar

Traditionally been applied on long transmission lines for improving transient stability.
Nowadays series capacitors are also applied on shorter transmission lines and distribution network for improving voltage stability and regulation.
Series compensation has often been found to be cost effective as compared to shunt compensation.
However, series compensation is not a popular choice because of unfamiliarity (lack of practical experience) and because of excessive concern over sub-synchronous resonance.
Generally, sub-synchronous resonance is often not a major problem (especially in distribution), and low cost countermeasures would provide solution to this problem.
SERIES COMPENSATION

1) A series capacitor located in the middle of a long (20km) distribution cable.
No compensation, voltage at node 2 is well below criteria of 10.45kV with total loss incurred of about 305kW.
IMPACT OF SERIES COMPENSATION
NODE111 .50 kV1 50.00°
N ODE21 0 .3 1 kV1 50.42°
2 .86 MW
1.1 9 Mvar2 .86 MW
1.1 9 Mvar
-2 .71 MW
-1.4 1 Mvar
2.5 5 M W
1.5 8 Mvar
N ODE31 0 .9 1 kV1 50.05°
NODE410 .9 2 kV1 50.11°
2. 71 M W
1.4 0 Mvar
-2.55 MW
-1.5 8 Mvar
2.7
1 M
1.4
1 M
-2.7 1 M W
-1.4 0 Mvar
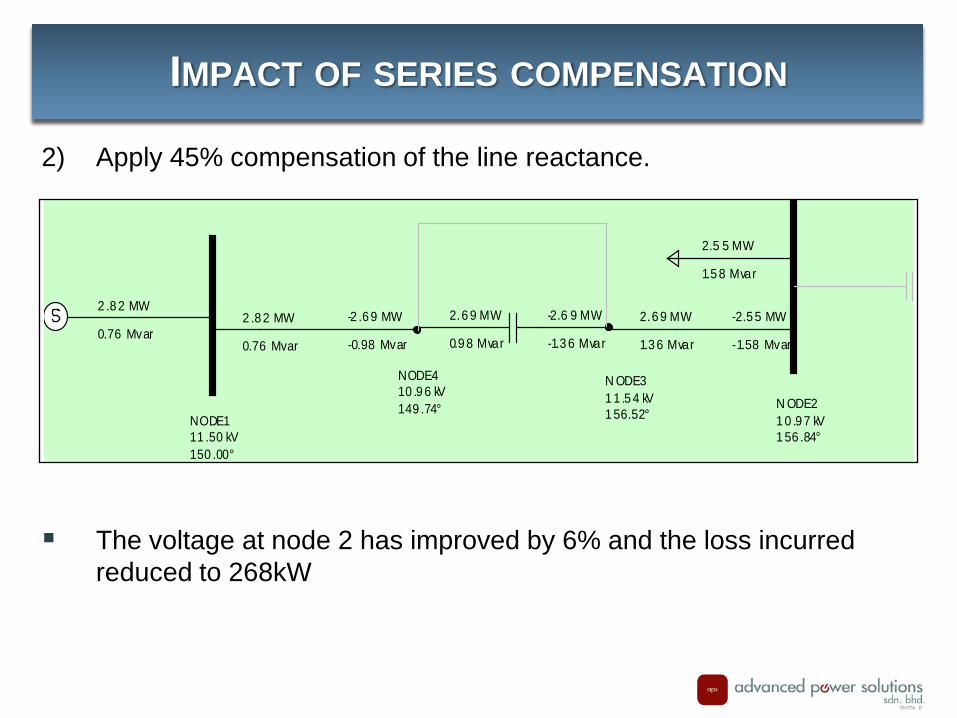
2) Apply 45% compensation of the line reactance.
The voltage at node 2 has improved by 6% and the loss incurred reduced to 268kW
IMPACT OF SERIES COMPENSATION
NODE111 .50 kV150 .00°
N ODE21 0 .9 7 kV1 56 .84°
2 .8 2 MW
0.76 Mvar2 .8 2 MW
0.76 Mvar
-2 .6 9 MW
-0.98 Mvar
2.5 5 MW
1.5 8 Mvar
N ODE31 1 .5 4 kV1 56.52°
NODE410 .9 6 kV149 .74°
2.6 9 MW
0.9 8 Mvar
-2.6 9 MW
-1.3 6 Mvar
2.6 9 MW
1.3 6 Mvar
-2.5 5 MW
-1.58 Mvar

3) Put shunt compensation to have equal amount of reactive power absorbed and used by node 1 and node 2.
The voltage improvement is about 2.4% and the total loss incurred reduces to 228kW.
SERIES AND SHUNT COMPARED
NODE111 .50 kV1 50 .00°
N ODE21 0 .5 6 kV1 47 .88°
2 .7 8 MW
-0.22 Mvar2 .7 8 MW
-0.22 Mvar
-2 .6 6 MW
-0.01 Mvar
2.5 5 MW
1.5 8 Mvar 0.0 0 MW
-1.3 7 Mvar
N ODE31 1 .0 4 kV1 48.83°
NODE411 .0 4 kV1 48 .89°
2.6 6 MW
0.0 1 Mvar
-2.5 5 MW
-0.21 Mvar
2.6
6 M
0.01
M -2.6 6 MW
-0.0 1 Mvar
Series compensation has significant impact on voltage improvement.
Shunt compensation is more significant for loss reduction.
If for example more shunt capacitor is added to improve the voltage to the level afforded by the series compensation, the losses would increase to about 494 kW.
Generally:• When voltage is the main concern series compensation is a more
effective solution. • When both voltage and losses are the considerations, shunt
compensation is the preferred option.
SERIES AND SHUNT COMPARED

Transmission shunt compensation near load areas are for voltage control and load stabilization.
Shunt capacitor banks are always bus connected. Shunt reactors may be either bus connected or line connected.
Application of shunt capacitor in distribution system is not only for voltage control but also include power factor improvement, losses reduction and reducing feeder capacity.
It is apparent that it would be economical if transmission/distribution lines are used to transfer only active power.
Reactive power required by loads are met within the distribution system at the customer or at the most, the substation level.
This would enable optimum utilization of assets, improve the operational performance and reduce energy loss.
SHUNT CAPACITOR AND REACTOR

LV capacitors are installed in the distribution system at:• substation LV boards, overhead lines/poles• consumer motors
When the shunt capacitors are located at the reactive power consuming loads of the customers, it provides advantages in terms of reduced KVA demand and losses as well as stable voltage.
The same advantages apply to the Distributor when capacitors are installed in the LV network.
LV CAPACITORS INSTALLATION

LV capacitors at motor terminals preferred because:• It can be controlled by the same control gear which controls the motor.• If the capacitor are connected on the LV motor connection, losses
both on the HV and LV will also be reduced.• The capacitors being directly connected to the motors come into
operation when the motors are in service and are out automatically when the motors are not in use.
Capacitors on LV system:• Capacitors at LV board or LV lines may require switching operations. • With new loads, the location of the capacitors will have to be changed
from time to time to give best result.
What if you do not have access to the loads - motors etc.. ?
LV CAPACITORS CLOSER TO LOADS

Whenever possible capacitor unit of a standard voltage rating should be used since they are generally less expensive than those with special voltage ratings.
It is desirable to choose capacitor units with voltage rating such that each series group contains a large number of units in parallel.
Proper selection of capacitor unit voltage and kVAr rating requires evaluation of three factors• Allowable number of units per group• Parallel stored energy• Cost
LARGE BANK UNITS

Two criteria are applied when determining the minimum allowable number of parallel capacitor unit in each phase:
• The loss of one capacitor unit in a phase should not produce a voltage across the remaining units in that phase exceeding 110 percent of the rated voltage.
• In the event of failure of a unit, sufficient fault current should flow through the individual fuse to ensure clearing in 300 seconds or less. It should be pointed out that a 30s or less is a more desirable time span.
NO OF PARALLEL UNITS/PHASE

4.82F or Xc = 660 ohm p.u
RYB
19.05kV
57.6 A 57.6 A 57.6 A
Using the result of the previous class exercise, determine the over-voltage in the event of one capacitor unit failure in any one phase.
CLASS EXERCISE

Model the configuration
Can see the impact on weak source
USE PSS/ADEPT TO MAKE THIS
NODE119057.66 V120.00°
0.01 kW
-2750.73 kv ar
NODE219045.13 V0.00°
NODE319057.77 V240.00°
NODE419059.59 V120.00°
0.00 kW
-549.54 kv ar
-0.00 kW
549.57 kv ar
-0.00 kW
1100.60 kv ar
0.00 kW
-1100.49 kv ar
-0.00 kW
1100.81 kv ar
0.00 kW
-1100.70 kv ar
-0.00 kW-549.57 kv ar
0.00 kW
-550.30 kv ar
0.00 kW-550.30 kv ar
0.00 kW
-550.41 kv ar
0.00 kW-550.41 kv ar

USE PSS/ADEPT FOR SLG FAULT CURRENT
NODE119.50 V92.75°
0.58 kA
3.90°
NODE20.00 V93.90°
NODE30.00 V0.00°
NODE40.00 V0.00°
0.58 kA
3.90°
0.58 kA
183.90°
0.00 kA
0.00°
0.00 kA
0.00°
0.00 kA
0.00°
0.00 kA
0.00°
0.58 k
A3.9
0°
They are packaged in units that are rated up to 2.5kVAr single phase.
The units are connected in delta and package in groups to give the desired phase rating.
They have an internal pressure switch that will disconnect the unit if there is an internal fault.
They also have an internal resistor that bleeds of the charge within five minutes.
LV CAPACITORS

Fixed compensation on transformer LV - compensate for transformer reactive consumption.
Min kVAr = Tx kVA x % Z/200For 1000kVA, 6% ZMin kVAr = 1000 x 6/200 = 30kVAr
Transformer11/0.415kV
NR
Y
B
Switch
HRC Fuses
EUROPEAN PRACTICE

Fused, delta-connected
LV POLE TOP CAPACITORS

Voltage Three Phase Units with Terminal Block and Fuses
Consult manufacturers
TYPICAL LV CAPACITOR SIZES
Voltages kVAR rating
240 5 – 25 in 2.5 kVAr steps 25 – 180 In 10 kVAr steps
480 5 – 50 in 2.5 kVAr steps 600 50 – 300 in 25 kVAr steps

Single and three-phase units Voltage: 1kV - 20kV kVAr: 120 - 1040 HV banks: Y-Y connected
HV CAPACITORS

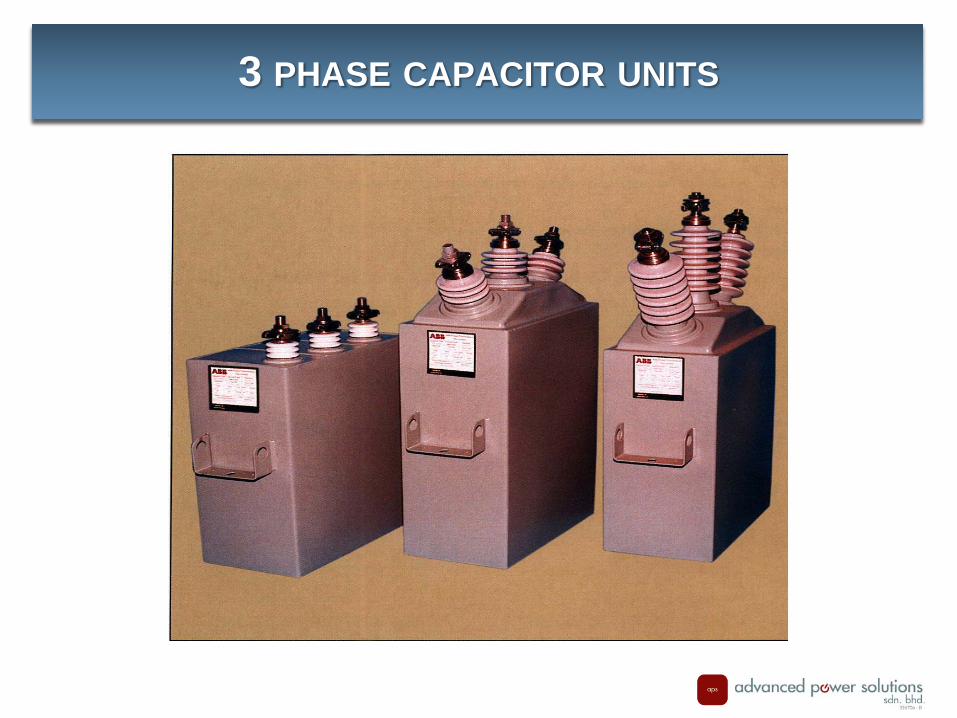
Ungrounded Y-connected Standard Manufacturer’s size: 50 - 450 kVAr, 3-phase Unfused Indoor & outdoor use Voltage 3.3kV upwards Connection: in series 1, in parallel many Suitable for small installation
3-PHASE HV UNITS
450 kVAr, 3-phase
150kVAr/phase
3 PHASE CAPACITOR UNITS

H-POLE INSTALLATION OF 3-PHASE UNIT
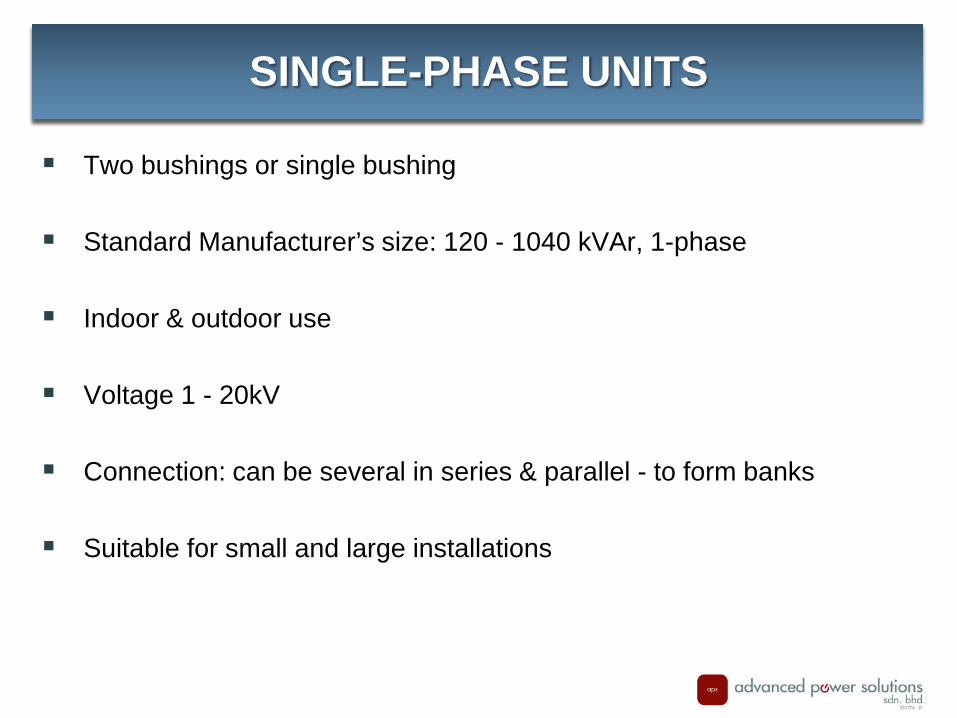
Two bushings or single bushing
Standard Manufacturer’s size: 120 - 1040 kVAr, 1-phase
Indoor & outdoor use
Voltage 1 - 20kV
Connection: can be several in series & parallel - to form banks
Suitable for small and large installations
SINGLE-PHASE UNITS
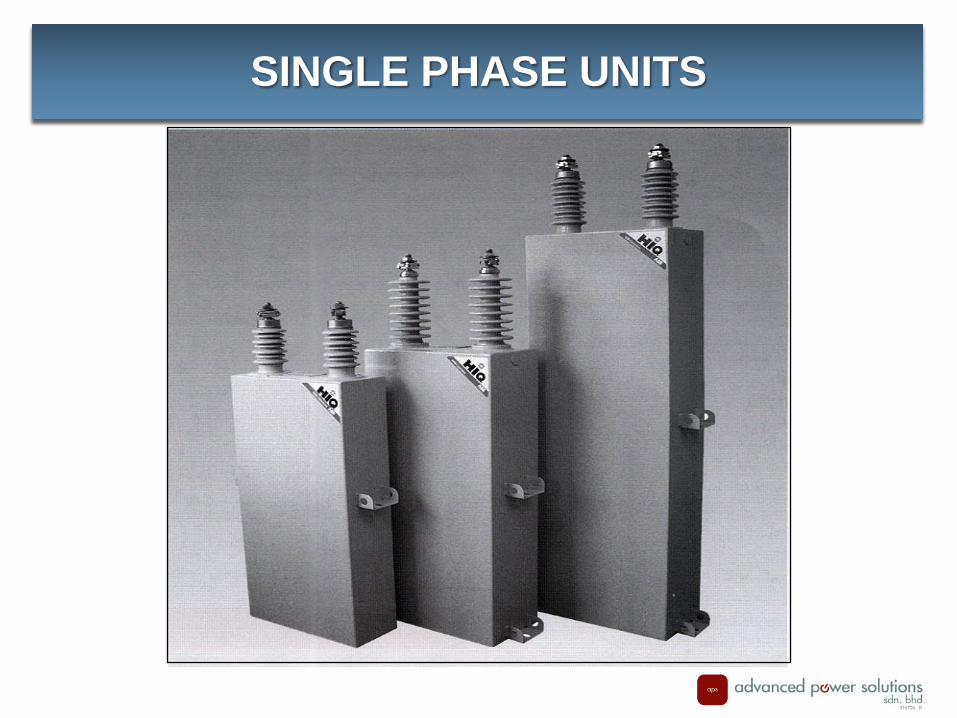
SINGLE PHASE UNITS
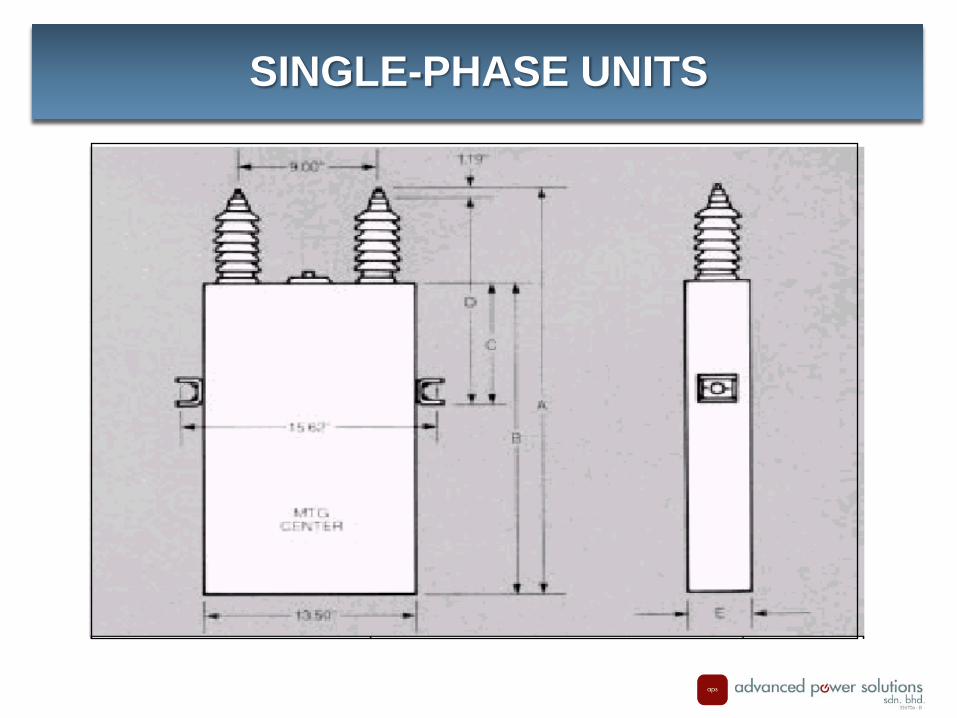
SINGLE-PHASE UNITS

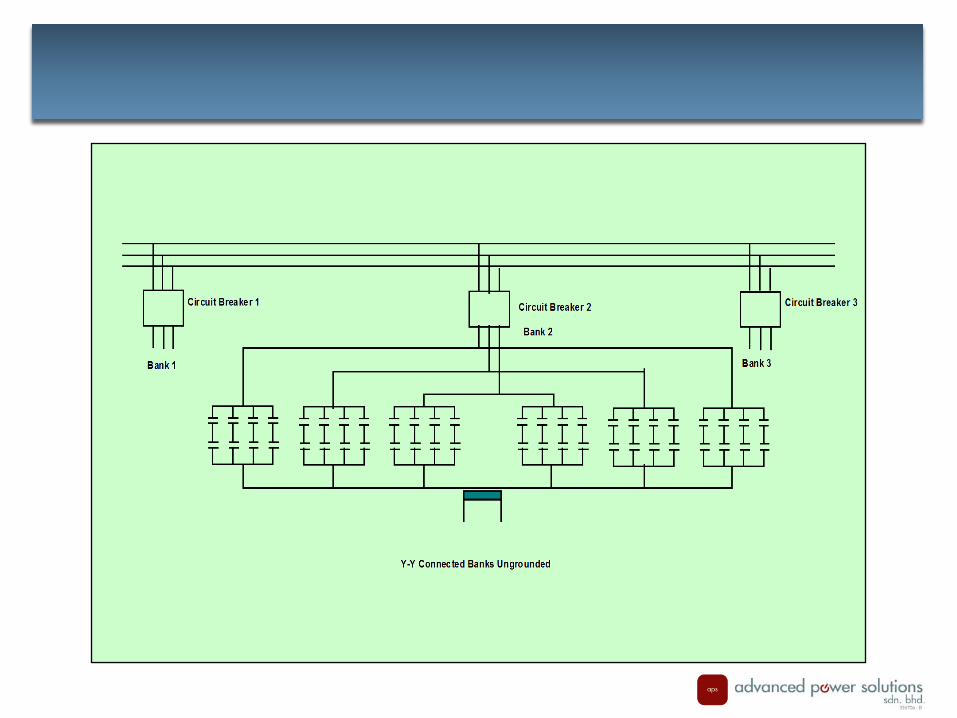
How are the units connected in series & parallel ?
SINGLE PHASE UNITS TO FORM BANKS

H-POLE INSTALLATION OF SINGLE PHASE UNITS
Underground cables
Fuses
Single-phase capacitor units
H-Pole Capacitor Installation

POLE-MOUNTED RACK FOR 1-PHASE UNITS

SINGLE PHASE ASSEMBLIES AND BREAKERS

Applicable standards :IEEE/ANSI #18, IEC 871-1Rated Voltage :2.4 to 21.6 kVRated Frequency :60 Hz rated (50 Hz Capable)Permissible Overloads
Current :180%Voltage :110%kVAr :135%
Capacitor Tolerance :-0, +10%Fusing :External (Fuses Optional); Internally Fused
available upon requestTemperature Rating :-50 to 50 oCAltitude :1000 m (Standard Design)Discharge Device :Internal Discharge ResisterDischarge Time :300 sec. (IEEE) to < 50 V (Available on
request IEC - 600 sec. to < 75 V)
TYPICAL SPECIFICATIONS
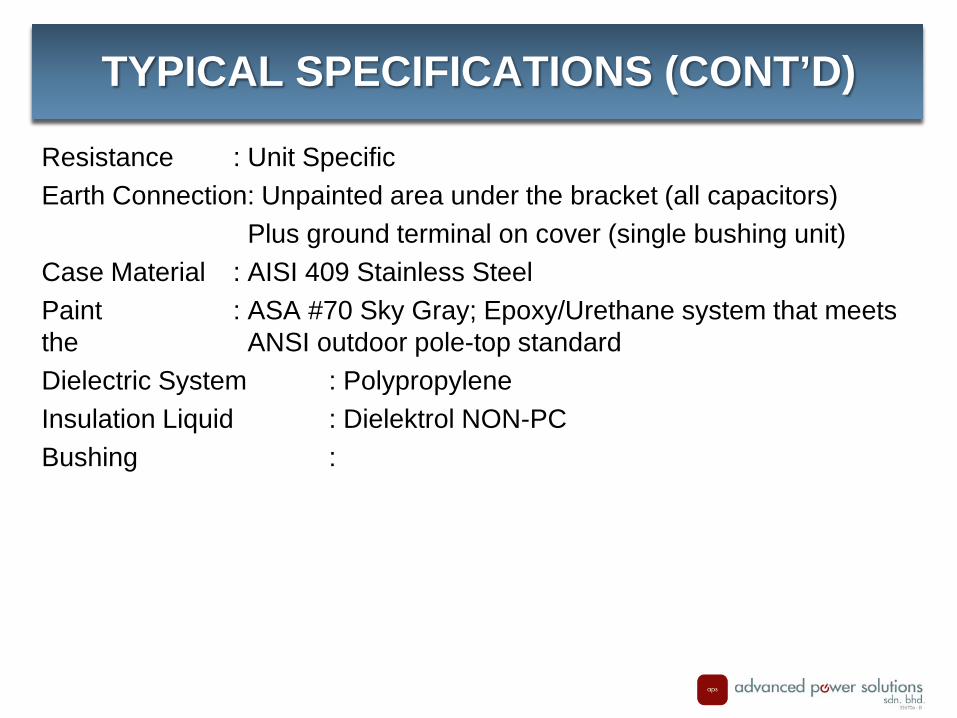
Resistance : Unit SpecificEarth Connection: Unpainted area under the bracket (all capacitors)
Plus ground terminal on cover (single bushing unit)Case Material : AISI 409 Stainless SteelPaint : ASA #70 Sky Gray; Epoxy/Urethane system that meets the ANSI outdoor pole-top standardDielectric System : PolypropyleneInsulation Liquid : Dielektrol NON-PCBushing :
TYPICAL SPECIFICATIONS (CONT’D)
Shunt capacitors can be connected in:• Grounded star• Ungrounded star• Delta
Delta connected bank is used exclusively with only one series per section per phase and for voltages up to 6.6kV.
For higher voltages, star-connected capacitors are usually used.
For star-connected capacitors, in general neutral of the capacitors is grounded only if the system or substation transformer is effectively grounded (solidly grounded).
DELTA, Y-CONNECTED CAPACITORS & GROUNDED OR UNGROUNDED

WHICH ONE IS FOR TNBD?
Ungrounded Y Ungrounded Y DeltaUNGROUNDED Y
GROUNDED Y DELTA

LV CAPACITOR CONFUGIRATION
MagneticContactorHRC Fuses
PFRegulator
CapacitorUnits To
LVDBIsolator
From CT
Capacitor Bank
Reactor
Capacitor BankBusbar

LV CAPACITOR CONFUGIRATION –cont’d
POWER FACTORREGULATORCT
TNB LVDB
REDYELLOW
BLUE
NEUTRAL

LV CAPACITOR CONFUGIRATION –cont’d

LV CAPACITOR CONFUGIRATION –cont’d
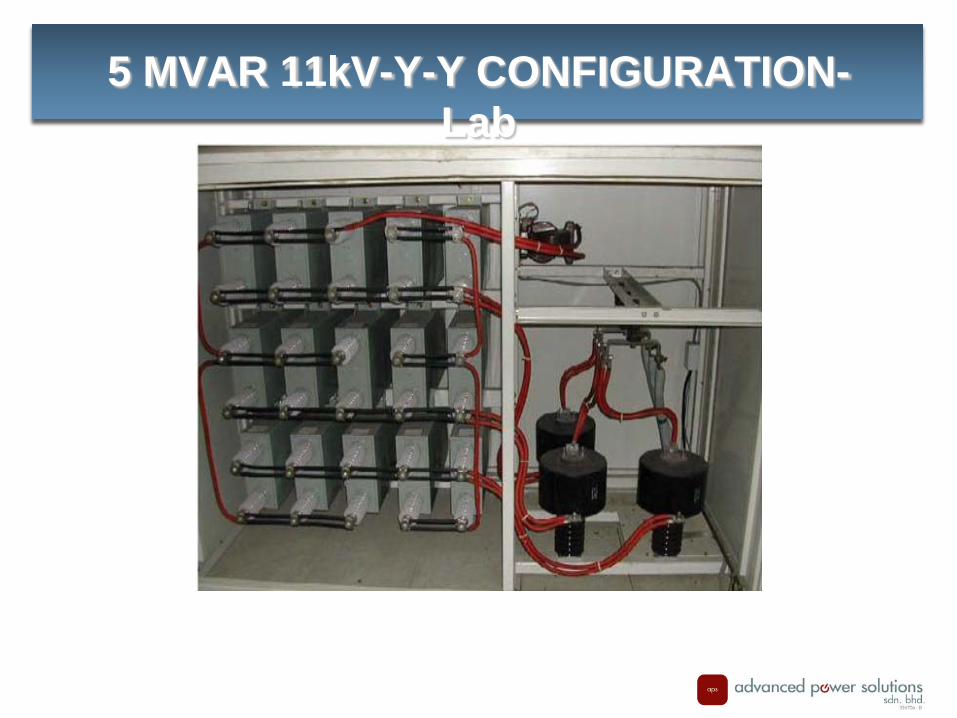
5 MVAR 11kV-Y-Y CONFIGURATION-Lab

5 MVAR 11kV-Y-Y CONFIGURATION-Lab (cont’d)

333 kVAr 6.35 kV-Y-Y CONFIGURATION-Lab

5 MVAR 11kV-Y-Y CONFIGURATION-Site
Cable BoxFuse
Inrush Reactor
Capacitor Bank15 Cans
(333.3kVAr per can)

LV POLE TOP CAPACITOR INSTALLATION-Lab

LV POLE TOP CAPACITOR INSTALLATION

LV POLE TOP CAPACITOR
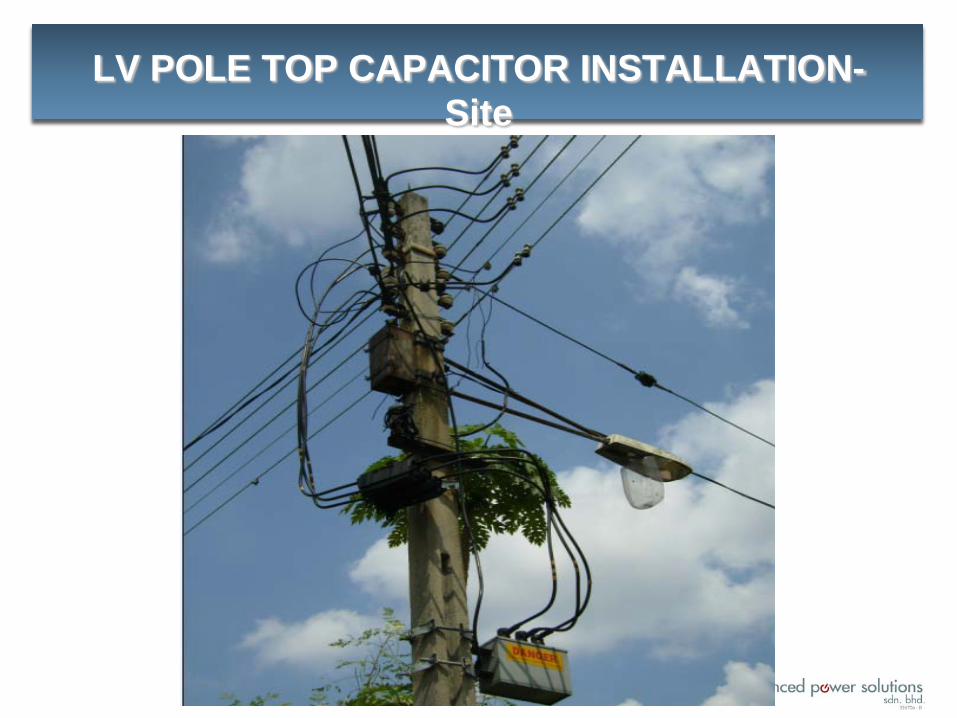
LV POLE TOP CAPACITOR INSTALLATION-Site