Day 1 - Observed Climate Trends and Projected Climate Change … · Payong PAGASA PAGASA The...
66
Payong PAGASA PAGASA The Weather and Climate Authority Observed Climate Trends and projected Climate Change in the Philippines Presented by: Thelma A. Cinco Assistant Weather Services Chief Philippine Atmospheric, Geophysical and Astronomical Services Administration
Transcript of Day 1 - Observed Climate Trends and Projected Climate Change … · Payong PAGASA PAGASA The...

PayongPAGASA
PAGASAThe Weather and Climate Authority
Observed
Climate Trendsand projected
Climate Changein the Philippines
Presented by:Thelma A. CincoAssistant Weather Services Chief
Philippine Atmospheric, Geophysical and Astronomical Services Administration

PayongPAGASA
PAGASAThe Weather and Climate Authority
Outline• Observed Trends: Global and the Philippines
• Climate Projections: SRES– and RCP– based climate projections
• Using the Climate Risk Analysis Matrix

PayongPAGASA
PAGASAThe Weather and Climate Authority
Distinguishing the difference
Weather• Is a specific meteorological
event or condition that happens over a period of hours or a few days.
Climate• The average weather
conditions over a long period of time (typically 30 years).

PayongPAGASA
PAGASAThe Weather and Climate Authority
Weather and climate information being provided by PAGASA
Past Present Future
PayongPAGASA
PAGASAThe Weather and Climate Authority
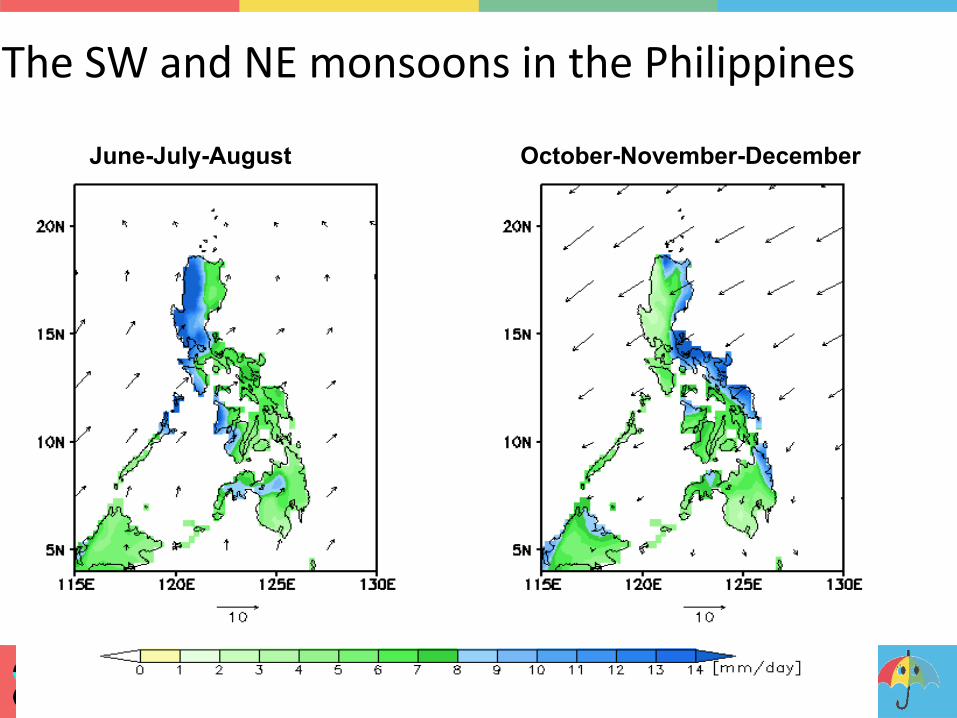
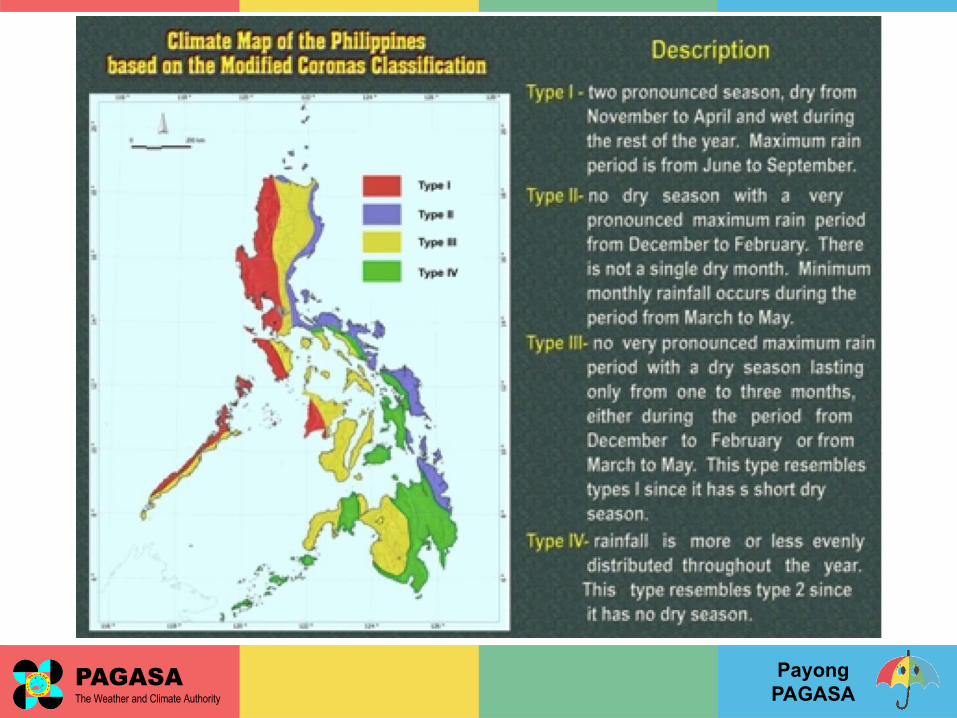
The SW and NE monsoons in the Philippines
June-July-August October-November-December
PayongPAGASA
PAGASAThe Weather and Climate Authority

PayongPAGASA
PAGASAThe Weather and Climate Authority
Climate variability refers to shorter term fluctuations in climate such as those caused by the El Niño Southern Oscillation (ENSO) Phenomenon.
What is Climate variability?

PayongPAGASA
PAGASAThe Weather and Climate Authority
El Niño La Niña
Source: http://www.esrl.noaa.gov
El Niño Southern Oscillation(ENSO)
PayongPAGASA
PAGASAThe Weather and Climate Authority
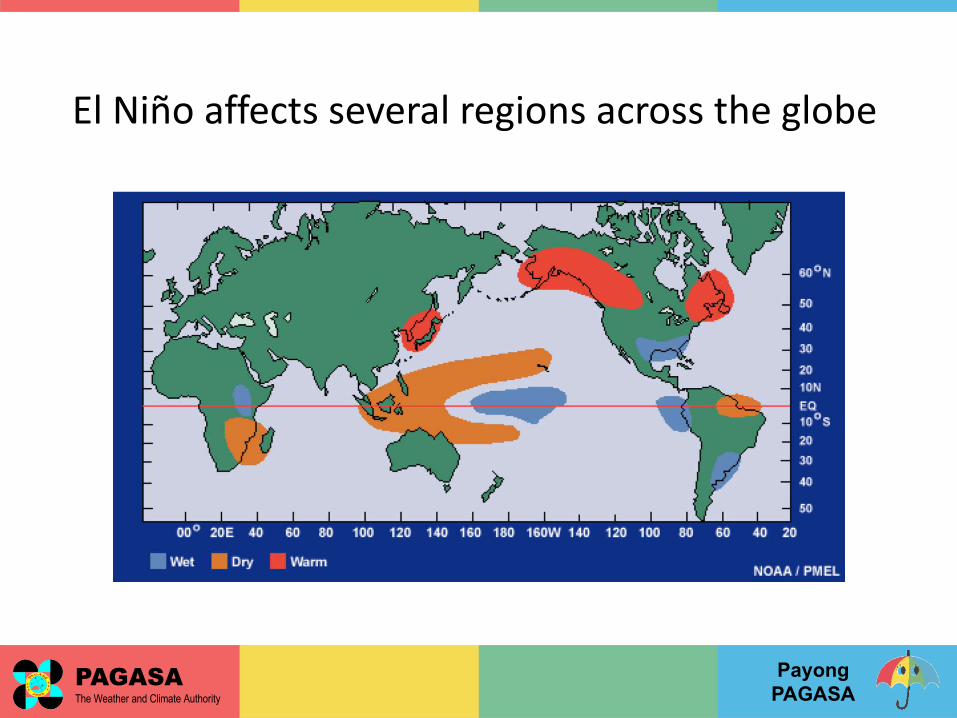
El Niño affects several regions across the globe

PayongPAGASA
PAGASAThe Weather and Climate Authority
Some of the Impacts of El Niño in the Philippines

PayongPAGASA
PAGASAThe Weather and Climate Authority
Some of the Impacts of La Niña in the Philippines
Landslide :Ginsaugon, Feb 2006
ST. BERNARD LANDSLIDE
Feb 2006

PayongPAGASA
PAGASAThe Weather and Climate Authority
Climate Change?Is that really happening?

PayongPAGASA
PAGASAThe Weather and Climate Authority
Global warming: Indicative of climate changeIs Global Temperature Rising?
0.85°C 1880-2012(IPCC AR5)
Source: IPCC AR5 WG1

PayongPAGASA
PAGASAThe Weather and Climate Authority
Global warming: Indicative of climate changeIs Global Temperature Rising?
Earth’s Long Term (1880-2016) Warming Trend (5-year average)
Source: National Aeronautics and Space Administration

PayongPAGASA
PAGASAThe Weather and Climate Authority
2016 global mean temperature is a record high

PayongPAGASA
PAGASAThe Weather and Climate Authority
August 2017 is the second highest

PayongPAGASA
PAGASAThe Weather and Climate Authority
DOST-PAGASAThe Weather and Climate Authority
Latest from WMO

PayongPAGASA
PAGASAThe Weather and Climate Authority
What are the ObservedClimate Trends in the
Philippines ?

PayongPAGASA
PAGASAThe Weather and Climate Authority
Observed climate trends in the Philippines:Over the past 65 years (1951-2015), a 0.68˚C increase in annual mean temperature has been observed
0.24˚C annual maximum temperature increase
0.99˚ C annual minimum temperature increase

PayongPAGASA
PAGASAThe Weather and Climate Authority
Wetting/drying tendency of annual total rainfall in the Philippines (1951-2010)
• Parts of central and northern Luzon
• Parts of eastern Visayas
• Northeastern and southwestern sections Mindanao
• Northern sections of Luzon
• Parts of western Visayas
• Central and western sections Mindanao

PayongPAGASA
PAGASAThe Weather and Climate Authority
Dec-Jan-Feb Mar-Apr-May Jun-Jul-Aug Sep-Oct-Nov
Increasing and decreasing trends in seasonal rainfall (1951-2010)
Source: IAAS, 2016
PayongPAGASA
PAGASAThe Weather and Climate Authority
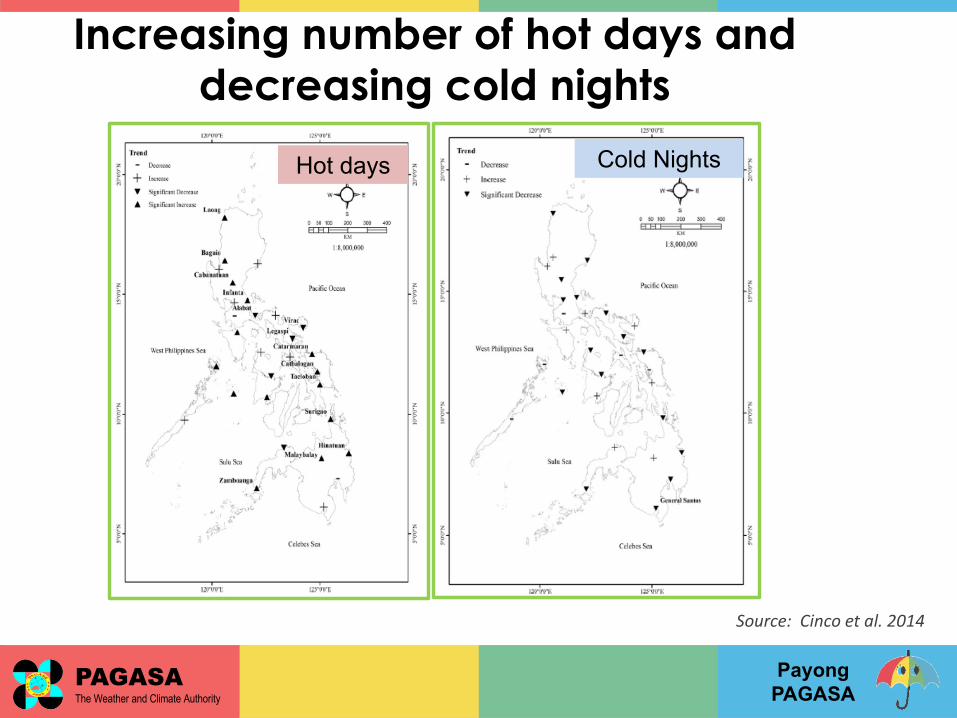
Increasing number of hot days and decreasing cold nights
Source: Cinco et al. 2014
Hot days Cold Nights

PayongPAGASA
PAGASAThe Weather and Climate Authority
Increasing frequency of extreme rainfall events (1951–2010)
Intensity Frequency
Source: Cinco et al. 2015

PayongPAGASA
PAGASAThe Weather and Climate Authority
Source: Cinco et al., 2016
Slightly decreasing in number of Tropical Cyclones TCs

PayongPAGASA
PAGASAThe Weather and Climate Authority
Slightly increasing number of intense TCs (maximum sustained winds >170kph)

PayongPAGASA
PAGASAThe Weather and Climate Authority

PayongPAGASA
PAGASAThe Weather and Climate Authority
Frequency of Tropical Cyclones which crossed the Metro Manila for the period 1948 to 2016

PayongPAGASA
PAGASAThe Weather and Climate Authority
Will those changes continue in the future?

PayongPAGASA
PAGASAThe Weather and Climate Authority
Understanding the difference
Weather forecast• The state of the atmosphere
(or the weather situation) at a particular location over a short period of time
• Highly dependent on the initial state of the atmosphere and the upper ocean
Climate projection• A likelihood of something to
happen in climate several decades or centuries in the future
• Conditional climate expectations based on scenarios (e.g., increase in green house gases)

PayongPAGASA
PAGASAThe Weather and Climate Authority
ClimateProjections
Understanding how
are made

PayongPAGASA
PAGASAThe Weather and Climate Authority
SCEN
ARIO SRES - Special Report on
Emissions Scenarios RCP – Representative Concentration Pathways
DESC
RIPT
ION Socio-economic driven scenarios Emission-driven scenarios
Describes a wide range of potential futures for the main drivers of climate change –greenhouse gases, air pollutant emissions & land use
BASE
S
• Demography• Economic development• Regionalization• Energy production/use• Technology • Agriculture• Forestry• Land use
RADIATIVE FORCINGRCP scenarios are new scenarios that specify concentrations and corresponding emissions,
(No fixed sets of assumptions related to population growth, economic development, ortechnology associated with any RCP)
NAM
ES A1, A2, B1, B2 families RCP 2.6, 4.5, 6.0, 8.5 (Wm-2)
Different scenarios

PayongPAGASA
PAGASAThe Weather and Climate Authority
Source: IPCC AR5 WG1
SRES vs RCP
RC
P 8.
5 Rising radiative forcing pathway leading to 8.5 W/m² in 2100.
RC
P 6
Stabilization without overshoot pathway to 6 W/m² at stabilization after 2100
RC
P 4.
5
Stabilization without overshoot pathwayto 4.5 W/m² at stabilization after 2100
RC
P 2.
6 Peak in radiative forcing at ~ 3 W/m² before 2100 and decline
Comparison of CO2 concentrations from SRES (A1B, A1FI, A2, B1) and RCP (RCP 3, RCP 4.5, RCP 6, RCP 8.5)

PayongPAGASA
PAGASAThe Weather and Climate Authority
1.6°C (2036-2065)MDGF Report – SRES A1B1.4°C – 2.0°C (2030-2059)SEACAM Report0.9°C – 1.9°C (2036-2065)7 model simulations*1.2°C – 2.3°C (2036-2065)12 model simulations
SUMMARY of CHANGESScenario Mid-21st century End of the 21st century
A1B +1.4 to +2.0 +2.7 to +3.8RCP4.5 +0.9 to +1.9 +1.3 to +2.5RCP8.5 +1.2 to +2.3 +2.5 to +4.1
Projected Annual Mean Temperature Change*
*relative to 1971 to 2000
PayongPAGASA
PAGASAThe Weather and Climate Authority
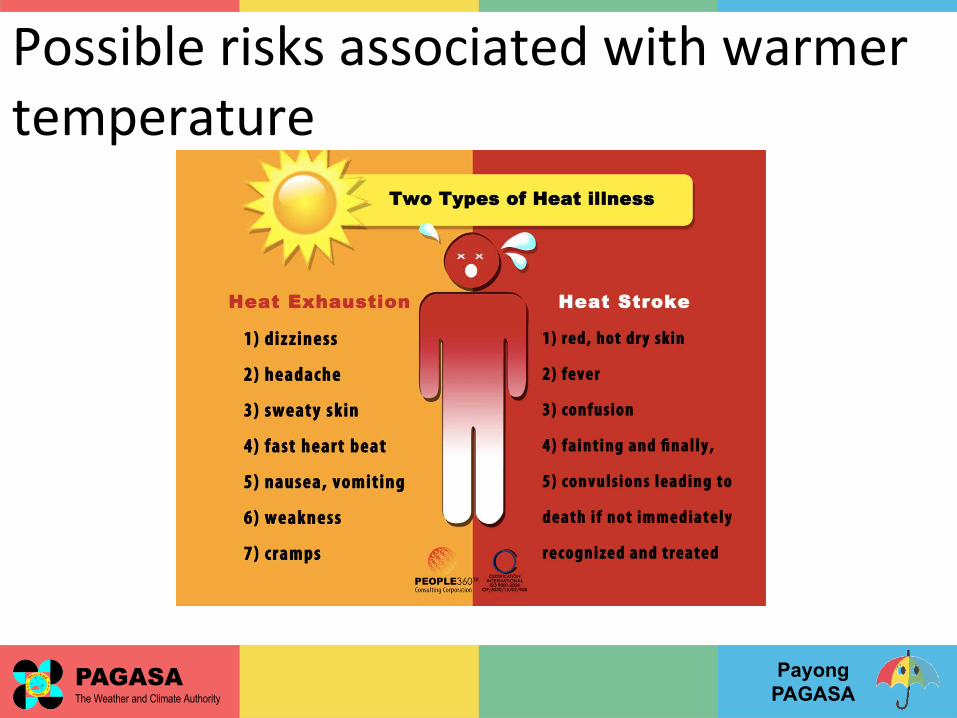
Possible risks associated with warmer temperature

PayongPAGASA
PAGASAThe Weather and Climate Authority
Dec-Jan-Feb Mar-Apr-May Jun-Jul-Aug Sep-Oct-Nov
Projected changes in seasonal total rainfall by the Mid-21st
Century (2036-2065) based on RCP8.5 scenario
Driest Possible
Median
Wettest Possible

PayongPAGASA
PAGASAThe Weather and Climate Authority
Possible risk associated with increased/enhanced rainfall in the future
PayongPAGASA
PAGASAThe Weather and Climate Authority
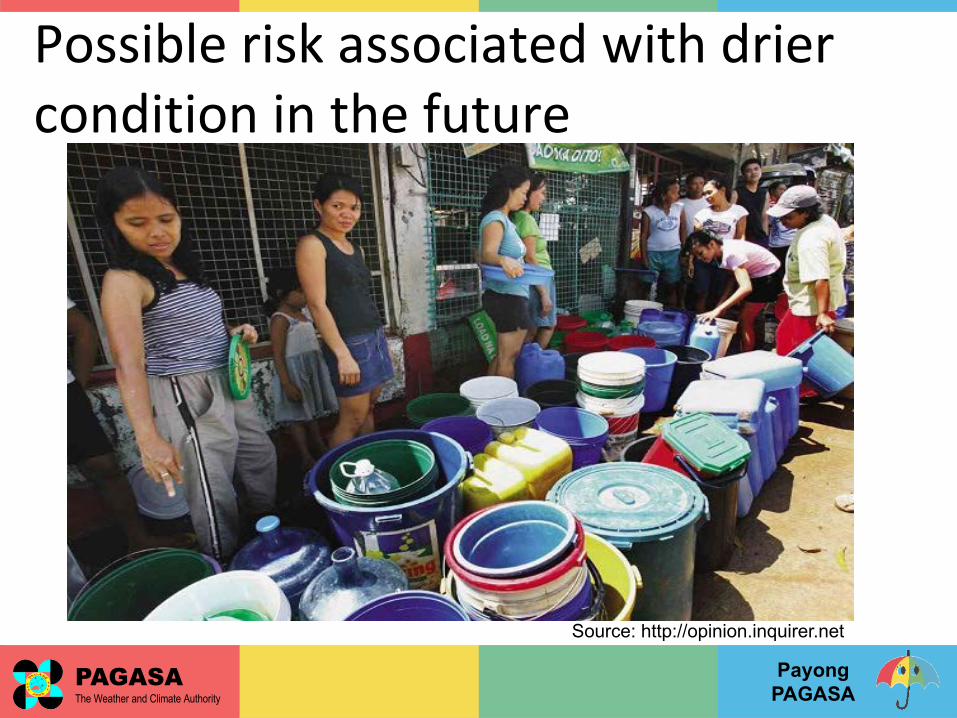
Possible risk associated with drier condition in the future
Source: http://opinion.inquirer.net

PayongPAGASA
PAGASAThe Weather and Climate Authority
Projected future change in tropical cyclones to affect the Philippines
Source: Daron et al. 2016, DFID project, UK- Met-office report

PayongPAGASA
PAGASAThe Weather and Climate Authority
Some of the Impacts of strong tropical cyclones

PayongPAGASA
PAGASAThe Weather and Climate Authority
So, what can we do now to make our families, communities,
businesses, and our whole locality resilient to
climate variability and change?

PayongPAGASA
PAGASAThe Weather and Climate Authority
Link of DRR and CCA
CCA and DRR: point of conceptual convergence (Source: Gotangco 2012)
Climate Change Adaptation:
Reduce risk to:
Gradual changes in climatic parameters
Extreme weather event with increased frequency and severity
Hazards that are associated with changing climate “Normals”
Hazards that are associated with extreme events
Disaster Risk Management
Reduce risk to:
Sea Level Rise
Changes in mean Temperature
Changes in Precipitation patterns
Climate and weather related events
GeophysicalEvents
Ecological Events
Other events (e.g. technological, terrestrial
Direct connection

PayongPAGASA
PAGASAThe Weather and Climate Authority

PayongPAGASA
PAGASAThe Weather and Climate Authority
Climate Change Impacts

PayongPAGASA
PAGASAThe Weather and Climate Authority

PayongPAGASA
PAGASAThe Weather and Climate Authority
Driest Possible
Median
Projected changes in seasonal rainfall over Eastern Samar by the Mid-21st Century (2036-2065) based on RCP8.5 scenario
Wettest Possible
Dec-Jan-Feb Mar-Apr-May Jun-Jul-Aug Sep-Oct-Nov

PayongPAGASA
PAGASAThe Weather and Climate Authority
How to Utilize the Climate Risk Analysis Matrix CLIRAM

PayongPAGASA
PAGASAThe Weather and Climate Authority
Percent (%) Rainfall amount (mm)
Lower Bound -4.2 -41.1 945.9Median 1.3 12.5 999.5
Upper Bound 45.0 444.4 1431.4Lower Bound -7.9 -77.8 909.2
Median 13.7 135.2 1122.2Upper Bound 43.6 430.8 1417.8Lower Bound -2.6 -12.1 452.0
Median 1.8 8.2 472.3Upper Bound 17.4 80.8 544.9Lower Bound 5.8 26.8 490.9
Median 1.1 5.3 469.4Upper Bound 13.0 60.3 524.4Lower Bound -6.7 -37.5 522.3
Median -1.1 -6.0 553.8Upper Bound 8.3 46.4 606.2Lower Bound -14.0 -78.3 481.5
Median -0.6 -3.2 556.6Upper Bound 9.7 54.6 614.4Lower Bound -20.1 -174.9 696.5
Median -16.6 -144.7 726.7Upper Bound -3.8 -33.4 838.0Lower Bound -22.0 -191.3 680.1
Median -9.3 -81.3 790.1Upper Bound 4.7 40.7 912.1
* upper: 90th percentile; median: 50th percentile; lower: 10th percentile
September-October-November (SON)
Observed baseline = 871 mm
Moderate Emission (RCP4.5)
High Emission (RCP8.5)
June-July-August (JJA)
Observed baseline = 560 mm
Moderate Emission (RCP4.5)
High Emission (RCP8.5)
March-April-May (MAM)
Observed baseline =
464 mm
Moderate Emission (RCP4.5)
High Emission (RCP8.5)
December-January-February (DJF)
Observed baseline =
987 mm
Moderate Emission (RCP4.5)
High Emission (RCP8.5)
Projected Changes in Seasonal Rainfall in the Mid-21st Century (2036-2065) for Eastern Samar relative to 1971-2000
Adaptation OptionSeason Scenario Range*
Projected ChangeProjected Seasonal
Rainfall Amount (mm)
Potential ImpactsInformation about patterns of Change
Climate Risk Analysis Matrix CLIRAM

PayongPAGASA
PAGASAThe Weather and Climate Authority
In accomplishing the CLIRAM for seasonal valuesdetermine the projected patterns of change(Column 7 of Table 1) based on the following(refer to Columns 4 to 6):
1. The lower bound that indicates the lowest possible change;
2. The upper bound that indicates the highest possible change; and
3. The median which represents multi model central estimate the future change.

PayongPAGASA
PAGASAThe Weather and Climate Authority
Example(of(the(filled(up(CLIRAM(for(different(sectors(in(Salcedo
(
Percent'(%)Rainfall'amount'
(mm)Col'1 Col'2 Col'3 Col'4 Col'5 Col'6 Col'7 Col'8 Col'9
Lower(Bound =4.2 =41.1 945.9 Minimal(to(no(change
Median 1.3 12.5 999.5 Minimal(to(no(change
Upper(Bound 45.0 444.4 1431.4
The(highest(possible(future(rainfall(change(during(the(
Northeast((NE)(Monsoon(or(Amihan(shows(an(increase(
of(45%(.(This(increase(could(be(detrimental(to(some(
sectors(of(the(community,(as(this(season(corresponds(
to(the(wettest(months(over(the(region(
●(Farm(Flooding,Crops(ruined((e.g.(
wash(out(of(planted(cassava(6=8(months(
growing(period)
●(Pest(&(Disease(Infestation
●(Increased(Cost(of(lodging(animals(&(
crops
●(Decrease(in(yield(/production
Lower(Bound =7.9 =77.8 909.2 Minimal(to(no(change
Median 13.7 135.2 1122.2 Minimal(increase
Upper(Bound 43.6 430.8 1417.8
The(highest(possible(future(rainfall(change(during(the(
Northeast((NE)(Monsoon(or(Amihan(shows(an(increase(
of(44%.(This(increase(could(be(detrimental(to(some(
sectors(of(the(community,(as(this(season(corresponds(
to(the(wettest(months(over(the(region(
●(Farm(Flooding,Crops(ruined((e.g.(
wash(out(of(planted(cassava(6=8(months(
growing(period)
●(Pest(&(Disease(Infestation
●(Increased(Cost(of(lodging(animals(&(
crops
●(Decrease(in(yield(/production
CLIRAM:(Projected(Changes(in(Seasonal(Rainfall(in(the(Mid=21st(Century((2036=2065)(for(Eastern(Samar(relative(to(1971=2000(((((((((((
•Extend(cover/greenhouse(style(of(planted(crops
•Plant(water(resistant(varieties,(raise(beds,(transfer(
planting(sites
•Provide(good(farm(drainage,(by(construction(of(
irrigation(canals(to(divert(excess(surface(run=off
•(Practice(cut&carry,(provide(permanent(shelter(to(
livestock
•(Use(flood(tolerant(/(water(resistant(
varieties/drought(tolerant(varieties
•(Conduct(Climate(Field(School(to(make(farmers(
more(resilient(to(climate(adversities
•(Provide(EWS(for(agriculture
•(Provide(insurance(to(farmers
Agriculture
December=
January=February(
(DJF)(((((((
((((((((((((((((((((
Observed(
baseline(=((987(
mm
Moderate(
Emission(
(RCP(4.5)
High(Emission(
(RCP(8.5)
Same(vulenrability(to((the(present
Season Scenario Range*Projected'Change Projected'
Seasonal'Rainfall'Amount'
(mm)
Information'about'patterns'of'changePotential'Impacts
Adaptation'Option
Same(vulenrability(to((the(present
Example of a filled-up CLIRAM for Agriculture sectors in Salcedo

PayongPAGASA
PAGASAThe Weather and Climate Authority
Example(of(the(filled(up(CLIRAM(for(different(sectors(in(Salcedo
(
Percent'(%)Rainfall'amount'
(mm)Col'1 Col'2 Col'3 Col'4 Col'5 Col'6 Col'7 Col'8 Col'9
Lower(Bound =4.2 =41.1 945.9 Minimal(to(no(change
Median 1.3 12.5 999.5 Minimal(to(no(change
Upper(Bound 45.0 444.4 1431.4
The(highest(possible(future(rainfall(change(
during(the(Northeast((NE)(Monsoon(or(
Amihan(shows(an(increase(of(45%(.(This(
increase(could(be(detrimental(to(some(sectors(
of(the(community,(as(this(season(corresponds(
to(the(wettest(months(over(the(region(
●(Farm(Flooding,Crops(ruined((e.g.(
wash(out(of(planted(cassava(6=8(months(
growing(period)
●(Pest(&(Disease(Infestation
●(Increased(Cost(of(lodging(animals(&(
crops
●(Decrease(in(yield(/production
Lower(Bound =7.9 =77.8 909.2 Minimal(to(no(change
Median 13.7 135.2 1122.2 Minimal(increase
Upper(Bound 43.6 430.8 1417.8
The(highest(possible(future(rainfall(change(
during(the(Northeast((NE)(Monsoon(or(
Amihan(shows(an(increase(of(44%.(This(
increase(could(be(detrimental(to(some(sectors(
of(the(community,(as(this(season(corresponds(
to(the(wettest(months(over(the(region(
●(Farm(Flooding,Crops(ruined((e.g.(
wash(out(of(planted(cassava(6=8(months(
growing(period)
●(Pest(&(Disease(Infestation
●(Increased(Cost(of(lodging(animals(&(
crops
●(Decrease(in(yield(/production
Lower(Bound =2.6 =12.1 452.0 Minimal(to(no(change
Median 1.8 8.2 472.3 Minimal(to(no(change
Upper(Bound 17.4 80.8 544.9 Minimal(increase
Lower(Bound 5.8 26.8 490.9 Minimal(to(no(change
Median 1.1 5.3 469.4 Minimal(to(no(change
Upper(Bound 13.0 60.3 524.4 Minimal(increase
Lower(Bound =6.7 =37.5 522.3 Minimal(to(no(change
Median =1.1 =6.0 553.8 Minimal(to(no(change
Upper(Bound 8.3 46.4 606.2 Minimal(to(no(change
Lower(Bound =14.0 =78.3 481.5 Minimal(reduction
Median =0.6 =3.2 556.6 Minimal(to(no(change
Upper(Bound 9.7 54.6 614.4 Minimal(increase
Lower(Bound =20.1 =174.9 696.5
The(driest(possible(future(rainfall(change(
during(the(transition(period(from(NE(to(SW(
monsoon(shows(a(reduction(of(20%
Median =16.6 =144.7 726.7
The(most(likely(future(rainfall(change(during(
the(transition(period(from(NE(to(SW(monsoon(
shows(a(reduction(of(17%
Upper(Bound =3.8 =33.4 838.0 Minimal(to(no(change
Lower(Bound =22.0 =191.3 680.1
The(driest(possible(future(rainfall(change(
during(the(transition(period(from(NE(to(SW(
monsoon(shows(a(reduction(of(22%
Median =9.3 =81.3 790.1 Minimal(to(no(change
Upper(Bound 4.7 40.7 912.1 Minimal(to(no(change
*(upper:(90th(percentile;(median:(50th(percentile;(lower:(10th(percentile
September=
October=
November((SON)(((((((((((((((((((((((((((((((((((((((((((((
Observed(
baseline(=((871(
mm
CLIRAM:(Projected(Changes(in(Seasonal(Rainfall(in(the(Mid=21st(Century((2036=2065)(for(Eastern(Samar(relative(to(1971=2000(((((((((((
Season Scenario Range*Projected'Change Projected'
Seasonal'Rainfall'Amount'
(mm)
Information'about'patterns'of'changePotential'Impacts
Adaptation'Option
Moderate(
Emission(
(RCP(4.5)
High(Emission(
(RCP(8.5)
•Extend(cover/greenhouse(style(
of(planted(crops
•Plant(water(resistant(varieties,(
raise(beds,(transfer(planting(sites
•Provide(good(farm(drainage,(by(
construction(of(irrigation(canals(to(
divert(excess(surface(run=off
•(Practice(cut&carry,(provide(
permanent(shelter(to(livestock
•(Use(flood(tolerant(/(water(
resistant(varieties/drought(
tolerant(varieties
•(Conduct(Climate(Field(School(to(
make(farmers(more(resilient(to(
climate(adversities
•(Provide(EWS(for(agriculture
•(Provide(insurance(to(farmers
June=July=August(
(JJA)((((((((((((((((((((((((
Observed(
baseline(=((560(
mm
Moderate(
Emission(
(RCP(4.5)
Same(vulenrability(to((the(present
High(Emission(
(RCP(8.5)
March=April=May(
(MAM)((((((((((((
(((((((((((((((((((((((((Ob
served(baseline(=((
464(mm
Moderate(
Emission(
(RCP(4.5)
High(Emission(
(RCP(8.5)
Same(vulenrability(to((the(present
Water(is((sufficient(for(farming(activity
December=
January=February(
(DJF)(((((((
((((((((((((((((((((
Observed(
baseline(=((987(
mm
Moderate(
Emission(
(RCP(4.5)
High(Emission(
(RCP(8.5)
Agriculture

PayongPAGASA
PAGASAThe Weather and Climate Authority
Example(of(the(filled(up(CLIRAM(for(Agriculture(in(Salcedo
Change'in'�Projected'Seasonal'Mean'Temperature'
(�)'Col'1 Col'2 Col'3 Col'4 Col'5 Col'6 Col'7 Col'8Lower(Bound 1.0 27.1 Coldest(season
Median 1.1 27.2 27.1(to(27.7
Upper(Bound 1.6 27.7Lower(Bound 1.3 27.4
Median 1.5 27.6 27.4(to(28.0Upper(Bound 1.9 28.0
Lower(Bound 1.0 28.7
Median 1.2 28.9 28.7(to(29.4
Upper(Bound 1.7 29.4
Lower(Bound 1.4 29.1
Median 1.6 29.3 29.1(to(29.8Upper(Bound 2.1 29.8
Lower(Bound 1.0 29.3
Median 1.2 29.5 29.3(to(30.1
Upper(Bound 1.8 30.1
Lower(Bound 1.4 29.7 Hottest(season
Median 1.7 30.0 29.7(to(30.5Upper(Bound 2.2 30.5Lower(Bound 1.0 28.7
Median 1.2 28.9 28.7(to(29.5
Upper(Bound 1.8 29.5
Lower(Bound 1.4 29.1
Median 1.5 29.2 29.1(to(29.9Upper(Bound 2.2 29.9
*(upper:(90th(percentile;(median:(50th(percentile;(lower:(10th(percentile
Generally((all(seasons(becoming((warmer(,(in(which(Air(surface,(soil(and(groundwater(temperatures(will(be(warmer.(The(general(climate(effects(of(having(warmer(oceans(or(lakes(are(included(here.(Increase(in(temperature((ranging(from(1.0(to(2.2(degrees(•(Impotent(livestock/crops(•(Livestock(disease(•(Decrease(in(yield(/production((•(Ice(Ice(effect(•(Fish(Kill
CLIRAM:Projected(Changes(in(Seasonal(Temperature(in(the(Mid\21st((Century((2036\2065)(for(Eastern(Samar(relative(to(1971\2000(((((((((((
Season Scenario Range*Projected'Change Information'about'
patterns'of'change Potential'Impacts
Adaptation'Option
Agriculture
December\January\February((DJF)(((((((
((((((((((((((((((((Observed(baseline(=((
26.1(�
Moderate(Emission((RCP4.5)
High(Emission((RCP8.5)
(•(Conduct(Climate(Field(School(to(make(farmers(more(resilient(to(climate(adversities•(Provide(EWS(for(agriculture•(Provide(insurance(to(farmers•(Translating(the(temperature(changes(to(impacts(to(different(crops
March\April\May((MAM)(((((((((((((((((((((((((((((((((((((Observed(baseline(=((27.7(�
Moderate(Emission((RCP4.5)
High(Emission((RCP8.5)
June\July\August((JJA)((((((((((((((((((((((((
Observed(baseline(=((28.3(�
Moderate(Emission((RCP4.5)
High(Emission((RCP8.5)
September\October\November((SON)(((((((((((((((((((((((((((((((((((((((((((((
Observed(baseline(=((27.7(�
Moderate(Emission((RCP4.5)
High(Emission((RCP8.5)

PayongPAGASA
PAGASAThe Weather and Climate Authority
y"=" $0.7347x"+"435.03
0
200
400
600
800
0.0 50.0 100.0 150.0 200.0 250.0 300.0
DAVAO"REGIONMay"Rainfall"vs"Mangostin

PayongPAGASA
PAGASAThe Weather and Climate Authority

PayongPAGASA
PAGASAThe Weather and Climate Authority

PayongPAGASA
PAGASAThe Weather and Climate Authority
COMPONENTS
Component A: Risk and Vulnerability Assessment
Component B: GHG Inventory and Review of Current Mitigation Actions

PayongPAGASA
PAGASAThe Weather and Climate Authority
Key questions and elements for Component A in Step 3Step 3 LCCAP
Component A: Climate Change Vulnerability and Risk Assessment
Key Questions:
1. Vulnerabilities, Risks, and Opportunities of climate change in communities
2. Types of climate-related and natural hazards
3. Issues that need to be addressed,
4. Location of climate change issues and hazards- current and are projected to happen (illustration/mapping)
5. Summary description on type of climate related hazards and issues will the LGU face in the future?
6. Analysis report on why and when should action be initiated

PayongPAGASA
PAGASAThe Weather and Climate Authority
Activity Objectives:
• To be able to interpret the projected climate changes in the area assigned to you
• To identify the potential impacts of projected changes and provide possible adaptation options using the CLIRAM for seasonal rainfall and mean temperature
Ø Determine the projected patterns of change in seasonal rainfall. Provide your inputs in Column 7 by referring to the information provided in Columns 4 to 6 of the CLIRAM:• The lower bound indicates the driest possible change;• The upper bound indicates the wettest possible change; and• The median represents the multimodel central estimate of future change
Ø Identify the sectors affected by the changes, potential impacts of projected changes and adaptation options

PayongPAGASA
PAGASAThe Weather and Climate Authority
Projected Changes in Seasonal Rainfall in the Mid-21st Century (2036-2065) for Metro Manila relative to 1971-2000

PayongPAGASA
PAGASAThe Weather and Climate Authority
Projected Changes in Seasonal Rainfall in the Mid-21st Century (2036-2065) for Metro Manila relative to 1971-2000

PayongPAGASA
PAGASAThe Weather and Climate Authority
Pampanga

PayongPAGASA
PAGASAThe Weather and Climate Authority
Albay
PayongPAGASA
PAGASAThe Weather and Climate Authority
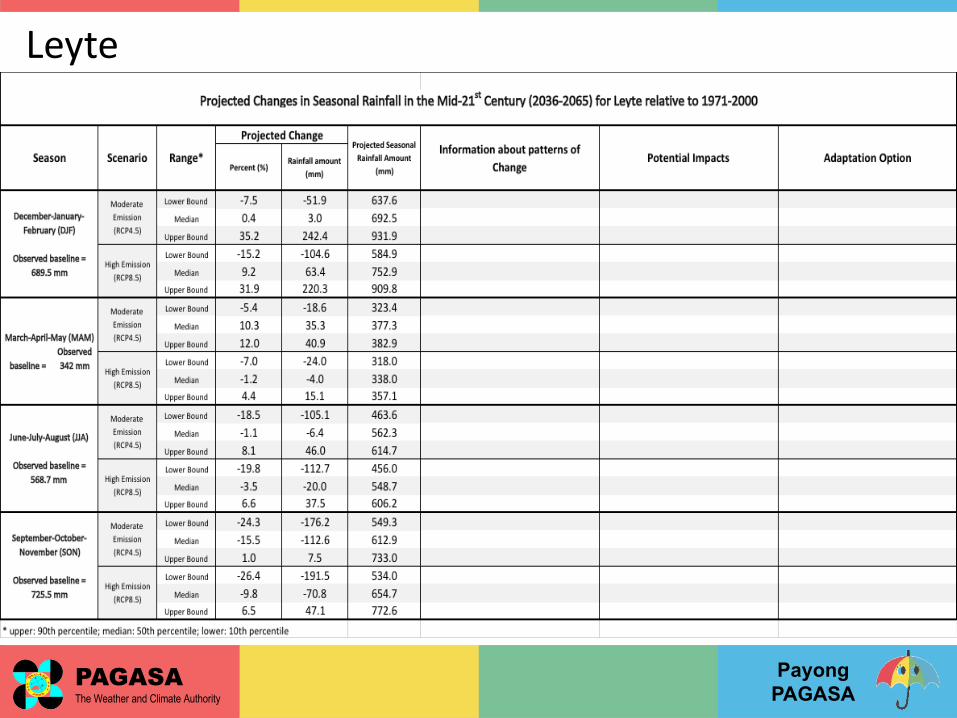
Leyte
PayongPAGASA
PAGASAThe Weather and Climate Authority
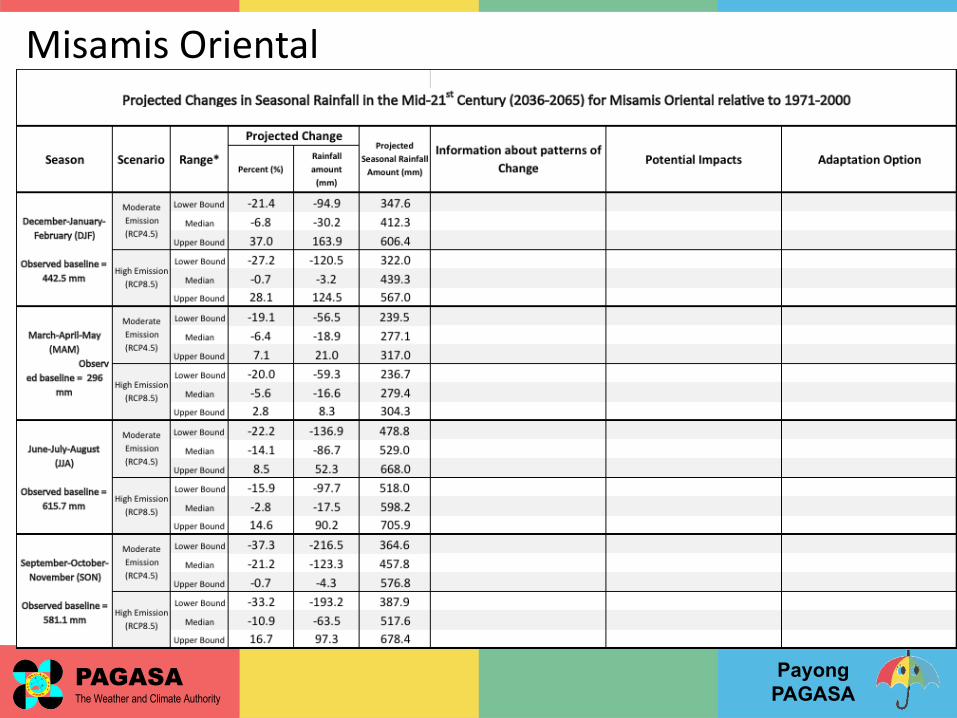
Misamis Oriental

PayongPAGASA
PAGASAThe Weather and Climate Authority
Davao del Norte

PayongPAGASA
PAGASAThe Weather and Climate Authority
Acknowledgements
Thelma A. Cinco, Emma D. Ares, Marcelino Q. Villafuerte II, John A. Manalo, Wilmer Agustin,Kimberli Anne Aquino
Joseph Daron, Richard Jones, Ian Macadam, Florian Gallo, Ron Kahana, Claire Scannell, David Hein, Simon Tucker, Rosanna Amato, and David Corbelli;
Jack Katzfey and Dewi Kirono.

PayongPAGASA
PAGASAThe Weather and Climate Authority
http://www.pagasa.dost.gov.ph/
www.facebook.com/PAGASA.DOST.GOV.PH
@dost_pagasa
Thank you! JContact us: Impact Assessment and Application Section
Climatology and Agrometeorology Division, DOST-PAGASA
+632-434-58-82/434-8130
Thelma A. Cincoemail: [email protected]