Data Quality Report for most particulate matter (PM10 and PM2.5) samplers is assessed via collocated...
96
2016 Annual Data Quality Report Monitoring and Laboratory Division Quality Management Branch
Transcript of Data Quality Report for most particulate matter (PM10 and PM2.5) samplers is assessed via collocated...
2016 Annual Data Quality Report
Monitoring and Laboratory Division
Quality Management Branch

This page intentionally left blank
2016
Annual Data Quality Report
California Air Resources Board’s Primary Quality Assurance Organization
Prepared by:
Quality Management Branch Monitoring and Laboratory Division
California Air Resources Board
October 2017

This page intentionally left blank
Acronyms and Abbreviations
APCD Air pollution control district
AQDA Air quality data action
AQMD Air quality management district
AQS Air Quality System
BAAQMD Bay Area Air Quality Management District
CAN Corrective action notification
CARB California Air Resources Board
CFR Code of Federal Regulations
CV Coefficient of variation
FEM Federal equivalent method
FRM Federal reference method
FRV Flow rate verification
MQO Measurement quality objective
PEP Performance Evaluation Program
PM Particulate matter
POC Parameter of Occurrence Code
PQAO Primary quality assurance organization
QC Quality control
QMB Quality Management Branch
SCAQMD South Coast Air Quality Management District
SDCAPCD San Diego County Air Pollution Control District

This page intentionally left blank

Table of Contents
Executive Summary i
I. Introduction 1 II. Quality Assurance 2 III. Data Quality – Statistical Summary Results 4
A. Gaseous Criteria Pollutants 4
B. Particulate Matter 26
IV. Conclusions and Recommendations 52 Appendices
Appendix A: EPA’s Measurement Quality Objectives, 55 Tools for Assessing Precision and Bias/Accuracy, and CARB’s Performance Audit Criteria
Appendix B: CARB’s PQAO Data Quality Issues 59 Appendix C: Meteorological Sensor Performance Audits 65 Conducted by CARB Appendix D: Detailed Calculations of Statistics Used to Assess 69
Precision and Accuracy Appendix E: References 79
Data Quality Report 2016
This page intentionally left blank
Data Quality Report 2016
i
Executive Summary
The Code of Federal Regulations (CFR) defines the California Air Resources Board (CARB) as one of four primary quality assurance organizations (PQAO) in California responsible for monitoring air pollutants and assessing data quality. The purpose of this report is to provide ambient air quality data producers and users with a centralized review of the data quality within CARB’s PQAO with respect to measurement quality objectives (MQO). The MQOs reviewed include data capture (amount of ambient data reported), precision (the degree of mutual agreement among individual measurements of the same property), bias/accuracy (the degree of agreement between an observed value and an accepted known or reference value), and the amount of precision and bias/accuracy data collected and reported. The criteria by which the assessments are made are mostly dictated in the U.S. Environmental Protection Agency’s (EPA) CFR1and are listed in Appendix A of this report. Appendix B provides details on the instruments/samplers that did not meet certain criteria. Where appropriate, comparisons to other PQAOs in California and the national average2 are also made. The other PQAOs in California include: Bay Area Air Quality Management District (BAAQMD), San Diego County Air Pollution Control District (SDCAPCD), and South Coast Air Quality Management District (SCAQMD). It is important to note that this assessment is solely based on data available in EPA’s Air Quality System (AQS). PQAOs may have collected certain precision and/or bias/accuracy data that was not uploaded to AQS; in some cases, that particular data was not federally required to be uploaded. The gaseous criteria pollutants assessed include: carbon monoxide (CO), ozone (O3), nitrogen dioxide (NO2), and sulfur dioxide (SO2). The ambient data capture rate represents the percentage of ambient data collected and uploaded to AQS to that of the total amount of data possible. For gaseous pollutants, one-point quality control (QC) precision checks (mostly automated) are performed by the monitoring organizations to confirm the instrument’s ability to respond to a known concentration of gas. Precision represents the degree of variability among the one-point checks. The one-point checks are also used to assess bias/accuracy for each instrument. This is done by comparing the difference between the instrument response and a reference gas. Precision for most particulate matter (PM10 and PM2.5) samplers is assessed via collocated sampling whereby two identical or equivalent samplers are operated side-by-side.3 Bias for PM samplers is assessed by using the routine flow rate verifications performed by site operators. Note that while all PM samplers are required to undergo monthly flow rate verifications except for high-volume (hi-vol) PM10
1 Title 40 CFR Appendix A to Part 58. 2 National average includes state, county, district, National Park Service, and tribal sites, including those in California. 3 Collocated sampling is required for all PM samplers, except continuous PM10.
Data Quality Report 2016
ii
samplers, where quarterly flow checks are required, only flow rate verification data for continuous PM10 samplers were required to be uploaded to AQS. In April 2016, with the update4 to 40 CFR Part 58, Appendix A, this requirement was expanded to apply to all PM samplers. However, due to the mid-year start time, EPA waived the requirement during 2016 data certification; hence, CARB will apply the new EPA requirement to 2017 data. Accuracy for both gaseous instruments and PM samplers is further verified by the performance evaluation audit program using through-the-probe audit techniques on gaseous instruments and checking flow rates on particulate samplers. The ambient data capture rate and the accompanying precision and accuracy data for 2016 from both gaseous instruments and PM samplers are summarized below. Gaseous Instruments Key findings and recommendations pertaining to gaseous instruments are highlighted below.
• Ninety-eight percent of the gaseous instruments operating under CARB’s PQAO achieved the ambient data capture rate of at least 75 percent in 2016. Most also achieved CARB’s goal of at least 85 percent data capture.
• Ninety-eight percent of the gaseous instruments operating under CARB’s PQAO reported at least 75 percent of the required QC checks submitted to AQS.
• CFR precision and bias/accuracy criteria (from one-point QC checks) were met
at the PQAO level.
• Performance audit data indicate that, except for a few instruments, CARB’s PQAO met the audit criteria. This finding is consistent with the bias information obtained from the one-point QC checks.
• These findings are consistent with those in 2015. Recommendation – Gaseous Program
• Although MQOs associated with the gaseous instruments were met at the PQAO level, there were a few instances of analyzers not meeting the MQO (e.g., ambient data capture rate, submittal of required QC checks, etc.). Monitoring agencies should investigate why these objectives were not met for each analyzer in their respective jurisdictions and develop corrective actions, if appropriate, to meet them in subsequent years.
4https://www3.epa.gov/ttn/amtic/files/ambient/pm25/Summary_of_Appendix_A_Changes_%203_25_2016.pdf
Data Quality Report 2016
iii
PM Samplers Key findings and recommendations pertaining to PM instruments are highlighted below.
• Ninety-nine percent of the particulate samplers operating under CARB’s PQAO achieved the ambient data capture rate of at least 75 percent in 2016. Most also achieved CARB’s goal of at least 85 percent capture.
• Although CARB’s Annual Network Plan Covering Operations in 25 California Air Districts, June 20165 indicates that CARB’s PQAO is short of meeting the required number of collocated sampling sites for PM10 and for one method of collecting PM2.5, planned changes to the network will bring CARB’s PQAO into achieving the 15% collocation requirement soon. This is an improvement compared to previous years, when more than one method did not meet the requirement.
• For the four pairs of collocated PM10 and fourteen pairs of collocated PM2.5
samplers that were present within CARB’s PQAO in 2016, all reported at least 75 percent of the required precision data. (See Table B3 for more details.)
• For the PM collocated data that were collected and reported, CARB’s PQAO met the precision criteria for PM10 except at one location. However, the precision for PM2.5 for all methods except one was not met. Compared to 2015, the coefficient of variation (CV) values in 2016 has decreased for most of the methods, indicating PM2.5 precision is improving. (See Table B3 for more details.)
• Compared to 2015, all of continuous PM10 samplers reported flow rate
verification data to AQS, and the results indicate that the PM10 network exhibited low bias. As stated previously, starting in April 2016, all PM samplers are required to upload such data to AQS. CARB will apply the new EPA requirement to 2017 data.
• The audit accuracy data indicates that CARB’s PQAO met CARB criteria for flow rate audits. This finding is consistent with the bias information that can be ascertained from the routine flow rate verification data available in AQS.
• These findings show an improvement in PM2.5 precision and accuracy compared to 2015.
5http://www.arb.ca.gov/aqd/amnr/amnr2017.pdf
Data Quality Report 2016
iv
Recommendations – PM Program • Although lower when compared to 2015, CV values among collocated PM2.5
samplers remain high in 2016 within CARB’s PQAO. CARB has conducted an assessment of the potential causes behind low PM2.5 precision among some of the collocated PM2.5 samplers within CARB’s PQAO, but no definitive source of the issue has been identified. Some of the observations from our assessment include: 1) ambient PM2.5 values in California are somewhat higher than the rest of the nation; 2) a few unusually large percent differences between the paired measurements can increase the CV result; 3) CV values tend to be higher among collocations of non-identical methods (i.e., FEM collocated with FRM) than those of identical methods; 4) empirically, due to the inherent nature of percent differences being magnified in the low concentration range, CV values would decrease if the cut-off limits were raised from 3 µg/m3; 5) sites that meet the CV criteria are not consistent from year to year. Monitoring agencies are encouraged to closely examine operational practices in order to help the PQAO achieve the precision criteria for PM.
• In April 2016, EPA revised CFR to require data from flow rate verifications be uploaded to AQS for all PM sampler methods.6 Agencies should establish procedures for uploading such data in an expeditious manner, thus allowing for a more comprehensive annual assessment of PM accuracy in 2017.
• Aside from the above recommendations, there were instances of samplers not meeting the MQOs (e.g., ambient data capture rate, submittal of required collocated measurements, etc). Monitoring agencies should investigate why these objectives were not met for each sampler in their respective jurisdictions and develop corrective actions, if appropriate, to meet them in subsequent years.
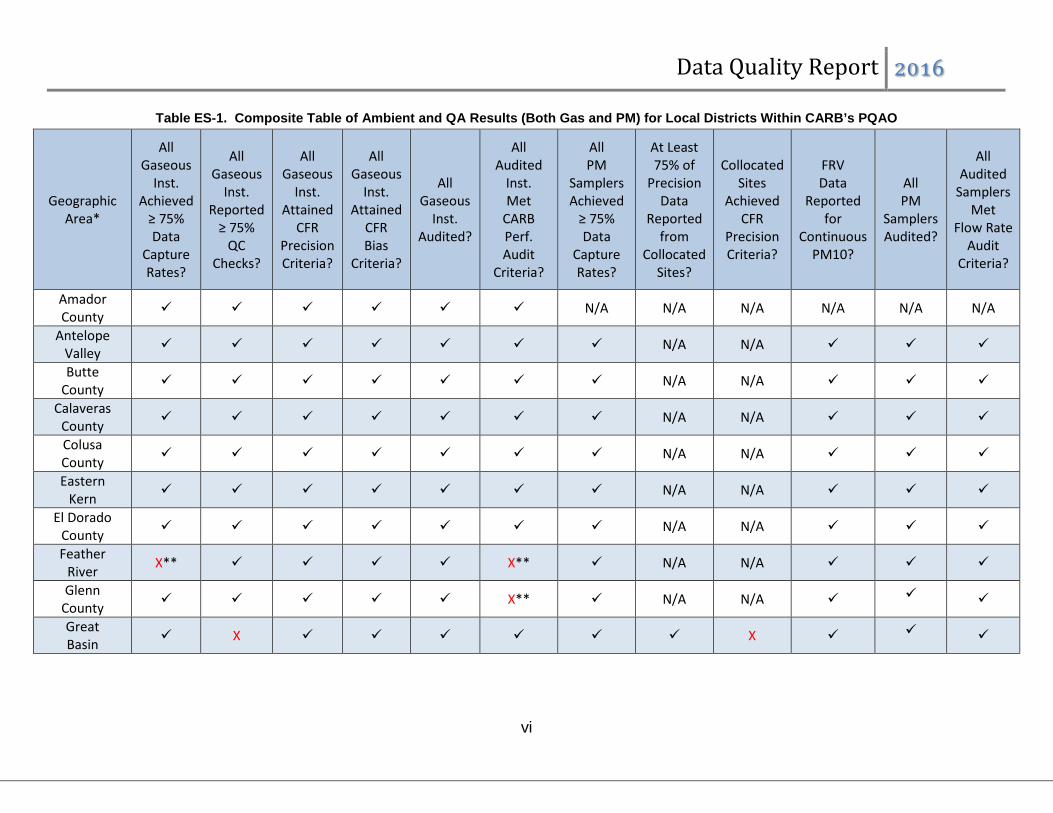
In an effort to compare 2016 data quality results across geographic areas within California, Table ES-1 presents results for both gases and PM in one composite table. To make a fair comparison, we divided the geographic areas into three categories according to monitoring activities: 1) gas only; 2) gas and PM without collocation; and 3) gas and PM with collocation. Below are some key observations for CARB’s PQAO from Table ES-1:
• There are 2 areas that monitored gases only, and 1 achieved all MQOs for gases.
• Among 19 areas that monitored gases and PM without collocation, 14 met all MQOs, 4 did not meet the MQOs for gases only, and 1 did not meet MQOs for PM.
6https://www3.epa.gov/ttn/amtic/files/ambient/pm25/Summary_of_Appendix_A_Changes_%203_25_2016.pdf
Data Quality Report 2016
v
• Among 9 areas that monitored gases and PM with collocation, 2 achieved all MQOs, with 7 others having high CVs associated with PM2.5. In comparison, none of such areas achieved all MQOs in 2015.
The statistics reported herein are intended as assessment tools for the data producers and users to identify areas where program improvements can be made to achieve all MQOs set by EPA or the data producers themselves. Although CFR criteria for precision and accuracy are generally applied and evaluated at the PQAO level, assessments at the district or site level may differ and can be important as well. However, it is important to note that when certain CFR criteria are not met, it does not necessarily mean that the corresponding air quality data should not be used, but rather, the data should be used with the knowledge of the quality behind it. The 2016 Ambient data in AQS for CARB’s PQAO have been certified and are considered suitable for comparison to federal standards. In addition, data producers are encouraged to review their monitoring networks to ensure that AQS accurately reflects the number of sites/samplers operating and that all required ambient, precision, and accuracy data collected are continually reported to AQS in a timely manner (within 90 days of the end of each quarter per CFR).
Data Quality Report 2016
vi
Table ES-1. Composite Table of Ambient and QA Results (Both Gas and PM) for Local Districts Within CARB’s PQAO
Geographic Area*
All Gaseous
Inst. Achieved
≥ 75% Data
Capture Rates?
All Gaseous
Inst. Reported
≥ 75% QC
Checks?
All Gaseous
Inst. Attained
CFR Precision Criteria?
All Gaseous
Inst. Attained
CFR Bias
Criteria?
All Gaseous
Inst. Audited?
All Audited
Inst. Met
CARB Perf. Audit
Criteria?
All PM
Samplers Achieved
≥ 75% Data
Capture Rates?
At Least 75% of
Precision Data
Reported from
Collocated Sites?
Collocated Sites
Achieved CFR
Precision Criteria?
FRV Data
Reported for
Continuous PM10?
All PM
Samplers Audited?
All Audited
Samplers Met
Flow Rate Audit
Criteria?
Amador County N/A N/A N/A N/A N/A N/A
Antelope Valley N/A N/A
Butte County N/A N/A
Calaveras County N/A N/A
Colusa County N/A N/A
Eastern Kern N/A N/A
El Dorado County N/A N/A
Feather River X** X** N/A N/A
Glenn County X** N/A N/A
Great Basin X X

Data Quality Report 2016
vii
Table ES-1 (cont’d). Composite Table of Ambient and QA Results (Both Gas and PM) for Local Districts Within CARB’s PQAO
Geographic Area*
All Gaseous
Inst. Achieved
≥ 75% Data
Capture Rates?
All Gaseous
Inst. Reported
≥ 75% QC
Checks?
All Gaseous
Inst. Attained
CFR Precision Criteria?
All Gaseous
Inst. Attained
CFR Bias
Criteria?
All Gaseous
Inst. Audited?
All Audited
Inst. Met
CARB Perf. Audit
Criteria?
All PM
Samplers Achieved
≥ 75% Data
Capture Rates?
At Least 75% of
Precision Data
Reported from
Collocated Sites?
Collocated Sites
Achieved CFR
Precision Criteria?
FRV Data
Reported for
Continuous PM10?
All PM
Samplers Audited?
All Audited
Samplers Met
Flow Rate Audit
Criteria?
Imperial County X X X X
Lake County N/A N/A
Mariposa County X** N/A N/A
Mendocino County N/A N/A
Mojave Desert X X X
Monterey Bay X
North Coast N/A N/A
Northern Sierra
Northern Sonoma County
N/A N/A
Placer County X** X**
Data Quality Report 2016
viii
Table ES-1 (cont’d). Composite Table of Ambient and QA Results (Both Gas and PM) for Local Districts Within CARB’s PQAO
Geographic Area*
All Gaseous
Inst. Achieved
≥ 75% Data
Capture Rates?
All Gaseous
Inst. Reported
≥ 75% QC
Checks?
All Gaseous
Inst. Attained
CFR Precision Criteria?
All Gaseous
Inst. Attained
CFR Bias
Criteria?
All Gaseous
Inst. Audited?
All Audited
Inst. Met
CARB Perf. Audit
Criteria?
All PM
Samplers Achieved
≥ 75% Data
Capture Rates?
At Least 75% of
Precision Data
Reported from
Collocated Sites?
Collocated Sites
Achieved CFR
Precision Criteria?
FRV Data
Reported for
Continuous PM10?
All PM
Samplers Audited?
All Audited
Samplers Met
Flow Rate Audit
Criteria?
Sacramento Metropolitan X X X
San Joaquin Valley X X** X**
San Luis Obispo County
N/A N/A
Santa Barbara County X N/A N/A
Shasta County N/A N/A
Siskiyou County N/A N/A
Tehama County X N/A N/A
Tuolumne County X** N/A N/A N/A N/A N/A N/A
Ventura County
Yolo-Solano N/A N/A * Geographic Area: regional extent covered by an air district. Sites within a given district may be operated by the district, CARB, or both. ** Impacted site operated by CARB. FRV: flow rate verification. : Met criteria. X: Did not meet criteria. N/A = Not applicable
Data Quality Report 2016
Page | 1
I. INTRODUCTION The California Air Resources Board (CARB) is the governmental agency delegated under State law with the authority and responsibility for collecting ambient air quality data as directed by the federal Clean Air Act of 1977 and Clean Air Act Amendments of 1990. CARB and local air pollution control agencies operate ambient monitoring stations throughout the State. As stated in the Code of Federal Regulations (CFR), the U.S. Environmental Protection Agency (EPA) has defined CARB as the Primary Quality Assurance Organization (PQAO) for all of California with the exception of the Bay Area Air Quality Management District (BAAQMD), the South Coast Air Quality Management District (SCAQMD), and the San Diego County Air Pollution Control District (SDCAPCD). In addition, the National Park Service (NPS) is its own PQAO at the national level; this report will not discuss NPS as a PQAO. A PQAO is a local air district, or a coordinated aggregation of such organizations that is responsible for a set of stations that monitors the same pollutants and for which data quality assessments can logically be pooled. Each criteria pollutant sampler/monitor at a monitoring station in the State and Local Air Monitoring Station (SLAMS) Network must be associated with one, and only one, PQAO.7 Factors defining a PQAO include:
• Operation by a common team of field operators according to a common set of procedures.
• Use of a common quality assurance project plan or standard operating procedures.
• Common calibration facilities and standards. • Oversight by a common quality assurance organization. • Support by a common management, laboratory, or headquarters.
The purpose of this report is to provide ambient air quality data producers and users with a centralized review of the data quality within CARB’s PQAO. Specifically, data from instruments measuring criteria gaseous and particulate pollutants are compared to measurement quality objectives (MQO). Where appropriate, comparisons to the national average and other PQAOs in California are also made. (The national average includes agencies defined as “state,” “county,” “district,” “National Park Service,” or “tribal.”) In addition, when auditing gaseous and particulate samplers, CARB also conducts performance audits of meteorological sensors (if present). Details on such audits can be found in Appendix C of this report.
7 Samplers may also be identified as Special Purpose Monitors (SPM) or Industrial (ID) monitors. There are a limited number of SPM and ID monitors in California. The statistics reported in this report are predominantly the result of SLAMS monitors but also include a small number of SPM and ID monitors as well.
Data Quality Report 2016
Page | 2
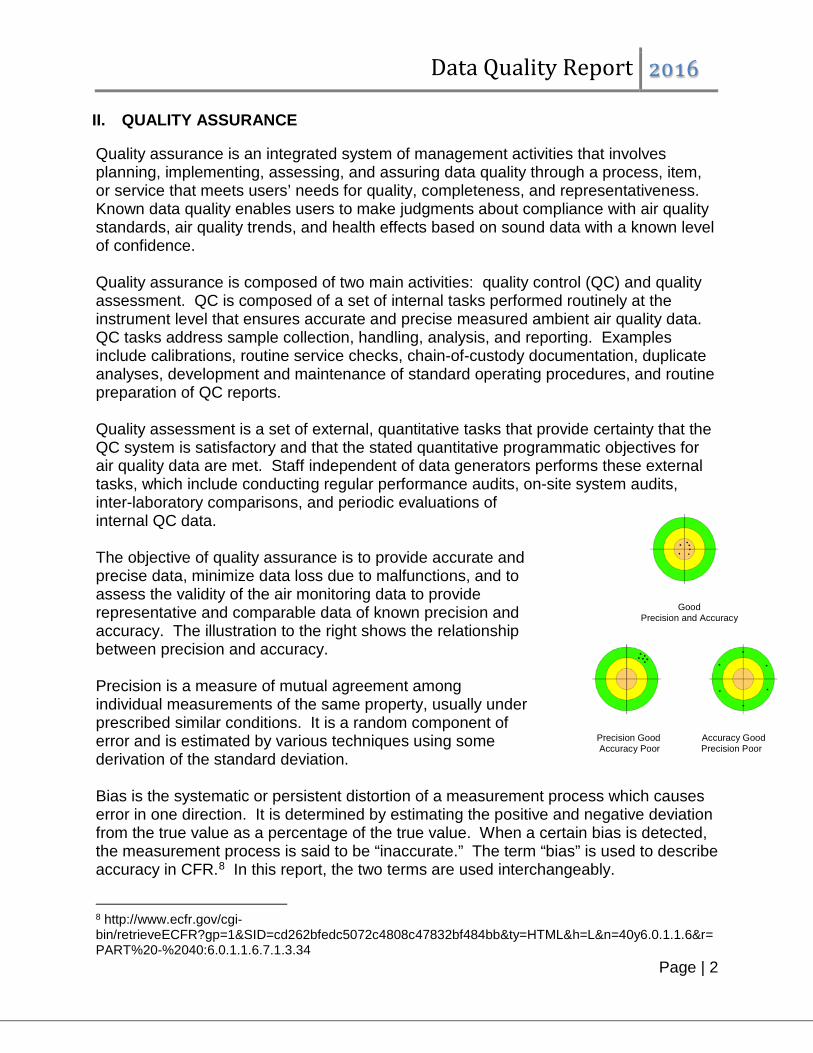
II. QUALITY ASSURANCE Quality assurance is an integrated system of management activities that involves planning, implementing, assessing, and assuring data quality through a process, item, or service that meets users’ needs for quality, completeness, and representativeness. Known data quality enables users to make judgments about compliance with air quality standards, air quality trends, and health effects based on sound data with a known level of confidence. Quality assurance is composed of two main activities: quality control (QC) and quality assessment. QC is composed of a set of internal tasks performed routinely at the instrument level that ensures accurate and precise measured ambient air quality data. QC tasks address sample collection, handling, analysis, and reporting. Examples include calibrations, routine service checks, chain-of-custody documentation, duplicate analyses, development and maintenance of standard operating procedures, and routine preparation of QC reports. Quality assessment is a set of external, quantitative tasks that provide certainty that the QC system is satisfactory and that the stated quantitative programmatic objectives for air quality data are met. Staff independent of data generators performs these external tasks, which include conducting regular performance audits, on-site system audits, inter-laboratory comparisons, and periodic evaluations of internal QC data. The objective of quality assurance is to provide accurate and precise data, minimize data loss due to malfunctions, and to assess the validity of the air monitoring data to provide representative and comparable data of known precision and accuracy. The illustration to the right shows the relationship between precision and accuracy. Precision is a measure of mutual agreement among individual measurements of the same property, usually under prescribed similar conditions. It is a random component of error and is estimated by various techniques using some derivation of the standard deviation. Bias is the systematic or persistent distortion of a measurement process which causes error in one direction. It is determined by estimating the positive and negative deviation from the true value as a percentage of the true value. When a certain bias is detected, the measurement process is said to be “inaccurate.” The term “bias” is used to describe accuracy in CFR.8 In this report, the two terms are used interchangeably.
8 http://www.ecfr.gov/cgi-bin/retrieveECFR?gp=1&SID=cd262bfedc5072c4808c47832bf484bb&ty=HTML&h=L&n=40y6.0.1.1.6&r=PART%20-%2040:6.0.1.1.6.7.1.3.34
Good Precision and Accuracy
Precision Good Accuracy Good Accuracy Poor Precision Poor
Data Quality Report 2016
Page | 3
Precision is based on one-point QC checks for gaseous instruments and paired measurements from collocated samplers for particulate matter (PM). For precision, the statistic is the upper bound of the coefficient of variation (CV), which reflects the highest estimate of the variability in the instrument’s measurements. One-point QC checks for gaseous instruments are also used to estimate bias. For PM, bias can be estimated from flow rate verifications; however, only flow rate verifications from continuous PM10 analyzers are required to be uploaded to AQS. Available tools for assessing precision and bias are summarized in Appendix A of this report (while details on cases where the criteria for precision or bias are not met can be found in Appendix B). Detailed descriptions of the CV and the bias estimator, including the formulae behind the calculations, can be found in Appendix D of this report. Accuracy of the instruments is further validated or assessed by the through-the-probe performance audits conducted via the CARB annual performance evaluation program for gaseous pollutants or via the semi-annual flow rate audits for PM. Appendix A lists CARB’s audit performance criteria, which were developed to closely match the National Performance Audit Program.9 Consistent with the goals of assessing precision and accuracy of the instruments/samplers, this report also assesses the amount of ambient air quality data produced by the instruments or samplers. Depending on the sampling frequency of each respective instrument or sampler, data capture is compiled as a percentage of the ambient data collected over the total amount of data possible. Air Quality Data Actions (AQDA) are key tools used by the Quality Management Branch (QMB) of the Monitoring and Laboratory Division to identify and correct issues which would adversely affect the quality of the ambient data generated by the samplers. An AQDA is initiated by CARB auditors upon a failed audit. After an AQDA has been issued, an investigation into the causes of the failure will determine an outcome on the affected data. The data in question can be affected in three ways: released, corrected, or invalidated. Data that are released meet compliance criteria and can be used in all aspects of decision making. In some cases, data are flagged with qualifier codes as they are released. Corrected data pertains to when a calculated correction value is applied, rendering the data as meeting the established control criteria. Invalidated data are considered not for record, meaning the data set will not be utilized in any designation, enforcement, or regulatory decisions. As such, null codes are associated with invalidated data. Outside of the AQDA process, data could also be flagged if monitoring agencies determine and EPA concurs that the collected data were influenced by an exceptional or natural event. Additionally, there are informational flags that do not impact the usage of the data. The implementation of a comprehensive corrective action system throughout CARB’s PQAO is an essential component for improving data quality and facilitating continuous process improvement. To meet this need, QMB implemented the Corrective Action 9 http://www3.epa.gov/ttn/amtic/npepqa.html
Data Quality Report 2016
Page | 4
Notification (CAN) process in late 2013. The CAN process documents issues that impact, or potentially impact, data quality, completeness, storage, or reporting. The goal of the CAN process is to investigate, correct, and reduce the recurrence of these issues. As such, the CAN process will identify issues not addressed by AQDAs, improve data quality, and help ensure compliance with state, federal, and local requirements.
CARB’s Quality Assurance Program is outlined in a six-volume Quality Assurance Manual, which guides the operation of the quality assurance programs used by CARB, local air districts, and private industry in California. The six-volume Quality Assurance Manual is available at http://www.arb.ca.gov/aaqm/qa/qa-manual/qa-manual.htm. There are more than 250 air monitoring sites among the four California PQAOs operating in 15 separate air basins in California. Within CARB’s PQAO, there are 21 local air districts operating sites under CARB’s guidance. Information about each air monitoring station audited by QMB is available at http://www.arb.ca.gov/qaweb. III. DATA QUALITY - STATISTICAL SUMMARY RESULTS The results are presented for two groups of pollutants: gases and particulate matter. For each group, the amount of ambient data collected (or captured) is discussed first, followed with an assessment of the quality behind the data. Statistical results presented in this report reflect the current information in AQS, with the exception of 2016 data, which is also updated to reflect corrections of data quality issues noted in Appendix B. These minor changes to 2016 data are not reflected in AQS since the data have already been certified and changing the data would require recertification. Data for 2014 and 2015 directly reflect the current information in AQS, and as such, they will reflect changes that occurred to past data since the 2015 Annual Data Quality Report was prepared. For example, “begin” and “end” dates for monitors may have been corrected, and parameter or method codes may have been updated to reflect the correct status of monitors in AQS. These changes may result in 2014 or 2015 data that differ from those published in the 2015 report. A. Gaseous Criteria Pollutants The gaseous pollutants assessed in this report are carbon monoxide (CO), ozone (O3), nitrogen dioxide (NO2), and sulfur dioxide (SO2). Ambient Data Capture: Data capture, as described in this report, is derived from the AQS completeness report AMP 430. The calculated number in AMP 430 represents the average of the monthly data capture rates for the calendar year and may not always be
Data Quality Report 2016
Page | 5
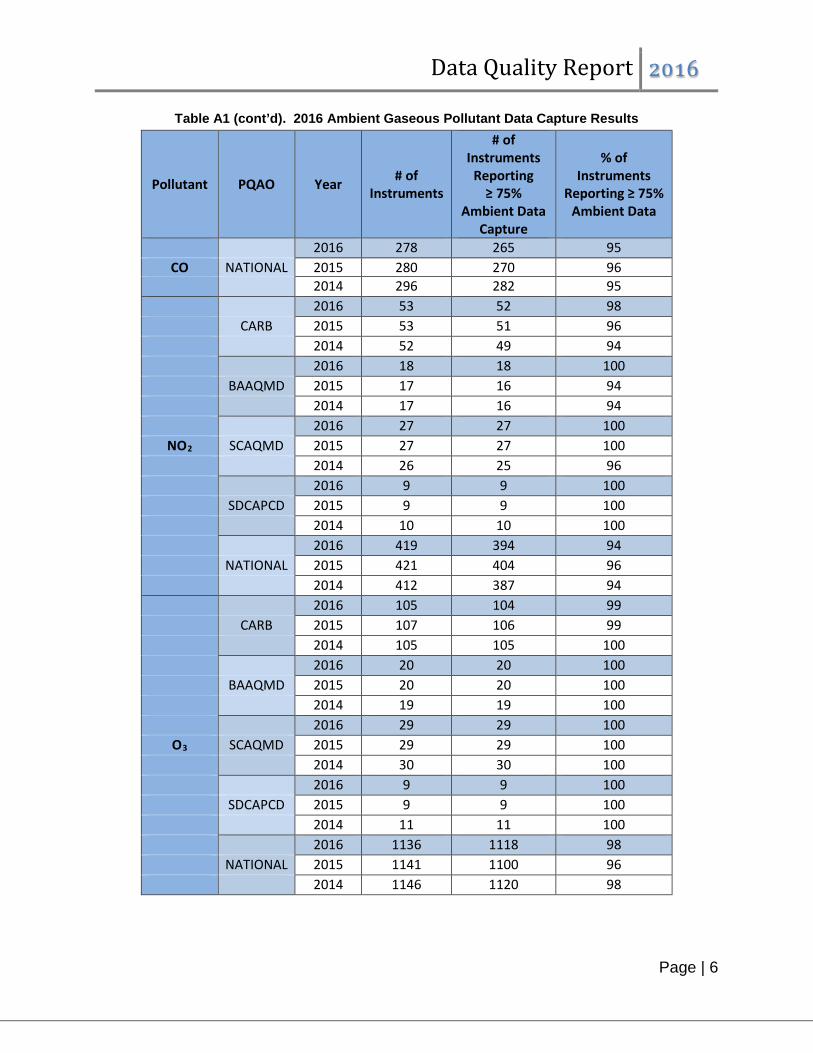
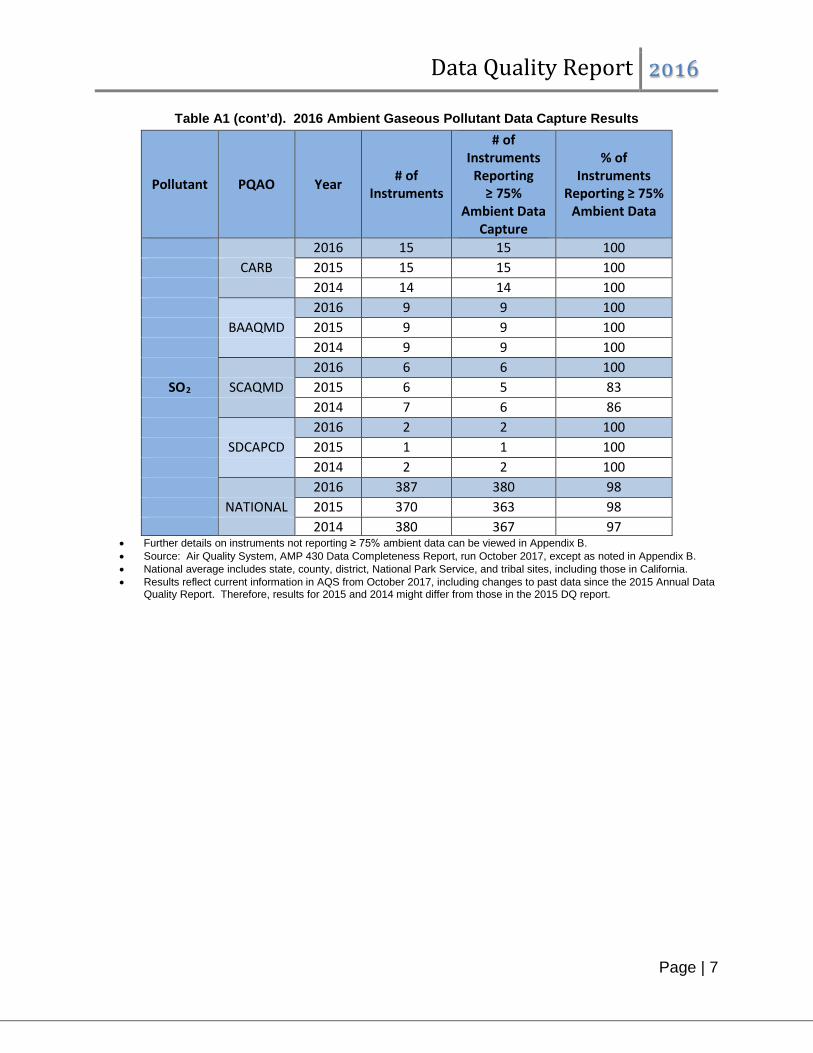
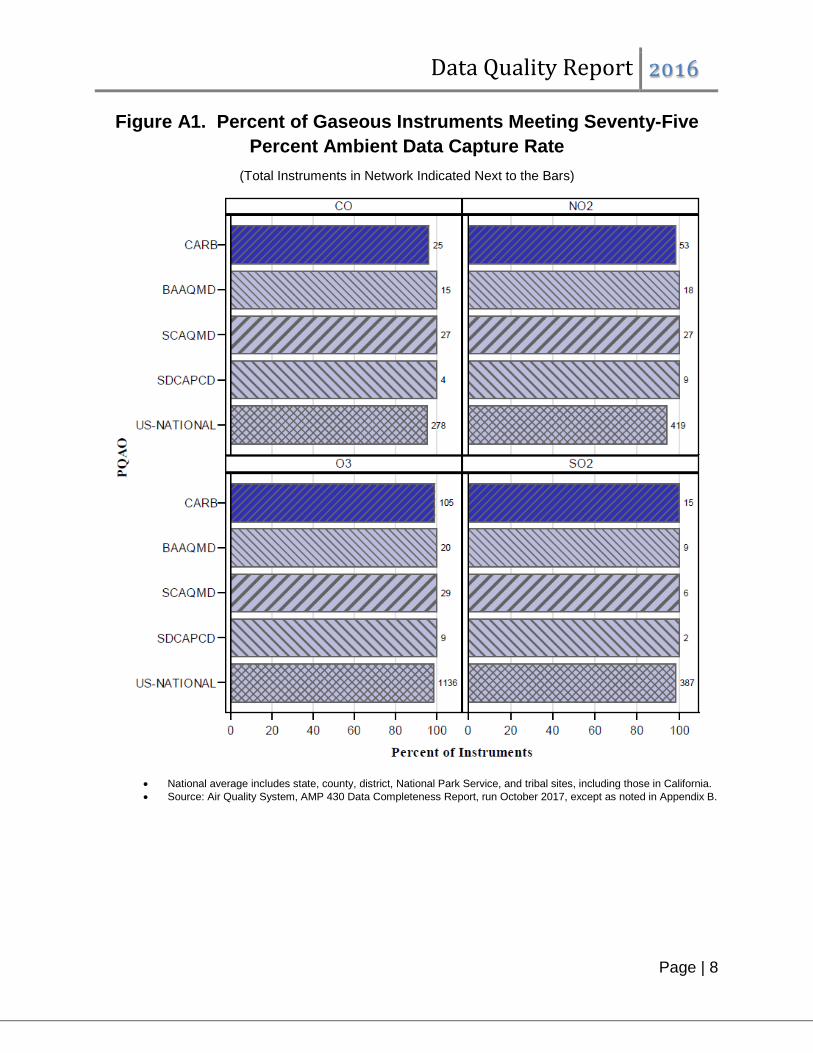
indicative of whether the 75 percent regulatory completeness requirement10 is met for a particular pollutant, considering the operational period in the year. Note that while this report focuses on the federal requirement of a minimum data capture rate of 75 percent, CARB’s goal is to have at least 85 percent of the data in AQS. Table A1 and Figure A1 present the percentage of instruments that reported at least 75 percent of the possible ambient data for each gaseous pollutant for each PQAO. Table A2 displays similar information for CARB and each local air district operating within CARB’s PQAO. Monitoring sites within each geographic area may be operated by the district, CARB, or both. As shown in the tables, very few instruments within CARB’s PQAO reported a data capture rate of less than 75 percent. Compared to previous years, 2016 had about the same number of instruments reporting at least 75 percent of the ambient gaseous data. In fact, only three gaseous instruments reported less than 75% ambient data in 2016. When subjected to ARB’s goal of 85%, an additional eight instruments11 would not meet this goal.
Table A1. 2016 Ambient Gaseous Pollutant Data Capture Results
10 40 CFR Part 50 states that the ambient data from a given instrument or sampler, in a calendar year, must be at least 75% complete to be included in making regulatory decisions, such as determinations of attainment of the ambient air quality standards. The State of California defines data “completeness” in a similar way, also using 75% as part of its criteria. However, unlike the federal definition, the State requirement factors in the high season of the pollutant in the completeness criteria (e.g., only months within the high ozone season are considered for ozone standard). 11 Eight gaseous instruments that do not meet ARB’s goal of 85% data capture rates are at North Highlands, Sacramento-Del Paso Manor, Sacramento-T St, Elk Grove-Bruceville, Jerseydale, Fresno-Drummond, Parlier, and Clovis.
Pollutant PQAO Year # of Instruments
# of Instruments
Reporting ≥ 75%
Ambient Data Capture
% of Instruments
Reporting ≥ 75% Ambient Data
2016 25 24 96 CARB 2015 31 28 90 2014 31 30 97 2016 15 15 100 BAAQMD 2015 14 14 100 2014 14 14 100 2016 27 27 100
CO SCAQMD 2015 27 26 96 2014 27 27 100 2016 4 4 100 SDCAPCD 2015 4 4 100 2014 4 4 100
Data Quality Report 2016
Page | 6
Table A1 (cont’d). 2016 Ambient Gaseous Pollutant Data Capture Results
Pollutant PQAO Year # of Instruments
# of Instruments
Reporting ≥ 75%
Ambient Data Capture
% of Instruments
Reporting ≥ 75% Ambient Data
2016 278 265 95 CO NATIONAL 2015 280 270 96
2014 296 282 95 2016 53 52 98 CARB 2015 53 51 96 2014 52 49 94 2016 18 18 100 BAAQMD 2015 17 16 94 2014 17 16 94 2016 27 27 100
NO2 SCAQMD 2015 27 27 100 2014 26 25 96 2016 9 9 100 SDCAPCD 2015 9 9 100 2014 10 10 100 2016 419 394 94 NATIONAL 2015 421 404 96 2014 412 387 94 2016 105 104 99 CARB 2015 107 106 99 2014 105 105 100 2016 20 20 100 BAAQMD 2015 20 20 100 2014 19 19 100 2016 29 29 100
O3 SCAQMD 2015 29 29 100 2014 30 30 100 2016 9 9 100 SDCAPCD 2015 9 9 100 2014 11 11 100 2016 1136 1118 98 NATIONAL 2015 1141 1100 96 2014 1146 1120 98
Data Quality Report 2016
Page | 7
• Further details on instruments not reporting ≥ 75% ambient data can be viewed in Appendix B. • Source: Air Quality System, AMP 430 Data Completeness Report, run October 2017, except as noted in Appendix B. • National average includes state, county, district, National Park Service, and tribal sites, including those in California. • Results reflect current information in AQS from October 2017, including changes to past data since the 2015 Annual Data
Quality Report. Therefore, results for 2015 and 2014 might differ from those in the 2015 DQ report.
Table A1 (cont’d). 2016 Ambient Gaseous Pollutant Data Capture Results
Pollutant PQAO Year # of Instruments
# of Instruments
Reporting ≥ 75%
Ambient Data Capture
% of Instruments
Reporting ≥ 75% Ambient Data
2016 15 15 100 CARB 2015 15 15 100 2014 14 14 100 2016 9 9 100 BAAQMD 2015 9 9 100 2014 9 9 100 2016 6 6 100
SO2 SCAQMD 2015 6 5 83 2014 7 6 86 2016 2 2 100 SDCAPCD 2015 1 1 100 2014 2 2 100 2016 387 380 98 NATIONAL 2015 370 363 98 2014 380 367 97
Data Quality Report 2016
Page | 8
Figure A1. Percent of Gaseous Instruments Meeting Seventy-Five Percent Ambient Data Capture Rate
(Total Instruments in Network Indicated Next to the Bars)
• National average includes state, county, district, National Park Service, and tribal sites, including those in California. • Source: Air Quality System, AMP 430 Data Completeness Report, run October 2017, except as noted in Appendix B.

Data Quality Report 2016
Page | 9
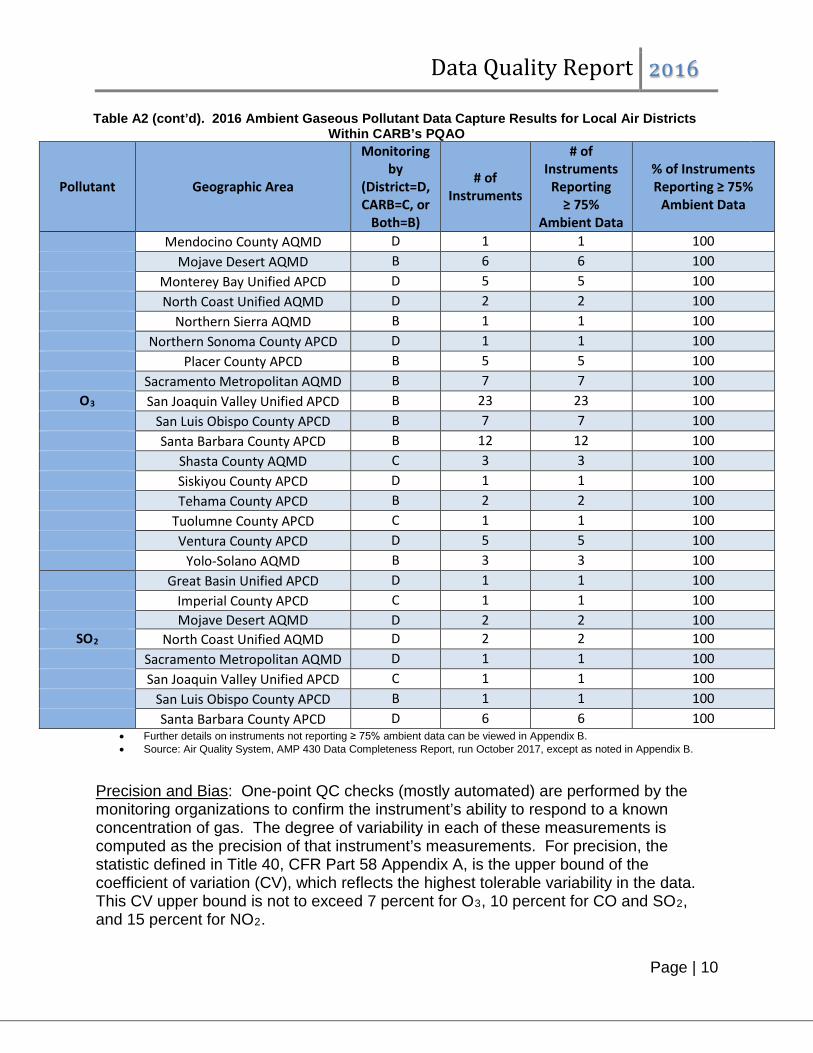
Table A2. 2016 Ambient Gaseous Pollutant Data Capture Results for Local Air Districts Within CARB’s PQAO
Pollutant Geographic Area
Monitoring by
(District=D, CARB=C, or
Both=B)
# of Instruments
# of Instruments Reporting ≥
75% Ambient Data
% of Instruments Reporting ≥ 75%
Ambient Data
Antelope Valley AQMD D 1 1 100 Butte County AQMD C 1 1 100 Great Basin APCD D 1 1 100 Imperial County APCD B 2 1 50 Mojave Desert AQMD D 2 2 100
CO Monterey Bay Unified APCD D 1 1 100 North Coast Unified AQMD D 2 2 100 Sacramento Metropolitan AQMD D 4 4 100 San Joaquin Valley Unified APCD B 5 5 100 Santa Barbara County APCD B 6 6 100 Antelope Valley AQMD D 1 1 100 Butte County AQMD C 1 1 100 Feather River AQMD C 1 0 0 Imperial County APCD B 2 2 100 Mojave Desert AQMD D 3 3 100 Monterey Bay Unified APCD D 1 1 100 North Coast Unified AQMD D 2 2 100
NO2 Placer County APCD C 1 1 100 Sacramento Metropolitan AQMD B 7 7 100 San Joaquin Valley Unified APCD B 17 17 100 San Luis Obispo County APCD D 3 3 100 Santa Barbara County APCD B 11 11 100 Ventura County APCD D 2 2 100 Yolo-Solano AQMD C 1 1 100 Amador County APCD C 1 1 100 Antelope Valley AQMD D 1 1 100 Butte County AQMD C 2 2 100 Calaveras County APCD C 1 1 100 Colusa County APCD C 1 1 100 Eastern Kern APCD D 1 1 100
O3 El Dorado County AQMD C 3 3 100 Feather River AQMD C 2 2 100 Glenn County APCD C 1 1 100 Great Basin APCD D 1 1 100 Imperial County APCD B 4 3 75 Lake County APCD D 1 1 100 Mariposa County APCD C 1 1 100
Data Quality Report 2016
Page | 10
Table A2 (cont’d). 2016 Ambient Gaseous Pollutant Data Capture Results for Local Air Districts Within CARB’s PQAO
Pollutant Geographic Area
Monitoring by
(District=D, CARB=C, or
Both=B)
# of Instruments
# of Instruments
Reporting ≥ 75%
Ambient Data
% of Instruments Reporting ≥ 75%
Ambient Data
Mendocino County AQMD D 1 1 100 Mojave Desert AQMD B 6 6 100 Monterey Bay Unified APCD D 5 5 100 North Coast Unified AQMD D 2 2 100 Northern Sierra AQMD B 1 1 100 Northern Sonoma County APCD D 1 1 100 Placer County APCD B 5 5 100 Sacramento Metropolitan AQMD B 7 7 100
O3 San Joaquin Valley Unified APCD B 23 23 100 San Luis Obispo County APCD B 7 7 100 Santa Barbara County APCD B 12 12 100 Shasta County AQMD C 3 3 100 Siskiyou County APCD D 1 1 100 Tehama County APCD B 2 2 100 Tuolumne County APCD C 1 1 100 Ventura County APCD D 5 5 100 Yolo-Solano AQMD B 3 3 100 Great Basin Unified APCD D 1 1 100 Imperial County APCD C 1 1 100 Mojave Desert AQMD D 2 2 100
SO2 North Coast Unified AQMD D 2 2 100 Sacramento Metropolitan AQMD D 1 1 100 San Joaquin Valley Unified APCD C 1 1 100 San Luis Obispo County APCD B 1 1 100 Santa Barbara County APCD D 6 6 100
• Further details on instruments not reporting ≥ 75% ambient data can be viewed in Appendix B. • Source: Air Quality System, AMP 430 Data Completeness Report, run October 2017, except as noted in Appendix B.
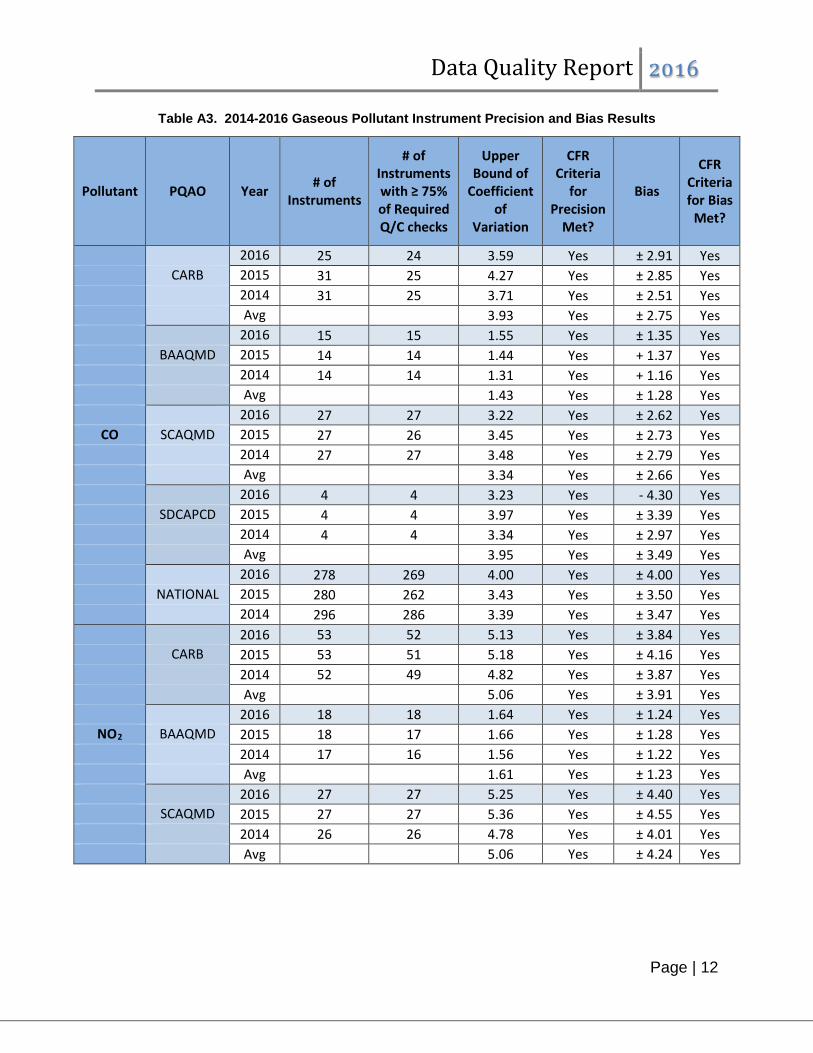
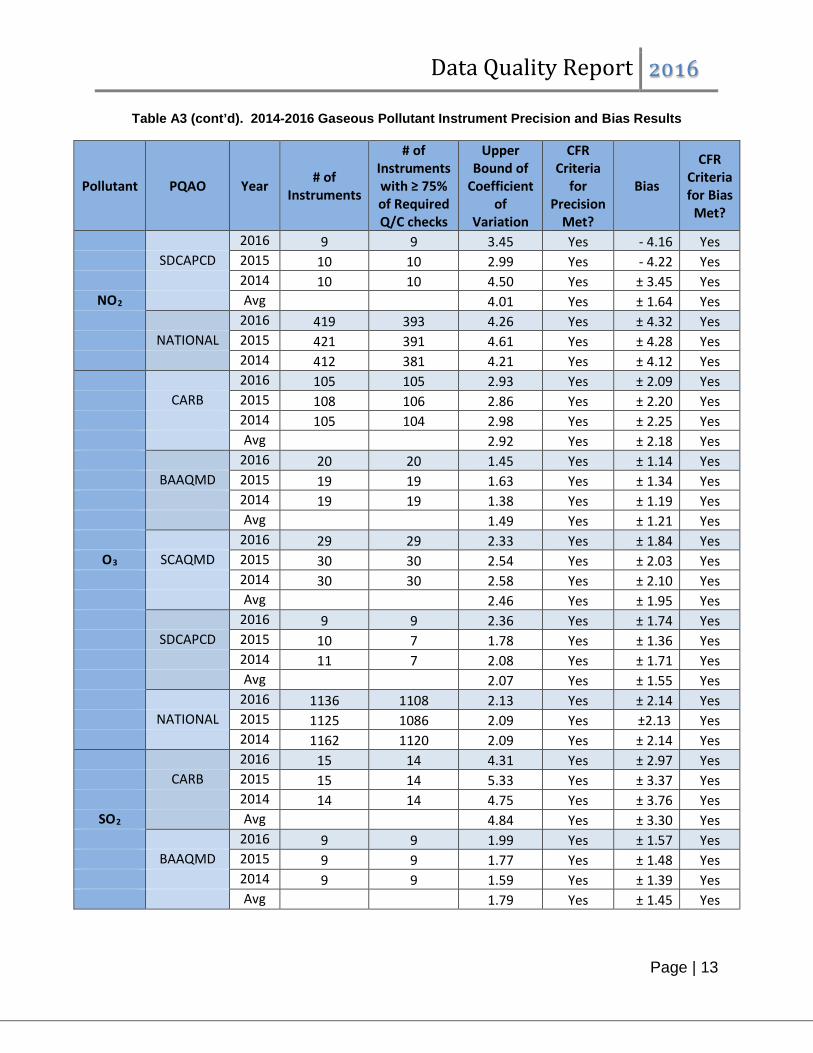
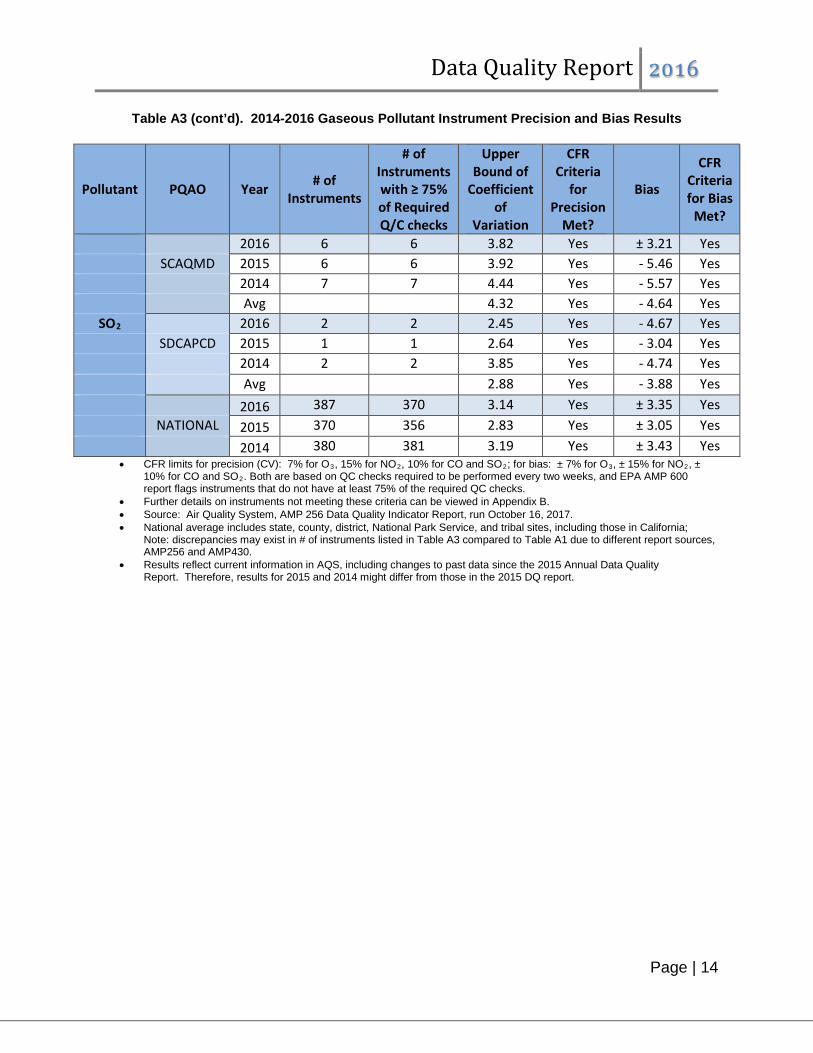
Precision and Bias: One-point QC checks (mostly automated) are performed by the monitoring organizations to confirm the instrument’s ability to respond to a known concentration of gas. The degree of variability in each of these measurements is computed as the precision of that instrument’s measurements. For precision, the statistic defined in Title 40, CFR Part 58 Appendix A, is the upper bound of the coefficient of variation (CV), which reflects the highest tolerable variability in the data. This CV upper bound is not to exceed 7 percent for O3, 10 percent for CO and SO2, and 15 percent for NO2.
Data Quality Report 2016
Page | 11
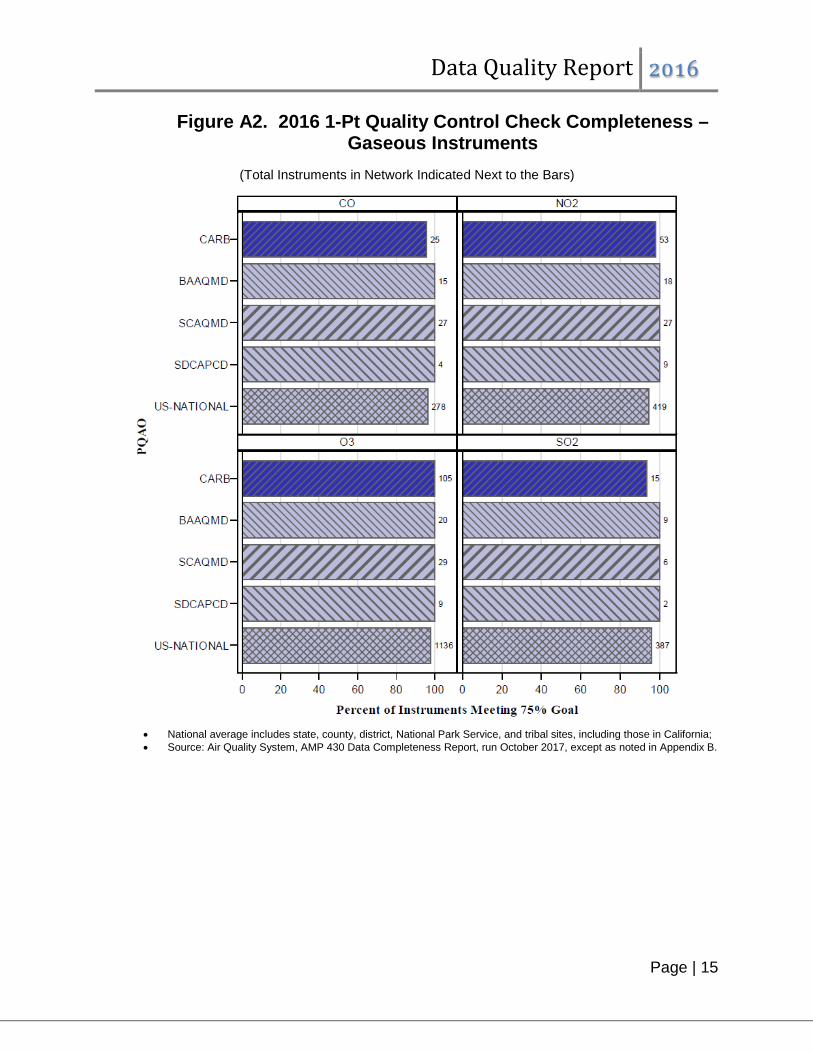
These one-point QC checks are also used to estimate the bias inherent in the sampling system associated with each instrument. Appendix A to Part 58 outlines how bias is calculated based on one-point QC checks for gaseous pollutants. The bias estimator is the upper bound on the mean absolute value of the percent differences between the instrument’s response and the true value of the gas concentration. A sign (positive/negative) is applied when the 25th and 75th percentiles are of the same sign. In other words, when at least 75 percent of the differences are all positive or negative, the bias estimate has a sign. Otherwise, the bias is denoted with “±.” For bias, the CFR criteria are: ±7 percent for O3, ±10 percent for CO and SO2, and ±15 percent for NO2.12 A detailed description of the bias estimator, including the formulae behind the calculations, can be found in Appendix D of this report. Bias estimates are further verified via the through-the-probe performance audits. CARB acceptance criteria for performance audits for 2016 were: ±10 percent for O3 (with warning at ±7 percent) and ±15 percent for CO, NO2, and SO2 (with warning at ±10 percent) for each audit point. CARB’s policy is to audit 100 percent of local air districts’ sites within its PQAO each year and audit non-CARB PQAO monitoring sites at least once every five years. Non-CARB PQAOs perform some audits on their own as part of the annual performance evaluation program. CFR requires that the one-point QC checks be performed at least once every two weeks on each automated instrument, which translates to a minimum of 26 checks per year for an instrument that operates year-round. During data certification, EPA flags instruments that do not have at least 75 percent of the required QC checks in AQS; thus, 75 percent is the criterion used in Table A3 and Figure A2. CV upper bound and bias are displayed in Figures A3 and A4. A complete listing of all MQOs set forth by EPA under Title 40 CFR and the Quality Assurance (QA) Handbook Volume II can be found in Appendix A of this report. For gaseous pollutants required by 40 CFR (CO, NO2, O3, and SO2), CARB’s PQAO (as well as other California PQAOs) met the precision and bias criteria in 2016, as shown in Table A3. Information for years 2014 and 2015 are provided for a historical perspective. Three-year averages for each PQAO are also included. In general, 2016 precision data are consistent with those in the previous two years. In addition, the required number of QC checks was achieved at most stations. Table A3 and Figure A2 include the number of instruments with at least 75 percent of the required precision data reported for 2016.
12The MQO goal for NO2 was established in guidance in 2006 as 10% and was updated in 2014 to 15%. The goal of 15% was established in regulation in 2010. Prior to 2010, there was no goal in regulation.
Data Quality Report 2016
Page | 12
Table A3. 2014-2016 Gaseous Pollutant Instrument Precision and Bias Results
Pollutant PQAO Year # of Instruments
# of Instruments with ≥ 75% of Required Q/C checks
Upper Bound of
Coefficient of
Variation
CFR Criteria
for Precision
Met?
Bias
CFR Criteria for Bias
Met?
2016 25 24 3.59 Yes ± 2.91 Yes CARB 2015 31 25 4.27 Yes ± 2.85 Yes 2014 31 25 3.71 Yes ± 2.51 Yes Avg 3.93 Yes ± 2.75 Yes 2016 15 15 1.55 Yes ± 1.35 Yes BAAQMD 2015 14 14 1.44 Yes + 1.37 Yes 2014 14 14 1.31 Yes + 1.16 Yes Avg 1.43 Yes ± 1.28 Yes 2016 27 27 3.22 Yes ± 2.62 Yes
CO SCAQMD 2015 27 26 3.45 Yes ± 2.73 Yes 2014 27 27 3.48 Yes ± 2.79 Yes Avg 3.34 Yes ± 2.66 Yes 2016 4 4 3.23 Yes - 4.30 Yes SDCAPCD 2015 4 4 3.97 Yes ± 3.39 Yes 2014 4 4 3.34 Yes ± 2.97 Yes Avg 3.95 Yes ± 3.49 Yes 2016 278 269 4.00 Yes ± 4.00 Yes NATIONAL 2015 280 262 3.43 Yes ± 3.50 Yes 2014 296 286 3.39 Yes ± 3.47 Yes 2016 53 52 5.13 Yes ± 3.84 Yes CARB 2015 53 51 5.18 Yes ± 4.16 Yes 2014 52 49 4.82 Yes ± 3.87 Yes Avg 5.06 Yes ± 3.91 Yes 2016 18 18 1.64 Yes ± 1.24 Yes
NO2 BAAQMD 2015 18 17 1.66 Yes ± 1.28 Yes 2014 17 16 1.56 Yes ± 1.22 Yes Avg 1.61 Yes ± 1.23 Yes 2016 27 27 5.25 Yes ± 4.40 Yes SCAQMD 2015 27 27 5.36 Yes ± 4.55 Yes 2014 26 26 4.78 Yes ± 4.01 Yes Avg 5.06 Yes ± 4.24 Yes
Data Quality Report 2016
Page | 13
Table A3 (cont’d). 2014-2016 Gaseous Pollutant Instrument Precision and Bias Results
Pollutant PQAO Year # of Instruments
# of Instruments with ≥ 75% of Required Q/C checks
Upper Bound of
Coefficient of
Variation
CFR Criteria
for Precision
Met?
Bias
CFR Criteria for Bias
Met?
2016 9 9 3.45 Yes - 4.16 Yes SDCAPCD 2015 10 10 2.99 Yes - 4.22 Yes 2014 10 10 4.50 Yes ± 3.45 Yes
NO2 Avg 4.01 Yes ± 1.64 Yes 2016 419 393 4.26 Yes ± 4.32 Yes NATIONAL 2015 421 391 4.61 Yes ± 4.28 Yes 2014 412 381 4.21 Yes ± 4.12 Yes 2016 105 105 2.93 Yes ± 2.09 Yes CARB 2015 108 106 2.86 Yes ± 2.20 Yes 2014 105 104 2.98 Yes ± 2.25 Yes Avg 2.92 Yes ± 2.18 Yes 2016 20 20 1.45 Yes ± 1.14 Yes BAAQMD 2015 19 19 1.63 Yes ± 1.34 Yes 2014 19 19 1.38 Yes ± 1.19 Yes Avg 1.49 Yes ± 1.21 Yes 2016 29 29 2.33 Yes ± 1.84 Yes
O3 SCAQMD 2015 30 30 2.54 Yes ± 2.03 Yes 2014 30 30 2.58 Yes ± 2.10 Yes Avg 2.46 Yes ± 1.95 Yes 2016 9 9 2.36 Yes ± 1.74 Yes SDCAPCD 2015 10 7 1.78 Yes ± 1.36 Yes 2014 11 7 2.08 Yes ± 1.71 Yes Avg 2.07 Yes ± 1.55 Yes 2016 1136 1108 2.13 Yes ± 2.14 Yes NATIONAL 2015 1125 1086 2.09 Yes ±2.13 Yes 2014 1162 1120 2.09 Yes ± 2.14 Yes 2016 15 14 4.31 Yes ± 2.97 Yes CARB 2015 15 14 5.33 Yes ± 3.37 Yes 2014 14 14 4.75 Yes ± 3.76 Yes
SO2 Avg 4.84 Yes ± 3.30 Yes 2016 9 9 1.99 Yes ± 1.57 Yes BAAQMD 2015 9 9 1.77 Yes ± 1.48 Yes 2014 9 9 1.59 Yes ± 1.39 Yes Avg 1.79 Yes ± 1.45 Yes
Data Quality Report 2016
Page | 14
Table A3 (cont’d). 2014-2016 Gaseous Pollutant Instrument Precision and Bias Results
Pollutant PQAO Year # of Instruments
# of Instruments with ≥ 75% of Required Q/C checks
Upper Bound of
Coefficient of
Variation
CFR Criteria
for Precision
Met?
Bias
CFR Criteria for Bias
Met?
2016 6 6 3.82 Yes ± 3.21 Yes SCAQMD 2015 6 6 3.92 Yes - 5.46 Yes 2014 7 7 4.44 Yes - 5.57 Yes Avg 4.32 Yes - 4.64 Yes
SO2 2016 2 2 2.45 Yes - 4.67 Yes SDCAPCD 2015 1 1 2.64 Yes - 3.04 Yes 2014 2 2 3.85 Yes - 4.74 Yes Avg 2.88 Yes - 3.88 Yes 2016 387 370 3.14 Yes ± 3.35 Yes NATIONAL 2015 370 356 2.83 Yes ± 3.05 Yes 2014 380 381 3.19 Yes ± 3.43 Yes • CFR limits for precision (CV): 7% for O3, 15% for NO2, 10% for CO and SO2; for bias: ± 7% for O3, ± 15% for NO2, ±
10% for CO and SO2. Both are based on QC checks required to be performed every two weeks, and EPA AMP 600 report flags instruments that do not have at least 75% of the required QC checks.
• Further details on instruments not meeting these criteria can be viewed in Appendix B. • Source: Air Quality System, AMP 256 Data Quality Indicator Report, run October 16, 2017. • National average includes state, county, district, National Park Service, and tribal sites, including those in California;
Note: discrepancies may exist in # of instruments listed in Table A3 compared to Table A1 due to different report sources, AMP256 and AMP430.
• Results reflect current information in AQS, including changes to past data since the 2015 Annual Data Quality Report. Therefore, results for 2015 and 2014 might differ from those in the 2015 DQ report.
Data Quality Report 2016
Page | 15
Figure A2. 2016 1-Pt Quality Control Check Completeness – Gaseous Instruments
(Total Instruments in Network Indicated Next to the Bars)
• National average includes state, county, district, National Park Service, and tribal sites, including those in California; • Source: Air Quality System, AMP 430 Data Completeness Report, run October 2017, except as noted in Appendix B.
Data Quality Report 2016
Page | 16
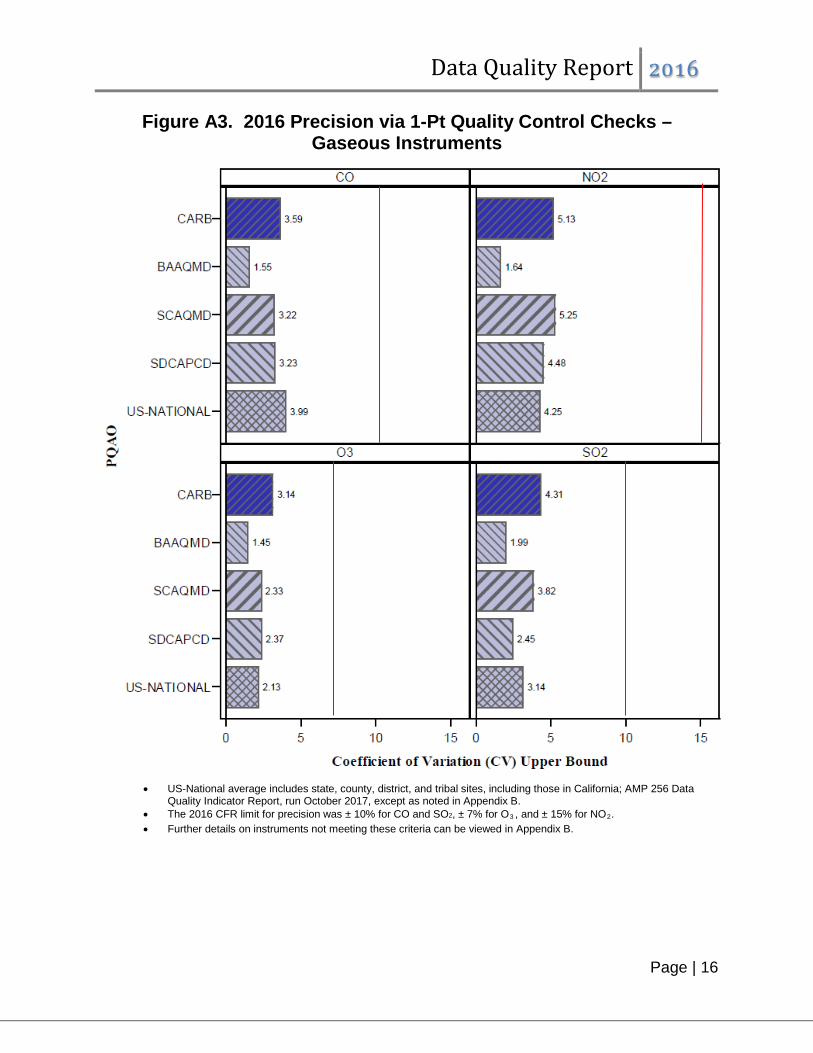
Figure A3. 2016 Precision via 1-Pt Quality Control Checks – Gaseous Instruments
• US-National average includes state, county, district, and tribal sites, including those in California; AMP 256 Data Quality Indicator Report, run October 2017, except as noted in Appendix B.
• The 2016 CFR limit for precision was ± 10% for CO and SO2, ± 7% for O3 , and ± 15% for NO2. • Further details on instruments not meeting these criteria can be viewed in Appendix B.

Data Quality Report 2016
Page | 17
Figure A4. 2016 Bias via 1-Pt Quality Control Checks – Gaseous Instruments
• US-National average includes state, county, district, and tribal sites, including those in California; AMP 256 Data Quality Indicator Report, run October 2017.
• The 2016 CFR limit for bias was ± 10% for CO and SO2, ± 7% for O3, and ± 15% for NO2. • Further details on instruments not meeting these criteria can be viewed in Appendix B.

Data Quality Report 2016
Page | 18
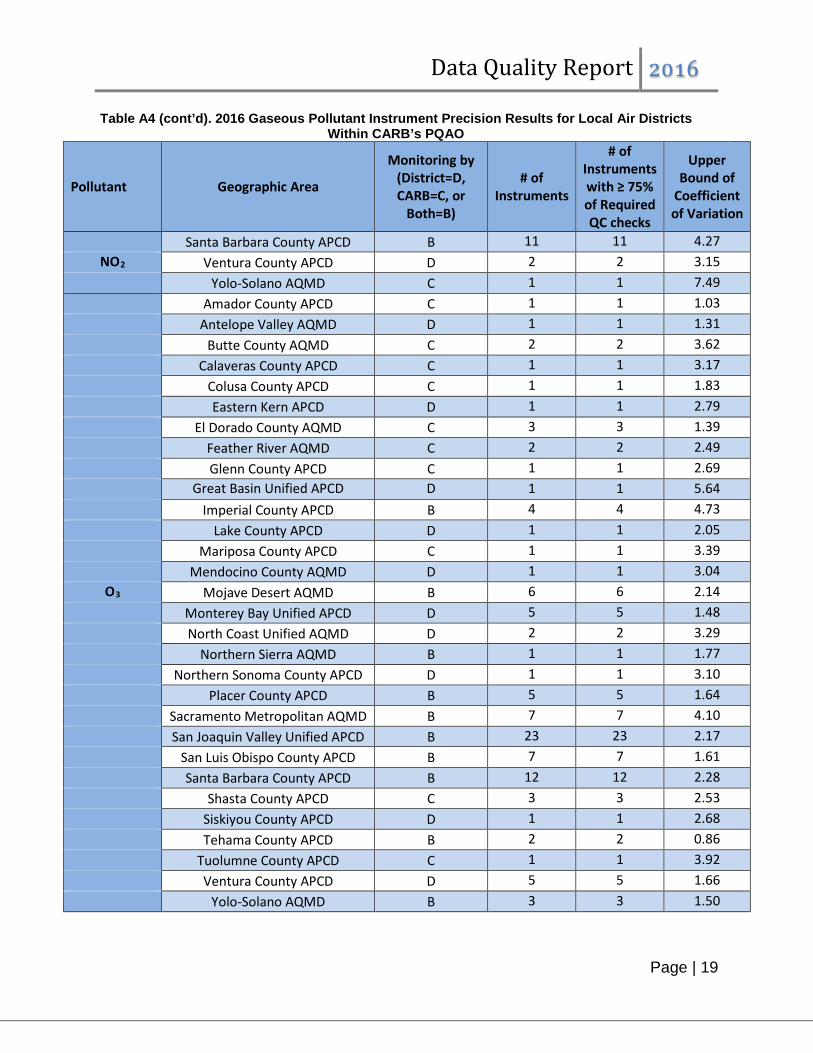
Table A4 displays precision data for each local air district within CARB’s PQAO in which sites are operated, with CV averaged across sites within each district. Monitoring sites within these areas may be operated by the district, CARB, or both. As shown in the table, all districts met the CV requirement and had very few instruments with less than 75 percent of required QC data reported. In order to provide decision makers with data of known quality, EPA provides a tool for assessing data quality in terms of three data quality indicators in graphical format13. At this link, EPA’s graphs provide detailed information on precision (CV), bias, and the number of one-point QC checks performed at each monitoring station in a given year.
Table A4. 2016 Gaseous Pollutant Instrument Precision Results for Local Air Districts Within CARB’s PQAO
Pollutant Geographic Area
Monitoring by (District=D, CARB=C, or
Both=B)
# of Instruments
# of Instruments with ≥ 75% of Required QC checks
Upper Bound of
Coefficient of Variation
Antelope Valley AQMD D 1 1 3.55 Butte County AQMD C 1 1 0.91 Great Basin Unified APCD D 1 1 1.36 Imperial County APCD B 2 2 5.50
CO Mojave Desert AQMD D 2 2 2.51 Monterey Bay Unified APCD D 1 1 2.28 North Coast Unified AQMD D 2 2 3.64 Sacramento Metropolitan AQMD D 4 3 3.49 San Joaquin Valley Unified APCD B 5 5 3.11 Santa Barbara County APCD B 6 6 2.20 Antelope Valley AQMD D 1 1 3.00 Butte County AQMD C 1 1 1.95 Feather River AQMD C 1 1 5.55 Imperial County APCD B 2 2 3.23 Mojave Desert AQMD D 3 3 3.67
NO2 Monterey Bay Unified APCD D 1 1 2.87 North Coast Unified AQMD D 2 2 4.36 Placer County APCD C 1 1 7.78 Sacramento Metropolitan AQMD B 7 6 4.87 San Joaquin Valley Unified APCD B 17 17 4.58 San Luis Obispo County APCD D 3 3 2.65
13 https://www.epa.gov/outdoor-air-quality-data/single-point-precision-and-bias-report
Data Quality Report 2016
Page | 19
Table A4 (cont’d). 2016 Gaseous Pollutant Instrument Precision Results for Local Air Districts Within CARB’s PQAO
Pollutant Geographic Area
Monitoring by (District=D, CARB=C, or
Both=B)
# of Instruments
# of Instruments with ≥ 75% of Required QC checks
Upper Bound of
Coefficient of Variation
Santa Barbara County APCD B 11 11 4.27 NO2 Ventura County APCD D 2 2 3.15
Yolo-Solano AQMD C 1 1 7.49 Amador County APCD C 1 1 1.03 Antelope Valley AQMD D 1 1 1.31 Butte County AQMD C 2 2 3.62 Calaveras County APCD C 1 1 3.17 Colusa County APCD C 1 1 1.83 Eastern Kern APCD D 1 1 2.79 El Dorado County AQMD C 3 3 1.39 Feather River AQMD C 2 2 2.49 Glenn County APCD C 1 1 2.69 Great Basin Unified APCD D 1 1 5.64 Imperial County APCD B 4 4 4.73 Lake County APCD D 1 1 2.05 Mariposa County APCD C 1 1 3.39 Mendocino County AQMD D 1 1 3.04
O3 Mojave Desert AQMD B 6 6 2.14 Monterey Bay Unified APCD D 5 5 1.48 North Coast Unified AQMD D 2 2 3.29 Northern Sierra AQMD B 1 1 1.77 Northern Sonoma County APCD D 1 1 3.10 Placer County APCD B 5 5 1.64 Sacramento Metropolitan AQMD B 7 7 4.10 San Joaquin Valley Unified APCD B 23 23 2.17 San Luis Obispo County APCD B 7 7 1.61 Santa Barbara County APCD B 12 12 2.28 Shasta County APCD C 3 3 2.53 Siskiyou County APCD D 1 1 2.68 Tehama County APCD B 2 2 0.86 Tuolumne County APCD C 1 1 3.92 Ventura County APCD D 5 5 1.66 Yolo-Solano AQMD B 3 3 1.50

Data Quality Report 2016
Page | 20
Table A4 (cont’d). 2016 Gaseous Pollutant Instrument Precision Results for Local Air Districts Within CARB’s PQAO
Pollutant Geographic Area
Monitoring by (District=D, CARB=C, or
Both=B)
# of Instruments
# of Instruments with ≥ 75% of Required QC checks
Upper Bound of
Coefficient of Variation
Great Basin APCD D 1 0 2.43 Imperial County APCD C 1 1 5.72 Mojave Desert AQMD D 2 2 4.55
SO2 North Coast Unified AQMD D 2 2 3.97 Sacramento Metropolitan AQMD D 1 1 4.97 San Joaquin Valley Unified APCD C 1 1 4.72 San Luis Obispo County APCD B 1 1 2.38 Santa Barbara County APCD D 6 6 2.24
• AQMD – Air Quality Management District • APCD – Air Pollution Control District • CFR Limit for precision CV: 7% for O3, 15% for NO2, 10% for CO and SO2, based on QC checks required to be performed
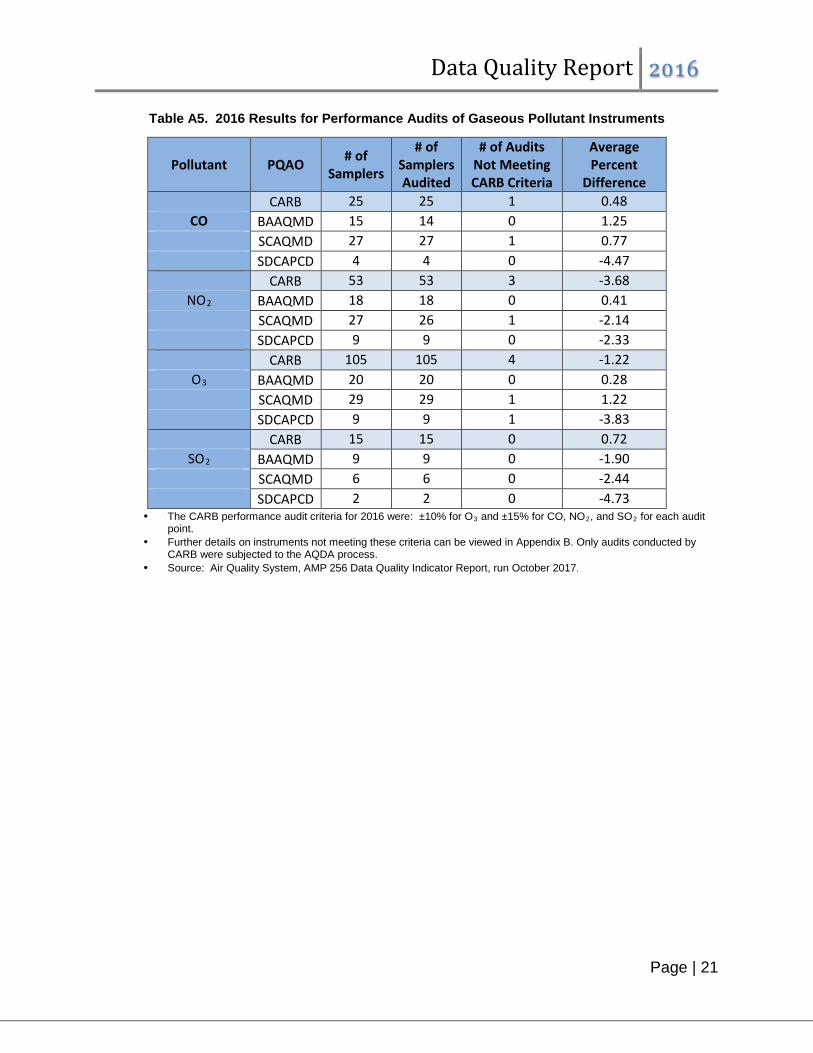
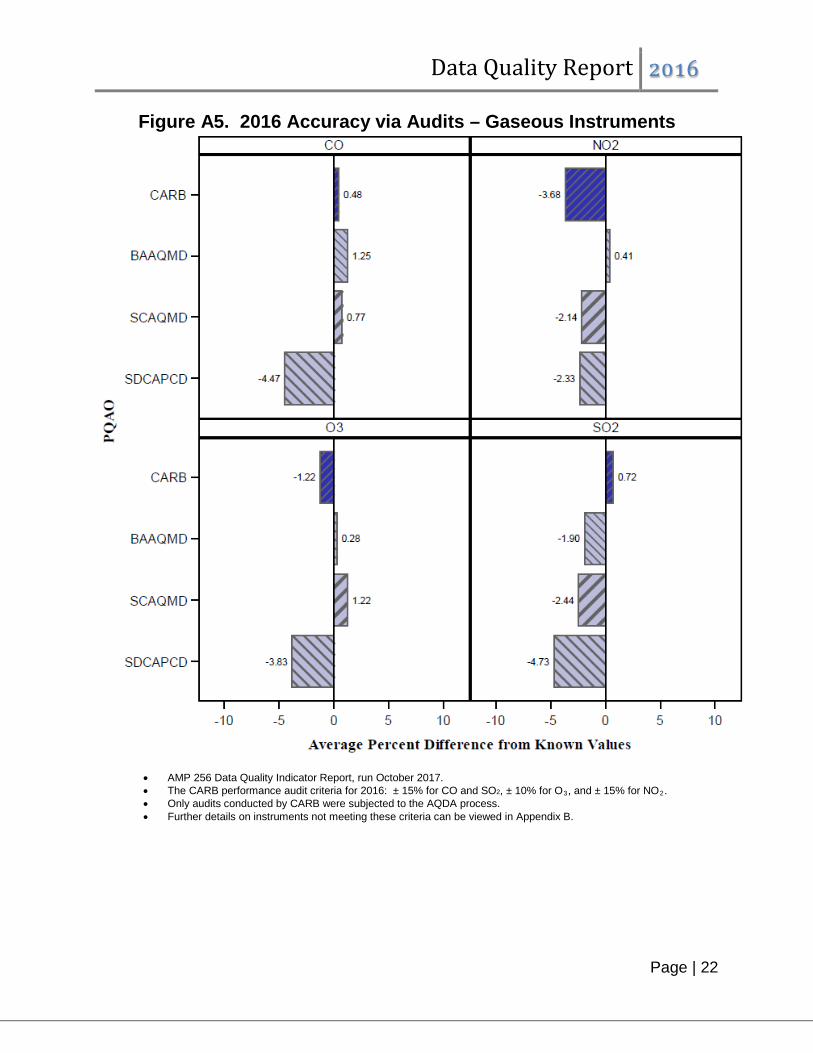
every two weeks, and EPA AMP 600 report flags instruments that do not have at least 75% of the required QC checks. • Further details on instruments not meeting these criteria can be viewed in Appendix B. • Source: Air Quality System, AMP 256 Data Quality Indicator Report, run October 2017. Accuracy Validation Via Performance Audits: To further validate bias estimates from one-point QC checks, CFR requires that independent performance audits be conducted and the average percent differences be evaluated against pre-determined criteria. In addition, auditing results should be assessed as to whether they are in agreement with the one-point QC checks. Table A5 and Figures A5-A6 summarize the 2016 performance audit results for the gaseous criteria pollutants. Accuracy is represented as an average percent difference. The average percent difference is the arithmetic mean of the combined differences from the known value of all the individual audit points. Audit results show that, in general, all gaseous instruments met CARB criteria for bias at the PQAO level. Table A6 shows similar data for local air districts within CARB’s PQAO. Performance audit results in 2016 corroborate what the QC checks revealed: that CARB’s PQAO is providing accurate data for all gaseous pollutants. The average percent differences at the PQAO level were well below the audit criteria (±10 percent for ozone, ±15 percent for other gases) for all gaseous pollutants. This fact is further strengthened by the small number of audits that did not meet CARB performance audit criteria.
Data Quality Report 2016
Page | 21
Table A5. 2016 Results for Performance Audits of Gaseous Pollutant Instruments
Pollutant PQAO # of Samplers
# of Samplers Audited
# of Audits Not Meeting CARB Criteria
Average Percent
Difference CARB 25 25 1 0.48
CO BAAQMD 15 14 0 1.25 SCAQMD 27 27 1 0.77 SDCAPCD 4 4 0 -4.47 CARB 53 53 3 -3.68
NO2 BAAQMD 18 18 0 0.41 SCAQMD 27 26 1 -2.14 SDCAPCD 9 9 0 -2.33 CARB 105 105 4 -1.22
O3 BAAQMD 20 20 0 0.28 SCAQMD 29 29 1 1.22 SDCAPCD 9 9 1 -3.83 CARB 15 15 0 0.72
SO2 BAAQMD 9 9 0 -1.90 SCAQMD 6 6 0 -2.44 SDCAPCD 2 2 0 -4.73
• The CARB performance audit criteria for 2016 were: ±10% for O3 and ±15% for CO, NO2, and SO2 for each audit point.
• Further details on instruments not meeting these criteria can be viewed in Appendix B. Only audits conducted by CARB were subjected to the AQDA process.
• Source: Air Quality System, AMP 256 Data Quality Indicator Report, run October 2017.
Data Quality Report 2016
Page | 22
Figure A5. 2016 Accuracy via Audits – Gaseous Instruments
• AMP 256 Data Quality Indicator Report, run October 2017. • The CARB performance audit criteria for 2016: ± 15% for CO and SO2, ± 10% for O3, and ± 15% for NO2. • Only audits conducted by CARB were subjected to the AQDA process. • Further details on instruments not meeting these criteria can be viewed in Appendix B.
Data Quality Report 2016
Page | 23
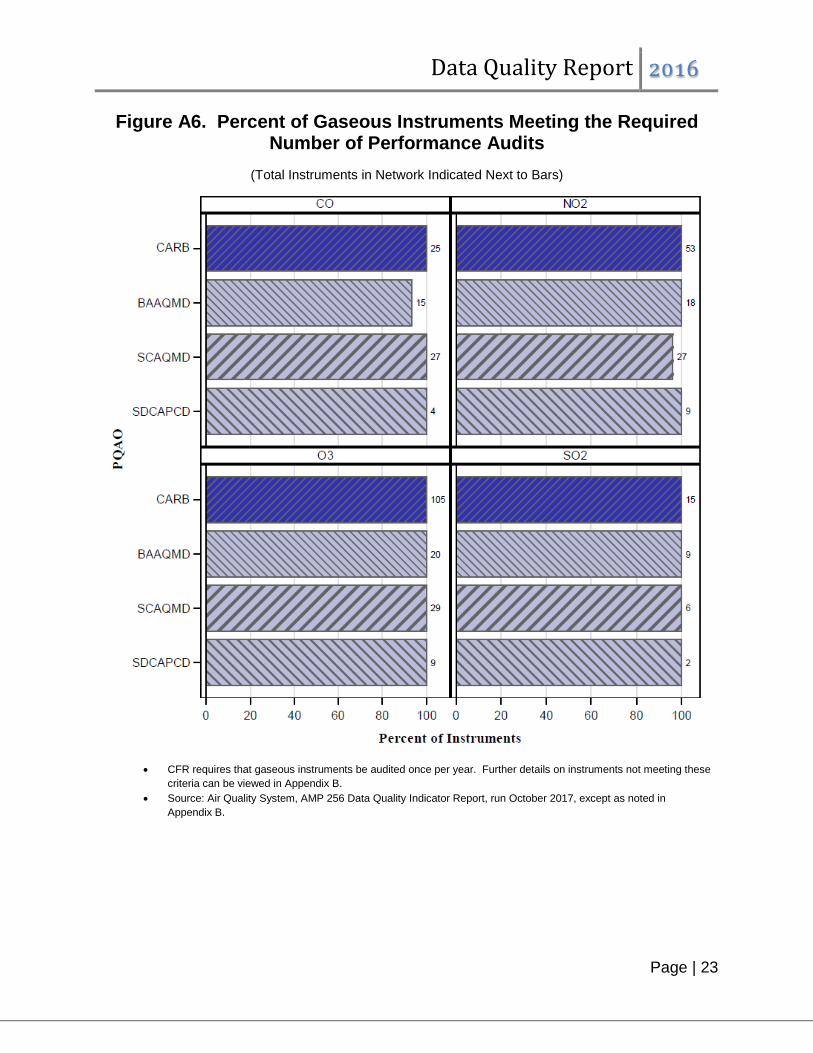
Figure A6. Percent of Gaseous Instruments Meeting the Required Number of Performance Audits
(Total Instruments in Network Indicated Next to Bars)
• CFR requires that gaseous instruments be audited once per year. Further details on instruments not meeting these
criteria can be viewed in Appendix B. • Source: Air Quality System, AMP 256 Data Quality Indicator Report, run October 2017, except as noted in
Appendix B.
Data Quality Report 2016
Page | 24
Table A6. 2016 Results for Performance Audits of Gaseous Pollutant Instruments for Local Air Districts within CARB’s PQAO
Pollutant Geographic Area
Monitoring by (District=D, CARB=C, or
Both=B)
Number of Instruments
Number of Instruments
Audited
Average Percent Difference
Antelope Valley AQMD D 1 1 -2.12 Butte County AQMD C 1 1 1.68 Great Basin APCD D 1 1 -2.03 Imperial County APCD B 2 2 -0.87 Mojave Desert AQMD D 2 2 -2.34
CO Monterey Bay Unified APCD D 1 1 3.15 North Coast Unified AQMD D 2 2 2.23 Sacramento Metropolitan AQMD D 4 4 -3.15 San Joaquin Valley Unified APCD B 5 5 3.15 Santa Barbara County APCD B 6 6 -0.03 Antelope Valley AQMD D 1 1 -13.31 Butte County AQMD C 1 1 -2.64 Feather River AQMD C 1 1 -18.15 Imperial County APCD B 2 2 -10.99 Mojave Desert AQMD D 3 3 -1.56 Monterey Bay Unified APCD D 1 1 -1.78
NO2 North Coast Unified AQMD D 2 2 -0.60 Placer County APCD C 1 1 -0.98 Sacramento Metropolitan AQMD B 7 7 -8.30 San Joaquin Valley Unified APCD B 17 17 -4.21 San Luis Obispo County APCD D 3 3 -2.28 Santa Barbara County APCD B 11 11 -3.86 Ventura County APCD D 2 2 -4.91 Yolo-Solano AQMD C 1 1 -8.19 Amador County APCD C 1 1 -1.86 Antelope Valley AQMD D 1 1 -2.11 Butte County AQMD C 2 2 -3.58 Calaveras County APCD C 1 1 -3.43 Colusa County APCD C 1 1 0.56 Eastern Kern APCD D 1 1 2.82
O3 El Dorado County AQMD C 3 3 1.68 Feather River AQMD C 2 2 0.03 Glenn County APCD C 1 1 -9.61 Great Basin APCD D 1 1 1.18 Imperial County APCD B 4 4 -2.91 Lake County APCD D 1 1 -1.82 Mariposa County APCD C 1 1 1.29
Data Quality Report 2016
Page | 25
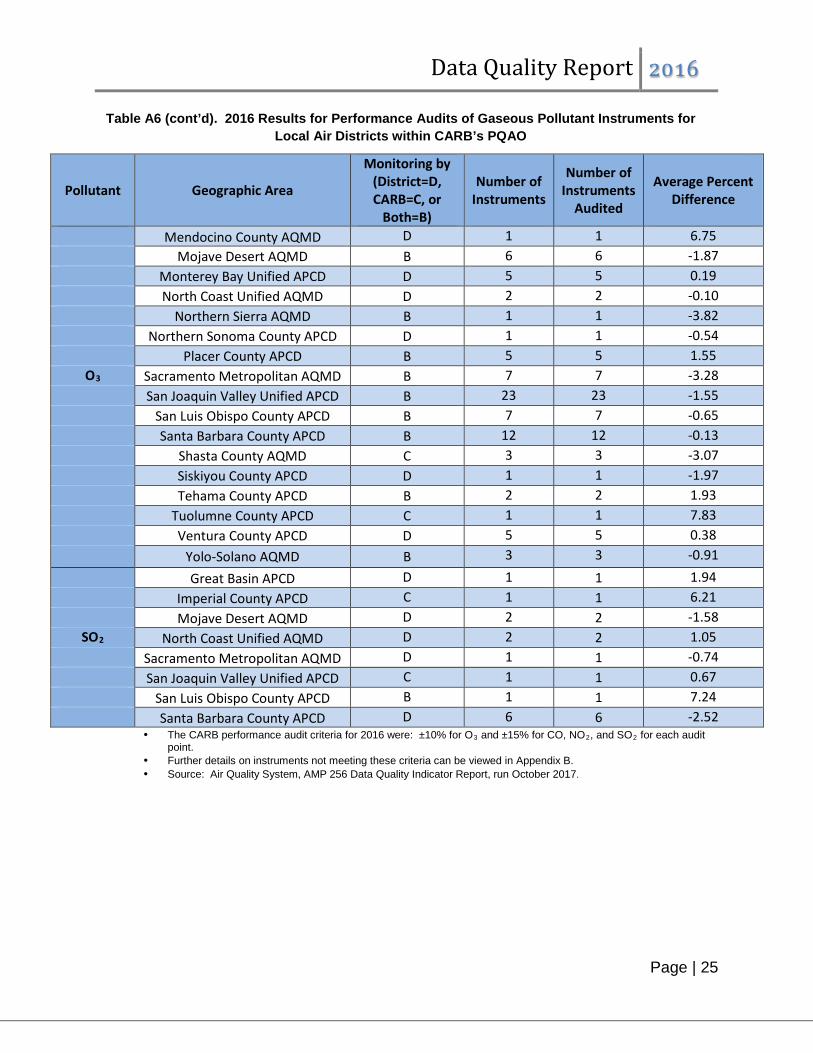
Table A6 (cont’d). 2016 Results for Performance Audits of Gaseous Pollutant Instruments for Local Air Districts within CARB’s PQAO
Pollutant Geographic Area
Monitoring by (District=D, CARB=C, or
Both=B)
Number of Instruments
Number of Instruments
Audited
Average Percent Difference
Mendocino County AQMD D 1 1 6.75 Mojave Desert AQMD B 6 6 -1.87 Monterey Bay Unified APCD D 5 5 0.19 North Coast Unified AQMD D 2 2 -0.10 Northern Sierra AQMD B 1 1 -3.82 Northern Sonoma County APCD D 1 1 -0.54 Placer County APCD B 5 5 1.55
O3 Sacramento Metropolitan AQMD B 7 7 -3.28 San Joaquin Valley Unified APCD B 23 23 -1.55 San Luis Obispo County APCD B 7 7 -0.65 Santa Barbara County APCD B 12 12 -0.13 Shasta County AQMD C 3 3 -3.07 Siskiyou County APCD D 1 1 -1.97 Tehama County APCD B 2 2 1.93 Tuolumne County APCD C 1 1 7.83 Ventura County APCD D 5 5 0.38 Yolo-Solano AQMD B 3 3 -0.91 Great Basin APCD D 1 1 1.94 Imperial County APCD C 1 1 6.21 Mojave Desert AQMD D 2 2 -1.58
SO2 North Coast Unified AQMD D 2 2 1.05 Sacramento Metropolitan AQMD D 1 1 -0.74 San Joaquin Valley Unified APCD C 1 1 0.67 San Luis Obispo County APCD B 1 1 7.24 Santa Barbara County APCD D 6 6 -2.52
• The CARB performance audit criteria for 2016 were: ±10% for O3 and ±15% for CO, NO2, and SO2 for each audit point.
• Further details on instruments not meeting these criteria can be viewed in Appendix B. • Source: Air Quality System, AMP 256 Data Quality Indicator Report, run October 2017.
Data Quality Report 2016
Page | 26
B. Particulate Matter Particulate matter (PM) monitoring is conducted using both manual and continuous type samplers. Manual samplers are operated on a one-in-six-day or one-in-three-day sampling schedule for PM10, and a similar, or more frequent schedule, for PM2.5. Continuous samplers report hourly values. Similar to the discussion of gaseous pollutants, ambient data capture is discussed first, followed with an assessment of the quality of the data captured. Ambient Data Capture: Data capture, as described in this report, is derived from the AQS completeness report AMP 430. The calculated number in AMP 430 represents the average of the monthly data capture
rates for the calendar year and may not always be indicative of whether the 75 percent regulatory completeness requirement14 is met for a particular pollutant. Note that while this report discusses the data capture rate of at least 75 percent, CARB’s goal is to have at least 85% of the data in AQS. Table B1 and Figure B1 present the percentage of samplers that reported an ambient data capture rate of at least 75 percent for each PQAO. Table B2 displays similar information for each local air district within CARB’s PQAO in which a PM sampler was operated. As can be seen in these tables, very few PM samplers within CARB’s PQAO failed to report at least a 75 percent data capture rate for the indicated ambient PM data. Compared to previous years, more ambient data were captured in 2016. In fact, only two PM samplers reported less than 75% ambient data in 2016. When subjected to ARB’s goal of 85%, an additional three samplers15 did not meet this goal. Precision and Bias: PM is subject to formal measurement quality objectives (MQOs) in federal and State regulations. Appendix A of this report lists the MQOs stated in CFR and EPA guidance. For all methods of collecting PM10 and PM2.5, Title 40 CFR Part 58 Appendix A specifies using the upper bound of CV to assess precision. This CV upper bound is not to exceed 10 percent. Collocated sampling is required to assess precision for manual PM10 and both manual and continuous PM2.5 sampling. Each PQAO is required to have a certain number of collocated sites to represent its
14 40 CFR Part 50 states that the ambient data from a given instrument or sampler, in a calendar year, must be at least 75% complete to be included in making regulatory decisions, such as determinations of attainment of the ambient air quality standards. The State of California defines data “completeness” in a similar way, also using 75% as its criteria. However, unlike the federal definition, the State requirement factors in the high season of the pollutant in the completeness criteria. 15 PM samplers at Bakersfield-Planz, Lone Pine, and Ridgecrest do not meet ARB’s goal of 85% data capture.
Data Quality Report 2016
Page | 27
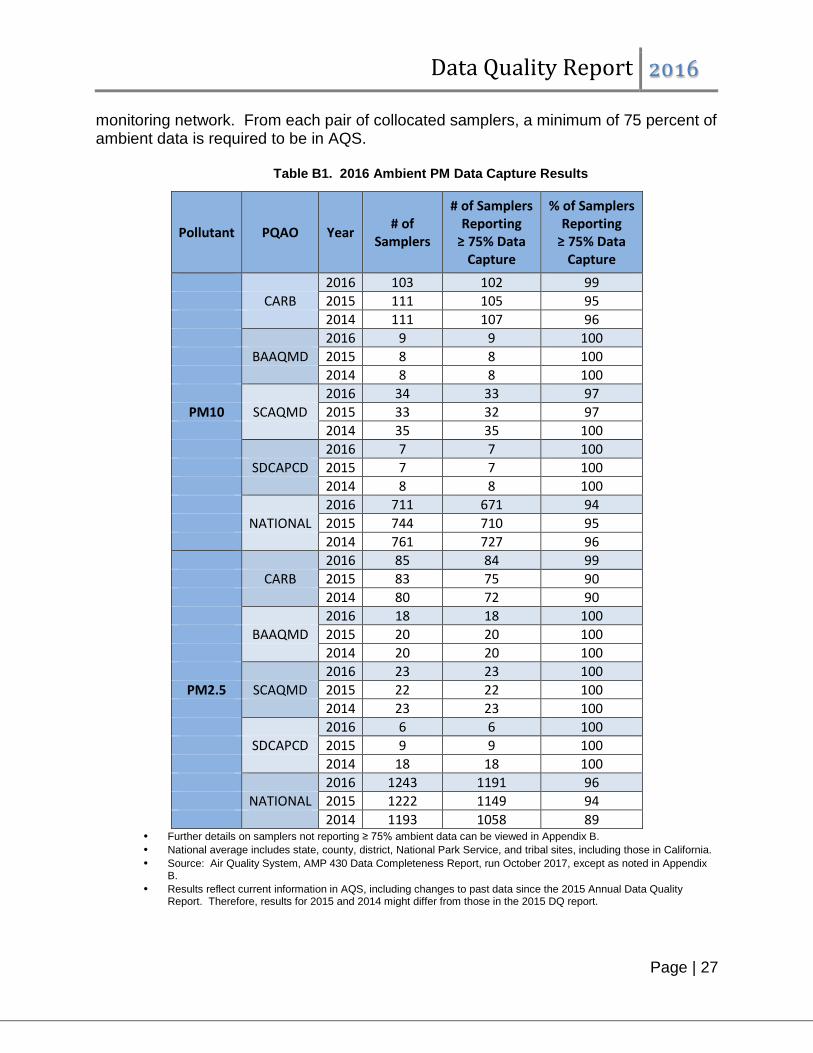
monitoring network. From each pair of collocated samplers, a minimum of 75 percent of ambient data is required to be in AQS.
Table B1. 2016 Ambient PM Data Capture Results
Pollutant PQAO Year # of Samplers
# of Samplers Reporting
≥ 75% Data Capture
% of Samplers Reporting
≥ 75% Data Capture
2016 103 102 99 CARB 2015 111 105 95 2014 111 107 96 2016 9 9 100 BAAQMD 2015 8 8 100 2014 8 8 100 2016 34 33 97
PM10 SCAQMD 2015 33 32 97 2014 35 35 100 2016 7 7 100 SDCAPCD 2015 7 7 100 2014 8 8 100 2016 711 671 94 NATIONAL 2015 744 710 95 2014 761 727 96 2016 85 84 99 CARB 2015 83 75 90 2014 80 72 90 2016 18 18 100 BAAQMD 2015 20 20 100 2014 20 20 100 2016 23 23 100
PM2.5 SCAQMD 2015 22 22 100 2014 23 23 100 2016 6 6 100 SDCAPCD 2015 9 9 100 2014 18 18 100 2016 1243 1191 96 NATIONAL 2015 1222 1149 94 2014 1193 1058 89
• Further details on samplers not reporting ≥ 75% ambient data can be viewed in Appendix B. • National average includes state, county, district, National Park Service, and tribal sites, including those in California. • Source: Air Quality System, AMP 430 Data Completeness Report, run October 2017, except as noted in Appendix
B. • Results reflect current information in AQS, including changes to past data since the 2015 Annual Data Quality
Report. Therefore, results for 2015 and 2014 might differ from those in the 2015 DQ report.
Data Quality Report 2016
Page | 28
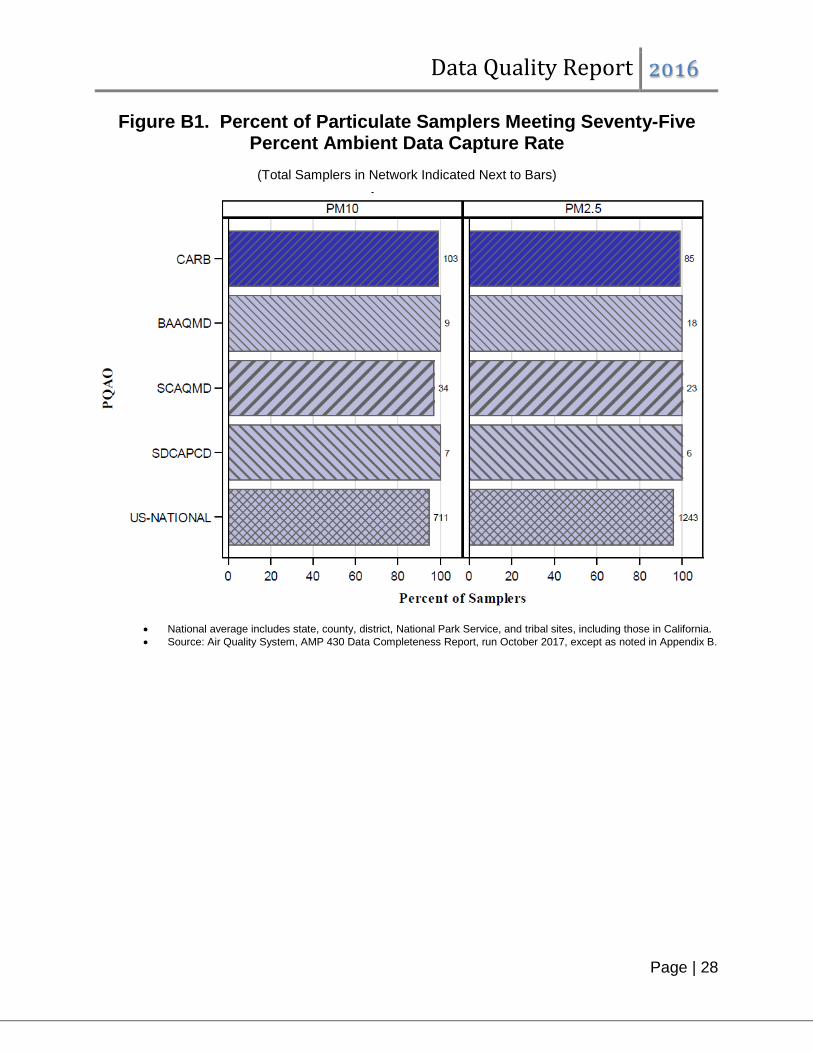
Figure B1. Percent of Particulate Samplers Meeting Seventy-Five Percent Ambient Data Capture Rate
(Total Samplers in Network Indicated Next to Bars)
• National average includes state, county, district, National Park Service, and tribal sites, including those in California. • Source: Air Quality System, AMP 430 Data Completeness Report, run October 2017, except as noted in Appendix B.
Data Quality Report 2016
Page | 29
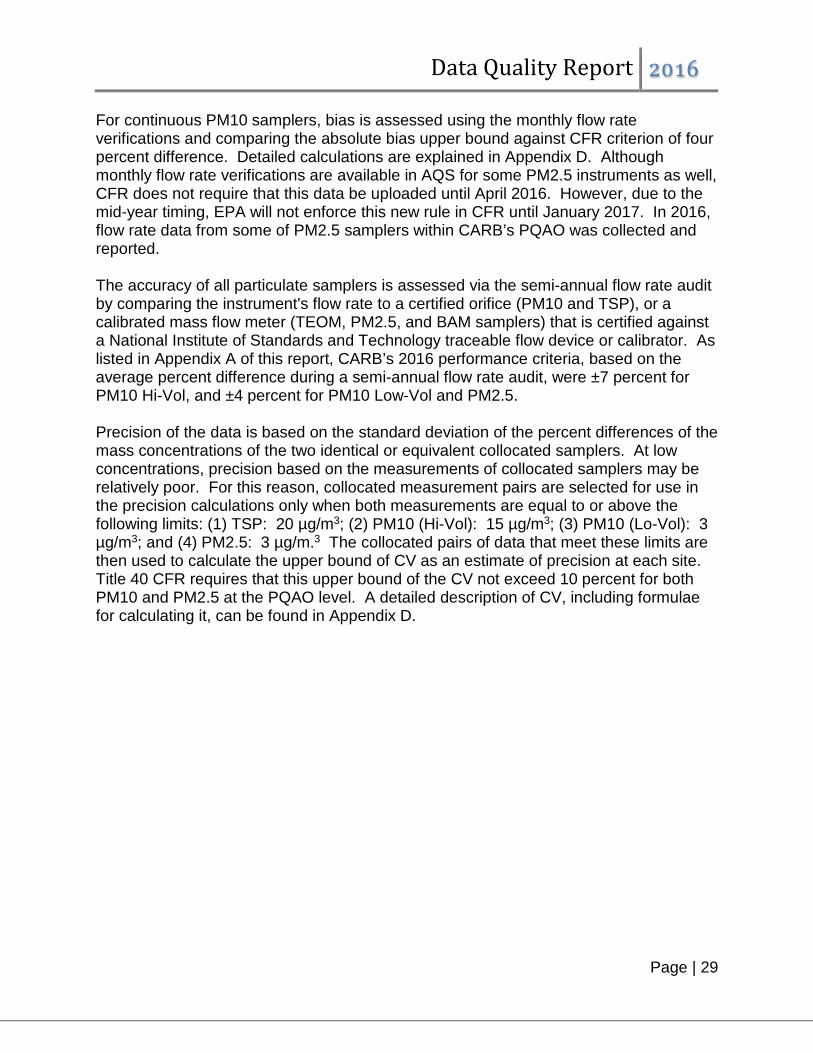
For continuous PM10 samplers, bias is assessed using the monthly flow rate verifications and comparing the absolute bias upper bound against CFR criterion of four percent difference. Detailed calculations are explained in Appendix D. Although monthly flow rate verifications are available in AQS for some PM2.5 instruments as well, CFR does not require that this data be uploaded until April 2016. However, due to the mid-year timing, EPA will not enforce this new rule in CFR until January 2017. In 2016, flow rate data from some of PM2.5 samplers within CARB’s PQAO was collected and reported. The accuracy of all particulate samplers is assessed via the semi-annual flow rate audit by comparing the instrument's flow rate to a certified orifice (PM10 and TSP), or a calibrated mass flow meter (TEOM, PM2.5, and BAM samplers) that is certified against a National Institute of Standards and Technology traceable flow device or calibrator. As listed in Appendix A of this report, CARB’s 2016 performance criteria, based on the average percent difference during a semi-annual flow rate audit, were ±7 percent for PM10 Hi-Vol, and ±4 percent for PM10 Low-Vol and PM2.5. Precision of the data is based on the standard deviation of the percent differences of the mass concentrations of the two identical or equivalent collocated samplers. At low concentrations, precision based on the measurements of collocated samplers may be relatively poor. For this reason, collocated measurement pairs are selected for use in the precision calculations only when both measurements are equal to or above the following limits: (1) TSP: 20 µg/m3; (2) PM10 (Hi-Vol): 15 µg/m3; (3) PM10 (Lo-Vol): 3 µg/m3; and (4) PM2.5: 3 µg/m.3 The collocated pairs of data that meet these limits are then used to calculate the upper bound of CV as an estimate of precision at each site. Title 40 CFR requires that this upper bound of the CV not exceed 10 percent for both PM10 and PM2.5 at the PQAO level. A detailed description of CV, including formulae for calculating it, can be found in Appendix D.
Data Quality Report 2016
Page | 30
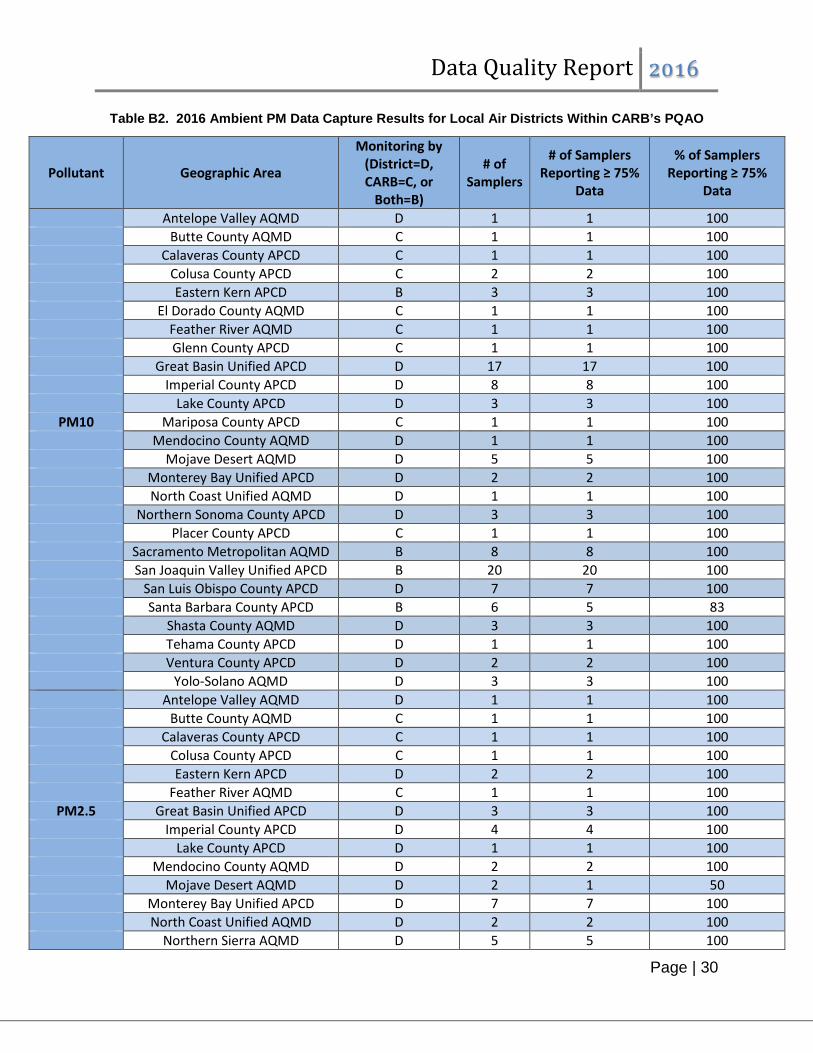
Table B2. 2016 Ambient PM Data Capture Results for Local Air Districts Within CARB’s PQAO
Pollutant Geographic Area
Monitoring by (District=D, CARB=C, or
Both=B)
# of Samplers
# of Samplers Reporting ≥ 75%
Data
% of Samplers Reporting ≥ 75%
Data
Antelope Valley AQMD D 1 1 100 Butte County AQMD C 1 1 100 Calaveras County APCD C 1 1 100 Colusa County APCD C 2 2 100 Eastern Kern APCD B 3 3 100 El Dorado County AQMD C 1 1 100 Feather River AQMD C 1 1 100 Glenn County APCD C 1 1 100 Great Basin Unified APCD D 17 17 100 Imperial County APCD D 8 8 100 Lake County APCD D 3 3 100
PM10 Mariposa County APCD C 1 1 100 Mendocino County AQMD D 1 1 100 Mojave Desert AQMD D 5 5 100 Monterey Bay Unified APCD D 2 2 100 North Coast Unified AQMD D 1 1 100 Northern Sonoma County APCD D 3 3 100 Placer County APCD C 1 1 100 Sacramento Metropolitan AQMD B 8 8 100 San Joaquin Valley Unified APCD B 20 20 100 San Luis Obispo County APCD D 7 7 100 Santa Barbara County APCD B 6 5 83 Shasta County AQMD D 3 3 100 Tehama County APCD D 1 1 100 Ventura County APCD D 2 2 100 Yolo-Solano AQMD D 3 3 100 Antelope Valley AQMD D 1 1 100 Butte County AQMD C 1 1 100 Calaveras County APCD C 1 1 100 Colusa County APCD C 1 1 100 Eastern Kern APCD D 2 2 100 Feather River AQMD C 1 1 100
PM2.5 Great Basin Unified APCD D 3 3 100 Imperial County APCD D 4 4 100 Lake County APCD D 1 1 100 Mendocino County AQMD D 2 2 100 Mojave Desert AQMD D 2 1 50 Monterey Bay Unified APCD D 7 7 100 North Coast Unified AQMD D 2 2 100 Northern Sierra AQMD D 5 5 100
Data Quality Report 2016
Page | 31
Table B2 (cont’d). 2016 Ambient PM Data Capture Results for Local Air Districts Within CARB’s PQAO
Pollutant Geographic Area
Monitoring by (District=D, CARB=C, or
Both=B)
# of Samplers
# of Samplers Reporting ≥ 75%
Data
% of Samplers Reporting ≥ 75%
Data
Placer County APCD B 3 3 100 Sacramento Metropolitan AQMD B 7 7 100 San Joaquin Valley Unified APCD B 25 25 100 San Luis Obispo County APCD D 4 4 100
PM2.5 Santa Barbara County APCD B 3 3 100 Shasta County AQMD D 1 1 100 Siskiyou County APCD D 1 1 100 Ventura County APCD D 1 1 100 Yolo-Solano AQMD B 6 6 100
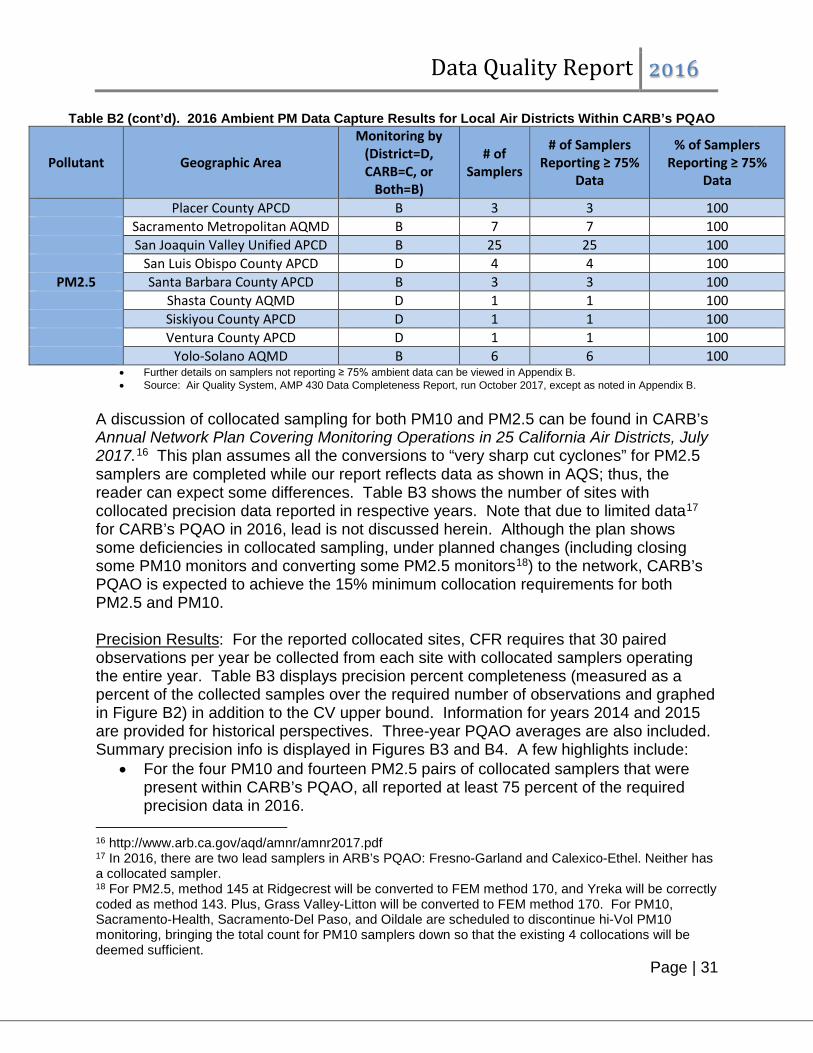
• Further details on samplers not reporting ≥ 75% ambient data can be viewed in Appendix B. • Source: Air Quality System, AMP 430 Data Completeness Report, run October 2017, except as noted in Appendix B.
A discussion of collocated sampling for both PM10 and PM2.5 can be found in CARB’s Annual Network Plan Covering Monitoring Operations in 25 California Air Districts, July 2017.16 This plan assumes all the conversions to “very sharp cut cyclones” for PM2.5 samplers are completed while our report reflects data as shown in AQS; thus, the reader can expect some differences. Table B3 shows the number of sites with collocated precision data reported in respective years. Note that due to limited data17 for CARB’s PQAO in 2016, lead is not discussed herein. Although the plan shows some deficiencies in collocated sampling, under planned changes (including closing some PM10 monitors and converting some PM2.5 monitors18) to the network, CARB’s PQAO is expected to achieve the 15% minimum collocation requirements for both PM2.5 and PM10. Precision Results: For the reported collocated sites, CFR requires that 30 paired observations per year be collected from each site with collocated samplers operating the entire year. Table B3 displays precision percent completeness (measured as a percent of the collected samples over the required number of observations and graphed in Figure B2) in addition to the CV upper bound. Information for years 2014 and 2015 are provided for historical perspectives. Three-year PQAO averages are also included. Summary precision info is displayed in Figures B3 and B4. A few highlights include:
• For the four PM10 and fourteen PM2.5 pairs of collocated samplers that were present within CARB’s PQAO, all reported at least 75 percent of the required precision data in 2016.
16 http://www.arb.ca.gov/aqd/amnr/amnr2017.pdf 17 In 2016, there are two lead samplers in ARB’s PQAO: Fresno-Garland and Calexico-Ethel. Neither has a collocated sampler. 18 For PM2.5, method 145 at Ridgecrest will be converted to FEM method 170, and Yreka will be correctly coded as method 143. Plus, Grass Valley-Litton will be converted to FEM method 170. For PM10, Sacramento-Health, Sacramento-Del Paso, and Oildale are scheduled to discontinue hi-Vol PM10 monitoring, bringing the total count for PM10 samplers down so that the existing 4 collocations will be deemed sufficient.
Data Quality Report 2016
Page | 32
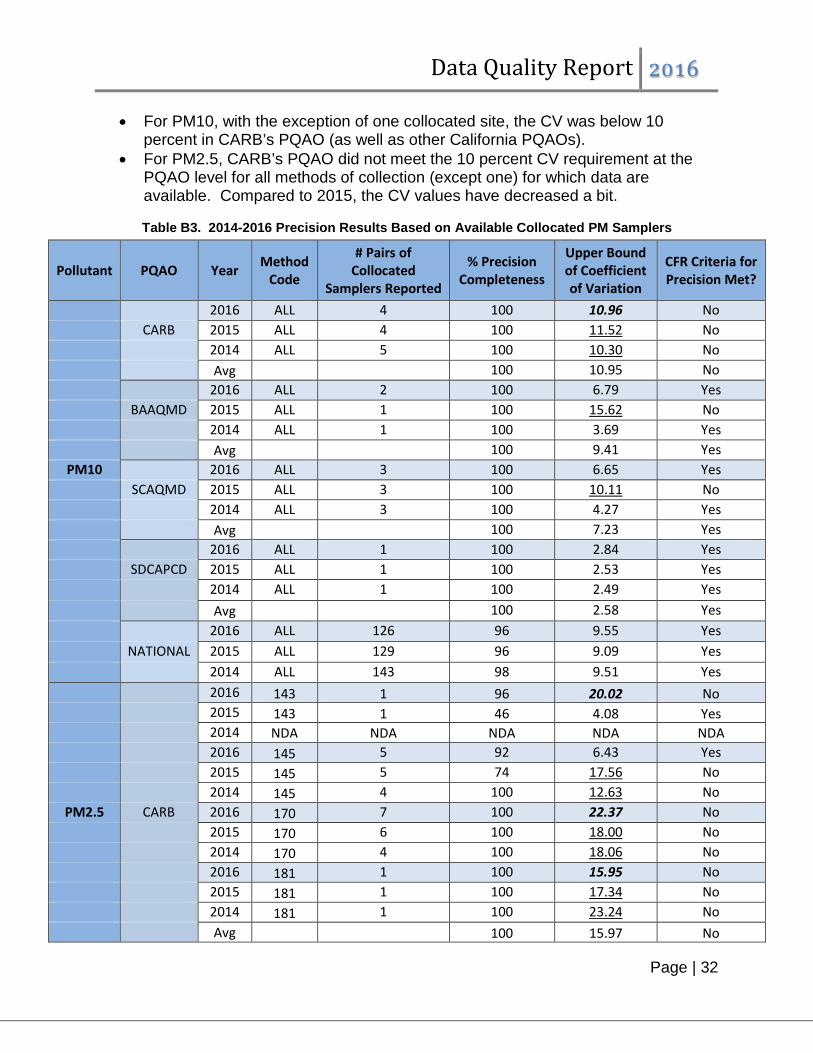
• For PM10, with the exception of one collocated site, the CV was below 10 percent in CARB’s PQAO (as well as other California PQAOs).
• For PM2.5, CARB’s PQAO did not meet the 10 percent CV requirement at the PQAO level for all methods of collection (except one) for which data are available. Compared to 2015, the CV values have decreased a bit.
Table B3. 2014-2016 Precision Results Based on Available Collocated PM Samplers
Pollutant PQAO Year Method Code
# Pairs of Collocated
Samplers Reported
% Precision Completeness
Upper Bound of Coefficient of Variation
CFR Criteria for Precision Met?
2016 ALL 4 100 10.96 No CARB 2015 ALL 4 100 11.52 No 2014 ALL 5 100 10.30 No Avg 100 10.95 No 2016 ALL 2 100 6.79 Yes BAAQMD 2015 ALL 1 100 15.62 No 2014 ALL 1 100 3.69 Yes Avg 100 9.41 Yes
PM10 2016 ALL 3 100 6.65 Yes SCAQMD 2015 ALL 3 100 10.11 No 2014 ALL 3 100 4.27 Yes Avg 100 7.23 Yes 2016 ALL 1 100 2.84 Yes SDCAPCD 2015 ALL 1 100 2.53 Yes 2014 ALL 1 100 2.49 Yes Avg 100 2.58 Yes 2016 ALL 126 96 9.55 Yes NATIONAL 2015 ALL 129 96 9.09 Yes 2014 ALL 143 98 9.51 Yes 2016 143 1 96 20.02 No 2015 143 1 46 4.08 Yes 2014 NDA NDA NDA NDA NDA 2016 145 5 92 6.43 Yes 2015 145 5 74 17.56 No 2014 145 4 100 12.63 No
PM2.5 CARB 2016 170 7 100 22.37 No 2015 170 6 100 18.00 No 2014 170 4 100 18.06 No 2016 181 1 100 15.95 No 2015 181 1 100 17.34 No 2014 181 1 100 23.24 No Avg 100 15.97 No

Data Quality Report 2016
Page | 33
Table B3 (cont’d). 2014-2016 Precision Results Based on Available Collocated PM Samplers
Pollutant PQAO Year Method Code
# Pairs of Collocated
Samplers Reported
% Precision Completeness
Upper Bound of Coefficient of Variation
CFR Criteria for Precision Met?
2016 170 2 100 20.84 No BAAQMD 2015 170 2 100 16.36 No 2014 170 2 100 16.44 No Avg 100 17.59 No 2016 120 NDA NDA NDA NDA 2015 120 3 41 34.04 No 2014 120 3 63 7.85 Yes SCAQMD 2016 145 3 100 7.47 Yes 2015 145 3 100 10.07 No 2014 145 NDA NDA NDA NDA Avg 100 11.66 No 2016 145 1 100 4.11 Yes 2015 145 1 100 7.93 Yes
SDCAPCD 2014 145 1 100 5.18 Yes PM2.5 Avg 100 5.74 Yes
2016 117 2 91 5.97 Yes 2015 117 3 100 16.93 No 2014 117 4 98 16.03 No 2016 118 48 85 8.61 Yes 2015 118 61 100 8.16 Yes 2014 118 68 97 10.65 No 2016 120 3 83 7.47 Yes NATIONAL 2015 120 7 72 14.50 No 2014 120 12 88 12.98 No 2016 143 11 99 11.08 No 2015 143 11 89 10.69 No 2014 143 10 93 9.41 Yes 2016 145 110 94 9.33 Yes 2015 145 86 95 8.83 Yes 2014 145 72 95 9.68 Yes
Data Quality Report 2016
Page | 34
Table B3 (cont’d). 2014-2016 Precision Results Based on Available Collocated PM Samplers
Pollutant PQAO Year Method Code
# Pairs of Collocated
Samplers Reported
% Precision Completeness
Upper Bound of Coefficient of Variation
CFR Criteria for Precision Met?
2016 170 51 99 22.14 No 2015 170 45 99 19.35 No
PM2.5 NATIONAL 2014 170 45 100 18.66 No 2016 181 5 100 13.28 No 2015 181 4 100 14.23 No 2014 181 3 100 18.53 No
• CFR Limit is a coefficient of variation of ≤ 10% for PM. Percent precision completeness is based on data collected from collocated samples. Further details on samplers not meeting these criteria can be found in Appendix B.
• Method 117 = R & P Model 2000 PM2.5 Sampler w/WINS; Method 118= R & P Model 2025 PM2.5 Sequential w/WINS; Method 120= Andersen RAAS2.5-300 PM2.5 SEQ w/WINS; Method 143= R & P Model 2000 PM2.5 Sampler w/VSCC; Method 145= R & P Model 2025 PM2.5 Sequential Air Sampler w/VSCC; Method 170= Met One BAM-1020 Mass Monitor w/VSCC; Method 181=Thermo TEOM 1400a FDMS.
• Bold italicized font indicates CV greater than 10% in 2016 while underlined font indicates CV greater than 10% in 2015 or 2014. • NDA= No collocated data available from AQS, but ambient data were reported to AQS. • Source: Air Quality System, AMP 256 Data Quality Indicator Report (Collocation Summary), run October 2017. • National average includes state, county, district, National Park Service, and tribal sites, including those in California. • Results reflect current information in AQS, including changes to past data since the 2014 Annual Data Quality Report. Therefore,
results for 2015 and 2014 might differ from those in the 2015 DQ report.
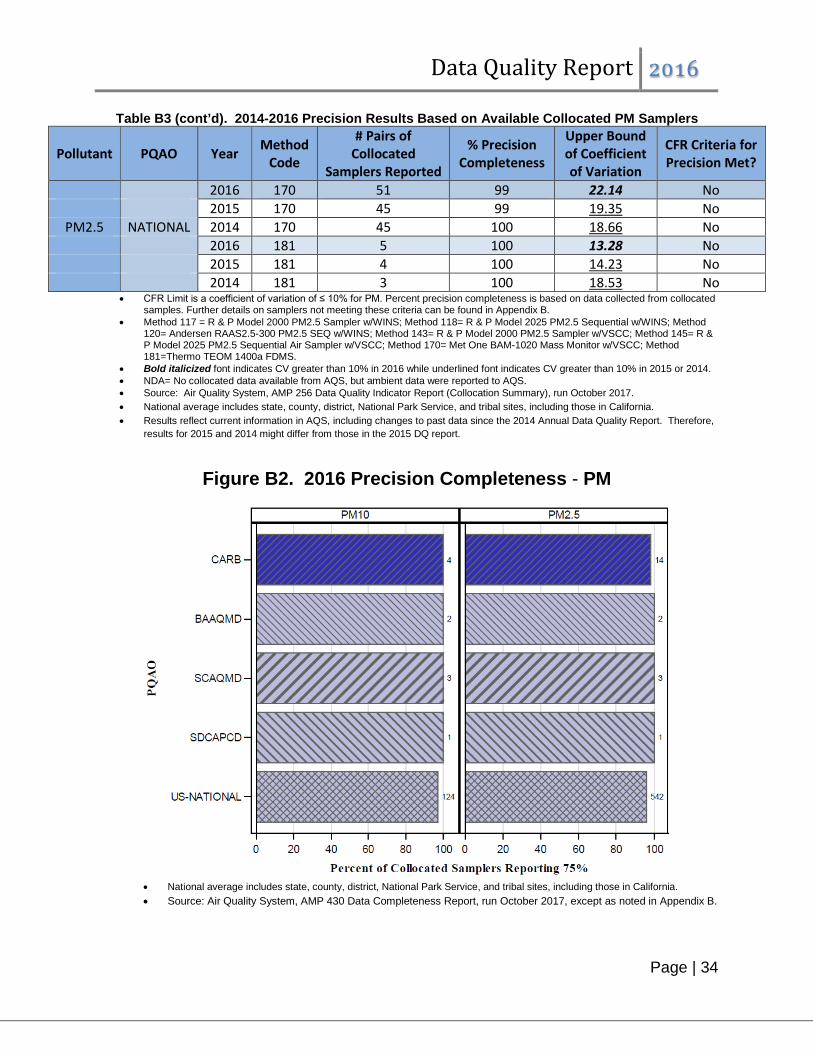
Figure B2. 2016 Precision Completeness - PM
• National average includes state, county, district, National Park Service, and tribal sites, including those in California. • Source: Air Quality System, AMP 430 Data Completeness Report, run October 2017, except as noted in Appendix B.

Data Quality Report 2016
Page | 35
Figure B3. 2016 Precision via Collocated Samplers – PM10
• Precision for manual PM10 samplers is based on collocated samples; • Source: Air Quality System, AMP 256 Data Quality Indicator Report, run October 2017. Further details on samplers
not meeting criteria can be viewed in Appendix B. • National average includes state, county, district, National Park Service, and tribal sites, including those in California.
Data Quality Report 2016
Page | 36
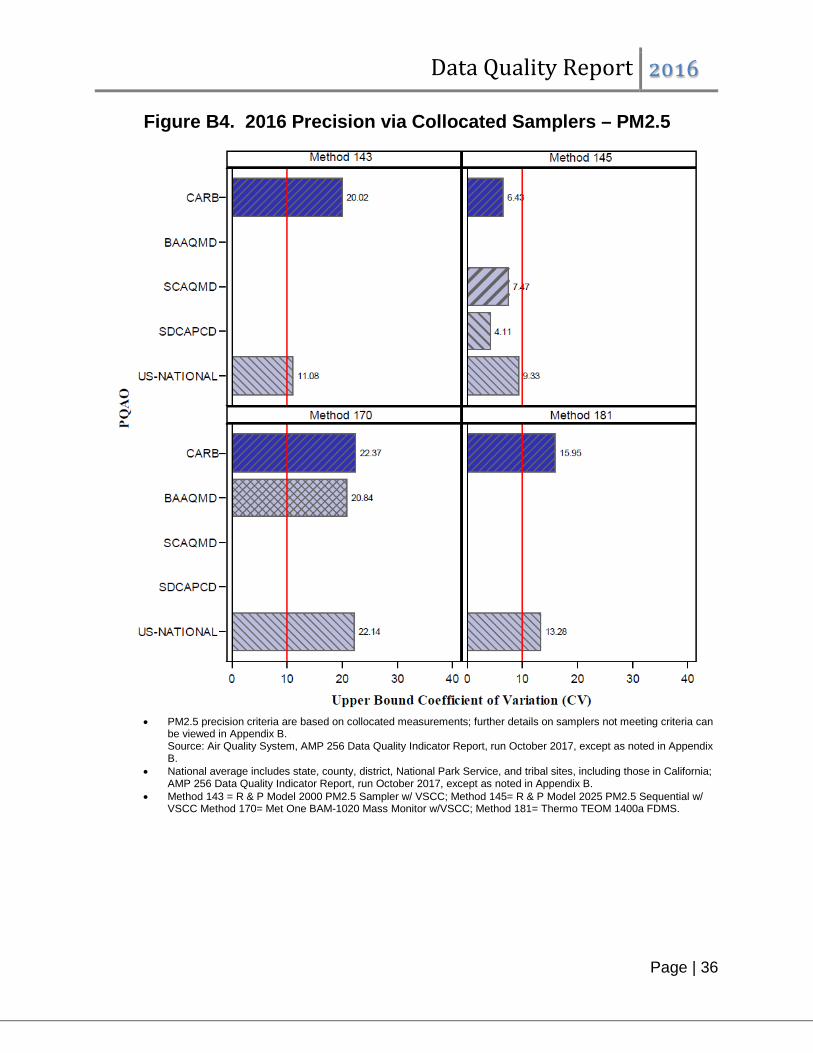
Figure B4. 2016 Precision via Collocated Samplers – PM2.5
• PM2.5 precision criteria are based on collocated measurements; further details on samplers not meeting criteria can
be viewed in Appendix B. Source: Air Quality System, AMP 256 Data Quality Indicator Report, run October 2017, except as noted in Appendix B.
• National average includes state, county, district, National Park Service, and tribal sites, including those in California; AMP 256 Data Quality Indicator Report, run October 2017, except as noted in Appendix B.
• Method 143 = R & P Model 2000 PM2.5 Sampler w/ VSCC; Method 145= R & P Model 2025 PM2.5 Sequential w/ VSCC Method 170= Met One BAM-1020 Mass Monitor w/VSCC; Method 181= Thermo TEOM 1400a FDMS.
Data Quality Report 2016
Page | 37
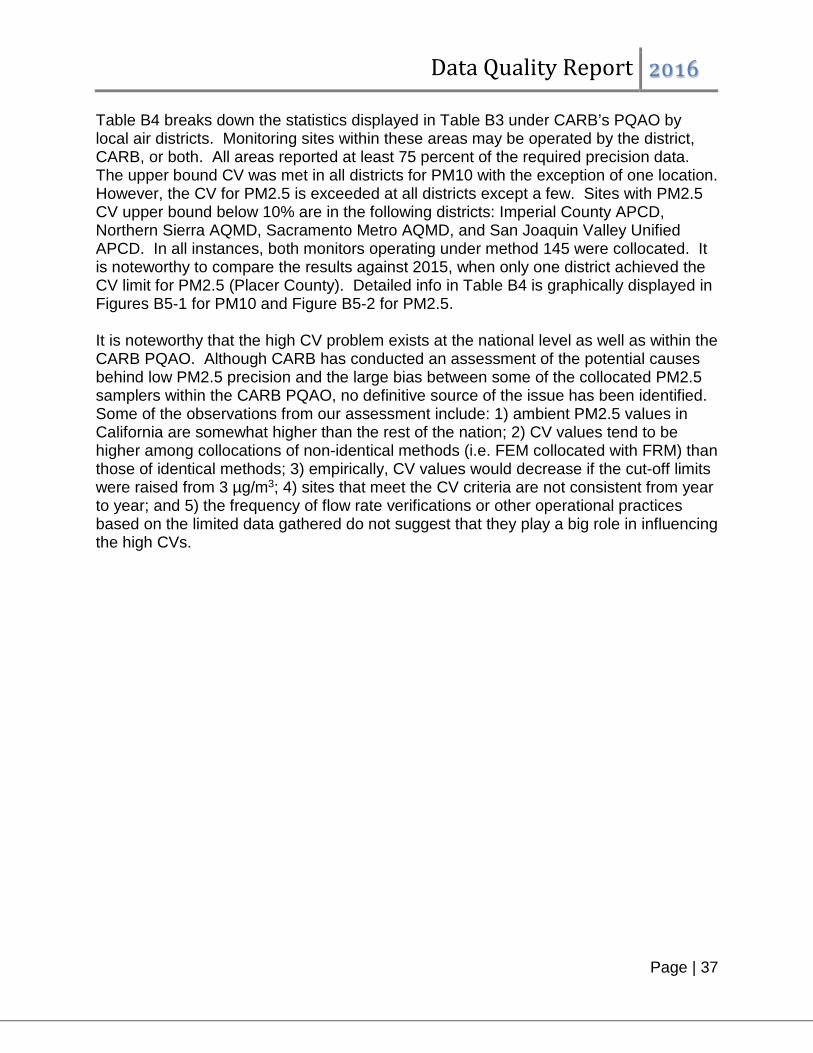
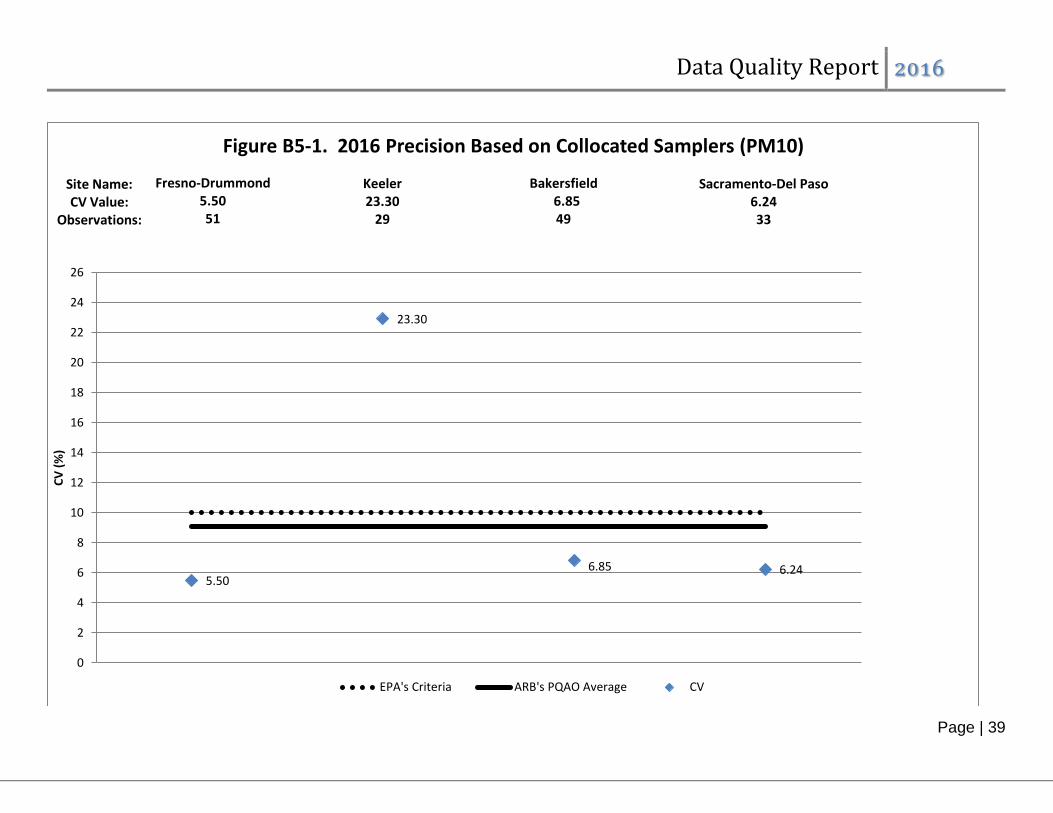
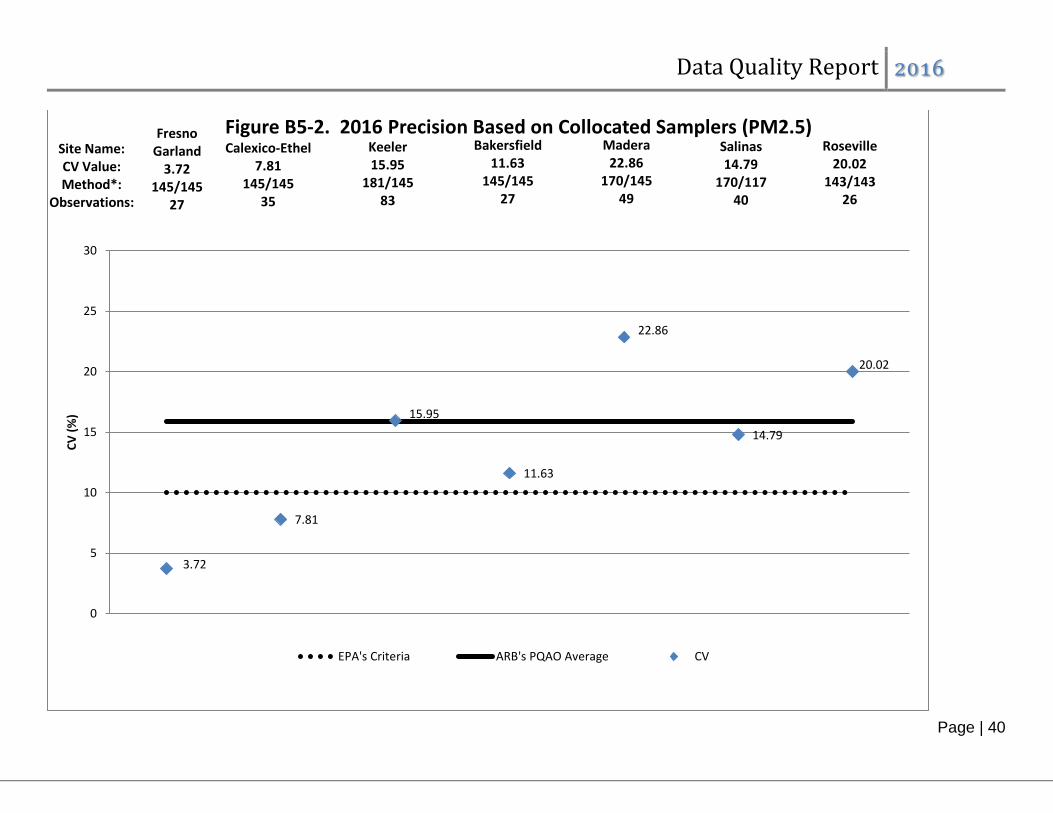
Table B4 breaks down the statistics displayed in Table B3 under CARB’s PQAO by local air districts. Monitoring sites within these areas may be operated by the district, CARB, or both. All areas reported at least 75 percent of the required precision data. The upper bound CV was met in all districts for PM10 with the exception of one location. However, the CV for PM2.5 is exceeded at all districts except a few. Sites with PM2.5 CV upper bound below 10% are in the following districts: Imperial County APCD, Northern Sierra AQMD, Sacramento Metro AQMD, and San Joaquin Valley Unified APCD. In all instances, both monitors operating under method 145 were collocated. It is noteworthy to compare the results against 2015, when only one district achieved the CV limit for PM2.5 (Placer County). Detailed info in Table B4 is graphically displayed in Figures B5-1 for PM10 and Figure B5-2 for PM2.5. It is noteworthy that the high CV problem exists at the national level as well as within the CARB PQAO. Although CARB has conducted an assessment of the potential causes behind low PM2.5 precision and the large bias between some of the collocated PM2.5 samplers within the CARB PQAO, no definitive source of the issue has been identified. Some of the observations from our assessment include: 1) ambient PM2.5 values in California are somewhat higher than the rest of the nation; 2) CV values tend to be higher among collocations of non-identical methods (i.e. FEM collocated with FRM) than those of identical methods; 3) empirically, CV values would decrease if the cut-off limits were raised from 3 µg/m3; 4) sites that meet the CV criteria are not consistent from year to year; and 5) the frequency of flow rate verifications or other operational practices based on the limited data gathered do not suggest that they play a big role in influencing the high CVs.

Data Quality Report 2016
Page | 38
Table B4. 2016 Precision Results for Districts within CARB’s PQAO
Pollutant Geographic Area
Method Code (Primary/
Secondary)
Monitoring by
(District=D, CARB=C)
% Precision Completeness
Upper Bound of
Coefficient of Variation
(CV) Great Basin
Unified APCD All D 93 23.30
Sacramento Metro AQMD All D 100 6.24
PM10 San Joaquin Valley APCD All D
C 100 100
5.50 6.85
Great Basin Unified APCD 181/145 D 100 15.95
Imperial County APCD 145/145 C 100 7.81
Mojave Desert AQMD 170/170 D 100 17.07
Monterey Bay Unified APCD 170/143 D 100 14.79
Northern Sierra AQMD 145/145 D 77 3.46
PM2.5 Placer County APCD 143/143 C 97 20.02
Sacramento Metro AQMD
145/145 170/170
D D
97 100
5.26 18.83
San Joaquin Valley APCD
145/145 145/145 170/145 170/170 170/143
C C D C C
97 90
100 100 100
3.72 11.63 22.86 22.77 14.18
Ventura County APCD 170/170 D 100 9.21
• CFR Limit for CV is 10% for PM. Further details on samplers not meeting these criteria can be viewed in Appendix B. • Bold italicized font indicates CV greater than 10% in 2016. • Source: Air Quality System, AMP 256 Data Quality Indicator Report (Collocation Detail Report), run October 2017.
Data Quality Report 2016
Page | 39
5.50
23.30
6.85 6.24
0
2
4
6
8
10
12
14
16
18
20
22
24
26
CV (%
)
Figure B5-1. 2016 Precision Based on Collocated Samplers (PM10)
EPA's Criteria ARB's PQAO Average CV
Fresno-Drummond5.5051
Site Name:CV Value:
Observations:
Bakersfield6.8549
Sacramento-Del Paso6.2433
Keeler23.30
29
Data Quality Report 2016
Page | 40
3.72
7.81
15.95
11.63
22.86
14.79
20.02
0
5
10
15
20
25
30
CV (%
)
Figure B5-2. 2016 Precision Based on Collocated Samplers (PM2.5)
EPA's Criteria ARB's PQAO Average CV
Site Name:CV Value:Method*:
Observations:
FresnoGarland
3.72145/145
27
Madera22.86
170/14549
Keeler15.95
181/14583
Salinas14.79
170/11740
Calexico-Ethel7.81
145/14535
Bakersfield11.63
145/14527
Roseville20.02
143/14326
Data Quality Report 2016
Page | 41
3.46 5.26
18.8317.07
22.77
14.18
9.21
0
5
10
15
20
25
30
35
40
CV (%
)
Figure B5-2 (cont'd). 2016 Precision Based on Collocated Samplers (PM2.5)
EPA's Criteria ARB's PQAO Average CV
Site Name:CV Value:Method*:
Observations:
Stockton22.77
170/170302
Simi-Valley9.21
170/170305
Folsom18.83
170/170231
Sac-Del Paso5.26
145/14526
Victorville17.07
117/117154
Modesto14.18
170/14329
Portola3.46
143/14322
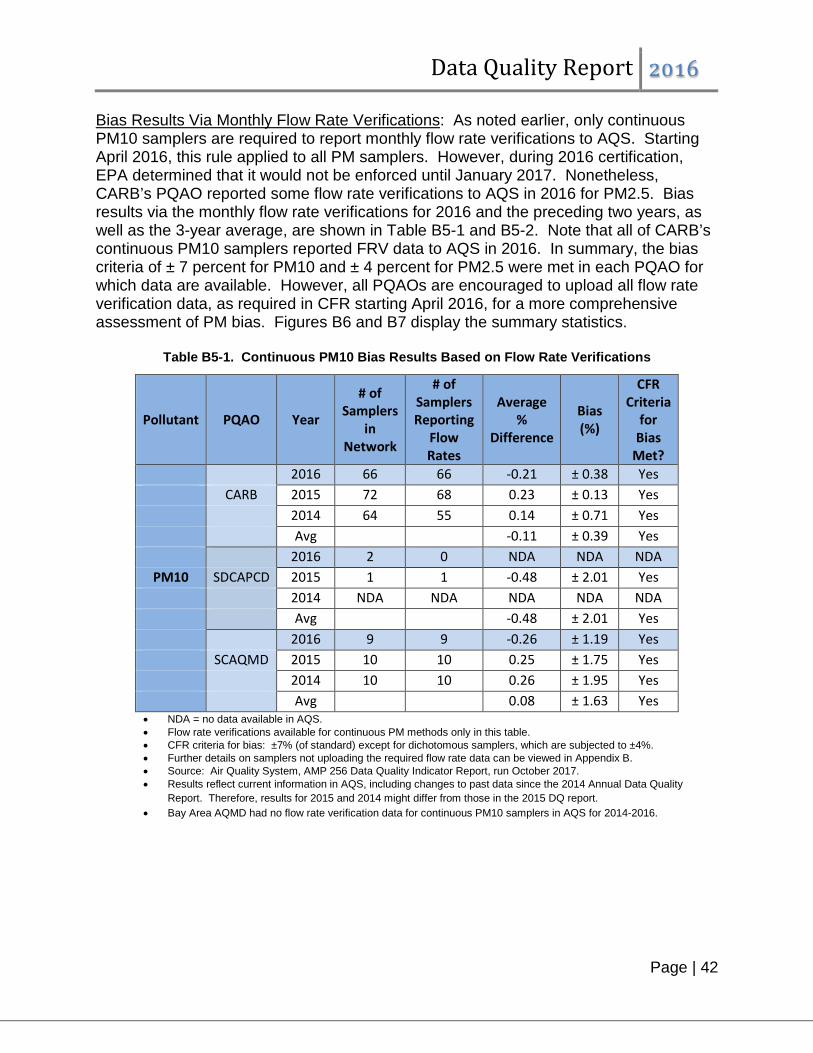
Data Quality Report 2016
Page | 42
Bias Results Via Monthly Flow Rate Verifications: As noted earlier, only continuous PM10 samplers are required to report monthly flow rate verifications to AQS. Starting April 2016, this rule applied to all PM samplers. However, during 2016 certification, EPA determined that it would not be enforced until January 2017. Nonetheless, CARB’s PQAO reported some flow rate verifications to AQS in 2016 for PM2.5. Bias results via the monthly flow rate verifications for 2016 and the preceding two years, as well as the 3-year average, are shown in Table B5-1 and B5-2. Note that all of CARB’s continuous PM10 samplers reported FRV data to AQS in 2016. In summary, the bias criteria of ± 7 percent for PM10 and ± 4 percent for PM2.5 were met in each PQAO for which data are available. However, all PQAOs are encouraged to upload all flow rate verification data, as required in CFR starting April 2016, for a more comprehensive assessment of PM bias. Figures B6 and B7 display the summary statistics.
Table B5-1. Continuous PM10 Bias Results Based on Flow Rate Verifications
Pollutant PQAO Year
# of Samplers
in Network
# of Samplers Reporting
Flow Rates
Average %
Difference
Bias (%)
CFR Criteria
for Bias
Met? 2016 66 66 -0.21 ± 0.38 Yes CARB 2015 72 68 0.23 ± 0.13 Yes 2014 64 55 0.14 ± 0.71 Yes Avg -0.11 ± 0.39 Yes 2016 2 0 NDA NDA NDA
PM10 SDCAPCD 2015 1 1 -0.48 ± 2.01 Yes 2014 NDA NDA NDA NDA NDA Avg -0.48 ± 2.01 Yes 2016 9 9 -0.26 ± 1.19 Yes SCAQMD 2015 10 10 0.25 ± 1.75 Yes 2014 10 10 0.26 ± 1.95 Yes Avg 0.08 ± 1.63 Yes
• NDA = no data available in AQS. • Flow rate verifications available for continuous PM methods only in this table. • CFR criteria for bias: ±7% (of standard) except for dichotomous samplers, which are subjected to ±4%. • Further details on samplers not uploading the required flow rate data can be viewed in Appendix B. • Source: Air Quality System, AMP 256 Data Quality Indicator Report, run October 2017. • Results reflect current information in AQS, including changes to past data since the 2014 Annual Data Quality
Report. Therefore, results for 2015 and 2014 might differ from those in the 2015 DQ report. • Bay Area AQMD had no flow rate verification data for continuous PM10 samplers in AQS for 2014-2016.
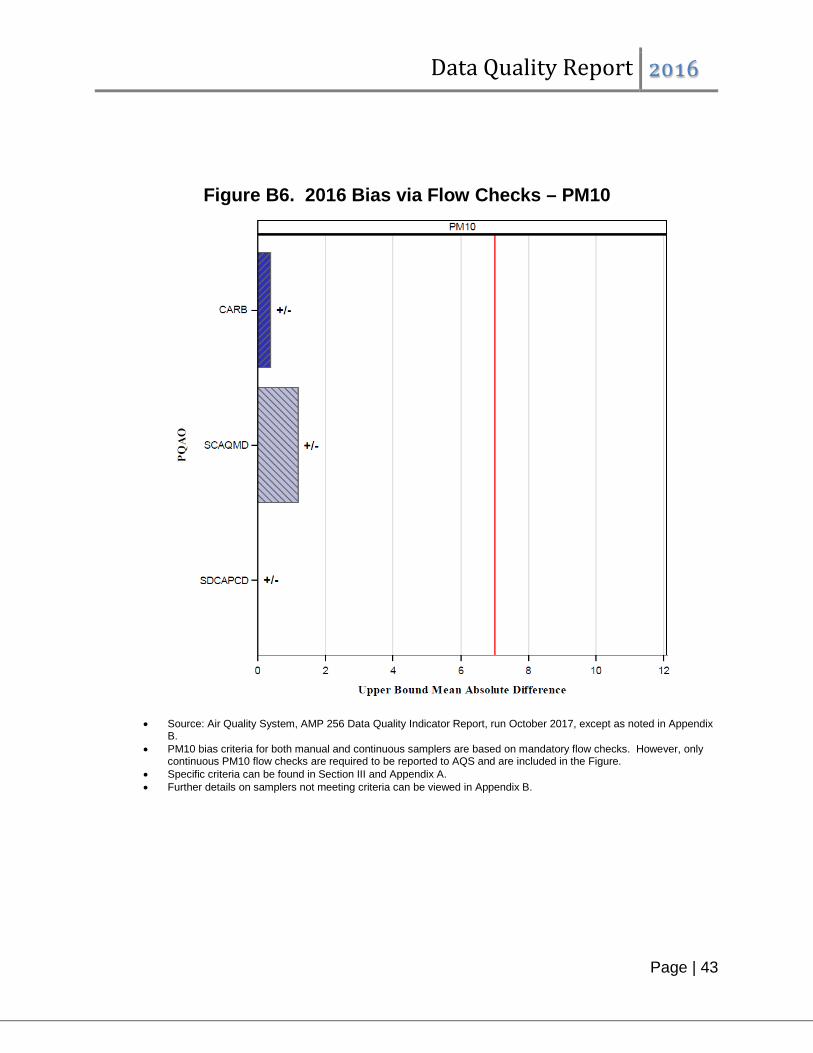
Data Quality Report 2016
Page | 43
Figure B6. 2016 Bias via Flow Checks – PM10
• Source: Air Quality System, AMP 256 Data Quality Indicator Report, run October 2017, except as noted in Appendix B.
• PM10 bias criteria for both manual and continuous samplers are based on mandatory flow checks. However, only continuous PM10 flow checks are required to be reported to AQS and are included in the Figure.
• Specific criteria can be found in Section III and Appendix A. • Further details on samplers not meeting criteria can be viewed in Appendix B.
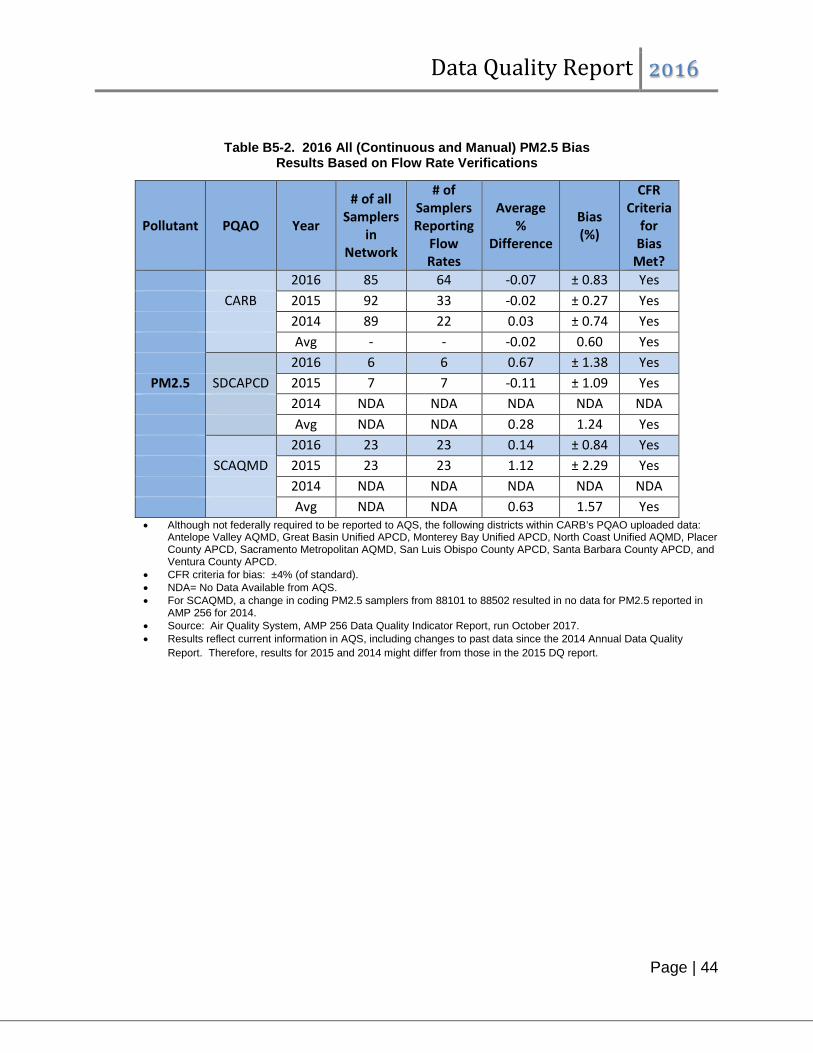
Data Quality Report 2016
Page | 44
Table B5-2. 2016 All (Continuous and Manual) PM2.5 Bias
Results Based on Flow Rate Verifications
Pollutant PQAO Year
# of all Samplers
in Network
# of Samplers Reporting
Flow Rates
Average %
Difference
Bias (%)
CFR Criteria
for Bias
Met? 2016 85 64 -0.07 ± 0.83 Yes CARB 2015 92 33 -0.02 ± 0.27 Yes 2014 89 22 0.03 ± 0.74 Yes Avg - - -0.02 0.60 Yes 2016 6 6 0.67 ± 1.38 Yes
PM2.5 SDCAPCD 2015 7 7 -0.11 ± 1.09 Yes 2014 NDA NDA NDA NDA NDA Avg NDA NDA 0.28 1.24 Yes 2016 23 23 0.14 ± 0.84 Yes SCAQMD 2015 23 23 1.12 ± 2.29 Yes 2014 NDA NDA NDA NDA NDA Avg NDA NDA 0.63 1.57 Yes
• Although not federally required to be reported to AQS, the following districts within CARB’s PQAO uploaded data: Antelope Valley AQMD, Great Basin Unified APCD, Monterey Bay Unified APCD, North Coast Unified AQMD, Placer County APCD, Sacramento Metropolitan AQMD, San Luis Obispo County APCD, Santa Barbara County APCD, and Ventura County APCD.
• CFR criteria for bias: ±4% (of standard). • NDA= No Data Available from AQS. • For SCAQMD, a change in coding PM2.5 samplers from 88101 to 88502 resulted in no data for PM2.5 reported in
AMP 256 for 2014. • Source: Air Quality System, AMP 256 Data Quality Indicator Report, run October 2017. • Results reflect current information in AQS, including changes to past data since the 2014 Annual Data Quality
Report. Therefore, results for 2015 and 2014 might differ from those in the 2015 DQ report.
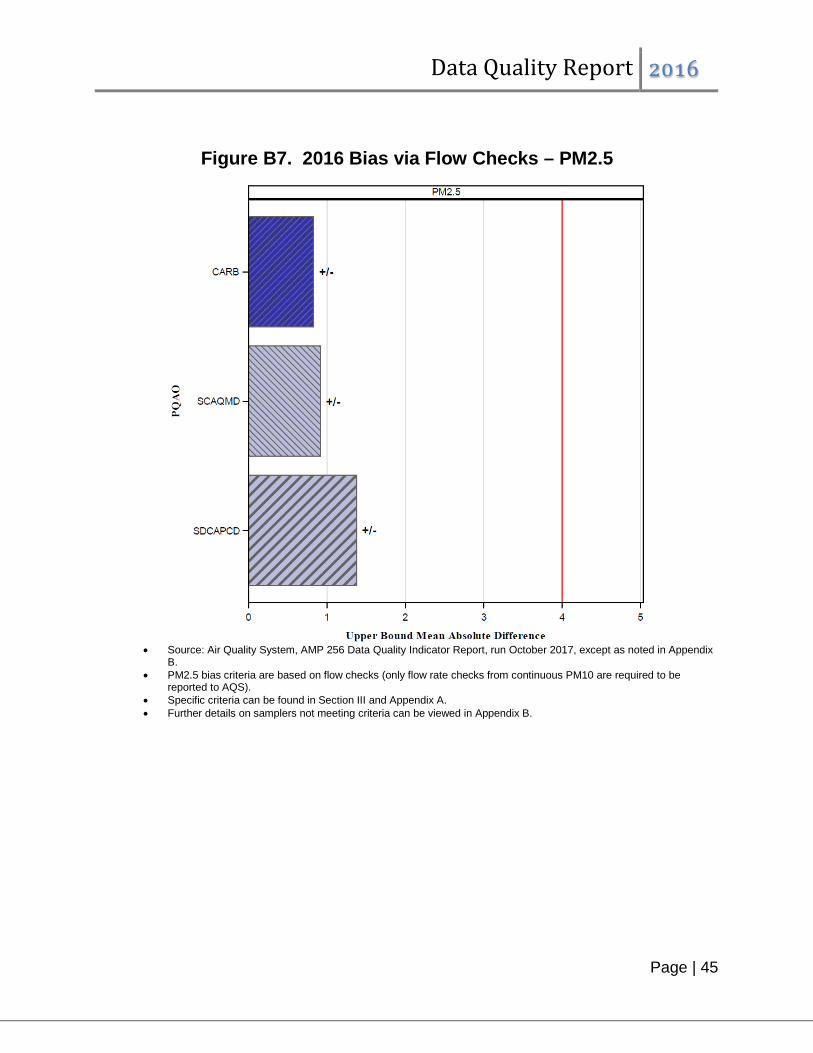
Data Quality Report 2016
Page | 45
Figure B7. 2016 Bias via Flow Checks – PM2.5
• Source: Air Quality System, AMP 256 Data Quality Indicator Report, run October 2017, except as noted in Appendix
B. • PM2.5 bias criteria are based on flow checks (only flow rate checks from continuous PM10 are required to be
reported to AQS). • Specific criteria can be found in Section III and Appendix A. • Further details on samplers not meeting criteria can be viewed in Appendix B.
Data Quality Report 2016
Page | 46
Accuracy Validation Via Performance Audits: Since an accurate measurement of PM is dependent upon the flow rate, CARB and other PQAOs are required to conduct semi-annual flow rate audits on all PM samplers at each site. Such audits are to be conducted five to seven months apart on each sampler in a given calendar year. In addition, as explained earlier, PQAOs are also required to submit the continuous PM10 monthly flow rate verifications to AQS; in this case, bias estimates based on flow rate verifications are further verified using the semi-annual flow rate audit data. Table B6 and Figures B8-B9 summarize the 2016 performance audit results for PM samplers. The numbers of samplers as well as those that met the required number of audits in 2016 are displayed. (Two audits are required if a sampler operates more than seven months; one audit if less than seven months but more than three months, zero if less than three months.) The average percent difference between the sampler flow rates and the audit flow rates represents the arithmetic mean of the combined differences from the certified value of all the individual audit points for each sampler. Table B7 presents similar data for local air districts within CARB’s PQAO. Note that in Figure B8, the percent of PM samplers is defined as the number of samplers meeting the required number of audits divided by the total number of samplers in each PQAO. CARB conducts the semi-annual flow rate audits for most samplers operating within CARB’s PQAO. In addition, certain local districts within CARB’s PQAO were allowed to conduct their own audits in 2016, per the agreed-upon “Roles and Responsibilities” documents19. For example, Great Basin Unified APCD conducts one of the semi-annual flow rate audits for the sites operating within its jurisdiction. CARB’s policy is to audit non-CARB PQAO monitoring sites at least once every five years. Non-CARB PQAOs are responsible for performing their own audits as part of the annual performance evaluation program. Overall, the results of the audited samplers indicate that the PM samplers in the network were operating within CARB’s and EPA’s flow rate audit criteria. For continuous PM10, flow rate audit results agree with bias estimates based on the flow rate verifications under CARB’s PQAO, further validating that the continuous PM10 samplers were operating accurately. PM2.5 samplers which reported flow rate verifications (as shown in Table B5-2) have similar results, indicating that the PM network operating under CARB’s PQAO generally exhibits a high level of accuracy.
19 https://arb.ca.gov/aaqm/qa/pqao/repository/rr_docs.htm
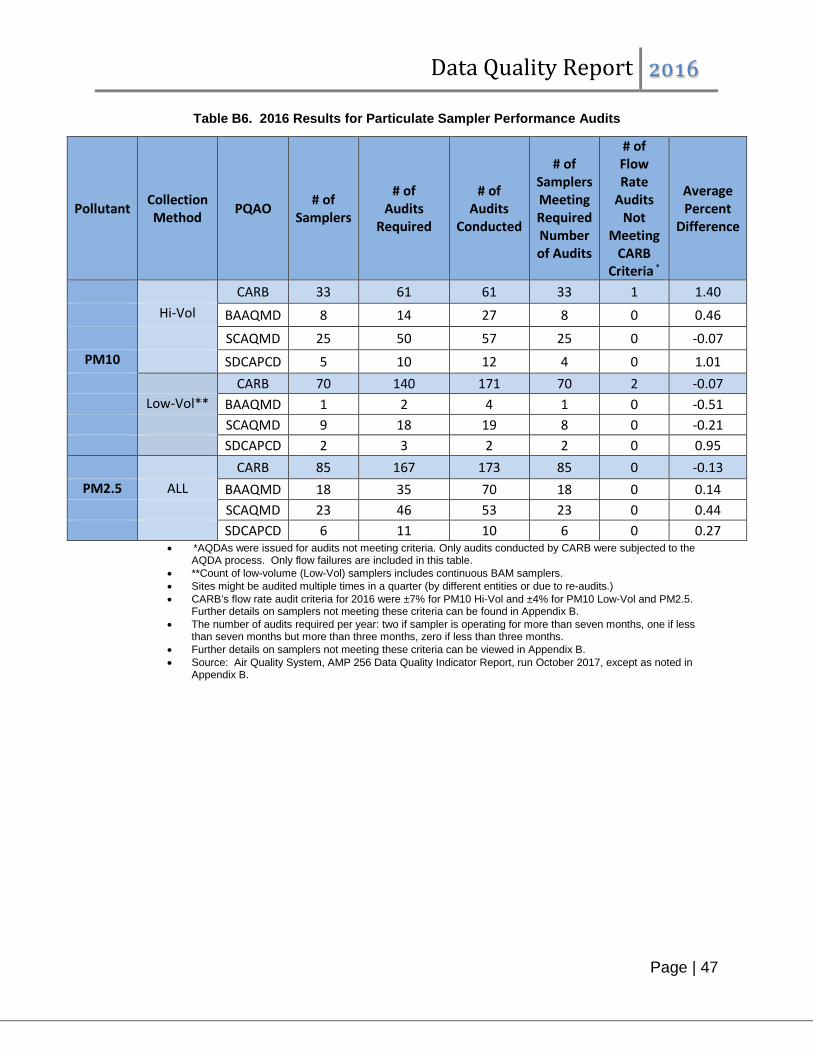
Data Quality Report 2016
Page | 47
Table B6. 2016 Results for Particulate Sampler Performance Audits
Pollutant Collection Method PQAO # of
Samplers
# of Audits
Required
# of Audits
Conducted
# of Samplers Meeting Required Number of Audits
# of Flow Rate
Audits Not
Meeting CARB
Criteria *
Average Percent
Difference
CARB 33 61 61 33 1 1.40 Hi-Vol BAAQMD 8 14 27 8 0 0.46 SCAQMD 25 50 57 25 0 -0.07
PM10 SDCAPCD 5 10 12 4 0 1.01 CARB 70 140 171 70 2 -0.07 Low-Vol** BAAQMD 1 2 4 1 0 -0.51 SCAQMD 9 18 19 8 0 -0.21 SDCAPCD 2 3 2 2 0 0.95 CARB 85 167 173 85 0 -0.13
PM2.5 ALL BAAQMD 18 35 70 18 0 0.14 SCAQMD 23 46 53 23 0 0.44 SDCAPCD 6 11 10 6 0 0.27
• *AQDAs were issued for audits not meeting criteria. Only audits conducted by CARB were subjected to the AQDA process. Only flow failures are included in this table.
• **Count of low-volume (Low-Vol) samplers includes continuous BAM samplers. • Sites might be audited multiple times in a quarter (by different entities or due to re-audits.) • CARB’s flow rate audit criteria for 2016 were ±7% for PM10 Hi-Vol and ±4% for PM10 Low-Vol and PM2.5.
Further details on samplers not meeting these criteria can be found in Appendix B. • The number of audits required per year: two if sampler is operating for more than seven months, one if less
than seven months but more than three months, zero if less than three months. • Further details on samplers not meeting these criteria can be viewed in Appendix B. • Source: Air Quality System, AMP 256 Data Quality Indicator Report, run October 2017, except as noted in
Appendix B.

Data Quality Report 2016
Page | 48
Figure B8. 2016 Accuracy via Audits – PM
• Source: Air Quality System, AMP 256 Data Quality Indicator Report, run October 2017. • CARB’s performance audit criteria for 2016: ±7% for PM10 Hi-Vol and ±4% for PM10 Low-Vol and PM2.5

Data Quality Report 2016
Page | 49
Figure B9. Percent of PM Samplers Meeting the Required Number of Performance Audits
(Total Samplers in Network Indicated on Bars)
• The number of audits required per year: two if sampler is operating for more than seven months, one if less than
seven months but more than three months, zero if less than three months. Further details on samplers not meeting criteria can be viewed in Appendix B.
• Source: AMP 256 Data Quality Indicator Report, run October 2017, except as noted in Appendix B.
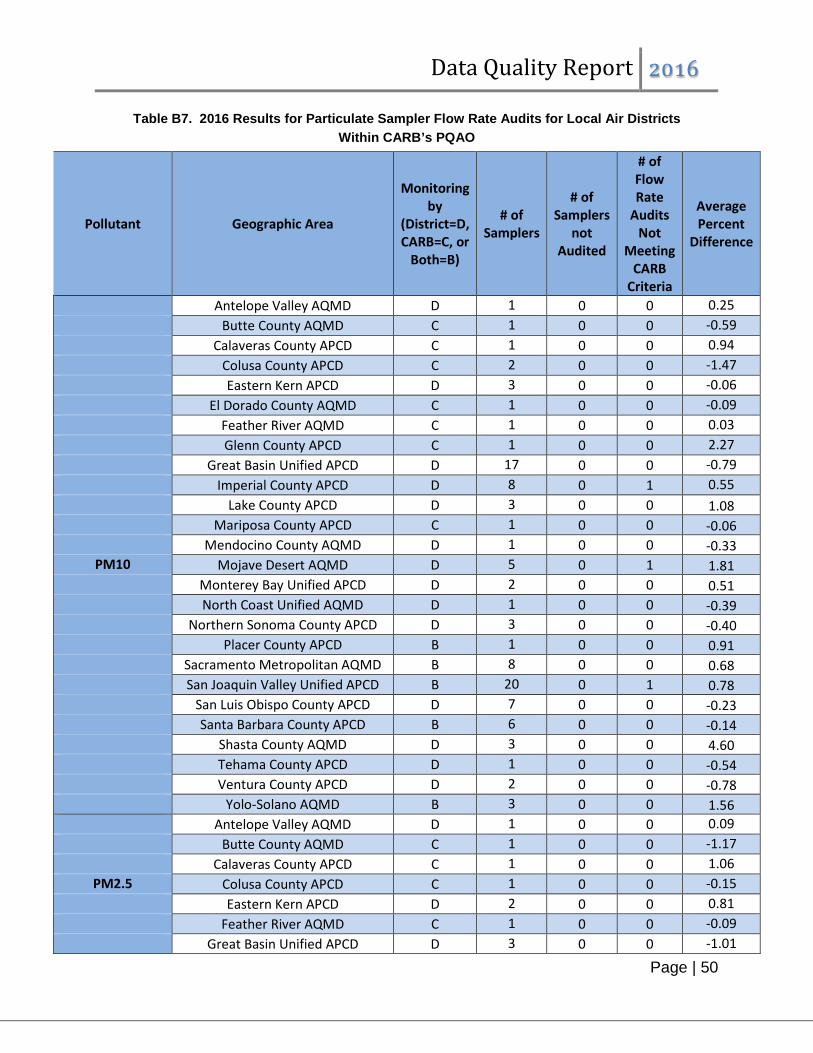
Data Quality Report 2016
Page | 50
Table B7. 2016 Results for Particulate Sampler Flow Rate Audits for Local Air Districts Within CARB’s PQAO
Pollutant Geographic Area
Monitoring by
(District=D, CARB=C, or
Both=B)
# of Samplers
# of Samplers
not Audited
# of Flow Rate
Audits Not
Meeting CARB
Criteria
Average Percent
Difference
Antelope Valley AQMD D 1 0 0 0.25 Butte County AQMD C 1 0 0 -0.59 Calaveras County APCD C 1 0 0 0.94 Colusa County APCD C 2 0 0 -1.47 Eastern Kern APCD D 3 0 0 -0.06 El Dorado County AQMD C 1 0 0 -0.09 Feather River AQMD C 1 0 0 0.03 Glenn County APCD C 1 0 0 2.27 Great Basin Unified APCD D 17 0 0 -0.79 Imperial County APCD D 8 0 1 0.55 Lake County APCD D 3 0 0 1.08 Mariposa County APCD C 1 0 0 -0.06
Mendocino County AQMD D 1 0 0 -0.33 PM10 Mojave Desert AQMD D 5 0 1 1.81
Monterey Bay Unified APCD D 2 0 0 0.51 North Coast Unified AQMD D 1 0 0 -0.39 Northern Sonoma County APCD D 3 0 0 -0.40 Placer County APCD B 1 0 0 0.91 Sacramento Metropolitan AQMD B 8 0 0 0.68 San Joaquin Valley Unified APCD B 20 0 1 0.78 San Luis Obispo County APCD D 7 0 0 -0.23 Santa Barbara County APCD B 6 0 0 -0.14 Shasta County AQMD D 3 0 0 4.60 Tehama County APCD D 1 0 0 -0.54 Ventura County APCD D 2 0 0 -0.78 Yolo-Solano AQMD B 3 0 0 1.56 Antelope Valley AQMD D 1 0 0 0.09 Butte County AQMD C 1 0 0 -1.17 Calaveras County APCD C 1 0 0 1.06
PM2.5 Colusa County APCD C 1 0 0 -0.15 Eastern Kern APCD D 2 0 0 0.81 Feather River AQMD C 1 0 0 -0.09 Great Basin Unified APCD D 3 0 0 -1.01

Data Quality Report 2016
Page | 51
Table B7 (cont’d). 2016 Results for Particulate Sampler Flow Rate Audits for Local Air Districts Within CARB’s PQAO
Pollutant Geographic Area
Monitoring by
(District=D, CARB=C, or
Both=B)
# of Samplers
# of Samplers
not Audited
# of Flow Rate
Audits Not
Meeting CARB
Criteria
Average Percent
Difference
Imperial County APCD D 4 0 0 0.24 Lake County APCD D 1 0 0 -0.85 Mendocino County AQMD D 2 0 0 -0.55 Mojave Desert AQMD D 2 0 0 0.31 Monterey Bay Unified APCD D 8 0 0 0.55 North Coast Unified AQMD D 2 0 0 -1.46 Northern Sierra AQMD D 5 0 0 -0.15 Placer County APCD B 3 0 0 0.51
PM2.5 Sacramento Metropolitan AQMD B 7 0 0 0.02 San Joaquin Valley Unified APCD B 24 0 0 -0.16 San Luis Obispo County APCD D 4 0 0 -0.27 Santa Barbara County APCD B 3 0 0 0.52 Shasta County AQMD D 1 0 0 0.85 Siskiyou County APCD D 1 0 0 -0.35 Tehama County APCD D 1 0 0 2.16 Ventura County APCD D 6 0 0 -0.50 Yolo-Solano AQMD B 1 0 0 -2.14
• CARB’s flow rate audit criteria for 2016 were ±7% for PM10 Hi-Vol and ±4% for PM10 Low-Vol and PM2.5. Only audits conducted by CARB were subjected to the AQDA process. Further details on samplers not meeting these criteria can be found in Appendix B. Only flow failures are included in this table.
• Source: Air Quality System, AMP 256 Data Quality Indicator Report, run October 2017, except as noted in Appendix B.

Data Quality Report 2016
Page | 52
IV. CONCLUSIONS AND RECOMMENDATIONS
This report provides ambient air quality data producers and users with a centralized review of the data quality within CARB’s PQAO with respect to MQOs. In addition, comparisons to other PQAOs in California and the national average are shown where appropriate. Below are some highlights for 2016.
Gaseous Pollutants (CO, O3, NO2, and SO2)
• Ninety-eight percent of the instruments operating under CARB’s PQAO achieved the ambient data capture rate of at least 75 percent in 2016. Most also met CARB’s goal of at least 85 percent data capture.
• Ninety-eight percent of the instruments operating within CARB’s PQAO reported at least 75 percent of the required one-point QC checks for the gaseous pollutants.
• All of the California PQAOs met the CFR criteria for precision and bias based on one-point QC checks.
• The performance audit acceptance criteria were met, on average, at the PQAO level for CARB’s PQAO (as well as other PQAOs) with only a small number of analyzers not passing performance audit criteria. This validates the bias estimates based on one-point QC checks, which showed that the gaseous network generally exhibits a high level of accuracy.
Particulate Matter (PM10 and PM2.5)
• Ninety-nine percent of the particulate samplers operating under CARB’s PQAO achieved the ambient data capture rate of at least 75 percent in 2016. Most also met CARB’s goal of at least 85 percent data capture.
• Although the Annual Network Plan for Small Districts indicates that CARB’s PQAO is short of meeting the required number of collocated sampling sites for PM10 and for one method of collecting PM2.5, planned changes to the network will bring CARB’s PQAO into achieving the 15% collocation requirement soon. This is an improvement compared to previous years, when more than one method did not meet the requirement.
• For the four PM10 and fourteen PM2.5 pairs of collocated samplers that were present within CARB’s PQAO, all reported at least 75 percent of the required precision data.
• Based on collocated PM data, CFR requirements for precision were met by CARB’s PQAO (as well as other California PQAOs) for PM10 except at one location. However, CARB’s PQAO did not meet the precision requirements at the PQAO level for all methods of collecting PM2.5 except one, as shown in Table IV-1. Although precision values are comparable to previous years, a general trend in precision limits decreasing is observed.
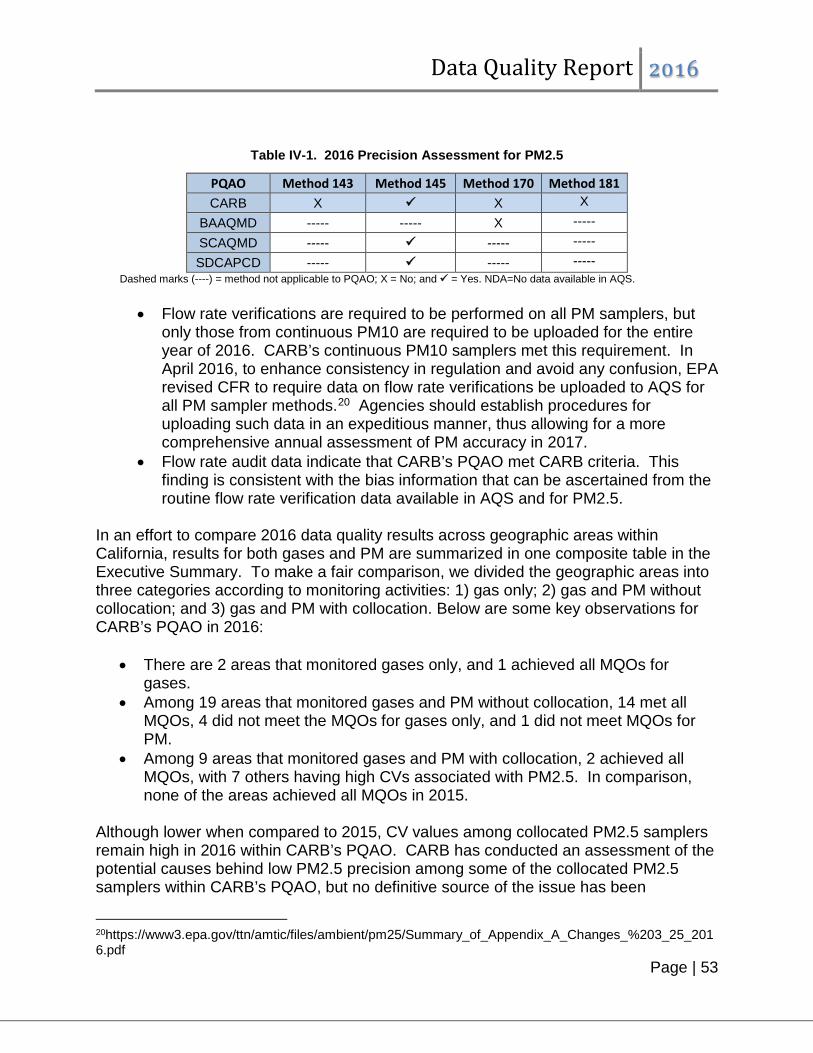
Data Quality Report 2016
Page | 53
Table IV-1. 2016 Precision Assessment for PM2.5
PQAO Method 143 Method 145 Method 170 Method 181 CARB X X X
BAAQMD ----- ----- X ----- SCAQMD ----- ----- ----- SDCAPCD ----- ----- -----
Dashed marks (----) = method not applicable to PQAO; X = No; and = Yes. NDA=No data available in AQS. • Flow rate verifications are required to be performed on all PM samplers, but
only those from continuous PM10 are required to be uploaded for the entire year of 2016. CARB’s continuous PM10 samplers met this requirement. In April 2016, to enhance consistency in regulation and avoid any confusion, EPA revised CFR to require data on flow rate verifications be uploaded to AQS for all PM sampler methods.20 Agencies should establish procedures for uploading such data in an expeditious manner, thus allowing for a more comprehensive annual assessment of PM accuracy in 2017.
• Flow rate audit data indicate that CARB’s PQAO met CARB criteria. This finding is consistent with the bias information that can be ascertained from the routine flow rate verification data available in AQS and for PM2.5.
In an effort to compare 2016 data quality results across geographic areas within California, results for both gases and PM are summarized in one composite table in the Executive Summary. To make a fair comparison, we divided the geographic areas into three categories according to monitoring activities: 1) gas only; 2) gas and PM without collocation; and 3) gas and PM with collocation. Below are some key observations for CARB’s PQAO in 2016:
• There are 2 areas that monitored gases only, and 1 achieved all MQOs for gases.
• Among 19 areas that monitored gases and PM without collocation, 14 met all MQOs, 4 did not meet the MQOs for gases only, and 1 did not meet MQOs for PM.
• Among 9 areas that monitored gases and PM with collocation, 2 achieved all MQOs, with 7 others having high CVs associated with PM2.5. In comparison, none of the areas achieved all MQOs in 2015.
Although lower when compared to 2015, CV values among collocated PM2.5 samplers remain high in 2016 within CARB’s PQAO. CARB has conducted an assessment of the potential causes behind low PM2.5 precision among some of the collocated PM2.5 samplers within CARB’s PQAO, but no definitive source of the issue has been
20https://www3.epa.gov/ttn/amtic/files/ambient/pm25/Summary_of_Appendix_A_Changes_%203_25_2016.pdf

Data Quality Report 2016
Page | 54
identified. Some of the observations from our assessment include: 1) ambient PM2.5 values in California are somewhat higher than the rest of the nation, 2) a few unusually large percent differences between the paired measurements can increase the CV result; 3) CV values tend to be higher among collocations of non-identical methods (i.e., FEM collocated with FRM) than those of identical methods; 4) empirically, due to the inherent nature of percent differences being magnified in the low concentration range, CV values would decrease if the cut-off limits were raised from 3 µg/m3; 5) sites that meet the CV criteria are not consistent from year to year. Monitoring agencies are encouraged to closely examine operational practices in order to help the PQAO achieve the precision criteria for PM. Although CFR criteria for precision and accuracy are generally applied and evaluated at the PQAO level, assessments at the district or site level may differ and can be important as well. Therefore, data producers are strongly encouraged to review the site-level information and assess whether their data quality objectives are met. It is important to note that when certain CFR criteria are not met, it does not necessarily mean that the corresponding air quality data should not be used, but rather, the data should be used with the knowledge of the quality behind it. The 2016 Ambient data in AQS for the CARB’s PQAO have been certified and are considered suitable for comparison to federal ambient air quality standards. The statistics presented in this report are intended as assessment tools for the data producers to identify areas where program improvements can be made to achieve all MQOs set by EPA or the data producers themselves. CARB has recently implemented a comprehensive corrective action system throughout CARB’s PQAO which is expected to serve as an essential component for improving data quality and facilitating continuous process improvement. Specifically, CARB developed the Corrective Action Notification (CAN) process that can be used to document issues that impact or potentially impact data quality, completeness, storage, or reporting. The goal of the CAN process is to investigate, correct, and reduce the recurrence of these issues. As such, the information obtained from this report can be coupled with the CAN process to identify issues (not already identified by AQDAs), improve data quality, and ensure compliance with State, federal, and local requirements. A complete listing of all references used in this report can be found in Appendix E.
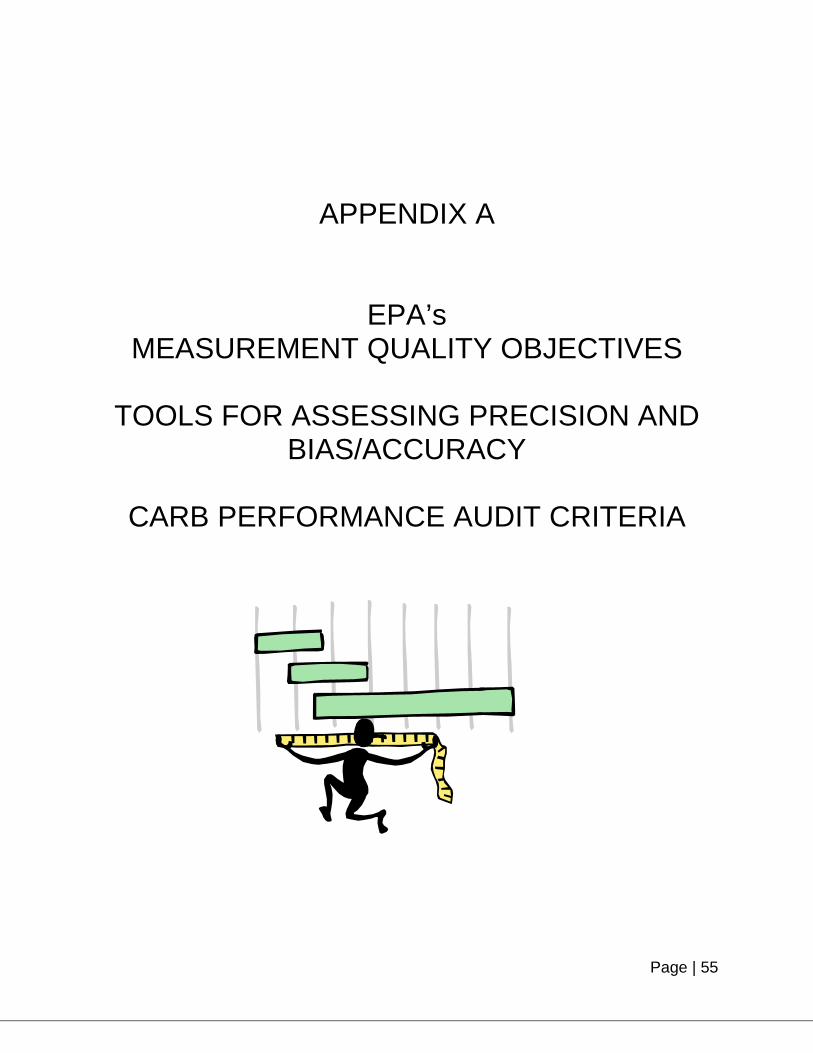
Page | 55
APPENDIX A
EPA’s MEASUREMENT QUALITY OBJECTIVES
TOOLS FOR ASSESSING PRECISION AND
BIAS/ACCURACY
CARB PERFORMANCE AUDIT CRITERIA
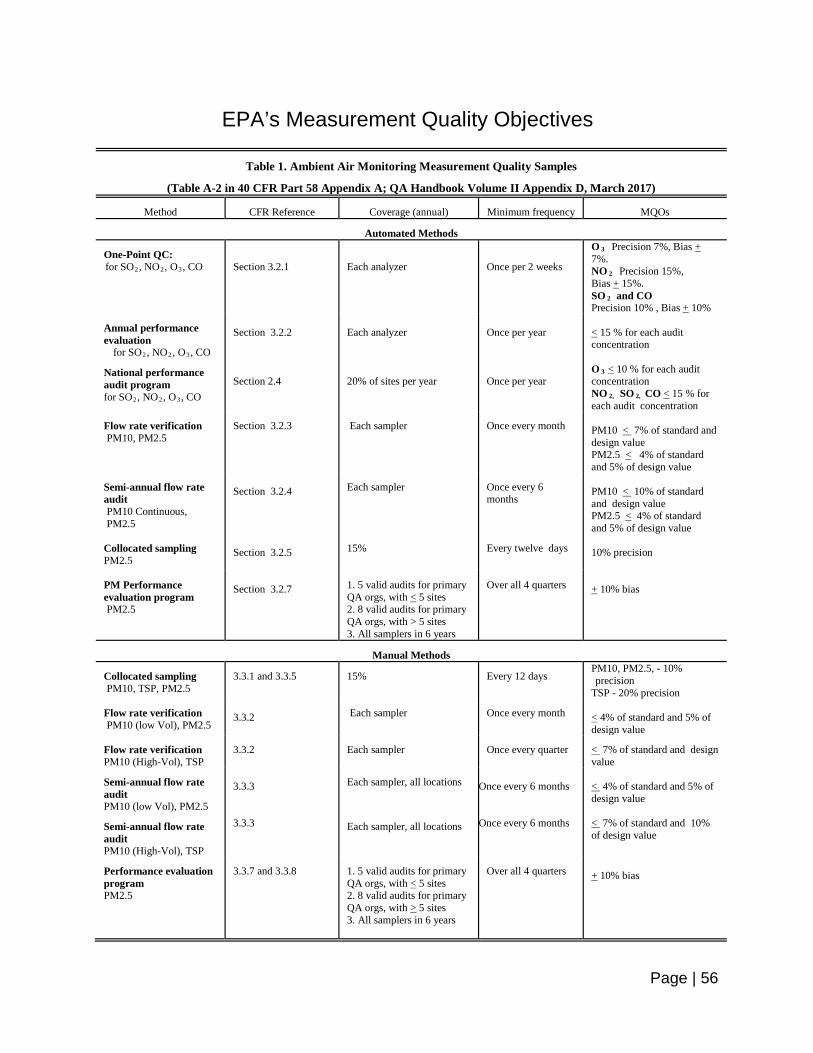
Page | 56
Table 1. Ambient Air Monitoring Measurement Quality Samples
(Table A-2 in 40 CFR Part 58 Appendix A; QA Handbook Volume II Appendix D, March 2017)
Method CFR Reference Coverage (annual) Minimum frequency MQOs
Automated Methods
One-Point QC: for SO2, NO2, O3, CO
Section 3.2.1
Each analyzer
Once per 2 weeks
O 3 Precision 7%, Bias + 7%. NO 2 Precision 15%, Bias + 15%. SO 2 and CO Precision 10% , Bias + 10%
Annual performance evaluation
for SO2, NO2, O3, CO
National performance audit program for SO2, NO2, O3, CO
Section 3.2.2 Section 2.4
Each analyzer 20% of sites per year
Once per year Once per year
< 15 % for each audit concentration O 3 < 10 % for each audit concentration NO 2, SO 2, CO < 15 % for each audit concentration
Flow rate verification PM10, PM2.5
Section 3.2.3 Each sampler Once every month
PM10 < 7% of standard and design value PM2.5 < 4% of standard and 5% of design value
Semi-annual flow rate audit PM10 Continuous, PM2.5
Section 3.2.4 Each sampler Once every 6
months
PM10 < 10% of standard and design value PM2.5 < 4% of standard and 5% of design value
Collocated sampling PM2.5
Section 3.2.5 15% Every twelve days
10% precision
PM Performance evaluation program PM2.5
Section 3.2.7 1. 5 valid audits for primary
QA orgs, with < 5 sites 2. 8 valid audits for primary QA orgs, with > 5 sites 3. All samplers in 6 years
Over all 4 quarters
+ 10% bias
Manual Methods
Collocated sampling PM10, TSP, PM2.5
3.3.1 and 3.3.5 15% Every 12 days
PM10, PM2.5, - 10% precision
TSP - 20% precision
Flow rate verification PM10 (low Vol), PM2.5
3.3.2 Each sampler Once every month
< 4% of standard and 5% of design value
Flow rate verification PM10 (High-Vol), TSP
3.3.2 Each sampler Once every quarter < 7% of standard and design value
Semi-annual flow rate audit PM10 (low Vol), PM2.5
Semi-annual flow rate audit PM10 (High-Vol), TSP
3.3.3 3.3.3
Each sampler, all locations
Each sampler, all locations
Once every 6 months Once every 6 months
< 4% of standard and 5% of design value < 7% of standard and 10% of design value
Performance evaluation program PM2.5
3.3.7 and 3.3.8 1. 5 valid audits for primary QA orgs, with < 5 sites 2. 8 valid audits for primary QA orgs, with > 5 sites 3. All samplers in 6 years
Over all 4 quarters + 10% bias
EPA’s Measurement Quality Objectives
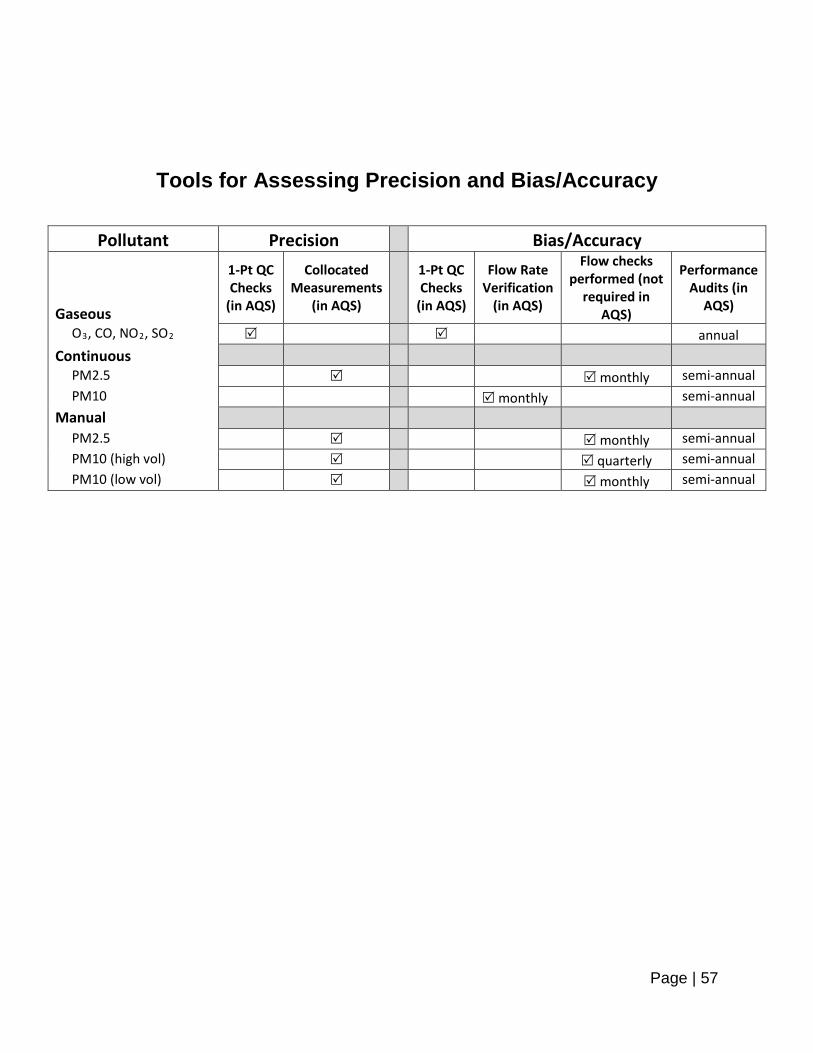
Page | 57
Tools for Assessing Precision and Bias/Accuracy
Pollutant Precision Bias/Accuracy
Gaseous
1-Pt QC Checks
(in AQS)
Collocated Measurements
(in AQS)
1-Pt QC Checks
(in AQS)
Flow Rate Verification
(in AQS)
Flow checks performed (not
required in AQS)
Performance Audits (in
AQS)
O3, CO, NO2, SO2 annual Continuous PM2.5 monthly semi-annual PM10 monthly semi-annual Manual PM2.5 monthly semi-annual PM10 (high vol) quarterly semi-annual PM10 (low vol) monthly semi-annual
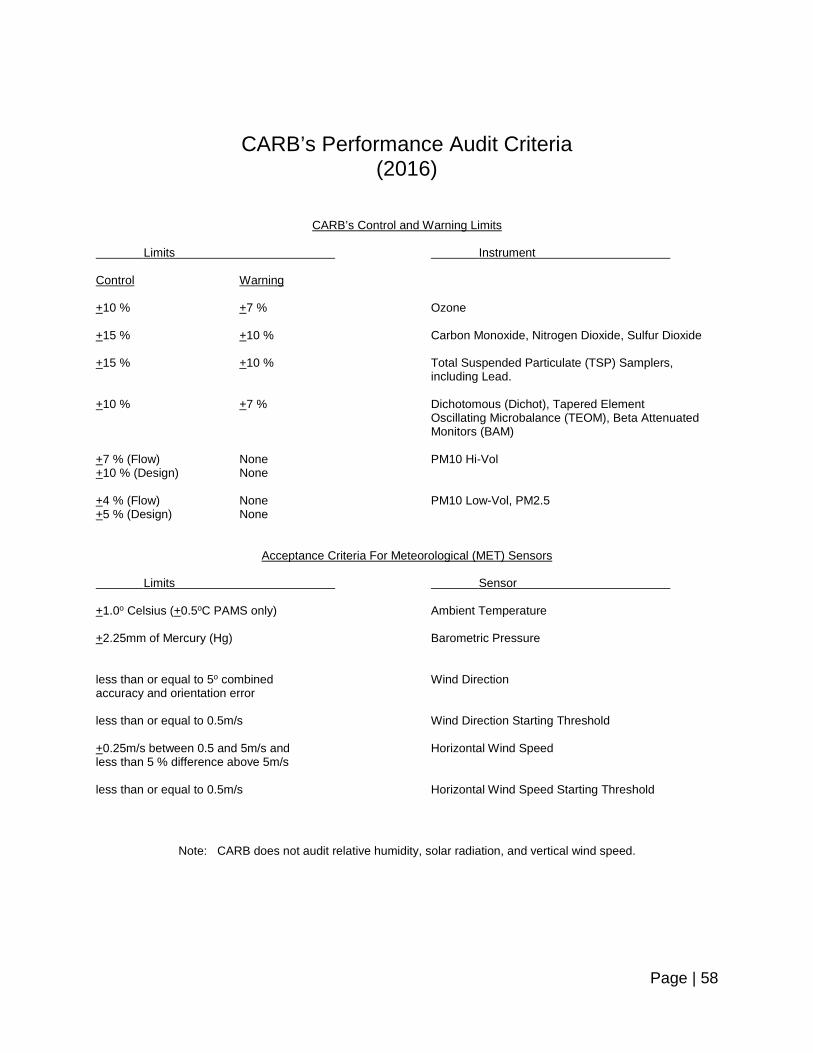
Page | 58
CARB’s Performance Audit Criteria
(2016)
CARB’s Control and Warning Limits
Limits Instrument
Control Warning +10 % +7 % Ozone +15 % +10 % Carbon Monoxide, Nitrogen Dioxide, Sulfur Dioxide +15 % +10 % Total Suspended Particulate (TSP) Samplers,
including Lead.
+10 % +7 % Dichotomous (Dichot), Tapered Element Oscillating Microbalance (TEOM), Beta Attenuated Monitors (BAM) +7 % (Flow) None PM10 Hi-Vol +10 % (Design) None +4 % (Flow) None PM10 Low-Vol, PM2.5 +5 % (Design) None
Acceptance Criteria For Meteorological (MET) Sensors Limits Sensor +1.0o Celsius (+0.5oC PAMS only) Ambient Temperature +2.25mm of Mercury (Hg) Barometric Pressure less than or equal to 5o combined Wind Direction accuracy and orientation error less than or equal to 0.5m/s Wind Direction Starting Threshold +0.25m/s between 0.5 and 5m/s and Horizontal Wind Speed less than 5 % difference above 5m/s less than or equal to 0.5m/s Horizontal Wind Speed Starting Threshold
Note: CARB does not audit relative humidity, solar radiation, and vertical wind speed.
Page | 59
APPENDIX B
CARB’s PQAO DATA QUALITY ISSUES
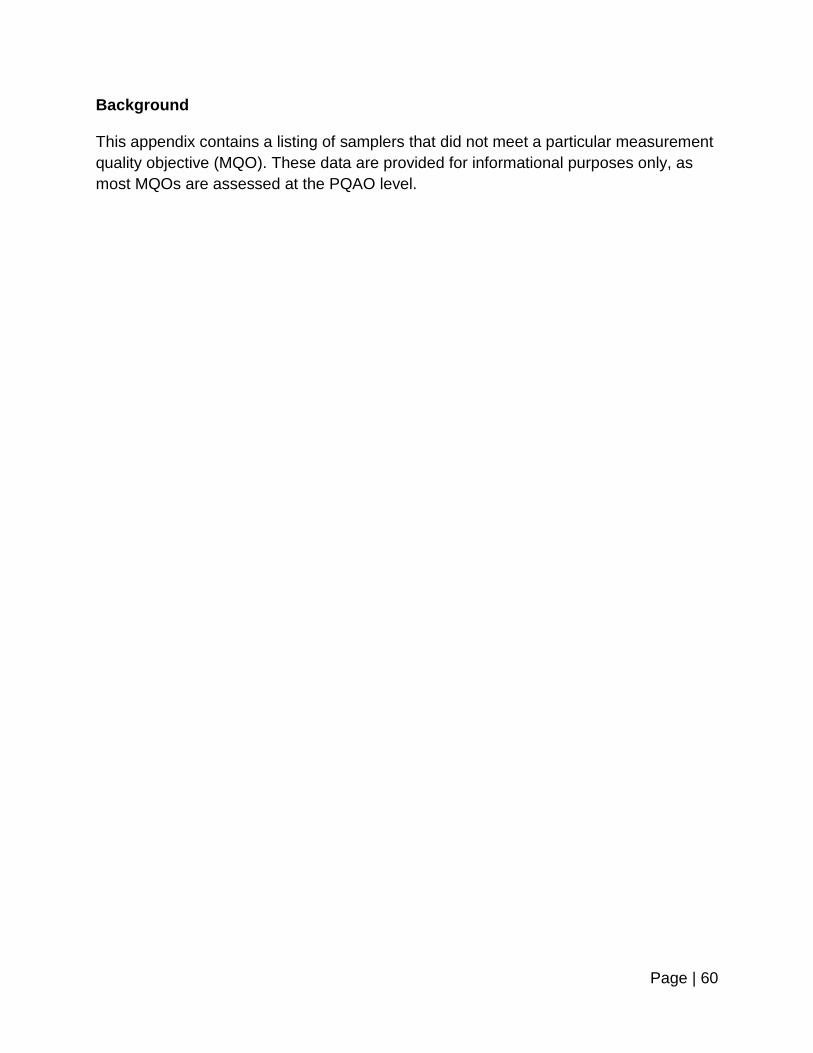
Page | 60
Background This appendix contains a listing of samplers that did not meet a particular measurement quality objective (MQO). These data are provided for informational purposes only, as most MQOs are assessed at the PQAO level.
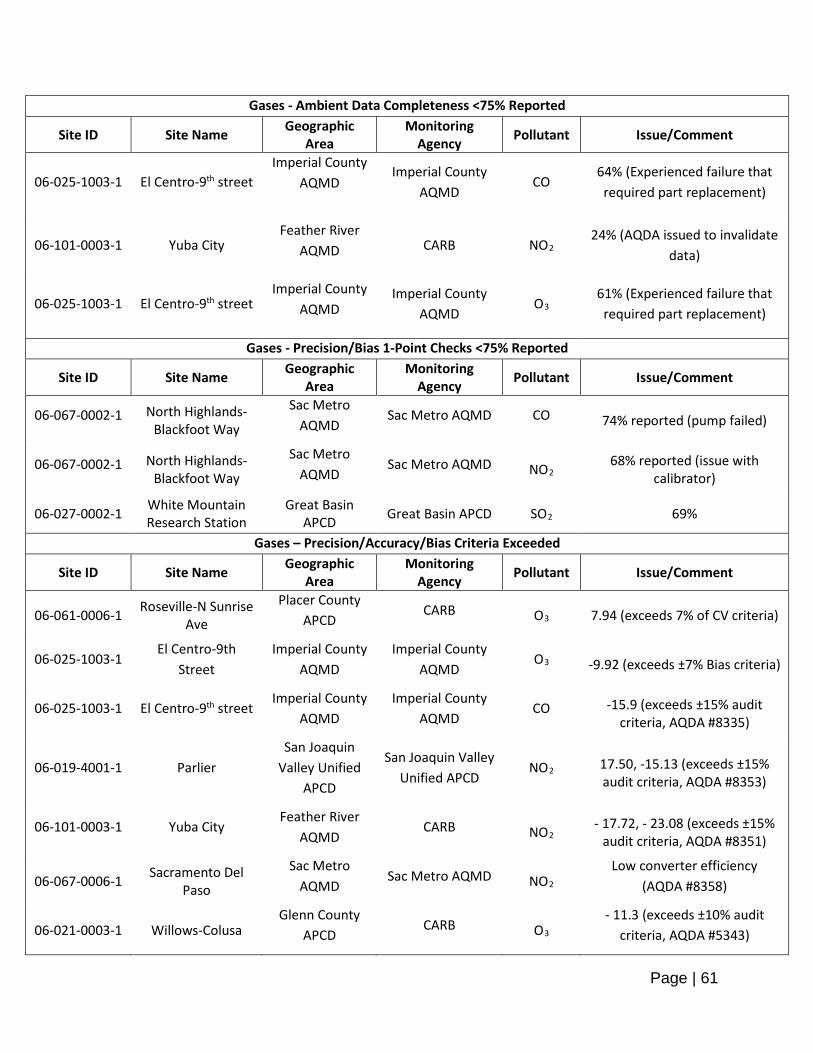
Page | 61
Gases - Ambient Data Completeness <75% Reported
Site ID Site Name Geographic Area
Monitoring Agency Pollutant Issue/Comment
06-025-1003-1 El Centro-9th street Imperial County
AQMD Imperial County
AQMD CO 64% (Experienced failure that required part replacement)
06-101-0003-1 Yuba City Feather River
AQMD CARB NO2 24% (AQDA issued to invalidate
data)
06-025-1003-1 El Centro-9th street Imperial County
AQMD Imperial County
AQMD O3 61% (Experienced failure that required part replacement)
Gases - Precision/Bias 1-Point Checks <75% Reported
Site ID Site Name Geographic Area
Monitoring Agency Pollutant Issue/Comment
06-067-0002-1 North Highlands-Blackfoot Way
Sac Metro AQMD
Sac Metro AQMD CO 74% reported (pump failed)
06-067-0002-1 North Highlands-Blackfoot Way
Sac Metro AQMD
Sac Metro AQMD NO2 68% reported (issue with
calibrator)
06-027-0002-1 White Mountain Research Station
Great Basin APCD Great Basin APCD SO2 69%
Gases – Precision/Accuracy/Bias Criteria Exceeded
Site ID Site Name Geographic Area
Monitoring Agency Pollutant Issue/Comment
06-061-0006-1 Roseville-N Sunrise Ave
Placer County APCD
CARB O3 7.94 (exceeds 7% of CV criteria)
06-025-1003-1 El Centro-9th
Street Imperial County
AQMD Imperial County
AQMD O3 -9.92 (exceeds ±7% Bias criteria)
06-025-1003-1 El Centro-9th street Imperial County
AQMD Imperial County
AQMD CO -15.9 (exceeds ±15% audit criteria, AQDA #8335)
06-019-4001-1 Parlier San Joaquin
Valley Unified APCD
San Joaquin Valley Unified APCD
NO2 17.50, -15.13 (exceeds ±15% audit criteria, AQDA #8353)
06-101-0003-1 Yuba City Feather River
AQMD CARB NO2
- 17.72, - 23.08 (exceeds ±15% audit criteria, AQDA #8351)
06-067-0006-1 Sacramento Del Paso
Sac Metro AQMD
Sac Metro AQMD NO2 Low converter efficiency
(AQDA #8358)
06-021-0003-1 Willows-Colusa Glenn County
APCD CARB O3
- 11.3 (exceeds ±10% audit criteria, AQDA #5343)

Page | 62
Gases – Precision/Accuracy/Bias Criteria Exceeded
Site ID Site Name Geographic
Area Monitoring
Agency Pollutant Issue/Comment
06-043-0006-1 Jerseydale Mariposa
County APCD CARB O3 As-is failture (AQDA #8357)
06-103-0007-1 Red Bluff-Walnut Street
Tehama County APCD
Tehama County APCD O3
12.3 (exceeds ±10% audit criteria, AQDA #8350)
06-109-0005-1 Sonora-Barretta Street
Tuolumne County APCD
CARB O3 10.7, 11.2 (exceeds ±10% audit
criteria, AQDA #8337)
PM - Ambient Data Completeness <75% reported
Site ID Site Name Geographic Area
Monitoring Agency Pollutant Issue/Comment
06-083-4003-3 Vandenberg Air Force Base-STS
Santa Barbara APCD
Santa Barbara APCD
PM10 73% reported (power outage)
06-071-0306-2 Victorville - Park
Avenue Mojave Desert
AQMD Mojave Desert
AQMD PM2.5
64% reported (no data collected during switch to new method)
PM Precision Criteria (CV limit of 10%) Not Met
Site ID Site Name Geographic Area
Monitoring Agency Pollutant Issue/Comment
06-027-1003-6 Keeler-Cerro Gordo
Road Great Basin
Unified APCD Great Basin
Unified APCD PM10 CV = 22.90
06-027-1003-3 Keeler-Cerro Gordo
Road Great Basin
Unified APCD Great Basin
Unified APCD PM2.5 CV = 15.95
06-029-0014-1 Bakersfield-5558 California Avenue
San Joaquin Valley Unified
APCD CARB PM2.5 CV = 11.63
06-039-2010-3 Madera-28261
Avenue 14
San Joaquin Valley Unified
APCD
San Joaquin Valley Unified APCD
PM2.5 CV = 22.86
06-053-1003-3 Salinas-#3 Monterey Bay Unified APCD
Monterey Bay Unified APCD
PM2.5 CV = 14.79
06-061-0006-1 Roseville-N Sunrise Placer County
APCD CARB PM2.5 CV = 20.02
06-067-0012-3 Folsom-Natoma
Street Sac Metro
AQMD Sac Metro AQMD PM2.5 CV = 18.83

Page | 63
PM Precision Criteria (CV limit of 10%) Not Met
Site ID Site Name Geographic
Area Monitoring
Agency Pollutant Issue/Comment
06-071-0306-1 Victorville-14306
Park Avenue Mojave Desert
AQMD Mojave Desert
AQMD PM2.5 CV = 17.07
06-077-1002-3 Stockton-Hazelton
Street
San Joaquin Valley Unified
APCD CARB PM2.5 CV = 22.77
06-099-0005-3 Modesto-14th
Street
San Joaquin Valley Unified
APCD CARB PM2.5 CV = 14.18
PM – Audit Criteria or Critical Criteria Exceeded
Site ID Site Name Geographic
Area Monitoring
Agency Pollutant Issue/Comment
06-025-0007-1 Brawley-Main Street
Imperial County AQMD
Imperial County AQMD PM10 Flow failure (AQDA #8336)
06-029-0014-1 Bakersfield-California Ave
San Joaquin Valley APCD CARB PM10 Flow failure (AQDA #8339)
06-071-0001-1 Barstow Mojave Desert AQMD
Mojave Desert AQMD PM10 Flow failure (AQDA #8338)
06-051-0001-5 Mammoth Lakes Great Basin Unified APCD
Great Basin Unified APCD PM10 Missing flow checks
(AQDA #8354)
06-051-0005-3 Lee Vining Great Basin Unified APCD
Great Basin Unified APCD
PM10 Missing flow checks (AQDA #8355)
06-097-0002-2 Healdsburg-Matheson
Northern Sonoma County
APCD
Northern Sonoma County APCD
PM10 Missing flow checks (AQDA #8346)
06-097-3002-1 Guerneville-Church and 1st
Northern Sonoma County
APCD
Northern Sonoma County APCD
PM10 Missing flow checks (AQDA #8345)
06-099-0006-3 Turlock- S Minaret Street
San Joaquin Valley Unified
APCD
San Joaquin Valley Unified APCD PM2.5 Missing flow checks
(AQDA #8342)
06-02-0014-3 Bakersfield-California Ave
San Joaquin Valley Unified
APCD CARB PM2.5 Missing flow checks
(AQDA #8352)
PM – Flow Rate Verification
Site ID Site Name Geographic Area
Monitoring Agency Pollutant Issue/Comment
06-071-0013-2 Lucerne Valley Mojave Desert AQMD
Mojave Desert AQMD PM10 Not operating for the year
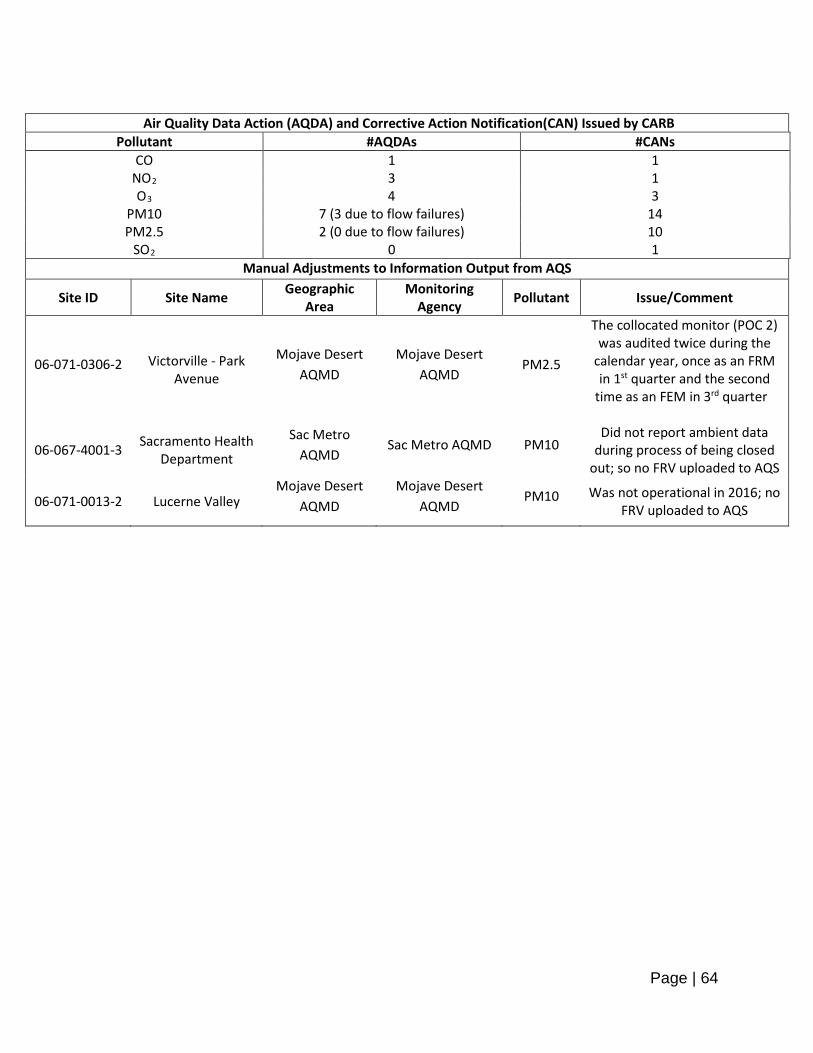
Page | 64
Air Quality Data Action (AQDA) and Corrective Action Notification(CAN) Issued by CARB
Pollutant #AQDAs #CANs CO 1 1
NO2 3 1 O3 4 3
PM10 7 (3 due to flow failures) 14 PM2.5 2 (0 due to flow failures) 10
SO2 0 1 Manual Adjustments to Information Output from AQS
Site ID Site Name Geographic Area
Monitoring Agency Pollutant Issue/Comment
06-071-0306-2
Victorville - Park
Avenue
Mojave Desert AQMD
Mojave Desert AQMD
PM2.5
The collocated monitor (POC 2) was audited twice during the
calendar year, once as an FRM in 1st quarter and the second
time as an FEM in 3rd quarter
06-067-4001-3 Sacramento Health Department
Sac Metro AQMD
Sac Metro AQMD PM10 Did not report ambient data
during process of being closed out; so no FRV uploaded to AQS
06-071-0013-2 Lucerne Valley Mojave Desert
AQMD Mojave Desert
AQMD PM10 Was not operational in 2016; no
FRV uploaded to AQS
Page | 65
APPENDIX C
METEOROLOGICAL SENSOR PERFORMANCE AUDITS CONDUCTED BY CARB

Page | 66
Meteorology
CARB and local air districts monitor meteorological parameters such as wind speed, wind direction, ambient temperature, relative humidity, barometric pressure, and total solar radiation. Real-time meteorological data are generated to characterize meteorological processes such as transport and diffusion, and to make air quality forecasts and burn-day decisions. The data are also used for control strategy modeling and urban airshed modeling. A State/local meteorology subcommittee of the Air Monitoring Technical Advisory Committee agreed to define the level of acceptability for meteorological data as those used by EPA for both the Prevention of Significant Deterioration and Photochemical Assessment Monitoring Stations programs. QMB evaluates meteorological parameters according to those levels.
The wind speed, wind direction, barometric pressure, and outside temperature data sets are subject to meeting CARB’s performance criteria, which can be found in Appendix A of this report. Relative humidity sensors are not audited by CARB. Since the inception of the meteorological audit program, the data quality has improved significantly. Accuracy: The accuracy of meteorological sensors is checked by annual performance audits. The table below summarizes the 2016 audit results. They represent the data collected by CARB. As meteorological sensors are not required in CFR to be audited by other PQAOs, and CARB only audits non-PQAO sites at least once every five years, the number of audits under CARB PQAO appears large compared to a few audits under other PQAOs. The average percent or degree difference represents the arithmetic mean of the combined differences from the certified value of all the individual audit points for each sensor. The minimum and maximum are included to convey the range in the percent differences. Information about the meteorological monitoring program is available at http://www.arb.ca.gov/aaqm/met.htm.
Meteorological Tower
Page | 67
2016 Results for Meteorological Sensor Performance Audits Conducted by CARB
Sensor PQAO # of Audits
# of Audits That
Failed
Avg % or Degree
Difference
Minimum %
Difference
Maximum%
Difference
Ambient CARB 68 0 0.01 -0.03 0.40
Temperature Other PQAOs
0 0 0.00 0.00 0.00
Wind Direction CARB 62 0 -0.21 -3.50 3.80
Direction Other PQAOs
2 0 2.45 2.20 2.70
Wind CARB 78 0 0.12 -1.90 4.00
Speed Other PQAOs
2 0 0.05 -0.10 0.20
Barometric CARB 28 0 -0.25 -7.80 1.90
Pressure Other PQAOs
3 1 -1.67 -2.60 -0.70
Note: CARB’s acceptance criteria for meteorological sensors are: ± 1 degree Celsius for ambient temperature, 5% combined accuracy and orientation error for wind direction, 0.25% m/s between 0.5 and 5 m/s and 5% difference above 5 m/s for horizontal wind speed, and ± 2.25 mmHg for barometric pressure.

Page | 68
This page intentionally left blank.
Page | 69
APPENDIX D
DETAILED CALCULATIONS OF STATISTICS USED TO ASSESS PRECISION AND
ACCURACY
Page | 70
The materials in this Appendix were adapted from EPA’s “Guideline on the Meaning and the Use of Precision and Bias Data Required by 40 CFR Part 58 to Appendix A”.
Data Quality Indicators Calculated for Each Measured Pollutant
Pollutant
Gaseous Assessments (Precision or
Bias)
One-Point Flow Rate
Bias Estimate
PM2.5 Bias
Semi-Annual
Flow Rate Audits
Precision Estimate
from Collocated Samples
Lead Bias
O 3 Precision Estimate/ Bias
Estimate
SO 2 Precision Estimate/ Bias
Estimate
NO 2 Precision Estimate/ Bias
Estimate
CO Precision Estimate/ Bias
Estimate
PM2.5 One-Point Flow Rate
Bias Estimate
Semi-Annual Flow Rate
Precision Estimate
PM10 One-Point Flow Rate
Semi-Annual Flow Rate
Precision Estimate
Lead Precision Estimate/
Bias Estimate
D.1 Gaseous Precision and Bias Assessments
Applies to: CO, O3, NO2, SO2
40 CFR Part 58 Appendix A References:
• 4.1.1 Percent Difference • 4.1.2 Precision Estimate • 4.1.3 Bias Estimate • 4.1.3.1 Assigning a sign (positive / negative) to the bias estimate. • 4.1.3.2 Calculate the 25th and 75th percentiles of the percent differences for each site.
Precision and bias estimates are based on 1-point Q/C checks. Then, bias estimates are validated using the annual performance evaluations (audits).
Percent Difference
Equations from this section come from 40 CFR Pt. 58, App. A, Section 4, “Calculations for Data Quality Assessment”. For each single point check, calculate the percent difference, di, as follows:
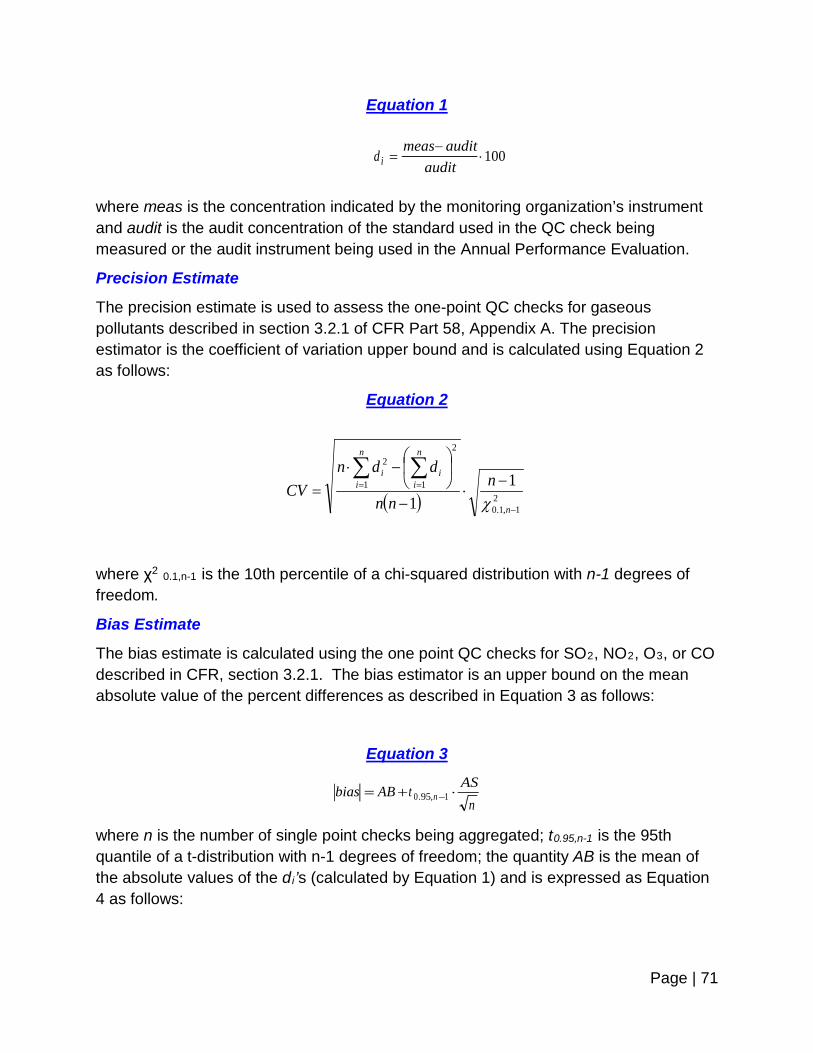
Page | 71
Equation 1
where meas is the concentration indicated by the monitoring organization’s instrument and audit is the audit concentration of the standard used in the QC check being measured or the audit instrument being used in the Annual Performance Evaluation.
Precision Estimate
The precision estimate is used to assess the one-point QC checks for gaseous pollutants described in section 3.2.1 of CFR Part 58, Appendix A. The precision estimator is the coefficient of variation upper bound and is calculated using Equation 2 as follows:
Equation 2
where χ2 0.1,n-1 is the 10th percentile of a chi-squared distribution with n-1 degrees of freedom.
Bias Estimate
The bias estimate is calculated using the one point QC checks for SO2, NO2, O3, or CO described in CFR, section 3.2.1. The bias estimator is an upper bound on the mean absolute value of the percent differences as described in Equation 3 as follows:
Equation 3
where n is the number of single point checks being aggregated; t0.95,n-1 is the 95th quantile of a t-distribution with n-1 degrees of freedom; the quantity AB is the mean of the absolute values of the di’s (calculated by Equation 1) and is expressed as Equation 4 as follows:
bias AB t ASn
n= + ⋅−0 95 1. ,
d
meas auditauditi =−
⋅100
( ) 21,1.0
1
2
1
2
11 −
= = −⋅
−
−⋅
=∑ ∑
n
n
i
n
iii n
nn
ddnCV
χ

Page | 72
Equation 4
and the quantity AS is the standard deviation of the absolute value of the di’s and is calculated using Equation 5 as follows:
Equation 5
Since the bias statistic as calculated in Equation 3 of this Appendix uses absolute values, it does not have a tendency (negative or positive bias) associated with it. A sign will be designated by rank ordering the percent differences (di’s) of the QC check samples from a given site for a particular assessment interval. Calculate the 25th and 75th percentiles of the percent differences for each site. The absolute bias upper bound should be flagged as positive if both percentiles are positive and negative if both percentiles are negative. The absolute bias upper bound would not be flagged if the 25th and 75th percentiles are of different signs (i.e., straddling zero).
D.2 Precision Estimates from Collocated Samples
Applies to: PM2.5, PM10, Lead
40 CFR Part 58 Appendix A References:
• 4.2.1 Precision Estimate from Collocated Samplers • 4.3.1 Precision Estimate(PM2.5) • 4.4.1 Precision Estimate (Lead)
Precision is estimated for manual instrumentation via duplicate measurements from collocated samplers at a minimum concentration (see table below for minimum concentration levels).
AB
nd i
i
n
= ⋅=∑1
1
( )AS
n d d
n n
ii
n
ii
n
=
⋅ −
−= =∑ ∑2
1 1
2
1
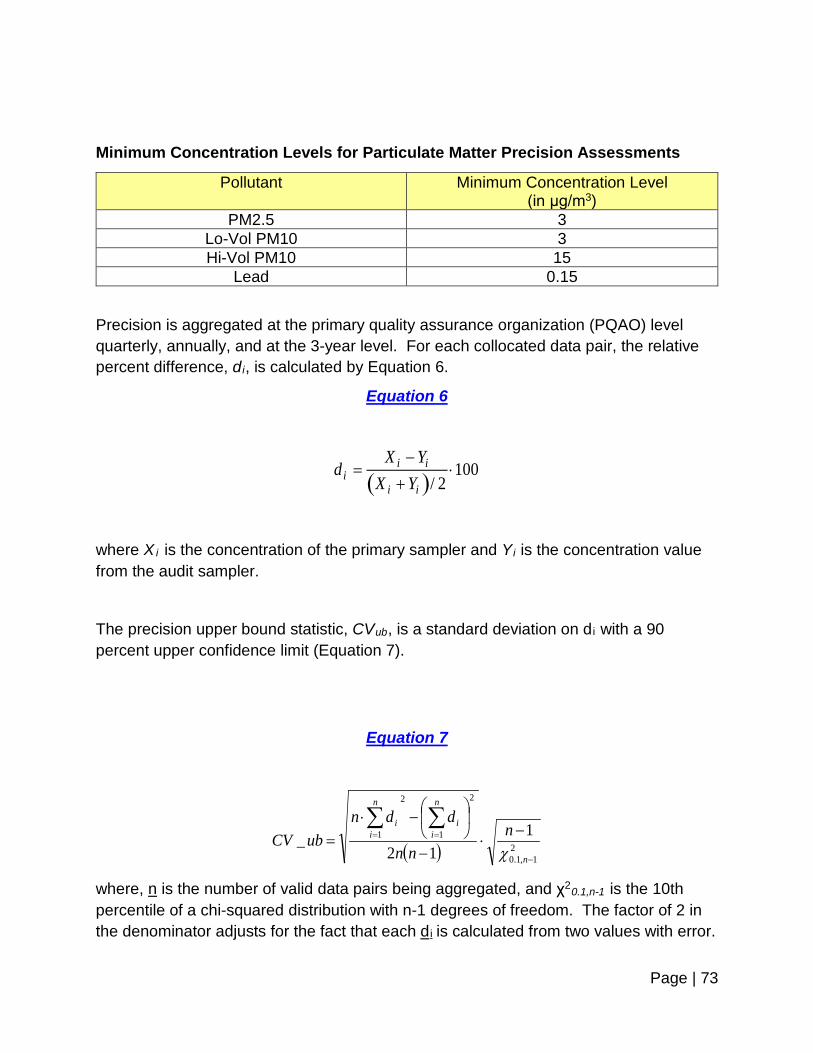
Page | 73
Minimum Concentration Levels for Particulate Matter Precision Assessments
Pollutant Minimum Concentration Level (in μg/m3)
PM2.5 3 Lo-Vol PM10 3 Hi-Vol PM10 15
Lead 0.15
Precision is aggregated at the primary quality assurance organization (PQAO) level quarterly, annually, and at the 3-year level. For each collocated data pair, the relative percent difference, di, is calculated by Equation 6.
Equation 6
where Xi is the concentration of the primary sampler and Yi is the concentration value from the audit sampler.
The precision upper bound statistic, CVub, is a standard deviation on di with a 90 percent upper confidence limit (Equation 7).
Equation 7
( ) 21,1.0
2
1
2
1 112
_−
== −⋅
−
−⋅
=∑∑
n
n
ii
n
ii n
nn
ddnubCV
χ
where, n is the number of valid data pairs being aggregated, and χ20.1,n-1 is the 10th percentile of a chi-squared distribution with n-1 degrees of freedom. The factor of 2 in the denominator adjusts for the fact that each di is calculated from two values with error.
( )d
X YX Yi
i i
i i=
−+
⋅/ 2
100
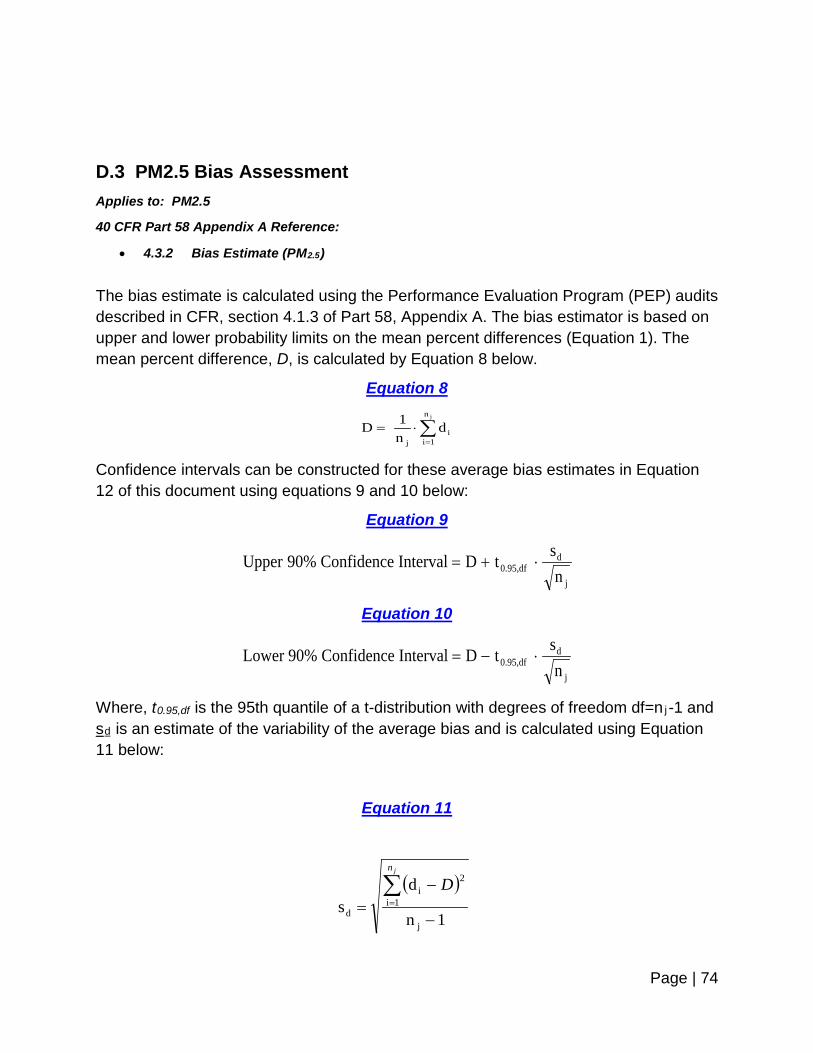
Page | 74
D.3 PM2.5 Bias Assessment Applies to: PM2.5
40 CFR Part 58 Appendix A Reference:
• 4.3.2 Bias Estimate (PM2.5)
The bias estimate is calculated using the Performance Evaluation Program (PEP) audits described in CFR, section 4.1.3 of Part 58, Appendix A. The bias estimator is based on upper and lower probability limits on the mean percent differences (Equation 1). The mean percent difference, D, is calculated by Equation 8 below.
Equation 8
∑=
⋅=jn
1ii
j
dn1D
Confidence intervals can be constructed for these average bias estimates in Equation 12 of this document using equations 9 and 10 below:
Equation 9
j
d0.95,df n
stDIntervalConfidence90%Upper ⋅+=
Equation 10
j
d0.95,df n
stDIntervalConfidence90%Lower ⋅−=
Where, t0.95,df is the 95th quantile of a t-distribution with degrees of freedom df=n j -1 and sd is an estimate of the variability of the average bias and is calculated using Equation 11 below:
Equation 11
( )
1n
ds
j
1i
2i
d −
−=∑=
jn
D

Page | 75
D.4 One-Point Flow Rate Bias Estimate Applies to: PM10, PM2.5
40 CFR Part 58 Appendix A References:
• 4.2.2 Bias Estimate Using One-Point Flow Rate Verifications (PM10) The bias estimate is calculated using the collocated audits previously described. The bias estimator is an upper bound on the mean absolute value of the percent differences (Equation 1), as described in Equation 12 as follows:
Equation 12
where n is the number of flow audits being aggregated; t 0.95,n-1 is the 95th quantile of a t-distribution with n-1 degrees of freedom; the quantity AB is the mean of the absolute values of the di’s (calculated by Equation 13) and is expressed as Equation 4 as follows:
Equation 13
and the quantity AS is the standard deviation of the absolute value of the di’s (Equation 4) and is calculated using Equation 14 as follows:
Equation 14
Since the bias statistic uses absolute values, it does not have a sign direction (negative or positive bias) associated with it. A sign will be designated by rank ordering the
bias AB t AS
nn= + ⋅−0 95 1. ,
AB
nd i
i
n
= ⋅=∑1
1
( )AS
n d d
n n
ii
n
ii
n
=
⋅ −
−= =∑ ∑2
1 1
2
1
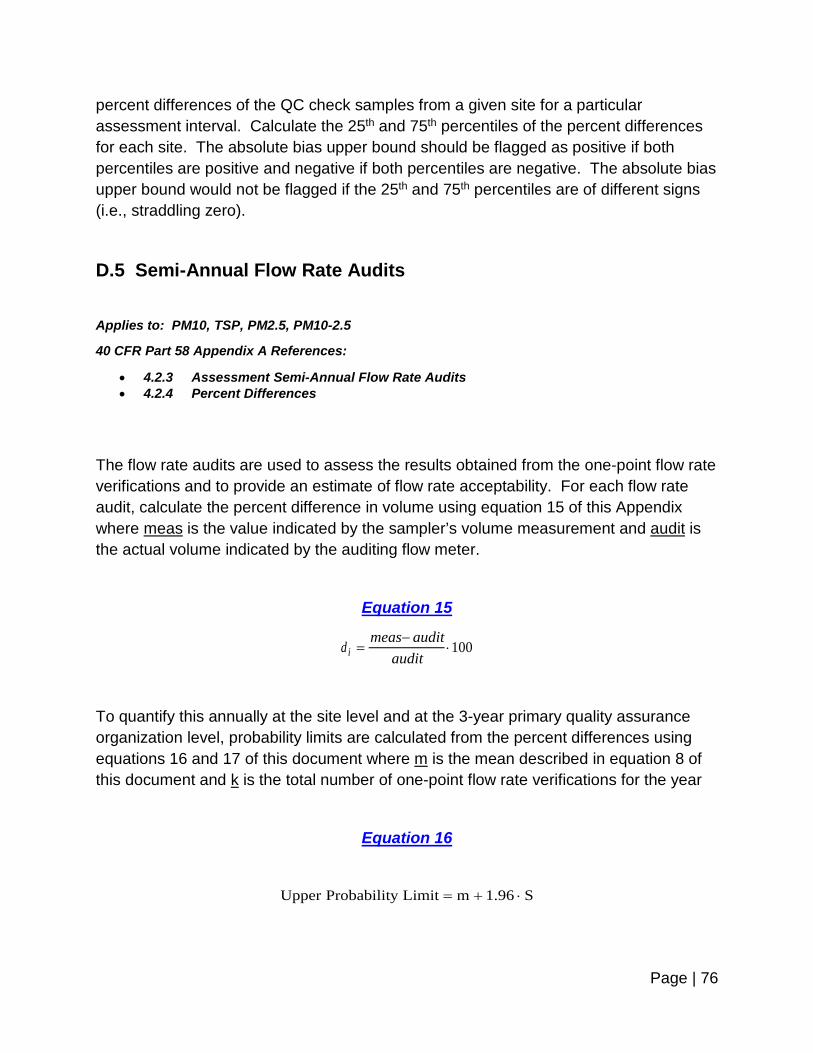
Page | 76
percent differences of the QC check samples from a given site for a particular assessment interval. Calculate the 25th and 75th percentiles of the percent differences for each site. The absolute bias upper bound should be flagged as positive if both percentiles are positive and negative if both percentiles are negative. The absolute bias upper bound would not be flagged if the 25th and 75th percentiles are of different signs (i.e., straddling zero).
D.5 Semi-Annual Flow Rate Audits
Applies to: PM10, TSP, PM2.5, PM10-2.5
40 CFR Part 58 Appendix A References:
• 4.2.3 Assessment Semi-Annual Flow Rate Audits • 4.2.4 Percent Differences
The flow rate audits are used to assess the results obtained from the one-point flow rate verifications and to provide an estimate of flow rate acceptability. For each flow rate audit, calculate the percent difference in volume using equation 15 of this Appendix where meas is the value indicated by the sampler’s volume measurement and audit is the actual volume indicated by the auditing flow meter.
Equation 15
To quantify this annually at the site level and at the 3-year primary quality assurance organization level, probability limits are calculated from the percent differences using equations 16 and 17 of this document where m is the mean described in equation 8 of this document and k is the total number of one-point flow rate verifications for the year
Equation 16
S1.96mLimityProbabilitUpper ⋅+=
dmeas audit
auditi =−
⋅100
Page | 77
Equation 17
S1.96mLimityProbabilitLower ⋅−=
where, m is the mean (equation 18):
Equation 18
∑=
⋅=k
1iid
k1m
where, k is the total number of one point QC checks for the interval being evaluated and S is the standard deviation of the percent differences (equation 19) as follows:
Equation 19
1)-k(k
ddkS
2k
1ii
k
1i
2i
−⋅
=∑∑==

Page | 78
This page intentionally left blank.
Page | 79
APPENDIX E
REFERENCES
Page | 80
References
1. CARB, Air Monitoring Quality Assurance Manual. Vol I, Quality Assurance Plan, 2005.
2. CARB, State and Local Air Monitoring Network Plan, 2009.
3. US EPA, Quality Assurance Handbook for Air Pollution Measurement Systems. Vol. I, A Field Guide to Environmental Quality Assurance, EPA-600/R-34/038a, 1994.
4. US EPA, Quality Assurance Handbook for Air Pollution Measurement Systems. Vol. II, Ambient
Air Quality Monitoring Program, EPA-454/B-13-003, 2013.
5. US EPA, Quality Assurance Handbook for Air Pollution Measurement Systems. Vol. IV, Meteorological Measurements Version 2.0 (Final), EPA-454/B-08-001, 2008.
6. 40 C.F.R §58 2016.