Data Profiling in Metanome - Hasso-Plattner-Institut · “Premature optimization is the root of...
33
Experimental methods many slides by Sebastian Kruse & Thorsten Papenbrock 22.05.2017 Felix Naumann
Transcript of Data Profiling in Metanome - Hasso-Plattner-Institut · “Premature optimization is the root of...

Experimental methods many slides by Sebastian Kruse & Thorsten Papenbrock
22.05.2017
Felix Naumann

1. Designing algorithms
■ Definition of goals
■ Engineering pitfalls
■ Testing for correctness
■ Experimental evaluation
2. Interpreting experiments
3. Cross-cutting concerns
■ Data acquisition
■ Thoughts on complexity
■ Science vs. Engineering
Agenda
Felix Naumann Data Profiling Summer 2017
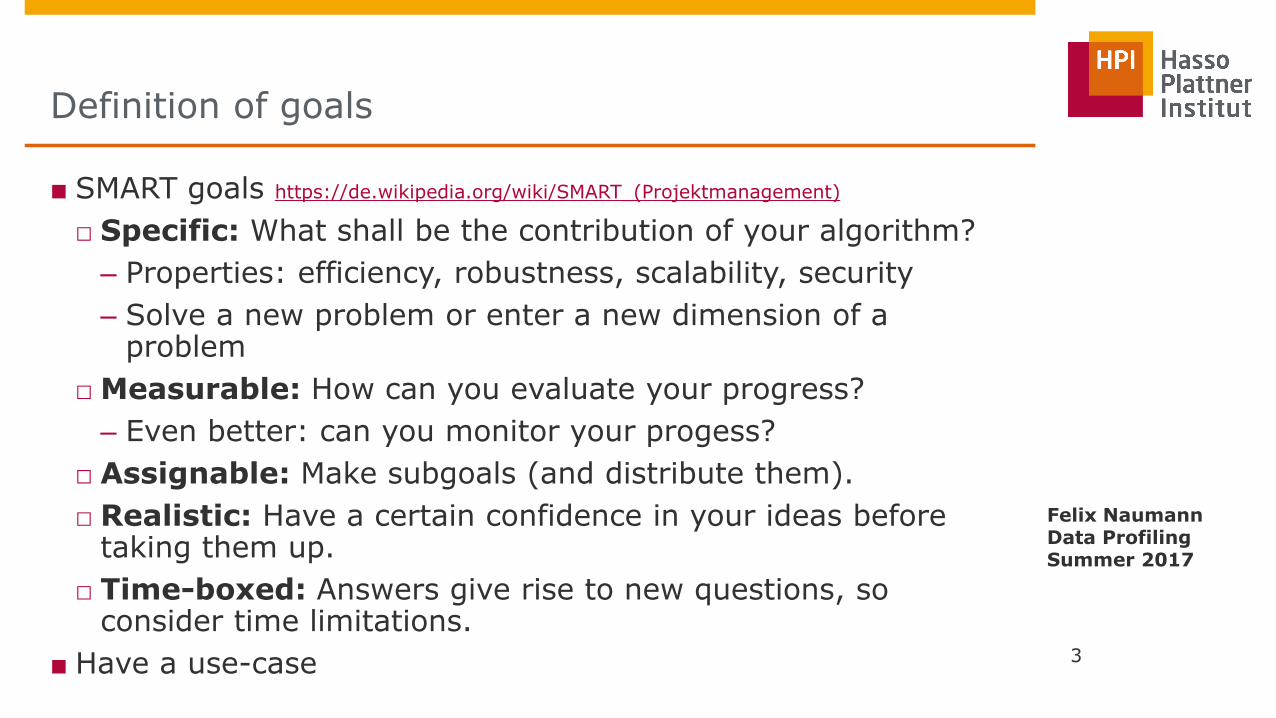
■ SMART goals https://de.wikipedia.org/wiki/SMART_(Projektmanagement)
□ Specific: What shall be the contribution of your algorithm?
– Properties: efficiency, robustness, scalability, security
– Solve a new problem or enter a new dimension of a problem
□ Measurable: How can you evaluate your progress?
– Even better: can you monitor your progess?
□ Assignable: Make subgoals (and distribute them).
□ Realistic: Have a certain confidence in your ideas before taking them up.
□ Time-boxed: Answers give rise to new questions, so consider time limitations.
■ Have a use-case 3
Definition of goals
Felix Naumann Data Profiling Summer 2017
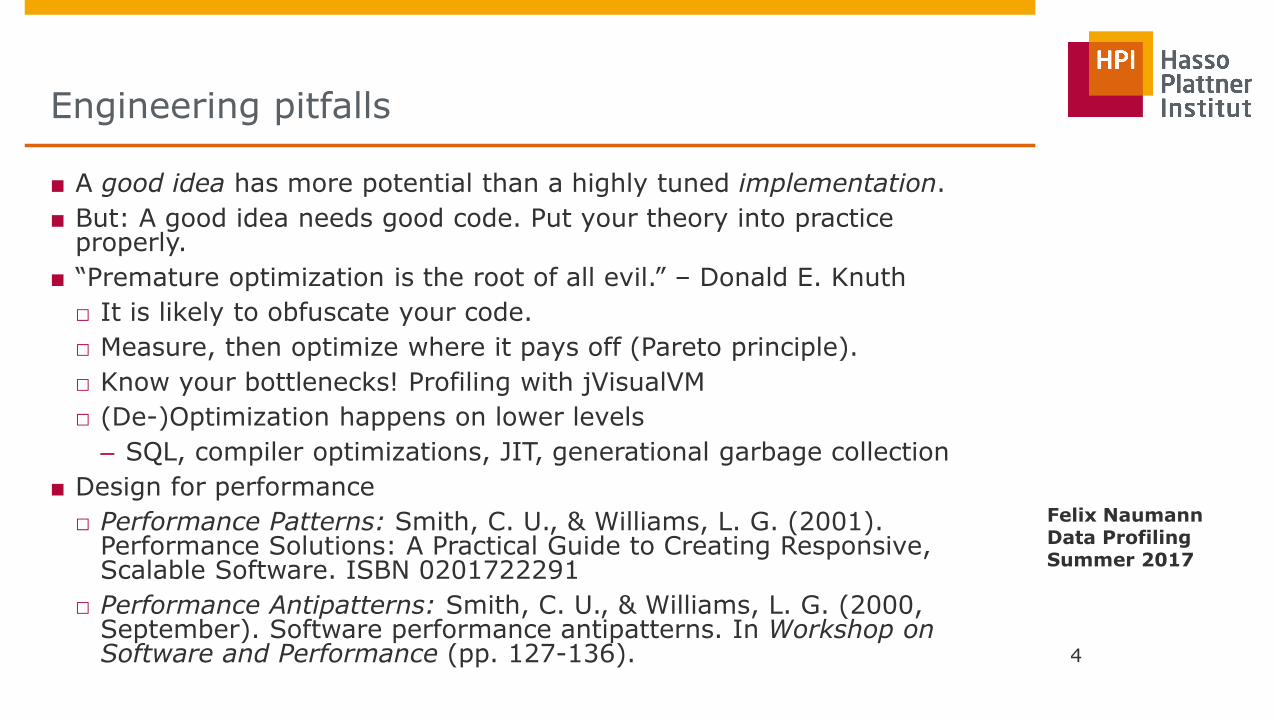
■ A good idea has more potential than a highly tuned implementation.
■ But: A good idea needs good code. Put your theory into practice properly.
■ “Premature optimization is the root of all evil.” – Donald E. Knuth
□ It is likely to obfuscate your code.
□ Measure, then optimize where it pays off (Pareto principle).
□ Know your bottlenecks! Profiling with jVisualVM
□ (De-)Optimization happens on lower levels
– SQL, compiler optimizations, JIT, generational garbage collection
■ Design for performance
□ Performance Patterns: Smith, C. U., & Williams, L. G. (2001). Performance Solutions: A Practical Guide to Creating Responsive, Scalable Software. ISBN 0201722291
□ Performance Antipatterns: Smith, C. U., & Williams, L. G. (2000, September). Software performance antipatterns. In Workshop on Software and Performance (pp. 127-136).
4
Engineering pitfalls
Felix Naumann Data Profiling Summer 2017
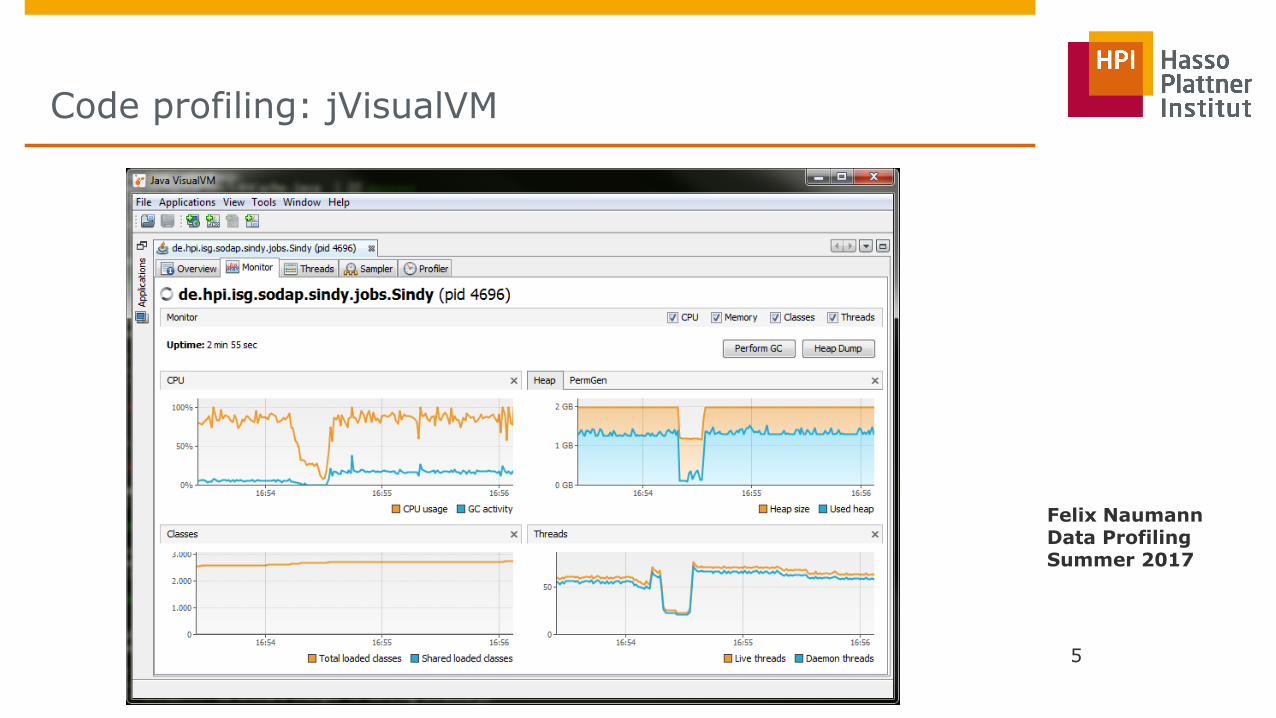
Code profiling: jVisualVM
5
Felix Naumann Data Profiling Summer 2017
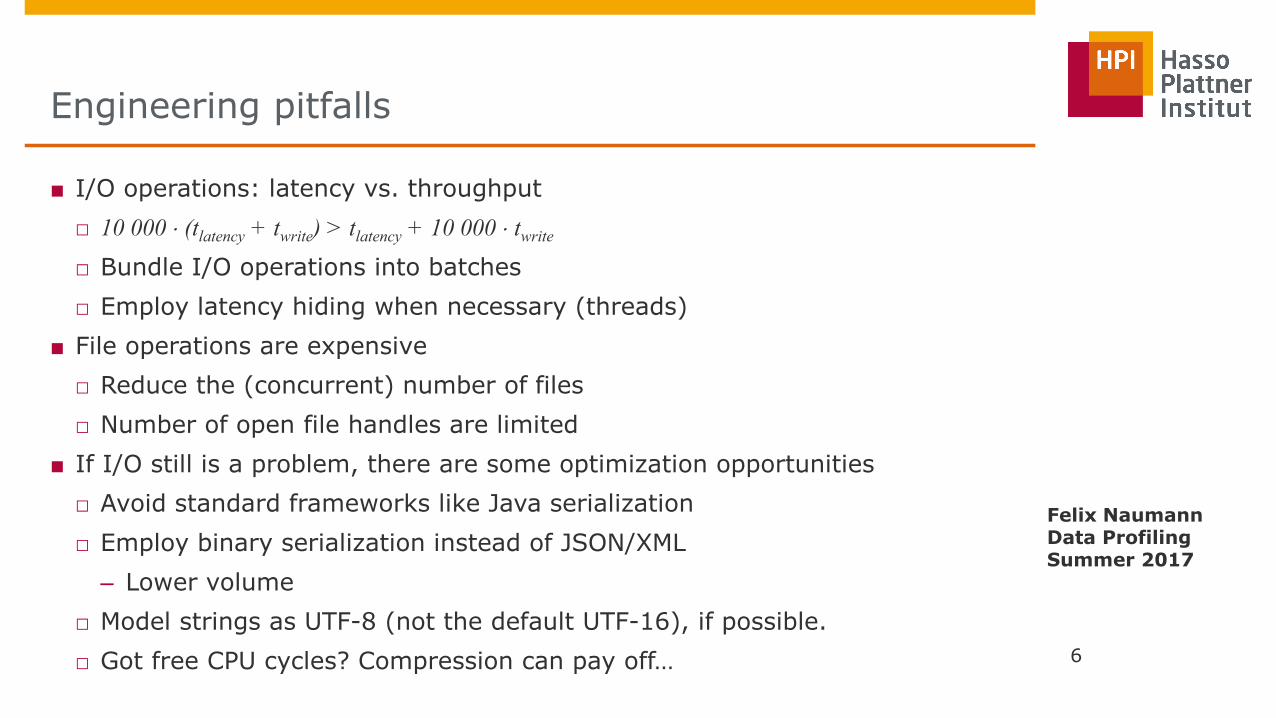
■ I/O operations: latency vs. throughput
□ 10 000 (tlatency + twrite) > tlatency + 10 000 twrite
□ Bundle I/O operations into batches
□ Employ latency hiding when necessary (threads)
■ File operations are expensive
□ Reduce the (concurrent) number of files
□ Number of open file handles are limited
■ If I/O still is a problem, there are some optimization opportunities
□ Avoid standard frameworks like Java serialization
□ Employ binary serialization instead of JSON/XML
– Lower volume
□ Model strings as UTF-8 (not the default UTF-16), if possible.
□ Got free CPU cycles? Compression can pay off… 6
Engineering pitfalls
Felix Naumann Data Profiling Summer 2017
■ Test your theory/hypothesis:
□ The ultimate verification: prove correctness of your algorithm
□ If formal proof is hard, make an informal proof to convince yourself
■ Test your components:
□ Write unit tests for your utilities (e.g., parsers)
■ Artificial test examples:
□ Good to get a first running version
□ Will likely not contain all edge cases
■ Reference implementation:
□ Automatic result comparison with reference implementation
□ Helpful for debugging: output your delta with reference result
□ Do it on as many datasets as possible
7
Testing for correctness
Felix Naumann Data Profiling Summer 2017
■ Monitor your progress
□ Measure first, then optimize
□ Measure often
– Use many different datasets for testing to avoid optimizing for specific dataset characteristics
– Explore your parameters
□ Write a measurement framework early on!
– Or use Metanome…
■ If your goals are smart, you know when you are done.
Felix Naumann Data Profiling Summer 2017
8
Experimental evaluation
■ Ultimate evaluation: Prove complexity of algorithm
■ Otherwise: Empirical evidence of your claims/goals
■ Evaluation results should therefore be
□ credible, significant, relevant, realistic, general/generalizable
□ Counterexamples?
■ The fine art of evaluation: Support your claims with only a few experiments (on 10-12 pages)
□ Main goals: efficiency (compared to other algorithms), scalability
□ Optimizations: isolate and show effects of design choices
□ Use many datasets
– Try to provide variety / use sampling to create variety
– Real-world datasets are in general more convincing
Felix Naumann Data Profiling Summer 2017
9
Experimental evaluation

1. Designing algorithms
■ Definition of goals
■ Engineering pitfalls
■ Testing for correctness
■ Experimental evaluation
2. Interpreting experiments
3. Cross-cutting concerns
■ Data acquisition
■ Thoughts on complexity
■ Science vs. Engineering
Agenda
Felix Naumann Data Profiling Summer 2017
Chart 10
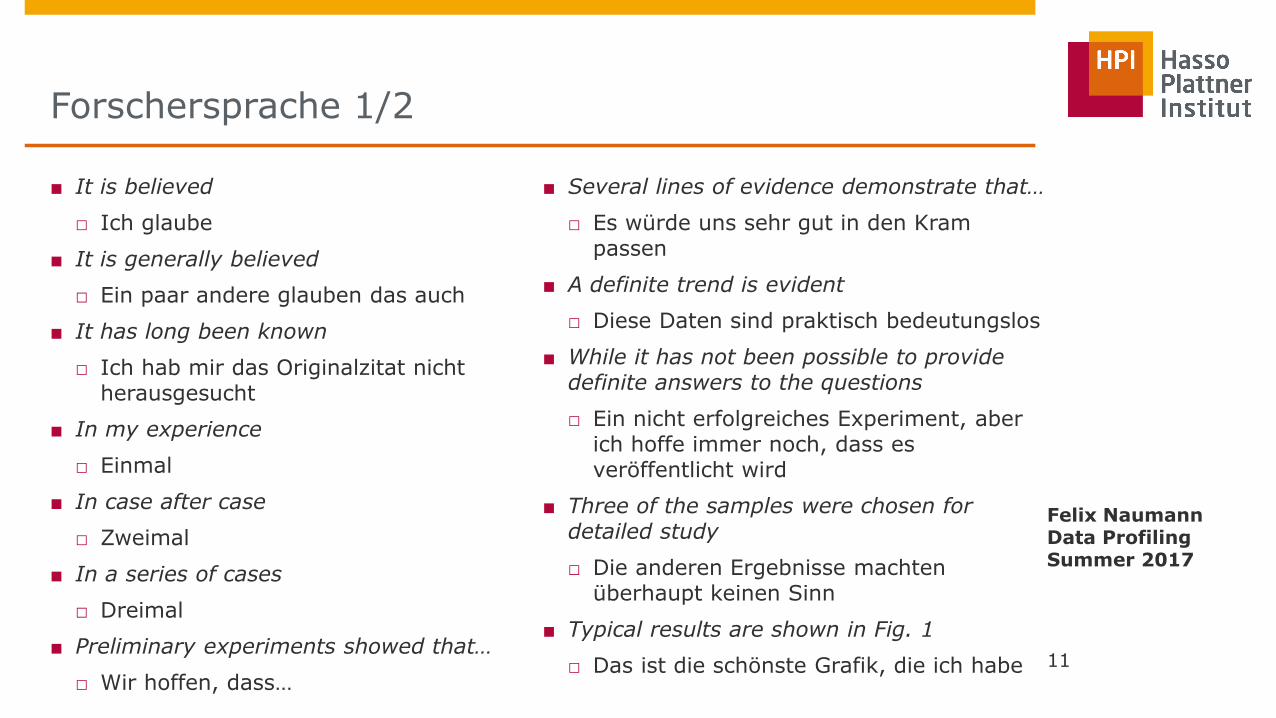
■ It is believed
□ Ich glaube
■ It is generally believed
□ Ein paar andere glauben das auch
■ It has long been known
□ Ich hab mir das Originalzitat nicht herausgesucht
■ In my experience
□ Einmal
■ In case after case
□ Zweimal
■ In a series of cases
□ Dreimal
■ Preliminary experiments showed that…
□ Wir hoffen, dass…
■ Several lines of evidence demonstrate that…
□ Es würde uns sehr gut in den Kram passen
■ A definite trend is evident
□ Diese Daten sind praktisch bedeutungslos
■ While it has not been possible to provide definite answers to the questions
□ Ein nicht erfolgreiches Experiment, aber ich hoffe immer noch, dass es veröffentlicht wird
■ Three of the samples were chosen for detailed study
□ Die anderen Ergebnisse machten überhaupt keinen Sinn
■ Typical results are shown in Fig. 1
□ Das ist die schönste Grafik, die ich habe 11
Forschersprache 1/2
Felix Naumann Data Profiling Summer 2017
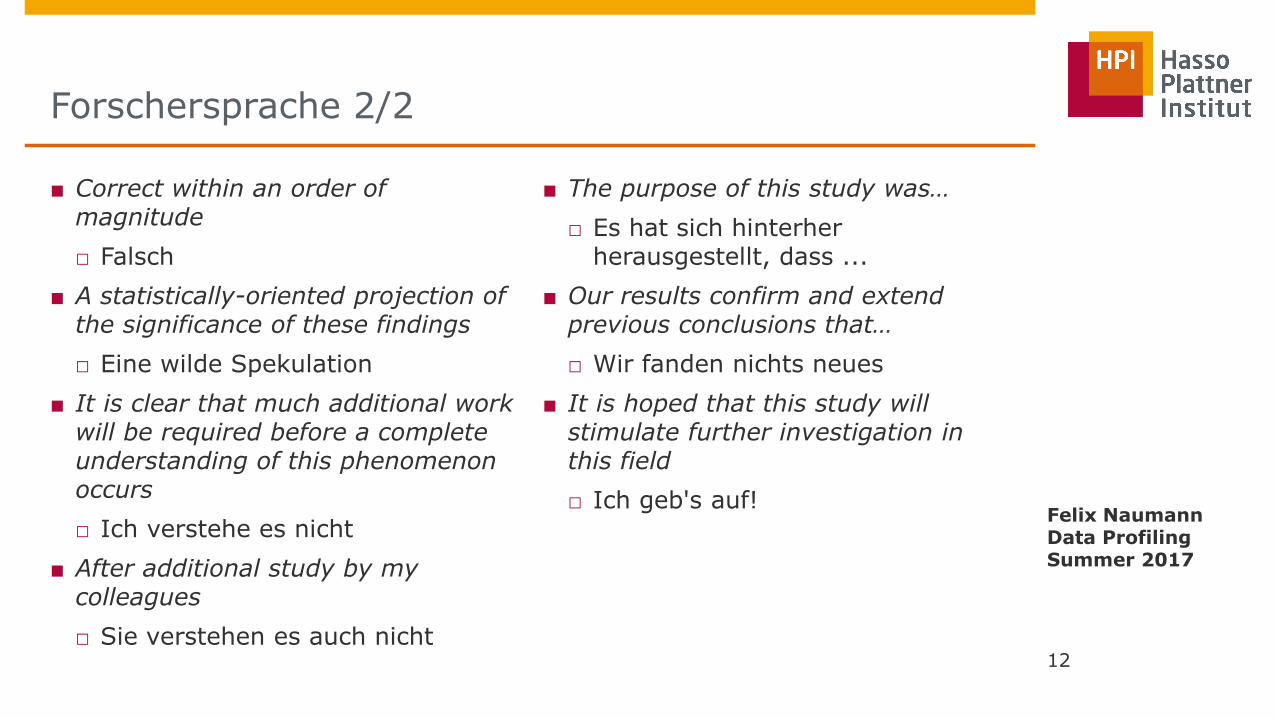
■ Correct within an order of magnitude
□ Falsch
■ A statistically-oriented projection of the significance of these findings
□ Eine wilde Spekulation
■ It is clear that much additional work will be required before a complete understanding of this phenomenon occurs
□ Ich verstehe es nicht
■ After additional study by my colleagues
□ Sie verstehen es auch nicht
■ The purpose of this study was…
□ Es hat sich hinterher herausgestellt, dass ...
■ Our results confirm and extend previous conclusions that…
□ Wir fanden nichts neues
■ It is hoped that this study will stimulate further investigation in this field
□ Ich geb's auf!
12
Forschersprache 2/2
Felix Naumann Data Profiling Summer 2017

■ Welche (vereinfachenden) Annahmen wurden getroffen
■ Welche Daten wurden verwendet?
□ Real-World-Daten (Szenario?)
□ Künstliche Daten
□ Datenmenge
■ Skalen der Grafiken
■ Lesbarkeit der Graphiken
■ Interpretation
□ Wurden Auffälligkeiten begründet?
■ Vollständigkeit der Experimente
□ Wurden alle Aspekte der vorigen Abschnitte getestet?
□ Wurden alle Fragen beantwortet?
□ Funktionalität und Laufzeit (oder Beweis) 13
Experimente kritisch begutachten
Felix Naumann Data Profiling Summer 2017
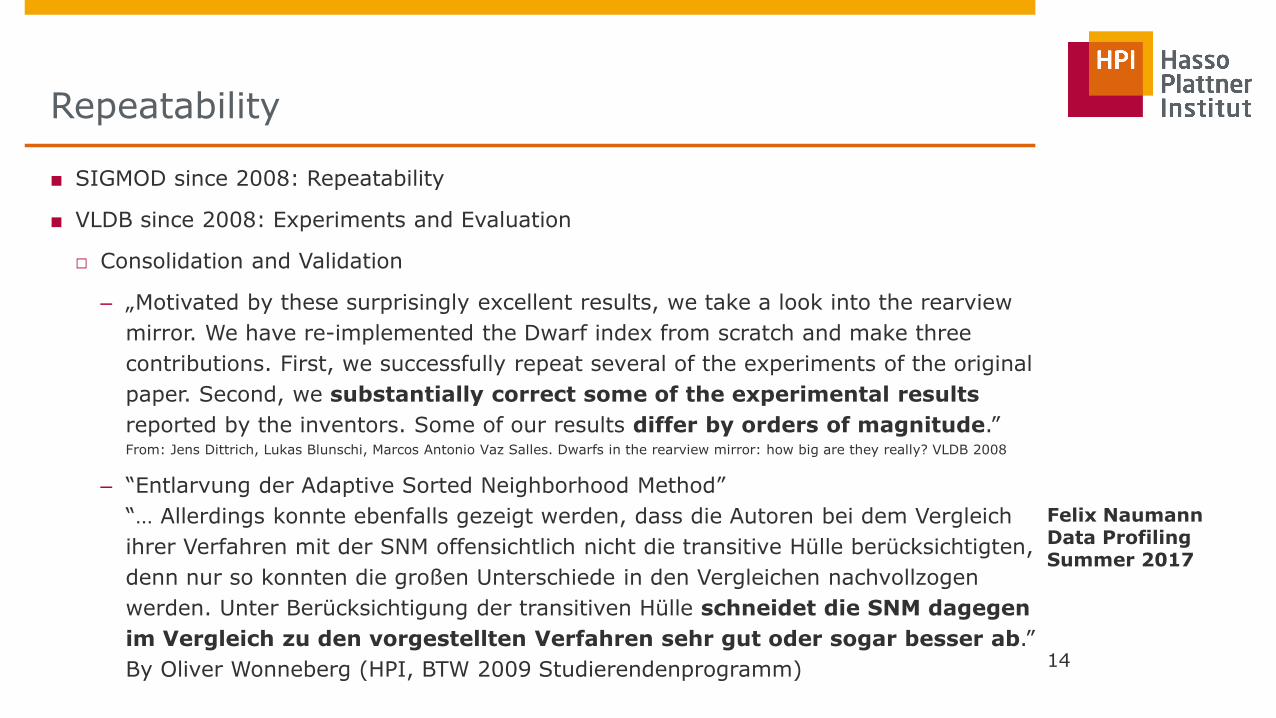
■ SIGMOD since 2008: Repeatability
■ VLDB since 2008: Experiments and Evaluation
□ Consolidation and Validation
– „Motivated by these surprisingly excellent results, we take a look into the rearview
mirror. We have re-implemented the Dwarf index from scratch and make three
contributions. First, we successfully repeat several of the experiments of the original
paper. Second, we substantially correct some of the experimental results
reported by the inventors. Some of our results differ by orders of magnitude.” From: Jens Dittrich, Lukas Blunschi, Marcos Antonio Vaz Salles. Dwarfs in the rearview mirror: how big are they really? VLDB 2008
– “Entlarvung der Adaptive Sorted Neighborhood Method”
“… Allerdings konnte ebenfalls gezeigt werden, dass die Autoren bei dem Vergleich
ihrer Verfahren mit der SNM offensichtlich nicht die transitive Hülle berücksichtigten,
denn nur so konnten die großen Unterschiede in den Vergleichen nachvollzogen
werden. Unter Berücksichtigung der transitiven Hülle schneidet die SNM dagegen
im Vergleich zu den vorgestellten Verfahren sehr gut oder sogar besser ab.”
By Oliver Wonneberg (HPI, BTW 2009 Studierendenprogramm) 14
Repeatability
Felix Naumann Data Profiling Summer 2017
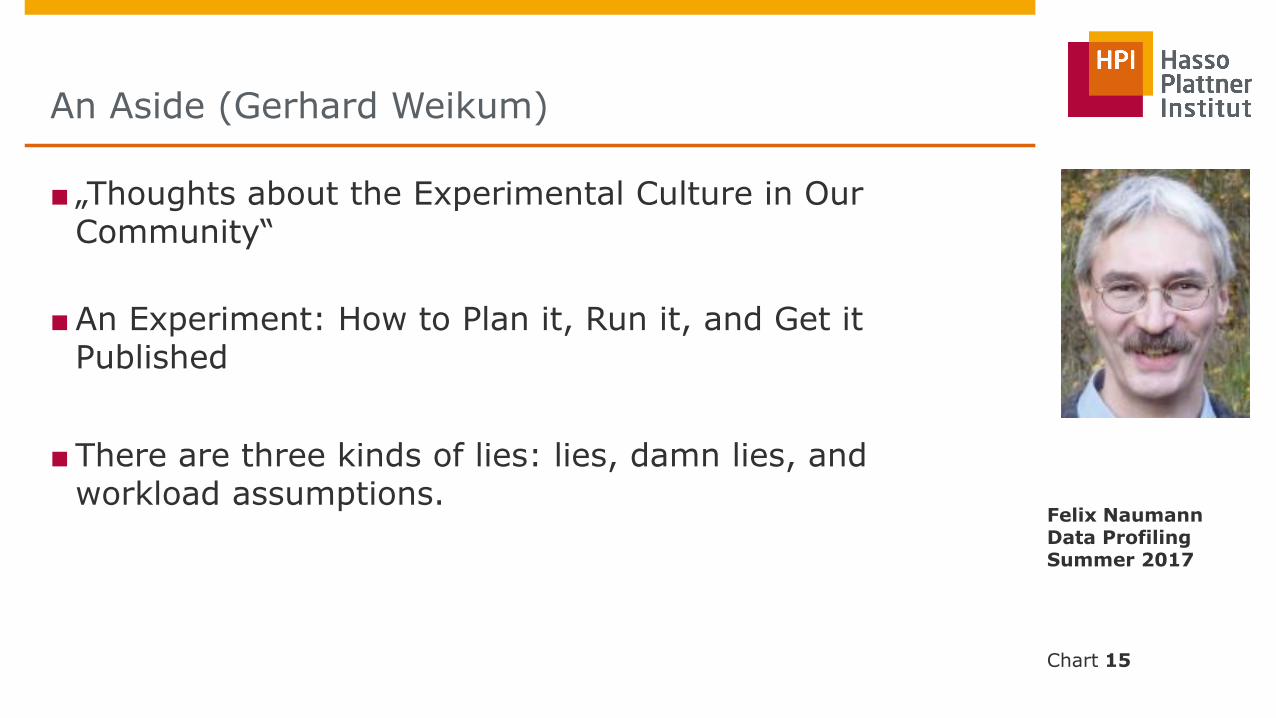
■ „Thoughts about the Experimental Culture in Our Community“
■An Experiment: How to Plan it, Run it, and Get it Published
■ There are three kinds of lies: lies, damn lies, and workload assumptions.
An Aside (Gerhard Weikum)
Felix Naumann Data Profiling Summer 2017
Chart 15
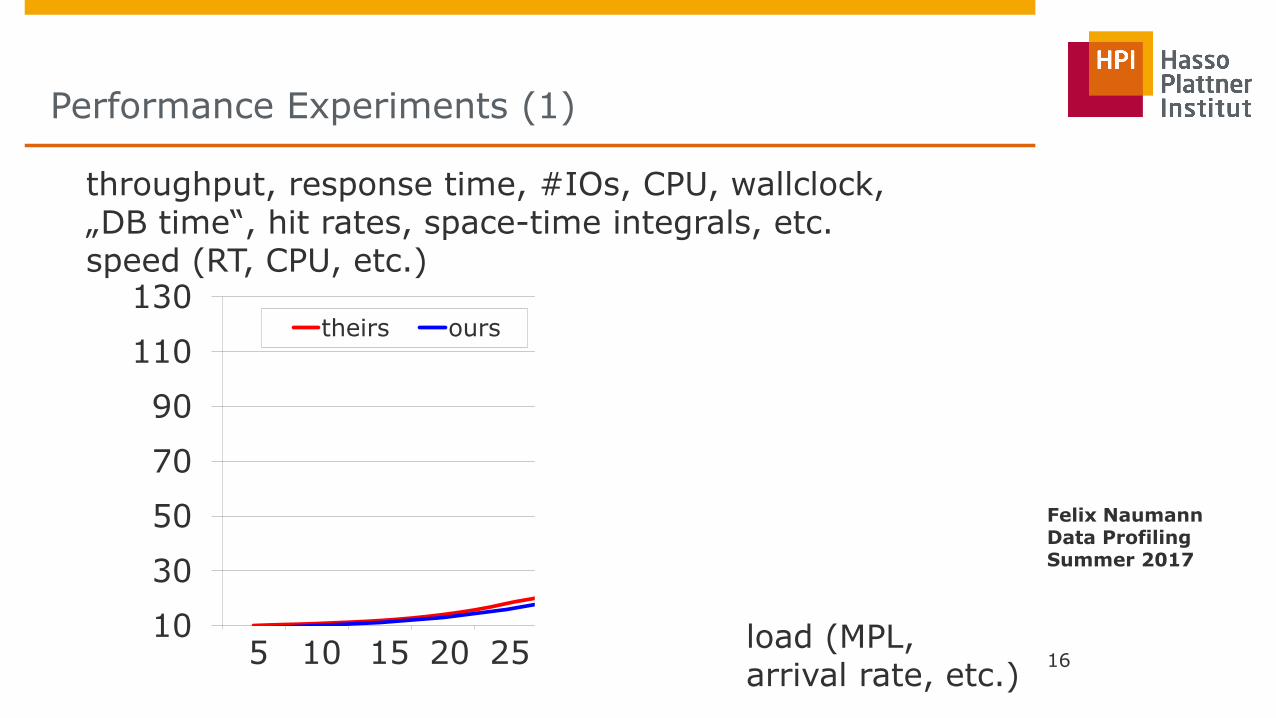
Performance Experiments (1)
16
10
30
50
70
90
110
130theirs ours
throughput, response time, #IOs, CPU, wallclock, „DB time“, hit rates, space-time integrals, etc.
5 10 15 20 25 30 load (MPL, arrival rate, etc.)
speed (RT, CPU, etc.)
35 40
Felix Naumann Data Profiling Summer 2017
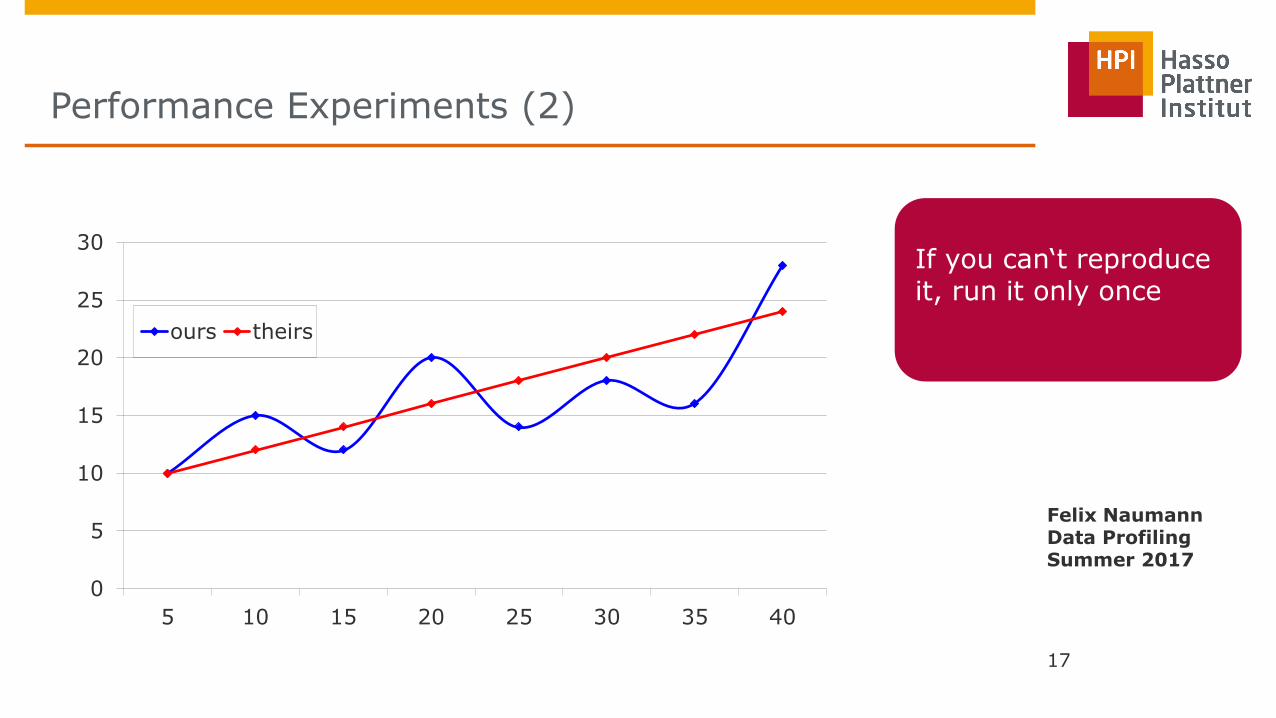
Performance Experiments (2)
17
0
5
10
15
20
25
30
5 10 15 20 25 30 35 40
ours theirs
If you can‘t reproduce it, run it only once
Felix Naumann Data Profiling Summer 2017
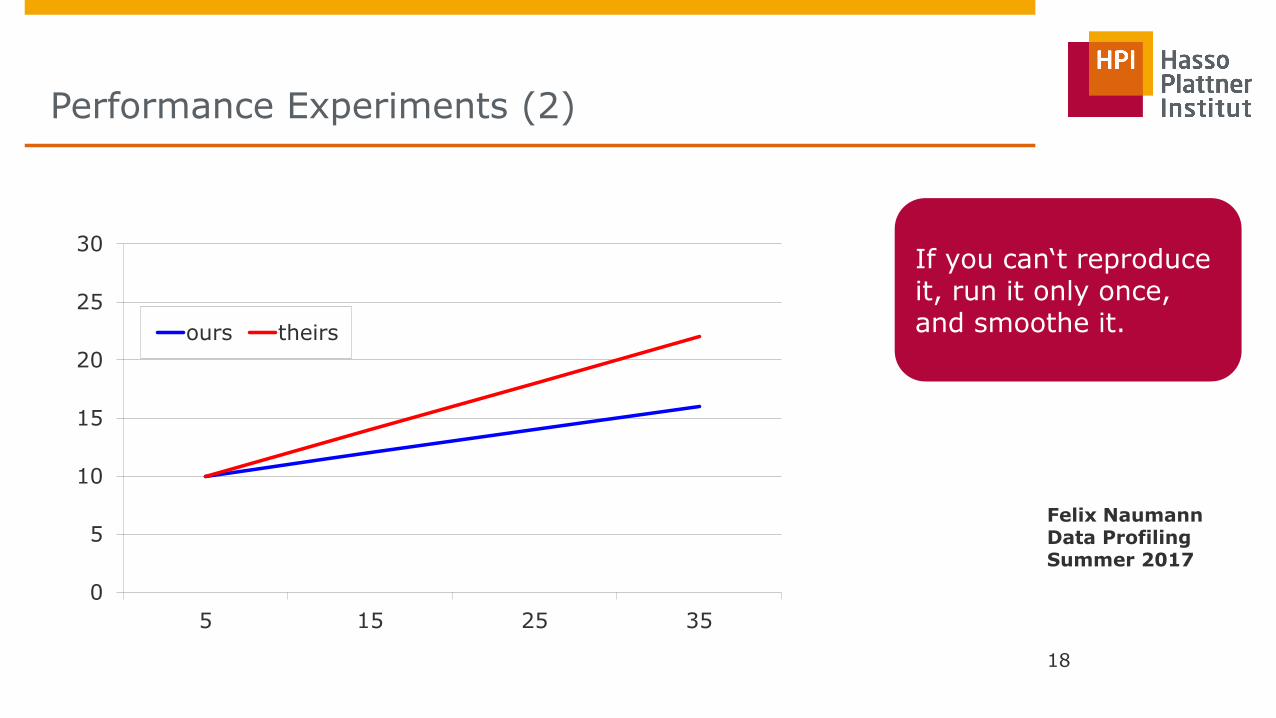
Performance Experiments (2)
18
If you can‘t reproduce it, run it only once, and smoothe it.
0
5
10
15
20
25
30
5 15 25 35
ours theirs
Felix Naumann Data Profiling Summer 2017
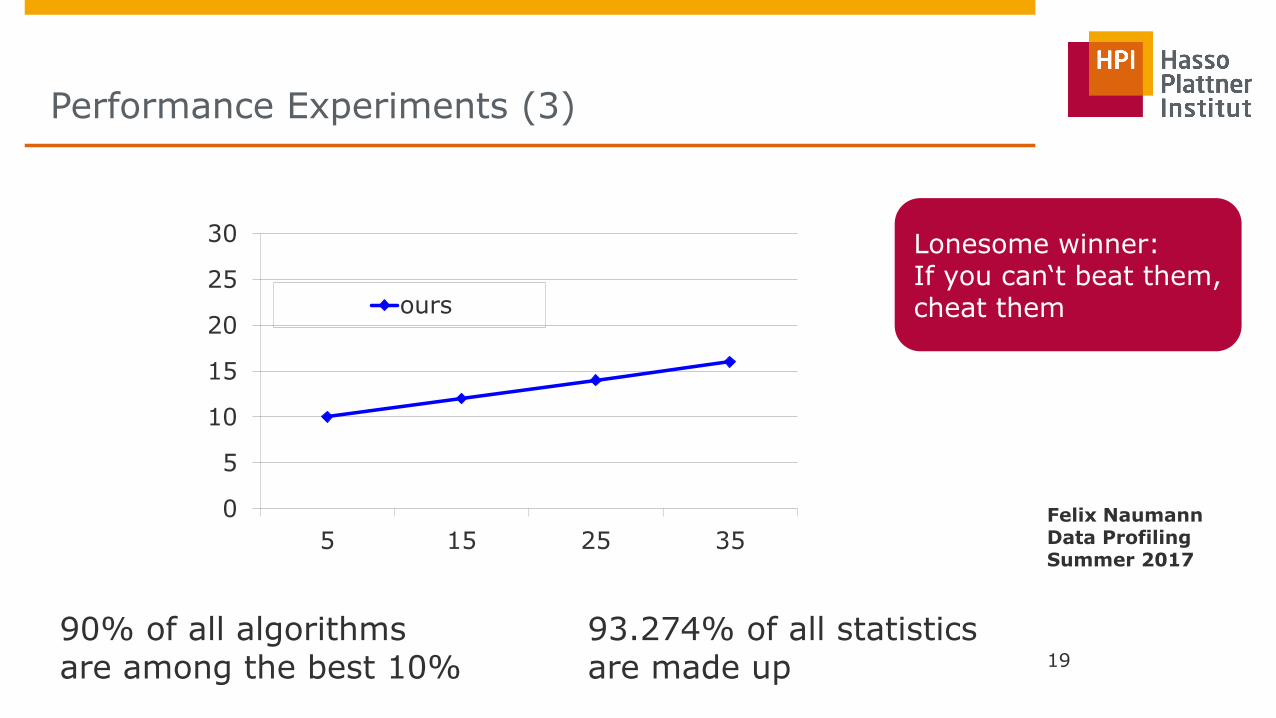
Performance Experiments (3)
19
0
5
10
15
20
25
30
5 15 25 35
ours
90% of all algorithms are among the best 10%
93.274% of all statistics are made up
Lonesome winner: If you can‘t beat them, cheat them
Felix Naumann Data Profiling Summer 2017
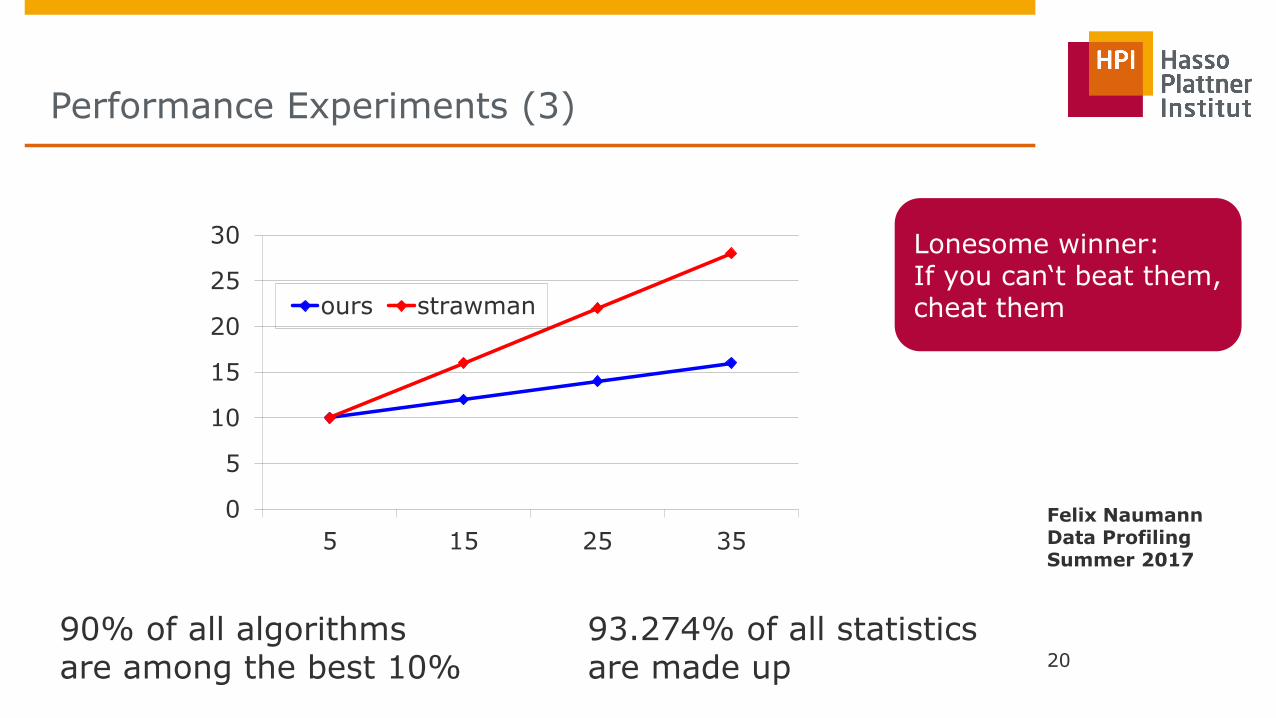
Performance Experiments (3)
20
0
5
10
15
20
25
30
5 15 25 35
ours strawman
90% of all algorithms are among the best 10%
93.274% of all statistics are made up
Lonesome winner: If you can‘t beat them, cheat them
Felix Naumann Data Profiling Summer 2017

■ PDbF: Portable database file
□ PDF file & HTML file (& virtual image)
□ Includes database
■ Demo: https://www.infosys.uni-saarland.de/publications/p1972-dittrich.html
■ https://github.com/uds-datalab/PDBF
21
Janiform Papers
Felix Naumann Data Profiling Summer 2017
1. Designing algorithms
■ Definition of goals
■ Engineering pitfalls
■ Testing for correctness
■ Experimental evaluation
2. Interpreting experiments
3. Cross-cutting concerns
■ Data acquisition
■ Thoughts on complexity
■ Science vs. Engineering
Agenda
Felix Naumann Data Profiling Summer 2017
■Data Profiling is data-driven
Data is important to …
– Define the problem and your goals
– Develop ideas for good solutions
– Test for correctness
– Test for performance
■But data owners usually do not give their data away
□Data is the core capital of companies (strategic resource)
□Data is private property (sensitive information)
□Data fiefdoms 23
Data acquisition
Felix Naumann Data Profiling Summer 2017
■ Some good sources:
□ WDC web tables project: http://webdatacommons.org/webtables/index.html
□ UCI machine learning repository: http://archive.ics.uci.edu/ml/
□ Public competitions: www.kaggle.com/competitions
□ Collection: www.quora.com/Where-can-I-find-large-datasets-open-to-the-public
■ Which data to consider?
□ Use datasets from different domains
□ Use datasets of different size
□ Use datasets in different formats
□ Use datasets from different sources 24
Data collection
Felix Naumann Data Profiling Summer 2017
■ “At some point, every company writes its own data generator”
□ HPI: dbtesma, hanaGenerator, …
□ IBM, SAP, …
■ Public data generators:
□ www.tpc.org/tpch/
□ www.generatedata.com/
□ www.red-gate.com/products/sql-development/sql-data-generator/
■ Advantage
□ As much data as you want!
□ Data fits your needs! (?)
25
Data generation
Felix Naumann Data Profiling Summer 2017
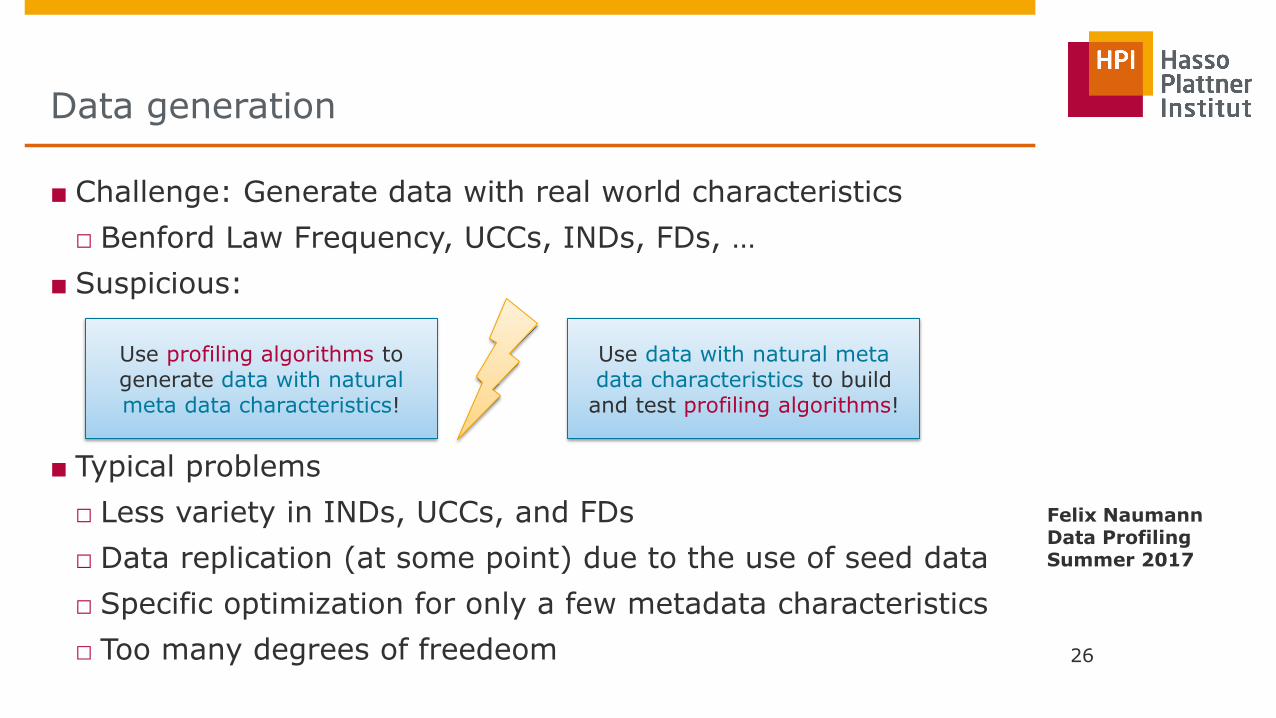
■ Challenge: Generate data with real world characteristics
□ Benford Law Frequency, UCCs, INDs, FDs, …
■ Suspicious:
■ Typical problems
□ Less variety in INDs, UCCs, and FDs
□ Data replication (at some point) due to the use of seed data
□ Specific optimization for only a few metadata characteristics
□ Too many degrees of freedeom
26
Data generation
Use profiling algorithms to generate data with natural meta data characteristics!
Use data with natural meta data characteristics to build
and test profiling algorithms!
Felix Naumann Data Profiling Summer 2017
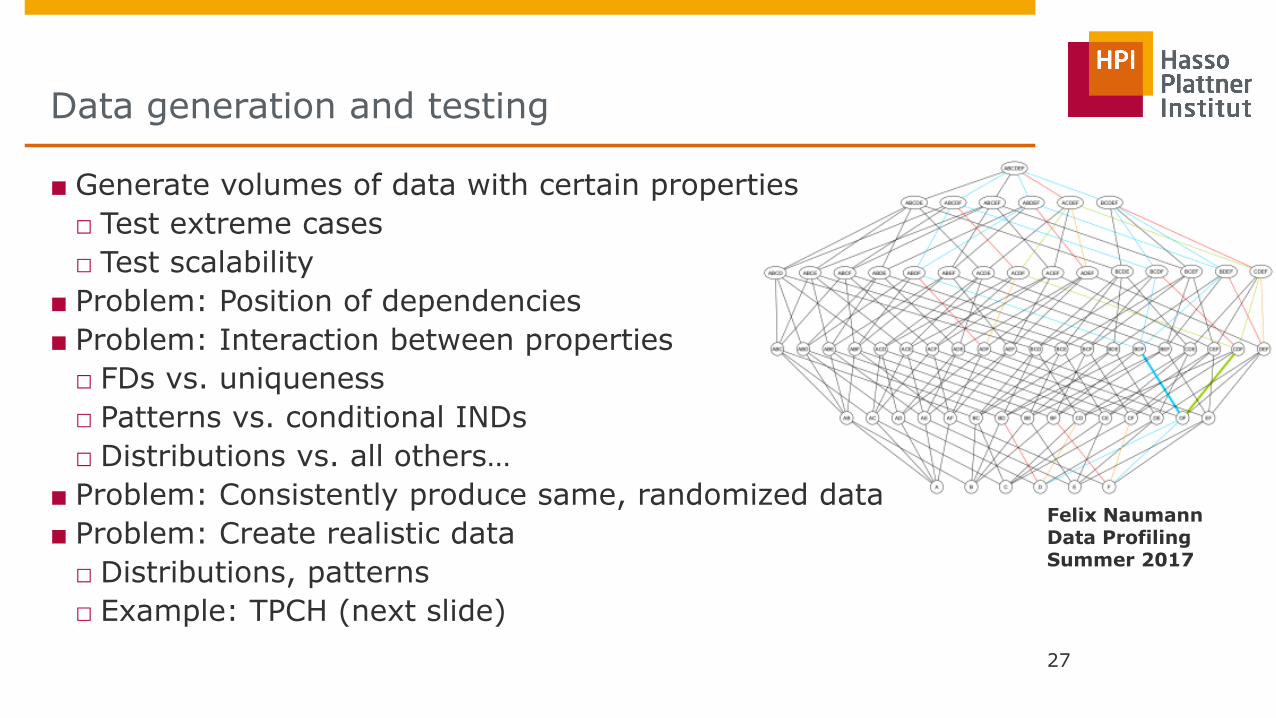
■ Generate volumes of data with certain properties
□ Test extreme cases
□ Test scalability
■ Problem: Position of dependencies
■ Problem: Interaction between properties
□ FDs vs. uniqueness
□ Patterns vs. conditional INDs
□ Distributions vs. all others…
■ Problem: Consistently produce same, randomized data
■ Problem: Create realistic data
□ Distributions, patterns
□ Example: TPCH (next slide)
27
Data generation and testing
Felix Naumann Data Profiling Summer 2017
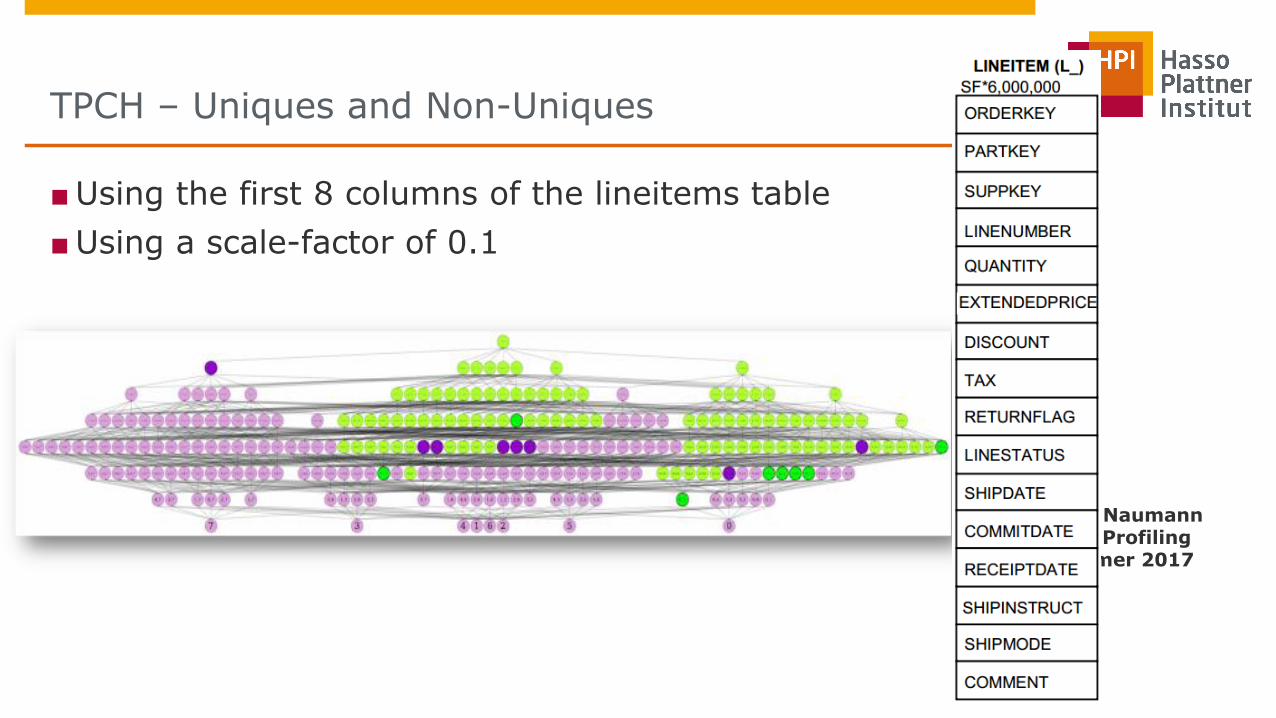
■Using the first 8 columns of the lineitems table
■Using a scale-factor of 0.1
28
TPCH – Uniques and Non-Uniques
Felix Naumann Data Profiling Summer 2017
■ Define data
□ Data generation
□ Real-world dataset(s)
□ Different scale-factors: Rows and columns
■ Define tasks
□ Individual tasks
□ Sets of tasks
■ Define measures
□ Speed
□ Speed/cost
□ Minimum hardware requirements
□ Accuracy for approximate approaches 29
Goal: Data profiling benchmark
Felix Naumann Data Profiling Summer 2017
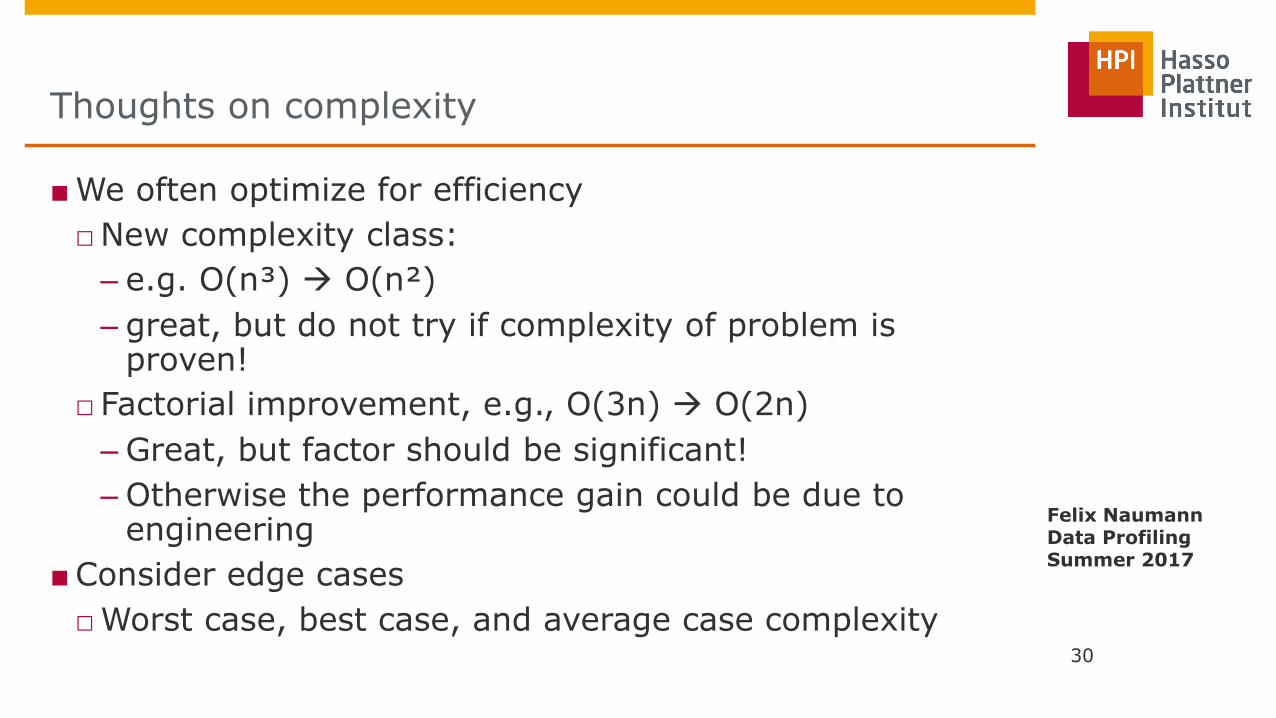
■We often optimize for efficiency
□New complexity class:
– e.g. O(n³) O(n²)
– great, but do not try if complexity of problem is proven!
□ Factorial improvement, e.g., O(3n) O(2n)
– Great, but factor should be significant!
–Otherwise the performance gain could be due to engineering
■Consider edge cases
□Worst case, best case, and average case complexity 30
Thoughts on complexity
Felix Naumann Data Profiling Summer 2017
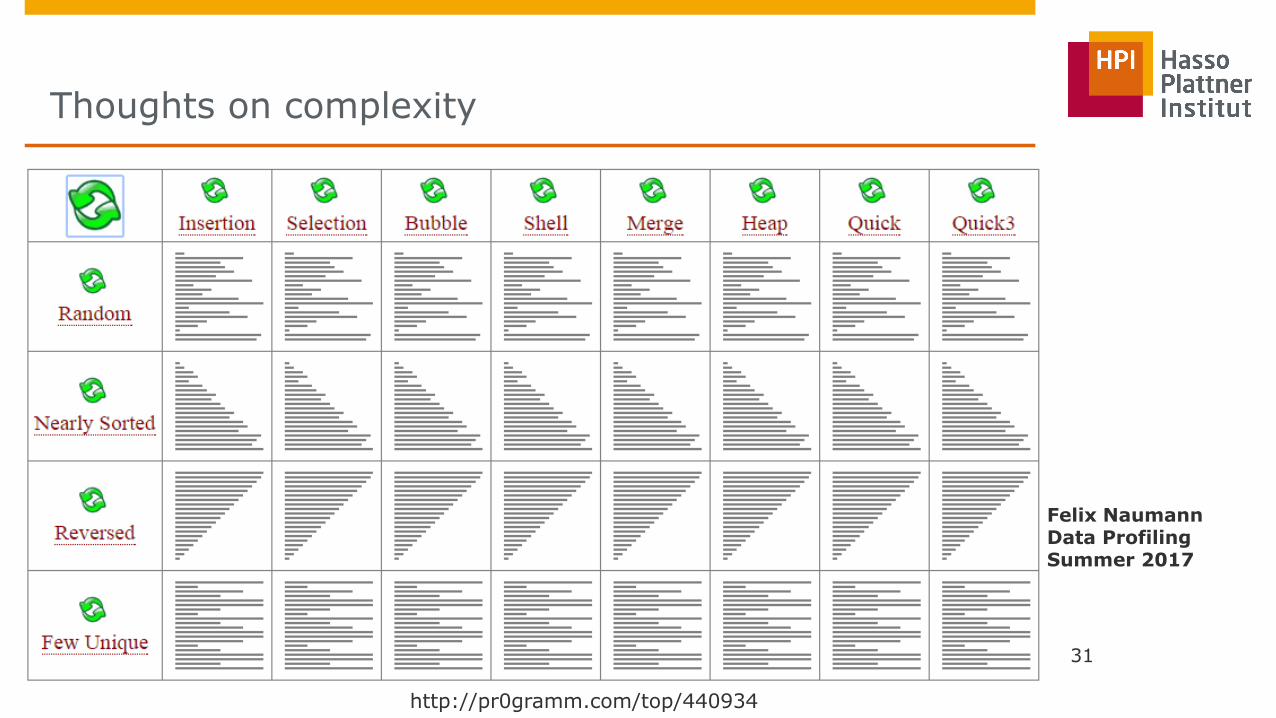
http://pr0gramm.com/top/440934
31
Thoughts on complexity
Felix Naumann Data Profiling Summer 2017
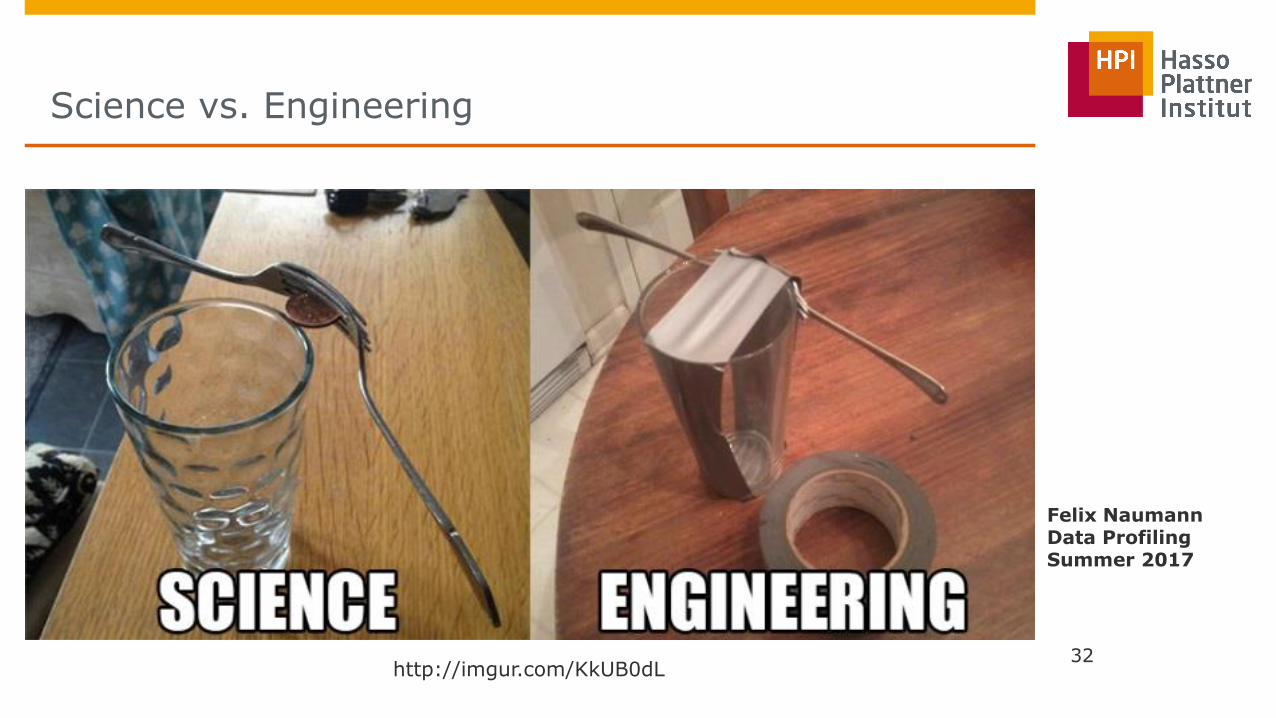
http://imgur.com/KkUB0dL 32
Science vs. Engineering
Felix Naumann Data Profiling Summer 2017
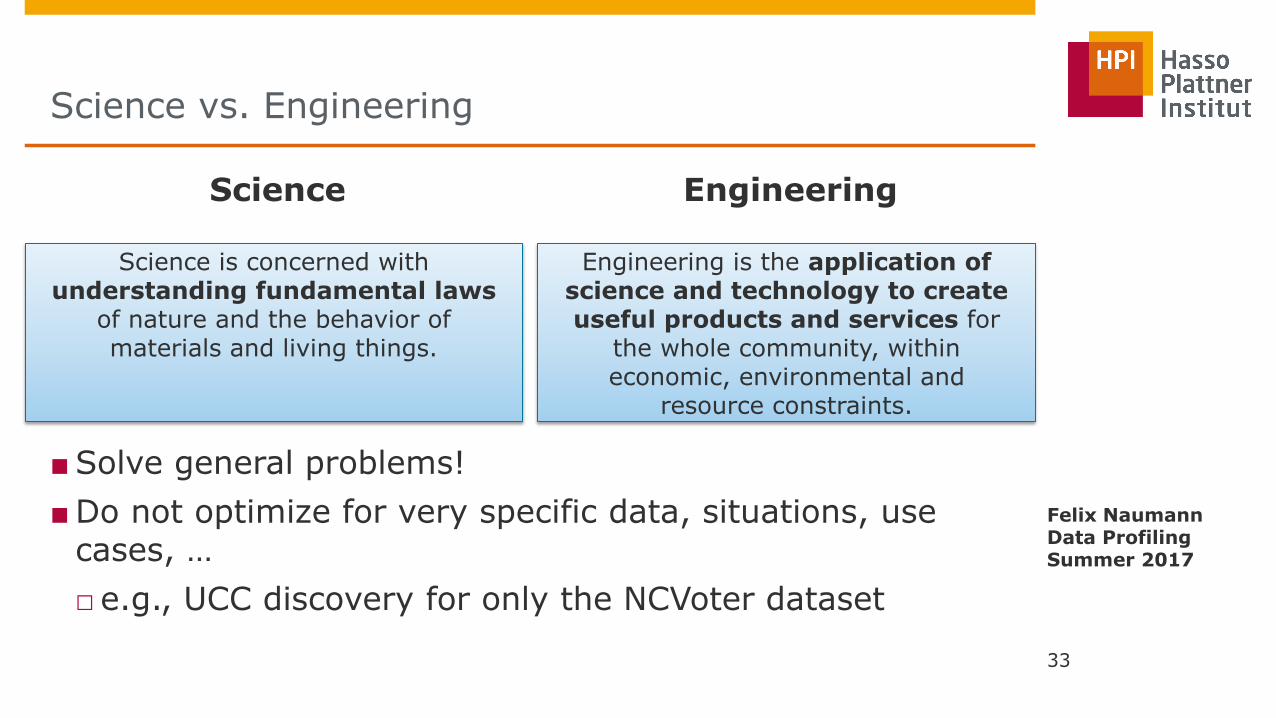
Science Engineering
Science is concerned with understanding fundamental laws
of nature and the behavior of materials and living things.
Engineering is the application of science and technology to create useful products and services for
the whole community, within economic, environmental and
resource constraints.
■Solve general problems!
■Do not optimize for very specific data, situations, use cases, …
□ e.g., UCC discovery for only the NCVoter dataset
33
Science vs. Engineering
Felix Naumann Data Profiling Summer 2017