Data preparation and management: Module 10; Quantitative
84
10 Module UNESCO International Institute for Educational Planning Andreas Schleicher and Mioko Saito Data preparation and management Quantitative research methods in educational planning Series editor: Kenneth N.Ross
Transcript of Data preparation and management: Module 10; Quantitative

10Module
UNESCO International Institute for Educational Planning
Andreas Schleicher and Mioko Saito
Data preparation and management
Quantitative research methods in educational planning
Series editor: Kenneth N.Ross

International Institute for Educational Planning/UNESCO7-9 rue Eugène-Delacroix, 75116 Paris, FranceTel: (33 1) 45 03 77 00Fax: (33 1 ) 40 72 83 66e-mail: [email protected] web site: http://www.unesco.org/iiep
The designations employed and the presentation of material throughout the publication do not imply the expression of any opinion whatsoever on the part of UNESCO concerning the legal status of any country, territory, city or area or of its authorities, or concerning its frontiers or boundaries.
All rights reserved. No part of this publication may be reproduced, stored in a retrieval system, or transmitted in any form or by any means: electronic, magnetic tape, mechanical, photocopying, recording or otherwise, without permission in writing from UNESCO (International Institute for Educational Planning).
Graphic design: Sabine LebeauTypesetting: Sabine LebeauPrinted in IIEP’s printshop
September 2005 © UNESCO
Quantitative research methods in educational planning
These modules were prepared by IIEP staff and consultants to be used in training workshops presented for the National Research Coordinators who are responsible for the educational policy research programme conducted by the Southern and Eastern Africa Consortium for Monitoring Educational Quality (SACMEQ).
The publication is available from the following two Internet Websites:http://www.sacmeq.org and http://www.unesco.org/iiep.

Data preparation and managementModule 10
Content
1
1. Introduction 1Professional data management as an essential component of educational surveys 1
Other related documentation 4
2. An overview of data management for educational survey research 5Integrating data management into the survey design 5
Setting-up a data management plan 6
Taking account of the data collection instruments 7
Taking account of field operations 8
The preparation of school and student record forms 9
1. School record forms 9
2. Student record forms 10
3. Planning coding and data entry 10
3. Data management and quality control 12Common errors during data preparation 13
Preparation of a codebook 15
1. Datafiles, records, and variables 15
2. Identification, data, and control variables 16
The purpose and use of a codebook 17

Data preparation and managementModule 10
II
4. The preparation of a codebook 20Elements in codebook 20
1. Codebook information for the school identification code 20
2. Codebook information for the student identification code 23
3. Codebook information for question 1: student sex 23
4. Codebook information for question 2: student age 23
5. Codebook information for question 3: regularity of meals 24
6. Codebook information for question 4: availability of books 25
7. Codebook information for questions 5 and 6: books at home
and reading activities 25
8. Codebook information for question 7: student possessions 25
An example of a codebook listing 26
5. The data entry manager software system 30File construction 31
1. Specifying a filename 31
2. Defining the variables 31
3. Saving the electronic codebook 38
Coding of missing data 38
1. Key requirements 39
2. Basic categories of missing data 39
Data entry 43
1. Basic approaches to data entry 43
2. Using a text editor for data entry 44
3. Using a computer-controlled approach for data entry,
the dataentrymanager programme 47
WinDEM 50
1. Entering data 50
2. Reviewing your data 52

Content
III
6. Data verif ication 64Data verification steps 66
1. Verification of file integrity 67
2. Special recodings 68
3. Value validation 68
4. Treatment of duplicate identification codes 69
5. Internal validation of an hierarchical identification system 69
6. Verification of the linkages between datafiles 69
7. Verification of participation indicator variables against data variables 70
8. Verification of exclusions of respondents 71
9. Checking for inconsistencies in the data 71
Data verification procedures using WinDEM 74
1. Unique ID check 74
2. Column check 74
3. Validation check 74
4. Merge check 75
5. Double coding check 75
7. Database construction and database management 76
8. Conclusion 78

1
Introduction
Professional data management as an essential component of educational surveysWhenever data are collected in educational survey research studies, two problems are often found at the data preparation phase. First, errors can be introduced in the entry of data into computers and as a result some data collections provide inaccurate and faulty results. Second, the computer entry and cleaning of data prior to the main data analyses can be extremely time consuming and therefore this information can rapidly become “out of date” and consequently lose its value to policy-makers.
The root causes of these two problems of “accuracy” and “timeliness” are sometimes associated with the selection of inappropriate research designs or the use of research designs that are not manageable within prevailing economic, administrative and socio-cultural constraints. In other cases, these two problems arise from the lack of a systematic analysis of decision-making requirements that can cause too many data of limited use to be collected.
Unfortunately, in many cases, a study is successful in addressing the need for appropriate research design and the data identification of required to be collected, but breaks down when the data reach head office. For example, a high quality data collection in the
1

Data preparation and management
2
Module 10 Introduction
3
field can be ruined when: (a) coding and data entry teams are insufficiently trained or supervised; (b) coding instructions and codebook specifications are incomplete or inadequate; or (c) the database management is inappropriate so that information is lost, composite variables are created incorrectly, data are used at the wrong level of analysis, or no attention is given to “adjusting” estimates for the structure of the sample design used.
The issues presented above illustrate the need for a great deal of thought to be given to the management of data prior to the commencement of an educational survey research study. In particular, close attention must be given to: (a) the type of data collected, (b) the data collection methods, (c) the design of data collection instruments, and (d) the administrative procedures and field operations.
In addition, adequate field monitoring and survey tracking instruments must be prepared, and good data entry and data verification procedures must be developed to implement these standards. Finally the organization of the data into adequate data structures is required in order to facilitate the manipulation, analysis, and reporting of information.
The following discussion places the spotlight on the broad field of “data management” for many issues related to the planning of large-scale educational survey research studies. In these studies, data may be collected from thousands of students selected by using quite complex sample designs. The discussion has been extended to cover the situation where data have been collected at different “levels” (for example, students, teachers, schools) and therefore may need to be merged, aggregated, and disaggregated prior to the main data analyses.

Data preparation and management
2
Module 10 Introduction
3
Scope and structureThere are several key steps in data management that are required to ensure that the quality of collected data is adequate, that data are turned into useful information, and that the more common data management problems are avoided. These steps include: (a) elaboration of data management issues during the preparation of the survey design, (b) setting data quality standards and the establishment of quality control mechanisms, (c) preparation of codebooks; (d) data coding and data entry in computer-readable format, (e) verification of data; and (f) database design and database management.
Data management issues will be addressed in the following discussion from a conceptual point of view and also through a set of worked examples that lead step by step towards solving frequently-occurring problems in data management. Several examples have been presented to illustrate three of the most frequently collected types of quantitative educational research data: (a) achievement tests with multiple-choice or pre-coded free response items, (b) questionnaire data, and (c) numerical measurements.
The discussion commences with an analysis of those aspects of data management that need to be addressed in the initial phases of the design of an educational survey. This is accompanied by an analysis of approaches to the establishment of data quality standards and mechanisms of quality control. The chapter then deals with how to transform answers given to questions and achievement test items into numerical codes that a computer can interpret, and how to represent the data from questionnaires or achievement tests in a datafile so that they can be processed and analyzed by a computer. The chapter concludes with an examination of data entry and verification procedures, followed by a brief overview of procedures for organizing information into database systems.

Data preparation and management
4
Module 10
5
Other related documentationSome of the examples given below are concerned with the entry, editing, and verification of data through the use of a software system for data management called the Windows DataEntryManager (WinDEM) program. A special version of this program is available from the IEA. This software has easy-to-learn features and comes with integrated file management and reporting capabilities. Using this programme, the deviation of data values from pre-specified validation criteria or data verification rules can be detected quickly, thereby allowing the user to correct errors shortly after the original survey materials arrive at the survey office. The manual for the WinDEM programme describes how to create new datafiles or to modify the structure of existing datafiles, and how to change coding schemes and range validation criteria for variables. The manual also contains an interactive tutorial through which the user can learn how to transform a questionnaire into an electronic codebook, how to set up a datafile, how to enter data into this datafile, and how to make backup copies of data on diskettes.

Data preparation and management
4
Module 10
5
An overview of data management for educational survey research
Integrating data management into the survey designOften researchers start to solve data management issues only after the field administration has been completed and the completed survey instruments have been returned. In these cases, the data management plan is prepared after the field administration has been completed and usually only involves data entry, data verification, and data analysis. However, in order to avoid unexpected problems, unnecessary corrective steps, and delays in data verification and data analysis, it is important to take data management issues into account during all phases of the research project.
From the very beginning of a survey, the following issues should be considered: (a) the type of data collected; (b) the data collection methods; (c) the design of the data collection instruments in terms of the development of coding rules and coding instructions; (d) the design of the administrative procedures including field monitoring and instrument receipt control; (e) the data entry and the type of data verification procedures required; (f) the timing and deadlines; (g) the data processing environment; and (h) the database design. It is therefore important that staff responsible for managing
2

6
Data preparation and managementModule 10
7
An overview of data management for educational survey research
educational survey research data by using computers are consulted from the very beginning of a study on all issues involving costs, administrative and practical constraints, timelines and needed technical/personnel resources.
Setting-up a data management planIn the planning stage of a survey a detailed “data management plan” needs to be developed which recognizes that action will be required with respect to four major components.
First, the resources required for field operations, data entry, and data processing generally depend on the sample size that is to be used. In situations where there are severe constraints on resources, this will often require trade-offs to be made concerning various factors which influence the quality with which the survey can be carried out.
Second, the procedures for coding and data entry will depend to a great extent on the types of response required of the questions in the data collection instruments.
Third, the establishment of identification codes for data collection instruments depends upon the units of sampling and the units of analyses that are to be used. The resource implications required to establish linkages between information gathered from different units (for example: school heads, teachers, and students) is a point that also needs to be considered.
Finally, the complexity of data verification procedures depends on the nature of the response patterns in the data collection instruments. Special care needs to be taken in dealing with “filter” or “branching” questions because these can lead to substantial inconsistencies in responses which must then be dealt with during the analysis of the data.
6
Data preparation and managementModule 10
7
An overview of data management for educational survey research
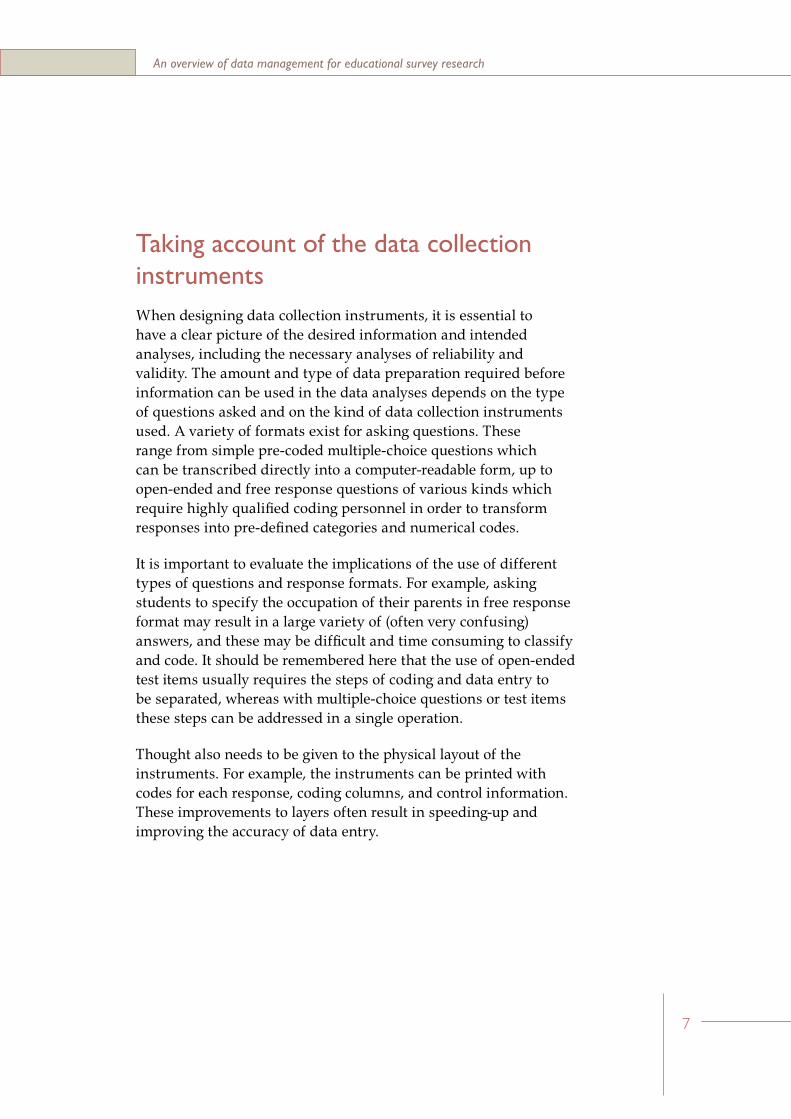
Taking account of the data collection instrumentsWhen designing data collection instruments, it is essential to have a clear picture of the desired information and intended analyses, including the necessary analyses of reliability and validity. The amount and type of data preparation required before information can be used in the data analyses depends on the type of questions asked and on the kind of data collection instruments used. A variety of formats exist for asking questions. These range from simple pre-coded multiple-choice questions which can be transcribed directly into a computer-readable form, up to open-ended and free response questions of various kinds which require highly qualified coding personnel in order to transform responses into pre-defined categories and numerical codes.
It is important to evaluate the implications of the use of different types of questions and response formats. For example, asking students to specify the occupation of their parents in free response format may result in a large variety of (often very confusing) answers, and these may be difficult and time consuming to classify and code. It should be remembered here that the use of open-ended test items usually requires the steps of coding and data entry to be separated, whereas with multiple-choice questions or test items these steps can be addressed in a single operation.
Thought also needs to be given to the physical layout of the instruments. For example, the instruments can be printed with codes for each response, coding columns, and control information. These improvements to layers often result in speeding-up and improving the accuracy of data entry.

8
Data preparation and managementModule 10
9
An overview of data management for educational survey research
Taking account of field operationsThe integration of the procedures for the selection of a survey sample into the procedures for data management can often facilitate survey operations and reduce survey costs. For example, a list of selected sampling units based on a computerized sampling frame can be used to generate address labels, name-lists, and registration forms – all of which can be used for the purposes of instrument preparation, field monitoring, data entry, and data verification. The establishment of proper identification (ID) codes for schools, classes, teachers, and students is thereby critical, especially when the survey design requires the linkage of students to their schools, classes and teachers. The system for assigning these identification codes must ensure that students, teachers, classes, and schools are identified uniquely and that there is sufficient information that will permit verification to be made at the various stages of the survey.
In educational surveys involving different levels of data aggregation, it is often advantageous to identify respondents through a hierarchical compound numbering system. In such a numbering system the first section classifies respondents within the next higher level of aggregation and, at the same time, identifies respondents within the classification units. For example, students in a survey may be assigned School IDs, Class IDs, and Student IDs. The Class ID would consist of the School ID plus an identification of the class within the school, and the Student ID in turn could then consist of the Class ID plus an identification of the student within the class.
When such an identification system is used, the internal consistency of the identifications can be verified by computer and the probability of an incorrect identification of respondents can be reduced because, during data entry, these identification codes can be automatically cross-validated on the basis of their common parts. Such a system can, for example, help to ensure that student data is linked reliably to teacher and school data.

8
Data preparation and managementModule 10
9
An overview of data management for educational survey research
It is crucial that unique identification codes are assigned to students, teachers, and classes, and that these identification codes are carefully written onto all instruments that are prepared before the instruments are sent out. This should be supplemented by the use of survey tracking instruments by means of which respondents can be followed throughout survey.
The following illustration provides an example of the design of school and student record forms based on a two stage sample design in which first schools are selected and then intact classes are selected within schools.
The preparation of school and student record forms
1. School record forms
This form should include the following items: (i) the official identification number of the school, (ii) the name, full address, and telephone number of the school, (iii) the name and telephone number of the person co-ordinating the assessment in the school, (iv) the number of classes in the target population in the school, and (v) the number of students in the target population in the school.
Schools that, despite all efforts, do not co-operate in the assessment are often replaced with “similar” schools, for example, with schools of a similar type, size, location and context. This is accomplished through the association of each sampled school with a replacement school derived from a separately drawn replacement sample. Though the use of replacement schools should be discouraged because it may introduce a bias of unknown magnitude, it is important to ensure that if replacement schools are used, the school

10
Data preparation and managementModule 10
11
An overview of data management for educational survey research
record form allows the researcher to trace such schools and to identify schools as replacement schools.
2. Student record forms
For the selected schools, Student Record Forms should be prepared. These will be of critical importance in various phases of the field trial. In particular, they provide information relating to: (i) the identification of students, (ii) the checking of the age and sex of students, (iii) which test booklets should be given to which students, (iv) the participation status of students in the test and questionnaire administration, (v) the students who have been excluded from the testing, (vi) the instruments that have been lost, and (vii) the checking of instruments against persons.
3. Planning coding and data entry
Once the data collection instruments are finalized the codebook can be prepared. The codebook provides a comprehensive description of the contents and layout of the data that are entered into a computer for analysis.
The largest part of the data collection costs are often caused by the coding, entry, and verification of the data. Careful thought must therefore be given to the establishment of consistent coding schemes that are easy to apply and that cover the potential responses and different instances of missing data in an exhaustive and mutually exclusive way. It is important that there are enough personnel and enough technical resources in order to complete the entering and cleaning of the data in a timely fashion. What is especially important is that coders are well trained and that there is a head-coder to whom queries can be directed and who can decide what to do when there are problems with the coding.

10
Data preparation and managementModule 10
11
An overview of data management for educational survey research
Sometimes, the tasks of coding and data entry may be separated, especially where open-ended questions or test items are involved which require specially- trained personnel. For both coding and data entry, it is important to test all procedures on a sub-sample of questionnaires so that the researcher knows how much time will be required to complete this work.

Data preparation and managementModule 10
12 13
It is essential that, prior to the collection of data, a common framework of data management standards be agreed upon. Standards in this context comprise: (a) principles to which the results of data collections and data collection operations should conform, (b) measures by which the quality and accuracy of results and procedures can be judged, and (c) steps that must be undertaken to obtain adequate data in a timely manner.
The main reasons for establishing data management standards are to ensure the quality of the data, so as to guarantee the integrity of the data analyses, and to be confident of the adequacy of the results of these data analyses for answering the intended research and policy questions.
There are five main elements which must be addressed in order to ensure that data adheres to quality standards.
• A detailed prior analysis of potential fieldwork problems.
• The specification of data verification rules.
• Adequate training of field administrators.
• The implementation of quality standards during data verification.
Data management and quality control
3

Data preparation and managementModule 10
12 13
• The development of procedures for the analytical treatment and reporting of deviations from the quality standards.
The careful preparation of administrative procedures including manuals, survey tracking instruments, and identification systems are of critical importance for the verification of data quality standards.
Common errors during data preparationThe errors that can occur during data preparation are usually linked with the procedures adopted for instrument design, coding procedures, and the data collection and data entry methods. For example, the kinds of errors that occur when free response data are manually coded and transcribed into computer readable form differ from the kinds of errors that are likely to occur when data are entered directly into computers from machine-readable answer sheets. In the first situation, errors can occur when coders misread or misinterpret the answers of respondents, when coding rules are not correctly applied, or when the data are incorrectly transcribed, such as when data values are omitted, shifted or otherwise wrongly entered into the computer. For some of these problems it is often impossible to verify whether the errors have been caused by the respondent, during the field administration, the coding process, or during the data transcription.
The ten most common problems in terms of quality standards have been listed below:
• Respondents may have been assigned invalid or wrong identification codes either during instrument preparation, field administration or data transcription. This can lead to difficulties if later analyses require linkages between different respondents or between different levels of data aggregation.

14
Data preparation and managementModule 10
15
Data management and quality control
• Questions may have accidentally been misprinted due to technical or organizational imperfections, thereby preventing respondents from giving appropriate answers.
• Questions may have been skipped, or not reached, by the respondents either in a randomized fashion or in a systematic way which results in “gaps” in the data to misleading results.
• Respondents may give two or more responses when only one answer was allowed, or questions may have been answered in other unintended ways.
• Certain data values may not correspond to the coding specifications or range validation criteria.
• Answers to open-ended questions may contain outlier codes, that is, there may be respondents with codes which are improbably low or high even though they could be the valid answers.
• The values for certain data variables might not correspond to the values of certain control variables. (For example, the value of a control variable may state that a particular student did not respond to a particular question set, whereas the data variables for this question set indicate actual responses).
• Data from a respondent may contain inconsistent values. (That is, the values for two or more variables may not be in accord).
• Inconsistencies between data values from different respondents which belong to a certain group may occur for questions which are related to this group. (For example, for students in the same class there may be different values for variables which are related to the class).
• Inconsistencies may also occur between data values of different but related datafiles or levels of aggregation.

14
Data preparation and managementModule 10
15
Data management and quality control
Preparation of a codebook
1. Datafiles, records, and variables
Data are stored in computers in the form of units called datafiles. In general terms, a datafile can be described as a collection of related information. For example, a datafile can contain a number that identifies each member of a sample of students and gives the student responses for each item of an achievement test, and, in addition, provides descriptive background information for each student. Each datafile is referenced by a unique filename.
The most common form of a datafile is an ASCII raw datafile. In such a datafile, data are stored in fixed form ASCII format where ASCII refers to the American Standard Code for Information Interchange. (If you use a computer other than a Personal Computer then other interchange format standards may be used which can usually be transformed into ASCII files). Fixed format implies that the data for each piece of information are recorded in the same columns of a datafile for each respondent. In a raw datafile the different pieces of information are represented next to each other (in columns) and respondents are represented below each other (in rows).
Most statistical data analysis systems can read and process raw datafiles. The user of these systems must “tell the system” in which location and in which format the data have been written. To simplify this process, many statistical data analysis systems employ their own system file format in which the data and all the technical information concerning the file structure, the data format, and the coding schemes are integrated. However, these system files can usually only be used with a specific software system and therefore are often not suitable for data transfer between different software systems.

16
Data preparation and managementModule 10
17
Data management and quality control
Each respondent is represented in the datafile through one or more records which comprise all of the data associated with the respondent. A record is usually represented as a single line in a raw datafile.
Each record in a datafile contains different categories of information, for example, the student identification codes, the student answers on the first test item, the student answers on the second test item, and so on. Each of these categories of information is represented in the computer by a variable. It is useful to distinguish between identification variables, data variables, and control variables. Each variable is referred to by a variable name.
2. Identification, data, and control variables
Each respondent described in a datafile should be uniquely identified so that it is possible to distinguish respondents in later analyses. For example, in order to calculate school mean scores of student achievement, it is necessary to be able to identify which school a mean score refers to. To accomplish this, a special set of variables are defined in the codebook which provide a unique identification for each respondent from whom information has been collected. These variables are referred to as identification variables. In cases where data are collected on several hierarchically related levels (for example, students, classes, and schools), the identification of each level of aggregation should be defined as a separate variable so that in later analyses the connection between successive levels of the hierarchy can easily be established. In a hierarchical system the Class ID could for example consist of the School ID plus a sequential number of the class within the school and the Student ID could consist of the Class ID plus a sequential number of the student within the class (see also above).
The variables containing the actual responses from the respondents are referred to as data variables.

16
Data preparation and managementModule 10
17
Data management and quality control
Errors often occur during the entry of data into a computer when a number of variables have possible values within the same range and, at the same time, they appear in a sequence or are coded in a continuous string. These variables take values within the same range and therefore this leads to greater potential for column shifts. To guard against this type of error it is often useful to insert, at certain positions in the datafile, variables for which a certain fixed value (for example, a blank space) must be specified. Similarly, it is often useful to introduce variables that indicate the participation status of the respondent or that indicate reasons for excluding a respondent from the assessment. Variables that do not represent data from the respondents but that are introduced for checking purposes are usually referred to as control variables.
The purpose and use of a codebookAfter the data collection instruments have been returned by the respondents, the responses must be entered into a datafile. In order to be useable in computer-based data analyses, these responses need to be transformed into numeric or alphanumeric codes. This is usually achieved by having each response associated with a well defined numerical code, that is usually represented by a fixed number of digits. For each possible response there should therefore be one, and only one, code. Questions for which more than one response can be given must be split into several variables, each corresponding to one response option.
Detailed instructions must be specified describing how data must be coded and how resultant codes are stored in computer readable form. The document providing these instructions is usually referred to as the codebook.
This codebook should be prepared in a standardized way, using defined naming, layout, and structural conventions. Some

18
Data preparation and managementModule 10
19
Data management and quality control
important pieces of information which the codebook should contain have been listed below:
• The codebook should contain an accurate reproduction of each question, including the identification of the question and its sequential number and/or position in the instrument.
• Each variable should be identified by a unique variable name. Multiple or split variables referring to the same question should be indicated as such, through a common stem in the variable names. It is advantageous if the variable names contain classificatory elements which, for example, may allow the identification of the population, the type of respondent, the kind of question, and the response type from the variable name. Note that most software packages for data analysis impose certain restrictions on the variable names.
There are four restrictions that apply to most standard software packages: (i) variable names should have a maximum length of 8 characters, (ii) the first character should be a letter but later characters can be letters, numbers, or underscores, (iii) blanks should not be included within variable names, and (iv) variable names should not contain special characters except for the underscore.
• Since the variable name can only include a limited amount of information in highly condensed form, each variable name should be supplemented by a descriptive label which indicates the content and/or classification categories of the variable.
• For each pre-coded question there must be a list of all possible answers along with the definition of the corresponding codes that are assigned to each of these answers. (Free response questions require scoring rules and classification schemes which assign data-values to defined categories).

18
Data preparation and managementModule 10
19
Data management and quality control
• The location and format of the data representation in the computer needs to be defined. (Codes are often represented in the form of fixed-form integers, rationales, or exponentials).
• If a computer system is used for data transcription, then the codebook should describe where on the screen the data have to be entered and how the data values can be accessed.
• The codebook should contain a description of the validation criteria and data verification rules that are associated with the corresponding variables, a list of the codes that are used to indicate the various instances of missing data, and instructions on how missing data are coded.
• The codebook may be supplemented with information useful to the researcher analyzing the data, e.g. information concerning the scale-type or measurement class of the variables.
As the proper analytical use of data will depend on appropriate coding, the coding must be completed according to the information in the codebook. It is therefore necessary that general rules concerning the coding and entry of data are clear to the coders before they start entering data.
It is advisable to implement certain redundancy checks in the coding of responses which can be used for later data verification purposes. For example, a variable which indicates whether a respondent was administered a particular questionnaire or test can be used to indicate whether missing data for this questionnaire or test means that the respondent was not administered the test or else took the test but did not respond to it.

Data preparation and managementModule 10
20 21
In the following discussion, an example in the preparation of a codebook has been illustrated for a short hypothetical questionnaire.
In preparing the codebook it is often useful to start with the identification variables and then to continue with the data variables in the same sequence as they appear in the tests or questionnaires so that the coders can proceed with the coding in the same sequence in which they read the data collection instruments. In the following example we will start the specification of the codebook with the school identification code which is presented in the header of the questionnaire.
Elements in codebook
1. Codebook information for the school identification code
• Variable Name: Each variable must be identified by a unique variable name. In this example the school identification variable has been given the name IDSCHOOL.
• Variable Type: The type of coding that is used for the variable must now be defined. Usually a distinction is made between alphanumeric variables which are treated as categorical data and open-ended numerical codes which are treated as
The preparation of a codebook
4

Data preparation and managementModule 10
20 21
numbers. Sometimes also a distinction between different types of numerical codes is made. Identification variables always have categorical codes but we can choose between an alpha or a numeric data representation.
• Variable Length and Recording Positions: The number of digits (including decimal places) which are required to code the data values of this variable and the positions in the datafile must then be specified. Starting the datafile with the school identification code we will put this into the columns 1-3 of the raw datafile.
• Number of Decimal Places: Where decimals are used in data codes it is necessary to specify how many decimal places are used. For the school identification code there will be no decimal places.
• Instrument Location: The codebook should also tell the coders about the location of information in the data collection instruments. For example, the coders should be informed that they will find school identification codes in the headers of assigned questionnaires.
• Variable Label: A brief descriptive label should be assigned to the variable that can help later users of the programme to remember what the short variable name stands for.
• Coding Scheme: For categorical variables it is necessary to specify the code for each possible category. In addition, for all types of variables it is necessary to specify the codes associated with frequently-occurred data (such as missing, not administered, not reached, etc.).
• Range Validation Criteria: It is often useful to specify a valid range for the variable that determines which data values the user is allowed to enter into the computer. Such range validation criteria may take the form of a simple set of allowed codes or they may have a complex structure, relating the codes to responses to other questions or the responses of other respondents.

22
Data preparation and managementModule 10
23
The preparation of a codebook
School identification code — — —Student identification code — — — — —
1. Are you a boy or a girl? (Tick one number)
Boy .............................................. 1 Girl .............................................. 2
2. How old are you? (Put in your age in years)
....................................................... years
3. How often do you eat each of the following meals? (Tick one number on each line)
Not at all
1 or 2 times a week
3 or 4 times a week
Every day
(a) Morning meal 1 2 3 4(b) Lunch 1 2 3 4(c) Evening meal 1 2 3 4
4. Are there any books where you live that you could read which are not your school books? (Tick one number)
Yes .............................................. 1 No .............................................. 2 If “No”, go to question 6.
5. If “Yes”, how often do you read these books? (Tick one number)
Always .......................................... 3 Sometimes................................... 2Never............................................ 1
6. If “Yes”, how many books are there in your home? (Tick one number)
None............................................. 11 to 10 books ............................. 211 to 50 books ........................... 3 More than 50 books ................. 4
7. Do you have the following things in your home? (Tick one number on each line)
Do not have this Have one or more
(a) Radio 0 1(b) TV 0 1(c) Table to Write on 0 1(d) Bicycle 0 1(e) Electricity 0 1(f) Running Water 0 1(g) Daily Newspaper 0 1
FIGURE 1 Hypothetical questionnaire

22
Data preparation and managementModule 10
23
The preparation of a codebook
2. Codebook information for the student identification code
The definition of the student identification code in the sample questionnaire is similar to the definition of the school identification code, except that a five-digit number should be used. With the school identification code occupying columns 1-3 in the datafile, the positions 4-8 could be allocated to the student identification code. We will give this variable the name IDSTUDENT.
3. Codebook information for question 1: student sex
The first question in the sample questionnaire asks for the student’s sex. This question can be represented by the variable SSEX. This variable has a fixed set of categorical codes, namely “1” for “boy”, “2” for “girl”. The code “9” can be used to indicate missing data, and the code “8” to indicate that the student was not administered this question in the sample questionnaire. We therefore specify a categorical variable type. The length of the code is 1 character and there are no decimals. Since this question is the first question in the sample questionnaire, “Question 1” can be given for the instrument location. An appropriate variable label would be “Student sex”. For each valid data code a brief description is provided that indicates the meaning of the codes. These descriptions are usually referred to as value labels. The code “1” may be selected to specify “boy” and “2” to specify “girl”. The position of the code for the student sex in the raw datafile would be column 9.
4. Codebook information for question 2: student age
The next variable in the codebook describes age in years. This variable can be represented by “SAGEY” for the variable name. Since students are requested to enter their age as an open-ended

24
Data preparation and managementModule 10
25
The preparation of a codebook
number, the code for this variable is open-ended and therefore it is necessary to specify an open-ended numerical variable type. The length is two characters in this case and there are no decimals. For the instrument location “Question 2” may be specified, and “Student age in years” for the variable label. A value of “99” can be used for the “missing” code and “98” for the “not administered” code. Assuming that the age of the students in the sample ranges between 8 and 16 years, values of “8” and “16” specify the extremes of the valid range. The position of the code for the student age in the raw datafile would be columns 10-11.
5. Codebook information for question 3: regularity of meals
In the instructions to this question the student is asked to provide three answers, one concerning the morning meal, the second concerning lunch, and the third concerning the evening meal. Since each variable can contain only one data value, it is necessary to represent this question by three separate variables with the names of: SMEALA, SMEALB, and SMEALC. These variables have a fixed set of categorical codes, namely “1” for “not at all”, “2” for “1 or 2 times a week”, “3” for “3 or 4 times a week”, “4” for “every day”, with “9” being used to indicate “missing” data, and “8” being used to indicate that the student was not administered this question. The code for this variable is a categorical type, a length of one character, and no decimals. “Question 3a”, “Question 3b”, and “Question 3c” are specified, respectively, for instrument locations, and the variable labels are “Frequency of meals/morning meals”, “Frequency of meals/lunch”, and “Frequency of meals/evening meals”, respectively. The valid data are 1, 2, 3, and 4 and for the corresponding value labels are “not at all”, “1 or 2 times a week”, “3 or 4 times a week”, and “every day” according to the instructions in the questionnaires. The position of the codes for the three variables on the regularity of meals in the raw datafile would be columns 12, 13, and 14.

24
Data preparation and managementModule 10
25
The preparation of a codebook
6. Codebook information for question 4: availability of books
Question 4 asks about the availability of books and may be allocated the name of SBOOKAV. Note that the responses that follow this question will depend on the answer to this question. Such variables are described as filter variables. The position of the code for the question on availability of books would be column 15.
7. Codebook information for questions 5 and 6: books at home and reading activities
Questions 5 and 6 are related to the number of books and the reading activities of the students. The answers to these questions depend on the answer to question 4. The coding is similar to the coding of question 1 with variable names of SBOOKRD and SBOOKS. The position of the code for the questions on the number of books at home and the reading activities would be columns 16 and 17. However, if the student answers “No” to Question 4, the coding for Questions 5 should be specially assigned (for the special reason of “missing”), and the coding for Question 6 should automatically become “1”.
8. Codebook information for question 7: student possessions
Question 7 is again a “split” question which asks the student about home possessions. The coding is similar to question 3 except that there are now 7 distinct variables – each of which has valid data codes of 0 and 1. The variable names are SPOSSA, SPOSSB, SPOSSC, SPOSSD, SPOSSE, SPOSSF, and SPOSSG. The position of the code for the questions on student possessions would be columns 18, 19, 20, 21, 22, 23, and 24.

26
Data preparation and managementModule 10
27
The preparation of a codebook
An example of a codebook listingIn Figure 2, the codebook for the hypothetical questionnaire has been presented. This codebook was prepared as output from the DataEntryManagement (WinDEM) software when applied to the questionnaire presented in Figure 1. The different pieces of information contained in this hypothetical codebook are described below:
• The first column in the codebook (Var. No.) presents a sequential number for each variable in the Reading Literacy Codebook;
• The second column (Quest. No.) presents an identification of the background question and its location in the instruments;
• The third column (Variable Name) presents the variable name;
• The fourth column (Variable Label) presents the variable label;
• The fifth column (Code R:Recode) presents the codes for the responses, and the recodes for variables for which recoding is necessary and where recoding is not covered by the general notes on recoding. Whenever actual numerical data are supplied in the response to the questions, this is indicated by the keyword “VALUE”. The missing-code presented in the codebook indicates “missing/non-response” values. The “not administered” code presented in the codebook indicates “not administered” values;
• The sixth column (Option) presents the response phrase (or an abbreviation of it) that corresponds to the code. For variables that contain actual numeric data, it contains an explanation and the permitted range of the value to be entered;

26
Data preparation and managementModule 10
27
The preparation of a codebook
• The seventh column (Location/Format) presents the location and format of the variable in the raw datafile. A variables format is the pattern used to write each value of the variable. It consists of the variable type, the first column in the raw datafile that is assigned to the variable, the last column the variable occupies in the raw datafile, and the length and the number of decimal places. In the seventh column of the codebook the first two numbers refer to the position of the first and last digit of the value of a variable within a record. “C” and “N” indicate the variable type (where N refers to “non-categorical” or open-ended numeric variables and C refers to “categorical” alpha-numeric values). The third number refers to the length (where the numeric code refers to the length of the value and the number of decimal places associated with the values) of each variable.

28
Data preparation and managementModule 10
29
The preparation of a codebook
Var. Variable Code No. Question Name Variable Label R:Recode Option Location/Format1 SCHOOL ID IDSCHOOL SCHOOL IDENTIFICATION CODE 999 missing 1- 3/N 3.0 998 not admin.
VLD: (IDSCHOOL>=1.AND.IDSCHOOL<=150).OR.IDSCHOOL=999.OR. Flags: SCR: 1 / CAR:YES / CAT:D / DEF:
2 STUDENT ID IDSTUD STUDENT IDENTIFICATION CODE 99999 missing 4- 8/N 5.0 99998 not admin.
VLD: (IDSTUD>=1.AND.IDSTUD<=50000).OR.IDSTUD=99999.OR.ID FLAGS: SCR: 2 / CAR:No / CAT:D / DEF:
3 QUEST 1 SSEX STUDENT’S GENDER 1 boy 9 /C 1.0 2 girl 9 missing 8 not admin.
VLD: SSEX$’1298’ Flags: SCR: 3 / CAR:No / CAT:B / DEF: 9
4 QUEST 2 SAGEY STUDENT AGE IN YEARS 99 missing 10- 11/N 2.0 98 not admin.
VLD: (SAGEY>=8.AND.SAGEY<=16).OR.SAGEY=99.OR.SAGEY=98 Flags: SCR: 4 / CAR:No / CAT:B / DEF:
5 QUEST 3A SMEALA FREQUENCY OF MEALS / MORNING MEALS 1 not at all 12 /C 1.0 2 1 or 2 times a week 3 3 or 4 times a week 4 every day 9 missing 8 not admin.
VLD: SMEALA$’123498’ Flags: SCR: 5 / CAR:No / CAT:B / DEF: 9
6 QUEST 3B SMEALB FREQUENCY OF MEALS / LUNCH 1 not at all 13 /C 1.0 2 1 or 2 times a week 3 3 or 4 times a week 4 every day 9 missing 8 not admin.
VLD: SMEALB$’123498’ Flags: SCR: 6 / CAR:No / CAT:B / DEF: 9
7 QUEST 3C SMEALC FREQUENCY OF MEALS / EVENING MEALS 1 not at all 14 /C 1.0 2 1 or 2 times a week 3 3 or 4 times a week 4 every day 9 missing 8 not admin.
VLD: SMEALC$’123498’ Flags: SCR: 7 / CAR:No / CAT:B / DEF: 9
8 QUEST 4 BOOKAV AVAILABILITY OF BOOKS 1 No 15 /C 1.0 2 Yes 9 missing 8 not admin.
VLD: BOOKAV$’1298’ Flags: SCR: 8 / CAR:No / CAT:B / DEF: 9
FIGURE 2 Codebook for the hypothetical questionnaire
Codebook, Date 13.07.94 File: SAMPLE1.SDB

28
Data preparation and managementModule 10
29
The preparation of a codebook
Var. Variable Code No. Question Name Variable Label R:Recode Option Location/Format9 QUEST 5 BOOKRD READING FREQUENCY 1 Never 16 /C 1.0 2 Sometimes 3 Always 9 missing 8 not admin.
VLD: BOOKRD$’12398’ Flags: SCR: 9 / CAR:No / CAT:B / DEF: 9
10 QUEST 6 SBOOKS NUMBER OF BOOKS AT HOME 1 none 17 /C 1.0 2 1 to 10 books 3 11 to 50 books 4 more than 50 books 9 missing 8 not admin.
VLD: SBOOKS$’123498’ Flags: SCR: 10 / CAR:No / CAT:B / DEF: 9
11 QUEST 7A SPOSSA HOME POSSESSIONS / RADIO 0 do not have this 18 /C 1.0 1 have one or more 9 missing 8 not admin.
VLD: SPOSSA$’0198’ Flags: SCR: 11 / CAR:No / CAT:B / DEF: 9
12 QUEST 7B SPOSSB HOME POSSESSIONS / TV 0 do not have this 19 /C 1.0 1 have one or more 9 missing 8 not admin.
VLD: SPOSSB$’0198’ Flags: SCR: 12 / CAR:No / CAT:B / DEF: 9
13 QUEST 7C SPOSSC HOME POSSESSIONS / TABLE TO WRITE ON 0 do not have this 20 /C 1.0 1 have one or more 9 missing 8 not admin.
VLD: SPOSSC$’0198’ Flags: SCR: 13 / CAR:No / CAT:B / DEF: 9
14 QUEST 7D SPOSSD HOME POSSESSIONS / BICYCLE 0 do not have this 21 /C 1.0 1 have one or more 9 missing 8 not admin.
VLD: SPOSSD$’0198’ Flags: SCR: 14 / CAR:No / CAT:B / DEF: 9
15 QUEST 7E SPOSSE HOME POSSESSIONS / ELECTRICITY 0 do not have this 22 /C 1.0 1 have one or more 9 missing 8 not admin.
VLD: SPOSSE$’0198’ Flags: SCR: 15 / CAR:No / CAT:B / DEF: 9
16 QUEST 7F SPOSSF HOME POSSESSIONS / RUNNING WATER 0 do not have this 23 /C 1.0 1 have one or more 9 missing 8 not admin.
VLD: SPOSSF$’0198’ Flags: SCR: 16 / CAR:No / CAT:B / DEF: 9
17 QUEST 7G SPOSSG HOME POSSESSIONS / DAILY NEWSPAPER 0 do not have this 24 /C 1.0 1 have one or more 9 missing 8 not admin.
VLD: SPOSSG$’0198’ Flags: SCR: 17 / CAR:No / CAT:B / DEF: 9

Data preparation and managementModule 10
30 31
There are software systems which allow one to create a codebook in an interactive way. The following discussion covers this step-by-step process using the WinDEM programme provided by the IEA (for more detailed information, refer to the programme manual of the WinDEM programme).
For each data file which you create with the WinDEM programme, the programme maintains an electronic codebook which contains all technical information required to define the file structure, the coding scheme, the data verification rules, and quality standards for the datafile. Whenever variables are modified, the programme updates the electronic codebook automatically.
To illustrate the operations of the WinDEM software, consider the preparation of a datafile that can hold the data from the sample questionnaire in Figure 1. This will require the following three steps: creating a new datafile, defining the variables to be included in the datafile, and saving the resulting electronic codebook. Each of these steps requires the user to provide input to the WinDEM programme through a series of questions and prompts. In the following discussion an example of this process has been presented along with a listing of the “dialogue” that occurs between the user and the computer.
The data entry manager software system
5

Data preparation and managementModule 10
30 31
File construction
1. Specifying a filename
In order to create a new datafile, the programme will first ask you to give your datafile an alphanumeric name with a length of up to 8 characters, for example, SAMPLE1.
2. Defining the variables
The next step is to define the information to be stored in the datafile. This can be done in the form of a “dialogue” with the computer, where the computer will ask you to specify the characteristics of the variables in the datafile.
A display as shown in Figure 3 will appear where you can fill in the variable definitions in the codebook fields:
FIGURE 3 The variable definition display (first part of dialogue)

32
Data preparation and managementModule 10
33
The data entry manager software system
a. Essential information
The following pieces of information are essential for the definition of a variable.
Unique Variable Name: Each variable must be identified by a unique variable name. We will start with the school identification code which is presented in the header of the questionnaire. We have given it the name “IDSCHOOL”, so you would enter “IDSCHOOL” into the first blank field.
Variable Type: The next question asks about the type of coding that is used for the variable. The letter “C” indicates categorical variables with a fixed set of alphanumeric or numeric categories. The letter “N” indicates non-categorical variables with open-ended numerical codes. While there are a fixed number of schools and therefore only a fixed set of possible school identification values, the number of possible values is very large and can be understood as quasi-open-ended, so you should enter “N” into the second blank field.
Variable Length: Afterwards you need to specify the number of digits (including decimal places) which are required to code the data values of this variable. Assuming that, in our example, there are 150 schools the identification codes of which are the numbers 1 to 150, we can use a three-digit code to identify the schools, so you would enter “3” into the codebook field for the length.
Decimals: Afterwards you can specify the number of decimal places to be used in the codes. In the school identification code there are no decimal places, so you would leave the “0” in this codebook field which is the default value and go to the next codebook field.
Location in Instrument: The next piece of information will tell the coders where (in the data collection instruments) they will find the question used as the source of information. You can

32
Data preparation and managementModule 10
33
The data entry manager software system
fill in a short description that helps to locate the information quickly. In our example, you could enter “School ID” into this codebook field to indicate that the codes for this variable are found in the identification part of the questionnaire.
The “Hide variable” Indicator: The question “Allow modification of variable?” asks you to specify whether a variable will be visible and editable in the WinDEM display when you enter data or not. “Y” indicates that the value will be displayed during the data entry stage, “N” indicates that the value will not be displayed. As the later users need to enter the school identification code, you should enter “Y” in this codebook field.
The “Carry on” Indicator: The question “Carry data values on as default?” asks you to specify whether the value of a variable is carried as a default value to the next record when you enter data. This is useful for variables which remain constant for a number of records. If the “Carry” indicator is set to “Y” for a particular variable, then every new record will have the data value from the previous record as the default value. You can then modify this default value as required. If the “Carry” indicator is set to “N”, then the default value for this variable will be the default value which was specified for this variable. As we may be entering many students for the same school, you should enter “Y”.
Order (Display): You can specify the sequential position in which variables will appear in the WinDEM display during data entry. If you do not specify anything, the programme will set these sequential positions so that the variables appear on the display in the sequence in which you define them.
Order (File): Similarly, you can specify the sequential position in which variables will be recorded in the datafiles. If you do not specify anything, the programme will set these sequential

34
Data preparation and managementModule 10
35
The data entry manager software system
positions so that the variables appear on the display in the sequence in which you define them.
Field Label: For the descriptive label you could fill in “School identification code”.
b. Optional coding information
Afterwards the display will expand to the display as shown in Figure 4. These additional pieces of information should be filled in to provide further information on the coding of the variable.
FIGURE 4 The variable definition display (second part of dialogue)
Code for “Missing” Data: Following the above specifications, in the case of the variable IDSCHOOL you could enter the code “999” to indicate missing or omitted data.
Code for “Not Administered” Data: Correspondingly you could specify “998” to indicate “not administered” data for the variable IDSCHOOL.

34
Data preparation and managementModule 10
35
The data entry manager software system
“Default” Code: You can provide a code that will be used as a programme default when you create a new record in the datafile. In the case of the variable IDSCHOOL, you could leave this codebook field blank or specify 999 as its default code.
Valid Range: You can specify a valid range that determines which data values the user is allowed to enter when entering data. Assuming that in our example, there are 150 schools the identification codes of which are the numbers 1 to 150, you would enter the numbers 1 and 150 in the corresponding codebook fields.
Variable Class: You can classify variables according to their use in later data analyses. Since the variable IDSCHOOL is an identification variable, select the keyword “ID”. Note that only when the variable class is “ID” can the distinguish these variables as identification variables.
Comment: You can associate a descriptive comment with the variable which will be printed in the electronic codebook.
c. Adding variables
Having completed the definition of the variable, the programme will bring you back to the tabular display where you can review your definitions or add new variables. In the following discussion you will find two more examples for the preparation of variables in the electronic codebook. The definition of the student identification code is similar to the definition of the school identification code, except that a five-digit number will be used. You would enter “IDSTUD” for the variable name, “N” for the variable type, “5” for the length, “0” for the number of decimals, “Student ID” for the instrument location, and “Student identification code” for the variable label. Then you could enter “99999” for the “missing” data code and “99998” for the “not administered” data code.

36
Data preparation and managementModule 10
37
The data entry manager software system
The first question in the sample questionnaire asks for the student’s sex. We have represented this question by the variable SSEX. You would therefore enter “SSEX” for the variable name. This variable has a fixed set of categorical codes, namely “1” for “boy”, “2” for “girl”, “9” to indicate missing data, and “8” to indicate that the student was not administered this question in the sample questionnaire. You should enter “C” for “categorical” into the codebook field for the variable type. For the length enter “1” and for the number of decimals enter “0”. Since this question is the first question in the sample questionnaire, you may enter “Question 1” into the codebook field instrument location. For the variable label enter “Student sex”. For the “missing” code and the “default” code enter “9” and for the “not administered” code enter “8”.
The programme will then ask you to specify the number of valid data codes for this question. Note that codes for “missing” and “not administered” data are not counted as valid data, so your answer should be “2” (for “boys” and “girls”). The programme will then ask you to define the valid codes:
FIGURE 5 The variable definition display (defining codes and value labels)

36
Data preparation and managementModule 10
37
The data entry manager software system
For each valid code, you will find one row displayed in a small window. In the blank fields on the left hand side of this window you should enter the codes, and in the blank fields on the right hand side you should enter the meaning of the codes, which are referred to as the value labels. For the code “1” you would enter “boy” and for the code “2” you would enter “girl” (the codes and value labels should be based on the questionnaire presented in Figure 1).
For the variable class you should select “D” to indicate that this question refers to the student’s description. Also the remaining questions in this questionnaire will refer to the students’ description, so you should also select “D” for the variable class for the remaining variables.
FIGURE 6 Completed variable definition display
EXERCISE 1:Complete defining all the variables in SAMPLE1 based on the questionnaire (Figure 1) and the printed codebook (Figure 2). You should have the following screen (Figure 6) when you finish:

38
Data preparation and managementModule 10
39
The data entry manager software system
3. Saving the electronic codebook
Once you have defined all variables in the electronic codebook, the programme will ask you to confirm that you want to save the codebook. Afterwards the programme will verify your definitions for formal correctness. If the programme detects any errors, these will be indicated on the display and the programme will bring you back into the tabular display with the definitions where you can correct these errors.
If no errors are found, the codebook will be saved and the programme will bring you back into the main menu. You are now ready to enter data into the new datafile.
Coding of missing dataIn preparing a codebook, careful thought has to be given to considering how to code different instances of missing data and how to treat these different categories of missing data in data analyses.
If you define none or too few categories of missing data, you may end up with severe problems in the data analyses. For example, to calculate the percentage of correct answers for an item in a reading test you may want to assume that the students who omitted an item could not answer it and will therefore be scored as wrong. However, it would be unfair to score some items as wrong which were not administered to the student because they were, for example, misprinted in the student booklet. If the coders do not assign different codes for each of these instances then you will not be able to make that distinction in the data analyses.
On the other hand, if you define too many categories of missing data for which there is no analytical use, it may be very difficult for

38
Data preparation and managementModule 10
39
The data entry manager software system
the coders to distinguish between the different instances of missing data, and the coding may be unnecessarily complicated.
Some distinctions between different instances of missing data must be made by the coders before the data are entered into the datafile, whereas there are other distinctions which can be derived later when the data are being processed.
1. Key requirements
The codes for missing data need to represent the different instances of missing data exhaustively. This means that each code in the datafiles should either represent a valid data value or one of the missing codes. There should never be a situation where a position in the datafile is just left blank. There should also never be a situation where there is no data from the respondent but none of the missing codes applies.
Secondly, the missing codes should be mutually exclusive. This means that there should be no ambiguity concerning which missing code to apply in each particular situation, and there need to be clear definitions and instructions on how to assign the missing codes.
Finally, it should be clear how the missing codes are coded in the datafile and how the different instances of missing data are treated in the data analyses.
2. Basic categories of missing data
The minimum distinction which the coders must make when entering data is between: i) data that are missing because they were omitted by the respondents or answered in an invalid way; and ii) data that are missing because a question or test item was not administered.

40
Data preparation and managementModule 10
41
The data entry manager software system
a. Missing/omit
“Missing/omit” codes refer to questions/items which a respondent should have answered but which he/she either did not answer or which were answered in an invalid way (though sometimes a finer distinction between these categories may be required). Some obvious reasons for assigning this code:
No Response: Where there was no response to a question or an item where there should be one.
Two or More Responses: Where there were two or more responses when only one answer was allowed.
Response Unreadable: Where the response was unreadable or uninterpretable. Often the codes “9”, “99”, “999” (depending on the length for a variable) are assigned to this type of missing data to distinguish them from the valid and “not applicable” data.
Sometimes a further distinction between questions that were omitted by a respondent and questions that have been answered in an invalid way is required but the analytical distinctions will then be very complicated.
b. Not administered
“Not administered” codes are assigned when data were not collected for an observation on a specific variable. There are some obvious cases when this code should be used:
Respondent Not Present: For example, if a student was not present in a particular testing session, then all variables referring to that session were supposed to be coded to “not administered”. However, if the student received the instrument but did not answer particular questions, then these questions must be coded as “missing”.

40
Data preparation and managementModule 10
41
The data entry manager software system
Booklet Not Received: If a student did not receive a particular test instrument then all variables referring to that test instrument were to be coded as “not administered”.
Item Left Out or Misprinted: If a particular question or item (or a whole page) was misprinted, left out, or not available to a student, teacher or school then the corresponding variables were to be coded as “not administered”.
Item Mistranslated: If an item was mistranslated, then all observations for this item were also to be coded as “not administered”.
The codes “8”, “98”, “998” (depending on the length of the variable) are often assigned to “not applicable” data to distinguish them from the valid and other missing data.
c. Examples for derived categories of missing data
In certain situations, there are categories of missing data which can be derived from existing data.
When a respondent was not meant to answer a variable because of its logical relationship to other variables, these variables could be recoded to the missing code “logical not applicable”. For example, if a respondent gave a negative answer to a filter question, then the corresponding dependent questions could be recoded to “logical not applicable” unless all dependent variables indicate that the filter variable was incorrectly coded in which case it might be better to recode the filter variable.
Data recorded in an invalid or inconsistent way have in some cases been recoded to a special missing code “invalid”. In this sense, “invalid” means that data were recorded in an invalid way, i.e. that the coder coded a variable to a data value that did not conform to the specifications in the codebook; this does not necessarily mean that the respondent gave an invalid response.

42
Data preparation and managementModule 10
43
The data entry manager software system
d. Coding of absentees and excluded students
Certain students within the selected schools may, for different reasons, be unable to take part in the assessment. Countries differ widely in the percentage of the population that is considered to be in this position and this category should be held to a minimum to avoid biasing international comparisons. In some educational systems these students are located in special schools or in special classrooms and the information available for the construction of the national sampling frame may allow the identification of schools and students belonging to the excluded populations prior to the construction of the within-school sampling frames. However, in other educational systems this information is often not available. For example, this can occur in countries where such students are integrated in some schools of the mainstream schooling system even though they may be part of the excluded population.
To accommodate this situation, precise standards should be defined which allow these students to be excluded from the administration of the tests. For example, it will clearly not be sufficient for a study to state that “handicapped” students may be excluded because the understanding of “handicapped” students may include different kinds of physical, emotional, and mental disabilities in different countries and therefore may vary considerably between countries.
Care needs to be taken in finding comparable categorizations for the within-school exclusion of students and it must be ensured that these are coded appropriately in the datafiles. The results of a data collection will be seriously threatened if excluded respondents are simply ignored.

42
Data preparation and managementModule 10
43
The data entry manager software system
Data entryOnce the data have been returned from the respondents the data need to be recorded in computer readable form. This section provides an overview of different approaches to data entry and then discusses two approaches to data entry in a more detailed way.
1. Basic approaches to data entry
Data may be collected on free-text notebooks, questionnaires, optical scanning forms, or micro-computers. All further steps depend on the quality with which the data entry is completed. Inaccurate data entry often causes substantial delays in the data verification and data analysis phases of a survey.
Adequate procedures for data entry depend on instrument design and on the data collection methods. Sometimes in large scale surveys, data entry procedures are used wherein data are recorded directly in computer readable form using optical or magnetic character readers, optical or magnetic mark readers, or micro-computers during fieldwork. Examples of this are computer assisted telephone interviewing (CATI) and computer assisted personal interviewing (CAPI) systems. Whereas transcription errors can be minimized with these procedures, the use of such technical innovations requires careful planning, an expensive technical environment, and trained respondents.
The more common approaches for data entry in educational surveys are transcriptive procedures in which respondents write their answers onto the instruments. The answers are then transcribed either to machine readable form or directly into the computer. Transcription is usually costly, sometimes requiring up to half of the total data processing costs. If the response formats are complex or the coding requires specially trained coding personnel, then

44
Data preparation and managementModule 10
45
The data entry manager software system
an additional coding stage may need to be inserted in which the responses are translated into their codes which are then written on the instruments or transcribed to special code-sheets. Although introducing an additional source of error, nonetheless separating coding from data entry allows faster coding of data and does not require coding skills for the data entry personnel.
Key verification procedures, or better still, independent verification techniques where two coders code and enter the data independently, can help to ensure the correctness of the data entered. While perhaps too costly to process the whole dataset, at least a reasonable sized sample of the data should be verified using these techniques in order to estimate the error introduced and to decide on further corrective measures to ensure sufficient data quality. Often it is advantageous to identify the coder who entered each record so that any errors can be traced back. This can be done by adding a coder identification code to the datafile.
It is important to trial test data entry procedures at an early stage so that resources required for timely entry can be planned.
2. Using a text editor for data entry
For each piece of information in the data collection instruments the codebook defines which format and into which positions it should be entered into the raw datafile. Following the definitions in the codebook, it is possible to simply enter the data into a text editor or word processor. An example for how such a text file would look like is provided in the following using the codebook of the above sample questionnaire.
103103042 83941991019110103103051124232130110110103104063 92221241000110

44
Data preparation and managementModule 10
45
The data entry manager software system
As you can see, the codebook starts with the School ID (103), followed by the Student ID (10304), the student sex (the 2 indicates a girl), the students age (8 years), and so on until all variables in the codebook have been coded.
However, a great deal of caution must be used when following this approach and there is usually a great deal of work involved in resolving problems resulting from such an approach. To give an example for this, four frequently occurring problems are listed in the following:
If, by mistake, a coder skips a code or enters a code twice, then all subsequent codes in the datafile will be shifted and thus change their implied meaning in the datafile:
Incorrect: 10310304283941991019110Correct: 103103042 83941991019110
The student age should be coded in columns 10-11. If, as in the above example for student 10304, the coder puts the code for the age in the 10th position and then continues in position 11 with the remaining variables, then columns 10-11 would contain the value 83 and the computer would interpret this as the age of 83 years in later analyses. All variables following the students age would be misinterpreted similarly. This can have dramatic impacts on the statistical results, for example, if we calculate the mean age and there is an outlier with 83 years in the datafile, then the overall mean can change substantially if the sample size is not too large.
The approach also does not allow to verify during data entry whether the data values entered conform indeed to the specifications in the codebook:
Example: 103104063 92221241000110

46
Data preparation and managementModule 10
47
The data entry manager software system
In this example the position for the student sex contains the value “3” which is outside the set of permitted values (“1” for “boy”, “2” for “girl”, and “8” and “9” for the missing codes) and is obviously a coding error. Besides losing the information for this student it also has, if undetected, an impact on the results of statistical analyses.
Furthermore, such an approach does not allow to verify the data for internal consistency while the data are entered:
Example: 103103042 83941341019110
In this example, the questions on the student reading activities and the number of books have been coded as “3” and “4” respectively, indicating that the student always reads the books and that there are between 11 and 50 books in his home. Looking at the sample questionnaire from which the data was entered, we see that both questions were left blank by the respondent and therefore should have been coded to “9”. Now it could be argued that also a computer validated range check would not have found the error, since both “9”, “3”, and “5” are valid codes for this question and in accordance with the codebook. However, a computerized range validation could have taken into account that these questions have a filter question (question 3) asking for the existence of books at home which was coded to “1”, meaning that the student did not have access to any books outside school. When the coder enters a code indicating that there are 11-50 books at home while at the same time the filter question indicates that the student does not have access to books outside schools, the computer could have alerted the coder requesting that these datavalue be checked once more against the data collection instruments. Only if the respondent had indeed answered inconsistently, then the coder would put these inconsistencies in the datafile.
Another problem are duplicate identification codes or inconsistencies in the identification codes:

46
Data preparation and managementModule 10
47
The data entry manager software system
Example: 103104063 92221241000110
In this example, the school identification code does not match the first three digits in the student identification code, even though a hierarchical identification system was used. Entering the data into a text file the coder might not notice this mistake. While this problem would be impossible to resolve once the original data collection instruments are no longer available, a computer-controlled data entry programme could verify the student and school identification codes during data entry for internal consistency, alerting the coder that either the student or the school identification code contains an error and asking the coder to immediately check this information back against the original data collection instruments.
3. Using a computer-controlled approach for data entry, the dataentrymanager programme
Transcriptive data entry can greatly be facilitated through the use of interactive data entry software that integrates the processes of the entry, editing, and verification of the data. Such data entry systems come often also with integrated data and file management capabilities including mechanisms for the transfer of the data to standard statistical analysis systems. Using such systems, deviations of datavalues from pre-specified validation criteria or data verification rules can be detected quickly, thereby letting the user correct the error while the original documents are still at hand.
An example for such a programme is the WinDEM which is provided by the IEA and which is briefly described in the following:
This programme has been designed to be used by users with limited experience in computer use. The programme can handle datafiles with more than 1000 variables and data for more than 1 000 000

48
Data preparation and managementModule 10
49
The data entry manager software system
000 respondents. All datafiles created are fully compatible with the dBASE IV™ standard.
The WinDEM programme operates through a system of menus and windows. It contains nine menus with which you can accomplish different tasks.
With the FILE menu you can open, create, delete or sort a datafile. As you have seen earlier in this module, you can use this menu also to edit the electronic codebook which is associated with each datafile and which contains all information about the file structure and the coding schemes employed. Furthermore, you can use this menu to print the electronic codebook or to transform the information in the electronic codebook into SAS™, SPSS™, or OSIRIS/IDAMS™ control statements which you can use later in order to convert the datafiles into SAS™, SPSS™, or OSIRIS/IDAMS™ system files. Finally this menu allows you to exit the WinDEM programme.
With the EDIT menu you can enter, modify, or delete data in datafiles. You can look at a datafile in two different ways: (a) in record view, you can view the data for one record at a time with detailed information on each of the variables; (b) in table view, you can view a datafile as a whole in tabular form with records shown as rows and variables shown as columns. The programme will control the processing of the data entered, interrupting and alerting you when data values fail to meet the range validation criteria which are specified in the electronic codebook.
With the SEARCH menu you can search for specific records using your own search criteria or locate a record with a known record number.
With the SUBSET menu, you can define a subset of specific records using your own criteria. This will then restrict your view of the data to the records which match these criteria.

48
Data preparation and managementModule 10
49
The data entry manager software system
You can use the Print menu to print pre-selected records on a printer or to a text file.
You can use the IMPORT/EXPORT menu to generate fixed form ASCII raw datafiles or free format datafiles from the WinDEM system files or to import raw datafiles or free format datafiles created with other software packages into the WinDEM programme. For example, if you want to verify and clean a datafile that has been created with a text editor, you can use the Import item of the IMPORT/EXPORT menu. The Import item of the IMPORT/EXPORT menu may also be used to combine several datafiles into a single datafile. The Export item of the IMPORT/EXPORT menu is helpful if you want to further process a datafile with software packages like SAS™ or SPSS™.
You can use the VERIFY menu to apply a variety of data verification checks to your data. With the knowledge of the data verification rules which are specified in the electronic codebook, the programme will check the datafiles and report when problems occur. These problems can then be resolved in record view or table view.
With the ANALYSIS menu you can calculate simple univariate statistics. You can select the variables as well as the records for which statistics are to be calculated by various criteria.
You can use the TOOLS menu to back-up data from the hard disk onto diskettes or to restore data from the backup diskettes in case the data on your hard disk has been damaged. You can further use this menu to configure the programme to your specific hardware environment.
The following section contains an example of how to interactively enter data from our sample questionnaires using the WinDEM programme.

50
Data preparation and managementModule 10
51
The data entry manager software system
WinDEMThis would require the following steps:
• opening the datafile;
• choosing your view on the data;
• entering the identification codes for the respondent;
• entering the response data; and
• saving the data.
After selecting the datafile, the programme will bring you to the EDIT menu, where you can choose to look at the datafile in two different ways, in record view or in table view. The difference between the two displays is that record view will provide you with a detailed display of one record at a time, whereas table view will provide you with a tabular overview of several records of the datafile at the same time.
1. Entering data
The record view: Suppose we would choose the Record view item from the EDIT menu.
When you start editing in Record view, you will see some useful information on the screen (Figure 7).
• the main menu with the highlighted bar positioned on the currently selected menu (EDIT);

50
Data preparation and managementModule 10
51
The data entry manager software system
• the status line with the filename (SAMPLE1.DBF), the number of the current record, and the total number of records (1 of (1)) in the datafile; and
• fields filled with default codes (“999” and “99999”) for the identification variables (IDSCHOOL and IDSTUD respectively).
You may enter data in the fields filled with default codes. You can go to a previous variable with the [á ]-key or to a subsequent variable with the [â ]-key provided that the variable in which the cursor is currently positioned has a valid code.
You have to complete the identification variables first. Into the identification fields on the display you would enter the identification codes shown in the sample questionnaire, that is, enter 103 for the variable IDSCHOOL and 10304 for the variable IDSTUDENT.
FIGURE 7 Entering codes for the data variables

52
Data preparation and managementModule 10
53
The data entry manager software system
Note that the programme will only allow you to enter those variables which match the criteria which you have specified in the codebook. For example, if you enter the code “3” for the variables SSEX (students sex) the programme will reject this value. This is because we have defined only the codes “1” for “boy” and “2” for “girl”, “9” for “missing”, and “8” for “not administered”.
If, for an open-ended or “non-categorical” variable (variable type “N”), a data value is entered which is outside the range specified in the codebook, then the programme will alert you and ask you to re-enter the value.
2. Reviewing your data
You can review your datafile in a tabular display in which each student is represented in one row with the different variables represented as the columns. To enter into this view, select the Table view item of the EDIT menu. The following display will then appear (Figure 8):
FIGURE 8 Reviewing data in table view

52
Data preparation and managementModule 10
53
The data entry manager software system
EXERCISE 2:Enter data using the questionnaires filled by 10 students, shown in Figure 9.

54
Data preparation and managementModule 10
55
The data entry manager software system
School identification code 1 0 3Student identification code 1 0 3 0 4
1. Are you a boy or a girl? (Tick one number)
Boy .............................................. 1 Girl .............................................. 2 v
2. How old are you? (Put in your age in years)
....................................................... years
3. How often do you eat each of the following meals? (Tick one number on each line)
Not at all
1 or 2 times a week
3 or 4 times a week
Every day
(a) Morning meal 1 2 3 v 4(b) Lunch 1 2 3 4(c) Evening meal 1 2 3 4 v
4. Are there any books where you live that you could read which are not your school books? (Tick one number)
Yes .............................................. 1 v No .............................................. 2 If “No”, go to question 6.
5. If “Yes”, how often do you read these books? (Tick one number)
Always .......................................... 3 Sometimes................................... 2Never............................................ 1
6. If “Yes”, how many books are there in your home? (Tick one number)
None............................................. 11 to 10 books ............................. 211 to 50 books ........................... 3 More than 50 books ................. 4
7. Do you have the following things in your home? (Tick one number on each line)
Do not have this Have one or more
(a) Radio 0 1 v(b) TV 0 v 1(c) Table to Write on 0 1 v(d) Bicycle 0 1(e) Electricity 0 1 v(f) Running Water 0 1 v(g) Daily Newspaper 0 v 1
FIGURE 9 10 cases of collected questionnaires
Case 1
8

54
Data preparation and managementModule 10
55
The data entry manager software system
School identification code 1 0 3Student identification code 1 0 3 1 5
1. Are you a boy or a girl? (Tick one number)
Boy .............................................. 1 v Girl .............................................. 2
2. How old are you? (Put in your age in years)
....................................................... years
3. How often do you eat each of the following meals? (Tick one number on each line)
Not at all
1 or 2 times a week
3 or 4 times a week
Every day
(a) Morning meal 1 2 v 3 4(b) Lunch 1 2 3 4 v(c) Evening meal 1 2 3 4 v
4. Are there any books where you live that you could read which are not your school books? (Tick one number)
Yes .............................................. 1 v No .............................................. 2 If “No”, go to question 6.
5. If “Yes”, how often do you read these books? (Tick one number)
Always .......................................... 3 v Sometimes................................... 2Never............................................ 1
6. If “Yes”, how many books are there in your home? (Tick one number)
None............................................. 11 to 10 books ............................. 2 v11 to 50 books ........................... 3 More than 50 books ................. 4
7. Do you have the following things in your home? (Tick one number on each line)
Do not have this Have one or more
(a) Radio 0 1 v(b) TV 0 1 v(c) Table to Write on 0 1 v(d) Bicycle 0 v 1(e) Electricity 0 1 v(f) Running Water 0 1 v(g) Daily Newspaper 0 1 v
Case 2
10

56
Data preparation and managementModule 10
57
The data entry manager software system
School identification code 1 1 1Student identification code 1 1 1 0 8
1. Are you a boy or a girl? (Tick one number)
Boy .............................................. 1 v Girl .............................................. 2
2. How old are you? (Put in your age in years)
....................................................... years
3. How often do you eat each of the following meals? (Tick one number on each line)
Not at all
1 or 2 times a week
3 or 4 times a week
Every day
(a) Morning meal 1 2 3 4 v(b) Lunch 1 2 3 4 v(c) Evening meal 1 2 3 4 v
4. Are there any books where you live that you could read which are not your school books? (Tick one number)
Yes .............................................. 1 v No .............................................. 2 If “No”, go to question 6.
5. If “Yes”, how often do you read these books? (Tick one number)
Always .......................................... 3 Sometimes................................... 2 vNever............................................ 1
6. If “Yes”, how many books are there in your home? (Tick one number)
None............................................. 1 v1 to 10 books ............................. 2 11 to 50 books ........................... 3 More than 50 books ................. 4
7. Do you have the following things in your home? (Tick one number on each line)
Do not have this Have one or more
(a) Radio 0 1 v(b) TV 0 v 1 v(c) Table to Write on 0 1 v(d) Bicycle 0 v 1(e) Electricity 0 1 v(f) Running Water 0 1 v(g) Daily Newspaper 0 v 1
Case 3
9

56
Data preparation and managementModule 10
57
The data entry manager software system
School identification code 1 2 3Student identification code 5 2 3 1 6
1. Are you a boy or a girl? (Tick one number)
Boy .............................................. 1 Girl .............................................. 2 v
2. How old are you? (Put in your age in years)
....................................................... years
3. How often do you eat each of the following meals? (Tick one number on each line)
Not at all
1 or 2 times a week
3 or 4 times a week
Every day
(a) Morning meal 1 2 3 v 4(b) Lunch 1 2 3 4 v(c) Evening meal 1 2 3 4 v
4. Are there any books where you live that you could read which are not your school books? (Tick one number)
Yes .............................................. 1 No .............................................. 2 v If “No”, go to question 6.
5. If “Yes”, how often do you read these books? (Tick one number)
Always .......................................... 3 Sometimes................................... 2 vNever............................................ 1
6. If “Yes”, how many books are there in your home? (Tick one number)
None............................................. 1 v1 to 10 books ............................. 211 to 50 books ........................... 3 More than 50 books ................. 4
7. Do you have the following things in your home? (Tick one number on each line)
Do not have this Have one or more
(a) Radio 0 v 1 (b) TV 0 v 1 (c) Table to Write on 0 v 1 (d) Bicycle 0 v 1(e) Electricity 0 1 v(f) Running Water 0 1 v(g) Daily Newspaper 0 v 1
Case 4
9

58
Data preparation and managementModule 10
59
The data entry manager software system
School identification code 1 1 2Student identification code 1 1 2 0 9
1. Are you a boy or a girl? (Tick one number)
Boy .............................................. 1 Girl .............................................. 2 v
2. How old are you? (Put in your age in years)
....................................................... years
3. How often do you eat each of the following meals? (Tick one number on each line)
Not at all
1 or 2 times a week
3 or 4 times a week
Every day
(a) Morning meal 1 2 v 3 4(b) Lunch 1 2 3 4 v(c) Evening meal 1 2 3 v 4
4. Are there any books where you live that you could read which are not your school books? (Tick one number)
Yes .............................................. 1 v No .............................................. 2 If “No”, go to question 6.
5. If “Yes”, how often do you read these books? (Tick one number)
Always .......................................... 3 Sometimes................................... 2 vNever............................................ 1
6. If “Yes”, how many books are there in your home? (Tick one number)
None............................................. 11 to 10 books ............................. 2 11 to 50 books ........................... 3 More than 50 books ................. 4 v
7. Do you have the following things in your home? (Tick one number on each line)
Do not have this Have one or more
(a) Radio 0 1 v(b) TV 0 1 v(c) Table to Write on 0 1 v(d) Bicycle 0 1 v(e) Electricity 0 1 v(f) Running Water 0 1 v(g) Daily Newspaper 0 1 v
Case 5
15

58
Data preparation and managementModule 10
59
The data entry manager software system
School identification code 5 6 Student identification code 5 6 1 7
1. Are you a boy or a girl? (Tick one number)
Boy .............................................. 1 v Girl .............................................. 2
2. How old are you? (Put in your age in years)
....................................................... years
3. How often do you eat each of the following meals? (Tick one number on each line)
Not at all
1 or 2 times a week
3 or 4 times a week
Every day
(a) Morning meal 1 2 v 3 4(b) Lunch 1 2 3 4 v(c) Evening meal 1 2 v 3 4
4. Are there any books where you live that you could read which are not your school books? (Tick one number)
Yes .............................................. 1 v No .............................................. 2 If “No”, go to question 6.
5. If “Yes”, how often do you read these books? (Tick one number)
Always .......................................... 3 Sometimes................................... 2 Never............................................ 1 v
6. If “Yes”, how many books are there in your home? (Tick one number)
None............................................. 1 1 to 10 books ............................. 2 v11 to 50 books ........................... 3 More than 50 books ................. 4
7. Do you have the following things in your home? (Tick one number on each line)
Do not have this Have one or more
(a) Radio 0 1 v (b) TV 0 v 1 (c) Table to Write on 0 v 1 (d) Bicycle 0 v 1(e) Electricity 0 1 v(f) Running Water 0 1 v(g) Daily Newspaper 0 v 1
Case 6
12

60
Data preparation and managementModule 10
61
The data entry manager software system
School identification code 0 8 1Student identification code 0 8 1 1 1
1. Are you a boy or a girl? (Tick one number)
Boy .............................................. 1 v Girl .............................................. 2
2. How old are you? (Put in your age in years)
....................................................... years
3. How often do you eat each of the following meals? (Tick one number on each line)
Not at all
1 or 2 times a week
3 or 4 times a week
Every day
(a) Morning meal 1 2 3 v 4(b) Lunch 1 2 3 v 4 (c) Evening meal 1 2 3 v 4
4. Are there any books where you live that you could read which are not your school books? (Tick one number)
Yes .............................................. 1 v No .............................................. 2 If “No”, go to question 6.
5. If “Yes”, how often do you read these books? (Tick one number)
Always .......................................... 3 Sometimes................................... 2 vNever............................................ 1
6. If “Yes”, how many books are there in your home? (Tick one number)
None............................................. 11 to 10 books ............................. 2 v 11 to 50 books ........................... 3 More than 50 books ................. 4
7. Do you have the following things in your home? (Tick one number on each line)
Do not have this Have one or more
(a) Radio 0 v 1 (b) TV 0 v 1 (c) Table to Write on 0 v 1 (d) Bicycle 0 v 1 (e) Electricity 0 1 v(f) Running Water 0 1 v(g) Daily Newspaper 0 v 1
Case 7
12

60
Data preparation and managementModule 10
61
The data entry manager software system
School identification code 1 0 2 Student identification code 1 0 2 1 8
1. Are you a boy or a girl? (Tick one number)
Boy .............................................. 1 Girl .............................................. 2 v
2. How old are you? (Put in your age in years)
....................................................... years
3. How often do you eat each of the following meals? (Tick one number on each line)
Not at all
1 or 2 times a week
3 or 4 times a week
Every day
(a) Morning meal 1 2 3 v 4(b) Lunch 1 2 3 4 v(c) Evening meal 1 2 3 v 4
4. Are there any books where you live that you could read which are not your school books? (Tick one number)
Yes .............................................. 1 v No .............................................. 2 If “No”, go to question 6.
5. If “Yes”, how often do you read these books? (Tick one number)
Always .......................................... 3 v Sometimes................................... 2 Never............................................ 1
6. If “Yes”, how many books are there in your home? (Tick one number)
None............................................. 1 1 to 10 books ............................. 2 11 to 50 books ........................... 3 More than 50 books ................. 4 v
7. Do you have the following things in your home? (Tick one number on each line)
Do not have this Have one or more
(a) Radio 0 1 v (b) TV 0 v 1 (c) Table to Write on 0 1 v (d) Bicycle 0 v 1(e) Electricity 0 1 v(f) Running Water 0 1 v(g) Daily Newspaper 0 1 v
Case 8
8

62
Data preparation and managementModule 10
63
The data entry manager software system
School identification code 0 0 7Student identification code 0 0 7 0 8
1. Are you a boy or a girl? (Tick one number)
Boy .............................................. 1 Girl .............................................. 2 v
2. How old are you? (Put in your age in years)
....................................................... years
3. How often do you eat each of the following meals? (Tick one number on each line)
Not at all
1 or 2 times a week
3 or 4 times a week
Every day
(a) Morning meal 1 2 3 4 v(b) Lunch 1 2 3 4 v (c) Evening meal 1 2 3 4 v
4. Are there any books where you live that you could read which are not your school books? (Tick one number)
Yes .............................................. 1 v No .............................................. 2 If “No”, go to question 6.
5. If “Yes”, how often do you read these books? (Tick one number)
Always .......................................... 3 v Sometimes................................... 2 Never............................................ 1
6. If “Yes”, how many books are there in your home? (Tick one number)
None............................................. 11 to 10 books ............................. 2 11 to 50 books ........................... 3 v More than 50 books ................. 4
7. Do you have the following things in your home? (Tick one number on each line)
Do not have this Have one or more
(a) Radio 0 1 v (b) TV 0 1 v (c) Table to Write on 0 1 v (d) Bicycle 0 1 (e) Electricity 0 1 v(f) Running Water 0 1 v(g) Daily Newspaper 0 1 v
Case 9
9

62
Data preparation and managementModule 10
63
The data entry manager software system
School identification code 1 4 6 Student identification code 1 4 6 1 8
1. Are you a boy or a girl? (Tick one number)
Boy .............................................. 1 v Girl .............................................. 2
2. How old are you? (Put in your age in years)
....................................................... years
3. How often do you eat each of the following meals? (Tick one number on each line)
Not at all
1 or 2 times a week
3 or 4 times a week
Every day
(a) Morning meal 1 2 v 3 4(b) Lunch 1 2 3 4 v(c) Evening meal 1 2 3 4 v
4. Are there any books where you live that you could read which are not your school books? (Tick one number)
Yes .............................................. 1 v No .............................................. 2 If “No”, go to question 6.
5. If “Yes”, how often do you read these books? (Tick one number)
Always .......................................... 3 Sometimes................................... 2 Never............................................ 1 v
6. If “Yes”, how many books are there in your home? (Tick one number)
None............................................. 1 1 to 10 books ............................. 2 11 to 50 books ........................... 3 v More than 50 books ................. 4
7. Do you have the following things in your home? (Tick one number on each line)
Do not have this Have one or more
(a) Radio 0 1 v (b) TV 0 1 v (c) Table to Write on 0 1 v (d) Bicycle 0 1 v(e) Electricity 0 1 v(f) Running Water 0 1 v(g) Daily Newspaper 0 1 v
Case 10
10

Data preparation and managementModule 10
64 65
6
A critical step in the management of survey data is the verification of the data. It must be ensured that the data are consistent and conform to the definitions in the codebook and are ready for analytical use. This section describes common approaches to data verification and indicates potential problems that need to be addressed.
Whenever data are collected, almost inevitably errors are introduced by various sources. Substantial delays occur when these errors are not anticipated and safeguards built into procedures. Errors in the data may be caused: (a) by faulty preparation of the field monitoring and survey tracking instruments, (b) by the assignment of incorrect identifications to the respondents, (c) during the field administration, (d) during the preparation of the instruments including the coding of the responses, and (e) during transcription of the data.
Whereas in an ideal situation all questions would be answered in the way intended in the codebook there are many sources for deviations from the codebook. For example, questions may have been skipped due to technical or organizational imperfections (e.g. misprints, missing pages) or questions may have been skipped or answered in a way not intended because of misunderstanding during translation and/or ambiguities in the question. Such deviations can result in: (a) variables which have been skipped but which should have been included; or, variables which have been included when they should not have been (e.g. when they were misprinted); (b) incorrectly coded variables; (c) variables which have a content different from that specified by the codebook.
Data verif ication

Data preparation and managementModule 10
64 65
The amount of work involved in resolving these problems, often called “data cleaning” can greatly be reduced by using well-designed instruments, qualified field administration and coding personnel and appropriate transcription mechanisms. The steps that must be undertaken to verify the data are implied in the quality standards that have been defined for the corresponding survey. Procedures must be implemented for checking invalid, incorrect and inconsistent data, which may range from simple deterministic univariate range checks to multivariate contingency tests between different variables and different respondents. The criteria on which these checks are based depend, on the one hand, on variable type (i.e. different checks may apply to data variables, control variables, and identification variables) and, on the other hand, to the manner and sequence in which questions are asked. For some questions a certain number of responses are required, or responses must be given in a special way, due to a dependency or logical relationship between questions.
Depending on the data collection procedures used, it must be defined when and at what stage data verification steps are implemented. For example, some range validation checks may be applied during data entry whereas more complex checks for the internal consistency of data or for outliers may be more appropriately applied after the completion of the data entry. Problems that have been detected through verification procedures need to be resolved efficiently and quickly.
Some problems can, using certain assumptions, be resolved automatically on the basis of cross-checks in the datafiles. Other problems will require further inspection and manual resolving. Where problems cannot be resolved, the problematic data-values must be recoded to special missing codes.
The criteria on which the checking was based depended, on the one hand, on the type of variables that were used to code the information (for example, different criteria apply to data variables,

66
Data preparation and managementModule 10
67
Data verification
identification variables, control variables, filter variables, and dependent variables) and, on the other hand on the way and sequence in which questions were asked (for example, for some questions a certain number of responses are required, or responses must be given in a special way, or there is a dependency, or a logical relationship between certain questions).
A report on the verification of the data should be produced listing each error that was encountered and the solutions undertaken. For each problem the following questions ultimately have to be answered: (a) when to correct a data-value on the basis of other data values; (b) when to set a data-value to a specific missing code which indicates that the question was not administered, had an invalid, missing, or no applicable answer; (c) when to drop a respondent because of invalid, missing or not administered data; and (d) when to drop a question or variable.
Data verification stepsUsually, data verification is undertaken through a series of steps, which for each survey need to be established and sequenced in accordance with the quality requirements, the type of data collected, and the field operations and data entry procedures applied.
Common data verification steps are:
• the verification of returned instruments for completeness and correctness;
• the verification of identification codes against field monitoring and survey tracking instruments;
• a check for the file integrity, in particular, the verification of the structure of the datafiles against the specifications in the codebook;

66
Data preparation and managementModule 10
67
Data verification
• the verification of the identification codes for internal consistency;
• the verification of the data variables for each student or teacher against the validation criteria specified in the codebook;
• the verification of the data variables for each student and teacher against certain control variables in the datafiles;
• the verification of the data obtained for each respondent for internal consistency (for example, the responses for questions which were coded through split variables the answers to these can be cross-validated);
• the cross-validation of related data between respondents;
• the verification of linkages between related datafiles, especially in the case of hierarchically structured data; and
• the verification of the handling of missing data.
The most important of these steps are described in more detail in the following:
1. Verification of file integrity
As a first step it needs to be ensured that the overall structure of the datafiles conforms to the specifications in the codebook. For example, if raw datafiles are used, then each record should have the same length in correspondence with the codebook. Often it is useful to introduce column-control variables in the codebook at regular intervals which the coder should code with blanks. When reviewing the datafile these positions should appear as blank columns and provide therefore a useful means of detecting columns shifts in the datafile. If we find a non-blank value in any of these columns, this can indicate the following problems:

68
Data preparation and managementModule 10
69
Data verification
• a single transcription error for one of these column-control variables;
• a column shift for the current respondent (for example, a coder might have entered a value for a certain data-value twice and thus codes in subsequent columns were wrong). In this case, a check was made to see whether subsequent column-control variables also had invalid values;
• a global column shift for the whole datafile which means that the variables were not coded in the format specified in the codebook;
• In more advanced data collection systems such as the WinDEM programme, data are directly transcribed into a database which ensures the file integrity automatically.
2. Special recodings
Sometimes it is necessary to recode certain variables before they can be used in the data analyses. Examples for such situations are:
• The sequence of questions or items has been changed for some reason and is not any more in accordance with the codebook;
• A question or item may have been asked to some respondents in a different way or format than was intended;
• A question or item has not been asked to some respondents but the missing information could be derived from other variables.
3. Value validation
Background questions and test items for which a fixed set of codes rather than open-ended values applied need to be checked against the range validation criteria defined in the codebook. Variables with open-ended values (e.g. “Student age”) need to be checked against theoretical ranges.

68
Data preparation and managementModule 10
69
Data verification
4. Treatment of duplicate identification codes
Each datafile should be checked for duplicate identification codes. It is thereby often useful to distinguished between the following two cases:
• Respondents who have identical identification codes but different values for a number of key data variables. These respondents have probably been assigned invalid identification codes.
• Respondents who have identical identification codes and at the same time also identical datavalues for the key data variables. These respondents are most likely duplicate entries in which case the second occurrence of the respondents data was removed from the datafiles.
5. Internal validation of an hierarchical identification system
If a hierarchical identification system is used for identifying respondents at different levels, then the structure of this system can be verified for internal consistency. The number of errors in identi-fication codes which are often a serious threat to the use of the data can thus be dramatically reduced. Often inconsistencies can then be resolved automatically or even avoided during the entry of data.
6. Verification of the linkages between datafiles
Often data are collected at different levels, for example data are collected for students and for the teachers which teach the classes in which the students are enrolled. Then it is important to verify the linkages between such levels of data collection. There is a wide range of potential problems, for example:

70
Data preparation and managementModule 10
71
Data verification
• There may be cases where for a teacher in the teacher datafile there are no students linked to him or her in the student datafile (that is, for a certain Teacher ID in the teacher datafile there is no matching Teacher ID in the student datafile);
• There may be cases in the student datafile which do not have a match in the teacher datafile even though they are associated with a Teacher ID;
• There may be cases where the Class IDs of all students which were linked to a teacher were different from the Class ID of this teacher in the teacher datafile; and
• There may be cases where the Class IDs of all students which were linked to a teacher are different from the Class ID of this teacher in the teacher datafile.
7. Verification of participation indicator variables against data variables
In many situations, respondents are asked to respond to multiple assessment instruments, often in multiple assessment sessions. For example, students may be given a test in the morning and a second test in the afternoon. If we find no data for a student for a particular testing session then it is then crucial to know whether there are no data because the student did not participate in the testing session or whether there are no data because the student did not respond to any of the test items in this session. This is so important because, for example, in the first situation we would base the student score only on the answers given in the first testing session and exclude the items in the second testing session from scoring, whereas in the second situation case we would score all items in the second testing session as wrong.
To allow the verification of this, the datafile should, besides the variables with the questions and test items, contain also information about the participation status of the respondents in the different

70
Data preparation and managementModule 10
71
Data verification
testing sessions. It is often useful to group the variables in the codebook into blocks. Each of these blocks can then begin with a variable the code of which indicates the participation of the student in the respective testing session. It can then be verified whether the participation indicator variables matched the data in the corresponding data variables.
8. Verification of exclusions of respondents
Some surveys allow that respondents are excluded from the assessment for certain reasons. A severe mistake results if these respondents are not entered into the datafiles but simply ignored because then they will not be accounted for in any reports. For example, if test administrators are allowed to excluded certain mentally or physical handicapped students from the assessment but if these students are not accounted for in the presentation of the overall achievement of the sample, then the survey results may be severely biased. It is therefore important that each respondent is entered into the datafiles. If the respondent was excluded, then this should be indicated in a specially designed variable. The codes of this variable should be verified against the information in the participation indicator variables for each respondent.
9. Checking for inconsistencies in the data
The criteria on which the consistency checks are based usually de-pend on the way and sequence in which questions and items were asked (e.g. for some questions a certain number of responses is required, or responses must be given in a special way). Some ques-tions could be answered independently from each other, whereas, in other cases, questions were logically related to other questions.
For the purpose of data verification inconsistency checks can often be classified as follows:

72
Data preparation and managementModule 10
73
Data verification
• Inconsistencies between the answers to particular questions for a given respondent (e.g. inconsistencies between answers to a dependent question and the corresponding filter question).
• Inconsistencies between the responses of different respondents to particular questions (e.g. answers of students of the same class to variables referring to the class).
• Inconsistencies between class- and school level aggregates of student questions.
It is always good to establish the data verification rules for inconsistencies while the data collection instruments are being prepared so that decisions related to the response format of the questions can be made taking the complexity of the data verification procedures and the analytical treatment of the data into account.
Some questions are asked and/or coded in terms of more than one variable. The data verification rules applicable to such variables then depend on whether the variables were related to each other and on whether open-ended codes or a fixed set of codes were used.
Further problems arise when data that are missing are not properly distinguished from “zero” values. For example, suppose in a questionnaire for school principals there is a question asking for the enrolment rates of boys and girls. If the school principal in an all girls-school leaves out the question asking for the boys enrolment rates implying that the omission means a “zero”, then the coder might enter a missing code for this question to the datafile which is misleading. An extra data verification step needs then to be applied (that in this case would cross-check the variables for boys and girls enrolments) in order to check for these problems and to avoid a distortion of the corresponding sample estimates.
Sometimes there are some questions which provide a checklist in which respondents are asked to either check or omit each of the response options. The coders are, for example, asked to code the checked options to “2”, the not-checked options to “1”. A potential problem is that this type of coding does not allow a distinction

72
Data preparation and managementModule 10
73
Data verification
between cases where a student did not check any of the response options because none of the options applied and cases where a student omitted the whole question. However, in the analysis it is important to know whether a respondent omitted the whole question or whether he or she did not check a particular response option. It is best to avoid such problems by not using such response formats.
Establishing data verification rules for split variables with open-ended codes is more difficult, in particular when they were only partially answered. If the question requires a composite answer and only one component of the answer has to be given, then the decision has to be made whether to interpret the missing answer as missing, zero, or whether some form of imputation should take place.
Relationships between filter and dependent questions need to be verified. Sometimes these relationships are made explicit by a statement like: “If you answered “No” to question 3 then please go to question 6”. In other questions the dependency is not explicitly stated, but the answer to a first question should condition the answer to some following questions. If the patterns of answers are consistent, we would expect that when a filter question was answered “No”, its dependent questions would have either been skipped (in case of explicit dependence) or answered in a negative way. In both of these cases the corresponding variables could then be recoded to a “logical not applicable” code and the calculation of statistics would then be based only on the variables with a positive answer to the filter question.

74
Data preparation and managementModule 10
75
Data verification
Data verification procedures using WinDEMWinDEM offers some simple data verification procedures. All the procedures are found under the “Verify” menu. The following section describes some of the fundamental ones:
1. Unique ID check
There must be only one record within a file for each unit of analysis surveyed. This verification procedure checks whether each record has been allocated with a unique identification code.
2. Column check
When a series of similar variables exist in a file, it is possible that the enterer skips a variable or enters a variable twice, and consequently a column shift occurs. This can be avoided if you introduce variables in the datafile at regular positions in the codebook, into which the data entry personnel must enter a blank value. In order to be recognized by the automatic checking routines of the WinDEM program, the names of these variables must have the prefix “CHECK”. Column shift should not occur if the data enters followed these directions of entering the blank values. You can also see that the data entry proceeded correctly by looking at the “Table entry” from the “view” menu.
3. Validation check
As mentioned before, WinDEM assures that the values are within the range specified in the structure file unless the data puncher explicitly confirms the out-of-range values entered. This validation criteria check will show all the variables of all the cases that have been “confirmed” to contain out-of-range values. This can be useful especially when many data enterers are involved in the survey study.

74
Data preparation and managementModule 10
75
Data verification
4. Merge check
WinDEM allows you to check the consistency between variables. This check detects records in a datafile that do not have matches in a related datafile for a higher level of data aggregation. For example, a survey in which data is collected from the students and from the school principals of the schools in which the students are enrolled. In such a case, the student data could be recorded in a student datafile with the name “student.DBF”, and the data from the school principals could be recorded in a school datafile with the name “school.DBF”. To check whether each student in the student datafile has a matching school principal in the school datafile, the school identification code “IDSCHOOL” must exist in both the student datafile and the school datafile.
Using “Merge check” from the “Verify” menu, you can select the variables (or variable combinations) by which the records in the selected data file are matched against the records in the higher-level aggregated data file. The software will ask you to specify the datafile against which to check the merge of the current datafile in the “File Open Dialog”.
The program will notify you if some errors are found. The software will ask you if you want to open the data verification report for further details.
5. Double coding check
In order to produce high-quality data, it is sometimes recommended to enter data into two different computers (requiring two different data enterers). This allows you to examine if the two files have exactly the same structures and the values on all records. In order to check this, however, you will have to have these two files under different names and the two corresponding codebooks on one computer.

Data preparation and managementModule 10
76 77
It is often desirable to integrate the cleaned data into a database management system which allows for efficient use of the collected information. This section provides a brief overview on the establishment of such a management system.
The format of the data after data entry and data verification processes have been completed, is often not the best format for the use in data analyses. In order to manipulate, analyze and report the information collected in a convenient and efficient way, the data needs to be organized in a database system. Such a database system is a structured aggregation of data-elements which can be related and linked to each other through specified relationships. The data-elements can then be accessed through specified criteria and through a set of transaction operations, which are usually implemented through a data-retrieval language. In such a database system the links between the physical data stored in the computer, their conceptual representation, and the views of the users on the data are implemented through a database management system. The database system ensures that: (a) information is stored with as little redundancy as possible; (b) data are stored in a way which is independent of the application and the storage is independent of the users’ view on the data; (c) inconsistencies between different datafiles are avoided; and (d) data can be stored centrally and be shared and controlled by a single security system.
7 Database construction and database management

Data preparation and managementModule 10
76 77
For the purpose of database construction all data need first to be organized in logical entities such that the data-elements are logically de-coupled especially with respect to different levels of data aggregation. Different conceptual data-models are used in the design of database systems which are associated with different functional tasks.
The researcher communicates with the database through a set of commands consisting of keywords and a syntax for instructions which makes it possible: (a) to derive the required output such as reports and data analyses; (b) to describe the format of the data-elements in a database; and (c) to maintain and update the data. The researcher can then relate variables and respondents to each other and analyze the generated information.
If the primary focus of the researcher is data analysis, then the use of statistical packages with integrated data management capabilities are often valuable. For this purpose the Statistical Analysis System (SAS) is currently the most promising candidate. It allows the researcher to generate and link data structures and to programme data analysis requests without requiring software development expertise.

Data preparation and managementModule 10
78
The careful planning and implementation of data management are essential to obtain accurate and valid survey results and to avoid delays in survey administration. Computing staff should therefore be consulted from the very beginning of a research project.
This module has shown that data management issues are relevant, and must be planned, during almost all phases of a research project; starting from the design of the data collection instruments and the development of the coding schemes, through the design of the data collection methods and field administration procedures, the setting of quality standards, the data entry and data verification, and finishing with database construction. To implement each of these steps, various technologies are available and it is the task of the researcher to decide which procedures are most appropriate for the survey design given administrative, logistical, and economic constraints.
Conclusion8

Since 1992 UNESCO’s International Institute for Educational Planning (IIEP) has been working with Ministries of Education in Southern and Eastern Africa in order to undertake integrated research and training activities that will expand opportunities for educational planners to gain the technical skills required for monitoring and evaluating the quality of basic education, and to generate information that can be used by decision-makers to plan and improve the quality of education. These activities have been conducted under the auspices of the Southern and Eastern Africa Consortium for Monitoring Educational Quality (SACMEQ).
Fifteen Ministries of Education are members of the SACMEQ Consortium: Botswana, Kenya, Lesotho, Malawi, Mauritius, Mozambique, Namibia, Seychelles, South Africa, Swaziland, Tanzania (Mainland), Tanzania (Zanzibar), Uganda, Zambia, and Zimbabwe.
SACMEQ is officially registered as an Intergovernmental Organization and is governed by the SACMEQ Assembly of Ministers of Education.
In 2004 SACMEQ was awarded the prestigious Jan Amos Comenius Medal in recognition of its “outstanding achievements in the field of educational research, capacity building, and innovation”.
These modules were prepared by IIEP staff and consultants to be used in training workshops presented for the National Research Coordinators who are responsible for SACMEQ’s educational policy research programme. All modules may be found on two Internet Websites: http://www.sacmeq.org and http://www.unesco.org/iiep.