Data in Brief - QUT ePrintseprints.qut.edu.au/103915/1/103915.pdf · Decorin DCN TCCTGATGACCGCGACTT...
10
Data Article Data defining markers of human neural stem cell lineage potential Lotta E. Oikari, Rachel K. Okolicsanyi, Lyn R. Griffiths, Larisa M. Haupt n Genomics Research Centre, Institute of Health and Biomedical Innovation, Queensland University of Technology, Brisbane, Australia article info Article history: Received 18 December 2015 Received in revised form 15 January 2016 Accepted 11 February 2016 Available online 19 February 2016 Keywords: Neural stem cells Neural progenitor cells Proteoglycans Lineage Characterisation abstract Neural stem cells (NSCs) and neural progenitor cells (NPCs) are self-renewing and multipotent cells, however, NPCs are considered to be more lineage-restricted with a reduced self-renewing capa- city. We present data comparing the expression of 21 markers encompassing pluripotency, self-renewal (NSC) as well as neuronal and glial (astrocyte and oligodendrocyte) lineage specification and 28 extracellular proteoglycan (PG) genes and their regulatory enzymes between embryonic stem cell (ESC)-derived human NSCs (hNSC H9 cells, Thermo Fisher) and human cortex-derived normal human NPCs (nhNPCs, Lonza). The data demonstrates expression differences of multiple lineage and proteoglycan-associated genes between hNSC H9 cells and nhNPCs. Data interpretation of mar- kers and proteoglycans defining NSC and neural cell lineage characterisation can be found in “Cell surface heparan sulfate pro- teoglycans as novel markers of human neural stem cell fate deter- mination” (Oikari et al. 2015) [1]. & 2016 The Authors. Published by Elsevier Inc. This is an open access article under the CC BY license (http://creativecommons.org/licenses/by/4.0/). Contents lists available at ScienceDirect journal homepage: www.elsevier.com/locate/dib Data in Brief http://dx.doi.org/10.1016/j.dib.2016.02.030 2352-3409/& 2016 The Authors. Published by Elsevier Inc. This is an open access article under the CC BY license (http://creativecommons.org/licenses/by/4.0/). DOI of original article: http://dx.doi.org/10.1016/j.scr.2015.12.011 n Correspondence to: Genomics Research Centre, Institute of Health and Biomedical Innovation, School of Biomedical Sciences, Queensland University of Technology, 60 Musk Ave, Kelvin Grove, QLD 4059, Australia. E-mail address: [email protected] (L.M. Haupt). Data in Brief 7 (2016) 206–215
-
Upload
nguyenhanh -
Category
Documents
-
view
212 -
download
0
Transcript of Data in Brief - QUT ePrintseprints.qut.edu.au/103915/1/103915.pdf · Decorin DCN TCCTGATGACCGCGACTT...

Contents lists available at ScienceDirect
Data in Brief
Data in Brief 7 (2016) 206–215
http://d2352-34(http://c
DOIn Corr
ScienceE-m
journal homepage: www.elsevier.com/locate/dib
Data Article
Data defining markers of human neural stem celllineage potential
Lotta E. Oikari, Rachel K. Okolicsanyi, Lyn R. Griffiths,Larisa M. Haupt n
Genomics Research Centre, Institute of Health and Biomedical Innovation, Queensland University ofTechnology, Brisbane, Australia
a r t i c l e i n f o
Article history:Received 18 December 2015Received in revised form15 January 2016Accepted 11 February 2016Available online 19 February 2016
Keywords:Neural stem cellsNeural progenitor cellsProteoglycansLineageCharacterisation
x.doi.org/10.1016/j.dib.2016.02.03009/& 2016 The Authors. Published by Elsereativecommons.org/licenses/by/4.0/).
of original article: http://dx.doi.org/10.1016espondence to: Genomics Research Centrs, Queensland University of Technology, 60ail address: [email protected] (L.M. H
a b s t r a c t
Neural stem cells (NSCs) and neural progenitor cells (NPCs) areself-renewing and multipotent cells, however, NPCs are consideredto be more lineage-restricted with a reduced self-renewing capa-city. We present data comparing the expression of 21 markersencompassing pluripotency, self-renewal (NSC) as well as neuronaland glial (astrocyte and oligodendrocyte) lineage specification and28 extracellular proteoglycan (PG) genes and their regulatoryenzymes between embryonic stem cell (ESC)-derived human NSCs(hNSC H9 cells, Thermo Fisher) and human cortex-derived normalhuman NPCs (nhNPCs, Lonza). The data demonstrates expressiondifferences of multiple lineage and proteoglycan-associated genesbetween hNSC H9 cells and nhNPCs. Data interpretation of mar-kers and proteoglycans defining NSC and neural cell lineagecharacterisation can be found in “Cell surface heparan sulfate pro-teoglycans as novel markers of human neural stem cell fate deter-mination” (Oikari et al. 2015) [1].
& 2016 The Authors. Published by Elsevier Inc. This is an openaccess article under the CC BY license
(http://creativecommons.org/licenses/by/4.0/).
vier Inc. This is an open access article under the CC BY license
/j.scr.2015.12.011e, Institute of Health and Biomedical Innovation, School of BiomedicalMusk Ave, Kelvin Grove, QLD 4059, Australia.aupt).

L.E. Oikari et al. / Data in Brief 7 (2016) 206–215 207
Specifications Table
SM
TH
DE
E
D
ubject area
Cell biology ore specific sub-ject areaHuman neural stem cell (hNSC) and human neural progenitor cell (hNPC)marker characterisation
ype of data
Text file, graphs and immunofluorescence images ow data wasacquiredin vitro culture/expansion and phase-contrast fluorescence microscopy data forphenotypic analysis was obtained on an Olympus IX81 inverted fluorescentmicroscope via Volocity Imaging package; raw Q-PCR data was obtained onApplied Biosystems 7900HT Fast Real-Time PCR system
ata format
Analysed xperimentalfactorshNSC H9 and nhNP cells were cultured under basal medium conditions
xperimentalfeatures
hNSC H9 cells (Thermo Fisher) were cultured as a monolayer and nhNP cells(Lonza) were cultured as neurospheres in standard maintenance mediumprovided by the manufacturer. RNA was harvested and transcribed to cDNA andgene expression of a panel of 49 genes examined by Q-PCR. Specific neural celllineage markers were further detected through immunofluorescence (IF)
ata sourcelocation
Institute of Health and Biomedical Innovation, Queensland University of Tech-nology, Brisbane, Queensland Australia
ata accessibility
Data is provided in this article D� The data provides an extensive panel of markers for better characterisation of human NSCs and NPCs.� The data demonstrates significant and specific differences in expression of pluripotency, NSC self-
renewal and neural cell lineage markers between hNSCs and hNPCs.� The marker profile data could be used to identify and differentiate between the two cell types to
improve their efficacy in research or therapeutic applications.� The data provides information on the proteoglycan profile of human NSCs and NPCs providing
potential new additional markers defining lineage progression of NSCs to NPCs.
1. Data
We compared the expression of 49 selected genes between human NSCs (hESC-derived hNSC H9 cells,Thermo Fisher) and normal human progenitor cells (nhNPCs, Lonza) following short-term culture underbasal growth conditions. Q-PCR data was obtained for pluripotency genes, NSC, neuronal, astrocyte andoligodendrocyte lineage defining genes (n¼21; Table 1.) (Fig. 1) with several of these markers also detectedthrough immunofluorescence (IF) (Fig. 2) using specific antibodies (Table 3). In addition, Q-PCR data wasobtained for 28 heparan and chondroitin sulphate proteoglycan biosynthesis enzymes and core proteingenes (Table 2) ubiquitous to the neural niche [1–7] in hNSC H9 cells and nhNPCs (Figs. 3 and 4). The datapresented provides information on self-renewal and multilineage potential as well as proteoglycanexpression differences between the two neural stem/progenitor cell types.
2. Experimental design, materials and methods
2.1. Cell culture
Gibcos human neural stem cells derived from NIH-approved H9 (WA09) embryonic stem cells (hNSCH9 cells) were cultured as a monolayer on Geltrexs coated culture dishes in StemPros NSC serum-freemedium (NSC SFM) containing KnockOUT™ DMEM/F-12 supplemented with 2% StemPros Neural Sup-plement, 20 ng/ml FGFb and EGF and 2mM GlutaMAX™ (cells and culture reagents obtained from Thermo

Table 1Primer sequences of NSC and neural lineage related genes.
Gene Symbol Forward primer Reverse primer RefSeq Ref
CD44 CD44 AGCAACTGAGACAGCAACCA AGACGTACCAGCCATTTGTGT NM_000610.3Doublecortin Dcx TATGCGCCGAAGCAAGTCTC TACAGGTCCTTGTGCTTCCG NM_178152.2Enolase 2 ENO2 TGCACAGGCCAGATCAAGAC ACAGCACACTGGGATTACGG NM_001975.2Forkhead box A2 FOXA2 CTGGTCGTTTGTTGTGGCTG GGAGGAGTAGCCCTCGG NM_021784.4Galactosylceramidase GalC GCCAAGCGTTACCATGATTT TTTCACTCGCTGGAGACCTT NM_001201402.1 [8]Glial fibrillary acidic protein GFAP GAGGTTGAGAGGGACAATCTGG GTGGCTTCATCTGCTTCCTGTC NM_002055.4Human telomerase hTERT GACGTGGAAGATGAGCGTG GACGACGTACACACTCATC NM_001193376.1 NM_198253.2 [9]Microtubule associated protein 2 MAP2 GACTGCAGCTCTGCCTTTAG AAGTAAATCTTCCTCCACTGTGAC NM_002374.3Mushahi I MSI I TGACCAAGAGATCCAGGGGT CGATTGCGCCAGCACTTTAT NM_002442.3Nanog homeobox NANOG ACCTCAGCTACAAACAGGTGAA AAAGGCTGGGGTAGGTAGGT NM_024865.2Nestin NES CTCAGCTTTCAGGACCCCAA GTCTCAAGGGTAGCAGGCAA NM_006617.1Neurofilament M NEFM TGCAGTCCAAGAGCATCGAG GGATGGTGTCCTGGTAGCTG NM_005382.2Neurogenin 2 NEUROG2 AGAGCCAACTAAGATGTTCGTCA CGATCCGAGCAGCACTAACA NM_024019.3Oligodendrocyte transcription factor 1 OLIG1 GTCATCCTGCCCTACTCAGC CTGCCCAGCAGTAGGATGTAG NM_138983.2 [8]Oligodendrocyte transcription factor 2 OLIG2 GACAAGCTAGGAGGCAGTGG CGGCTCTGTCATTTGCTTCT NM_005806.3 [8]POU Class 5 homeobox 1 (OCT3/4) OCT3/4 ATCTTCAGGAGATATGCAAAGCAGA TGATCTGCTGCAGTGTGGGT NM_002701.4SRY box 1 SOX1 CAACCAGGACCGGGTCAAAC CCTCGGACATGACCTTCCAC NM_005986.2SRY box 2 SOX2 CCACCTACAGCATGTCCTACTCG GGGAGGAAGAGGTAACCACAGG NM_003106.3 [10]S100 Calcium binding protein B S100B TTCTGGAAGGGAGGGAGACA CTCCTGCTCTTTGATTTCCTCT NM_006272.2Vimentin VIM GGACCAGCTAACCAACGACAAA CGCATTGTCAACATCCTGTCTG NM_003380.3βIII tubulin TUBB3 GGCCAAGTTCTGGGAAGTCAT CTCGAGGCACGTACTTGTGA NM_06086.3
L.E.Oikari
etal./
Data
inBrief
7(2016)
206–215
208
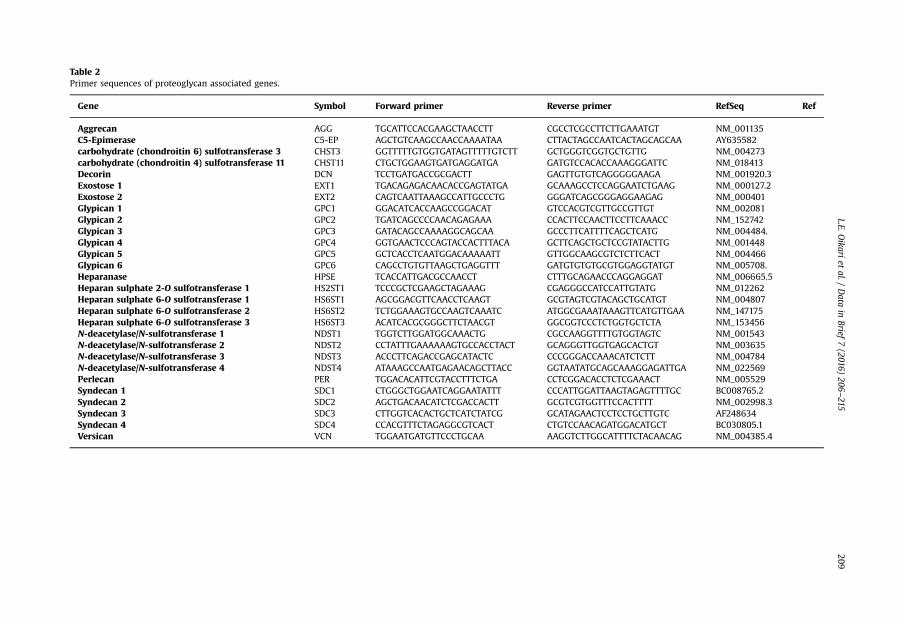
Table 2Primer sequences of proteoglycan associated genes.
Gene Symbol Forward primer Reverse primer RefSeq Ref
Aggrecan AGG TGCATTCCACGAAGCTAACCTT CGCCTCGCCTTCTTGAAATGT NM_001135C5-Epimerase C5-EP AGCTGTCAAGCCAACCAAAATAA CTTACTAGCCAATCACTAGCAGCAA AY635582carbohydrate (chondroitin 6) sulfotransferase 3 CHST3 GGTTTTTGTGGTGATAGTTTTTGTCTT GCTGGGTCGGTGCTGTTG NM_004273carbohydrate (chondroitin 4) sulfotransferase 11 CHST11 CTGCTGGAAGTGATGAGGATGA GATGTCCACACCAAAGGGATTC NM_018413Decorin DCN TCCTGATGACCGCGACTT GAGTTGTGTCAGGGGGAAGA NM_001920.3Exostose 1 EXT1 TGACAGAGACAACACCGAGTATGA GCAAAGCCTCCAGGAATCTGAAG NM_000127.2Exostose 2 EXT2 CAGTCAATTAAAGCCATTGCCCTG GGGATCAGCGGGAGGAAGAG NM_000401Glypican 1 GPC1 GGACATCACCAAGCCGGACAT GTCCACGTCGTTGCCGTTGT NM_002081Glypican 2 GPC2 TGATCAGCCCCAACAGAGAAA CCACTTCCAACTTCCTTCAAACC NM_152742Glypican 3 GPC3 GATACAGCCAAAAGGCAGCAA GCCCTTCATTTTCAGCTCATG NM_004484.Glypican 4 GPC4 GGTGAACTCCCAGTACCACTTTACA GCTTCAGCTGCTCCGTATACTTG NM_001448Glypican 5 GPC5 GCTCACCTCAATGGACAAAAATT GTTGGCAAGCGTCTCTTCACT NM_004466Glypican 6 GPC6 CAGCCTGTGTTAAGCTGAGGTTT GATGTGTGTGCGTGGAGGTATGT NM_005708.Heparanase HPSE TCACCATTGACGCCAACCT CTTTGCAGAACCCAGGAGGAT NM_006665.5Heparan sulphate 2-O sulfotransferase 1 HS2ST1 TCCCGCTCGAAGCTAGAAAG CGAGGGCCATCCATTGTATG NM_012262Heparan sulphate 6-O sulfotransferase 1 HS6ST1 AGCGGACGTTCAACCTCAAGT GCGTAGTCGTACAGCTGCATGT NM_004807Heparan sulphate 6-O sulfotransferase 2 HS6ST2 TCTGGAAAGTGCCAAGTCAAATC ATGGCGAAATAAAGTTCATGTTGAA NM_147175Heparan sulphate 6-O sulfotransferase 3 HS6ST3 ACATCACGCGGGCTTCTAACGT GGCGGTCCCTCTGGTGCTCTA NM_153456N-deacetylase/N-sulfotransferase 1 NDST1 TGGTCTTGGATGGCAAACTG CGCCAAGGTTTTGTGGTAGTC NM_001543N-deacetylase/N-sulfotransferase 2 NDST2 CCTATTTGAAAAAAGTGCCACCTACT GCAGGGTTGGTGAGCACTGT NM_003635N-deacetylase/N-sulfotransferase 3 NDST3 ACCCTTCAGACCGAGCATACTC CCCGGGACCAAACATCTCTT NM_004784N-deacetylase/N-sulfotransferase 4 NDST4 ATAAAGCCAATGAGAACAGCTTACC GGTAATATGCAGCAAAGGAGATTGA NM_022569Perlecan PER TGGACACATTCGTACCTTTCTGA CCTCGGACACCTCTCGAAACT NM_005529Syndecan 1 SDC1 CTGGGCTGGAATCAGGAATATTT CCCATTGGATTAAGTAGAGTTTTGC BC008765.2Syndecan 2 SDC2 AGCTGACAACATCTCGACCACTT GCGTCGTGGTTTCCACTTTT NM_002998.3Syndecan 3 SDC3 CTTGGTCACACTGCTCATCTATCG GCATAGAACTCCTCCTGCTTGTC AF248634Syndecan 4 SDC4 CCACGTTTCTAGAGGCGTCACT CTGTCCAACAGATGGACATGCT BC030805.1Versican VCN TGGAATGATGTTCCCTGCAA AAGGTCTTGGCATTTTCTACAACAG NM_004385.4
L.E.Oikari
etal./
Data
inBrief
7(2016)
206–215
209

Fig. 1. Q-PCR analysis of pluripotency, NSC self-renewal, neuronal and glial lineage marker genes in hNSC H9 cells and nhNPCs.Relative expression in hNSC H9 cells and nhNPCs of: (A) pluripotency markers; (B) NSC self-renewal markers; (C) neuronallineage defining markers; and (D) glial lineage defining markers. Relative expression normalised to 18 S, error bars¼SD, sta-tistical significance: n po0.05, nn po0.01, nnn po0.001.
L.E. Oikari et al. / Data in Brief 7 (2016) 206–215210
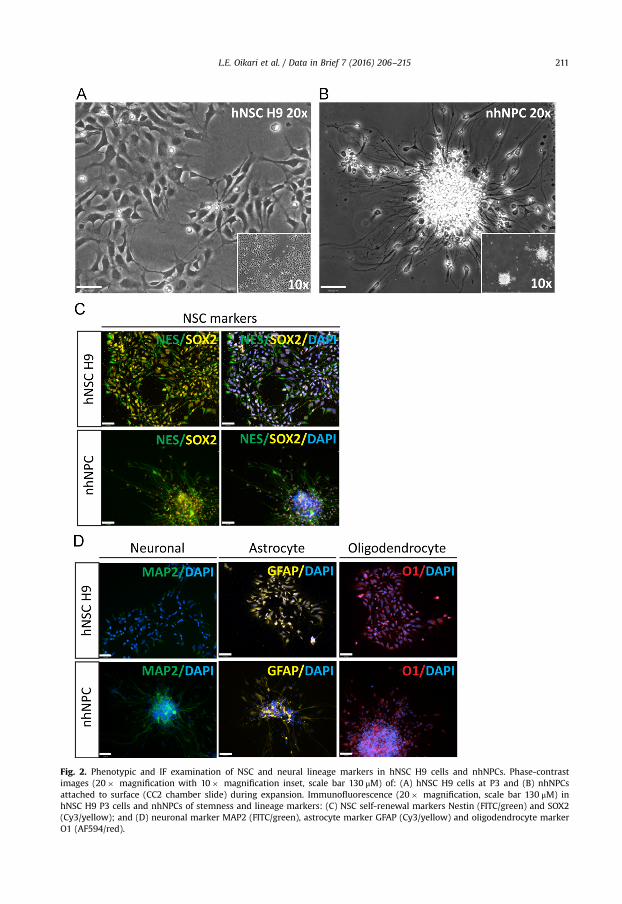
Fig. 2. Phenotypic and IF examination of NSC and neural lineage markers in hNSC H9 cells and nhNPCs. Phase-contrastimages (20� magnification with 10� magnification inset, scale bar 130 μM) of: (A) hNSC H9 cells at P3 and (B) nhNPCsattached to surface (CC2 chamber slide) during expansion. Immunofluorescence (20� magnification, scale bar 130 μM) inhNSC H9 P3 cells and nhNPCs of stemness and lineage markers: (C) NSC self-renewal markers Nestin (FITC/green) and SOX2(Cy3/yellow); and (D) neuronal marker MAP2 (FITC/green), astrocyte marker GFAP (Cy3/yellow) and oligodendrocyte markerO1 (AF594/red).
L.E. Oikari et al. / Data in Brief 7 (2016) 206–215 211
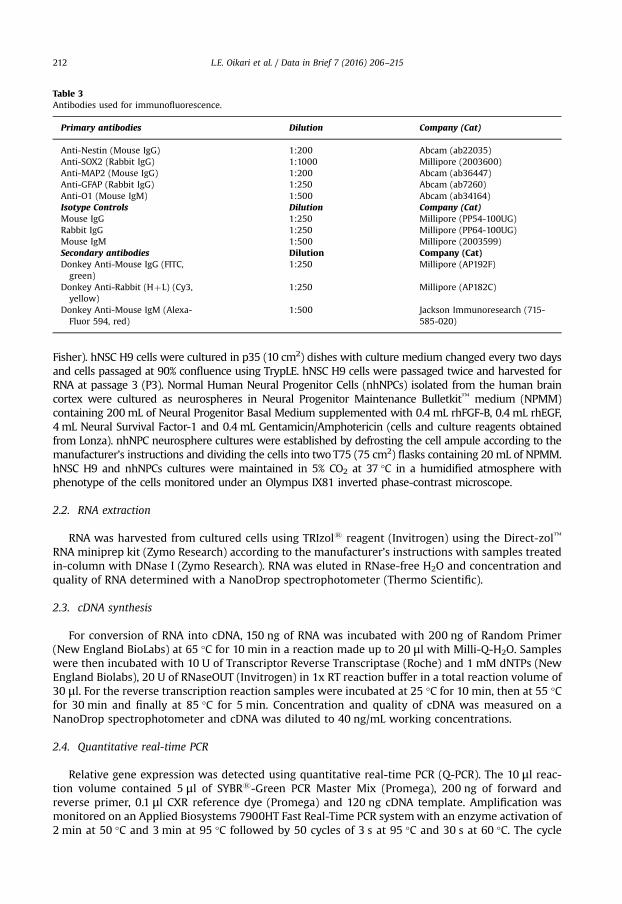
Table 3Antibodies used for immunofluorescence.
Primary antibodies Dilution Company (Cat)
Anti-Nestin (Mouse IgG) 1:200 Abcam (ab22035)Anti-SOX2 (Rabbit IgG) 1:1000 Millipore (2003600)Anti-MAP2 (Mouse IgG) 1:200 Abcam (ab36447)Anti-GFAP (Rabbit IgG) 1:250 Abcam (ab7260)Anti-O1 (Mouse IgM) 1:500 Abcam (ab34164)Isotype Controls Dilution Company (Cat)Mouse IgG 1:250 Millipore (PP54-100UG)Rabbit IgG 1:250 Millipore (PP64-100UG)Mouse IgM 1:500 Millipore (2003599)Secondary antibodies Dilution Company (Cat)Donkey Anti-Mouse IgG (FITC,green)
1:250 Millipore (AP192F)
Donkey Anti-Rabbit (HþL) (Cy3,yellow)
1:250 Millipore (AP182C)
Donkey Anti-Mouse IgM (Alexa-Fluor 594, red)
1:500 Jackson Immunoresearch (715-585-020)
L.E. Oikari et al. / Data in Brief 7 (2016) 206–215212
Fisher). hNSC H9 cells were cultured in p35 (10 cm2) dishes with culture medium changed every two daysand cells passaged at 90% confluence using TrypLE. hNSC H9 cells were passaged twice and harvested forRNA at passage 3 (P3). Normal Human Neural Progenitor Cells (nhNPCs) isolated from the human braincortex were cultured as neurospheres in Neural Progenitor Maintenance Bulletkit™ medium (NPMM)containing 200 mL of Neural Progenitor Basal Medium supplemented with 0.4 mL rhFGF-B, 0.4 mL rhEGF,4 mL Neural Survival Factor-1 and 0.4 mL Gentamicin/Amphotericin (cells and culture reagents obtainedfrom Lonza). nhNPC neurosphere cultures were established by defrosting the cell ampule according to themanufacturer’s instructions and dividing the cells into two T75 (75 cm2) flasks containing 20 mL of NPMM.hNSC H9 and nhNPCs cultures were maintained in 5% CO2 at 37 °C in a humidified atmosphere withphenotype of the cells monitored under an Olympus IX81 inverted phase-contrast microscope.
2.2. RNA extraction
RNA was harvested from cultured cells using TRIzols reagent (Invitrogen) using the Direct-zol™
RNA miniprep kit (Zymo Research) according to the manufacturer’s instructions with samples treatedin-column with DNase I (Zymo Research). RNA was eluted in RNase-free H2O and concentration andquality of RNA determined with a NanoDrop spectrophotometer (Thermo Scientific).
2.3. cDNA synthesis
For conversion of RNA into cDNA, 150 ng of RNA was incubated with 200 ng of Random Primer(New England BioLabs) at 65 °C for 10 min in a reaction made up to 20 μl with Milli-Q-H2O. Sampleswere then incubated with 10 U of Transcriptor Reverse Transcriptase (Roche) and 1 mM dNTPs (NewEngland Biolabs), 20 U of RNaseOUT (Invitrogen) in 1x RT reaction buffer in a total reaction volume of30 μl. For the reverse transcription reaction samples were incubated at 25 °C for 10 min, then at 55 °Cfor 30 min and finally at 85 °C for 5 min. Concentration and quality of cDNA was measured on aNanoDrop spectrophotometer and cDNA was diluted to 40 ng/mL working concentrations.
2.4. Quantitative real-time PCR
Relative gene expression was detected using quantitative real-time PCR (Q-PCR). The 10 μl reac-tion volume contained 5 μl of SYBRs-Green PCR Master Mix (Promega), 200 ng of forward andreverse primer, 0.1 μl CXR reference dye (Promega) and 120 ng cDNA template. Amplification wasmonitored on an Applied Biosystems 7900HT Fast Real-Time PCR systemwith an enzyme activation of2 min at 50 °C and 3 min at 95 °C followed by 50 cycles of 3 s at 95 °C and 30 s at 60 °C. The cycle

Fig. 3. Q-PCR analysis of proteoglycan biosynthesis enzyme gene expression in hNSC H9 cells and nhNPCs. Relative expressionin hNSC H9 cells and nhNPCs of: (A) HS chain synthesising and modifying enzymes; (B) HS chain N-deacelylating/N-sulfatingenzymes; (C) HS chain sulfating enzymes; and (D) CS chain sulfating enzymes. Relative expression normalised to 18 S, errorbars¼SD, statistical significance: n po0.05, nn po0.01, nnn po0.001.
L.E. Oikari et al. / Data in Brief 7 (2016) 206–215 213
threshold (Ct) values were normalised against the endogenous control 18 S (forward primerTTCGAGGCCCTGTAATTGGA, reverse primer GCA GCAACTTAATATACGCTAT) Ct values (ΔCt value)included in each run, and relative gene expression was determined by the ΔΔCt value (2(�ΔCt)). Forease of graphic presentation of relative gene expression, ΔΔCt values were multiplied by 106. Primersequences for detected NSC and neural lineage genes are presented in Table 1 and primer sequencesfor heparan and chondroitin sulphate proteoglycan associated genes are presented in Table 2.
2.4.1. Immunofluorescence (IF)Expression of selected NSC and neural lineage marker proteins were detected via IF using an Olympus
IX81 inverted phase-contrast fluorescent microscope and images acquired using Volocity software (Perkin-Elmer) on a Hamamatsu Orca camera. For imaging, cells were plated on 8-well CC2-coated chamber slides(Lab-Tek) at 20–30�104 cells/well and cells were cultured for 3–4 days before fixing and staining. Briefly,

Fig. 4. Q-PCR analysis of proteoglycan core protein gene expression in hNSC H9 cells and nhNPCs. Relative expression in hNSC H9 cellsand nhNPCs of: cell surface HSPGs (A) syndecans; (B) glypicans; and extracellular CSPGs and HSPGs (C) aggrecan, versican, perlecanand decorin. Relative expression normalised to 18 S, error bars¼SD, statistical significance: n po0.05, nn po0.01, nnn po0.001.
L.E. Oikari et al. / Data in Brief 7 (2016) 206–215214
culture medium was removed, cells rinsed with 1� PBS with Ca2þ and Mg2þ and fixed with 4% paraf-ormaldehyde. After this cells were blocked (5% Donkey serum, 1% BSA in PBS with or without 0.1% Triton-Xto allow permeabilisation) and primary antibodies were incubated overnight at 4 °C. Isotype control anti-bodies were used as a negative control. After 24 h incubation, primary antibodies were removed, cellsrinsed with 1� PBS with Ca2þ and Mg2þ and cells incubated with secondary antibodies for 2 h at roomtemperature. Finally, cells were rinsed with 1� PBS with Ca2þ and Mg2þ and slides mounted with DAPI(ab104139, Abcam). Antibodies and dilutions used are presented in Table 3.
2.4.2. Statistical analysisFor Q-PCR analysis each gene was detected in quadruplicate per sample. Paired t-test was used to
determine statistical significance and defined as * po0.5, ** po0.01 and *** po0.001. Error barsrepresent SD.
L.E. Oikari et al. / Data in Brief 7 (2016) 206–215 215
Acknowledgements
This work was supported through Queensland University of Technology postgraduate researchawards (QUTPRA and IPRS) and the Estate of the late Clem Jones AO.
Appendix A. Supplementary material
Supplementary data associated with this article can be found in the online version at http://dx.doi.org/10.1016/j.dib.2016.02.030.
References
[1] L.E. Oikari, et al., Cell surface heparan sulfate proteoglycans as novel markers of human neural stem cell fate determination,Stem Cell. Res. 16 (1) (2015) 92–104.
[2] H. Cui, et al., Proteoglycans in the central nervous system: role in development, neural repair, and Alzheimer's disease,IUBMB Life 65 (2) (2013) 108–120.
[3] J.L. Dreyfuss, et al., Heparan sulfate proteoglycans: structure, protein interactions and cell signaling, Acad. Bras. Cienc. 81 (3)(2009) 409–429.
[4] M. Ford-Perriss, et al., Localisation of specific heparan sulfate proteoglycans during the proliferative phase of braindevelopment, Dev. Dyn. 227 (2) (2003) 170–184.
[5] C.I. Gama, et al., Sulfation patterns of glycosaminoglycans encode molecular recognition and activity, Nat. Chem. Biol. 2 (9)(2006) 467–473.
[6] F. Lanner, et al., Heparan sulfation-dependent fibroblast growth factor signaling maintains embryonic stem cells primed fordifferentiation in a heterogeneous state, Stem Cells 28 (2) (2010) 191–200.
[7] N. Maeda, et al., Functions of chondroitin sulfate and heparan sulfate in the developing brain, Neurochem. Res. 36 (7) (2011)1228–1240.
[8] Y. Wu, et al., Regulation of glioblastoma multiforme stem-like cells by inhibitor of DNA binding proteins and oligoden-droglial lineage-associated transcription factors, Cancer Sci. 103 (6) (2012) 1028–1037.
[9] R.M. Samsonraj, et al., Telomere length analysis of human mesenchymal stem cells by quantitative PCR, Gene 519 (2) (2013)348–355.
[10] D.A. Ovchinnikov, et al., Transgenic human ES and iPS reporter cell lines for identification and selection of pluripotentstem cells in vitro, Stem Cell. Res. 13 (2) (2014) 251–261.


![Traffic Safety Culture in Australia - QUT ePrintseprints.qut.edu.au/62957/1/CONF_King_TrafficSafetyCultureAustralia.pdf · Traffic Safety Culture in Australia [1] Traffic safety culture](https://static.fdocuments.in/doc/165x107/5cc36a9588c993ab2e8cbf11/traffic-safety-culture-in-australia-qut-traffic-safety-culture-in-australia.jpg)