Data Ferrett 2016 Hawaiifiles.hawaii.gov/.../2016/16_10_present_DataFerrett_2016_Hawaii.pdf ·...
48
11/2/2016 1 ACS Public Use Microdata Samples DataFerrett Hawaii Jerry Wong Data Dissemination Specialist U.S. Census Bureau Outline Summary Data vs. Microdata Fundamentals of PUMS Data Geography and the PUMS Accessing PUMS Data Issues to be Aware of Documentation and Guidance 2
Transcript of Data Ferrett 2016 Hawaiifiles.hawaii.gov/.../2016/16_10_present_DataFerrett_2016_Hawaii.pdf ·...

11/2/2016
1
ACS Public Use Microdata Samples
DataFerrett
Hawaii
Jerry WongData Dissemination Specialist
U.S. Census Bureau
Outline
Summary Data vs. Microdata
Fundamentals of PUMS Data
Geography and the PUMS
Accessing PUMS Data
Issues to be Aware of
Documentation and Guidance
2

11/2/2016
2
Summary Data Versus Microdata
Microdata
Dataset of individual responses to questionnaire
Enables custom tables and analyses
Limitations: edits to protect privacy, can’t study small areas
Summary Data
Premade or published tables
Easy to get, even for small areas
Limitations: fixed content
3 3
Summary Data
4
Source: 2010 ACS 1-year Estimates. Table B04001. FIRST ANCESTRY REPORTED
4

11/2/2016
3
5
Microdata
Source: 2010 ACS 1-year PUMS file
6
Microdata in SAS
Source: 2010 ACS 1-year PUMS file.

11/2/2016
4
Outline
Summary data vs. Microdata
Fundamentals of PUMS Data
Geography and the PUMS
Accessing PUMS Data
Issues to be Aware of
Documentation and Guidance
7
Public Use
Microdata
Sample
anonymized, downloadable
records of individual people
a representative sample of the population
What are PUMS data?
8

11/2/2016
5
9
PUMS Overview
PUMS sample is a subsample of ACS interviews, one percent of all US households
PUMS is a “weighted” sample Weighting variables must be used in analysis
A set of two files - housing units and persons
ACS produces 1-, 3-, and 5-year PUMS files
Available as SAS files, CSV files, via DataFerrett and redistributors such as IPUMS
10
Why Use PUMS?
Data needed for a tabulation or a specific universe not supported by standard ACS tables (e.g., population groups by single year of age)
Statistical analysis required to understand relationships between economic, demographic or housing variables (e.g., correlation analysis)
Can create new measures using multiple variables or other people in household (spouse’s occupation, same-sex couples, number of kids)

11/2/2016
6
ACS PUMS Availability Produced every year since 2000
Person-level files includes about 250 variables
Housing unit files include about 200 variables
Includes people in housing units and group quarters
Includes many useful constructed variables (e.g., poverty status, subfamily identification, etc.)
Includes collapsed codes for some variables (e.g., race, Hispanic origin, ancestry, place of birth, industry, occupation, etc.)
11
Person records in ACS PUMS
(millions)
Person records in ACS complete data
(millions)
Population represented
(millions)
2001 1.2 1.2 2852002 1.2 1.2 2872003 1.2 1.2 2902004 1.2 1.2 2932005 2.9 4.5 2962006 3.0 4.5 2982007 3.0 4.5 3012008 3.0 4.5 3042009 3.0 4.5 3072010 3.1 4.5 3092011 3.1 5.0 312
12

11/2/2016
7
Types of PUMS Files Released
We release 3 new PUMS files every year
1 year PUMS (example: 2011 1-year PUMS)
October
3-year PUMS (example: 2009-2011 3-year PUMS)
December
5-year PUMS (example: 2007-2011 5-year PUMS)
January
Most documentation released one week prior to
data
13
Modifications to Multiyear PUMS
Multiyear PUMS have the same cases and geography as their component 1-year files
How are multiyear PUMS different from single year? Weights are produced using latest population estimate
“vintages”
Coding schemes and dollar amounts are standardized
Why use the multiyear PUMS files? For studying small groups, where more cases are needed
When analysis is also making use of multiyear summary data
14
11/2/2016
8
Outline
Summary data vs. Microdata
Fundamentals of PUMS Data
Geography and the PUMS
Accessing PUMS Data
Issues to be Aware of
Documentation and Guidance
15
Limited Geographic Detail
Geographic identifiers are region, division, state, PUMA
PUMAs can be used to identify most cities of 100,000+ and many metropolitan areas, but not all Combinations of adjacent counties and census tracts
within states
Also, divisions of geo areas (counties/cities)
PUMS is not designed for statistical analysis of small geographic areas
16
11/2/2016
9
17
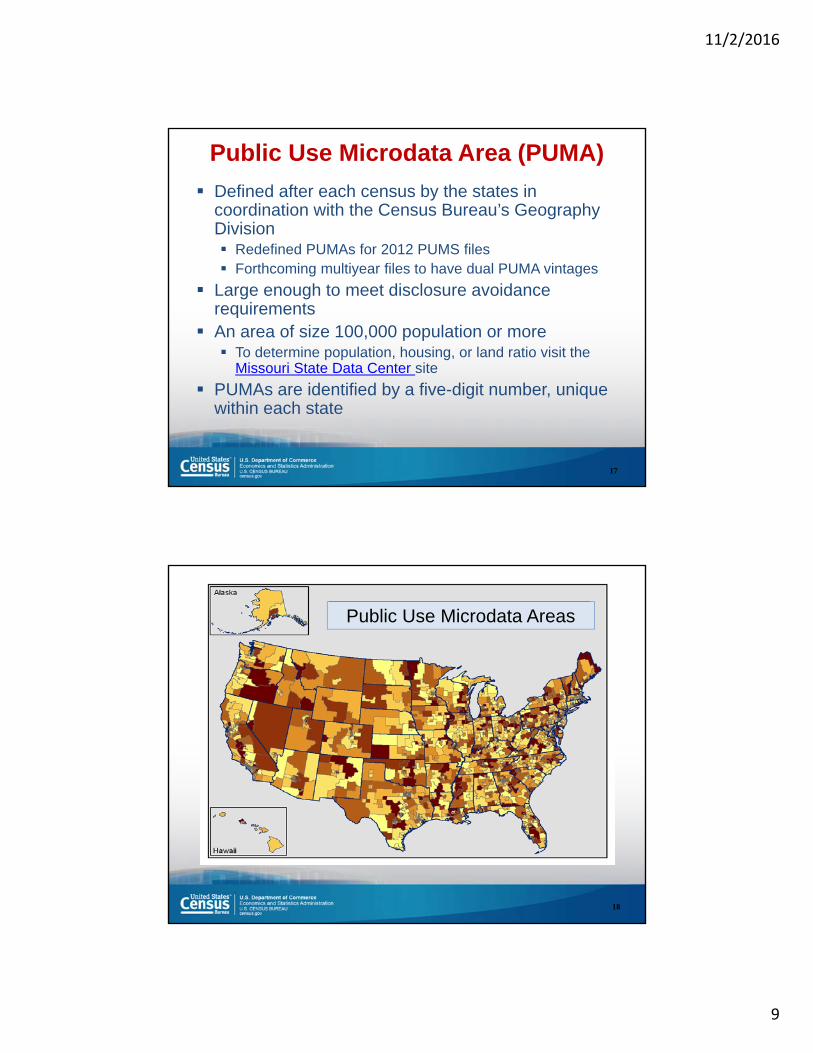
Public Use Microdata Area (PUMA)
Defined after each census by the states in coordination with the Census Bureau’s Geography Division Redefined PUMAs for 2012 PUMS files Forthcoming multiyear files to have dual PUMA vintages
Large enough to meet disclosure avoidance requirements
An area of size 100,000 population or more To determine population, housing, or land ratio visit the
Missouri State Data Center site
PUMAs are identified by a five-digit number, unique within each state
18
Public Use Microdata Areas

11/2/2016
10
PUMA Maps
19
http://www.census.gov/geo/maps-data/maps/2010puma/st15_hi.html
20
2010 Census – PUMA Reference Map Hawaii County
11/2/2016
11
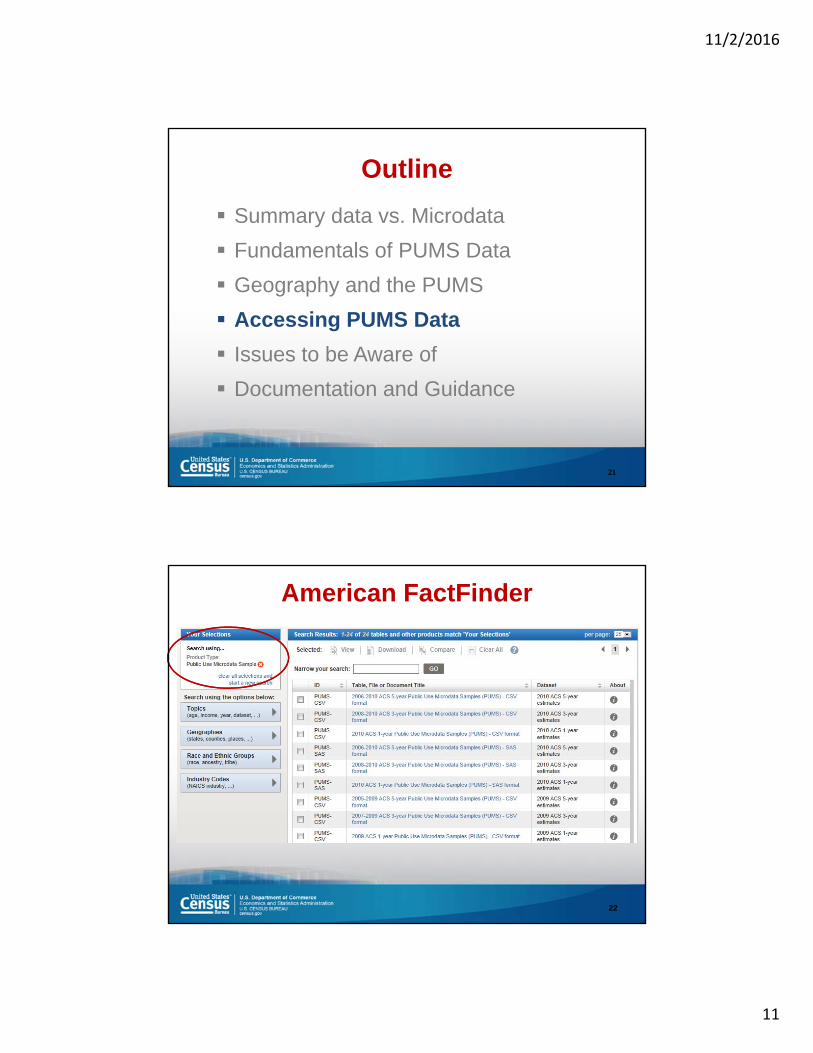
Outline
Summary data vs. Microdata
Fundamentals of PUMS Data
Geography and the PUMS
Accessing PUMS Data
Issues to be Aware of
Documentation and Guidance
21
American FactFinder
22
11/2/2016
12
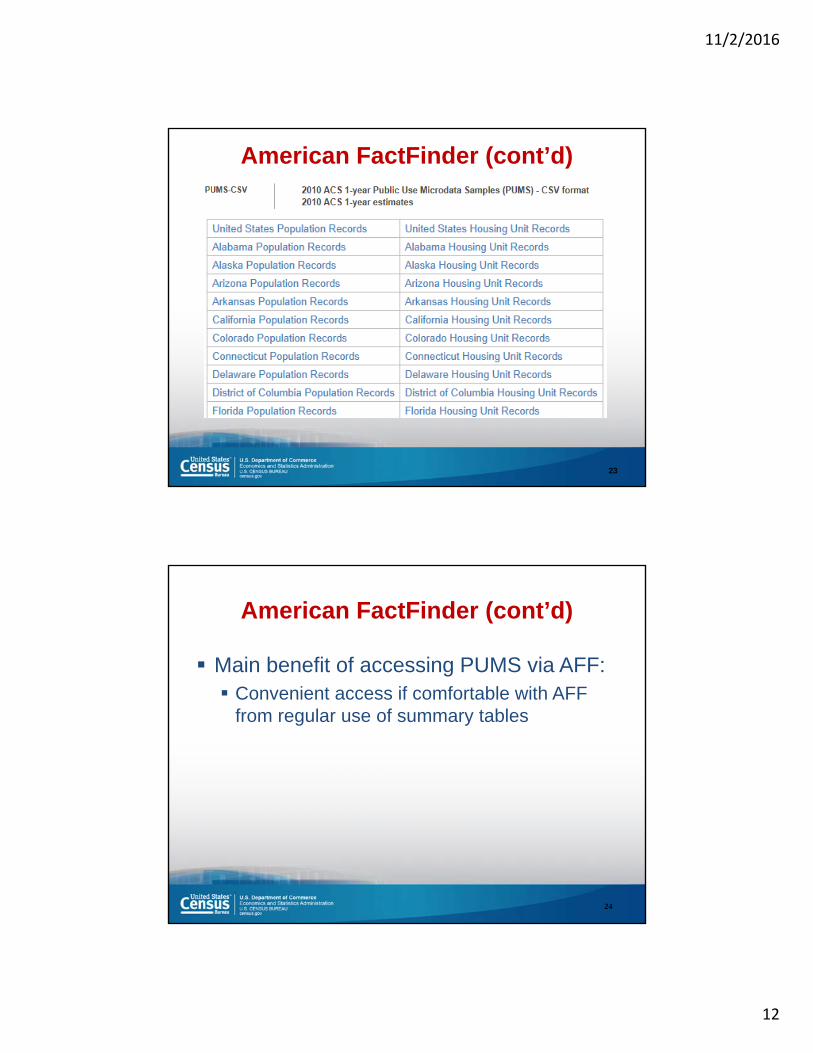
American FactFinder (cont’d)
23
Main benefit of accessing PUMS via AFF: Convenient access if comfortable with AFF
from regular use of summary tables
24
American FactFinder (cont’d)
11/2/2016
13
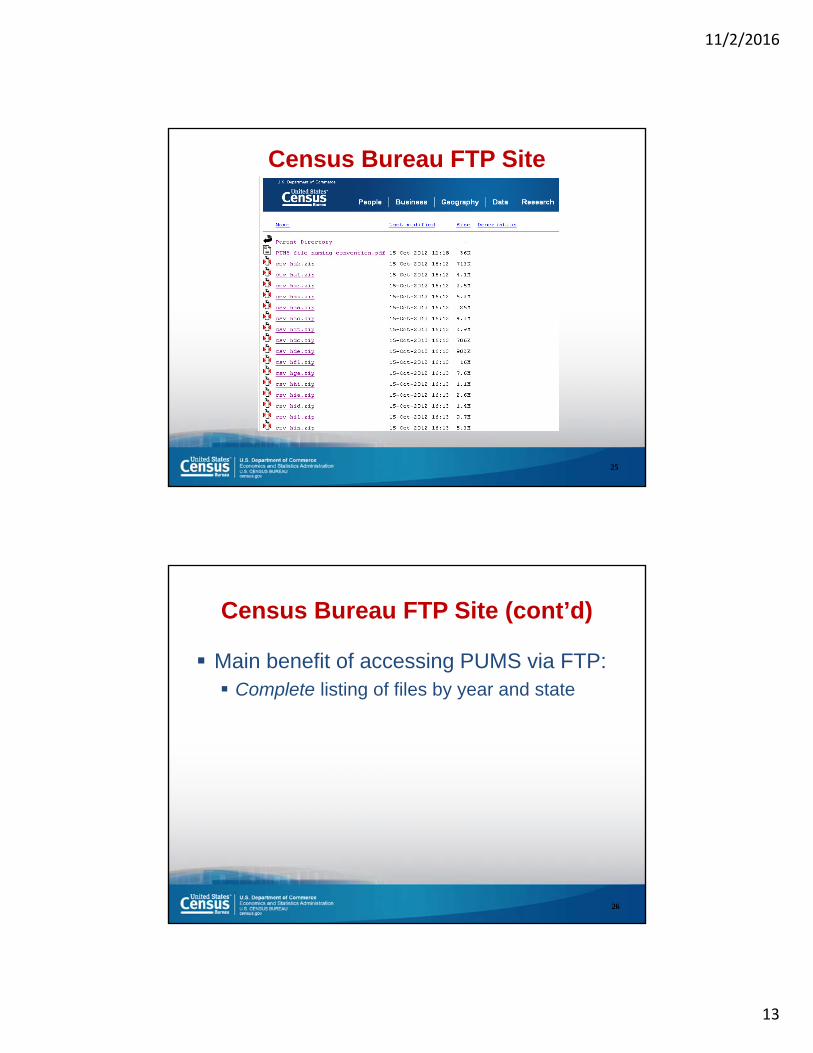
Census Bureau FTP Site
25
Census Bureau FTP Site (cont’d)
Main benefit of accessing PUMS via FTP: Complete listing of files by year and state
26

11/2/2016
14
DataFerrett
27
DataFerrett (cont’d)
Main benefit of accessing PUMS via DF: Menu driven system doesn’t require
knowledge of a stats package (i.e. SAS, SPSS, etc.)
Ability to download variables individually
28

11/2/2016
15
Outline
Summary data vs. Microdata
Fundamentals of PUMS Data
Geography and the PUMS
Accessing PUMS Data
Issues to be Aware of
Documentation and Guidance
29
Analyzing PUMS Data
National level files must be concatenated See PUMS ReadMe
Use SERIALNO variable to merge housing and person records to create complete file See PUMS ReadMe
30
11/2/2016
16
31
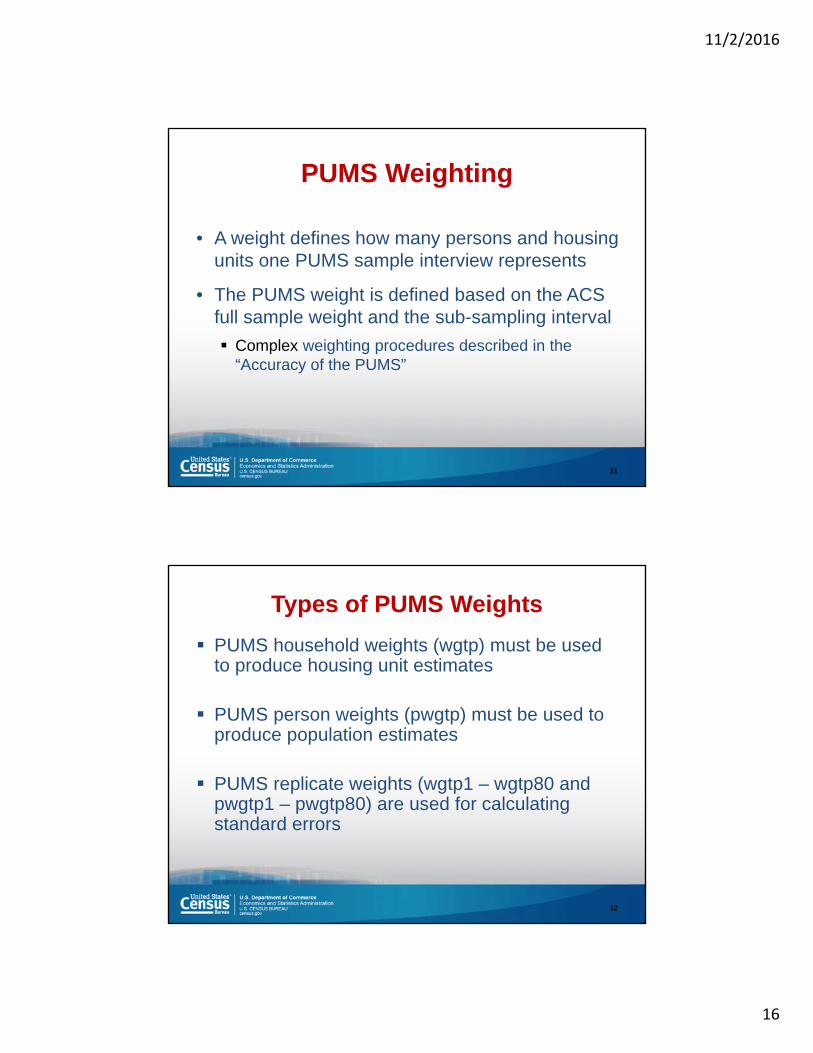
PUMS Weighting
• A weight defines how many persons and housing units one PUMS sample interview represents
• The PUMS weight is defined based on the ACS full sample weight and the sub-sampling interval
Complex weighting procedures described in the “Accuracy of the PUMS”
32
Types of PUMS Weights
PUMS household weights (wgtp) must be used to produce housing unit estimates
PUMS person weights (pwgtp) must be used to produce population estimates
PUMS replicate weights (wgtp1 – wgtp80 and pwgtp1 – pwgtp80) are used for calculating standard errors

11/2/2016
17
Estimating Variance with PUMS
Problem: PUMS is not a simple random sample Stratified samples with complex weighting
Sample drawn at household level (i.e., not a simple random sample of individuals)
Solutions: Use weighting variable and a “design factor”
Use weighting variable and 80 “replicate weights”
Both methods explained in “Accuracy of the PUMS”
33
Quick Check on Reliability
Examine unweighted data table or frequencies of sample counts
Be careful using estimates based on a small handful of cases
To obtain more cases: Use multiyear files
Combine geographic areas
34

11/2/2016
18
Extreme Values are Masked
PUMS files have top- and bottom-coding to avoid disclosure
Affects: Dollar-amount variables (all kinds of income,
mortgage, rent, utilities, property taxes, home value, property insurance costs)
Number of rooms and bedrooms
Age
Travel time to work, hours worked
35
Operational Variable Availability
Mode of data collection Mail-in distinguished from telephone/personal interview
Group quarters type Institutional is distinguished from non-institutional
Allocated data Identified in “data quality flag” variables
Month of data collection: not provided
36

11/2/2016
19
Outline
Summary data vs. Microdata
Fundamentals of PUMS Data
Geography and the PUMS
Accessing PUMS Data
Issues to be Aware of
Documentation and Guidance
37
PUMS Documentation
• Subjects in the PUMS
• Code Lists
• PUMS Top Coded and Bottom Coded Values
• PUMS Estimates for User Verification
• Accuracy of the PUMS
38
http://www.census.gov/acs/www/data_documentation/pums_documentation/

11/2/2016
20
PUMS Guidance
Compass Handbook on Using PUMS
http://www.census.gov/acs/www/guidance_for_data_users/handbooks/
soup-to-nuts overview of getting and using the data
Training PPT on Using PUMShttp://www.census.gov/acs/www/guidance_for_data_users/training_presentations/
overview of PUMS basics
39
DataFerrett

11/2/2016
21
The Census Bureau’s Breakthrough Technologies
TheDataWeb is an internet based distributed data network of public and private databases--a “virtual” data warehouse.
DataFerrett is a data mining, extraction, and tabulation tool that allows analysis of datasets available in TheDataWeb.
41
TheDataWeb Defined
An infrastructure for linking different databases into a single virtual data warehouse that supports different…
vendors
file structures
data types
file security models
42

11/2/2016
22
DataFerrett Defined
DataFerrett is an analytical interface to TheDataWeb. It allows a user to:
Browse (search & discover) all of the datasets that are accessible via TheDataWeb
Produce sophisticated analyses using tables, graphs, and maps
Select variables from multiple datasets and integrate data on-the-fly
43
What DataFerrett Can Do
Data manipulation through simple universe restrictions & variable recoding
Pre-merges hierarchical microdata files
Frequencies, cross- and multi-dimensional (nested) tables
Spreadsheet formulas
Maps & graphs
Save as HTML, PDF & JPEG
44

11/2/2016
23
Simple Cross-Tabulation
45
Data Visualization
46
Maps Graphs
Highlight spreadsheet rows or columns to create:

11/2/2016
24
Powerful Tabulation Capabilities
Simple table layout that supports:
47
• Flexible design• Frequencies and
trends• Spreadsheet math for
robust analysis • Complex nesting • Hide columns/rows• Applies weighting
variables• Fast results using large
datasets
DataFerrett Users
• Intended for:
– Users who cannot get what they need from pre-defined data tables
– Users needing quick, yet sophisticated tabulations
– Users that want to “play” with the data
48

11/2/2016
25
What We’re Working On
• Calculating variances on-the-fly for microdata tabulations
• Calculating margins of error for custom summations of aggregate data
• Integrating Google maps with DataFerrett thematic maps
49
Supports Multiple Data Types
50
(Needed for data integration)
Microdata: Individual transaction records, or survey response records. Data are often in multiple files (e.g. Household, Person, Geography files).
Aggregate (Macro) Data: Data that has already been tabulated. You must pick from variables or dimensions already tabulated (i.e. geography).
Timeseries: Data that can be tabulated by time periods from a cell in a table (poverty rate, or unemployment rate over time).
Longitudinal Data: Follows people over time (microdata).

11/2/2016
26
Exercise 1
Accessing:
2012 PUMS
Foreign Born and Year of Entry
Create a Recode for Year of Entry
All PUMAS within Hawaii
Create a Table
Create a Formula
51
www.census.gov

11/2/2016
27
Open DataSelect Data Tools and Apps
Click Data Tools & Apps Main
Scroll Down Page

11/2/2016
28
Click on DataFerrett
Launch Data Ferrett
11/2/2016
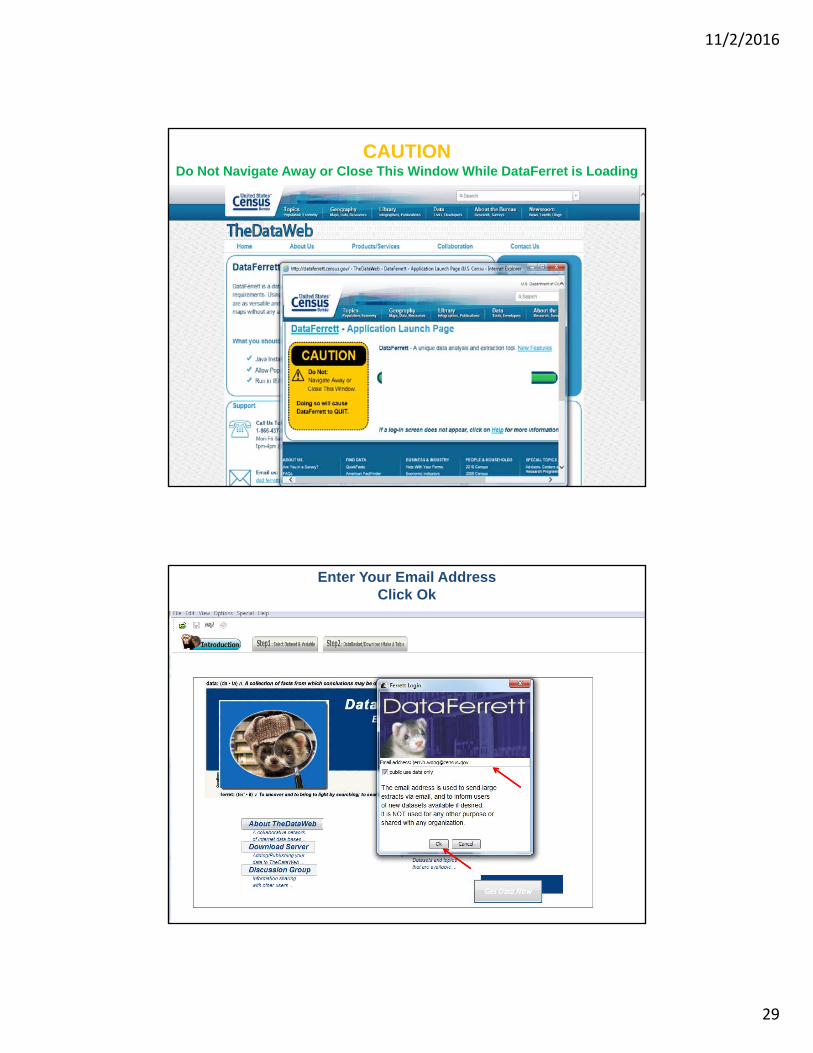
29
CAUTIONDo Not Navigate Away or Close This Window While DataFerret is Loading
Enter Your Email AddressClick Ok

11/2/2016
30
Get Data Now
Select a Datasetclick American Community Survey

11/2/2016
31
Select American Community Survey
Open PUMS to view years
Select 2014
Click View Variables (drop down)
Click Select All Topics and click Search Variables
11/2/2016
32
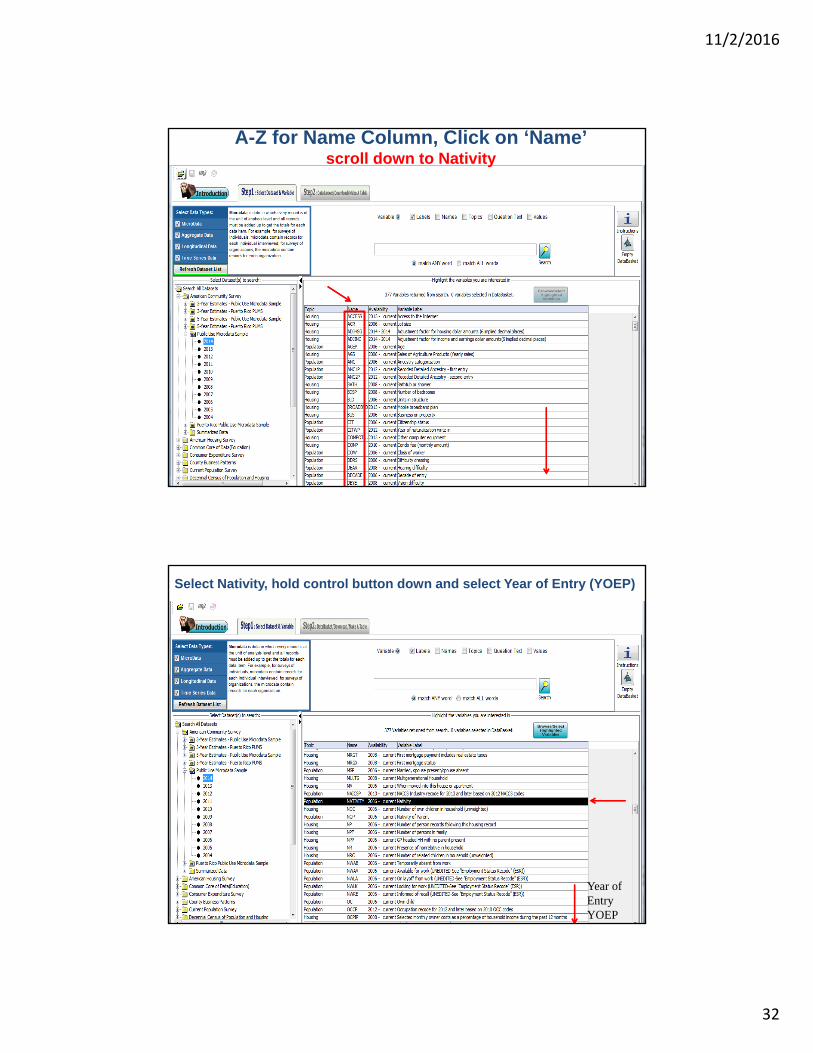
A-Z for Name Column, Click on ‘Name’scroll down to Nativity
Select Nativity, hold control button down and select Year of Entry (YOEP)
Year of Entry YOEP

11/2/2016
33
Select Nativity, hold control button down and select Year of Entry (YOEP) and click /Browse/Select Highlighted Variables (blue) Button
Year of Entry YOEP
Check ‘Select’ ACS Nativity,Highlight next variable ACS YOEP

11/2/2016
34
Check ‘Select’ ACS YOEPDeselect box for 1920 Not eligible – Born in US, Click OK
You have added 2 variables for your DataBasketClick OK

11/2/2016
35
Note: 2 Variables selected in DataBasketDouble Click to Select Geography Variable
Click Browse/Select Highlighted Variable Button
Select PUMA from types of geos available, highlight the PUMA code in the Hierarchies section and click ‘Use Hierarchy’
SelectPUMA
Hierarchies

11/2/2016
36
Double click Hawaii from ‘Select State of current residence’, Highlight Hawaii in middle box and click ‘Next Level’
Note: ALL PUMAs in Hawaii are Listed. Double Click Select All. They will be added to the Selected Geographies Areas (right side box), Click Finish
Select All
11/2/2016
37
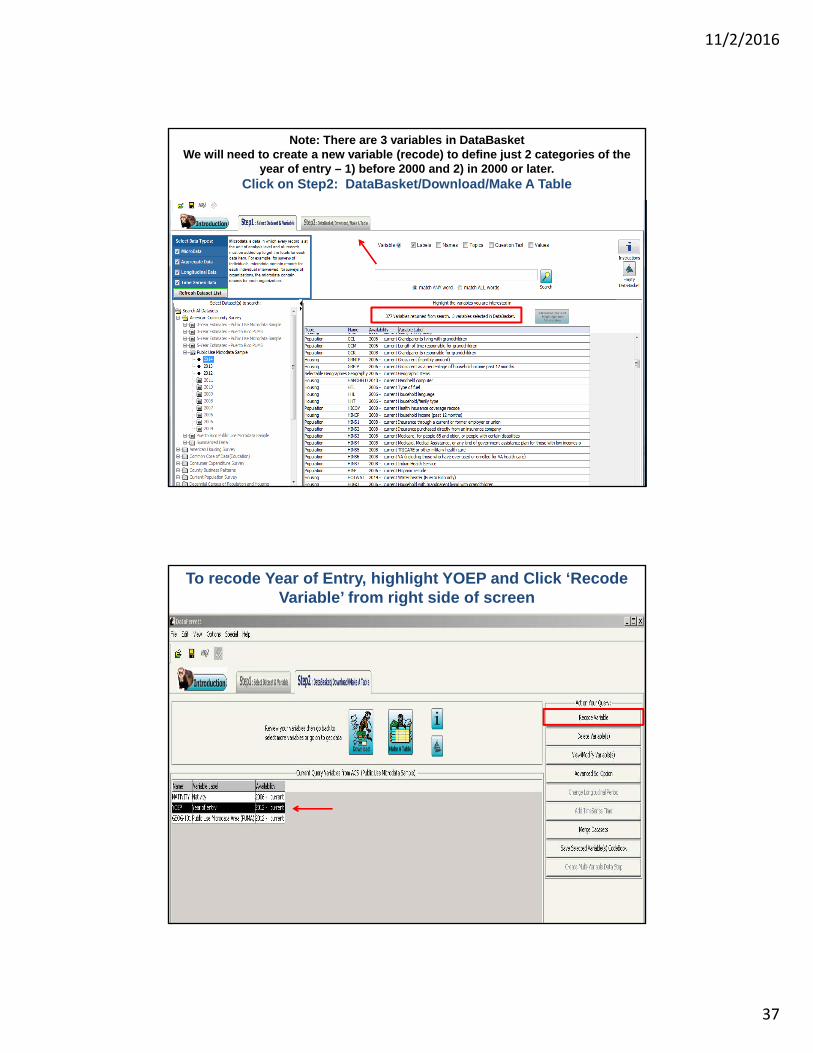
Note: There are 3 variables in DataBasketWe will need to create a new variable (recode) to define just 2 categories of the
year of entry – 1) before 2000 and 2) in 2000 or later. Click on Step2: DataBasket/Download/Make A Table
To recode Year of Entry, highlight YOEP and Click ‘Recode Variable’ from right side of screen

11/2/2016
38
Rename Recode1 to ‘Year of Entry Recode’ and highlight all of the categories from 1921 to 1999 and click Recode button below

11/2/2016
39
Note: there are two categories for the new recoded variable: RecodeValue1 and Not Elsewhere Classified
double click on ‘RecodeValue_1’ to change name to ‘Before 2000’ (Make sure to hit the Enter Key).
Double Click on ‘Not Elsewhere Classified’ to change name to ‘2000 or Later’ (Make sure to hit the Enter Key). Finish by Clicking OK
11/2/2016
40
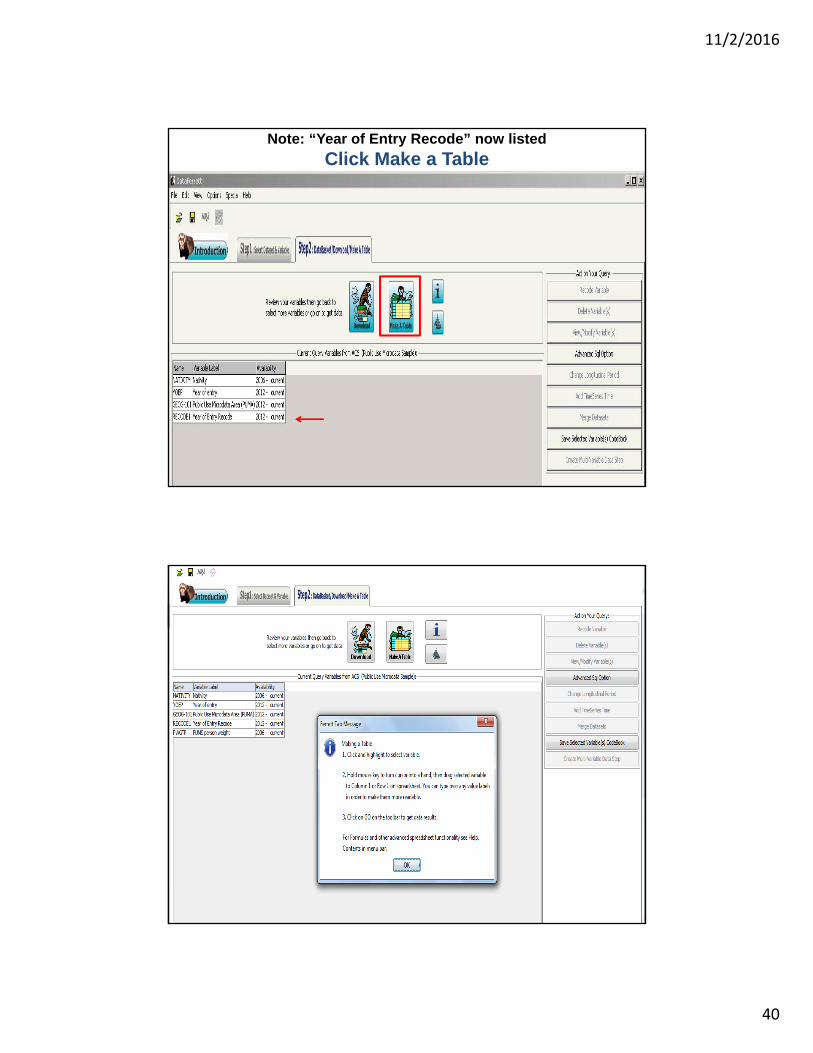
Note: “Year of Entry Recode” now listed
Click Make a Table
11/2/2016
41
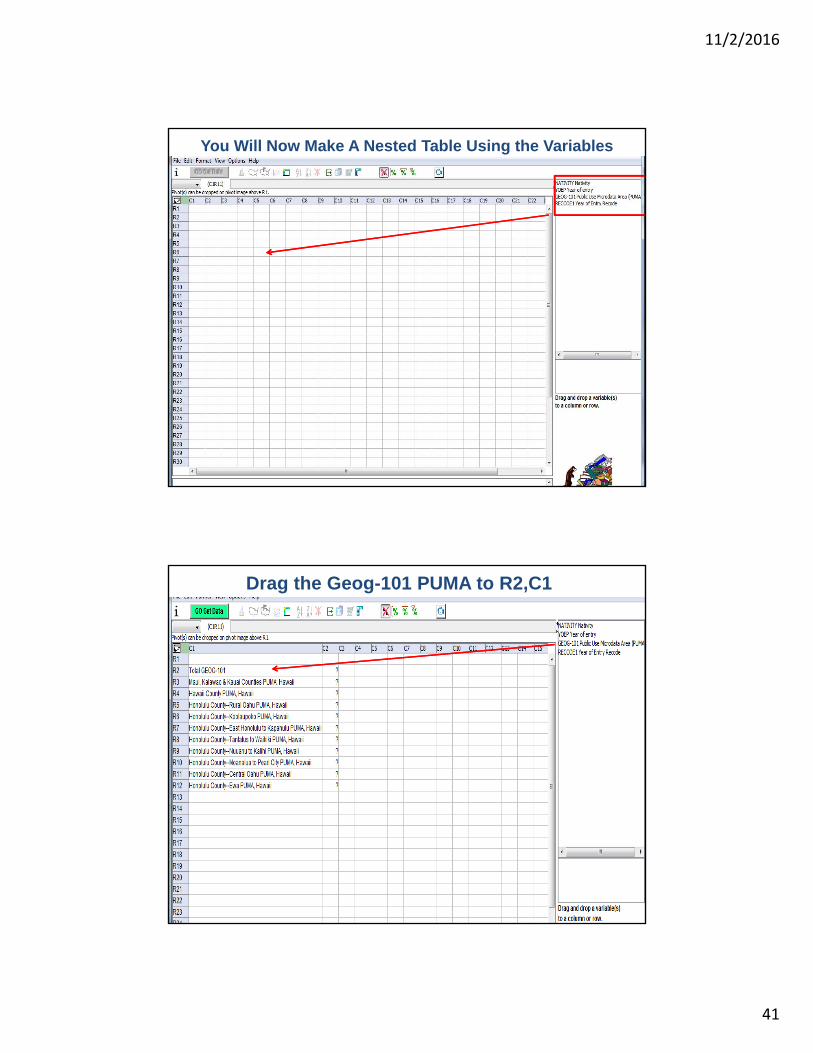
You Will Now Make A Nested Table Using the Variables
Drag the Geog-101 PUMA to R2,C1

11/2/2016
42
Drag Nativity variable to R1,C2
Nest the “Year of Entry Recode” variable on the columns by dropping onto any of the nativity Labels

11/2/2016
43
Click “GO Get Data”
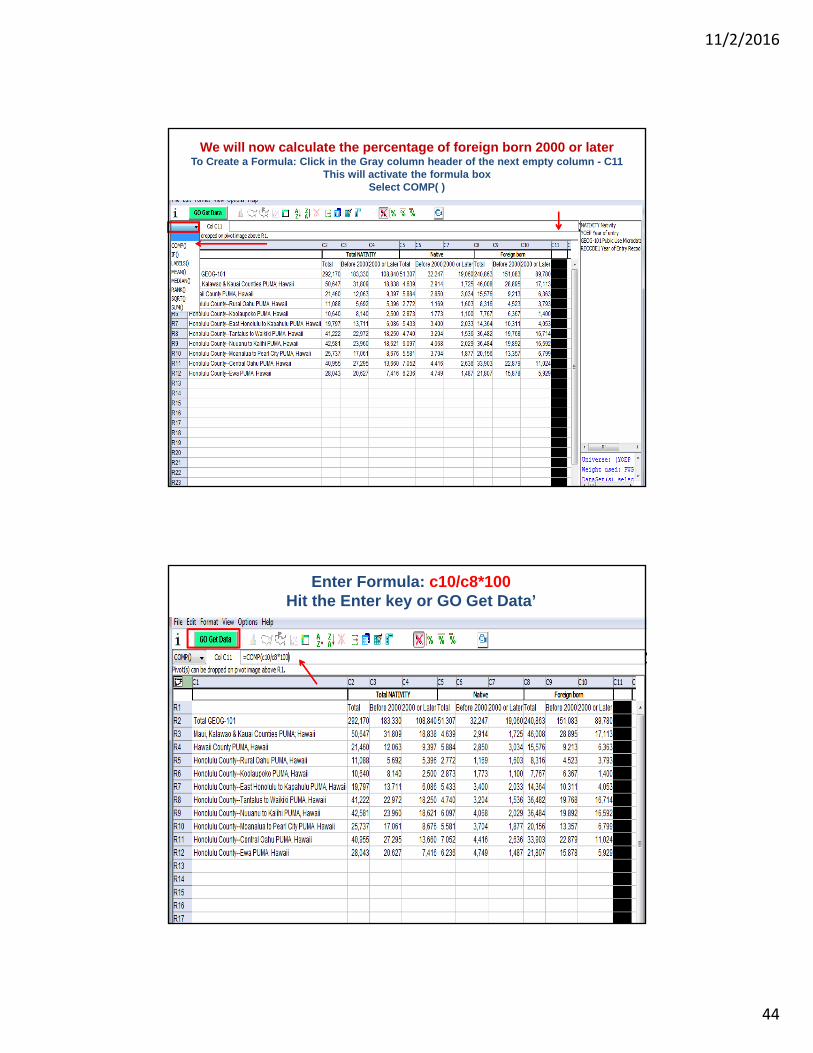
To Create a Formula: Click in the Gray column header of the next empty column (in this table it is column C11).
Click in the Formula bar directly below ‘GO Get Data’ and type =comp(c10/c8*100)Hit the Enter key
11/2/2016
44
We will now calculate the percentage of foreign born 2000 or laterTo Create a Formula: Click in the Gray column header of the next empty column - C11
This will activate the formula boxSelect COMP( )
Enter Formula: c10/c8*100Hit the Enter key or GO Get Data’

11/2/2016
45
Percentage Calculated
Click in the R1C11 cell to enter heading ‘% Entered Since 2000’
11/2/2016
46
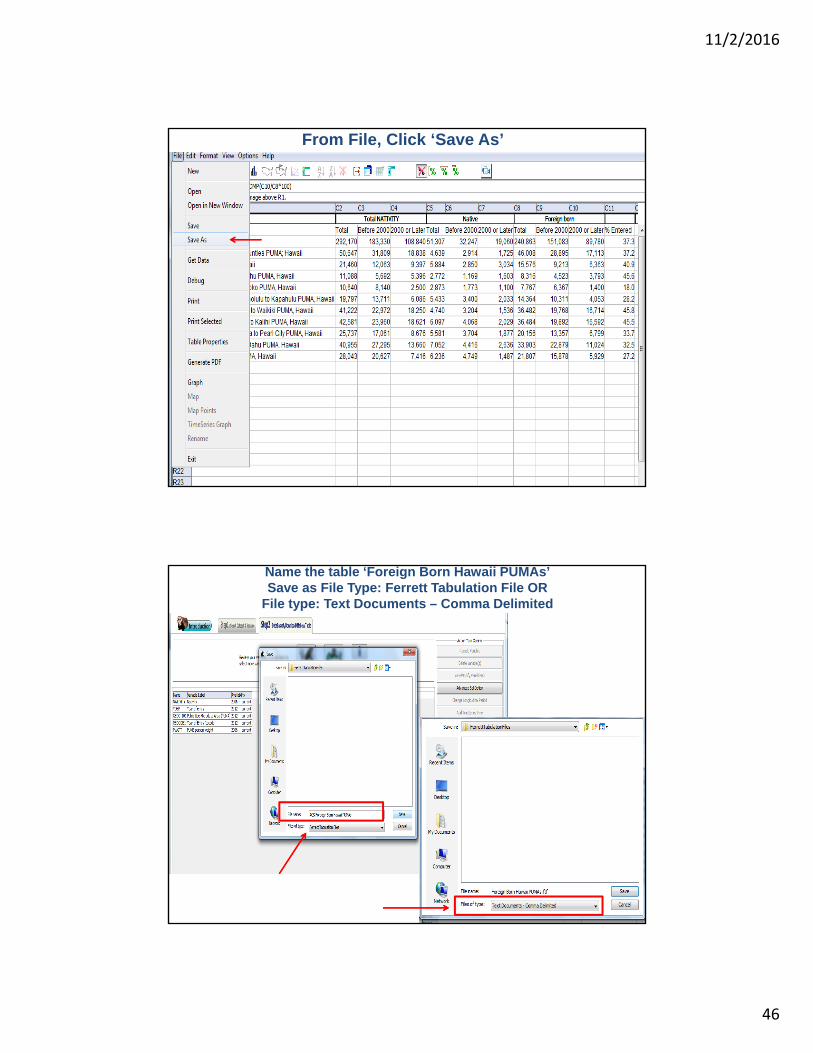
From File, Click ‘Save As’
Name the table ‘Foreign Born Hawaii PUMAs’Save as File Type: Ferrett Tabulation File OR
File type: Text Documents – Comma Delimited
11/2/2016
47
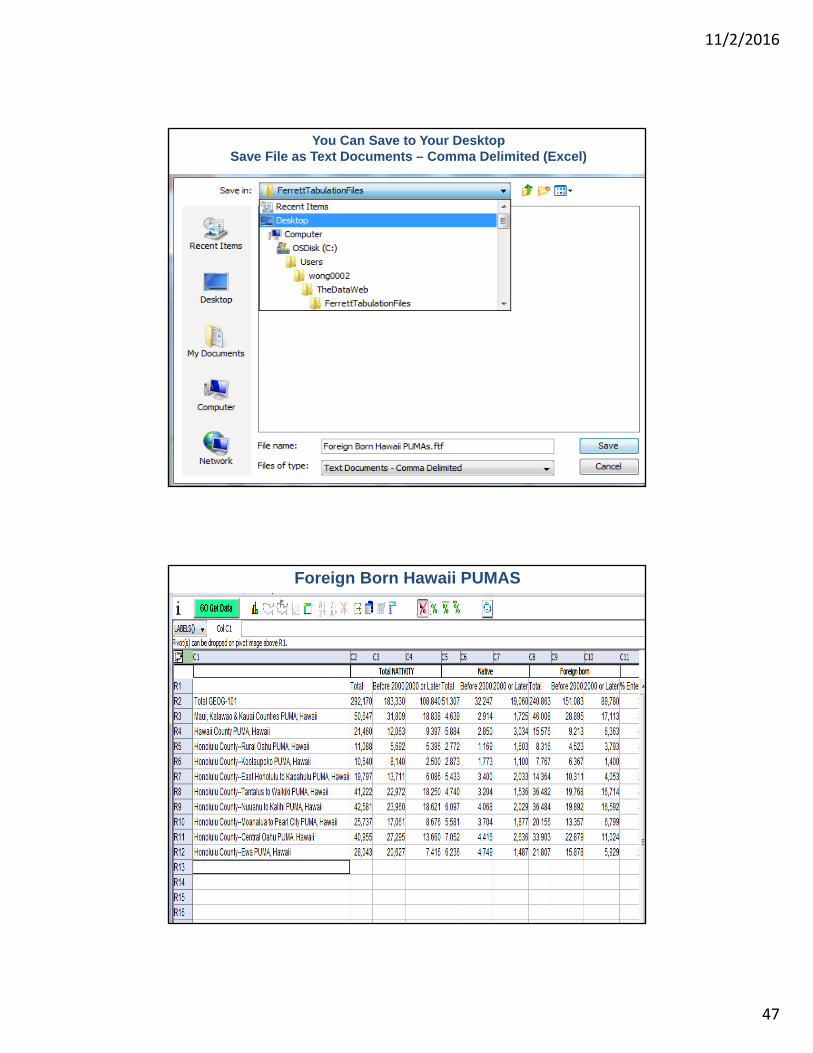
You Can Save to Your DesktopSave File as Text Documents – Comma Delimited (Excel)
Foreign Born Hawaii PUMAS

11/2/2016
48
Questions
96
Data Dissemination BranchCustomer Liaison and Marketing Services Office
U.S. Census Bureau
(888) 806-6389 Toll Free
Resources: Need Assistance?