Data-Driven Decision-Making for Continuing Education November 6, 2012 Jim Fong, UPCEA Janet Gifford,...
33
Data-Driven Decision-Making for Continuing Education November 6, 2012 Jim Fong, UPCEA Janet Gifford, Linfield College
-
Upload
grant-page -
Category
Documents
-
view
214 -
download
0
Transcript of Data-Driven Decision-Making for Continuing Education November 6, 2012 Jim Fong, UPCEA Janet Gifford,...

Data-Driven Decision-Making for Continuing Education
November 6, 2012
Jim Fong, UPCEAJanet Gifford, Linfield College

Agenda and Objectives
• Introduction
• What is the CRC?
• Linfield College: Changing a Culture Toward Distance Education
• Case Studies in CRC Research
• Q&A

What is UPCEA CRC?
• UPCEA’s Center for Research and Consulting (CRC) was developed as a response from the membership for more market research options and guidance at a national level, but also at a local or customized level.
• The CRC has grown to 25 member institutions and 6 clients at the ad-hoc level since it was established in April 2011.
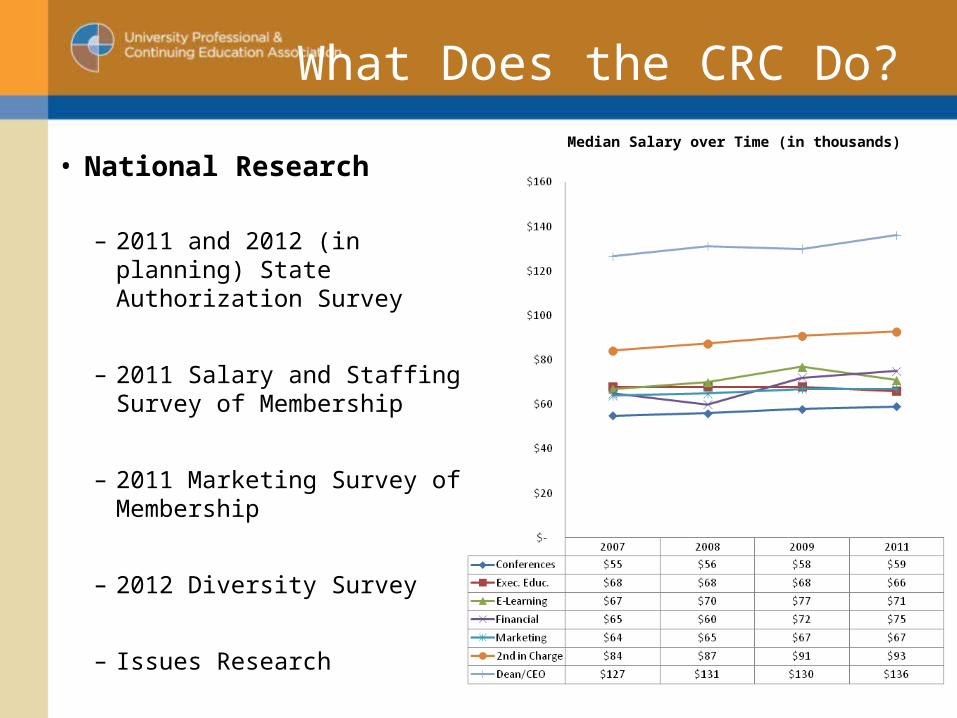
What Does the CRC Do?Median Salary over Time (in thousands)
• National Research
– 2011 and 2012 (in planning) State Authorization Survey
– 2011 Salary and Staffing Survey of Membership
– 2011 Marketing Survey of Membership
– 2012 Diversity Survey
– Issues Research

Customized Research
What are we currently doing for customized research?
• Three environmental scans for an institution’s program development for a new campus center.
• Four market concept tests of online graduate degrees.
• Re-assessing two recently launched graduate degrees.
• Assessing market potential for online non-credit programs.
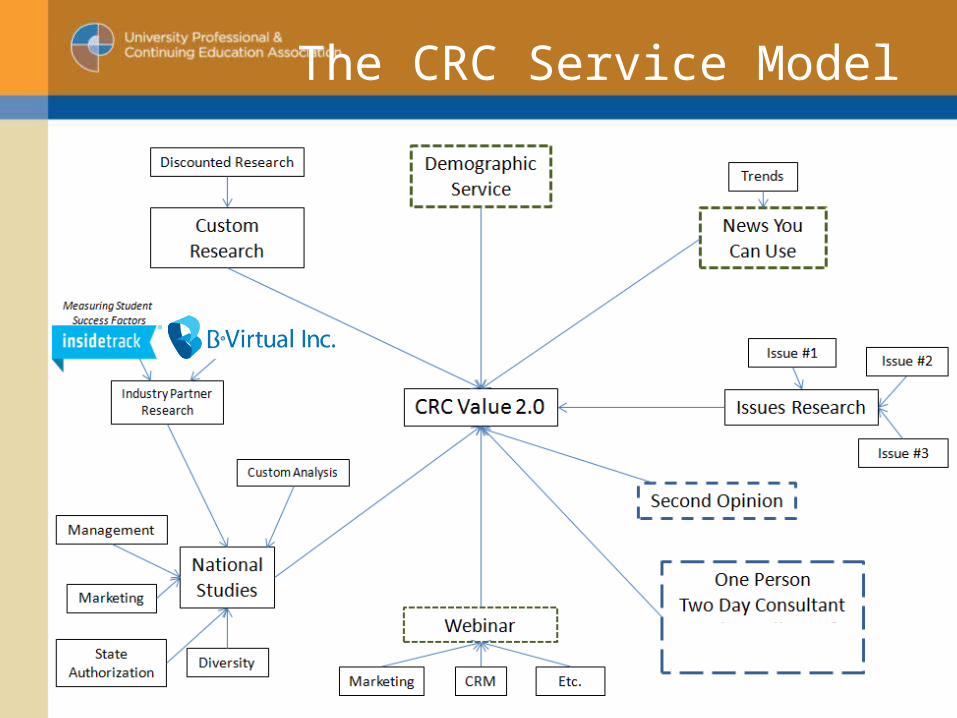
The CRC Service Model
Industry Partner Research
• Rather than a traditional sponsorship arrangement, UPCEA seeks mutually beneficial partnerships that advance the strategic interests of each organization and the field of professional, continuing and online education.
• While an Industry Partnership includes a wide variety of more conventional benefits, it also includes strategic initiatives designed to educate the market on the need for solutions such as those provided by the partner.– Collaboration on a study with the CRC– A webinar related to the outcomes of the study
Industry Partner Research
• InsideTrack– Collaborated on survey of members on adult student
success: having an infrastructure in place that measures students retention and completion
– Client summit occurred last month where study findings were presented.
• B Virtual Inc.– Collaborating on benchmark research study focusing on
the need for ensuring integrity in proctoring online exams, anytime, anywhere
– White paper and follow up Webinar to share results

Strategic ImplicationsLinfield College
Adult Degree Program

Overview
• A residential campus in McMinnville, OR featuring traditional liberal arts and pre-professional programs.
• A Portland campus which is home to the Linfield-Good Samaritan School of Nursing, a CCNE accredited BSN program.
• The Adult Degree Program, a pioneer in adult education, offering eight of the college’s majors and four professional certificate programs online, with advisors based in Portland and McMinnville and on six community college campuses in Oregon.
Linfield College, one of the first colleges in the Pacific Northwest was founded in 1858, has 2800 students and offers 47 majors through three programs:

Overview
• Linfield College has been offering online courses for over ten years.
• Many of Linfield's instructors were involved in the early design of online education. The flexibility of Linfield’s educational programs in the Adult Degree Program allows students to complete their degree or certificate at the pace that works for them.
• Linfield’s Adult Degree Program also has relationships with community colleges throughout Oregon and Southwest Washington to help make the transition from a community college to a four year bachelor’s degree program seamless.
Bachelor’s Degree Programs• Accounting (Online)• Arts & Humanities• Business Information Systems• International Business (Online)• Management (Online)• Marketing (Online)• RN to BSN (Online)• Social and Behavioral Sciences (Online)
Minors • Minor in Environmental Studies Certificate Programs • Post Baccalaureate Accounting (Online)• Computer Information Systems• Human Resource Management (Online)• Marketing (Online)

Objectives
• Understand whether investments in improved student services and advisory processes have given Linfield a competitive.
• Assess the strengths and weaknesses of Linfield College's online presence and offerings.
• Determine what makes Linfield College the choice of those outside the Oregon borders.
• Identify the top reasons that adult students are choosing Linfield College to complete their bachelor’s degrees online.
• Discover why prospects go elsewhere and where they might go.
• Determine how students learn about Linfield.
• Evaluate the experiences of current and past students.
• Identify market potential, potential student needs and interests, competitive factors and positive and negative trends.

Methodology
• A survey of students, prospects and recent graduates of Linfield College was conducted from June 1 to July 31, 2011.
• Email survey: Invitation with two reminders, plus incentive.
– Student Survey: 238 out of 458 good emails = 52%– Recent Graduates: 120/425 good emails = 28% – Recent Prospects: 143/781 good emails = 18%
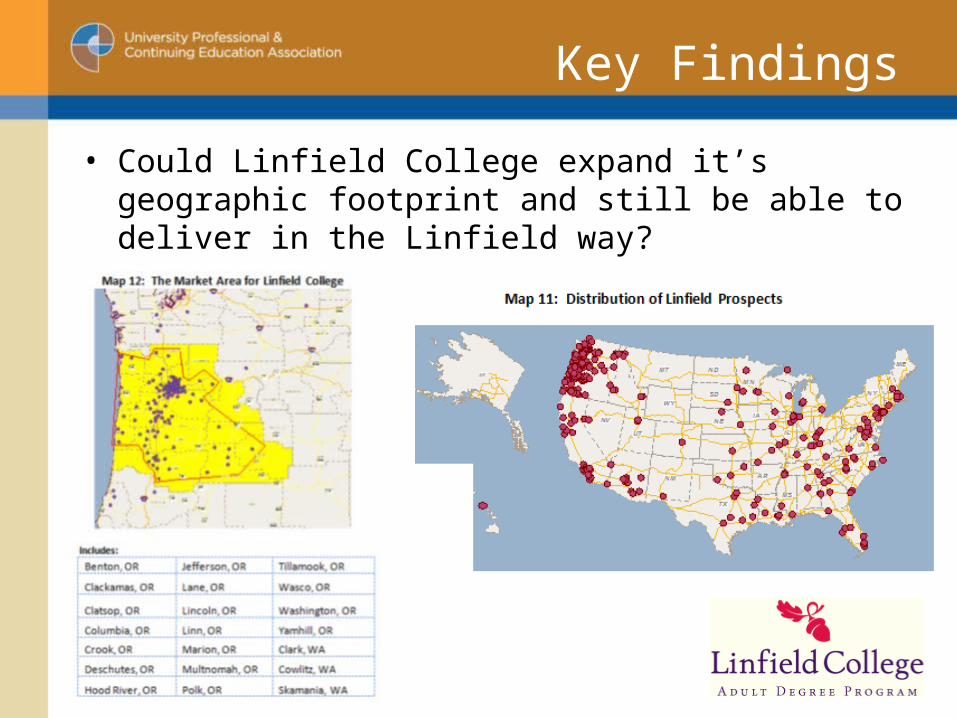
Key Findings
• Could Linfield College expand it’s geographic footprint and still be able to deliver in the Linfield way?
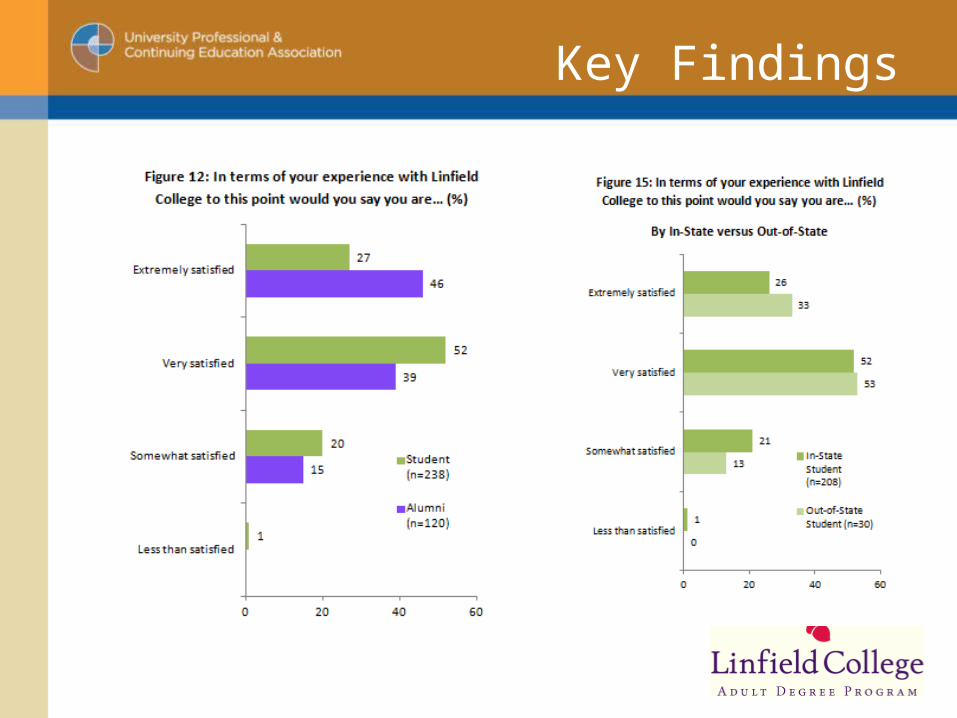
Key Findings
Key Findings
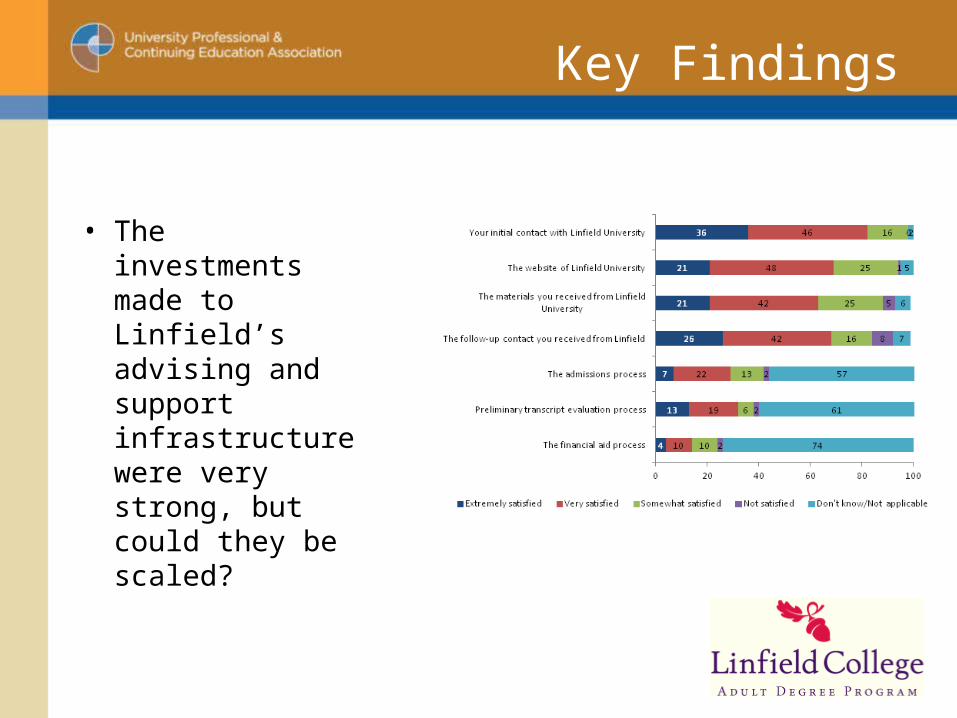
• The investments made to Linfield’s advising and support infrastructure were very strong, but could they be scaled?

Strengths of Linfield

Potential Weaknesses of Linfield
Data-Driven Decisions for Linfield
• Determine the target market for the Adult Degree Program. Initiate process to achieve state authorizations within target market.
• Expand online registration to include all students in Adult Degree Program to reach convenience-based, off-hours audience.
• Establish instructor training for online faculty, and enroll first group by fall 2012.

Strategic ImplicationsCase Studies of the CRC

Research Objectives
• Situation– New dean and associate dean
– No clear information on trending and student need and satisfaction
• Objectives:– Market potential
– Student needs/interests
– Competitive factors
– University strengths, weaknesses and opportunities in the region

Key Findings
• Many of the programs align with occupational professionals that are high growth/high volume or manageable competitive situation

Key Findings
• No clear market leadership position; no clear differentiation or leading, promoted benefit

Key Findings
• While the colleges perform adequately overall, there is room for improvement on all customer contact factors
Data-Driven Decisions for Chatham
• Reassessed the marketing position of CGS and CCPS to leverage clear strengths & differentiating factors of the institution
• Developed an integrated marketing plan taking into account advertising & promotion, customer relations management, branding and e-marketing– New VP of marketing joined Chatham in 2012
• Using research findings to guide upcoming efforts
– Implemented e-marketing efforts
• Comprehensive review of CRM system at institutional level to ensure proactive and progressive
• Revised advising and student support processes and services

Other Cases

Other Cases
• Stopping it before it happens …
• Major market study to re-establish continuing education department
• Re-aligning the marketing department
• Engaging the faculty through environmental scanning

Special Requests
Special Requests
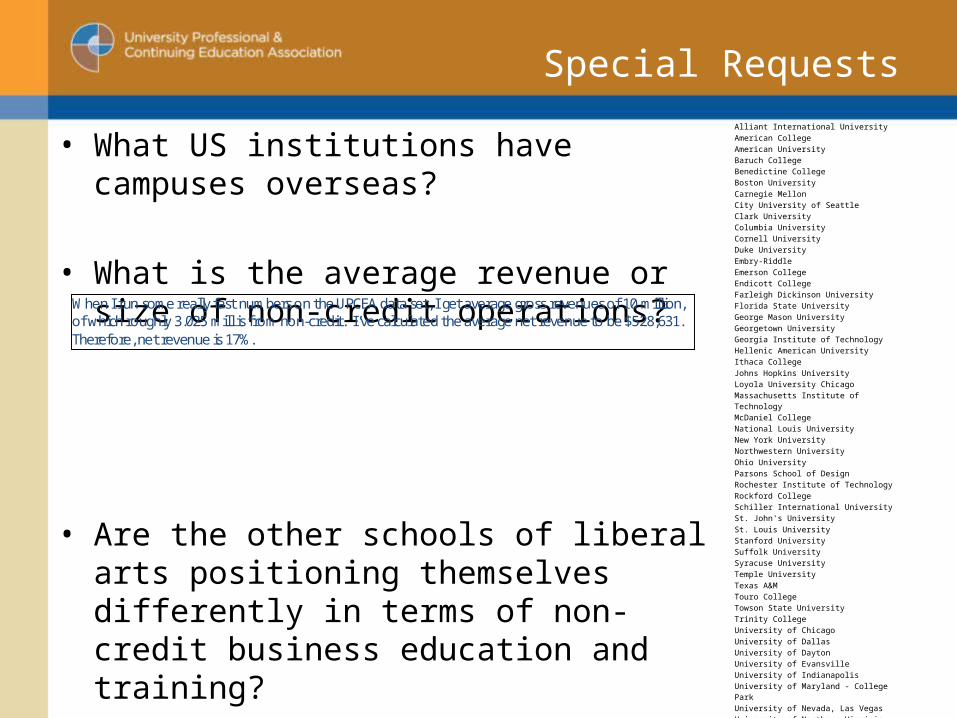
• What US institutions have campuses overseas?
• What is the average revenue or size of non-credit operations?
• Are the other schools of liberal arts positioning themselves differently in terms of non-credit business education and training?
Alliant International UniversityAmerican CollegeAmerican UniversityBaruch CollegeBenedictine CollegeBoston UniversityCarnegie MellonCity University of SeattleClark UniversityColumbia UniversityCornell UniversityDuke UniversityEmbry-RiddleEmerson CollegeEndicott CollegeFarleigh Dickinson UniversityFlorida State UniversityGeorge Mason UniversityGeorgetown UniversityGeorgia Institute of TechnologyHellenic American UniversityIthaca CollegeJohns Hopkins UniversityLoyola University Chicago
Massachusetts Institute of TechnologyMcDaniel CollegeNational Louis UniversityNew York UniversityNorthwestern UniversityOhio UniversityParsons School of DesignRochester Institute of TechnologyRockford CollegeSchiller International UniversitySt. John's UniversitySt. Louis UniversityStanford UniversitySuffolk UniversitySyracuse UniversityTemple UniversityTexas A&MTouro CollegeTowson State UniversityTrinity CollegeUniversity of ChicagoUniversity of DallasUniversity of DaytonUniversity of EvansvilleUniversity of Indianapolis
University of Maryland - College ParkUniversity of Nevada, Las VegasUniversity of Northern VirginiaUniversity of PhoenixVirgina Tech UniversityVirginia Commonwealth UniversityWebster UniversityYale University
When I run some really fast numbers on the UPCEA data set, I get average gross revenues of 10 million, of which roughly 3.025 mill is from non-credit. I ’ve calculated the average net revenue to be $528,631. Therefore, net revenue is 17%.

Recent Analysis of Larger UPCEA Institutions, Those With More Than $30M in Gross Revenues Allocate 5.5% to Marketing
Larger UPCEA InstitutionsGross Revenues 34,516,523.00$ Marketing Salary 705,822.00$ Media 771,499.00$ Salary/Gross Revenue 2.04%Media/Gross Revenue 2.24%Outsourcing 0.70%Operations 0.52%
Total Spent on Marketing 5.51%
Figure 19: Number of Marketing Staff by Revenue Size
(Average When They Had this Person on Staff)
5 million or less
5.1 million
to 15 million
More than 15 million Total
Full-time staff 4.40 3.33 11.04 5.89Part-time staff 1.69 2.07 2.62 2.12Marketing director 0.91 1.05 1.10 1.02Marketing associate/manager 0.93 1.23 2.31 1.63E-marketer 0.55 0.69 1.36 0.96Web developer 0.91 0.87 1.43 1.12Graphic designer 1.13 1.28 1.88 1.47Copy writer 0.79 0.64 1.19 0.98Editor 0.60 0.78 1.22 0.91Broadcast 0.10 0.00 0.93 0.73B2B 0.50 0.00 5.00 2.75Media 0.20 0.40 0.91 0.65Market researcher 0.54 0.37 1.60 1.13Public relations 0.73 0.53 0.89 0.75Marketing support 0.70 0.75 1.71 1.06CRM 0.65 0.58 1.23 0.92Call center 0.00 0.30 5.10 4.14
How much should I spend on marketing?

Overview of CE Marketing Units
Where’s the (Marketing) Money?5 million or
less5.1 million to
15 millionMore than 15
million All
Average CE Gross Revenues 2,712,788$ 9,878,788$ 34,516,523$ 13,839,798$ Median Stated Marketing 300,000$ 400,000$ 879,163$ 360,000$ Average Stated Marketing Budget 299,280$ 410,600$ 1,796,696$ 718,912$ Average Budget for Salaries 154,838$ 143,778$ 705,822$ 368,876$ Average Budget for Media 155,277$ 260,969$ 771,499$ 364,760$ Average Budget for Operating 29,700$ 28,286$ 180,514$ 79,671$ Average Spent on Freelance Staff 6,416$ 8,531$ 39,948$ 15,448$ Average Spent on Ad Agency 22,716$ 57,458$ 139,057$ 62,555$ Average Spent on Research 6,205$ 10,625$ 64,074$ 22,639$ Average Percentage for Salaries 6% 1% 2% 3%Average Percentage for Media 6% 3% 2% 3%Average Percentage for Operating 1% 0% 1% 1%Average Percentage Spent on Freelance Staff 0% 0% 0% 0%Average Percentage Spent on Ad Agency 1% 1% 0% 0%Average Percentage Spent on Research 0% 0% 0% 0%Average Calculated Marketing Budget % 14% 5% 6% 7%
Average Stated Marketing Percentage of Gross Revenue 11% 4% 5% 5%
The average marketing budget is between 5% and 7% of gross revenues. A smaller marketing unit spends about twice the percentage, between 11% and 14%.

Questions??

Jim FongDirectorUPCEA Center for Research & ConsultingPhone: (814) 308-8424Blog: [email protected]
Contact InformationJanet GiffordAssociate Director Adult Degree Program/Director of Marketing Adult Linfield CollegePhone: (503) 413-7056 [email protected]