Dart Energy coal bed methane proposed development at ... comments on Dart Energy... · Review of...
21
Dart Energy coal bed methane proposed development at Letham: Review of additional information supplied in support of the hydrogeological assessment By David K. Smythe Emeritus Professor of Geophysics, University of Glasgow La Fontenille 1, rue du Couchant 11120 Ventenac en Minervois France [email protected] www.davidsmythe.org 26 August 2013 Version 1.1 Prof D K Smythe Review of Dart Energy hydrogeological assessment Page i
Transcript of Dart Energy coal bed methane proposed development at ... comments on Dart Energy... · Review of...
Dart Energy coal bed methane proposed development at Letham:
Review of additional information supplied in support of the hydrogeological assessment
By
David K. Smythe
Emeritus Professor of Geophysics, University of Glasgow
La Fontenille
1, rue du Couchant
11120 Ventenac en Minervois
France
www.davidsmythe.org
26 August 2013
Version 1.1
Prof D K Smythe Review of Dart Energy hydrogeological assessment Page i

Prof D K Smythe Review of Dart Energy hydrogeological assessment Page ii
EXECUTIVE SUMMARY
The review concentrates on the sub-area (the proposed development area or PDA) of licence block PEDL133, within which Dart Energy has applied to drill and construct horizontal and vertical wells and service corridors. Methane extraction from four target coal horizons within the Limestone Coal Formation at around 800 m depth will be achieved by dewatering of the coals. According to Dart, no fracking will be used, and therefore no earthquakes will be triggered. There is ample geological and coalmining information showing that the PDA is traversed by significant faults, mostly running east-west. Dart's submissions on the geology fail to address this, and several faults are omitted. Some of the submissions, such as the geological maps and cross-sections are too generalised, or are outwith the area of the PDA. Much essential information for a sound evaluation of the hydrogeological implications of the proposals appears to be missing. My impression is that Dart has a limited understanding of some of the geology. Dart has optimistically assumed that the faults will all act as seals to fluid flow, but this is not the case. An extensive body of literature shows that faults are very complex and hard to predict, hydrogeologically. The default position of the oil and gas industry is that any particular fault will be a conduit, and not a seal. Within the PDA even small faults with a displacement of a few metres may aid the potential upward flow of fluids resulting from the production of methane. The danger is that fugitive methane may thereby rapidly migrate upwards to the groundwater resources and even to the surface. The PDA lies in a zone of high risk to development, because of old coalmine workings. These workings will contribute to adverse fluid flow of potentially contaminated water and gases into the 'receptor' environment (that is, to humans). Due to the evident lack of a sufficiently robust 'cap rock', to keep the operations at depth isolated from the near-surface environment, the development proposals pose too great a risk to be permitted.
Prof D K Smythe Review of Dart Energy hydrogeological assessment Page iii
TABLE OF CONTENTS
1 INTRODUCTION 1.1 Relevant personal details from my CV 1.2 Declaration of interest and non-liability 2 GEOLOGY AND HYDROGEOLOGY OF THE LETHAM SITE 2.1 Relevant aspects of Dart's proposals 2.2 Dart's G20 response on the geological structure and hydrogeology 2.3 The structural geology database 2.4 Faulting within the PDA 2.5 Faults as potential conduits or barriers 2.6 Permeability, hydraulic conductivity and vertical flow 2.7 Hydraulic conductivity of faults 2.8 Compartmentalisation by faults 3 IMPLICATIONS FOR POTENTIAL RECEPTORS 3.1 Migration up faults 3.2 High risk development zones and groundwater vulnerability 4 CONCLUSIONS
REFERENCES
LIST OF FIGURES
Fig. 1. Dart Energy underground works (the proposed development area or PDA) Fig. 2. Old mine shafts (red crosses) within the PDA Fig. 3. PEDL133 (green dashed area) and location of two geological cross-sections Fig. 4. Southern half of cross-section BB', south on left Fig. 5. Fence diagram from Airth-2 to Airth-3 Fig. 6. Detail of lower part of Figure 5 Fig. 7. Cartoon of a fault zone and resulting fluid flow Fig. 8. The Carnock, Dunmore Farm and Kilbagie Faults, to the north of the PDA Fig. 9. The PDA in relation to faulting (red lines) and the OS map Fig. 10. Horizontal wells of the PDA in relation to faults and the Coal Authority development high risk area Fig. 11. Groundwater vulnerability map of the PDA

Prof D K Smythe Review of Dart Energy hydrogeological assessment Page 1
1 INTRODUCTION
1.1 Relevant personal details from my CV
1.1.1 I am Emeritus Professor of Geophysics in the University of Glasgow. Although I am now a French resident I remain a British citizen, and take an active interest in UK, French and foreign affairs, as well as in various facets of scientific research.
1.1.2 Prior to my taking up the Chair of Geophysics at the University of Glasgow in 1988 I was employed by the British Geological Survey (BGS) in Edinburgh, from 1973 to 1987. I was a research scientist, rising to the post of Principal Scientific Officer. My professional qualifications are: BSc Geology (Glasgow 1970), PhD Geophysics (Glasgow 1987), Chartered Geologist. 1.1.3 In the 1990s I was closely involved in the search for a UK underground nuclear waste repository. I served on the BNFL Geological Review Panel from 1990 to 1991. I was invited to join the panel by one of its members, Professor John Lloyd, a hydrogeologist from the University of Birmingham. I served on this panel to support BNFL’s case for a Sellafield site for a Potential Repository Zone (PRZ), at the time when Nirex was investigating both Dounreay and Sellafield. I resigned from the panel after the case for Sellafield had been successfully made. 1.1.4 I was closely involved with Nirex at this epoch, and conducted for Nirex an experimental 3D seismic reflection survey, which took place in 1994. The survey encompassed the volume of the proposed rock characterisation facility (RCF) – a deep underground laboratory planned as a precursor to actual waste disposal. This was a double world ‘first’ – the first ever 3D seismic survey of such a site, and the first academic group to use this method, which at the time was just emerging as an essential tool of the oil exploration industry. 1.1.5 I am familar with the geology of the Midland Valley (the central belt of Scotland) through teaching and undergraduate field excursions. 1.1.6 Since my retirement from the university in 1998 I have carried out private research, acted as a consultant to the oil industry, and maintained an interest in the geological problems raised by nuclear waste disposal, shale gas exploration and coal-bed methane exploration. 1.2 Declaration of interest and non-liability 1.2.1 I have no interests to declare. This document is provided pro bono publico, without charge. I am not connected to, nor am I a member of any activist group, political party, or other organisation. I am solely responsible for its contents. It is supplied in good faith, but I can accept no liability resulting from any errors or omissions.
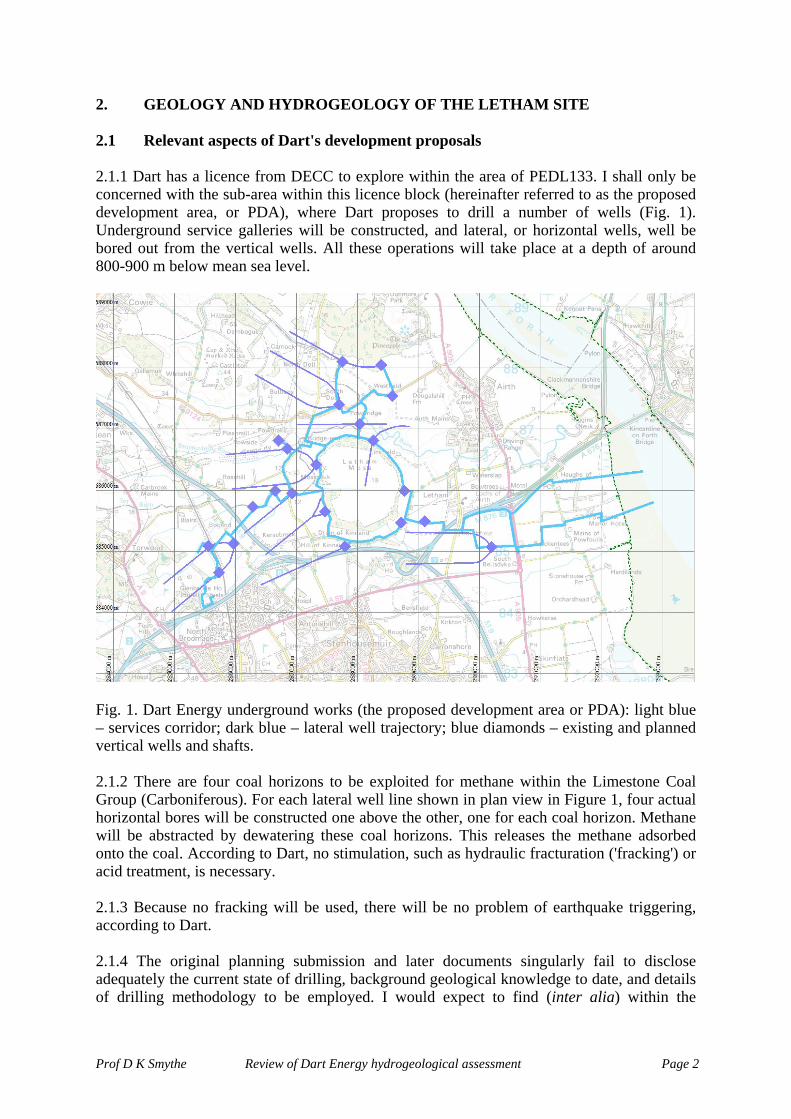
2. GEOLOGY AND HYDROGEOLOGY OF THE LETHAM SITE 2.1 Relevant aspects of Dart's development proposals 2.1.1 Dart has a licence from DECC to explore within the area of PEDL133. I shall only be concerned with the sub-area within this licence block (hereinafter referred to as the proposed development area, or PDA), where Dart proposes to drill a number of wells (Fig. 1). Underground service galleries will be constructed, and lateral, or horizontal wells, well be bored out from the vertical wells. All these operations will take place at a depth of around 800-900 m below mean sea level.
Fig. 1. Dart Energy underground works (the proposed development area or PDA): light blue – services corridor; dark blue – lateral well trajectory; blue diamonds – existing and planned vertical wells and shafts. 2.1.2 There are four coal horizons to be exploited for methane within the Limestone Coal Group (Carboniferous). For each lateral well line shown in plan view in Figure 1, four actual horizontal bores will be constructed one above the other, one for each coal horizon. Methane will be abstracted by dewatering these coal horizons. This releases the methane adsorbed onto the coal. According to Dart, no stimulation, such as hydraulic fracturation ('fracking') or acid treatment, is necessary. 2.1.3 Because no fracking will be used, there will be no problem of earthquake triggering, according to Dart. 2.1.4 The original planning submission and later documents singularly fail to disclose adequately the current state of drilling, background geological knowledge to date, and details of drilling methodology to be employed. I would expect to find (inter alia) within the
Prof D K Smythe Review of Dart Energy hydrogeological assessment Page 2

submissions:
Composite well logs for every existing well, Brief history of why each existing well was drilled, Fence diagrams linking the wells, Seismic data used (if any), both raw and interpreted, Contour maps of the PDA showing structure of certain key horizons, Details as to how the horizontal wells will be constructed.
2.1.5 For example, in the original application (Appendix 8.1) the logs for 8 shallow water boreholes are reproduced, but the only log supplied for a deep borehole is Airth-6 (G20 submission, Appendix 3). There are stock extracts from industry manuals and brochures for the drilling rigs, generators, and so on (e.g. Appendix 3), but what is missing is any account as to how the horizontal wells will be drilled so as to confine the borehole path within each coal seam. Such information is crucial for making a safety case within an environmental statement, particularly as such technology is new to the UK. 2.2 Dart's G20 response on the geological structure and hydrogeology 2.2.1 Dart has presented a set of maps showing old coal-mine workings over the entire area of PEDL133, and two geological cross-sections. The east-west cross section is 4 km north of Letham Moss (which can be considered as the centroid of the proposed operations) and 1500 m north of the most northerly lateral. It nearly intersects the Inch of Ferryton oil well. The north-south cross-section runs some 200 m west of Airth-4, Airth-11 and one of the proposed vertical wells, but only intersects four linear features (lateral wells or underground tunnels) of the proposed development. It is wrongly labelled; B' should be in the south and B in the north, not the reverse as shown. 2.2.2 Dart has responded to AMEC's request concerning dewatering volumes by explaining that the 'horizontal zone of influence' of each lateral is around 250 m (half of the lateral spacing), and that the 'vertical zone of influence' is minimal, because "based on the evidence below that the strata are of low permeability, there is no hydraulic continuity across the almost 0.5 km thickness of strata." [para. 3.6]. 2.2.3 In a succeeding section (Permeability of Geology overlying Target Coal Seams), Dart quotes measurements made on a 10 m long core from the Inch of Ferryton 1 well, drilled by Tricentrol in 1986. The core is from the Limestone Coal Formation, the same formation as the target coals. A calculation is then presented by extrapolation, to infer that the transit time of downdrawn water from the Passage Formation (classified as a Secondary A aquifer) to the uppermost target coal band would be of the order of seven years. 2.3 The structural geology database 2.3.1 Based upon the information supplied in the original application and the G20 documents, Dart appears to have a limited understanding of the geological structure of the proposed development area. I am not in a position to say whether Dart has withheld detailed information which it would have been better to have published, or whether it simply does not possess that information. 2.3.2 My own database is incomplete, in that I do not currently have a copy of the BGS Alloa solid geology map, sheet 39, nor do I possess copies of the BGS descriptive memoirs for
Prof D K Smythe Review of Dart Energy hydrogeological assessment Page 3

Alloa or Airdrie. I do have the Airdrie solid geology sheet 31, one-inch series (1:63360). The boundary between the two sheets runs through the PDA. 2.3.3 I have access to the online BGS digital map database. This is available in two flavours:
'Digimap' - a coloured image of the 1:50K solid and/or superficial geology, Digital outlines and areas for incorporation into graphic mapping packages.
2.3.4 The fault-lines in the latter database do not indicate a sense of throw. The Digimap faults have tick-marks to indicate the downthrow side, but approximately 50% of these are wrong. This serious error is due to the erroneous assumption that the progression of vertices marking the fault, from beginning to end, have always been digitised such that the downthrow side is on the right. This problem is national, not just local to the present review. So all faults shown on the Digimap images either have to be checked against the paper copy of the solid geology map, or else can often be corrected by inspection. 2.3.5 I have corrected the throw sense of faults within the current area, but those of which I am unsure I have left without a tick mark. 2.3.6 There are slight discrepancies between the faults shown on the Airdrie paper solid geology sheet, which dates from 1924, and the current BGS digital database. Presumably the latter is an updated version. 2.3.7 Dart presumably has access to the 2D seismic profiles which cover the PDA. There are three lines running approximately north-south, and four running roughly east-west. They all date from 1982 or 1985, and were shot for Tricentrol. None of these lines, together with a geological interpretation, have been made available by Dart. 2.3.8 The maps showing the old mineworkings (G20 Appendix 5) cover the entire licence, and are therefore not very clear at the scale of the PDA. Nevertheless, they appear to show that there are no deep workings within the PDA. There are, however, a number of old mine shafts which I have plotted from another source (Fig. 2). 2.3.9 It is very probable that these were dug to target the Productive Coal Measures (now called the Lower Coal Measures Formation) which outcrops over most of the PDA. It is very unlikely that they would have gone as deep as the Limestone Coal Formation, which is evidently too deep to have been exploited in the past. It can be assumed that these old mineworkings are probably less than 50 m deep below the surface, i.e. the thickness of the productive formation. If any of them penetrate to the Passage Formation (formerly called the Millstone Grit), which is depicted in yellow in all the BGS maps, then they will provide fast-track migration paths to the Quaternary deposits (a Primary Aquifer) and the surface for any fugitive methane or other fluids. 2.3.10 The two cross-sections supplied by Dart are of very limited use, due to their inappropriate location relative to the PDA, as mentioned above. Figure 3 illustrates this. 2.3.11 Section BB' passes 2.3 km east of Airth-6, a geological column of which is featured at the side. A much more useful section would have been to construct one running directly through both Airth-6 and Inch of Ferryton 1.
Prof D K Smythe Review of Dart Energy hydrogeological assessment Page 4

Fig. 2. Old mine shafts (red crosses) within the PDA.
Fig. 3. PEDL133 (green dashed area) and location of two geological cross-sections shown in orange; AA' (E-W) and BB' (N-S). Blue shapes show the PDA as in Figure 1.
Prof D K Smythe Review of Dart Energy hydrogeological assessment Page 5

2.4 Faulting within the PDA 2.4.1 The throws of some faults are indicated on the Airdrie solid geology sheet, measured in fathoms. I have multiplied the figures by two to get an approximate throw in metres. These figures presumably refer to the maximum throw in the central portion of the fault, and if the fault extends horizontally for several kilometres, the throw figure can be presumed to be valid vertically down to at least a kilometre, i.e. at least as deep as the target zone. 2.4.2 Section BB' (G20, Appendix 2) is somewhat misleading, as it excludes several of these normal faults, trending east-west, within the PDA (Fig. 4). Two of these have throws of 34 m and 50 m, respectively, at the location of the cross-section. The latter lies at the southern margin of the PDA at the section location, and runs right through the PDA to the west. Another E-W fault about 1 km south of the PDA has a throw of 40 m. 2.4.3 The Letham Fault is of particular concern, as it illustrates several of the problems of faulting in the area. Its western end is under Letham Moss, and it runs east to the River Forth. The Digimap image indicates a throw down to the north, whereas the Airdrie sheet shows a downthrow to the south. Its eastern part, however, appears to have a throw down to the north as shown by the offset of the solid geology boundary near the west bank of the Forth. 2.4.4 There is a problem with the correlation from Airth-3 to Airth-2, as shown by a 'fence diagram' linking the two wells (Fig. 5). This was submitted to Falkirk Council in 2002 (planning application F/2002/732) in support of a development plan by CBM Ltd, which had the EXL237 licence in the PDA at that time. In Airth-3 there are about 140 m of Upper Limestone Group between the marker limestones, the Lyoncross and the Index (upper and lower, respectively). But some 630 m to the NW this sequence has lost about 90 m in thickness, as shown in Airth-2. The implication is that some of the section in Airth-2 has been cut out by a normal fault downthrowing to the SE. This is shown as a schematic suggestion in the diagram. In the same diagram the Letham Fault is indicated to the top left with a throw down to the north. But if this fault has a southerly downthrow (cf. the paper Airdrie geology sheet) it would fit the bill for cutting out 90 m of section. Figures 5 and 6 (below) illustrate the problem and its possible solution. 2.4.5 All these faults are significant for consideration of the danger of fugitive methane emission and contamination of groundwater resources, and should not have been omitted from the proposals. Much more detailed work is required. 2.4.6 A high-resolution 3D seismic survey is required over the PDA to clarify the faults. 2.5 Faults as potential conduits or barriers 2.5.1 The extensive faulting in the PDA is crucial, because the whole question of vertical hydraulic conductivity depends on how the faults behave. We are concerned here, not with drawdown from the principal aquifer to the target coal beds, as illustrated in Dart's G20 submission, figure 4.1, but in the potential for upward pathways of fluids, particularly fugitive methane.
Prof D K Smythe Review of Dart Energy hydrogeological assessment Page 6

Fig. 4. Southern half of cross-section BB', south on left. Five faults (vertical red lines) have been superimposed from the BGS maps. These should be present on the cross-section. 2.5.2 Dart contends that the faults can affect fluid flow, but conclude that because the fault throws are only of the order of 30-40 m, they do not juxtapose higher- and lower-permeability strata. Were this to be true, the scale of the alternations in layering has to be greater than 30-40 m. But the scale of alternations in lithology, as shown by the Airth-6 log (G20, Appendix 3), is as follows (scale is true vertical depth below mean sea level):
Lower Coal Measures (-19.6 to 68.8 m) - 5 to 30 m, Passage Formation (68.8 to 284.0 m) - 4 to 40 m, the sandstones being the thick units, Upper Limestone Formation (284 to 696.7 m) - 5 to 30 m, sandstones being the thick
units, Limestone Coal Formation (696.7 to top target coal) - 1 to 15 m, sandstones being the
thick units. 2.5.3 In the analysis above the periodicity of units in the Passage Formation is irrelevant, because it is of high permeability (a Secondary A aquifer). Similarly, in the Upper Limestone and Limestone Coal Formations, the thicker sandstone units are irrelevant. In conclusion, any faults with a throw of more than 5 or 10 m will juxtapose layers of differing permeability.
Prof D K Smythe Review of Dart Energy hydrogeological assessment Page 7
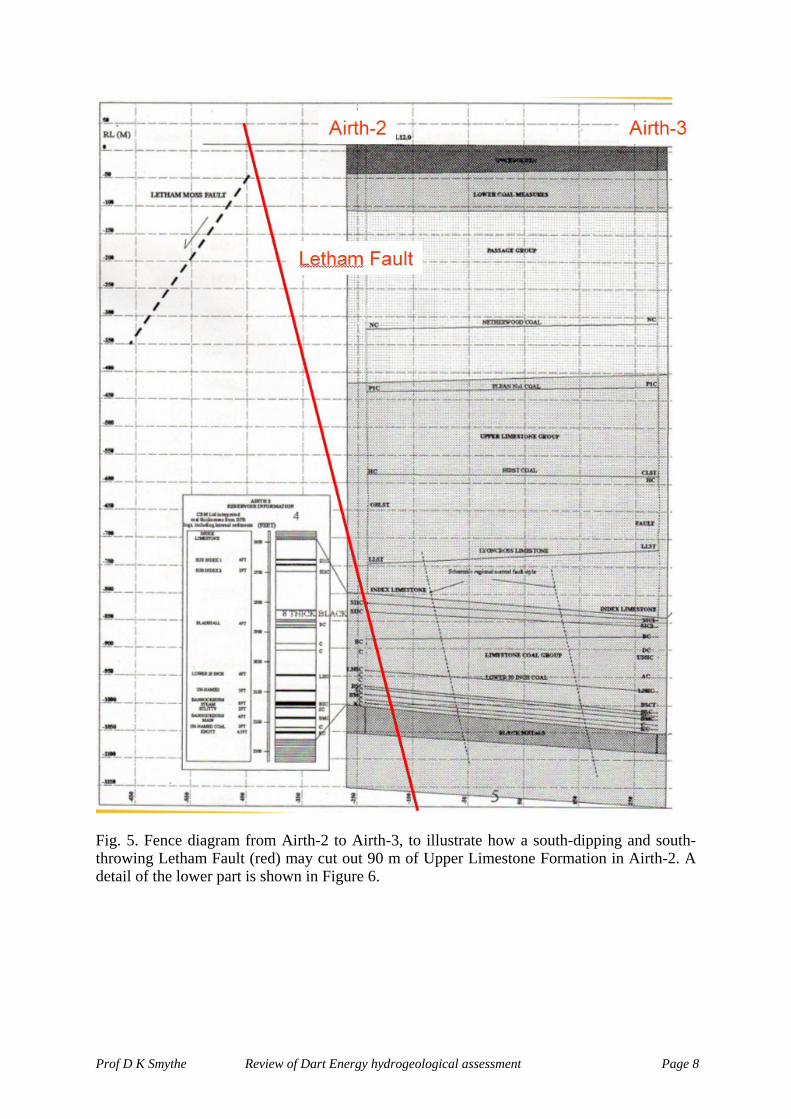
Fig. 5. Fence diagram from Airth-2 to Airth-3, to illustrate how a south-dipping and south-throwing Letham Fault (red) may cut out 90 m of Upper Limestone Formation in Airth-2. A detail of the lower part is shown in Figure 6.
Prof D K Smythe Review of Dart Energy hydrogeological assessment Page 8

Fig. 6. Detail of lower part of Figure 5, showing how the Letham Fault cuts out 90 m of Upper Limestone Formation. 2.5.4 Just as in domestic plumbing, where a water leak comes from the weakest point in the system, and the waterproof properties of the rest of the pipework are irrelevant, fugitive methane and other fluids will find the weakest path upwards. Even the lowest permeability rocks in the succession - mudstones and siltstones - are moderately permeable. This is discussed below. The hydraulic conductivity properties of faults zones are also discussed below. 2.6 Permeability, hydraulic conductivity and vertical flow 2.6.1 The BGS, in an aquifer productivity study (MacDonald et al. 2004, table 1) has classified the Passage Formation sandstone as having high productivity (defined as 10-20 l/s), the flow mechanism being "dominantly intergranular". All other Carboniferous rocks, except mudstones, are classified as moderately productive (1-10 l/s), and Carboniferous mudstones have low productivity (0.1-1 l/s). Note that these productivity ratings are applicable to a borehole, so the figures are only a rough order-of-magnitude guide to relative permeabilities at depth. 2.6.2 Dart cites a laboratory measurement of permeability in the Limestone Coal Formation, observed on a 10 m long core from the Inch of Ferryton 1 well. 2.6.3 Tellam and Lloyd (1981) studied the hydraulic conductivity of British mudrocks. The laboratory measurements gave values 2 to 3 orders of magnitude lower than the in situ
Prof D K Smythe Review of Dart Energy hydrogeological assessment Page 9

values. So the Inch of Ferryton results should be scaled accordingly. Furthermore, we are interested in the maximum conductivity. In short, the relevant hydraulic conductivity from this core is 10-5 to 10-6 m/s. This range is somewhat higher than the Mercia Mudstone Group (MMG), and two to four orders of magnitude higher than true clays such as the London Clay, Oxford Clay, Gault Clay and Lias Clay. 2.6.4 In the East Irish Sea Basin it is reported that at least 600 m of MMG is required for it to be an effective hydrocarbon seal there, due to the inversion uplift (Duncan et al. 1998). However, the MMG is an effective seal in the Wessex Basin, where 300 m of MMG caps the oil of the Wytch Farm field, together with another 200 m of Liassic mudstone above. The difference in the latter case is that the Tertiary uplift has never taken the MMG into the brittle tensional strength regime, which is the reason for the higher hydraulic conductivity in the Irish Sea region. The Carboniferous mudstones of the PEDL133 area have also undergone uplift, since they are now at shallow depth or at outcrop. 2.6.5 In conclusion, by comparison with the MMG, the mudstones of the Limestone Coal Formation above the target coals are unlikely to provide much of a seal to prevent fugitive methane and other fluids escaping upwards. This conclusion does not even take into account the presence of the faults. I would expect a similar result for the overlying Upper Limestone Formation, although there appear to be no data on hydraulic conductivities of that formation. 2.7 Hydraulic conductivity of faults 2.7.1 The literature on the fluid sealing or conducting properties of faults in sediments is large and confusing. Research is driven by the need to understand sealing of hydrocarbon reservoirs at depths of 2-3 km on the one hand, and engineering properties of faults in the near-surface (down to a few hundred metres), especially in unconsolidated sediments. In addition, the subset of research into the effects of faulting in pelitic rocks (e.g. mudstones) is very limited. 2.7.2 The paper cited by Dart on clay smearing (Manzocchi et al. 2002) is just one within a large field of active research. Dart states in support of its case that faults are not significant conduits:
"clay-rich material becomes incorporated into the fault zone during the movement of the fault, by abrasion of clay rich zones against clay poor zones as the hanging wall moves past the footwall, by smearing, and the production of shale gouge. Depending on the clay content, this can act as an effective seal to groundwater and other fluid movements."
2.7.3 There are dozens of academic research groups and oil-industry service companies working on the problem of whether faults act as conduits or barriers to fluid flow. The default position in the industry is the conservative one, that faults do not act as seals. In oil or gas exploration, if a fault is wrongly judged to be a seal when in fact it is permeable, no damage is done, other than to the bank balances and share prices of companies and individuals. However, in the case of CBM exploitation, the consequences of over-optimistically assuming that faults act as seals may be extremely damaging to the environment. 2.7.4 My brief and necessarily incomplete review of this large field of research and development leads me to the following impressions and tentative conclusions:
Prof D K Smythe Review of Dart Energy hydrogeological assessment Page 10

1. There are field measurements of faults at outcrop and at shallow depth; it is realised
that small-scale structures associated with faults dominate the bulk hydrogeological properties. These are characteristically fractures sub-parallel to the master fault plane, which are collectively termed the ‘damage zone’. Such zones can be several metres to tens of metres in horizontal width, and are often the locus of fluid flow up or downwards, rather than across the master fault plane.
2. In an unconsolidated mixed sand/clay stratigraphy, the conductivity in the damage
zone can be enhanced by several orders of magnitude, but clay smearing along the core fault plane reduces the bulk conductivity.
3. Iron oxide re-precipitation in the core fault, due to the enhanced flow in the damage
zone, is another mechanism which can reduce the core conductivity. 4. The relative hydraulic conductivity of a fault cutting indurated low-conductivity clays
is neutral; i.e. the conductivity of the fault zone remains within the same order of magnitude as the unfaulted clay. An example is the set of measurements across the Down Ampney fault, made by the BGS, in which Oxford Clay is juxtaposed against Oxford Clay or Forest Marble Clay.
5. However, the same dataset shows that the conductivity of the fault zone as a whole is
enhanced by one or two orders of magnitude, because the succession includes limestones and sandstones as well as the aforementioned clays. This will be the case with the successions present within PEDL133.
6. Smectite in shear zones can be dehydrated to anhydrous illite minerals as a shear
fabric develops; this in turn can account for overpressure build-up. This mechanism accounts for high hydraulic conductivity observed in accretionary wedges, but contradicts laboratory experimental studies suggesting that sheared clays in fault zones represent aquitards.
2.7.5 Lunn et al. (2008) have modelled the fluid flow pathways across models derived from detailed outcrop observations. Starting with their summary that:
“Faults can be barriers to flow, conduits, or combinations of the two, and their hydraulic properties vary considerably over both space and time”.
they conclude from their study that the micro properties as opposed to the average hydraulic properties in a fault zone are crucial, but that these properties are unmeasurable at depth. A multi-variate stochastic approach is the only way forward, they say, which:
“implies that a very large database of fault architecture is needed to accurately characterize fault permeability distributions. This can only be achieved by pooling a large number of field datasets. This would require an international consensus on the recording of the gross parameters (e.g., lithology, offset, stress history) and the architectural detail at each site.” [NB authors’ emphasis on very large].
2.7.6 From Lunn et al.'s observation (which was already widely known across the hydrocarbon exploration industry) that “faults can be barriers to flow, conduits, or combinations of the two”, one can construct a cartoon of how normal faults cutting sediments
Prof D K Smythe Review of Dart Energy hydrogeological assessment Page 11

will affect flow direction (Figure 7). I have indicated in this cartoon the general flow parallel to sedimentary bedding, in this case moving down-dip from right to left. But when the flow encounters a fault zone it will be redirected upwards; this is irrespective of whether the fault is acting as a barrier or as a conduit to fluid flow.
Fig. 7. Cartoon of a fault zone and resulting fluid flow. The core zone (black) could be a barrier, or it could be a conduit. The damage zone on either side is always a conduit because it is fractured. 2.7.7 Dart acknowledges the concern raised by AMEC regarding faulting and old mine workings. The G20 document states:
"the geology of the area, including past mining activities has the potential to be a route for methane migration. However, were methane likely to migrate through faults in the overlying rock -to an area of lower pressure -there is no reason why it would not do so in the absence of Dart's activities -albeit only from the coal directly around the fault, due to hydrostatic pressure binding the gas within the coal matrix." [para. 4.10]
2.7.8 Dart here appears to be admitting that faults are indeed potential pathways for methane migration. But since the virgin coal (i.e. undewatered or otherwise exploited) has been around for a long time, as have the faults, any localised migration such as described above would have long ago ceased. But when release of methane is started by dewatering, a new phase of methane escape could begin, but this time it will be orders of magnitude greater in volume. 2.8 Compartmentalisation by faults 2.8.1 Dart discusses presumed compartmentalisation of the groundwater flow system by certain faults. The G20 document states:
Prof D K Smythe Review of Dart Energy hydrogeological assessment Page 12
"3.24 There is a potential horizontal and sub horizontal component to groundwater flow also, since the deep Lower Coal Measures strata may be recharged from the strata at outcrop around Bannockburn. However significant vertical displacement of the target coal bed units by the Carnock and Dunmore Farm Faults in the west and Kilbagie Fault in the east means that the target coals are likely to lie within a hydrogeologically isolated fault block."
and
"4.16 Within the Limestone Coal Formation, relevant workings would be to the west, around Bannockburn, which could be affected by workings from sites H (paired with G and I) or M. However, the target coal beds in the gas field and the corresponding beds at outcrop are hydrogeologically isolated from one another by fault displacement, in particular by vertical displacement at the intervening Carnock and Dunmore Farm Faults. The faults in these clay rich strata are unlikely to act as a significant hydrogeological pathway to permit significant groundwater flow across the faults."
2.8.2 Dart quotes a BGS report (BGS 2011), closely quoting text from the latter. The BGS states:
"2.4 HYDROGEOLOGY
2.4.1 Bedrock hydrogeology
The hydrogeology of the Carboniferous sedimentary aquifers in the Midland Valley is complex. The cyclical sedimentary sequences of alternating fine- and coarse-grained rocks form multi-layered aquifers in which sandstone units effectively act as separate aquifers, interspersed with lower-permeability siltstones and mudstones. Some of these aquifers are effectively confined by overlying low permeability rocks. The hydrogeological complexity is increased by the predominance of fracture flow, and by the compartmentalising of groundwater flow within fault-bounded blocks." [my underlining].
2.8.3 This is the only mention of compartmentalisation in the BGS report. The underlined phrase above refers to a scale of compartmentalisation which is evidently much larger than any area as small as the PDA or even PEDL133, since the report concerns the whole of the Midland Valley. 2.8.4 No evidence is presented to support the concept of compartmentalisation at the local scale of the proposal. The named faults referred to by Dart on the quoted extracts above are shown in Figure 8. The three named faults are all north of the PDA, and are large, but not exceptional in importance. The supposed compartmentalisation seems to depend on the assumption that the faults in these "clay rich strata" will act as barriers due to clay smear along the fault plane. This assumption has been discussed and discounted in section 2.7 above. 3 IMPLICATIONS FOR POTENTIAL RECEPTORS 3.1 Migration up faults 3.1.1 Figure 9 shows the proposed horizontal wells, together with the existing Composite Energy wells on the OS 1:50K basemap. The underground corridors have been omitted as
Prof D K Smythe Review of Dart Energy hydrogeological assessment Page 13

Fig. 8. The Carnock, Dunmore Farm and Kilbagie Faults, to the north of the PDA. The solid geology comprises, from younger to older, Lower Coal Measures (grey), Passage Formation (yellow) and Upper Limestone Formation (pink). they are unlikely to be a source of upward fluid migration. The surface locations of the faults are shown in red. 3.1.2 Many of the proposed horizontal wells cut the faults. Allowance must be made for the slight difference in the underground location of the faults, since they are likely to have a hade (a dip, or slope, usually on the downthrown side); however, the location of the faults at 800 m or so below the ground surface will probably be within 100-200 m of the surface location. 3.1.3 Other smaller faults which remain unmapped may also exist, sufficient to create a permeable flow surface between the target coals and the Passage Formation. Unfortunately the existing 2D seismic lines do not have the resolution to permit faults with a throw of less than 40-50 m or so to be reliably identified. 3.1.4 I conclude that the numerous normal faults in the PDA are more likely to act as conduits for fluid flow and fugitive methane than to be barriers to flow. Furthermore, the conduit only has to extend in a vertical sense for 500 m to connect the target coals to the Secondary A aquifer of the Passage Formation. Within the latter further upward migration will be probable, and once any such fluids reach the Lower Coal Measures there is an additional easy route for upward migrating fluids provided by the old mine shafts (Fig. 2 above).
Prof D K Smythe Review of Dart Energy hydrogeological assessment Page 14

Fig. 9. The PDA in relation to faulting (red lines) and the OS map. 3.2 High risk development zones and groundwater vulnerability 3.2.1 The Coal Authority has mapped zones of high risk. This is shown by cross-hatching in Figure 10 below. It is defined as follows:
"The Development High Risk Area is the part of the coal mining reporting area which contains one or more recorded coal mining related features which have the potential for instability or a degree of risk to the surface from the legacy of coal mining operations. The combination of features includes mine entries; shallow coal workings (recorded and probable); recorded coal mining related hazards; recorded mine gas sites; fissures and breaklines and previous surface mining sites. New development in this defined area needs to demonstrate that the development will be safe and stable taking full account of former coal mining activities."
3.2.2 This map gives an indication of where surface development may be at high risk, and is therefore an indirect measure of legacy coal-mining operations. It is relevant to the subsurface elements of the PDA inasmuch as it is a proxy map for risk of fluid migration at shallow levels, mostly within the Lower Coal Measures. It can be regarded as complementary to the map of old mine shafts (Fig. 2 above), but is probably based on more complete information.
Prof D K Smythe Review of Dart Energy hydrogeological assessment Page 15

Fig. 10. Horizontal wells of the PDA and existing horizontal wells, in relation to faults (red) and the Coal Authority development high risk area (black cross-hatching).
Fig. 11. Groundwater vulnerability map of the PDA. There are 5 classes, from 1 (light grey) to 5 (black).
Prof D K Smythe Review of Dart Energy hydrogeological assessment Page 16

3.2.3 The BGS (Dochartaigh et al. 2005) has assessed the vulnerability of groundwater to risk. The published sample area happens to include PEDL 133. Figure 11 (above) shows this map in relation to the PDA and the faulting. Much of the groundwater in the area is in Class 1 (Only vulnerable to conservative contaminants in the long-term when continuously and widely introduced.), but small patches in black belong to the highest class, 5 (Vulnerable to most water contaminants with rapid impact in many cases). 3.2.4 Note that even Class 1 vulnerability means that fugitive methane migration is a problem. It could be widely introduced over the PDA, it could be a long-term problem (for at least the 30 year life of the installation), and it is a conservative contaminant (i.e. it does not die off). The italics here refer back to the definition of Class 1. 3.2.5 The issue of individual private water wells remains to be considered. They were mentioned in Dart's original planning application Environmental Statement at para. 8.24. 4 CONCLUSIONS 4.1 Despite the fact that a dozen or so wells have been drilled in or near the PDA over the last decade or more, the geology seems to be remarkably poorly understood. 4.2 There is no 3D seismic reflection survey over the PDA. Such a survey should have been commissioned to image the faults down to a resolution of a few metres, and would have gone some way to mitigating the very incomplete knowledge of faulting in this area. The PDA, excluding the outfall tunnels, covers about 15 km2. In order to image this subsurface area a surface survey covering about 35 km2 would be required, as the source vehicles (vibrators) would need to cover an area with a fringe of at least a kilometre outside the subsurface area to be imaged. As the target is shallow compared to orthodox oil industry targets, a high-resolution survey would be required, with receiver lines at a 25 m spacing. Such a survey is feasible, but would cost several million pounds. 4.3 There is no reliable and continuous caprock or barrier layer over the PDA. The entire edifice of confidence that fugitive emissions are very unlikely to occur is based on a single measurement of hydraulic conductivity from an old oil industry well some 5 km NE of the PDA centroid, combined with the highly optimistic assumption, based on a single research paper citation, that the faults will act as seals due to clay smear. Many more measurements of hydraulic conductivity, both in situ and in the laboratory, should have been made. 4.4 There are at least a dozen places where horizontal wells will penetrate through a fault. Due to the use of slimhole drilling technology, there is no way to cement up the fault zone, even if such a zone could be recognised. Faults not infrequently go unrecognised even in fully logged and cored vertical boreholes and wells, as the Airth-2 example discussed above illustrates. 4.5 Dart has not explained how it will be able to confine each horizontal well to its respective coal seam. Furthermore, there is no guide as to what will happen if and when the borehole penetrates a fault and the coal on the far side is 'missing', because it has been displaced vertically upwards or downwards. 4.6 The development therefore poses a threat to groundwater resources over the entire area of the PDA, and there is the additional risk that fugitive methane may even reach the surface. In my view the development should not be permitted.
Prof D K Smythe Review of Dart Energy hydrogeological assessment Page 17

Prof D K Smythe Review of Dart Energy hydrogeological assessment Page 18
REFERENCES British Geological Survey 2011. Baseline Scotland: groundwater chemistry of the Carboniferous sedimentary aquifers of the Midland Valley. British Geological Survey Open Report OR/111021. Dochartaigh, B.E.O, Ball, D.E., MacDonald, A.M., Lilly, A., Fitzsimons, V., Del Rio, M. and Auton, C.A. 2005. Mapping groundwater vulnerability in Scotland: a new approach for the Water Framework Directive. Scottish Journal of Geology 41, 21-30. Duncan, W.I., Green, P.F and Duddy, I.R. 1998. Source rock burial history and seal effectiveness: key facets to understanding hydrocarbon exploration potential in the East and Central Irish Sea Basins. Am. Ass. Petrol. Geologists Bull. 82, 1401-1415. Lunn, R.J., Shipton, Z. K. and Bright A. M. 2008. How can we improve estimates of bulk fault zone hydraulic properties? Geological Society, London, Spec. Publ. 299; 231-237. MacDonald, A.M., Ball, D.F and Dochartaigh, B.E.O. 2004. A GIS of aquifer productivity in Scotland: explanatory notes. Commissioned Report CR/04/047N. Manzocchi, T., Heath, A.E. ,Walsh, J.J., Childs, C. 2002. The representation of two phase fault-rock properties in flow simulation models. Petroleum Geoscience, 8, 119-132. Tellam, J.H. and Lloyd, J.W. 1981. A review of the hydrogeology of British onshore non-carbonate mudrocks. Quarterly Journal of Engineering Geology and Hydrogeology, 14, 347-355.


![Alphageo awarded Contract from Dart Energy (AS) Pte Ltd [Company Update]](https://static.fdocuments.in/doc/165x107/577cb4971a28aba7118c9113/alphageo-awarded-contract-from-dart-energy-as-pte-ltd-company-update.jpg)