Darcy-Olmos-2010-ATRS-paper-9_Aircraft_Asset_Management_toolsairline_strategies_during_world_market_downturn.pdf...
29
Darcy Olmos Mancilla- ATRS World Conference 2010 Aircraft Asset Management: Tools & airline strategies during a world market downturn 1 Aircraft Asset Management: Tools & airline strategies during a world market downturn ATRS World Conference 2010 Paper Darcy Olmos Mancilla, Consultant AirBusiness Academy, 19 av. Leonard de Vinci, 31700 Toulouse, France Phone +33 562 121 139, fax +33 562 121 120 Email address: [email protected] Contents Abstract ........................................................................................................................................................ 2 Introduction .................................................................................................................................................. 3 Background .................................................................................................................................................. 4 Airlines industry analysis............................................................................................................................. 5 Airlines business models ......................................................................................................................... 5 Airlines world regions revenue and profitability analysis ....................................................................... 7 Airlines sample ............................................................................................................................................ 8 Aircraft asset management tools .................................................................................................................. 9 Airlines research sample: fleet ownership and analysis ............................................................................ 15 Brand new aircraft: financing and ownership analysis .............................................................................. 20 Conclusion ................................................................................................................................................. 21 Appendix A: Top 150 airlines group financial data .................................................................................. 23 Appendix B: Airlines research sample’s revenues .................................................................................... 24 Appendix C: Airlines research sample’s fleet data .................................................................................... 25 Appendix D: Lease vs. purchase comparison ............................................................................................ 28 References .................................................................................................................................................. 29
description
Aviation finance
Transcript of Darcy-Olmos-2010-ATRS-paper-9_Aircraft_Asset_Management_toolsairline_strategies_during_world_market_downturn.pdf...
Darcy Olmos Mancilla- ATRS World Conference 2010 Aircraft Asset Management: Tools & airline strategies during a world market downturn
1
Aircraft Asset Management:
Tools & airline strategies during a world market downturn
ATRS World Conference 2010 Paper
Darcy Olmos Mancilla, Consultant
AirBusiness Academy, 19 av. Leonard de Vinci, 31700 Toulouse, France
Phone +33 562 121 139, fax +33 562 121 120
Email address: [email protected]
Contents
Abstract ........................................................................................................................................................2
Introduction..................................................................................................................................................3
Background..................................................................................................................................................4
Airlines industry analysis.............................................................................................................................5
Airlines business models .........................................................................................................................5 Airlines world regions revenue and profitability analysis .......................................................................7
Airlines sample ............................................................................................................................................8
Aircraft asset management tools..................................................................................................................9
Airlines research sample: fleet ownership and analysis ............................................................................15
Brand new aircraft: financing and ownership analysis ..............................................................................20
Conclusion .................................................................................................................................................21
Appendix A: Top 150 airlines group financial data ..................................................................................23
Appendix B: Airlines research sample’s revenues ....................................................................................24
Appendix C: Airlines research sample’s fleet data....................................................................................25
Appendix D: Lease vs. purchase comparison............................................................................................28
References..................................................................................................................................................29
Darcy Olmos Mancilla- ATRS World Conference 2010 Aircraft Asset Management: Tools & airline strategies during a world market downturn
2
Abstract Have airlines changed the way they manage their aircraft during the current economic crisis? In this
paper the author reviews aircraft asset management strategies and programmes implemented by airlines
in today’s difficult business environment. It analyses the essential aspects of aircraft asset management
tools available in the market, looking at the impact on the aviation industry. Through the analysis of
fleet data of airlines from different regions and with different business models, the author has identified
changes in the way airlines manage their fleets. Indeed, empirical data from latest aircraft transactions,
financing and storage numbers evolution suggests a “change of approach” of industry players during this
aviation market’s unprecedented crisis. On the other hand, trends in world aircraft ownership suggest an
increase in airline fleet flexibility and diversification of the industrial, ownership and operational risks.
Furthermore, aircraft values, economic and airline data analysis show a strong correlation between the
aviation industry and the world economic situation. Aircraft asset management tools could be an
important factor to be taken into account as part of the airline strategy and management decisions,
notably during downturns.
KEY WORDS
Aircraft asset management, airlines business models, aircraft residual value, aircraft book value, aircraft
ownership, airline fleet, operating lease, finance lease, sale and lease back (SLB), Export Credit Agency
(ECA), securitization
Darcy Olmos Mancilla- ATRS World Conference 2010 Aircraft Asset Management: Tools & airline strategies during a world market downturn
3
Introduction Aviation is a highly cyclical/GDP correlated industry (Darcy Olmos, 2008), therefore economic
downturns put real pressure on aviation industry’s profitability. The current economic crisis has had a
non precedent impact on airlines’ net profitability of -$15.9 billions in 2008 and -$9.4 billions in 2009E
(IATA, March 2010). On the other hand, the 1,400 or more aircraft due to be delivered this year,
together with a normal 400 or so retirements, could boost the in-service fleet 4%, so adding more
capacity to the already deteriorated aviation market. However, two thirds of airlines managers surveyed
by IATA in April 2010 expect profitability to improve over the next 12 months; concern is building over
the rise in fuel cost ahead which may hamper a speedy return to profitability at the industry level. This
situation, along with a potential slow recovery on traffic demand, notably in mature markets such as
Europe and North America, and increasing cost could create a real challenge to airlines and the way they
manage their fleet.
The aim of this paper is to review and analyse aircraft ownership and financing structures (referred to as
asset management strategies hereafter) implemented by airlines with different business models and from
different regions during the last 5 years and notably during today’s difficult business environment.
To describe airline aircraft management and aviation industry trends, the majority of researchers use
industry macro figures such as RPK, load factors and aircraft retirements figures with a strong focus on
general aspects. This paper goes further by providing the essential characteristics of the most commonly
used aircraft asset management tools and analysing specific airline fleet samples over the last 5 years to
identify changes in the way airlines use these tools to respond to the economic crisis.
Through the analysis of statistical data, the author has identified for new aircrafts an increase of ECA
support, backstop and SLB transactions notably; and for second hand aircraft a decrease of operating
leased aircraft coupled with an increase of aircraft grounding and retirements. On the other hand, no
specific asset management pattern was identified among different types of airline business models. For
instance, main airlines groups such as Lufthansa, Air France and Iberia despite the fact of being located
in the same region; used totally different and sometimes “opposite” aircraft asset management
philosophy although each of them have been key industry players for years.
Darcy Olmos Mancilla- ATRS World Conference 2010 Aircraft Asset Management: Tools & airline strategies during a world market downturn
4
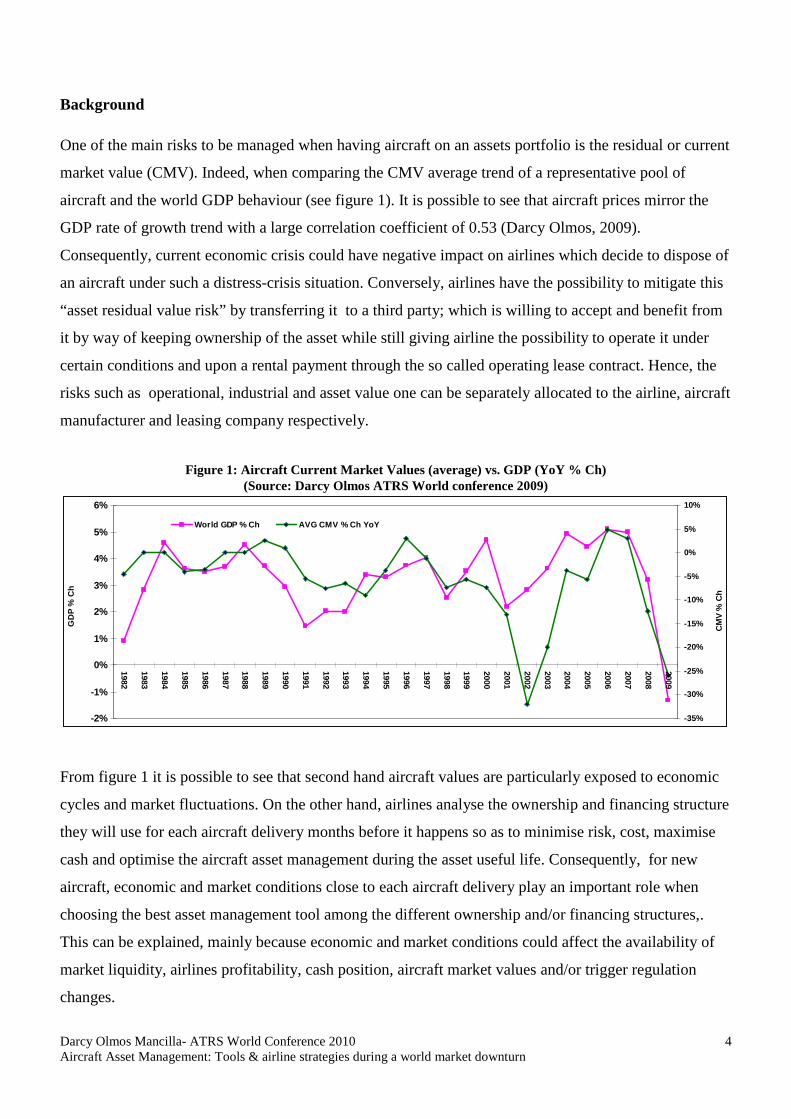
Background One of the main risks to be managed when having aircraft on an assets portfolio is the residual or current
market value (CMV). Indeed, when comparing the CMV average trend of a representative pool of
aircraft and the world GDP behaviour (see figure 1). It is possible to see that aircraft prices mirror the
GDP rate of growth trend with a large correlation coefficient of 0.53 (Darcy Olmos, 2009).
Consequently, current economic crisis could have negative impact on airlines which decide to dispose of
an aircraft under such a distress-crisis situation. Conversely, airlines have the possibility to mitigate this
“asset residual value risk” by transferring it to a third party; which is willing to accept and benefit from
it by way of keeping ownership of the asset while still giving airline the possibility to operate it under
certain conditions and upon a rental payment through the so called operating lease contract. Hence, the
risks such as operational, industrial and asset value one can be separately allocated to the airline, aircraft
manufacturer and leasing company respectively.
Figure 1: Aircraft Current Market Values (average) vs. GDP (YoY % Ch) (Source: Darcy Olmos ATRS World conference 2009)
-2%
-1%
0%
1%
2%
3%
4%
5%
6%
1982
1983
1984
1985
1986
1987
1988
1989
1990
1991
1992
1993
1994
1995
1996
1997
1998
1999
2000
2001
2002
2003
2004
2005
2006
2007
2008
2009
GD
P %
Ch
-35%
-30%
-25%
-20%
-15%
-10%
-5%
0%
5%
10%
CM
V %
Ch
World GDP % Ch AVG CMV % Ch YoY
From figure 1 it is possible to see that second hand aircraft values are particularly exposed to economic
cycles and market fluctuations. On the other hand, airlines analyse the ownership and financing structure
they will use for each aircraft delivery months before it happens so as to minimise risk, cost, maximise
cash and optimise the aircraft asset management during the asset useful life. Consequently, for new
aircraft, economic and market conditions close to each aircraft delivery play an important role when
choosing the best asset management tool among the different ownership and/or financing structures,.
This can be explained, mainly because economic and market conditions could affect the availability of
market liquidity, airlines profitability, cash position, aircraft market values and/or trigger regulation
changes.
Darcy Olmos Mancilla- ATRS World Conference 2010 Aircraft Asset Management: Tools & airline strategies during a world market downturn
5
Airline industry analysis
Airline revenues grew substantially from $ 346.4 billion in 2000 to $572.4 billion in 20081. This increase
has been shared differently among different airline types and world regions, consequently an analysis
and description of different airline business models and revenue market shared as per region is provided
hereafter
Airline business models By definition a business model describes the rationale of how an organization creates, delivers, and
captures value in economic, social, or other forms of value. The process of business model design is part
of business strategy.
In theory and practice the term business model is used for a broad range of informal and formal
descriptions to represent core aspects of a business, including purpose, offerings, strategies,
infrastructure, organizational structures, trading practices, and operational processes and policies.
Hereafter, a broad description of the main characteristics of the main 5 airline business models:
Mainline carriers : These are mainly network or former flag carriers of States that maintain hub and
spoke networks, consolidating traffic at key hub airports.
Leisure airlines: Either travel group or charter airlines. Traditionally these airlines have carried
passengers at low unit costs, targeting holiday travellers. Most European charter airlines now form part
of vertically integrated organisations incorporating a tour operator, travel agency chain, airline and, often
hotels and providers of ground transportation (Williams, 2001). Several charter airlines offer scheduled
and seat-only services as a result of competition with Low Cost Carries (LCCs).
Low cost carriers: This business model has evolved in different directions, some airlines keeping to a
more solid model involving low frequency services to secondary airport, others adapting to the higher-
yielding business market serving higher frequencies.
1 Airlines business top 150 airlines 2008

Darcy Olmos Mancilla- ATRS World Conference 2010 Aircraft Asset Management: Tools & airline strategies during a world market downturn
6
Regional airlines: These carriers tend to operate shorter sectors both point to point and feeding network
carrier hubs, usually with aircraft of less than 100 seats (Cranfield University, 2008).
Cargo Airlines: These are airfreight carrier dedicated to the transport of cargo
From figure 2 it is possible to see that the predominant business model in the industry is still the
mainline or network carrier group representing 80% of the market share in terms of revenue. On the
other hand, LCCs are the second most important business model with 9% market share and with an
aggressive year-on-year rate of growth of 19.5% in 2008 (see appendix A). Cargo was the only group
with negative revenue growth, which is in line with the higher sensitivity of this segment to the
economic cycles and notably trade volumes. In terms of profitability, the top 150 airlines got a negative
net profitability margin of -5.8% with all business segments groups in negative position except leisure
group that showed a low 1% net margin
Figure 2: Airlines business models and market share (USD Revenues 2008) (Source: D. Olmos of airlines business data)
2%
9%3% 6%
80%
Cargo - Group
Mainline - Group
Leisure - Group
Low Cost - Group
Regional - Group
Darcy Olmos Mancilla- ATRS World Conference 2010 Aircraft Asset Management: Tools & airline strategies during a world market downturn
7
Airlines world regions revenue and profitability analysis
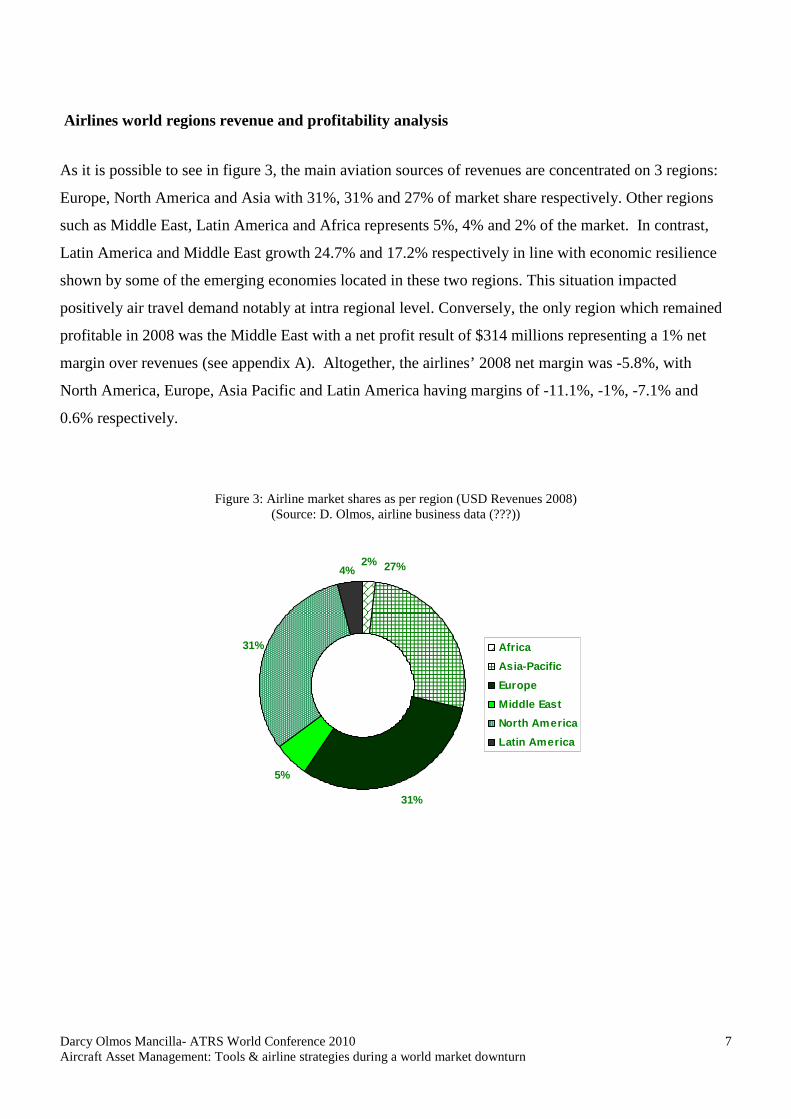
As it is possible to see in figure 3, the main aviation sources of revenues are concentrated on 3 regions:
Europe, North America and Asia with 31%, 31% and 27% of market share respectively. Other regions
such as Middle East, Latin America and Africa represents 5%, 4% and 2% of the market. In contrast,
Latin America and Middle East growth 24.7% and 17.2% respectively in line with economic resilience
shown by some of the emerging economies located in these two regions. This situation impacted
positively air travel demand notably at intra regional level. Conversely, the only region which remained
profitable in 2008 was the Middle East with a net profit result of $314 millions representing a 1% net
margin over revenues (see appendix A). Altogether, the airlines’ 2008 net margin was -5.8%, with
North America, Europe, Asia Pacific and Latin America having margins of -11.1%, -1%, -7.1% and
0.6% respectively.
Figure 3: Airline market shares as per region (USD Revenues 2008) (Source: D. Olmos, airline business data (???))
4% 27%2%
31%
5%
31%
Africa
Asia-Pacific
Europe
Middle East
North America
Latin America
Darcy Olmos Mancilla- ATRS World Conference 2010 Aircraft Asset Management: Tools & airline strategies during a world market downturn
8
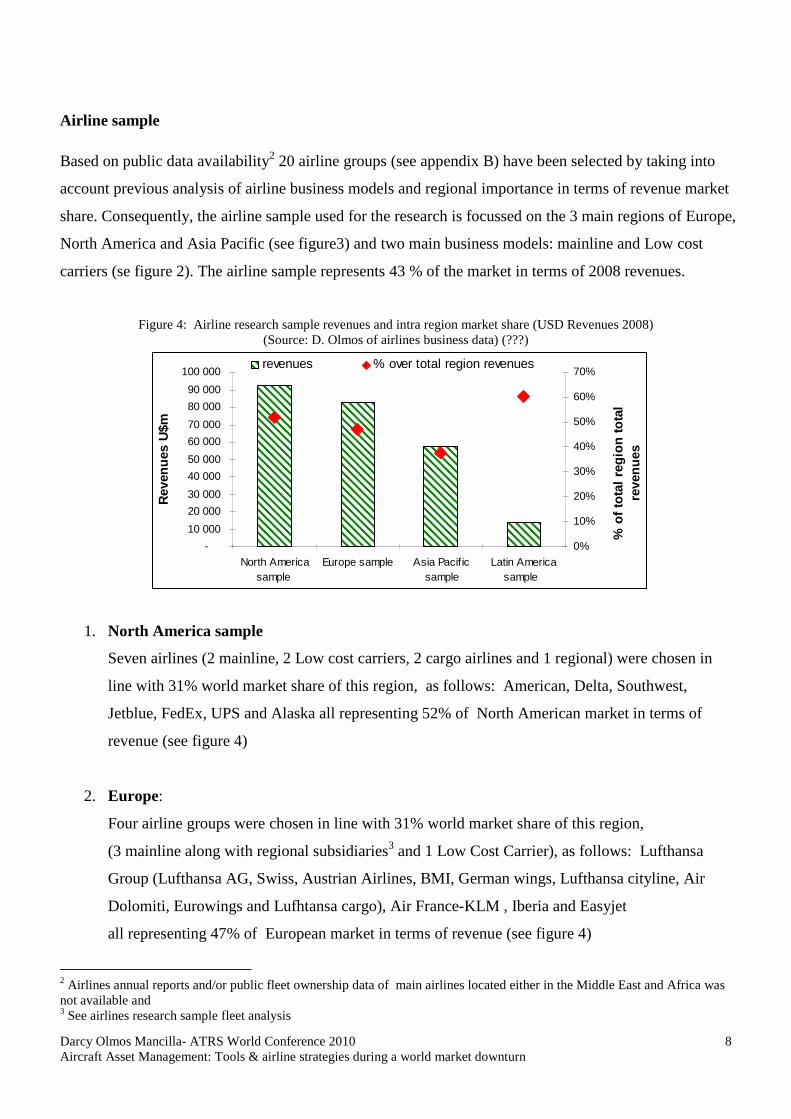
Airline sample Based on public data availability2 20 airline groups (see appendix B) have been selected by taking into
account previous analysis of airline business models and regional importance in terms of revenue market
share. Consequently, the airline sample used for the research is focussed on the 3 main regions of Europe,
North America and Asia Pacific (see figure3) and two main business models: mainline and Low cost
carriers (se figure 2). The airline sample represents 43 % of the market in terms of 2008 revenues.
Figure 4: Airline research sample revenues and intra region market share (USD Revenues 2008) (Source: D. Olmos of airlines business data) (???)
1. North America sample
Seven airlines (2 mainline, 2 Low cost carriers, 2 cargo airlines and 1 regional) were chosen in
line with 31% world market share of this region, as follows: American, Delta, Southwest,
Jetblue, FedEx, UPS and Alaska all representing 52% of North American market in terms of
revenue (see figure 4)
2. Europe:
Four airline groups were chosen in line with 31% world market share of this region,
(3 mainline along with regional subsidiaries3 and 1 Low Cost Carrier), as follows: Lufthansa
Group (Lufthansa AG, Swiss, Austrian Airlines, BMI, German wings, Lufthansa cityline, Air
Dolomiti, Eurowings and Lufhtansa cargo), Air France-KLM , Iberia and Easyjet
all representing 47% of European market in terms of revenue (see figure 4)
2 Airlines annual reports and/or public fleet ownership data of main airlines located either in the Middle East and Africa was not available and 3 See airlines research sample fleet analysis
-
10 000
20 000
30 000
40 000
50 000
60 000
70 000
80 000
90 000
100 000
North Americasample
Europe sample Asia Pacif icsample
Latin Americasample
Rev
enu
es U
$m
0%
10%
20%
30%
40%
50%
60%
70%
% o
f to
tal
reg
ion
to
tal
reve
nu
es
revenues % over total region revenues

Darcy Olmos Mancilla- ATRS World Conference 2010 Aircraft Asset Management: Tools & airline strategies during a world market downturn
9
3. Asia Pacific
Six airline groups were chosen in line with 27% world market share of this region, 6 mainline
along with 1 cargo subsidiary (SIA cargo) and 1 regional airline (Dragonair): All Nippon
Airways group, Cathay Pacific including Dragon Air, Air China, China Southern, China Eastern
all representing 38% of Asia Pacific market in terms of revenue (see figure 4).
4. South America
Three airlines were chosen in line with 4% world market share of this region (2 mainline and 1
low cost carrier) as follows: TAM, LAN and GOL Transportes Aereos all representing 60% of
South American market in terms of revenue (see figure 4).
Historical public fleet data along with ownership structure was not available for main airlines in the
Middle East and Africa
Aircraft asset management tools Airline industry has some particularities which make it very different from other types of businesses,
some of them are very cyclical, competitive, seasonal, regulated, low profitability, capital intensive, cost
rigid, highly skilled and sensitive industry. Consequently, airlines face the challenge of managing both
operational and aircraft residual value risks along with keeping profitability and fleet flexibility.
Hereafter, the author summarizes the main aircraft ownership and financing structures used by the
industry in order to take, manage and/or mitigate the risks mentioned above
Direct purchase
The situation when airline decides to buy an aircraft directly from manufacturer with its own cash and
most of the time keeping the legal title of the aircraft. Under a direct purchase by the airline, normally it
keeps ownership of the aircraft which provides airlines the tax benefits of aircraft depreciation and
having an asset on its balance sheet which can be used as collateral when raising funds and/or as
potential source of liquidity if it is sold. In reality, few airlines have the capability to buy directly with
their own cash and therefore losing most of the times the possibility of keeping ownership of the aircraft.

Darcy Olmos Mancilla- ATRS World Conference 2010 Aircraft Asset Management: Tools & airline strategies during a world market downturn
10
Some of the most likely airline asset management decisions during economic downturn when owning
the aircraft after a direct purchase are:
� Ground the aircraft, incurring preservation, parking and maintenance cost without revenue
generation
� Sell the aircraft to another third party normally under distress basis
� Enter into a SLB transaction with a lessor which could be applicable to either a new or second
hand aircraft (see sale and lease back)
� Sublease the aircraft
� Access manufacturers asset management support
Figure 5: World fleet in storage (Source: Ascend)
From figure 5 it is possible to see that aircraft in storage tend to increase in periods of economic
downturns such as 1991-2-3, 2001-2 and 2008-9-10. Most of these aircraft were parked temporarily and
some of them will never come back again into service due to economic performance reasons, regulation
or obsolescence. Number of aircraft in storage increased dramatically from 1638 aircraft in 2007 to 2518
aircraft in July 2010 representing a 54% increase.
0200400600800
100012001400160018002000220024002600
1989
1990
1991
1992
1993
1994
1995
1996
1997
1998
1999
2000
2001
2002
2003
2004
2005
2006
2007
2008
2009
juil-
05
Darcy Olmos Mancilla- ATRS World Conference 2010 Aircraft Asset Management: Tools & airline strategies during a world market downturn
11
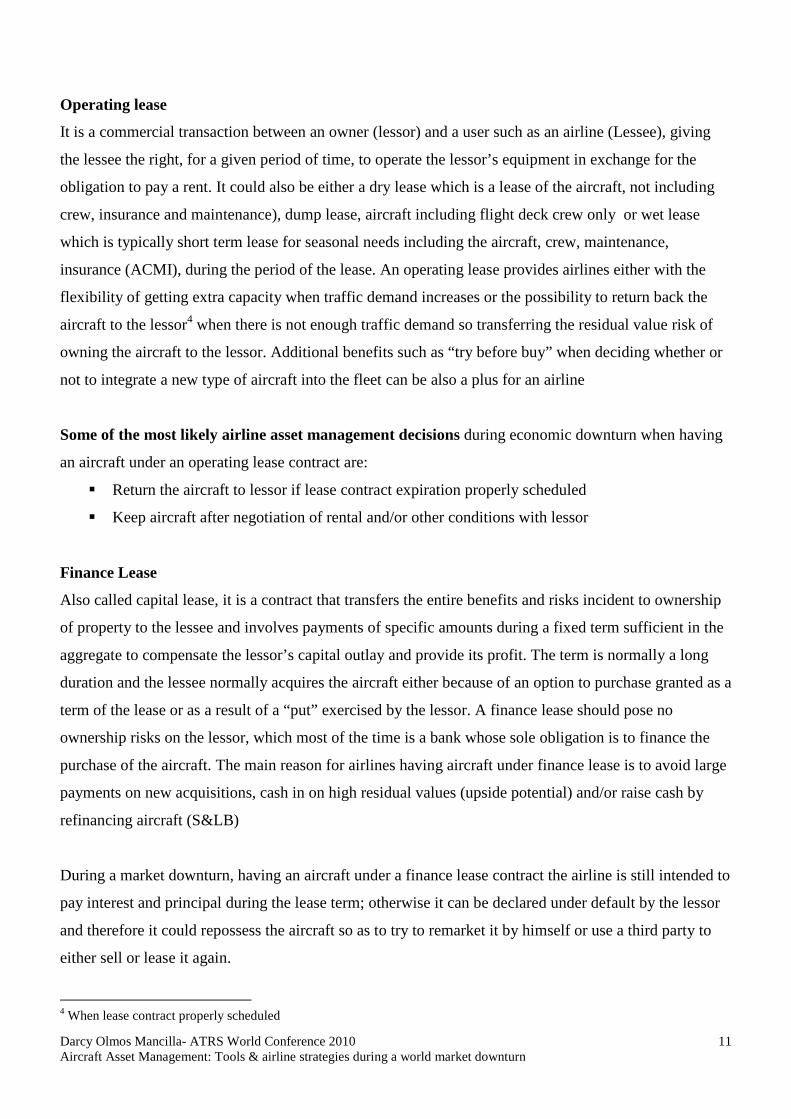
Operating lease
It is a commercial transaction between an owner (lessor) and a user such as an airline (Lessee), giving
the lessee the right, for a given period of time, to operate the lessor’s equipment in exchange for the
obligation to pay a rent. It could also be either a dry lease which is a lease of the aircraft, not including
crew, insurance and maintenance), dump lease, aircraft including flight deck crew only or wet lease
which is typically short term lease for seasonal needs including the aircraft, crew, maintenance,
insurance (ACMI), during the period of the lease. An operating lease provides airlines either with the
flexibility of getting extra capacity when traffic demand increases or the possibility to return back the
aircraft to the lessor4 when there is not enough traffic demand so transferring the residual value risk of
owning the aircraft to the lessor. Additional benefits such as “try before buy” when deciding whether or
not to integrate a new type of aircraft into the fleet can be also a plus for an airline
Some of the most likely airline asset management decisions during economic downturn when having
an aircraft under an operating lease contract are:
� Return the aircraft to lessor if lease contract expiration properly scheduled
� Keep aircraft after negotiation of rental and/or other conditions with lessor
Finance Lease
Also called capital lease, it is a contract that transfers the entire benefits and risks incident to ownership
of property to the lessee and involves payments of specific amounts during a fixed term sufficient in the
aggregate to compensate the lessor’s capital outlay and provide its profit. The term is normally a long
duration and the lessee normally acquires the aircraft either because of an option to purchase granted as a
term of the lease or as a result of a “put” exercised by the lessor. A finance lease should pose no
ownership risks on the lessor, which most of the time is a bank whose sole obligation is to finance the
purchase of the aircraft. The main reason for airlines having aircraft under finance lease is to avoid large
payments on new acquisitions, cash in on high residual values (upside potential) and/or raise cash by
refinancing aircraft (S&LB)
During a market downturn, having an aircraft under a finance lease contract the airline is still intended to
pay interest and principal during the lease term; otherwise it can be declared under default by the lessor
and therefore it could repossess the aircraft so as to try to remarket it by himself or use a third party to
either sell or lease it again.
4 When lease contract properly scheduled
Darcy Olmos Mancilla- ATRS World Conference 2010 Aircraft Asset Management: Tools & airline strategies during a world market downturn
12
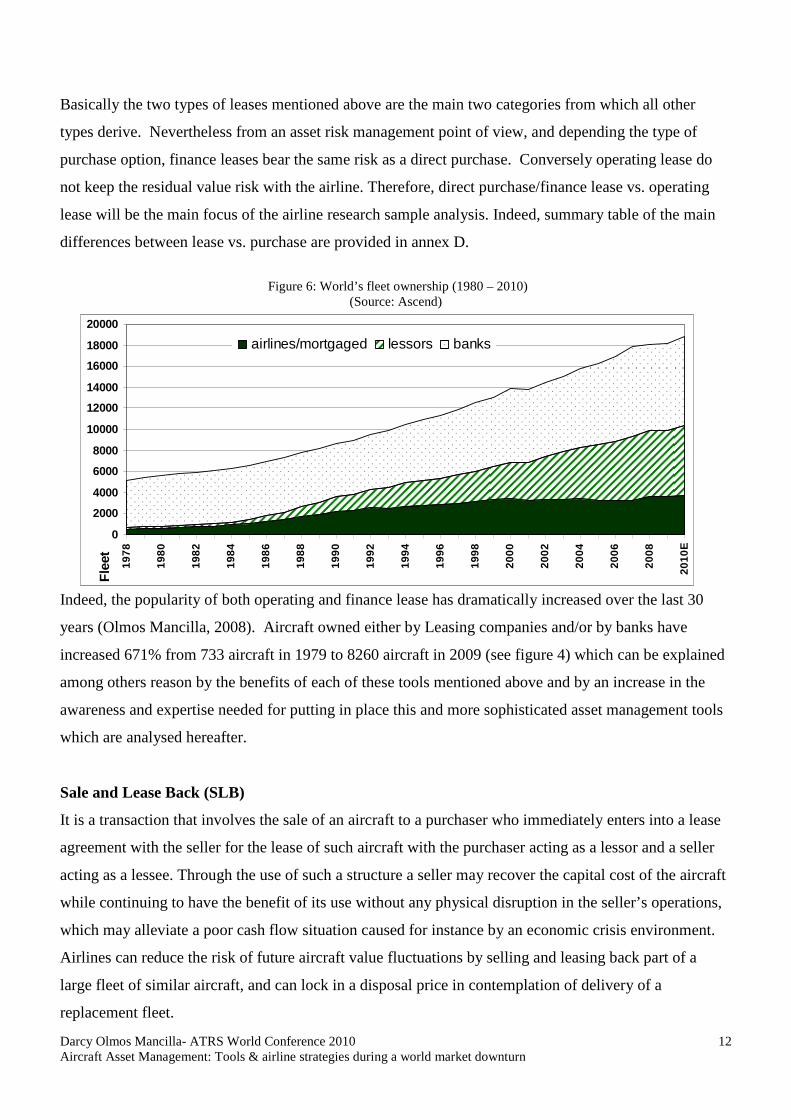
Basically the two types of leases mentioned above are the main two categories from which all other
types derive. Nevertheless from an asset risk management point of view, and depending the type of
purchase option, finance leases bear the same risk as a direct purchase. Conversely operating lease do
not keep the residual value risk with the airline. Therefore, direct purchase/finance lease vs. operating
lease will be the main focus of the airline research sample analysis. Indeed, summary table of the main
differences between lease vs. purchase are provided in annex D.
Figure 6: World’s fleet ownership (1980 – 2010)
(Source: Ascend)
Indeed, the popularity of both operating and finance lease has dramatically increased over the last 30
years (Olmos Mancilla, 2008). Aircraft owned either by Leasing companies and/or by banks have
increased 671% from 733 aircraft in 1979 to 8260 aircraft in 2009 (see figure 4) which can be explained
among others reason by the benefits of each of these tools mentioned above and by an increase in the
awareness and expertise needed for putting in place this and more sophisticated asset management tools
which are analysed hereafter.
Sale and Lease Back (SLB)
It is a transaction that involves the sale of an aircraft to a purchaser who immediately enters into a lease
agreement with the seller for the lease of such aircraft with the purchaser acting as a lessor and a seller
acting as a lessee. Through the use of such a structure a seller may recover the capital cost of the aircraft
while continuing to have the benefit of its use without any physical disruption in the seller’s operations,
which may alleviate a poor cash flow situation caused for instance by an economic crisis environment.
Airlines can reduce the risk of future aircraft value fluctuations by selling and leasing back part of a
large fleet of similar aircraft, and can lock in a disposal price in contemplation of delivery of a
replacement fleet.
0
2000
4000
6000
8000
10000
12000
14000
16000
18000
20000
197
8
198
0
198
2
198
4
198
6
198
8
199
0
199
2
199
4
199
6
199
8
200
0
200
2
200
4
200
6
200
8
2010
E
Fle
et
airlines/mortgaged lessors banks

Darcy Olmos Mancilla- ATRS World Conference 2010 Aircraft Asset Management: Tools & airline strategies during a world market downturn
13
In summary it is possible to distinguish between two different markets where main characteristics are as
follows:
• New aircraft
– At aircraft delivery, up to 100% of net aircraft price
– Prior to delivery, lessor can step in and pay pre-delivery payments
• Old, debt free aircraft
– to raise cash (often to solve cash-flow problems)
– to transfer residual value risk (e.g. older aircraft)
– to realise “hidden equity” in values (when market values are substantially above book
values)
Figure 7: Ownership of the airline fleet (Source: Ascend)
From figure 5 it is possible to see the increase of SLB activity during the downturns such as 2001 and
2008-9. Then, it is true mostly for SLBs on delivery (e.g. 2001 and 2009). It is also interesting to see an
activity jump in 2007 where economic and market condition were very positive, this situation could be
explained for the big amount of liquidity on the market and the willingness of lessor and banks of
entering on these kind of transactions
0
50
100
150
200
250
300
350
400
2001
2002
2003
2004
2005
2006
2007
2008
2009
2010
YTD
Used SLB SLB on Delivery
Darcy Olmos Mancilla- ATRS World Conference 2010 Aircraft Asset Management: Tools & airline strategies during a world market downturn
14
Governmental support: Export Credit Agencies (ECA)
Most industrialized countries have specific governments departments or agencies with the responsibility
of developing, promoting and financing export sales of that nation’s products. Through insurance and
loan and guarantee programs, the official export credit agencies seek to ensure that, to the extent
practicable, sellers of national goods and services that are otherwise internationally competitive remain
so when financing of the sale is taken into account. One feature common to all the systems is the
assumption, by or on behalf of the government, of the bulk of credit risk inherent in extending finance to
foreign buyers. Every system has a specialized institution for this purpose, either an official body or one
that acts in the State’s name. Official support, through export credit agencies (ECAs), may be provided
as “pure cover” (i.e. insurance or guarantees given to exporters or lending institutions without financing
support); as financing support, (i.e. direct credits/financings, refinancing, interest rate support); or as aid
financing (credits and grants). Official credit support may be provided with the basic guarantee or
insurance facility, or it may be provided on an stand-alone basis. Main ECAs are EXIM bank, COFACE,
HERMES, ECGD and EDC for the US, France, Germany, UK and Canada respectively.
Manufacturers’ assistance
Manufacturers’ support is, generally, a market-driven factor in aircraft financing. When times are good
for the industry, manufacturers’ support is low or non existent, but when times are tough and sales are
few, then competition will force manufacturers to take risks that they will normally try to avoid.
Aircraft securitization
Is the process by which pools of leases and aircraft are packaged, underwritten and distributed to
investors in the form of security instruments known as Enhanced Equipment Trust Certificates (EETC)
securitization and portfolio securitization. There are two main types:
I. Receivable securitization: where the rentals and other revenues payable pursuant to leases are
securitized
II. Residual securitization: where the residual value of the aircraft is securitized
Main benefits are:
� The risk is spread over a number of borrowers
� The risk may be spread over a number of geographical regions
� The larger the transaction the lower the transaction cost per unit
� The loan or asset is removed from the lessor’s or airline’s balance sheet
� Funding with finer margins are available in the market

Darcy Olmos Mancilla- ATRS World Conference 2010 Aircraft Asset Management: Tools & airline strategies during a world market downturn
15
Although it is an aircraft financing and asset management tools which can provide liquidity for an airline
willing to securitize aircraft on its portfolio, it is very difficult to make a detailed ownership analysis and
track of SLB’s aircrafts mainly because it could involve external parties such as credit agencies or
different investors which public data is not available.
It is making a loan or mortgage into a tradable security by issuing a bill of exchange or other negotiable
paper in place of the loan. The term is also known in the aviation industry as the “packaging of aircraft-
related receivables into securities for sale to investors”
Airline research sample: fleet ownership and analysis Based on the airline sample discussed previously, the author analyses their fleet ownership evolution
over the last 5 years so as to identify main changes on their asset management strategies before (2007-2)
and during economic downturn (2008-9). For some airlines groups, regional subsidiaries fleet ownership
data was available: VLM Airlines, Regional, Cityjet and Britair for Air France, KLM Cityhopper the for
KLM and Dragon air for Cathay Pacific, therefore the author analysed it as a separate regional carrier.
The same criteria was applied to Singapore cargo subsidiary of Singapore airlines.
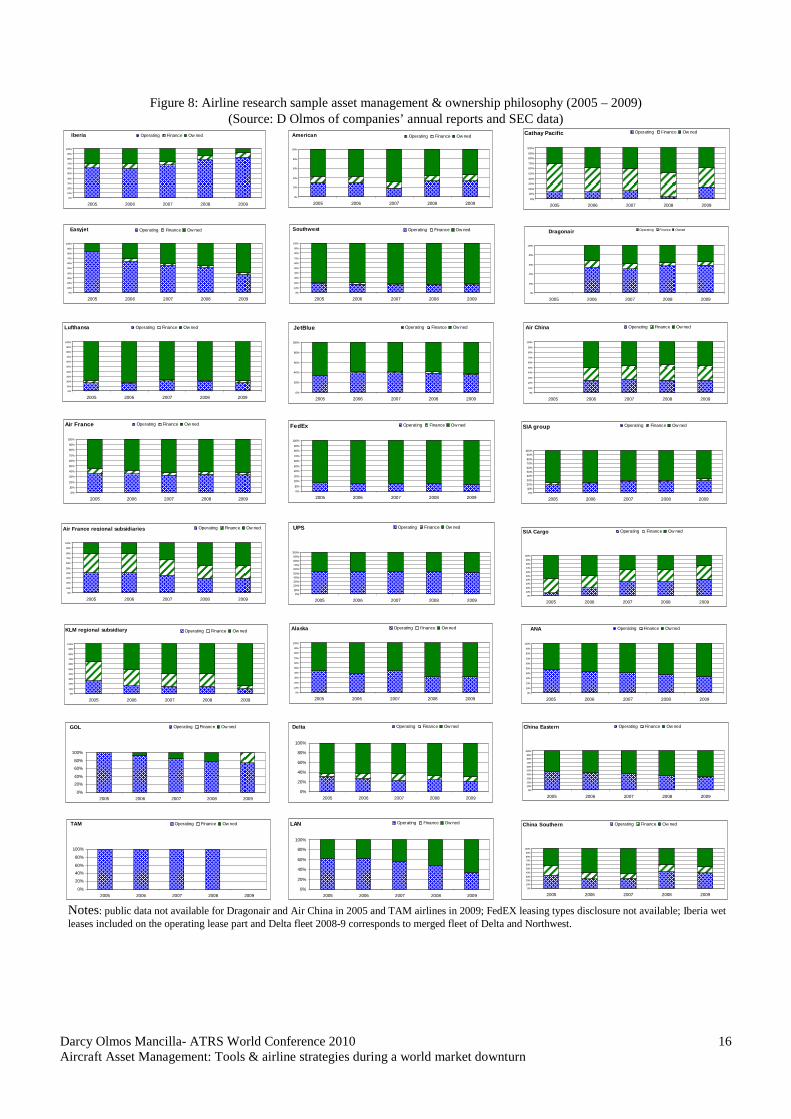
From figure 8 it is possible to see that airlines implemented different asset management tools and
ownership mixes over the last five years (airline ownership philosophy). For instance, airlines such as
Lufthansa, Southwest, FedEx and Singapore airlines group decided to take most of the aircraft residual
value risk by owning around 80% of their fleet over the last 5 years, which can be explained by the
airline’s philosophy and/or the benefits mentioned above (see direct purchase). Conversely, airlines such
as Iberia or the Brazilian carriers Gol and TAM had largely used operating leasing as their preferred
asset management and ownership tool which also can be explained by the benefits of it (see operating
leasing part) and the carrier strategy and philosophy. For instance Iberia openly states that “airlines’
mission is to bring people from point A to B which doesn’t necessarily mean taking the residual value
risk of the aircraft” (AirBusiness Academy, Asset Management course 2010). Although the airline
research sample represents an important part of the aviation market revenues and most of their members
have a sustainable and solid business, the author found no common asset management strategy or
philosophy; consequently it is not possible to associate one specific asset management philosophy with
airline economic success and/or business sustainability over time.
Darcy Olmos Mancilla- ATRS World Conference 2010 Aircraft Asset Management: Tools & airline strategies during a world market downturn
16
Figure 8: Airline research sample asset management & ownership philosophy (2005 – 2009) (Source: D Olmos of companies’ annual reports and SEC data)
Notes: public data not available for Dragonair and Air China in 2005 and TAM airlines in 2009; FedEX leasing types disclosure not available; Iberia wet leases included on the operating lease part and Delta fleet 2008-9 corresponds to merged fleet of Delta and Northwest.
Iberia
0%
10%
20%
30%
40%
50%
60%
70%
80%
90%
100%
2005 2006 2007 2008 2009
Operating Finance Ow ned
Easyjet
0%
10%
20%
30%
40%
50%
60%
70%
80%
90%
100%
2005 2006 2007 2008 2009
Operating Finance Ow ned
Lufthansa
0%
10%
20%
30%
40%
50%
60%
70%
80%
90%
100%
2005 2006 2007 2008 2009
Operating Finance Ow ned
Air France
0%
10%
20%
30%
40%
50%
60%
70%
80%
90%
100%
2005 2006 2007 2008 2009
Operating Finance Ow ned
Air France regional subsidiaries
0%
10%
20%
30%
40%
50%
60%
70%
80%
90%
100%
2005 2006 2007 2008 2009
Operating Finance Ow ned
KLM regional subsidiary
0%
10%
20%
30%
40%
50%
60%
70%
80%
90%
100%
2005 2006 2007 2008 2009
Operating Finance Ow ned
American
0%
20%
40%
60%
80%
100%
2005 2006 2007 2008 2009
Operating Finance Ow ned
Southwest
0%
10%
20%
30%
40%
50%
60%
70%
80%
90%
100%
2005 2006 2007 2008 2009
Operating Finance Ow ned
JetBlue
0%
20%
40%
60%
80%
100%
2005 2006 2007 2008 2009
Operating Finance Ow ned
FedEx
0%
10%
20%
30%
40%
50%
60%
70%
80%
90%
100%
2005 2006 2007 2008 2009
Operating Finance Ow ned
UPS
0%10%
20%30%
40%50%
60%70%
80%
90%
100%
2005 2006 2007 2008 2009
Operating Finance Ow ned
Alaska
0%
10%
20%
30%
40%
50%
60%
70%
80%
90%
100%
2005 2006 2007 2008 2009
Operating Finance Ow ned
Delta
0%
20%
40%
60%
80%
100%
2005 2006 2007 2008 2009
Operating Finance Ow ned
Cathay Pacific
0%
10%
20%
30%
40%
50%
60%
70%
80%
90%
100%
2005 2006 2007 2008 2009
Operating Finance Ow ned
Dragonair
0%
20%
40%
60%
80%
100%
2005 2006 2007 2008 2009
Operat ing Finance Owned
Air China
0%
10%
20%
30%
40%
50%
60%
70%
80%
90%
100%
2005 2006 2007 2008 2009
Operating Finance Ow ned
SIA group
0%
10%
20%
30%
40%50%60%
70%
80%
90%100%
2005 2006 2007 2008 2009
Operating Finance Ow ned
SIA Cargo
0%
10%
20%
30%
40%
50%
60%
70%
80%
90%
100%
2005 2006 2007 2008 2009
Operating Finance Ow ned
ANA
0%
10%
20%
30%
40%
50%
60%
70%
80%
90%
100%
2005 2006 2007 2008 2009
Operating Finance Ow ned
China Eastern
0%
10%
20%
30%
40%
50%
60%
70%
80%
90%
100%
2005 2006 2007 2008 2009
Operating Finance Ow ned
China Southern
0%
10%
20%
30%
40%
50%
60%
70%
80%
90%
100%
2005 2006 2007 2008 2009
Operating Finance Ow ned
GOL
0%
20%
40%
60%
80%
100%
2005 2006 2007 2008 2009
Operating Finance Ow ned
TAM
0%
20%
40%
60%
80%
100%
2005 2006 2007 2008 2009
Operating Finance Ow ned LAN
0%
20%
40%
60%
80%
100%
2005 2006 2007 2008 2009
Operating Finance Ow ned
Darcy Olmos Mancilla- ATRS World Conference 2010 Aircraft Asset Management: Tools & airline strategies during a world market downturn
17
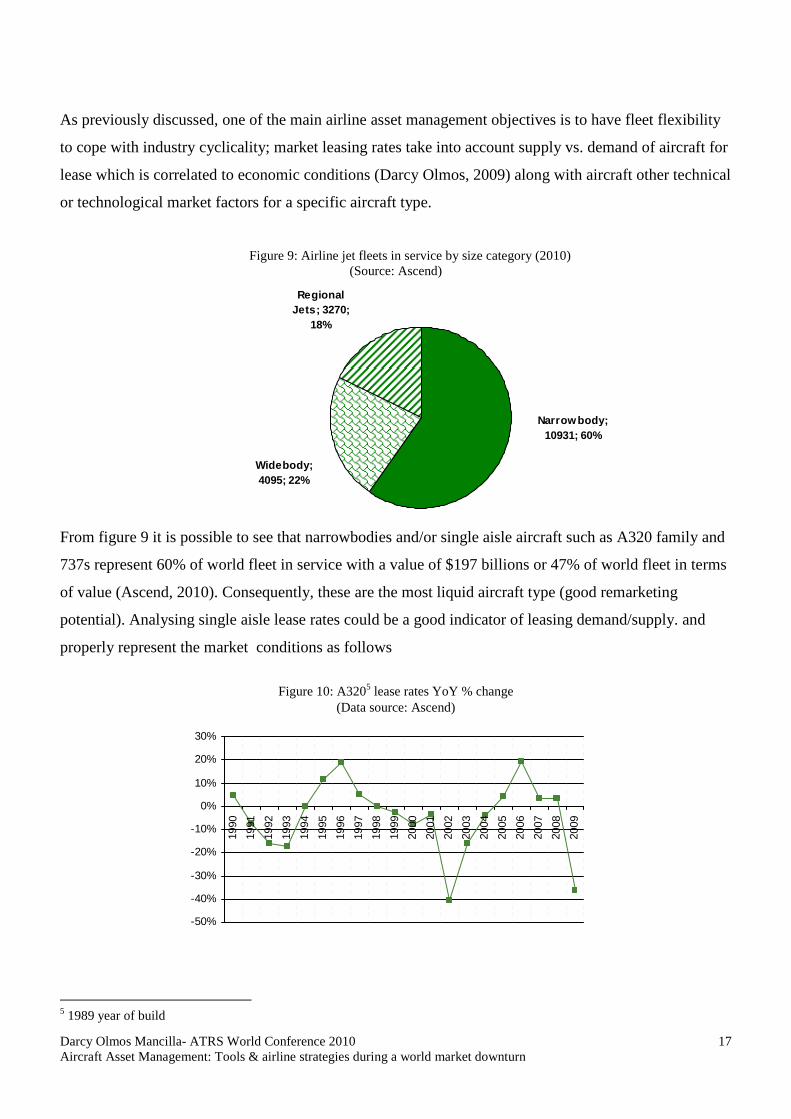
As previously discussed, one of the main airline asset management objectives is to have fleet flexibility
to cope with industry cyclicality; market leasing rates take into account supply vs. demand of aircraft for
lease which is correlated to economic conditions (Darcy Olmos, 2009) along with aircraft other technical
or technological market factors for a specific aircraft type.
Figure 9: Airline jet fleets in service by size category (2010) (Source: Ascend)
From figure 9 it is possible to see that narrowbodies and/or single aisle aircraft such as A320 family and
737s represent 60% of world fleet in service with a value of $197 billions or 47% of world fleet in terms
of value (Ascend, 2010). Consequently, these are the most liquid aircraft type (good remarketing
potential). Analysing single aisle lease rates could be a good indicator of leasing demand/supply. and
properly represent the market conditions as follows
Figure 10: A3205 lease rates YoY % change
(Data source: Ascend)
5 1989 year of build
Narrowbody; 10931; 60%
Regional Jets; 3270;
18%
Widebody; 4095; 22%
-50%
-40%
-30%
-20%
-10%
0%
10%
20%
30%
199 0
1 99 1
199 2
1 993
1 99 4
199 5
1 996
199 7
1 998
1 99 9
200 0
2 001
200 2
2 003
2 00 4
200 5
2 006
200 7
2 008
2 00 9

Darcy Olmos Mancilla- ATRS World Conference 2010 Aircraft Asset Management: Tools & airline strategies during a world market downturn
18
From figure 10 it is possible to see the cyclical and economic driven behaviour of lease rates for a single
aisle aircraft type. Moreover, a dramatic lease rental drop during the last three years suggests a decrease
on operating lease aircraft demand over supply, which is in line with the airlines’ right to use the
flexibility provided by this asset management tool. As previously mentioned the global operating lease
trend has increased dramatically during the last years. Airline by airline, different lease strategies and
trends were identified depending on the region and airline itself.
Figure 11: Aircraft under operating lease Europe sample (Source: D. Olmos from airlines annual reports data)
In Europe apart from Lufthansa6, airlines from the research sample decreased their number of leased
aircraft which is in line with flexibility advantage of this tool. Indeed, most airlines started to decrease
the number of aircraft under operating lease in 2009
Figure 12: Aircraft under operating lease North America sample
(Source: D. Olmos from airlines annual reports data)
The North America research sample showed a decrease in the number of aircraft under lease in 2007 for
legacy carriers American and Delta and since 2008 for the two cargo carriers and Alaska; which is in
6 Lufthansa has recently acquired other smaller airlines which explain the dramatic increase of the total number of aircraft from 534 in 2008 to 732 in 2009. It could also be the main reason of the increase of aircraft under lease due to acquired airlines aircraft leasing legacy
Europe: operating leased A/Cs
0
20
40
60
80
100
120
140
2005 2006 2007 2008 2009
nu
mb
er o
f A
/Cs
Iberia Easyjet Lufthansa Air France AF regional KLM regional
North America: operating leased A/Cs
0
50
100
150
200
250
300
350
2005 2006 2007 2008 2009
nu
mb
er o
f A
/Cs
American Southw est JetBlue FedEx UPS Alaska Delta
Darcy Olmos Mancilla- ATRS World Conference 2010 Aircraft Asset Management: Tools & airline strategies during a world market downturn
19
line with the immediate sub prime crisis impact in North America unlike Europe where the impact was
months later. Indeed, although Delta merged with Northwest in 2008, it was still possible to see a
decrease in aircraft under operating lease in 2009 where figures were comparable with 2008. On the
other hand, for years 2008 and 2009 the two low cost carriers Jetblue and Southwest increased and
maintained respectively the total number of aircraft in their fleet, which explains the increase or non
change on aircraft under operating lease on the same periods
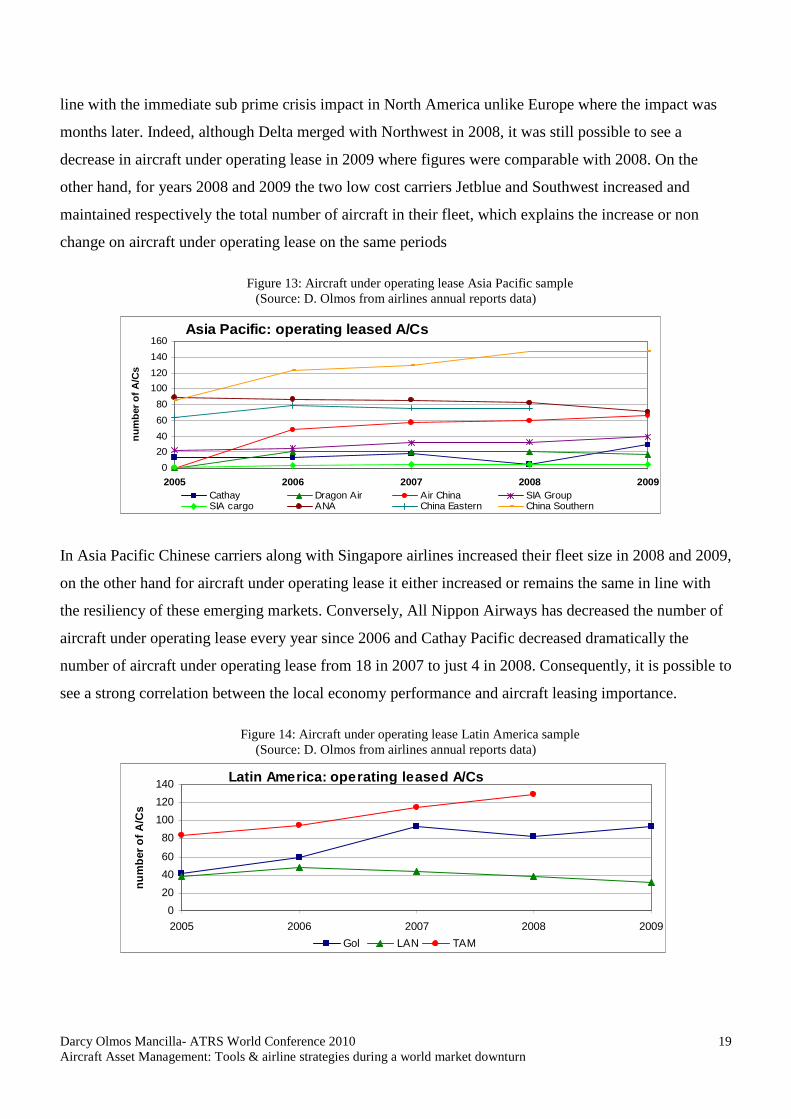
Figure 13: Aircraft under operating lease Asia Pacific sample
(Source: D. Olmos from airlines annual reports data)
In Asia Pacific Chinese carriers along with Singapore airlines increased their fleet size in 2008 and 2009,
on the other hand for aircraft under operating lease it either increased or remains the same in line with
the resiliency of these emerging markets. Conversely, All Nippon Airways has decreased the number of
aircraft under operating lease every year since 2006 and Cathay Pacific decreased dramatically the
number of aircraft under operating lease from 18 in 2007 to just 4 in 2008. Consequently, it is possible to
see a strong correlation between the local economy performance and aircraft leasing importance.
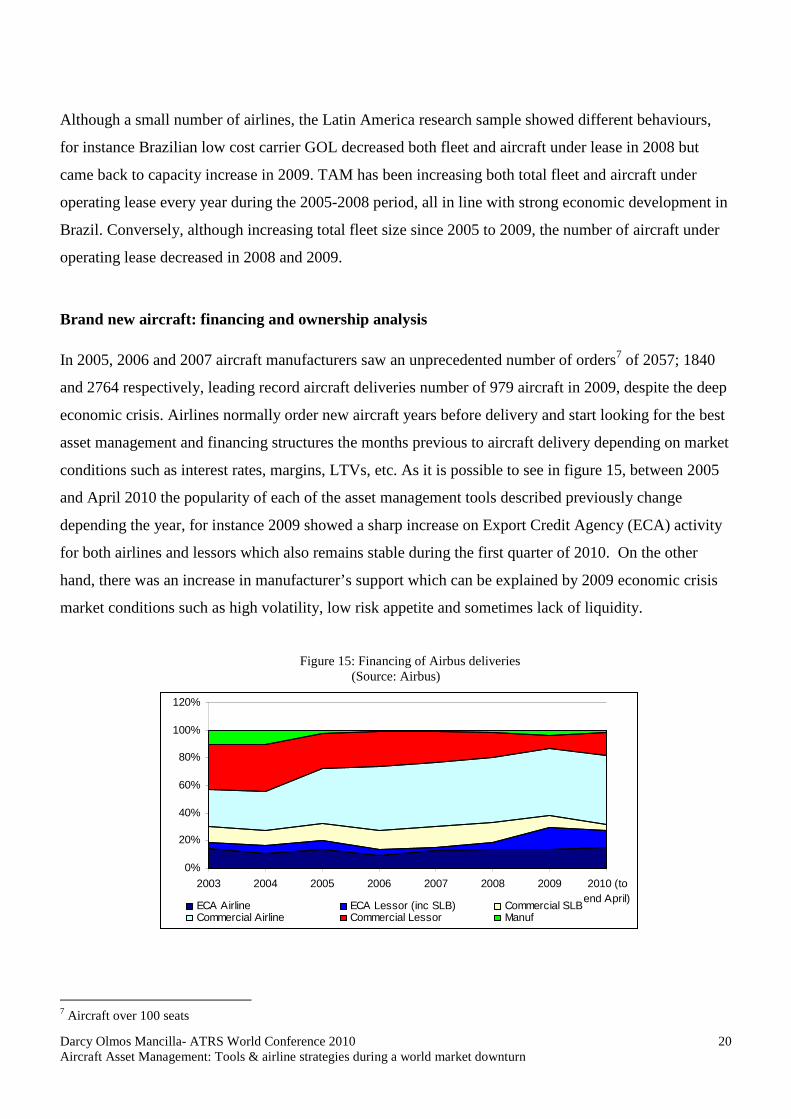
Figure 14: Aircraft under operating lease Latin America sample
(Source: D. Olmos from airlines annual reports data)
Latin America: operating leased A/Cs
0
20
40
60
80
100
120
140
2005 2006 2007 2008 2009
nu
mb
er o
f A
/Cs
Gol LAN TAM
Asia Pacific: operating leased A/Cs
0
20
40
60
80
100
120
140
160
2005 2006 2007 2008 2009
nu
mb
er o
f A
/Cs
Cathay Dragon Air Air China SIA GroupSIA cargo ANA China Eastern China Southern
Darcy Olmos Mancilla- ATRS World Conference 2010 Aircraft Asset Management: Tools & airline strategies during a world market downturn
20
Although a small number of airlines, the Latin America research sample showed different behaviours,
for instance Brazilian low cost carrier GOL decreased both fleet and aircraft under lease in 2008 but
came back to capacity increase in 2009. TAM has been increasing both total fleet and aircraft under
operating lease every year during the 2005-2008 period, all in line with strong economic development in
Brazil. Conversely, although increasing total fleet size since 2005 to 2009, the number of aircraft under
operating lease decreased in 2008 and 2009.
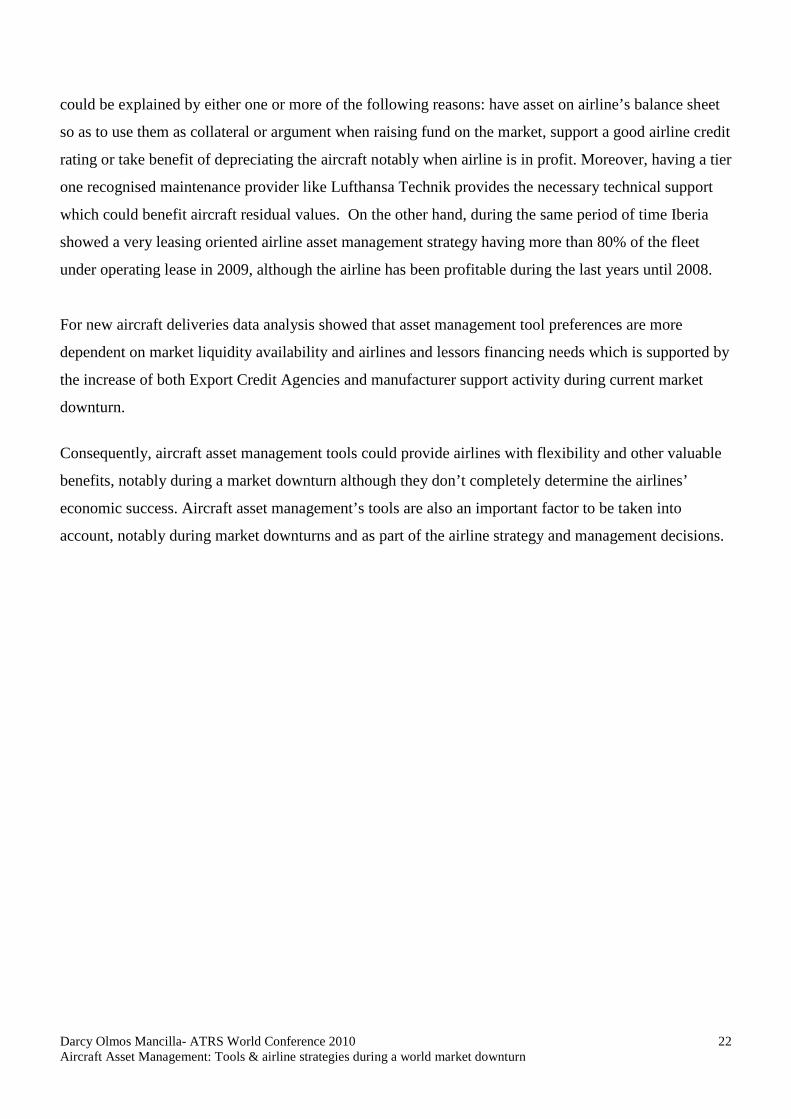
Brand new aircraft: financing and ownership analysis In 2005, 2006 and 2007 aircraft manufacturers saw an unprecedented number of orders7 of 2057; 1840
and 2764 respectively, leading record aircraft deliveries number of 979 aircraft in 2009, despite the deep
economic crisis. Airlines normally order new aircraft years before delivery and start looking for the best
asset management and financing structures the months previous to aircraft delivery depending on market
conditions such as interest rates, margins, LTVs, etc. As it is possible to see in figure 15, between 2005
and April 2010 the popularity of each of the asset management tools described previously change
depending the year, for instance 2009 showed a sharp increase on Export Credit Agency (ECA) activity
for both airlines and lessors which also remains stable during the first quarter of 2010. On the other
hand, there was an increase in manufacturer’s support which can be explained by 2009 economic crisis
market conditions such as high volatility, low risk appetite and sometimes lack of liquidity.
Figure 15: Financing of Airbus deliveries (Source: Airbus)
7 Aircraft over 100 seats
0%
20%
40%
60%
80%
100%
120%
2003 2004 2005 2006 2007 2008 2009 2010 (toend April)
ECA Airline ECA Lessor (inc SLB) Commercial SLBCommercial Airline Commercial Lessor Manuf

Darcy Olmos Mancilla- ATRS World Conference 2010 Aircraft Asset Management: Tools & airline strategies during a world market downturn
21
Conclusion It is possible to see a global economy recovery which follows a 2 speed pace: developing vs. emerging
economies. Aviation markets showed signs of recovery at 2 speed also, which is in line with the high
correlation found between aviation market and economy conditions (Olmos, 2009). The growth remains
concentrated in the emerging markets of Asia, Latin America and the Middle East, with benefits
accruing mainly to airlines in these regions. Carriers in the large developed markets of Europe and North
America face much more sluggish market growth. On the other hand, this 2-speed recovery in
economies, freight and travel markets is reflected in the divergent performance and different asset
management tools used by airlines in different regions.
The author found a decrease of aircraft under operating lease during economic crisis, notably on the
most affected regions such as Europe and North America, although starting on different years.
Conversely, in emerging markets such as Asia Pacific (notably China) and Latin America airlines fleet
grew and the number of aircraft under operating lease either increased or didn’t change. Moreover,
differences in the use of asset management tools were found among different business models, cargo
airlines decreased total fleet during the last 3 years and also decreased or kept the number of aircraft
under operating lease unlike low cost carries which increased their total fleet over the last 2 crisis years
The author also found a decrease in lease rates due to decrease in demand for leased aircraft which
supports the idea that operating leases are a key management tool during market downturn because it
permits airlines to decrease capacity without bearing the aircraft asset value risk. Aircraft in storage
increased 54% between 2007 and July 2010. Furthermore, the author found that Sale and Lease Back
(SLB) activity increased 48% and 51% for new and use aircraft respectively meaning it is also a popular
aircraft asset management tool during economic downturn, notably for airlines affected by decreasing
demand and looking to preserve cash during the difficult period.
The airline research sample data analysis showed that airline business sustainability or economic
performance is not fully dependent on the airline aircraft asset management strategy (measured by fleet
ownership mix trend), which rather reflects airlines’ tolerance to asset and/or market risk based on
estimation of potential future cost and benefits of each asset management philosophy. Lufthansa for
instance implemented over the last 5 years a very conservative approach by owning around 80% of its
fleet therefore renouncing the flexibility benefits of operating lease. This asset management philosophy
Darcy Olmos Mancilla- ATRS World Conference 2010 Aircraft Asset Management: Tools & airline strategies during a world market downturn
22
could be explained by either one or more of the following reasons: have asset on airline’s balance sheet
so as to use them as collateral or argument when raising fund on the market, support a good airline credit
rating or take benefit of depreciating the aircraft notably when airline is in profit. Moreover, having a tier
one recognised maintenance provider like Lufthansa Technik provides the necessary technical support
which could benefit aircraft residual values. On the other hand, during the same period of time Iberia
showed a very leasing oriented airline asset management strategy having more than 80% of the fleet
under operating lease in 2009, although the airline has been profitable during the last years until 2008.
For new aircraft deliveries data analysis showed that asset management tool preferences are more
dependent on market liquidity availability and airlines and lessors financing needs which is supported by
the increase of both Export Credit Agencies and manufacturer support activity during current market
downturn.
Consequently, aircraft asset management tools could provide airlines with flexibility and other valuable
benefits, notably during a market downturn although they don’t completely determine the airlines’
economic success. Aircraft asset management’s tools are also an important factor to be taken into
account, notably during market downturns and as part of the airline strategy and management decisions.
Darcy Olmos Mancilla- ATRS World Conference 2010 Aircraft Asset Management: Tools & airline strategies during a world market downturn
23
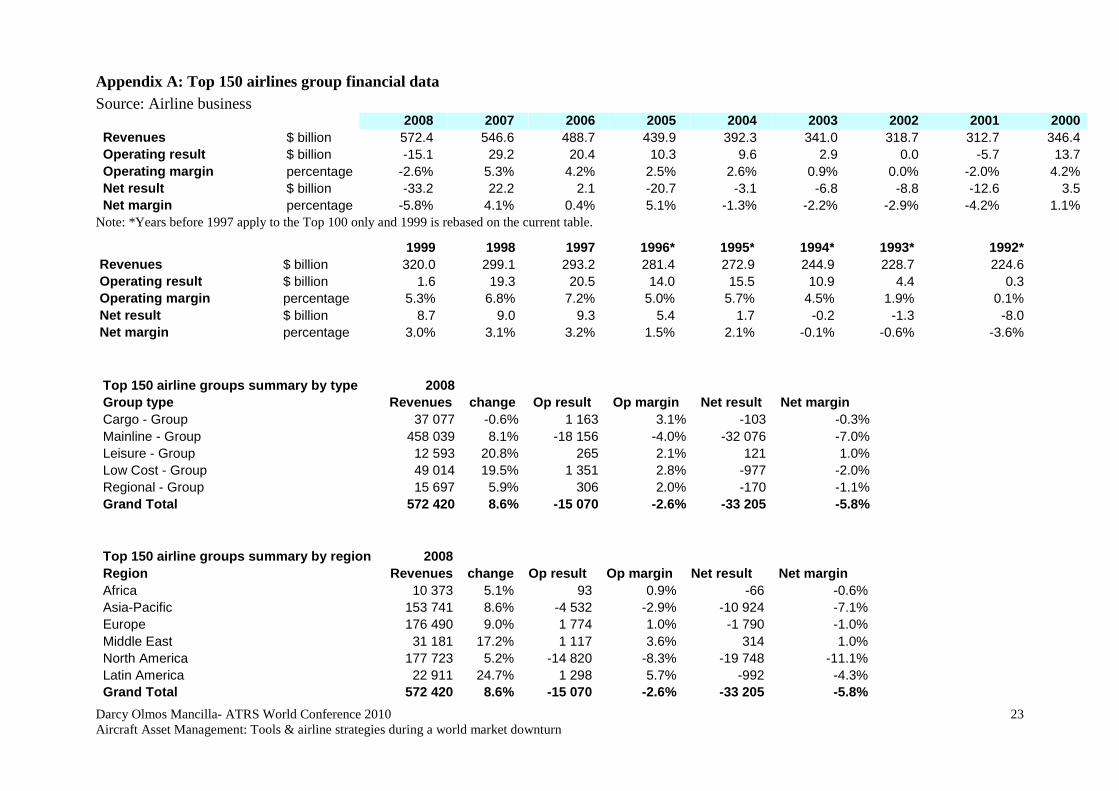
Appendix A: Top 150 airlines group financial data Source: Airline business
2008 2007 2006 2005 2004 2003 2002 2001 2000 Revenues $ billion 572.4 546.6 488.7 439.9 392.3 341.0 318.7 312.7 346.4 Operating result $ billion -15.1 29.2 20.4 10.3 9.6 2.9 0.0 -5.7 13.7 Operating margin percentage -2.6% 5.3% 4.2% 2.5% 2.6% 0.9% 0.0% -2.0% 4.2% Net result $ billion -33.2 22.2 2.1 -20.7 -3.1 -6.8 -8.8 -12.6 3.5 Net margin percentage -5.8% 4.1% 0.4% 5.1% -1.3% -2.2% -2.9% -4.2% 1.1%
Note: *Years before 1997 apply to the Top 100 only and 1999 is rebased on the current table.
Top 150 airline groups summary by region 2008 Region Revenues change Op result Op margin Net result Net margin Africa 10 373 5.1% 93 0.9% -66 -0.6% Asia-Pacific 153 741 8.6% -4 532 -2.9% -10 924 -7.1% Europe 176 490 9.0% 1 774 1.0% -1 790 -1.0% Middle East 31 181 17.2% 1 117 3.6% 314 1.0% North America 177 723 5.2% -14 820 -8.3% -19 748 -11.1% Latin America 22 911 24.7% 1 298 5.7% -992 -4.3% Grand Total 572 420 8.6% -15 070 -2.6% -33 205 -5.8%
1999 1998 1997 1996* 1995* 1994* 1993* 1992* Revenues $ billion 320.0 299.1 293.2 281.4 272.9 244.9 228.7 224.6 Operating result $ billion 1.6 19.3 20.5 14.0 15.5 10.9 4.4 0.3 Operating margin percentage 5.3% 6.8% 7.2% 5.0% 5.7% 4.5% 1.9% 0.1% Net result $ billion 8.7 9.0 9.3 5.4 1.7 -0.2 -1.3 -8.0 Net margin percentage 3.0% 3.1% 3.2% 1.5% 2.1% -0.1% -0.6% -3.6%
Top 150 airline groups summary by type 2008 Group type Revenues change Op result Op margin Net result Net margin Cargo - Group 37 077 -0.6% 1 163 3.1% -103 -0.3% Mainline - Group 458 039 8.1% -18 156 -4.0% -32 076 -7.0% Leisure - Group 12 593 20.8% 265 2.1% 121 1.0% Low Cost - Group 49 014 19.5% 1 351 2.8% -977 -2.0% Regional - Group 15 697 5.9% 306 2.0% -170 -1.1% Grand Total 572 420 8.6% -15 070 -2.6% -33 205 -5.8%

Darcy Olmos Mancilla- ATRS World Conference 2010 Aircraft Asset Management: Tools & airline strategies during a world market downturn
24
Appendix B: Airlines research sample’s revenues North America sample Asia Pacific sample Europe sample
Airline group Revenue $m Airline group
Revenue $m Airline group Revenue $m
AMR Corporation 23 766 ANA Group 13 883 Lufthansa Group 36 533 Delta Air Lines 22 697 Cathay Pacific & Dragoin Air 11 124 Air France-KLM Group 33 739 FedEx 22 364 Singapore Airlines & cargo 11 101 Iberia 8 101 Southwest Airlines 11 023 China Southern Airlines 7 983 easyJet 4 649 United Parcel Service 5 800 Air China 7 640 Total sample 83 022 Alaska Air Group 3 663 China Eastern Airlines 6 028 % of region revenues 47%
JetBlue Airways 3 388 Total sample 57 759
Total sample 92 700 % of region revenues 38%
% of region revenues 52% Latin America sample
Airline group Revenue $m TAM Linhas Aéreas 5 797
Summary LAN Airlines 4 534
North America sample 92 700 52% GOL Transportes Aereos 3 506 Europe sample 83 022 47% Total sample 13 836 Asia Pacific sample 57 759 38% % of region revenues 60%
Latin America sample 13 836 60% Total samples 247 318 % world 43%

Darcy Olmos Mancilla- ATRS World Conference 2010 Aircraft Asset Management: Tools & airline strategies during a world market downturn
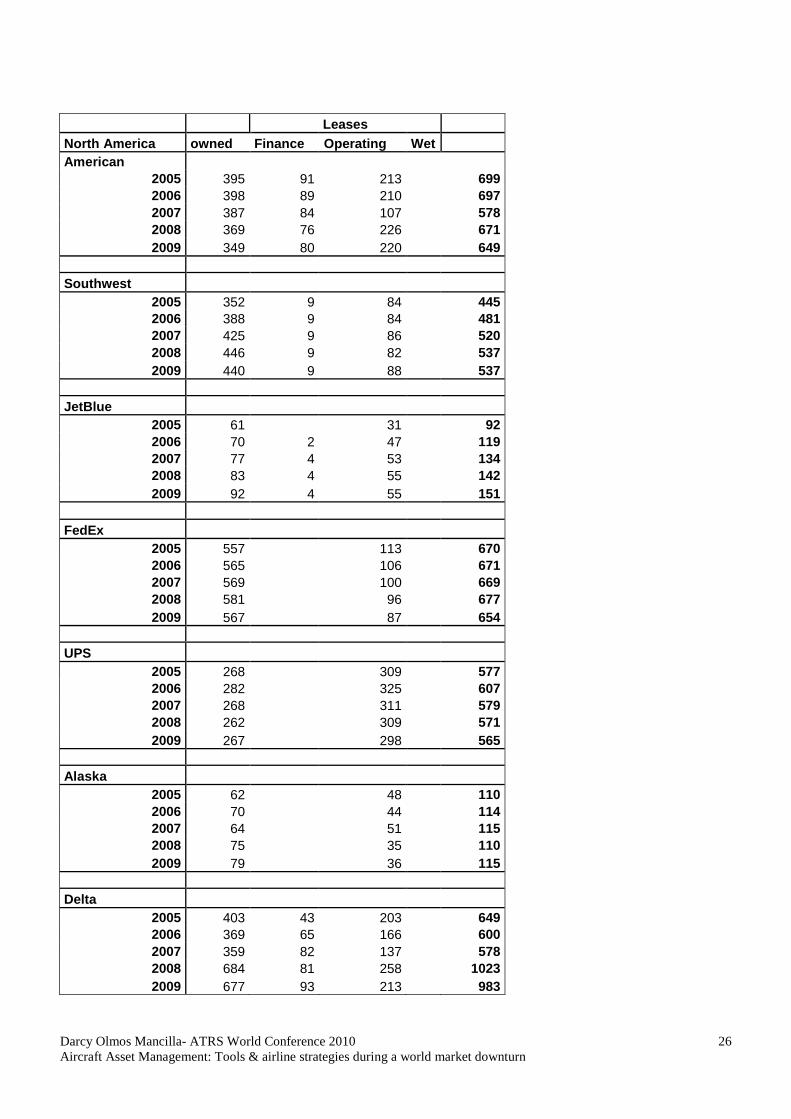
25
Appendix C: Airlines research sample’s fleet data Leases EUROPE Owned Finance Operating Wet Total Iberia
2005 46 14 89 6 155 2006 45 14 82 9 150 2007 36 9 87 5 137 2008 16 11 89 3 119 2009 8 11 90 0 109
Easyjet
2005 18 91 109 2006 38 6 78 122 2007 55 6 76 137 2008 75 6 84 165 2009 107 6 68 181
Lufthansa
2005 339 22 71 242 2006 351 11 68 250 2007 396 9 108 264 2008 420 8 106 534 2009 571 26 125 722
Air France
2005 141 23 90 254 2006 151 17 90 258 2007 164 12 85 261 2008 161 12 90 263 2009 162 12 88 262
AF regional
2005 28 51 54 133 2006 30 50 55 135 2007 47 47 50 144 2008 71 41 47 159 2009 70 38 45 153
KLM regional
2005 19 20 14 53 2006 27 18 8 53 2007 33 14 8 55 2008 33 14 8 55 2009 50 3 6 59
Darcy Olmos Mancilla- ATRS World Conference 2010 Aircraft Asset Management: Tools & airline strategies during a world market downturn
26
Leases North America owned Finance Operating Wet American
2005 395 91 213 699 2006 398 89 210 697 2007 387 84 107 578 2008 369 76 226 671 2009 349 80 220 649
Southwest
2005 352 9 84 445 2006 388 9 84 481 2007 425 9 86 520 2008 446 9 82 537 2009 440 9 88 537
JetBlue
2005 61 31 92 2006 70 2 47 119 2007 77 4 53 134 2008 83 4 55 142 2009 92 4 55 151
FedEx
2005 557 113 670 2006 565 106 671 2007 569 100 669 2008 581 96 677 2009 567 87 654
UPS
2005 268 309 577 2006 282 325 607 2007 268 311 579 2008 262 309 571 2009 267 298 565
Alaska
2005 62 48 110 2006 70 44 114 2007 64 51 115 2008 75 35 110 2009 79 36 115
Delta
2005 403 43 203 649 2006 369 65 166 600 2007 359 82 137 578 2008 684 81 258 1023 2009 677 93 213 983
Darcy Olmos Mancilla- ATRS World Conference 2010 Aircraft Asset Management: Tools & airline strategies during a world market downturn
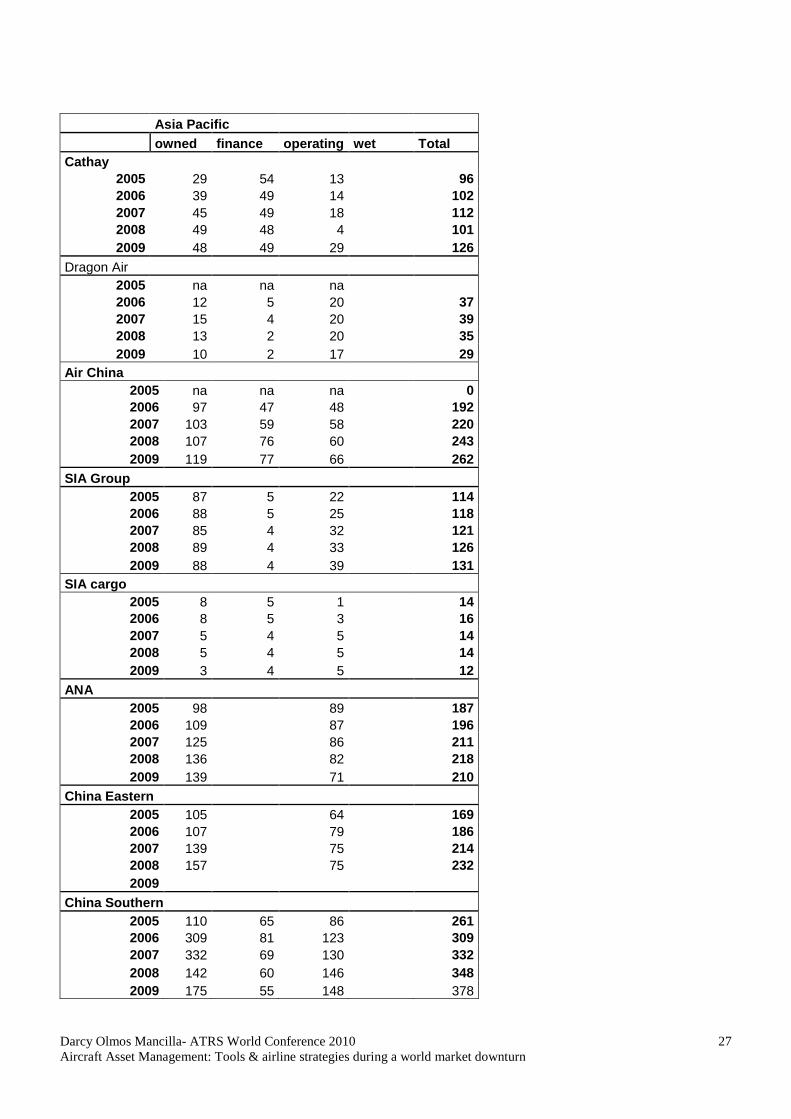
27
Asia Pacific
owned finance operating wet Total Cathay
2005 29 54 13 96 2006 39 49 14 102 2007 45 49 18 112 2008 49 48 4 101 2009 48 49 29 126
Dragon Air 2005 na na na 2006 12 5 20 37 2007 15 4 20 39 2008 13 2 20 35 2009 10 2 17 29
Air China 2005 na na na 0 2006 97 47 48 192 2007 103 59 58 220 2008 107 76 60 243 2009 119 77 66 262
SIA Group 2005 87 5 22 114 2006 88 5 25 118 2007 85 4 32 121 2008 89 4 33 126 2009 88 4 39 131
SIA cargo 2005 8 5 1 14 2006 8 5 3 16 2007 5 4 5 14 2008 5 4 5 14 2009 3 4 5 12
ANA 2005 98 89 187 2006 109 87 196 2007 125 86 211 2008 136 82 218 2009 139 71 210
China Eastern 2005 105 64 169 2006 107 79 186 2007 139 75 214 2008 157 75 232 2009
China Southern 2005 110 65 86 261 2006 309 81 123 309 2007 332 69 130 332 2008 142 60 146 348 2009 175 55 148 378

Darcy Olmos Mancilla- ATRS World Conference 2010 Aircraft Asset Management: Tools & airline strategies during a world market downturn
28
Leases
South America owned Finance Operating Wet Total Gol
2005 42 42 2006 5 60 65 2007 17 94 111 2008 23 83 106 2009 33 94 127
LAN 2005 24 39 63 2006 28 48 76 2007 34 44 78 2008 42 39 81 2009 61 32 93
TAM 2005 84 84 2006 95 95 2007 115 115 2008 129 129 2009 na
Appendix D: Lease vs. purchase comparison
Typical term 5 - 7 yrs 12 - 18 yrs Asset life
Capital requirement Low Moderate High
Deposits 3 months rent Moderate Significant(say 3%) c. 10% 20% +
Progress payments No No Yes
Repayments Rental Principal+Interest Balance due
Payments made Monthly 1, 3 or 6 monthly At deliveryin advance in arrears
Credit rating Lowest Moderate Highest
Asset exposure None Some/All Full
On/off balance sheet Off Usually On On
Flexibility High Low Lowest
Lead time to delivery May be short May be long May be long
Operating Finance Direct Lease Lease Purchase
Darcy Olmos Mancilla- ATRS World Conference 2010 Aircraft Asset Management: Tools & airline strategies during a world market downturn
29
References Abeyratne R., (1998), The proposed International Aeronautical Monetary Fund, Journal of Air
Transportation World Wide Vol 3 No 1
Airbus (2009), Global Market Forecasts 2009-2029
Airlines Business, (2009), Top Airlines Groups, London, UK
Bunker D., (2005), International Aircraft Financing, IATA, Montreal, Canada
Lufthansa, (2010), Aircraft Asset Management: An Airline’s Perspective, AirBusiness Academy Asset
Management course 2010, Blagnac, France
Littlejohns A., (1998), Aircraft Financing, Euromoney, Oxford, England
Morell P., (1997), Airline Finance, Aldershot, England
Olmos D., (2009), Financial Crisis and Aviation Leasing Markets: The emergence of China, ATRS
World Conference 2009 Paper
Pieniazek E., (2010), Aircraft Values and Asset Management, Ascend, AirBusiness Academy Asset
Management course 2010, Blagnac, France
Scheinberg R., (2005), A Guide for the Perplexed: Exogenous Elements to Consider When Investing in
Enhanced Equipment Trust Certificates (EETCs), New York
Stone T., Fisher R. and Lynes T., (1999), The Securitization of Aircraft Lease Receivables, Handbook of
Airline Finance. McGraw-Hill, New York
Standard and Poor’s, Structured Finance, New York
Vella S., (1999), Aircraft Asset Value Management, Handbook of Airline Finance. McGraw-Hill, New
York.