Damage Functions for Rutting, Fatigue Cracking, and Loss...
9
Transportation Research Record 943 1 Damage Functions for Rutting, Fatigue Cracking, and Loss of Serviceability 1n Flexible Pavements J. BRENT RAUHUT, R.L. LYTTON, P.R. JORDAHL, AND W.J. KENIS Damage functions are required for development of load equivalence factors to be used in allocating cost responsibilities to various vehicle classes for use of liighways. They are also required by pavement management systems for pre- diction of pavement damage or deterioration. The only damage function and set of load equivalence factors available have been those for loss of serviceabil- ity derived from the AASHO Road Test. This work is 20 years old and re- sulted from accelerated testing in one environment and essentially for one sub- grade, so new damage functions over the range of distresses significant to de- terioration of flexible pavements were needed by FHWA to respond to a Con- gressional mandate for new cost-allocation recommendations. Damage func- tions for rutting and fatigue cracking and a new damage function for loss of serviceability are provided. These damage functions resulted from multiple regressions on 216 separate sets of predicted distresses for each of four environ- mental zones. The predictions were obtained with an improved version of the VESYS flexible pavement model calibrated through comparisons with mea- sured values from 15 test sections throughout the United States. Damage pre- dictions from the regression equations are also compared with the damage mea- sured on 15 test sections representing a range of environmental, support, thickness design, and traffic conditions. The Federal-Aid Highway Act in 1978 required that new cost-allocation studies be conducted to update or replace those conducted 20 years ago on the basis of results from the AASHO Road Test. Load equiva- lence factors to differentiate among types of damage caused by the various vehicle classes are critically important to the allocation of costs for highway construction and maintenance among these same vehicle classes. The development of load equiva- lence factors in turn is dependent on the availabil- ity of damage functions from which they may be derived. It is important at this point to define both dam- age functions and load equivalence factors. Damage functions are mathematical equations that predict distress or reductions in performance measures [such as the present serviceability index (PSI) or the skid number] as a fraction of a referenced level of dis tress or reduction in performance established as a failure condition. The failure condition of interest is not necessarily structural failure but rather that level of distress or loss of performance that may be expected to generate major repair or re- habilitation. The form of the damage function or equation used in this project is similar to that used for the AASHO Road Test, where the damage func- tion (g) is calculated as follows: where g damage function, which ranges from 0 to 1 with increasing damage; Nia number of 18-kip equivalent single axle loads (ESALs) applied; p ESALs required to produce a damage level defined as failure; and e power that represents the rate of damage increase. (!) W represents the number of 18-kip ESALs at some time of interest, and p and e differ by type of distress and environmental zone and are functions of a variety of independent variables consistent with the form of distress or loss of performance under consideration. Load equivalence factors are defined in the same way as those resulting from the AASHO Road Test, but a more specific definition will be given, because the one published after the road test was somewhat confusing. A load equivalence factor for an arbitrary axle load is the ratio of the number of standard axle loads (18-kip single axles as in the AASHO Road Test) to produce a predefined level of distress or reduction in performance to the number of the arbi- trary axle loads necessary to produce the same level of distress or reduction in performance. As for the AASHO Road Test, these ratios are calculated at the predefined failure level when damage is 1.0. It can be seen then that the ratio represents the relative number of standard versus any other axle load neces- sary to produce an equivalent damage. As found at the AASHO Road Test, these load equivalence factors are dependent on the definition of failure or level of damage on which they are based. It was not feasible from either a time or a cost viewpoint to organize, perform, and analyze results from another road test (or series of road tests in different environments and for different condi- tions) , so FHWA selected an approach that used either empirical or mechanistic models for develop- ment of the needed damage functions and consequent load equivalence factors. After review of available empirical models and mechanistic models, it was decided to use the VESYS flexible pavement model with certain improvements after its predictions for rut depths, fatigue cracking, and loss of service- ability had been calibrated against measured data from 15 test sections in four environmental zones. Three other types of distress were considered significant in generating major repair and rehabili- tation for flexible pavements but were found to be essentially independent of axle load magnitudes and are not the subject of this paper. These types of distress are low-temperature (or thermal) cracking, roughness due to differential volume change in the subgrade, and reduced skid resistance. In this paper a description is given of how the VESYS model was used to generate a data bank and how multiple regression techniques were used to develop damage functions from this data bank; the specific damage functions developed and their applications are given. It should be noted that such damage functions not only are useful for cost-allocation studies but also are critically important to the prediction of pavement deterioration for pavement management systems. METHODOLOGY FOR DEVELOPMENT OF DAMAGE FUNCTIONS VESYS III-A, as received from FHWA in December 1980, lacked several capabilities that were considered necessary for the development of damage functions. Primary among these was the explicit provision for considering tandem axles. Accuracy of predictions could also be improved by introduction of capabili- ties to generate and modify fatigue constants by asphalt concrete modulus or temperature and to input layer moduli and permanent deformation coefficients separately for each axle load considered. These capabilities were added to produce computer program
Transcript of Damage Functions for Rutting, Fatigue Cracking, and Loss...
Transportation Research Record 943 1
Damage Functions for Rutting, Fatigue Cracking, and Loss of Serviceability 1n Flexible Pavements
J. BRENT RAUHUT, R.L. LYTTON, P.R. JORDAHL, AND W.J. KENIS
Damage functions are required for development of load equivalence factors to be used in allocating cost responsibilities to various vehicle classes for use of liighways. They are also required by pavement management systems for prediction of pavement damage or deterioration. The only damage function and set of load equivalence factors available have been those for loss of serviceability derived from the AASHO Road Test. This work is 20 years old and resulted from accelerated testing in one environment and essentially for one subgrade, so new damage functions over the range of distresses significant to deterioration of flexible pavements were needed by FHWA to respond to a Congressional mandate for new cost-allocation recommendations. Damage functions for rutting and fatigue cracking and a new damage function for loss of serviceability are provided. These damage functions resulted from multiple regressions on 216 separate sets of predicted distresses for each of four environmental zones. The predictions were obtained with an improved version of the VESYS flexible pavement model calibrated through comparisons with measured values from 15 test sections throughout the United States. Damage predictions from the regression equations are also compared with the damage measured on 15 test sections representing a range of environmental, support, thickness design, and traffic conditions.
The Federal-Aid Highway Act in 1978 required that new cost-allocation studies be conducted to update or replace those conducted 20 years ago on the basis of results from the AASHO Road Test. Load equivalence factors to differentiate among types of damage caused by the various vehicle classes are critically important to the allocation of costs for highway construction and maintenance among these same vehicle classes. The development of load equivalence factors in turn is dependent on the availability of damage functions from which they may be derived.
It is important at this point to define both damage functions and load equivalence factors. Damage functions are mathematical equations that predict distress or reductions in performance measures [such as the present serviceability index (PSI) or the skid number] as a fraction of a referenced level of dis tress or reduction in performance established as a failure condition. The failure condition of interest is not necessarily structural failure but rather that level of distress or loss of performance that may be expected to generate major repair or rehabilitation. The form of the damage function or equation used in this project is similar to that used for the AASHO Road Test, where the damage function (g) is calculated as follows:
where
g damage function, which ranges from 0 to 1 with increasing damage;
Nia number of 18-kip equivalent single axle loads (ESALs) applied;
p ESALs required to produce a damage level defined as failure; and
e power that represents the rate of damage increase.
(!)
W represents the number of 18-kip ESALs at some time of interest, and p and e differ by type of distress and environmental zone and are functions of a variety of independent variables consistent with the form of distress or loss of performance under consideration.
Load equivalence factors are defined in the same way as those resulting from the AASHO Road Test, but a more specific definition will be given, because the one published after the road test was somewhat confusing.
A load equivalence factor for an arbitrary axle load is the ratio of the number of standard axle loads (18-kip single axles as in the AASHO Road Test) to produce a predefined level of distress or reduction in performance to the number of the arbitrary axle loads necessary to produce the same level of distress or reduction in performance. As for the AASHO Road Test, these ratios are calculated at the predefined failure level when damage is 1.0. It can be seen then that the ratio represents the relative number of standard versus any other axle load necessary to produce an equivalent damage. As found at the AASHO Road Test, these load equivalence factors are dependent on the definition of failure or level of damage on which they are based.
It was not feasible from either a time or a cost viewpoint to organize, perform, and analyze results from another road test (or series of road tests in different environments and for different conditions) , so FHWA selected an approach that used either empirical or mechanistic models for development of the needed damage functions and consequent load equivalence factors. After review of available empirical models and mechanistic models, it was decided to use the VESYS flexible pavement model with certain improvements after its predictions for rut depths, fatigue cracking, and loss of serviceability had been calibrated against measured data from 15 test sections in four environmental zones.
Three other types of distress were considered significant in generating major repair and rehabilitation for flexible pavements but were found to be essentially independent of axle load magnitudes and are not the subject of this paper. These types of distress are low-temperature (or thermal) cracking, roughness due to differential volume change in the subgrade, and reduced skid resistance.
In this paper a description is given of how the VESYS model was used to generate a data bank and how multiple regression techniques were used to develop damage functions from this data bank; the specific damage functions developed and their applications are given. It should be noted that such damage functions not only are useful for cost-allocation studies but also are critically important to the prediction of pavement deterioration for pavement management systems.
METHODOLOGY FOR DEVELOPMENT OF DAMAGE FUNCTIONS
VESYS III-A, as received from FHWA in December 1980, lacked several capabilities that were considered necessary for the development of damage functions. Primary among these was the explicit provision for considering tandem axles. Accuracy of predictions could also be improved by introduction of capabilities to generate and modify fatigue constants by asphalt concrete modulus or temperature and to input layer moduli and permanent deformation coefficients separately for each axle load considered. These capabilities were added to produce computer program
2
VESYS III-B, and this mechanistic model was used in the project. The theory and capabilities of the VESYS flexible pavement model have been discussed in detail elsewhere (.!-_il •
Calibrating VESYS III-B
Because the simulative abilities of mechanistic models are still quite limited when compared with the staggering array of conditions offered by nature, it was decided to improve the VESYS III-B predictive capabilities by predicting distress and loss of serviceability for 15 test sections and arriving at some means of calibration after comparing the predicted and measured results. In order to include environmental effects, test sections were selected in New York, Colorado, Texas, and Florida repre~ent
ing wet-freeze, wet no-freeze, dry-freeze, and dry no-freeze environmental zones. Each state was visited, detailed data were collected for each test section, a condition survey was conducted, and core samples were obtained for materials characterization testing . Both resilient modulus and permanent deformation testing were conducted on asphalt concrete and subgrade samples. A detailed study was conducted to establish axle load distributions and volume as accurately as possible. All this information was then organized as input to computer program VESYS III-B and predictions were obtained for rutting, fatigue cracking, and loss of serviceability.
These comparisons of predicted and measured distresses indicated, as expected, the need for mod i fying the predictions from the models in some rational fashion to improve their predictive accuracy. Although it would have been ideal at this time to conduct an extensive study aimed at developing modifying functions to operate on the predicted results, time was not available because of the necessity of supporting the FHWA reponse to Congress on cost allocations, and the expedient approach of simply developing constant multipliers that would correct the predicted values to better approximate the measured values was used.
Ratios between measured and predicted values were developed for area cracked (transformed to the distress index) and rut depths. These ratios were then the discrete multipliers that would transform the predicted values into the correct measured values. Similar ratios were developed for PSI, except that the ratios represented relative reductions in PSI with traffic rather than relative values of PSI. Once a set of multipliers was available for each test section, they were compared in detail for trends with the environmental zones. As would be expected, the multipliers selected were compromises aimed at the best approximations of predicted values overall.
Development of Damage Functions
The data for the flexible pavement damage functions for rutting, cracking (distress index), and index of loss of serviceability were generated by using the computer model VESYS III-B. The input data represented a full factorial of the following number of variables:
1. Four environmental regions, 2. Three subgrade moduli, 3. Three thicknesses of surface course, 4. Three structural numbers, and 5 . Eight load levels, of which four were single
axle loads and four were tandem-axle loads.
In each environmental region, 216 computer runs were made in which distress i ndex , ru t ting, and
Transportation Research Record 943
loss-of-serviceability index were computed for 10 levels of load application during the life of the pavement. With this array of data it was possible to determine p- and a-values for each of the 27 pavement sections and for each of the eight load levels. The computer runs represented, in effect, separate miniature versions of the AASHO Road Test in each of the four climatic regions with the important distinction that three different subgrades were used instead of one as at the Road Test.
Further regression analysis was conducted to determine the manner in which the values of p and B depend on the variables that were used in the analysis. Many forms of equations could be assumed and tested to obtain the best relationships, but the seven shown as follows were selected as the best candidates for the detailed regression analyses and were tested and evaluated separately:
y = c + a(L1 + L2)b1 +b2T+b3T2 (L2)'1+c2 T+c3T2 (E,)d (SN)" (T)r (3)
y = c + a(L i + L 2)b1+b2SN+b3SN2
(L2)ct+c2SN+c3SN2
(E,)d (SN)" (T)1 (4)
y = c + a(L1 + L2)h1+b2T+h3T2+e2SN+e3SN2
x (L2
)CJ +c2T+c3T2
+g2SN +g3SN2 (E,)d (SN)' (T/ (5)
y = c + a(L, + L1)b1 +bif+b3T2 +e2E,+e3Et
x (L2 )ci +c2T+c3T2
+s2E,+g3Et (E,)d (SN)' (T)f (6)
y = c + a(L1 + L1)b1+b2T+b3T2
+e2E,;+c3Et+e4(T,£,)
x (L2)< 1 +c2T+c3T
2+g2E5+g3 l',+g3 Ef+g4(T • E5) (E,)d (SN)' (T)' (7)
y = c + a(L1 + L1)bo+(b1 T 1+b2Tf+b3T2)E,
x (L2 )co+{CJT1+c2Tf+c3T2)E, (E,)d (SN)' (T,/ (8)
where
T
y p or B; L1 load on one single-axle or
one tandem-axle set (kips); L2 axle code (1 for single
axle and 2 for tandem axle); SN structural number;
thickness of asphalt concrete layer (in.); thickness of granular base layer (in.); subgrade modulus of elasticity (psi) (selected for stress state around 18 to 20 in. below top of subgrade to be representative of entire subgrade) ; and
a, a1 1 and so on = coefficients from the regressions, whose values depend on type of distress, environmental zone, and whether y is p
or a.
It should be remembered that the load equivalence factors are determined at damage levels of 1. 0 and are the ratios PlS/O j ; thus, only the independent variables appea ring in the exponents for (L1 + L2) or L2 a ffe ct the load equivalence factors because all other terms cancel out in division. Equation 2, for instance, might offer reasonable predictions, but its load equivalence factors would be dependent only on axle loads.
Equation 6 was selected as offering the be st fit and most useful mix of significant independent variables for distress predictions and load equivalence factors. The values of the coefficients for this equation and the coefficients of determination R2
appear in Table 1.
Transpor t ation Resea rc h Record 94 3
Table 1. Regression coefficients for Equation 6.
a d e f
lift Frttlf zone
DI p .ill! l.84£+4 -tl.44 -.555 ;132 1.511E-5 -1.b6E-ll -tl.78 .686 - .138 -2.81E-5 2.24£-18 1.19 -tl.llS 5.59 .'1'13 RD 8 .ill! 1.m-1 8.10 -.1119 .llll l.JllE-7 -4.24£-12 -tl.118 .113 •• -9.55E-7 1.6JE-Jl -t.111 I.JS -t.22 .m RD p.illl 1.BBE-5-4.19-.732 .131 6.7!£-6-4.J'IE-JI 1.'r.i .577-.137 l.11E-4-2.l5E-t9 3.33-1.7614.87 ,953 PSI 8 .19 6.3'1E+2 -ti.JI -.162 .114 6.54£-5 -J.32E-f'1-J.49 .m -.142 5.65[-6 -2.21E-JI -t.68 -2.81 e.55 .614 PSI p .Ill 6.7!£-B -3.88 -.m .1116 -4.22£-5 4.27E-11 2.56 -.1!61 .en l.47E-4 -2.b-\E-f'I J.54 3.56 8.37 .864
Dry Frttze ione
DI p .Ill J.BJE+4 -tl.26 -.581 .133 1.22E-5 -7.JJE-ll -tl.86 .m -.IJB -l.BIE-5 l.41E-18 8.21 -ti.DI! 5.49 .991 RD 8 .1111! J.12E-J B.12 -.817 .• l -l.6'iE-6 2.76E-Jl -tl.08 .119 •• -9.42E-7 J.92E-11 1.82 1.23 -tl.24 .913 RD p •• B.32E-1 -4. 75 -.683 ,IJL b.87[-6 -1. 711-18 2.'1'1 .sm -.142 l.JlE-4 -2.86E-t9 2.88 -4.23 17.39 .m PSIS .08 l.55E+2 1.24 -.219 .818 UlE-5 -B.51£-11 -1.58 .582 -.145 l.27E-5 -B.16E-ll -tl.62 -2.17 il.61 .451 PSlp .Ile B.3!£-9 -3.91 -.181 -.B15 -UJE-5 1.52E-19 3.'l'i -.67J .178 1.16E-4 -1.76E-t9 3.73 3.94 8.25 .788
lift No-Freeze ione
DI p .Ill 1.11E+4 -t.33 -.611 .m l.1>6f:-5 -1.BllE-11 -1.97 .794 -.144 -1.93E-5 l.b7E-18 1.17 -tl.13 6.89 .'1'14 RD 8 .110 l.51E-1 -tl.01 .Bill -.• 2. m-7 ·-2.a-12 1.82 -.11!3 .1111 -1.I-7 l.SIE-12 -tl.1!2 -t.08 U7 .964 RD p .110 1.76£+1 -5.11 -.71!5 .141 7.1118£-5 -J.31E-tl'I 1.87 .744 -."57 9.BIE-5 -2.21E-t9 3.34 1.42 4.84 .'189 PSI S .17 6.57E+l U7 -.216 .116 5.B7E-5 -1.12E-tl'I -1.48 .487 -.132 1.15E-5 -5.21£-11 -ti.bl -2.88 1.62 • 79'1 PSI P .11 t.•-5 -5.53 -.172 .111 -3.4JE-5 5.46£-11 3.17 -.122 -.1111 t.84£-4 -J.J7£-i!l9 4.ta 5.04 1.10 .m
Dry No-Fruzt zone
DI P .Ill 1.14£+4 -t.15 -.638 .136 1.4!£-5 -1.J'IE-11 -1.19 .785 -.143 -J.911-5 J.61£-11 1.19 -t.11 5.'111 .992 11D 8 .19 1.5'1E-1 -t.19 .118 -.1111 6.7f£-7 -1.32E-ll U9 -.128 •• 1 -2.IJE-7 6.67E-12 -1.82 -t.116 I.• .m RD P .Ill 3.16E+7 -3.11-1.1169 .161 B.34E-5 -1.JIE-19 -t.111.198 -.181 5.89E-5 -l.62E-19 2.37 J.13 4.93 .m PSI s .18 l.14E+3 I.Ill -.m .m 7.59E-5 -1.45E-19 -J.19 .337 -.126 -1.lbE-5 -1.32£-11 -t.94 -2.92 1.66 .m PSI P .Ill 5.15H1 -5.45 -.838 .114 -9. 77E-5 1.'15£-19 J.15 -.1114 -.114 1.rnE-4 -J.27E-19 4.59 5.91 -ti.Bl .B7b
3
It is important to note that this form of equation shows that load equivalence factors as defined previously depend on the stiffness of the subgrade. It is not surprising that pavement structure (represented by SN or asphalt thickness) is significant because it was found to be significant for the AASHO Road Test load equivalence factors. However, the dependence of load equivalence factors on the stiffness of the subgrade is new. This dependence was not found at the AASHO Road Test because the entire set of test sections was placed on essentially the same subgrade soil. Equation 2 is the form of equation that is most similar to the AASHO Road Test equation and it produces uniformly the lowest values of R2 that were found for any of the equations tested.
are given elsewhere (5)i see Table 1 for Brent Rauhut Engineering, Inc:- (BRE) equations). Also, the initial value of PSI assumed for the AASHO Road Test equation and for the BRE VESYS regression models was 4 .2, but the terminal serviceability for the AASHO Road Test equation was 1.5, whereas 2.5 was used in the VESYS regression on the ba.iis of observations that federal-aid highways rarely are allowed to reach a lower serviceability level.
EVALUATION OF DAMAGE FUNCTIONS
The most obvious approach to evaluating a damage function is to convert its calculated results to distress or loss of serviceability and to compare the calculated distress or loss of serviceability with actual measured values. In the case of PSI loss, a second comparison may also be made with predicted serviceability loss calculated by the AASHO equation. Such comparisons have been made with the measured data from the 15 test sections described earlier.
Reduction in PSI
As stated earlier, the damage equation in this project is similar to that used for the AASHO Road Test. The differences between the equations are primarily in the equations for p and B [AASHO equations
The damage functions discussed previously may be used to convert to predicted loss of PSI by the following relationships:
AASHO:
6PSI = 2.7 · JO Gt
whe r e
B(logN18 - logp 18 J =log (N18/P18)8 i e' total 18-kip ESALs to the time at which 6PSI is calculated, and calculated p and B for Ll = 18, L2 = 1.
VESYS III-B regression:
6PSJ = J.7g
where
(9)
(JO)
( I I)
and the difference in the coefficients (1. 7 versus 2.7) arises because the AASHO Road Test defined dam-
4
age equal to l at PSI = 1.5, whereas the VESYS III-B regression results are based on a terminal PSI (damage equal to 1) of 2.5.
Measured distress and serviceability data from the 15 primary test sections used in the calibration runs for the VESYS III-B computer program were also used for comparison of these two predictive models. The soil support values for the AASHO Road Test equations were obtained by using values of California bearing ratio (CBR) or Texas triaxial class available from the data-collection effort for subg rade soils. The values of subgrade stiffness (Es) used for the VESYS regression models were those developed for the calibration runs. Other values of
Transportation Research Record 943
the independent variables were available from the data-collection effort or calculated in the usual manner. The relationships between soil support and CBR or Texas triaxial class were thor.e presented in Report 128 of the National Cooperative Highway Research Program (NCHRP) (~) •
In both sets of calculations 18-kip ESALs were used to convert mixed traffic to standard axle loads, but those for the AASHO Road Test equation were der i ved from the AASHO Road Test tables (_~), and those for the VESYS regression model were derived from load equivalence factors calculated as the ratio Pl81P·
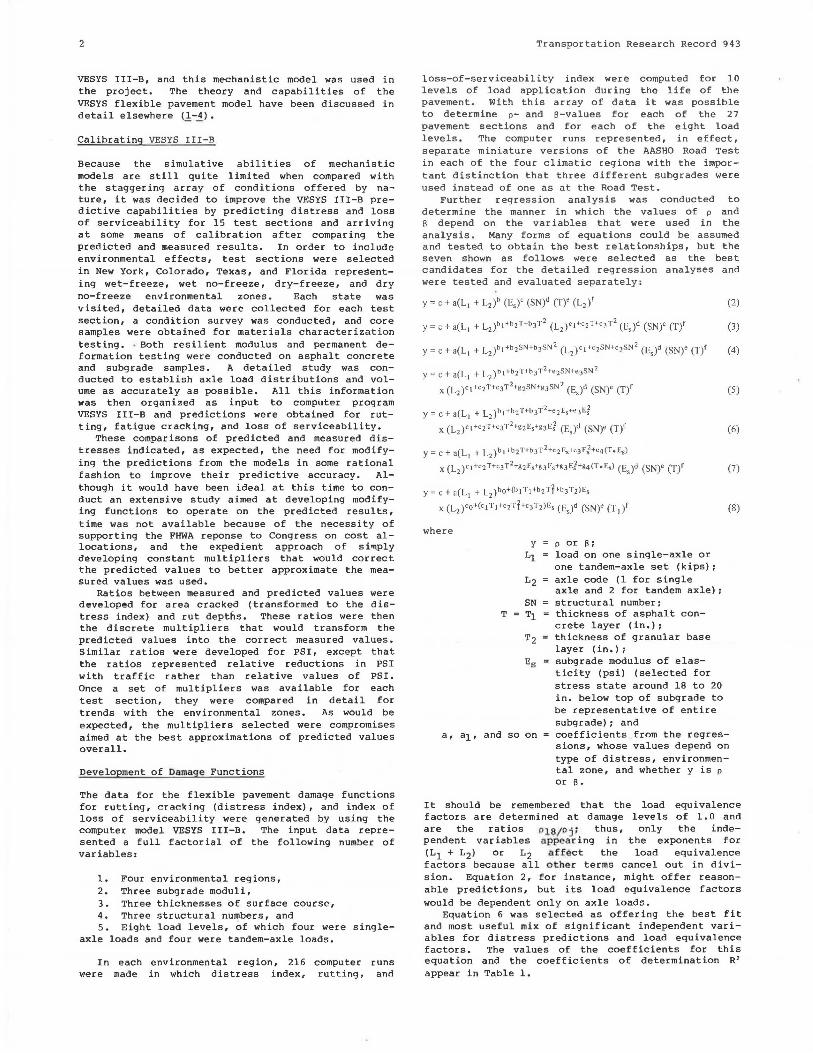
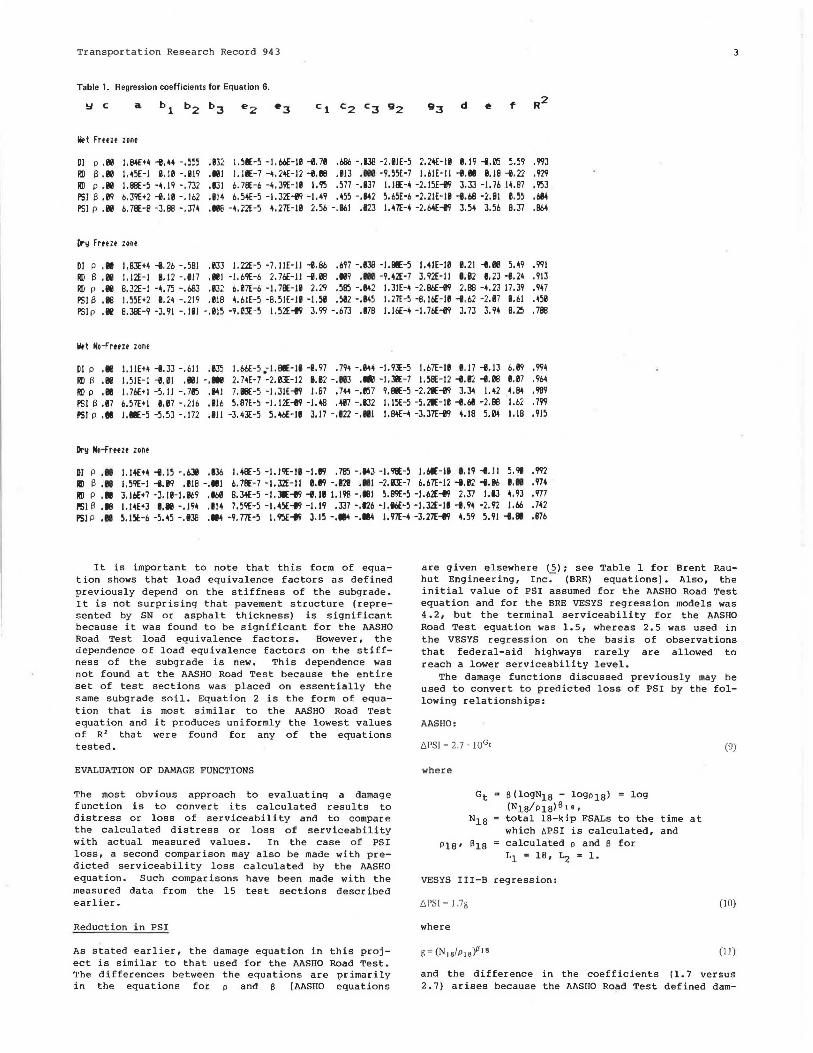
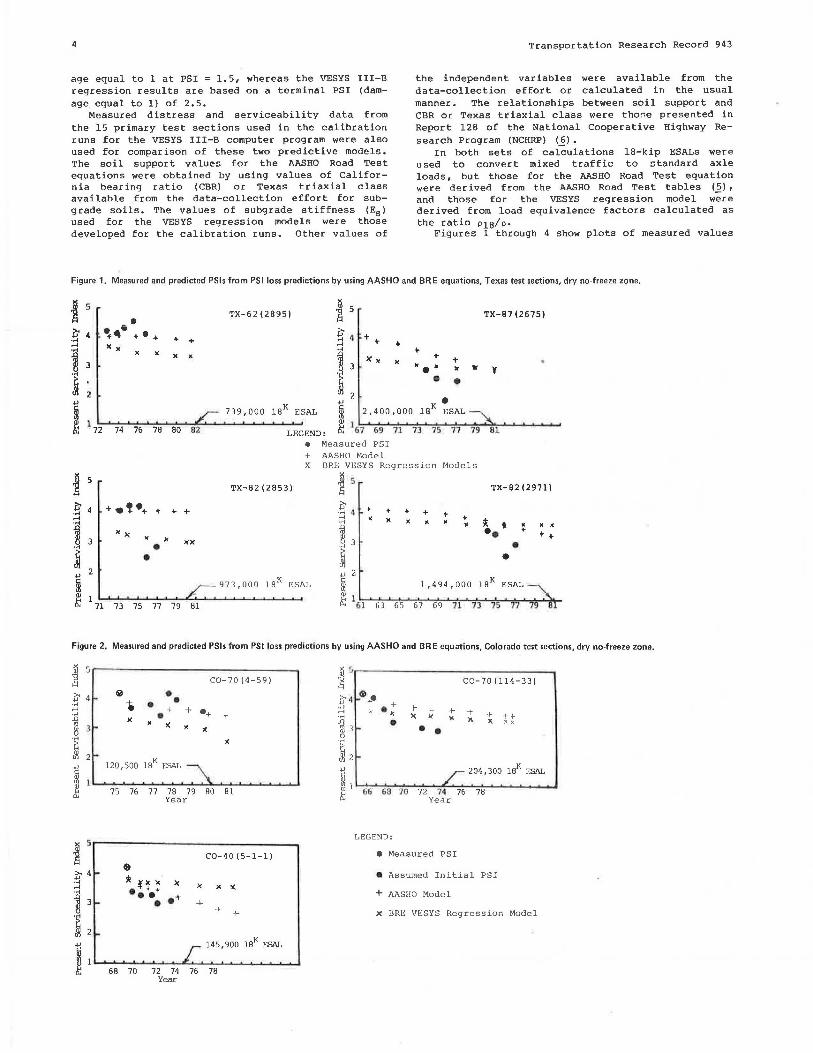
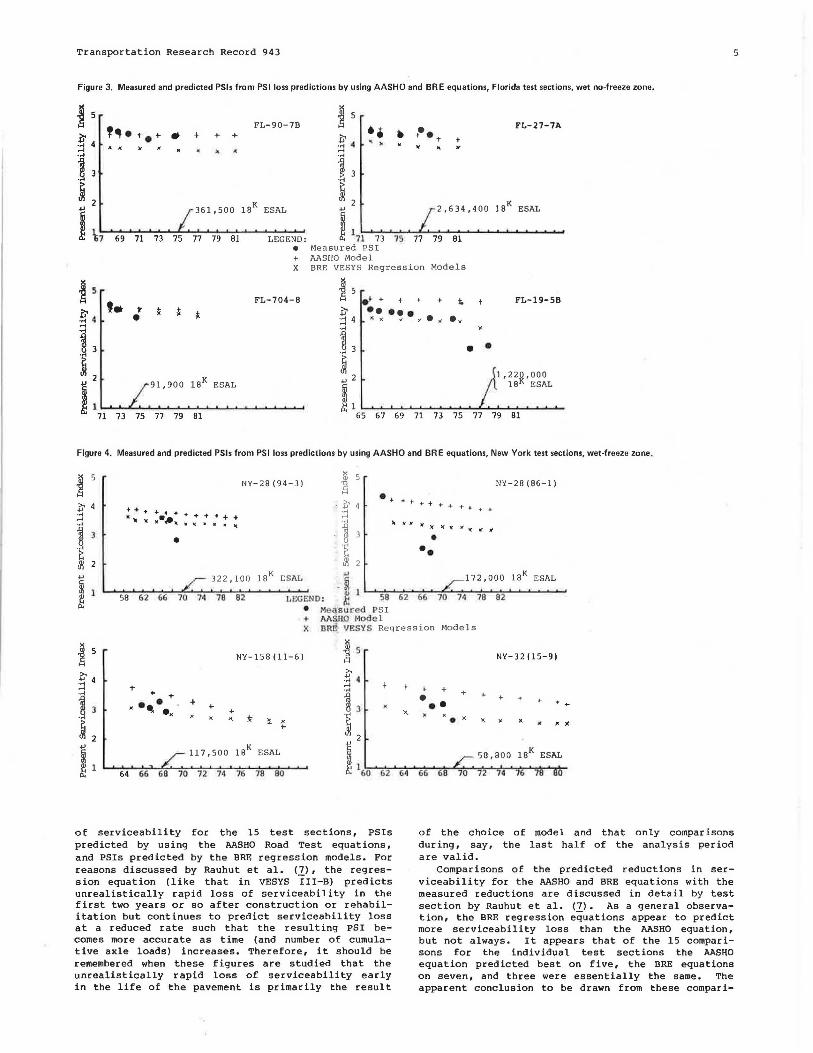
Figures l through 4 show plots of measured values
Figure 1. Measured and predicted PSls from PSI loss predictions by using AASHO and BRE equations, Texas test sections, dry no-freeze zone.
! 5 ~ 5 TX-62(2895) TX-87(2675) • iJ' 4 ~~· +•+ + iJ' + + ..... + ..... .... >C >C .... + .....
" " ..... +
1 " m + 3 )( " " +
-~ " .. " .. ¥
-~ • • 2 2
~ ... • 739,000 18K ESAL m 2,400,000 18K ESAL
~ 1 72 74 76 78 80 62 LEGEND: ~ 167 69 71 73 75 77 79 81
• Measured PSI
+ AASHO Model x BRE VESYS Regression Models
! 5 ~ 5 TX-82(2853) TX-02(2971)
iJ' + .!•+ + + + .€ 4 + + + ..... + .... .... " " "
+ ~ ..... ..... " " t • • • m ")( m •• +
t + " " ·~
)()( ll • • .....
• m • ... 2 ... 2
~ 973,000 18K ESAL m 1,494,000 lBK ESAL
1 OJ
I 71 73 75 77 79 81 ii:: 61 63 65 67 69 71 7J 75 71 79
Figure 2. Measured and predicted PSls from PSI loss predictions by using AASHO and BRE equations, Colorado test sections, dry no-freeze zone.
~ 5
iJ' 4 ,.. .... .... .... {l
3 .. OJ ll ....
m 2-... m OJ
ii::
~ 5
iJ' .... .... .... {l ~
-~ 2 ...
... m ~
C0-70(4-59)
~ • .. • • + + •+ • t-)( x )( l( )(
x
120,500 l8K ESAL ~
75 76 77
$
ilf _fX >C • + + •• •
78 79 80 81 Year
C0-40(5-1-1)
x >(
+ + +
.r 145,900
68 70 72 74 76 78 Year
~ . " + ." •
LEGEND:
t)(
fx
• • + ,.
• Measured PSI
C0-70 (114-33)
-+ )\
+ x ++
x'
• Assumed Initial PSI
+ AASHO Model
X BRE VESYS Regression Model
Transportation Research Record 943 5
Figure 3. Measured and predicted PSl5 from PSI loss prediction. by using AASHO and BRE equations, Florida test sections, wet no-freeze zone.
~ 5
~ .... .....
1 ~ 2
~
FL-90-7B
361,500 18K ESAL
~t~7 ........__.__._......._......._.__,__........_.........._ ........... ......._ ....... &; o 69 71 73 75 77 79 81 LEGEND:
! 5
•• ~ . ... .. ..... ·.-<
1 ·.-<
3
~ 2 .jJ
m ~ 1
11 73 Measured PSI AASHO Model
+• • .. FL- 27-7A • +
2,634,400 18K ESAL
75 77 79 81 • + x BRE VE SYS Regression Models
~ 5
::... •• .. Ii ~ -~ 4 • .....
~ 3
FL-704-8 ! 5
~ :::1 4
.~ + + + FL- 19-SB
•• ••• l( x )/ )I'. )( •• • •
~ J : ._..._._..._.__.9_1.._., 9._0_.0_..1_8._K_._E.._S_A._L~.._.._.._.._._...._.
71 73 75 77 79 Bl
i ] .. 2 1,220,000 - l8K ESAL
~1 ~~ ........... ~----........... ~ ...................... 65 67 69 71 73 75 77 79 81
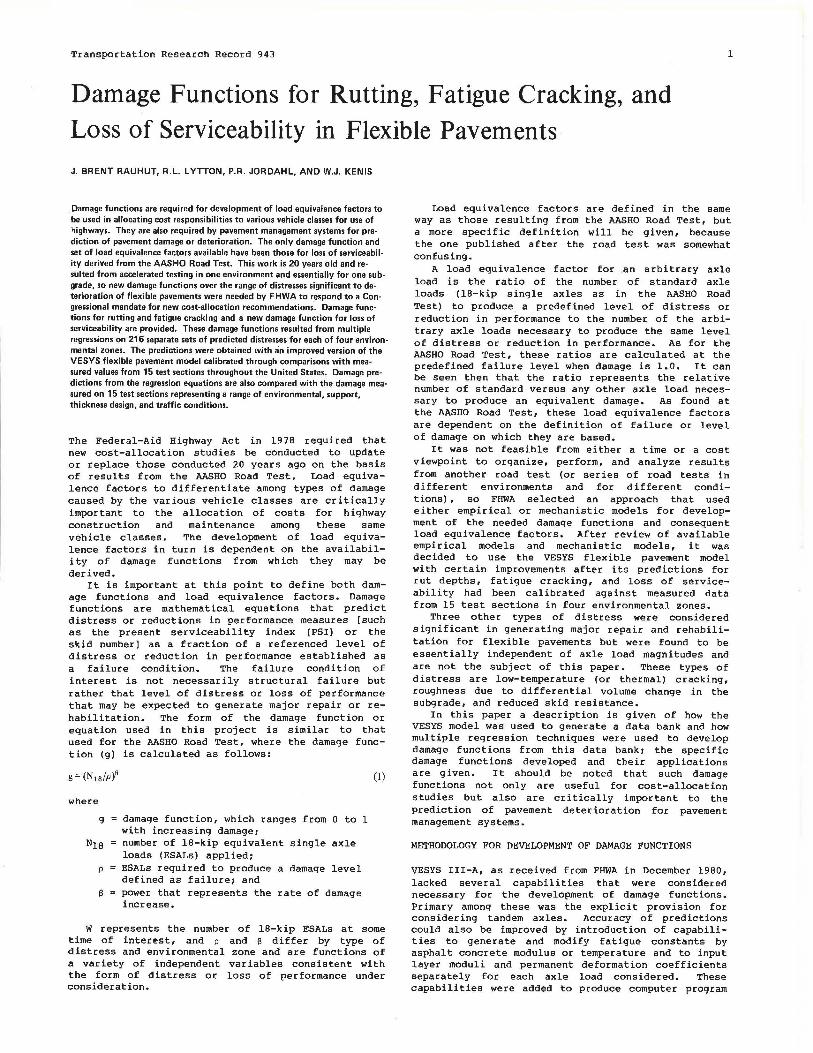
Figure 4. Measured and predicted PSls from PSI loss predictions by using AASHO and BRE equations, New York test sections, wet-freeze zone.
j 5
iJ' ·.-< ..... ·rl {I 3 ~ ·H
NY-28(94-3)
+ + ++++
"" . -·~- : : : .· ~ ! •
NY-28(86-1)
•• ++-+++++.._
~ 2 .jJ 322,100 18K CSAL
.jJ 172, 000 !BK ESAL
m ~ 58 62 66 70 74 78 82
-~ LEGEND : !l 58 62 66 70 74
• Measuced PSI 78 82
+ MSJl!J Model X BR R- VESYS Regression Models
j 5 NY-158 (11-6)
iJ' ·.-< .....
i 3
-~ 2
.,. .. + . ,. + .. •x ..
)<
" ti" ~ x .. ~ 117 ,500 18K ESAL
~ 1 64 66 68 70 72 74 76 78 80
of serviceability for the 15 test sections, PSIS predicted by using the AASHO Road Test equations, and PSIS predicted by the BRE regression models. For reasons discussed by Rauhut et al. (7), the regression equation (like that in VESYS III-B) predicts unrealistically rapid loss of serviceability in the first two years or so after construction or rehabilitation but continues to predict serviceability loss at a reduced rate such that the resulting PSI becomes more accurate as time (and number of cumulative axle loads) increases. Therefore, it should be remembered when these figures are studied that the unrealistically rapid loss of serviceability early in the life of the pavement is primarily the result
+ + • ••
66 68
+
• x
NY-3 2 (15-9)
+
x
of the choice of model and that only comparisons during, say, the last half of the analysis period are valid.
Comparisons of the predicted reductions in serviceability for the AASHO and BRE equations with the measured reductions are discussed in detail by test section by Rauhut et al. (7). As a general observation, the BRE regression equations appear to predict more serviceability loss than the AASHO equation, but not always. It appears that of the 15 comparisons for the individual test sections the AASHO equation predicted best on five, the BRE equations on seven, and three were essentially the same. The apparent conclusion to be drawn from these compari-
6
sons is that the BRE VESYS regression models (one for each of four environmental zones) predict loss of serviceability at least as well as the AASHO model with environmental zones represented by regional factors.
An attempt to further improve the BRE equations was made through applying multiplying functions to more closely predict the measured values for the test sections. Although this was successful for Texas test sections with a multiplying function developed from Texas data and Florida test sections with Florida data, the multiplying functions were not stable across a reasonable range of variables, so further improvements must await a broader data bank. The procedure used for development of multiplying functions is described in detail for rutting in the next section.
.Rut Depth
The BRE damage functions for rut depth appear in Table l and include the four sets of regression coefficients for each of the four environmental zones. The damage function for rut depth can be converted to predict rut depth by simply multiplying the calculated damage by one-half. This conversion reflects the selection of 0.5 in. of rut depth as the failure level (damage equal to 1.0).
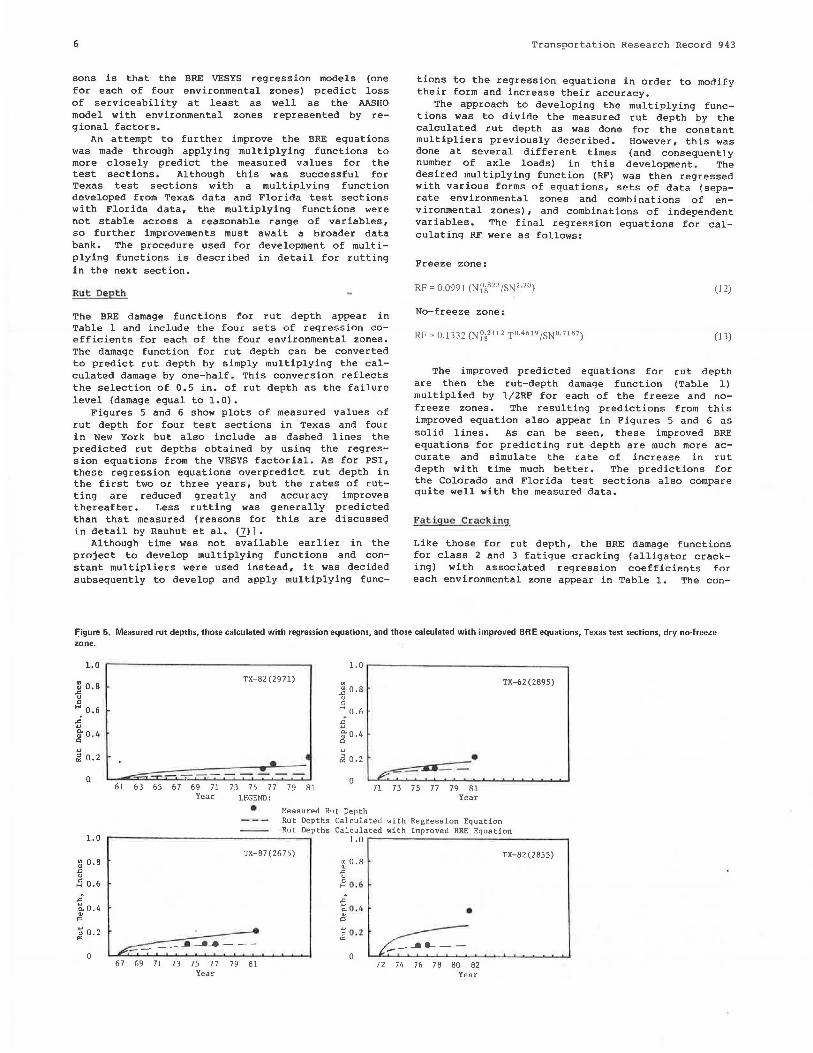
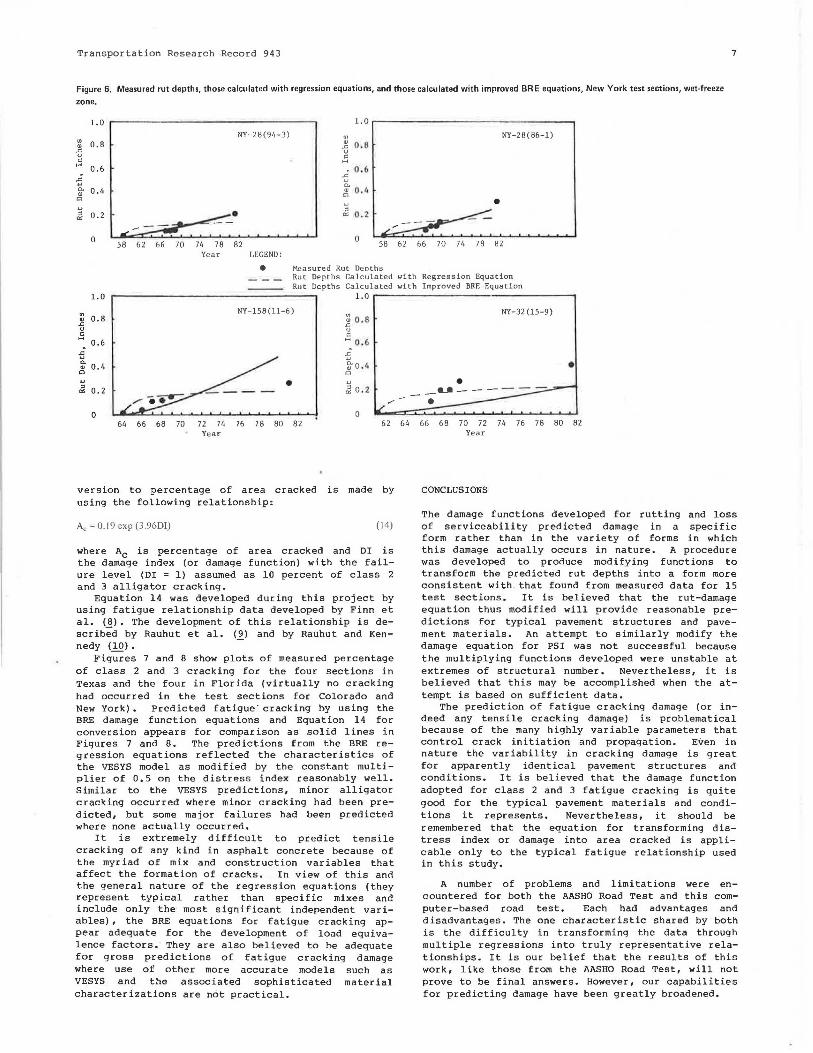
Figures 5 and 6 show plots of measured values of rut depth for four test sections in Texas and four in New York but also include as dashed lines the predicted rut depths obtained by using the regression equations from the VESYS factorial. As for PSI, these regression equations overpredict rut depth in the first two or three years, but the rates of rutting are reduced greatly and accuracy improves thereafter. Less rutting was generally predicted than that measured [reasons for this are discussed in detail by Rauhut et al. (7)].
Although time was not a-;;.ailable earlier in the project to develop multiplying functions and constant multipliers were used instead, it was decided subsequently to develop and apply multiplying func-
Transportation Research Record 943
tions to the regression equations in order to modify their form and increase their accuracy.
The approach to developing the multiplying functions was to divide the measured rut depth by the calculated rut depth as was done for the constant multipliers previously described. However, this was done at several different times (and consequently number of axle loads) in this development. The desired multiplying function (RF) was then regressed with various forms of equations, sets of data (separate environmental zones and combinations of environmental zones), and combinations of independent variables. The final r_egression equations for calculating RF were as follows:
Freeze zone:
(J 2)
No-freeze zone:
(13)
The improved predicted equations for rut depth are then the rut-depth damage function (Table 1) multiplied by l/2RF for each of the freeze and nofreeze zones. The resulting predictions from this improved equation also appear in Figures 5 and 6 as solid lines. As can be seen, these improved BRE equations for predicting rut depth are much more accurate and simulate the rate of increase in rut depth with time much better. The predictions for the Colorado and Florida test sections also compare quite well with the measured data.
Fatigue CracJdng
Like those for rut depth, the BRE damage functions for class 2 and 3 fatigue cracking (alligator cracking) with associated regression coefficients for each environmental zone appear in Table 1. The con-
Figure 5. Measured rut depths, those calculated with regression equations, and those calculated with improved BRE equations, Texas test sections, dry no-freeze zone.
1.0
~ 0.8 .c u
" ... 0.6
.c ., g- 0 .4
"' ., ~ 0.2
0
1.0
~ 0.8 .c u .!'i 0.6
i ""0.4 " "' ~ 0.2
0
1.0 .-------------------
TX-·82 (2971) 00
1! 0. 8 u
" ... 0.6
ii g- 0 .4
"' ,_,
• .ii 0.2 -61 63 65 67 69 71 73 75 77 79 81
0
Year LEGEND:
• Measured Rut De:pth
• 71 73 75 77 79 81
Year
TX-62(2895)
Rut Depths Calculated with Regression Equation Rut Depths Calculated with Improved BRE Equation
.....--~~~~~~~~~~~~~~~--..., 1.0
TX-87(2675)
67 69 71 73 75 77 79 81 Year
~ 0.8
'5 .!'i 0 .6
.c ~0. 1+ " "' ~ 0 . 2
0
• ,_-~L--
72 74 76 78 80 82 Year
TX-82 ( 285 5)
Transportation Research Record 943 7
Figure 6. Measured rut depths, those calculated with regression equations, and those calculated with improved BRE equations, New York test sections, wet-freeze
zone.
1.0
U) O. B " -" u ~
H 0.6
-e p. o. i. " 0
... ,;i 0 .2
0
NY-28(91,-3)
• 58 62 66 70 71, 78 82
Year LEGEND:
•
"' ~ 0.8 u ~
H
' 0.6 -e ~ 0.1. u
~ 0 . 2
0
NY-28(86-1)
•
58 62 66 70 74 78 82
Measured Rut Depths Rut Depths Calculated with Regression Equation Rut Depths Calculated with Improved BRE Equation
1.0 i.0.-------- - - ---------.
~ 0.8 u ~
H
i 0.6
~ 0.4
u
~ 0. 2
0
NY-158(11-6)
•
i 0.11 u ~
H Q.6
-e :; 0. 4 0
~ 0.2
0
NY-32 (15-9)
• • __ .... _____ _
• 64 66 68 70 72 74 76 78 80 82
Year 62 64 66 68 70 72 74 76 78 80 82
Year
version to percentage of area cracked is made by using the following relationship:
Ac= 0.19 exp (3.96DI) (14)
where Ac is percentage of area cracked and DI is the damage index (or damage function) with the failure level (DI = 1) assumed as 10 percent of class 2 and 3 alligator cracking.
Equation 14 was developed during this project by using fatigue relationship data developed by Finn et al. (~). The development of this relationship is described by Rauhut et al. (2_) and by Rauhut and Kennedy (10).
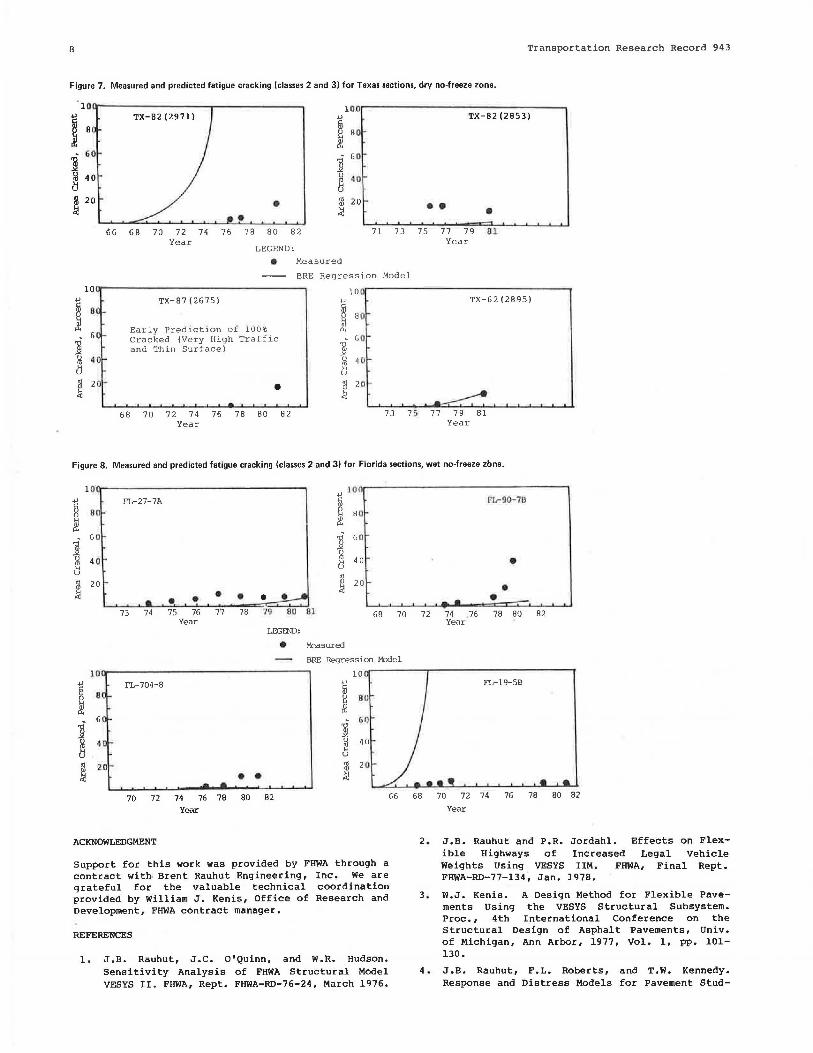
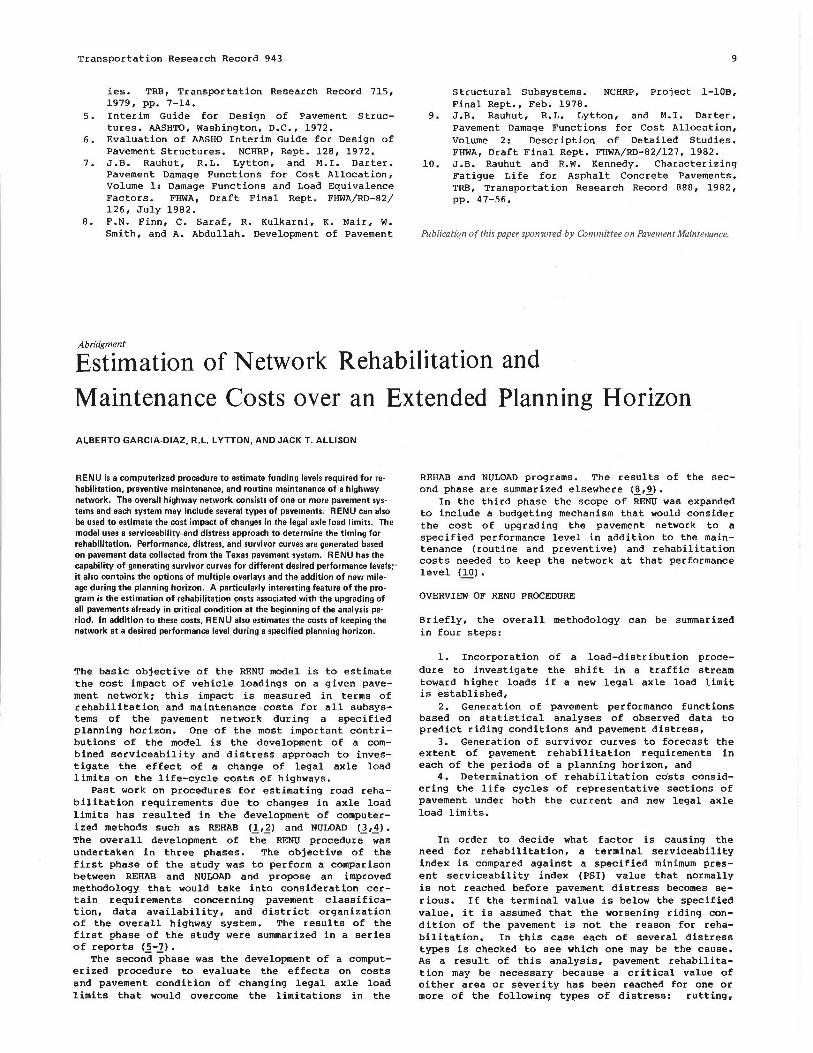
Figures 7 and 8 show plots of measured percentage of class 2 and 3 cracking for the four sections in Texas and the four in Florida (virtually no cracking had occurred in the test sections for Colorado and New York). Predicted fatigue· cracking by using the BRE damage function equations and Equation 14 for conversion appears for comparison as solid lines in Figures 7 and 8. The predictions from the BRE regression equations reflected the characteristics of the VESYS model as modified by the constant multiplier of 0.5 on the di s tress index reasonably we ll. Similar to the VESYS predictions, minor alligator cracking occurred where minor cracking had been predicted, but some major failures had been predicted where none actually occurred.
It is extremely difficult to predict tensile cracking of any kind in asphalt concrete because of the myriad of mix and construction variables that affect the formation of cracks. In view of this and the general nature of the regression equations (they represent typical rather than specific mixes and include only the most significant independent variables), the BRE equations for fatigue cracking appear adequate for the development of load equivalence factors. They are also believed to be adequate for gross predictions of fatigue cracking damage where use of other more accurate models such as VESYS and the associated sophisticated material characterizations are not practical.
CONCLUSIONS
The damage functions developed for rutting and loss of serviceability predicted damage in a specific form rather than in the variety of forms in which this damage actually occurs in nature. A procedure was developed to produce modifying functions to transform the predicted rut depths into a form more consistent with that found from measured data for 15 test sections. It is believed that the rut-damage equation thus modified will provide reasonable predictions for typical pavement structures and pavement materials. An attempt to similarly modify the damage equation for PSI was not successful because the multiplying functions developed were unstable at extremes of structural number. Nevertheless, it is believed that this may be accomplished when the attempt is based on sufficient data.
The prediction of fatigue cracking damage (or indeed any tensile cracking damage) is problematical because of the many highly variable parameters that control crack initiation and propagation. Even in nature the variability in cracking damage is great for apparently identical pavement structures and conditions. It is believed that the damage function adopted for class 2 and 3 fatigue cracking is quite good for the typical pavement materials and conditions it represents. Nevertheless, it should be remembered that the equation for transforming distress index or damage into area cracked is applicable only to the t ypical fatigue relationship used in this study.
A number of problems and limitations were encountered for both the AASHO Road Test and this computer-based road test. Each had advantages and disadvantages. The one characteristic shared by both is the difficulty in transforming the data through multiple regressions into truly representative relationships. It is our belief that the results of this work, like those from the AASHO Road Test, will not prove to be final answers. However, our capabilities for predicting damage have been greatly broadened.
8 Transportation Research Record 943
Figure 7. Measured and predicted fatigue cracking (classes 2 and 3) for Texas sections, dry no-freeze zone.
10.0
) TX-82(2971)
8 fil ~
BO
TX-82(2853)
j 60
~ 40 ] 60
hl 40 (j
~ 20 • • m 20 ~ • • •
~6 68 70 72 74 Year
76 7B 80 B2 71 73 75 77 79 81 Year
10
fil 80
~ ]
6 ( ....
~ 40 CJ
~ 20 -
LEGEND: • Measured
~~ BRE Regression Model
TX-87(2675)
Early Prediction ot iuui Cracked (Very High Traffic and Thin Surface)
•
.µ
ffi u
& ] hl " u
m ~
10
BO
60
4 {)
20
TX-62(2895)
68 70 72 74 76 78 BO B2 Year
73 7 5 77 79 Bl Year
Figure 8. Measured and predicted fatigue cracking (classes 2 and 3) for Florida sections, wet no-freeze zbne.
10 .µ
ffi BO u
Flr-27-7A
~ "" ]
GO
hl 4 0
" u
m 20
• • • ~
73 74 75 76 Tl Year
FL-704-B
.µ 100
~ H 8 0 &
] GO
hl 40 " u <1l
~ 20
• • • 7B 79 so 81 68 70
LJx;END:
• ~a sured
• •
BRE Regression f>bdel
10 .µ
ffi \:l 80 &
] Gil
hl 40
" u <1l 20 Q)
~
Pl.r9C)-7B
• •
_a • 72 74 .76 78 80 B2
Year
FL-19-58
70 72 74 76 78 80 82 Year
66 68 70 72 74 76 78 80 82
Year
ACKNOWLEDGMENT
Support for this work was provided by FHWA through a contract with. Brent Rauhut Engineering, Inc. We are grateful for the valuable technical coordination provided by William J. Kenis, Office of Research and Development, FHWA contract manager.
REFERENCES
1. J.B. Rauhut, J.C. O'Quinn, and W.R. Hudson. Sensitivity Analysis of FHWA Structural Model VESYS II. FHWA, Rept. FHWA-RD-76-24, March 1976.
2 . J.B. Rauhut and P.R. Jordahl. Effects on Flexible Highways of Increased Legal Vehicle Weights Using VESYS IIM. FHWA, Final Rept. FHWA-RD-77-134, Jan. 1978.
3. W.J. Kenis. A Design Method for Flexible Pavements Using the VESYS Structural Subsystem. Proc., 4th International Conference on the Structural Design of Asphalt Pavements, Univ. of Michigan, Ann Arbor, 1977, Vol. 1, pp. 101-130.
4 . J.B. Rauhut, F.L. Roberts, and T.W. Kennedy. Response and Distress Models for Pavement Stud-
Transportation Research Record 943
ies. TRB, Transportation Research Record 715, 1979, pp. 7-14.
5. Interim Guide for Design of Pavement Structures. AASHTO, Washington, D.C., 1972.
6. Evaluation of AASHO Interim Guide for Design of Pavement Structures. NCHRP, Rept. 128, 1972.
7. J.B. Rauhut, R.L. Lytton, and M.I. Darter. Pavement Damage Functions for Cost Allocation, Volume 1: Damage Functions and Load Equivalence Factors. FHWA, Draft Final Rept. FHWA/RD-82/ 126, July 1982.
8. F.N. Finn, C. Saraf, R. Kulkarni, K. Nair, w. Smith, and A. Abdullah. Development of Pavement
Abridgment
9
Structural Subsystems. NCHRP, Project 1-lOB, Final Rept., Feb. 1978.
9. J.B. Rauhut, R.L. Lytton, and M.I. Darter. Pavement Damage Functions for Cost Allocation, Volume 2: Description of Detailed Studies. FHWA, Draft Final Rept. FHWA/RD-82/127, 1982.
10. J.B. Rauhut and R.W. Kennedy. Characterizing Fatigue Life for Asphalt Concrete Pavements. TRB, Transportation Research Record 888, 1982, pp. 47-56.
Publication of this paper sponsored by Committee on Pavement Maintenance.
Estimation of Network Rehabilitation and
Maintenance Costs over an Extended Planning Horizon
ALBERTO GARCIA-DIAZ, R.L. LYTTON, AND JACK T. ALLISON
RENU is a computerized procedure to estimate funding levels required for rehabilitation, preventive maintenance, and routine maintenance of a highway network. The overall highway network consists of one or more pavement systems and each system may include several types of pavements. RENU can also be used to estimate the cost impact of changes in the legal axle load limits. The model uses a serviceability and distress approach to determine the timing for rehabilitation. Performance, distress, and survivor curves are generated based on pavement data collected from the Texas pavement system. R ENU has the capability of generating survivor curves for different desired performance levels;· it also contains the options of multiple overlays and the addition of new mileage during the planning horizon. A particularly interesting feature of the program is the estimation of rehabilitation costs associated with the upgrading of all pavements already in critical condition at the beginning of the analysis period. In addition to these costs, RENU also estimates the costs of keeping the network at a desired performance level during a specified planning horizon.
The basic objective of the RENU model is to estimate the cost impact of vehicle loadings on a given pavement network i this impact is measured in terms of rehabilitation and maintenance costs for all subsystems of the pavement network during a specified planning horizon. One of the most important contributions of the model is the development of a combined serviceability and distress approach to investigate the effect of a change of legal axle load limits on the life-cycle costs of highways.
Past work on procedures for estimating road rehabilitation requirements due to changes in axle load limits has resulted in the development of computerized methods such as REHAB (,!,1_) and NULOAD C~dl.
The overall development of the RENU procedure was undertaken in three phases. The objective of the first phase of the study was to perform a comparison between REHAB and NULOAD and propose an improved methodology that would take into consideration certain requirements concerning pavement classification, data availability, and district organization of the overall highway system. The results of the first phase of the study were summarized in a series of reports <2-1>·
The second phase was the development of a computerized procedure to evaluate the effects on costs and pavement condition of changing legal axle load limits that would overcome the limitations in the
REHAB and NULOAD programs. The results of the second phase are summarized elsewhere (_!!,2_).
In the third phase the scope of RENU was expanded to include a budgeting mechanism that would consider the cost of upgrading the pavement network to a specified performance level in addition to the maintenance (routine and preventive) and rehabilitation costs needed to keep the network at that performance level (10).
OVERVIEW OF RENU PROCEDURE
Briefly, the overall methodology can be summarized in four steps:
1. Incorporation of a load-distribution procedure to investigate the shift in a traffic stream toward higher loads if a new legal axle load limit is established,
2. Generation of pavement performance functions based on statistical analyses of observed data to predict riding conditions and pavement distress,
3. Generation of survivor curves to forecast the extent of pavement rehabilitation requirements in each of the periods of a planning horizon, and
4. Determination of rehabilitation co"sts considering the life cycles of representative sections of pavement under both the current and new legal axle load limits.
In order to decide what factor is causing the need for rehabilitation, a terminal serviceability index is compared against a specified minimum present serviceability index (PSI) value that normally is not reached before pavement distress becomes serious. If the terminal value is below the specified value, it is assumed that the worsening riding condition of the pavement is not the reason for rehabilitation. In this case each of several distress types is checked to see which one may be the cause. As a result of this analysis, pavement rehabilitation may be necessary because a critical value of either area or severity has been reached for one or more of the following types of distress: rutting,