Dairy Statistics 2009 - California Department of Food … Statistics 2009 California Recession...
52
Dairy Statistics 2009 California Recession Recovery Costs Income Bumps Ahead Retired Cows
Transcript of Dairy Statistics 2009 - California Department of Food … Statistics 2009 California Recession...
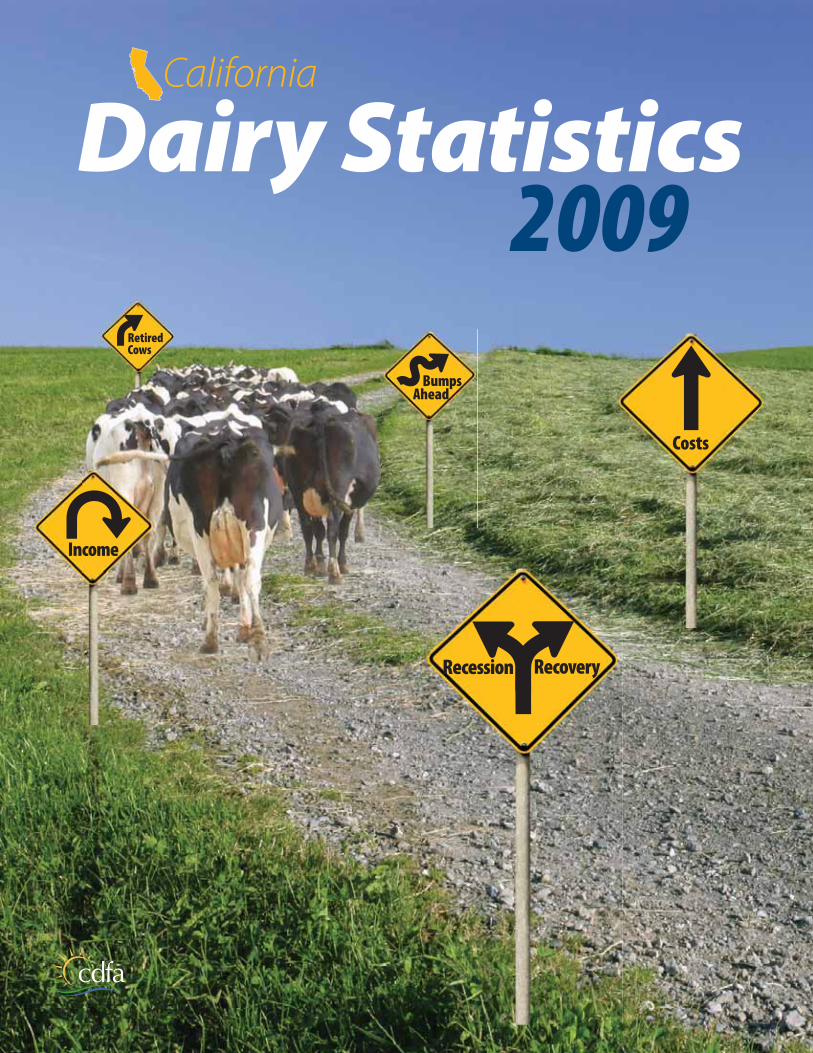
Dairy Statistics2009
California
Recession Recovery
Costs
Income
BumpsAhead
RetiredCows
Area Code is (916) unless otherwise noted.
Offi ce of the SecretaryA.G. Kawamura, Secretary, 654-0433Will Brown, Undersecretary, 654-0321Dr. Richard Breitmeyer, DVM, State Veterinarian, 651-6870
ANIMAL HEALTH AND FOOD SAFETY SERVICESDr. Annette Whiteford, DVM, Director, 654-0881,
Fax 653-4249
Animal Health BranchKent Fowler, DVM, Chief, 654-1447, Fax 653-2215
District VeterinariansRedding: Charles Palmer, DVM, (530) 225-2140Modesto: David Willoughby, DVM, (209) 491-9350Tulare: Melanie Swartz, DVM, (559) 685-3500Ontario: David Kerr, DVM, (909) 947-4462
Livestock Identifi cation BranchGreg Lawley, Chief, 654-0889, Fax 653-5190
Regional AdministratorsNorthern: John Romano (530) 347-5721Central: David Fischer, (209) 845-8352Southern: Richard Wright, (559) 685-3505
Milk & Dairy Foods Control BranchStephen Beam PhD., Chief, 653-0773, Fax 654-7512
Agriculture Program SupervisorKristen Dahl, 654-1981
LicensingFacilities, Corey Pruitt, 654-0916Personal Licenses, Ashley Cornejo, 654-0785
Regional CoordinatorsStockton: Mostafa Sherzad, (209) 466-7186Oakland: John Macy, (510) 622-4810Fresno: David Krall, (559) 445-5506Ontario: Joel Kolling, (909) 923-9929
California Department of Food and Agriculture1220 N Street, Sacramento, CA 95814Homepage Website: http:www.cdfa.ca.gov/dairyEmail address: [email protected]
Dairy Marketing BranchDavid K. Ikari, Chief, 341-5988, Fax 341-6697
California Dairy StatisticsKaren Dapper, 341-5988, Fax 341-6697
Economics/PricingCandace Gates, 341-5988, Fax 341-6697
Production Cost UnitMike Francesconi, 341-5988, Fax 341-6697
Manufacturing Cost UnitVenetta Reed, 341-5988, Fax 341-6697
Enforcement & Unlawful PracticesDavid Ikari, 341-5988, Fax 341-6697
Milk Pooling BranchJohn Lee, Chief, 341-5901, Fax 341-5995
Pool OperationsDon Shippelhoute, 341-5901, Fax 341-5995
Pool AuditsNancy Hartman, Ron Quan, Marlene Wride,Sunday Ikenador, 341-5901, Fax 341-5995
Producer Payments, Licenses & BondsJohn Bressett, 341-5901, Fax 341-5995
Marketing BranchBob Maxie, Chief, 341-6005, Fax 341-6826Dennis Manderfi eld, Glenn Yost
Meat & Poultry Inspection BranchDennis Thompson, DVM, Chief, 654-0504, Fax 654-2608
District VeterinariansSacramento: Doug Hepper, DVM, 654-0504Fresno: Herbert Radigtsch, DVM, (559) 233-7318Ontario: Namara Garbaba, DVM, (909) 773-0079
MARKETING SERVICESKevin Masuhara, Director, 445-5055, Fax 445-2655
Environmental ProgramsCasey Walsh Cady, 445-5055
C A L I F O R N I A
Contacts for the California Dairy Industry
2 California Dairy Statistics Annual 2009

4 California’s Dairy Industry, 2009 Looking at the dairy industry in 2009
6 Facts, Ranking, and Highlights Where does California rank in U.S. dairy production
8 Cows, Milk Production, California and U.S. Comparing California and the U.S.
10 Commercial Milk Production, Number of Cows, Dairies Looking at total milk production; number of cows and dairies
12 Bulk Milk Production Five-year summary, overall milk production by county
14 Milk Production, by County Commercial production, Grade A, Grade B, Top 10 Counties
21 Pooled Milk Utilization, Quota, Quota Transfers Summary of pooled milk utilization, quota information
24 Sales of Class 1 Market Milk Products Summary of California Class 1 fl uid milk sales
26 Fluid Milk Container Survey Survey of fl uid milk sales for October 2009
29 Manufacture of Dairy Products Five-year summaries, fl ow chart of butter and NFDM production
36 Class Prices Overview of 2009 class prices
37 Minimum Class Prices, Average Retail Prices Class prices, quota and overbase prices
44 Average Prices Paid to Producers, U.S. Mailbox Milk Prices Average prices paid to producers, U.S. and California mailbox prices
46 Production Cost and Manufacturing Cost Summaries Looking at cost to produce milk, cost to produce dairy products
48 Dairy Product Classifi cation and Historic Timeline Classifi cation of dairy products and historical timeline of dairy industry
C A L I F O R N I A
Dairy Statistics 2009
California Dairy Statistics Annual 2009 3
This publication was prepared in the Division of Marketing Services,
Dairy Marketing Branch, by:
Dairy Statistics Unit Staff :Karen Dapper, Research ManagerDickson Owino, Research Analyst
Lu Tang, Research Analyst
In Cooperation With:Dairy Marketing Branch’s Economics,
Manufacturing Cost, and Cost of Production Units;
Milk Pooling Branch
and the
U.S. Department of AgricultureWashington, D.C.
Tom Vilsack , Secretary
National Agricultural Statistics ServiceRon Bosecker, Administrator
Vic Tolomeo, California Statistician
The California Statistics 2009 Annual is a joint eff ort of the California Department of Food and Agriculture (CDFA) and the United States Department of Agriculture (USDA). Like the previous 64 issues, it contains a summary of statistical data that was originally published by CDFA and USDA, primarily in the Dairy Information Bulletin. This publication would not be possible without the cooperation of the individuals and fi rms engaged in the production, manufacture, and distribution of milk and dairy products. Both corrections of errors and revisions based on receipt of more complete information are the basis of all changes from previously published data.
California Department of Food and AgricultureA.G. Kawamura, SecretaryDairy Marketing Branch
1220 N Street, Sacramento, CA 95814(916) 341-5988 / www.cdfa.ca.gov/dairy
T he year 2009 was a very diffi cult year for thedairy industry. The
California’s Dairy Industry in 2009
C A L I F O R N I A
historic low class prices coupled with the unusually high cost of production, and the economic conditions making credit availability very tight, was the story throughout the year. Dairy producers were forced to trim their herds after excess milk supplies sent milk prices plunging and forced some dairy producers out of business. The economic climate and combination of low milk prices and high costs caused signifi cant loss of equity for many dairy producers. The
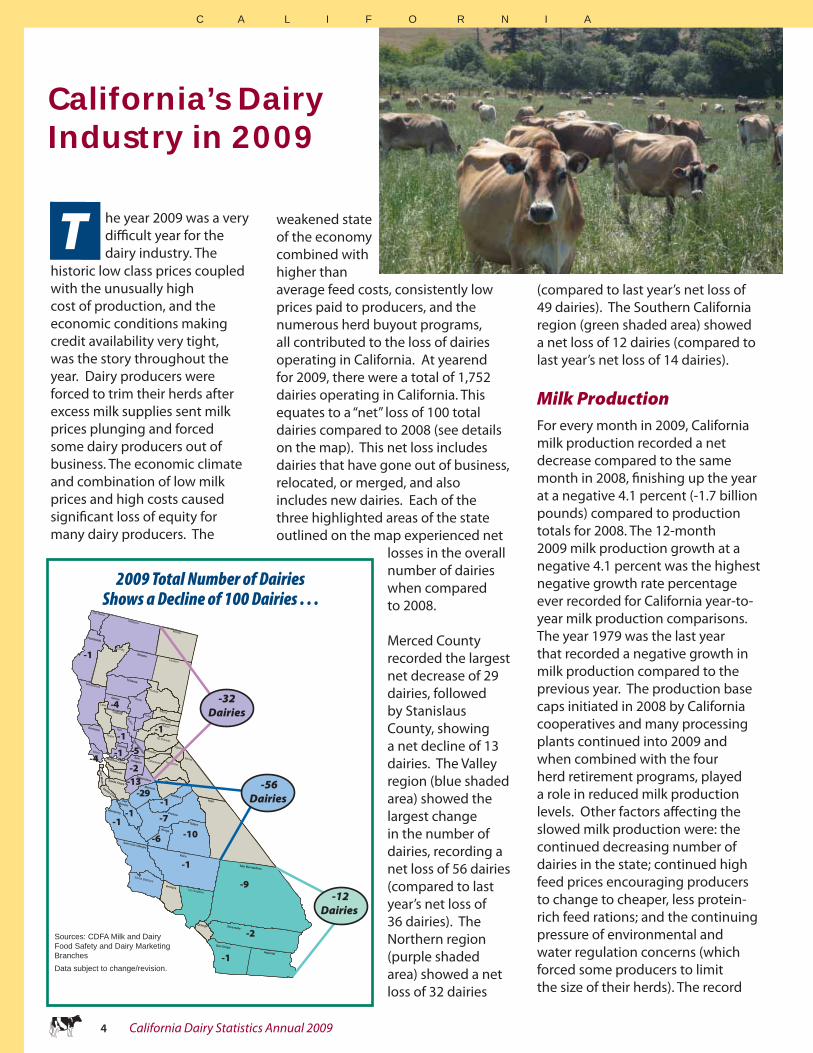
weakened state of the economy combined with higher than average feed costs, consistently low prices paid to producers, and the numerous herd buyout programs, all contributed to the loss of dairies operating in California. At yearend for 2009, there were a total of 1,752 dairies operating in California. This equates to a “net” loss of 100 total dairies compared to 2008 (see details on the map). This net loss includes dairies that have gone out of business, relocated, or merged, and also includes new dairies. Each of the three highlighted areas of the state outlined on the map experienced net
losses in the overall number of dairies when compared to 2008.
Merced County recorded the largest net decrease of 29 dairies, followed by Stanislaus County, showing a net decline of 13 dairies. The Valley region (blue shaded area) showed the largest change in the number of dairies, recording a net loss of 56 dairies (compared to last year’s net loss of 36 dairies). The Northern region (purple shaded area) showed a net loss of 32 dairies
(compared to last year’s net loss of 49 dairies). The Southern California region (green shaded area) showed a net loss of 12 dairies (compared to last year’s net loss of 14 dairies).
Milk ProductionFor every month in 2009, California milk production recorded a net decrease compared to the same month in 2008, fi nishing up the year at a negative 4.1 percent (-1.7 billion pounds) compared to production totals for 2008. The 12-month 2009 milk production growth at a negative 4.1 percent was the highest negative growth rate percentage ever recorded for California year-to-year milk production comparisons. The year 1979 was the last year that recorded a negative growth in milk production compared to the previous year. The production base caps initiated in 2008 by California cooperatives and many processing plants continued into 2009 and when combined with the four herd retirement programs, played a role in reduced milk production levels. Other factors aff ecting the slowed milk production were: the continued decreasing number of dairies in the state; continued high feed prices encouraging producers to change to cheaper, less protein-rich feed rations; and the continuing pressure of environmental and water regulation concerns (which forced some producers to limit the size of their herds). The record
2009 Total Number of Dairies Shows a Decline of 100 Dairies . . .
Sources: CDFA Milk and Dairy Food Safety and Dairy Marketing BranchesData subject to change/revision.
Del Norte
Siskiyou
Modoc
Lassen
Shasta
Trinity
Humboldt
Mendocino
Tehama
Butte
Plumas
GlennLake
SierraColusa
YoloSonoma
YubaNevadaPlacer
El Dorado
Sutter
Napa
Solano
Sacramento Amador
Alpine
Mono
Marin
Contra Costa
SanJoaquinCalaveras
San Mateo
Alameda
Tuolumne
Santa Cruz
Santa Clara
Stanislaus
Merced
Mariposa
MaderaSan
BenitoMonterey Fresno
Kings
Inyo
Tulare
San Luis Obispo
Kern
Santa BarbaraVentura Los Angeles
Orange
San DiegoImperial
Riverside
San Bernardino
-1
-4
-7
-29
-2
-5
-13
-4
-1
-10-6
-1
-1
-1-1
-32 Dairies
-12 Dairies
-56 Dairies
-1-1
-9
-2
-1
4 California Dairy Statistics Annual 2009
(Continued next page)
C A L I F O R N I A
Kern Stanislaus Kings Merced Tulare All Other Counties
Annual AverageCost of Production
Annual Average Mailbox Milk Price
2003 2004 2005 2006 2007 2008 2009(3 Qtrs.)
g
$0.00
$2.00
$4.00
$6.00
$8.00
$10.00
$12.00
$14.00
$16.00
$18.00
$
$$
$
$ $
$
$$
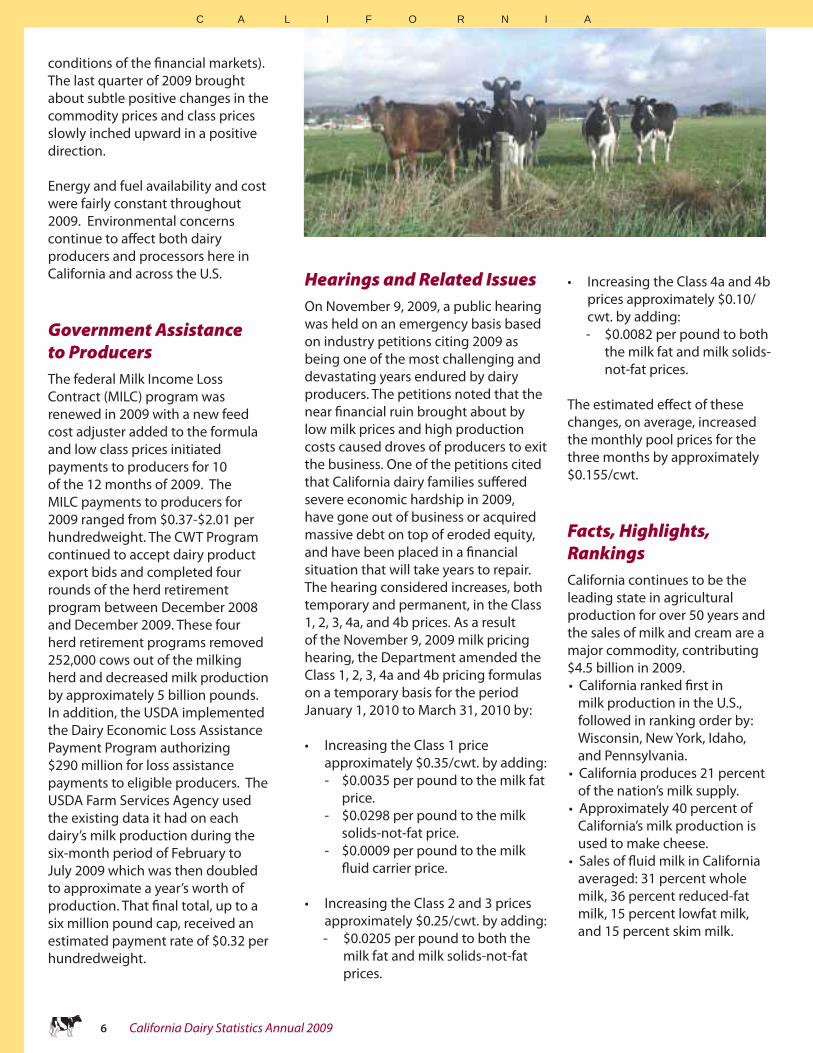
setting annual average prices paid to producers in 2007 of $18.04 per hundredweight, fell dramatically in 2009 to $11.48.
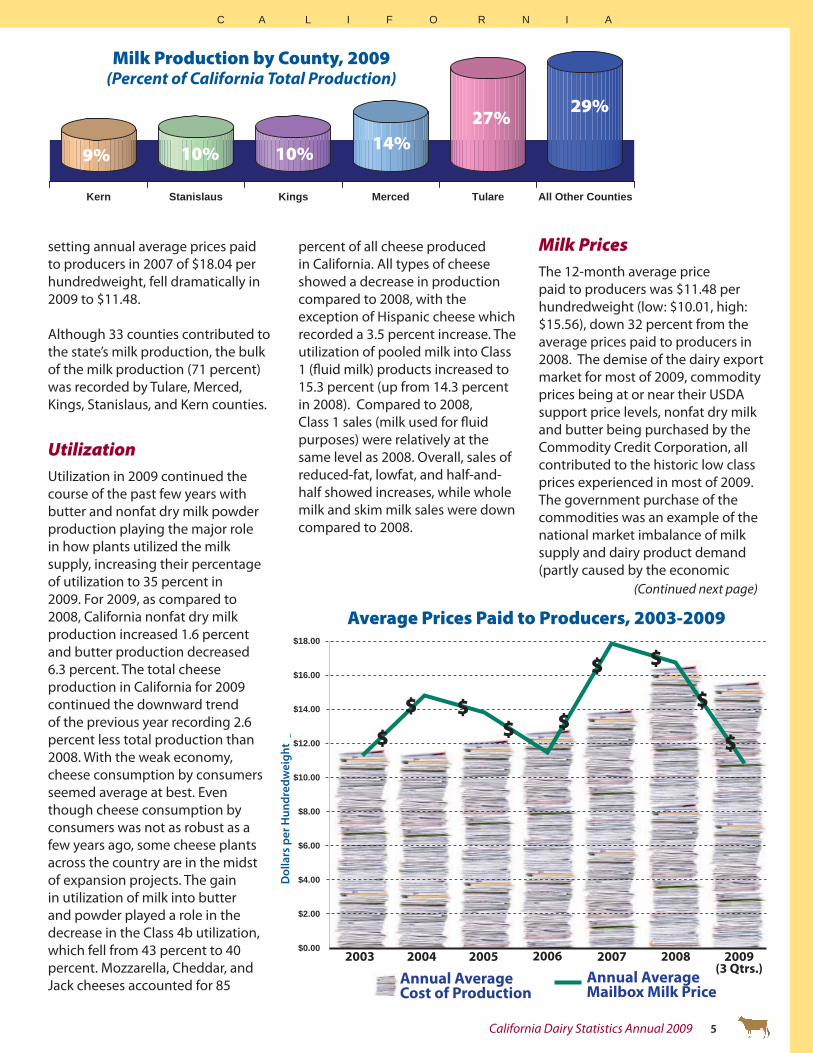
Although 33 counties contributed to the state’s milk production, the bulk of the milk production (71 percent) was recorded by Tulare, Merced, Kings, Stanislaus, and Kern counties.
UtilizationUtilization in 2009 continued the course of the past few years with butter and nonfat dry milk powder production playing the major role in how plants utilized the milk supply, increasing their percentage of utilization to 35 percent in 2009. For 2009, as compared to 2008, California nonfat dry milk production increased 1.6 percent and butter production decreased 6.3 percent. The total cheese production in California for 2009 continued the downward trend of the previous year recording 2.6 percent less total production than 2008. With the weak economy, cheese consumption by consumers seemed average at best. Even though cheese consumption by consumers was not as robust as a few years ago, some cheese plants across the country are in the midst of expansion projects. The gain in utilization of milk into butter and powder played a role in the decrease in the Class 4b utilization, which fell from 43 percent to 40 percent. Mozzarella, Cheddar, and Jack cheeses accounted for 85
percent of all cheese produced in California. All types of cheese showed a decrease in production compared to 2008, with the exception of Hispanic cheese which recorded a 3.5 percent increase. The utilization of pooled milk into Class 1 (fl uid milk) products increased to 15.3 percent (up from 14.3 percent in 2008). Compared to 2008, Class 1 sales (milk used for fl uid purposes) were relatively at the same level as 2008. Overall, sales of reduced-fat, lowfat, and half-and-half showed increases, while whole milk and skim milk sales were down compared to 2008.
Milk Production by County, 2009(Percent of California Total Production)
Milk PricesThe 12-month average price paid to producers was $11.48 per hundredweight (low: $10.01, high: $15.56), down 32 percent from the average prices paid to producers in 2008. The demise of the dairy export market for most of 2009, commodity prices being at or near their USDA support price levels, nonfat dry milk and butter being purchased by the Commodity Credit Corporation, all contributed to the historic low class prices experienced in most of 2009. The government purchase of the commodities was an example of the national market imbalance of milk supply and dairy product demand (partly caused by the economic
27%14%10%10%9%
Average Prices Paid to Producers, 2003-2009
Dol
lars
per
Hun
dred
wei
ght
29%
California Dairy Statistics Annual 2009 5
C A L I F O R N I A
conditions of the fi nancial markets). The last quarter of 2009 brought about subtle positive changes in the commodity prices and class prices slowly inched upward in a positive direction.
Energy and fuel availability and cost were fairly constant throughout 2009. Environmental concerns continue to aff ect both dairy producers and processors here in California and across the U.S.
Government Assistance to ProducersThe federal Milk Income Loss Contract (MILC) program was renewed in 2009 with a new feed cost adjuster added to the formula and low class prices initiated payments to producers for 10 of the 12 months of 2009. The MILC payments to producers for 2009 ranged from $0.37-$2.01 per hundredweight. The CWT Program continued to accept dairy product export bids and completed four rounds of the herd retirement program between December 2008 and December 2009. These four herd retirement programs removed 252,000 cows out of the milking herd and decreased milk production by approximately 5 billion pounds. In addition, the USDA implemented the Dairy Economic Loss Assistance Payment Program authorizing $290 million for loss assistance payments to eligible producers. The USDA Farm Services Agency used the existing data it had on each dairy’s milk production during the six-month period of February to July 2009 which was then doubled to approximate a year’s worth of production. That fi nal total, up to a six million pound cap, received an estimated payment rate of $0.32 per hundredweight.
Hearings and Related IssuesOn November 9, 2009, a public hearing was held on an emergency basis based on industry petitions citing 2009 as being one of the most challenging and devastating years endured by dairy producers. The petitions noted that the near fi nancial ruin brought about by low milk prices and high production costs caused droves of producers to exit the business. One of the petitions cited that California dairy families suff ered severe economic hardship in 2009, have gone out of business or acquired massive debt on top of eroded equity, and have been placed in a fi nancial situation that will take years to repair. The hearing considered increases, both temporary and permanent, in the Class 1, 2, 3, 4a, and 4b prices. As a result of the November 9, 2009 milk pricing hearing, the Department amended the Class 1, 2, 3, 4a and 4b pricing formulas on a temporary basis for the period January 1, 2010 to March 31, 2010 by:
• Increasing the Class 1 price approximately $0.35/cwt. by adding:- $0.0035 per pound to the milk fat
price.- $0.0298 per pound to the milk
solids-not-fat price.- $0.0009 per pound to the milk
fl uid carrier price.
• Increasing the Class 2 and 3 prices approximately $0.25/cwt. by adding:- $0.0205 per pound to both the
milk fat and milk solids-not-fat prices.
• Increasing the Class 4a and 4b prices approximately $0.10/cwt. by adding:- $0.0082 per pound to both
the milk fat and milk solids-not-fat prices.
The estimated eff ect of these changes, on average, increased the monthly pool prices for the three months by approximately $0.155/cwt.
Facts, Highlights, RankingsCalifornia continues to be the leading state in agricultural production for over 50 years and the sales of milk and cream are a major commodity, contributing $4.5 billion in 2009.• California ranked fi rst in
milk production in the U.S., followed in ranking order by: Wisconsin, New York, Idaho, and Pennsylvania.
• California produces 21 percent of the nation’s milk supply.
• Approximately 40 percent of California’s milk production is used to make cheese.
• Sales of fl uid milk in California averaged: 31 percent whole milk, 36 percent reduced-fat milk, 15 percent lowfat milk, and 15 percent skim milk.
6 California Dairy Statistics Annual 2009
C A L I F O R N I A
Cows, Production, Receipts
Cows, Production, ReceiptsU N I T E D S T A T E S
United States, Estimated Number of Milk Cows on Farms,Average Production Per Milk Cow, Total Production on Farms, and
Cash Receipts from Farm Marketing of Dairy Products, 2005-2009 1/, a00, a00,Cow, To
keting oketing o
estio
om om om o
estioe
gg P
ceipts frooe Pceipts fro
ted StateProduct
t f
dted StateProduct
t f
s, Estimon Per Milk
m Farm Mark
s, Estimaion Per Milk m Farm Mark
r otal Proof Dai
r ootal Prodof Dai
ms,5-20ms,5-20
nd9
nd9
C A L I F O R N I A / U. S.
Milk Cows & Heifers That
Have Calved, On Farms Average Production
Per Milk Cow Total Production
On Farms Cash Receipts
From Farm Year
Jan. 1 Total
Annual Average
Milk
Milk Fat Test
Milk
Milk Fat Test
Marketings Of Dairy Products 2/
Thousands Pounds Percent Million Pounds Percent Thousand Dollars 2005 1,760 1,755 21,404 3.67 37,564 3.67 5,226,738 2006 1,780 1,780 21,815 3.68 38,792 3.68 4,496,012 2007 1,813 1,813 22,440 3.68 40,646 3.68 7,332,538 2008 1,844 1,844 22,344 3.68 41,243 3.68 6,922,104 20093/ 1,796 1,796 22,000 3.66 39,512 3.66 4,545,094
1/ USDA/NASS data. 2/ All milk and cream. 3/ Figures for 2009 are preliminary.
Milk Cows & Heifers That Have Calved, On Farms
Average Production Per Milk Cow
Total Production On Farms
Cash Receipts From Farm
Year
Jan. 1 Total
Annual Average
Milk
Milk Fat Test
Milk
Milk Fat Test
Marketings Of Dairy Products 2/
Thousands Pounds Percent Million Pounds Percent Thousand Dollars 2005 9,043 9,041 19,565 3.66 176,929 3.66 26,737,882 2006 9,112 9,112 19,951 3.69 181,798 3.69 23,421,987 2007 9,153 9,153 20,277 3.68 185,654 3.68 35,425,015 2008 9,315 9,315 20,396 3.68 189,992 3.68 34,772,735
20093/ 9,201 9,201 20,576 N/A 189,320 N/A N/A
1/ USDA/NASS data. 2/ All milk and cream.
3/ Figures for 2009 are preliminary. N/A – Unavailable at time of release.
Tables are derived from USDA/NASS statistics. Total milk production figures on all farms includes all milk produced on the farm.
California Estimated Number of Milk Cows on Farms,Average Production Per Milk Cow, Total Production on Farms, and
Cash Receipts from Farm Marketing of Dairy Products, 2005-2009 1/
California Dairy Statistics Annual 2009 7
Total Production on Farms, Estimated Number of Milk Cows on Farms,Average Production Per Milk Cow, Number of Dairies, by State, 2009 1/2/
Cows, Production, Receipts, by State
Average production Rank in Percent of % Change Milk cows per milk cow United States United States
State Milk from 2008 on farms 2/ Milk Milk Production Milk Production
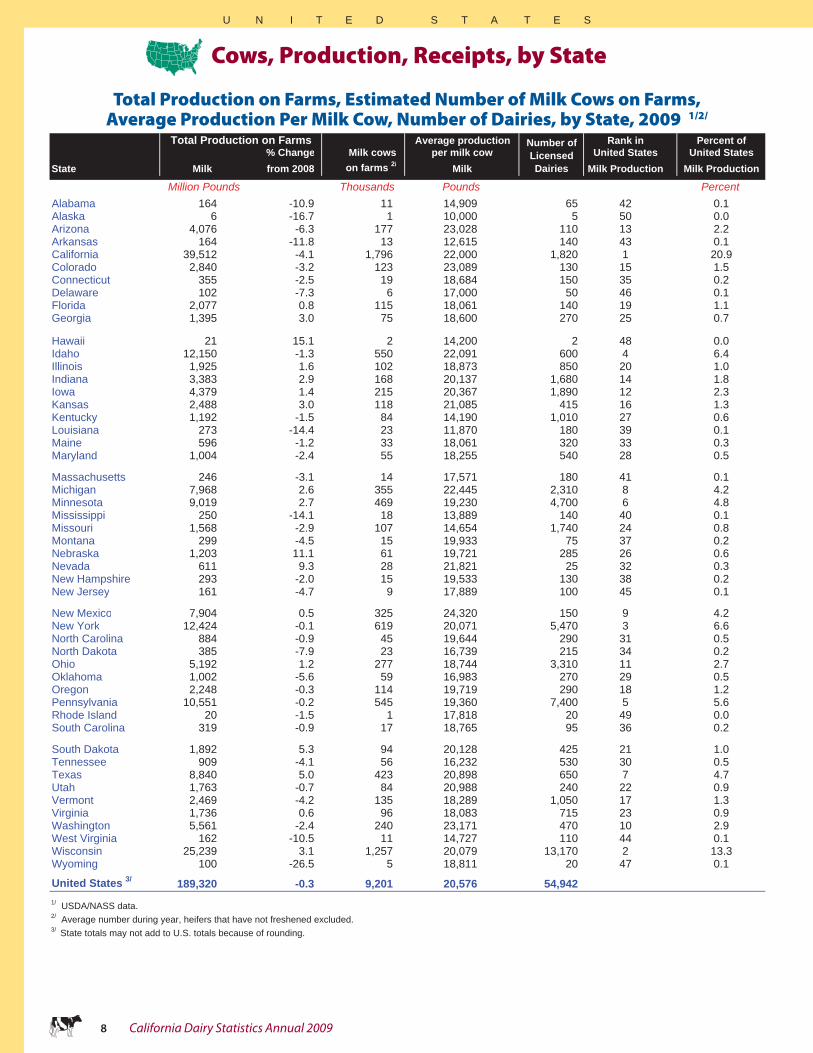
Million Pounds Thousands Pounds PercentAlabama 164 -10.9 11 14,909 65 42 0.1Alaska 6 -16.7 1 10,000 5 50 0.0Arizona 4,076 -6.3 177 23,028 110 13 2.2Arkansas 164 -11.8 13 12,615 140 43 0.1California 39,512 -4.1 1,796 22,000 1,820 1 20.9Colorado 2,840 -3.2 123 23,089 130 15 1.5Connecticut 355 -2.5 19 18,684 150 35 0.2Delaware 102 -7.3 6 17,000 50 46 0.1Florida 2,077 0.8 115 18,061 140 19 1.1Georgia 1,395 3.0 75 18,600 270 25 0.7
Hawaii 21 15.1 2 14,200 2 48 0.0Idaho 12,150 -1.3 550 22,091 600 4 6.4Illinois 1,925 1.6 102 18,873 850 20 1.0Indiana 3,383 2.9 168 20,137 1,680 14 1.8Iowa 4,379 1.4 215 20,367 1,890 12 2.3Kansas 2,488 3.0 118 21,085 415 16 1.3Kentucky 1,192 -1.5 84 14,190 1,010 27 0.6Louisiana 273 -14.4 23 11,870 180 39 0.1Maine 596 -1.2 33 18,061 320 33 0.3Maryland 1,004 -2.4 55 18,255 540 28 0.5
Massachusetts 246 -3.1 14 17,571 180 41 0.1Michigan 7,968 2.6 355 22,445 2,310 8 4.2Minnesota 9,019 2.7 469 19,230 4,700 6 4.8Mississippi 250 -14.1 18 13,889 140 40 0.1Missouri 1,568 -2.9 107 14,654 1,740 24 0.8Montana 299 -4.5 15 19,933 75 37 0.2Nebraska 1,203 11.1 61 19,721 285 26 0.6Nevada 611 9.3 28 21,821 25 32 0.3New Hampshire 293 -2.0 15 19,533 130 38 0.2New Jersey 161 -4.7 9 17,889 100 45 0.1
New Mexico 7,904 0.5 325 24,320 150 9 4.2New York 12,424 -0.1 619 20,071 5,470 3 6.6North Carolina 884 -0.9 45 19,644 290 31 0.5North Dakota 385 -7.9 23 16,739 215 34 0.2Ohio 5,192 1.2 277 18,744 3,310 11 2.7Oklahoma 1,002 -5.6 59 16,983 270 29 0.5Oregon 2,248 -0.3 114 19,719 290 18 1.2Pennsylvania 10,551 -0.2 545 19,360 7,400 5 5.6Rhode Island 20 -1.5 1 17,818 20 49 0.0South Carolina 319 -0.9 17 18,765 95 36 0.2
South Dakota 1,892 5.3 94 20,128 425 21 1.0Tennessee 909 -4.1 56 16,232 530 30 0.5Texas 8,840 5.0 423 20,898 650 7 4.7Utah 1,763 -0.7 84 20,988 240 22 0.9Vermont 2,469 -4.2 135 18,289 1,050 17 1.3Virginia 1,736 0.6 96 18,083 715 23 0.9Washington 5,561 -2.4 240 23,171 470 10 2.9West Virginia 162 -10.5 11 14,727 110 44 0.1Wisconsin 25,239 3.1 1,257 20,079 13,170 2 13.3Wyoming 100 -26.5 5 18,811 20 47 0.1
United States 3/ 189,320 -0.3 9,201 20,576 54,9421/ USDA/NASS data. 2/ Average number during year, heifers that have not freshened excluded.3/ State totals may not add to U.S. totals because of rounding.
Total Production on Farms Number ofLicensedDairies
U N I T E D S T A T E S
8 California Dairy Statistics Annual 2009
Milk Production Per Cow, 2009
U.S. Milk Production, 2009 Percent Change from 2008
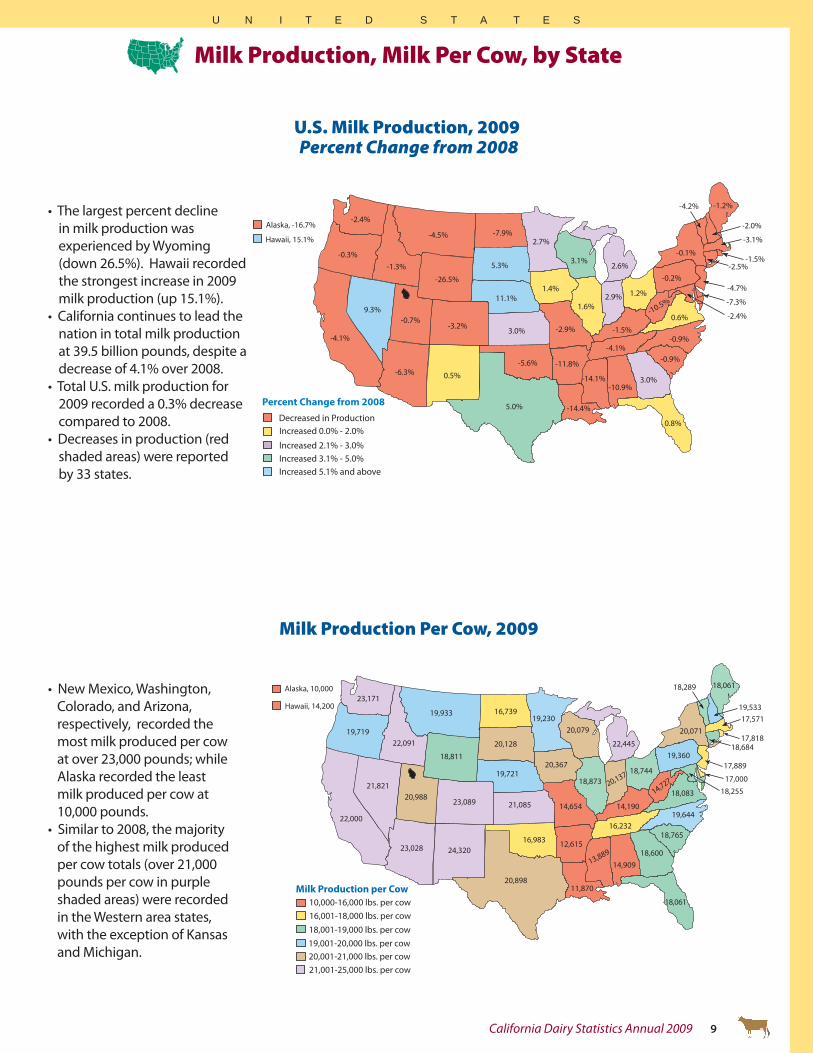
• The largest percent decline in milk production was experienced by Wyoming (down 26.5%). Hawaii recorded the strongest increase in 2009 milk production (up 15.1%).
• California continues to lead the nation in total milk production at 39.5 billion pounds, despite a decrease of 4.1% over 2008.
• Total U.S. milk production for 2009 recorded a 0.3% decrease compared to 2008.
• Decreases in production (red shaded areas) were reported by 33 states.
• New Mexico, Washington, Colorado, and Arizona, respectively, recorded the most milk produced per cow at over 23,000 pounds; while Alaska recorded the least milk produced per cow at 10,000 pounds.
• Similar to 2008, the majority of the highest milk produced per cow totals (over 21,000 pounds per cow in purple shaded areas) were recorded in the Western area states, with the exception of Kansas and Michigan.
Milk Production, Milk Per Cow, by State
-10.9%
-6.3%
-4.1%-3.2%
-2.5%
-7.3%
0.8%
3.0%
1.4%
-1.3%
-4.5%
-2.4%
-0.3%
9.3%-0.7%
-26.5%
0.5%
-7.9%
5.3%
11.1%
3.0%
-5.6%
5.0% -14.4%
-14.1%
-2.9%
-4.1%-0.9%
-0.9%-1.5%
0.6%
2.7%
3.1% 2.6%
1.6% 2.9% 1.2%
-0.1%
-10.5%
-0.2%
-1.2%
-4.7%
-2.4%
-1.5%
-3.1%
-4.2%
-2.0%
Decreased in Production Increased 0.0% - 2.0%
Increased 2.1% - 3.0%Increased 3.1% - 5.0%Increased 5.1% and above
-11.8%
Alaska, -16.7%
Hawaii, 15.1%
Percent Change from 2008
14,909
23,028
22,000
23,089
18,684
17,000
18,061
18,600
20,367
22,091
19,933
23,171
19,719
21,82120,988
18,811
24,320
16,739
20,128
19,721
21,085
16,983
20,89811,870
13,889
14,654
16,23219,644
18,765
14,190
18,083
19,23020,079
22,445
18,873 20,137 18,744
20,071
14,727
19,360
18,061
17,889
18,255
17,818
17,571
18,289
19,533
12,615
Alaska, 10,000 Hawaii, 14,200
10,000-16,000 lbs. per cow16,001-18,000 lbs. per cow 18,001-19,000 lbs. per cow19,001-20,000 lbs. per cow20,001-21,000 lbs. per cow
Milk Production per Cow
21,001-25,000 lbs. per cow
U N I T E D S T A T E S
California Dairy Statistics Annual 2009 9

39.5 billion pounds. The majority of the milk, 95.5 percent, was market grade (Grade A), with the remaining 4.5 percent manufacturing grade (Grade B). A portion of the manufacturing grade milk was produced by traditionally market grade dairies that, for pricing or regulatory reasons, made the decision to operate as manufacturing grade facilities.
The 26 milk-producing counties of the northern California region accounted for 92 percent of the
alifornia total milk production decreased 4.1 percent in 2009 to
California Milk ProductionAverage Daily Basis, 2005-2009
90
95
100
105
110
115
120
JAN FEB MAR APR MAY JUN JUL AUG SEP OCT NOV DEC
2005 2006 2007 2008 2009
Prod
uctio
n (m
illio
n lb
s/da
y)
C
California’s Commercial Milk Production
C A L I F O R N I A
The chart to the left represents the production of milk, in millions of pounds per day, on a monthly basis, January 2005 through December 2009.
market milk and 99 percent of the manufacturing milk produced commercially during 2009.
The fi ve leading counties in total milk production for 2009, in ranking order, were: Tulare (27 percent), Merced (14 percent); Kings (10 percent); Stanislaus (10 percent); and Kern (9 percent). These fi ve counties accounted for 71 percent of California’s total market milk production.
The fi ve leading counties in manufacturing milk production,
in ranking order, were: Merced (44 percent); Stanislaus (31 percent); San Joaquin (6 percent); Tulare (4 percent); and Tehama (4 percent). These fi ve counties accounted for 88 percent of California’s total manufacturing milk production.
10 California Dairy Statistics Annual 2009

Cows, Dairies, Cows Per Dairy: by County
Number of Milk Cows and Heifers that have Calved on Farms,Number of Dairies, and Average Number of Cows per Dairy
in California, by County and Region, 2008 and 2009
Cows, Dairies, Cows Per Dairy, by County
Average Average Number Number Number Number Number Number
County and Region 1/ Cows Dairies 2/ Cows/Dairy Cows Dairies 2/ Cows/Dairy
Butte 257 3 86 247 3 82Del Norte 4,340 9 482 4,099 9 455Fresno 120,299 109 1,104 115,716 102 1,134Glenn 19,356 46 421 17,519 42 417Humboldt 15,260 70 218 15,585 69 226Kern 176,643 54 3,271 167,309 53 3,157Kings 4/ 183,809 156 1,178 181,243 150 1,208Madera 79,810 56 1,425 73,747 55 1,341Marin 10,203 27 378 9,284 23 404Mendocino 3/ 2 2Merced 265,660 297 894 261,529 268 976Monterey 3/ 1,449 3 483 2Placer 3/ 1 0Sacramento 16,662 39 427 15,473 34 455San Benito 634 4 159 527 3 176San Joaquin 4/ 111,231 127 876 101,444 125 812
Santa Cruz 3/ 1 0
Shasta 1 1Siskiyou 682 3 227 636 3 212Solano 3/ 4,333 3 1,444 2Sonoma 27,262 69 395 26,538 69 385Stanislaus 183,316 272 674 180,020 259 695
Sutter 3/ 1 1Tehama 4,003 15 267 4,802 15 320Tulare 493,383 329 1,500 493,292 319 1,546Yolo 3/ 2,279 3 760 2Yuba 3,097 4 774 3,117 4 779Northern California 1,726,903 1,704 1,013 1,681,404 1,615 1,041
Imperial 7,547 4 1,887 7,500 4 1,875
Los Angeles 3/ 1 1Riverside 51,326 37 1,387 47,856 35 1,367San Bernardino 88,404 99 893 77,101 90 857San Diego 3,805 5 761 2,572 4 643
San Luis Obispo 3/ 1 1
Santa Barbara 3/ 4/ 1 2Southern California 155,843 148 1,053 139,538 137 1,019
STATE TOTALS 1,882,746 1,852 1,017 1,820,942 1,752 1,039
1/ Counties omitted have no reported milk production.2/ Number of dairies source is Milk and Dairy Foods Control.3/ Not published, but included in total.4/ Includes prison dairies.
2008 2009
C A L I F O R N I A
California Dairy Statistics Annual 2009 11
mercial Production of Bulk Milk
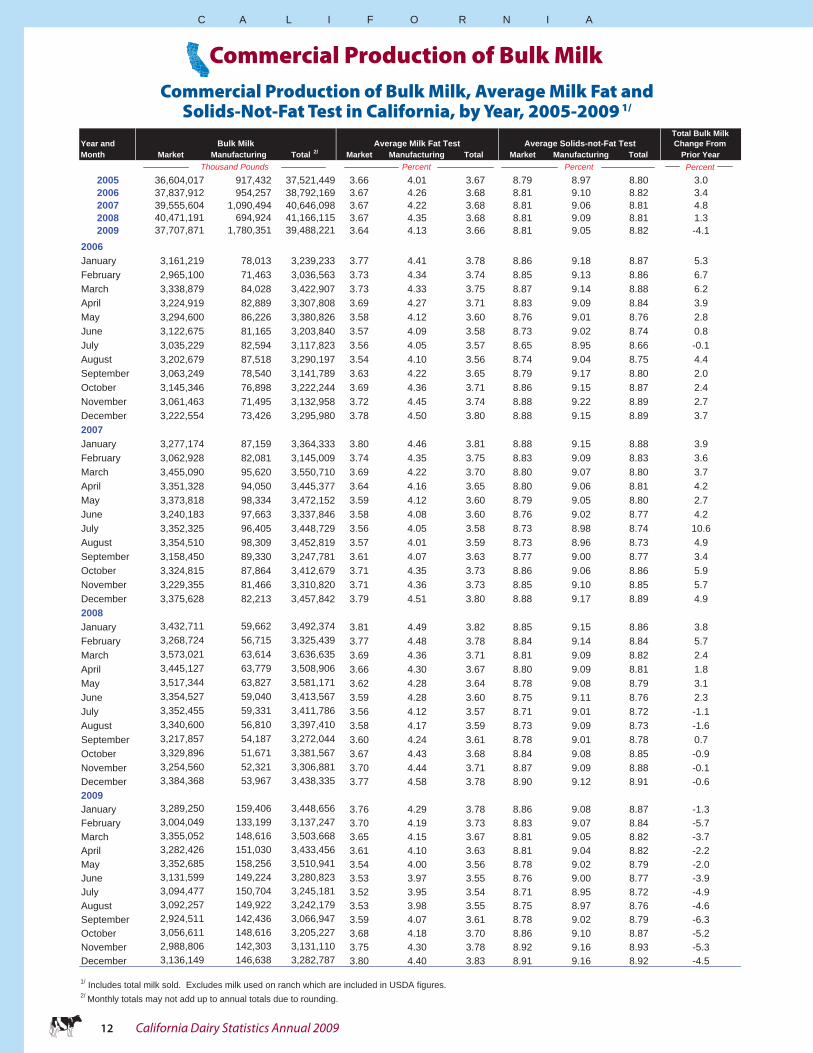
Commercial Production of Bulk Milk, Average Milk Fat andSolids-Not-Fat Test in California, by Year, 2005-2009 1/
Commercial Production of Bulk Milk
Total Bulk MilkYear and Change FromMonth Market Manufacturing Total 2/ Market Manufacturing Total Market Manufacturing Total Prior Year
Percent2005 36,604,017 917,432 37,521,449 3.66 4.01 3.67 8.79 8.97 8.80 3.02006 37,837,912 954,257 38,792,169 3.67 4.26 3.68 8.81 9.10 8.82 3.42007 39,555,604 1,090,494 40,646,098 3.67 4.22 3.68 8.81 9.06 8.81 4.82008 40,471,191 694,924 41,166,115 3.67 4.35 3.68 8.81 9.09 8.81 1.32009 37,707,871 1,780,351 39,488,221 3.64 4.13 3.66 8.81 9.05 8.82 -4.1
2006January 3,161,219 78,013 3,239,233 3.77 4.41 3.78 8.86 9.18 8.87 5.3February 2,965,100 71,463 3,036,563 3.73 4.34 3.74 8.85 9.13 8.86 6.7March 3,338,879 84,028 3,422,907 3.73 4.33 3.75 8.87 9.14 8.88 6.2April 3,224,919 82,889 3,307,808 3.69 4.27 3.71 8.83 9.09 8.84 3.9May 3,294,600 86,226 3,380,826 3.58 4.12 3.60 8.76 9.01 8.76 2.8June 3,122,675 81,165 3,203,840 3.57 4.09 3.58 8.73 9.02 8.74 0.8July 3,035,229 82,594 3,117,823 3.56 4.05 3.57 8.65 8.95 8.66 -0.1August 3,202,679 87,518 3,290,197 3.54 4.10 3.56 8.74 9.04 8.75 4.4September 3,063,249 78,540 3,141,789 3.63 4.22 3.65 8.79 9.17 8.80 2.0October 3,145,346 76,898 3,222,244 3.69 4.36 3.71 8.86 9.15 8.87 2.4November 3,061,463 71,495 3,132,958 3.72 4.45 3.74 8.88 9.22 8.89 2.7December 3,222,554 73,426 3,295,980 3.78 4.50 3.80 8.88 9.15 8.89 3.72007January 3,277,174 87,159 3,364,333 3.80 4.46 3.81 8.88 9.15 8.88 3.9February 3,062,928 82,081 3,145,009 3.74 4.35 3.75 8.83 9.09 8.83 3.6March 3,455,090 95,620 3,550,710 3.69 4.22 3.70 8.80 9.07 8.80 3.7April 3,351,328 94,050 3,445,377 3.64 4.16 3.65 8.80 9.06 8.81 4.2May 3,373,818 98,334 3,472,152 3.59 4.12 3.60 8.79 9.05 8.80 2.7June 3,240,183 97,663 3,337,846 3.58 4.08 3.60 8.76 9.02 8.77 4.2July 3,352,325 96,405 3,448,729 3.56 4.05 3.58 8.73 8.98 8.74 10.6August 3,354,510 98,309 3,452,819 3.57 4.01 3.59 8.73 8.96 8.73 4.9September 3,158,450 89,330 3,247,781 3.61 4.07 3.63 8.77 9.00 8.77 3.4October 3,324,815 87,864 3,412,679 3.71 4.35 3.73 8.86 9.06 8.86 5.9November 3,229,355 81,466 3,310,820 3.71 4.36 3.73 8.85 9.10 8.85 5.7December 3,375,628 82,213 3,457,842 3.79 4.51 3.80 8.88 9.17 8.89 4.92008January 3,432,711 59,662 3,492,374 3.81 4.49 3.82 8.85 9.15 8.86 3.8February 3,268,724 56,715 3,325,439 3.77 4.48 3.78 8.84 9.14 8.84 5.7March 3,573,021 63,614 3,636,635 3.69 4.36 3.71 8.81 9.09 8.82 2.4April 3,445,127 63,779 3,508,906 3.66 4.30 3.67 8.80 9.09 8.81 1.8May 3,517,344 63,827 3,581,171 3.62 4.28 3.64 8.78 9.08 8.79 3.1June 3,354,527 59,040 3,413,567 3.59 4.28 3.60 8.75 9.11 8.76 2.3July 3,352,455 59,331 3,411,786 3.56 4.12 3.57 8.71 9.01 8.72 -1.1August 3,340,600 56,810 3,397,410 3.58 4.17 3.59 8.73 9.09 8.73 -1.6September 3,217,857 54,187 3,272,044 3.60 4.24 3.61 8.78 9.01 8.78 0.7October 3,329,896 51,671 3,381,567 3.67 4.43 3.68 8.84 9.08 8.85 -0.9November 3,254,560 52,321 3,306,881 3.70 4.44 3.71 8.87 9.09 8.88 -0.1December 3,384,368 53,967 3,438,335 3.77 4.58 3.78 8.90 9.12 8.91 -0.62009January 3,289,250 159,406 3,448,656 3.76 4.29 3.78 8.86 9.08 8.87 -1.3February 3,004,049 133,199 3,137,247 3.70 4.19 3.73 8.83 9.07 8.84 -5.7March 3,355,052 148,616 3,503,668 3.65 4.15 3.67 8.81 9.05 8.82 -3.7April 3,282,426 151,030 3,433,456 3.61 4.10 3.63 8.81 9.04 8.82 -2.2May 3,352,685 158,256 3,510,941 3.54 4.00 3.56 8.78 9.02 8.79 -2.0June 3,131,599 149,224 3,280,823 3.53 3.97 3.55 8.76 9.00 8.77 -3.9July 3,094,477 150,704 3,245,181 3.52 3.95 3.54 8.71 8.95 8.72 -4.9August 3,092,257 149,922 3,242,179 3.53 3.98 3.55 8.75 8.97 8.76 -4.6September 2,924,511 142,436 3,066,947 3.59 4.07 3.61 8.78 9.02 8.79 -6.3October 3,056,611 148,616 3,205,227 3.68 4.18 3.70 8.86 9.10 8.87 -5.2November 2,988,806 142,303 3,131,110 3.75 4.30 3.78 8.92 9.16 8.93 -5.3December 3,136,149 146,638 3,282,787 3.80 4.40 3.83 8.91 9.16 8.92 -4.5
1/ Includes total milk sold. Excludes milk used on ranch which are included in USDA figures.2/ Monthly totals may not add up to annual totals due to rounding.
Bulk Milk
Thousand Pounds
Average Milk Fat Test Average Solids-not-Fat Test
Percent Percent
C A L I F O R N I A
12 California Dairy Statistics Annual 2009

Commercial Production of Bulk Milk, Average Milk Fat, and Solids-Not-Fat Test in California, by County and Region, 2009 1/
Cows, Dairies, Cows Per Da
State County and Region 2/ Market Manufacturing Total Market Manufacturing Total Market Manufacturing Total Rank
Butte 5,044 358 5,402 4.28 3.77 4.24 9.17 8.38 9.12 31Del Norte 52,465 9,952 62,417 3.94 4.79 4.08 8.80 9.28 8.87 20Fresno 2,564,101 11,796 2,575,897 3.63 4.37 3.63 8.82 9.18 8.83 6Glenn 367,289 15,266 382,555 3.60 3.78 3.60 8.81 8.82 8.81 12Humboldt 192,161 45,152 237,312 4.12 4.59 4.21 8.91 9.24 8.97 14Kern 3,653,300 2,681 3,655,981 3.61 3.62 3.61 8.76 8.74 8.76 5Kings 3,908,567 29,798 3,938,365 3.63 4.19 3.64 8.79 9.12 8.79 3Madera 1,553,245 57,117 1,610,362 3.62 4.31 3.64 8.80 9.14 8.81 9Marin 182,179 0 182,179 3.53 3.53 8.89 8.89 15Mendocino 4/ 25Merced 4,924,993 785,812 5,710,805 3.63 4.36 3.73 8.84 9.17 8.88 2Monterey 4/ 26Placer 4/ 30Sacramento 328,053 9,818 337,871 3.72 3.89 3.73 8.82 8.98 8.82 13San Benito 11,507 0 11,507 3.93 3.93 8.80 8.80 28San Joaquin 2,115,867 99,286 2,215,153 3.63 3.70 3.63 8.80 8.87 8.80 7Shasta 4/ 33Siskiyou 13,888 0 13,888 3.75 3.75 8.81 8.81 27Solano 4/ 18Sonoma 519,940 791 520,731 3.71 3.54 3.71 8.90 8.73 8.90 11Stanislaus 3,388,766 542,195 3,930,961 3.66 3.82 3.68 8.82 8.92 8.83 4Sutter 4/ 29Tehama 41,239 63,608 104,847 3.67 4.08 3.92 8.87 9.06 8.99 17Tulare 10,712,216 67,074 10,779,290 3.66 4.21 3.66 8.83 8.90 8.83 1Yolo 4/ 24Yuba 68,009 43 68,053 3.88 4.46 3.88 8.90 9.20 8.90 19Northern California 34,763,273 1,779,790 36,543,062 3.65 4.13 3.67 8.82 9.05 8.83
Imperial 141,481 0 141,481 3.80 3.80 8.97 8.97 16Los Angeles 4/ 23Riverside 1,015,872 23 1,015,895 3.57 3.83 3.57 8.79 8.87 8.79 10San Bernardino 1,636,160 538 1,636,698 3.50 3.97 3.50 8.78 9.03 8.78 8San Diego 54,607 0 54,607 3.43 3.43 8.73 8.73 21San Luis Obispo 4/ 32Santa Barbara 4/ 22Southern California 2,944,598 561 2,945,159 3.54 3.97 3.54 8.79 9.02 8.79
STATE TOTALS 37,707,871 1,780,351 39,488,221 3.64 4.13 3.66 8.81 9.05 8.82
1/ Includes total milk sold. Excludes milk used on ranch.2/ Counties omittted have no reported milk production.3/ Tests were computed from unrounded data.4/ Not published, but included in total.
Percent
Average Solids-not-Fat Test 3/
Thousand Pounds
Bulk Milk
Percent
Average Milk Fat Test 3/
Commercial Production of Bulk Milk, by County
C A L I F O R N I A
California Dairy Statistics Annual 2009 13
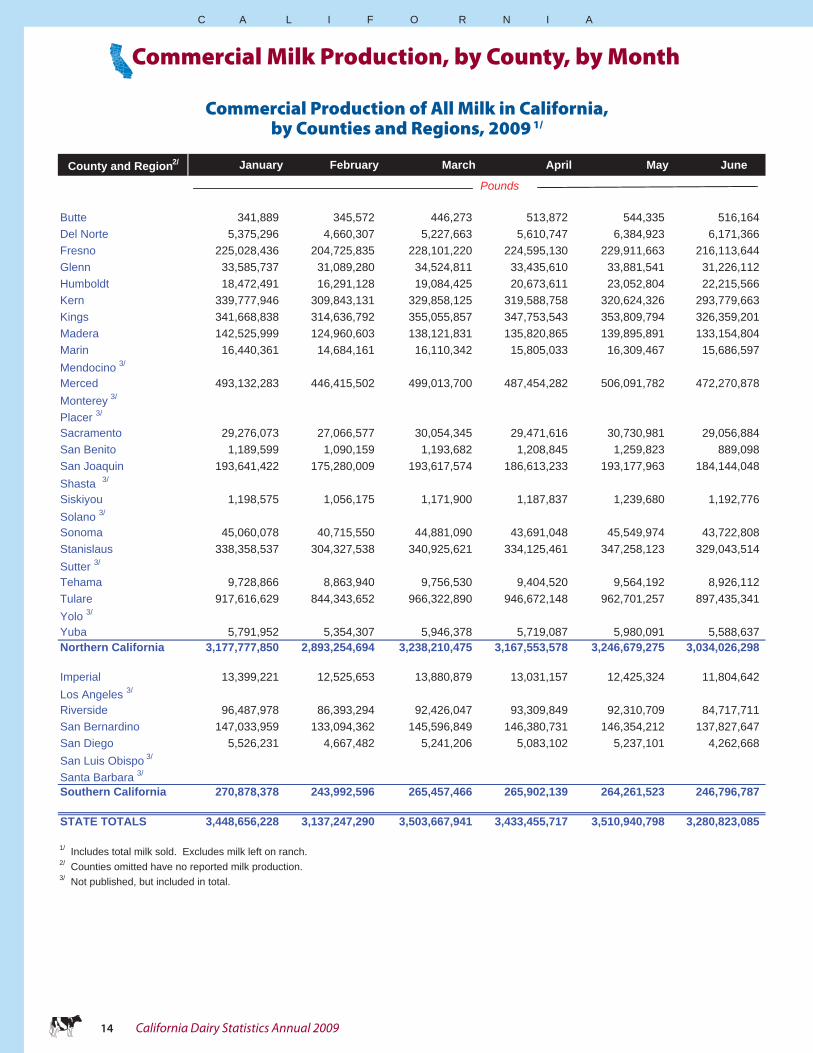
Commercial Production of All Milk in California,by Counties and Regions, 2009 1/
County and Region2/ January February March April May June
Pounds
Butte 341,889 345,572 446,273 513,872 544,335 516,164Del Norte 5,375,296 4,660,307 5,227,663 5,610,747 6,384,923 6,171,366Fresno 225,028,436 204,725,835 228,101,220 224,595,130 229,911,663 216,113,644Glenn 33,585,737 31,089,280 34,524,811 33,435,610 33,881,541 31,226,112Humboldt 18,472,491 16,291,128 19,084,425 20,673,611 23,052,804 22,215,566Kern 339,777,946 309,843,131 329,858,125 319,588,758 320,624,326 293,779,663Kings 341,668,838 314,636,792 355,055,857 347,753,543 353,809,794 326,359,201Madera 142,525,999 124,960,603 138,121,831 135,820,865 139,895,891 133,154,804Marin 16,440,361 14,684,161 16,110,342 15,805,033 16,309,467 15,686,597Mendocino 3/
Merced 493,132,283 446,415,502 499,013,700 487,454,282 506,091,782 472,270,878Monterey 3/
Placer 3/
Sacramento 29,276,073 27,066,577 30,054,345 29,471,616 30,730,981 29,056,884San Benito 1,189,599 1,090,159 1,193,682 1,208,845 1,259,823 889,098San Joaquin 193,641,422 175,280,009 193,617,574 186,613,233 193,177,963 184,144,048Shasta 3/
Siskiyou 1,198,575 1,056,175 1,171,900 1,187,837 1,239,680 1,192,776Solano 3/
Sonoma 45,060,078 40,715,550 44,881,090 43,691,048 45,549,974 43,722,808Stanislaus 338,358,537 304,327,538 340,925,621 334,125,461 347,258,123 329,043,514Sutter 3/
Tehama 9,728,866 8,863,940 9,756,530 9,404,520 9,564,192 8,926,112Tulare 917,616,629 844,343,652 966,322,890 946,672,148 962,701,257 897,435,341Yolo 3/
Yuba 5,791,952 5,354,307 5,946,378 5,719,087 5,980,091 5,588,637Northern California 3,177,777,850 2,893,254,694 3,238,210,475 3,167,553,578 3,246,679,275 3,034,026,298
Imperial 13,399,221 12,525,653 13,880,879 13,031,157 12,425,324 11,804,642Los Angeles 3/
Riverside 96,487,978 86,393,294 92,426,047 93,309,849 92,310,709 84,717,711San Bernardino 147,033,959 133,094,362 145,596,849 146,380,731 146,354,212 137,827,647San Diego 5,526,231 4,667,482 5,241,206 5,083,102 5,237,101 4,262,668San Luis Obispo 3/
Santa Barbara 3/
Southern California 270,878,378 243,992,596 265,457,466 265,902,139 264,261,523 246,796,787 STATE TOTALS 3,448,656,228 3,137,247,290 3,503,667,941 3,433,455,717 3,510,940,798 3,280,823,085
1/ Includes total milk sold. Excludes milk left on ranch.2/ Counties omitted have no reported milk production.3/ Not published, but included in total.
Commercial Milk Production, by County, by Month
C A L I F O R N I A
14 California Dairy Statistics Annual 2009
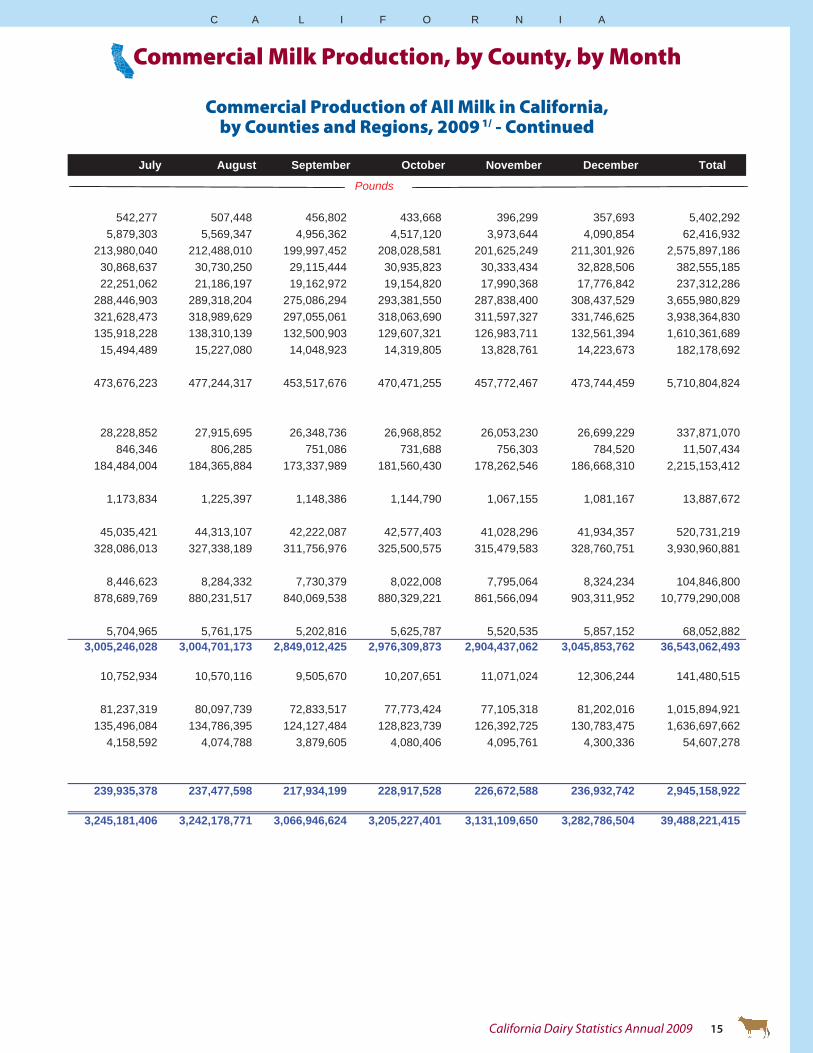
Commercial Production of All Milk in California,by Counties and Regions, 2009 1/ - Continued
Commercial Milk Production, by County, by MonthJuly August September October November December Total
Pounds
542,277 507,448 456,802 433,668 396,299 357,693 5,402,2925,879,303 5,569,347 4,956,362 4,517,120 3,973,644 4,090,854 62,416,932
213,980,040 212,488,010 199,997,452 208,028,581 201,625,249 211,301,926 2,575,897,18630,868,637 30,730,250 29,115,444 30,935,823 30,333,434 32,828,506 382,555,18522,251,062 21,186,197 19,162,972 19,154,820 17,990,368 17,776,842 237,312,286
288,446,903 289,318,204 275,086,294 293,381,550 287,838,400 308,437,529 3,655,980,829321,628,473 318,989,629 297,055,061 318,063,690 311,597,327 331,746,625 3,938,364,830135,918,228 138,310,139 132,500,903 129,607,321 126,983,711 132,561,394 1,610,361,68915,494,489 15,227,080 14,048,923 14,319,805 13,828,761 14,223,673 182,178,692
473,676,223 477,244,317 453,517,676 470,471,255 457,772,467 473,744,459 5,710,804,824
28,228,852 27,915,695 26,348,736 26,968,852 26,053,230 26,699,229 337,871,070846,346 806,285 751,086 731,688 756,303 784,520 11,507,434
184,484,004 184,365,884 173,337,989 181,560,430 178,262,546 186,668,310 2,215,153,412
1,173,834 1,225,397 1,148,386 1,144,790 1,067,155 1,081,167 13,887,672
45,035,421 44,313,107 42,222,087 42,577,403 41,028,296 41,934,357 520,731,219328,086,013 327,338,189 311,756,976 325,500,575 315,479,583 328,760,751 3,930,960,881
8,446,623 8,284,332 7,730,379 8,022,008 7,795,064 8,324,234 104,846,800878,689,769 880,231,517 840,069,538 880,329,221 861,566,094 903,311,952 10,779,290,008
5,704,965 5,761,175 5,202,816 5,625,787 5,520,535 5,857,152 68,052,8823,005,246,028 3,004,701,173 2,849,012,425 2,976,309,873 2,904,437,062 3,045,853,762 36,543,062,493
10,752,934 10,570,116 9,505,670 10,207,651 11,071,024 12,306,244 141,480,515
81,237,319 80,097,739 72,833,517 77,773,424 77,105,318 81,202,016 1,015,894,921135,496,084 134,786,395 124,127,484 128,823,739 126,392,725 130,783,475 1,636,697,662
4,158,592 4,074,788 3,879,605 4,080,406 4,095,761 4,300,336 54,607,278
239,935,378 237,477,598 217,934,199 228,917,528 226,672,588 236,932,742 2,945,158,922
3,245,181,406 3,242,178,771 3,066,946,624 3,205,227,401 3,131,109,650 3,282,786,504 39,488,221,415
Commercial Milk Production, by County, by Month
C A L I F O R N I A
California Dairy Statistics Annual 2009 15
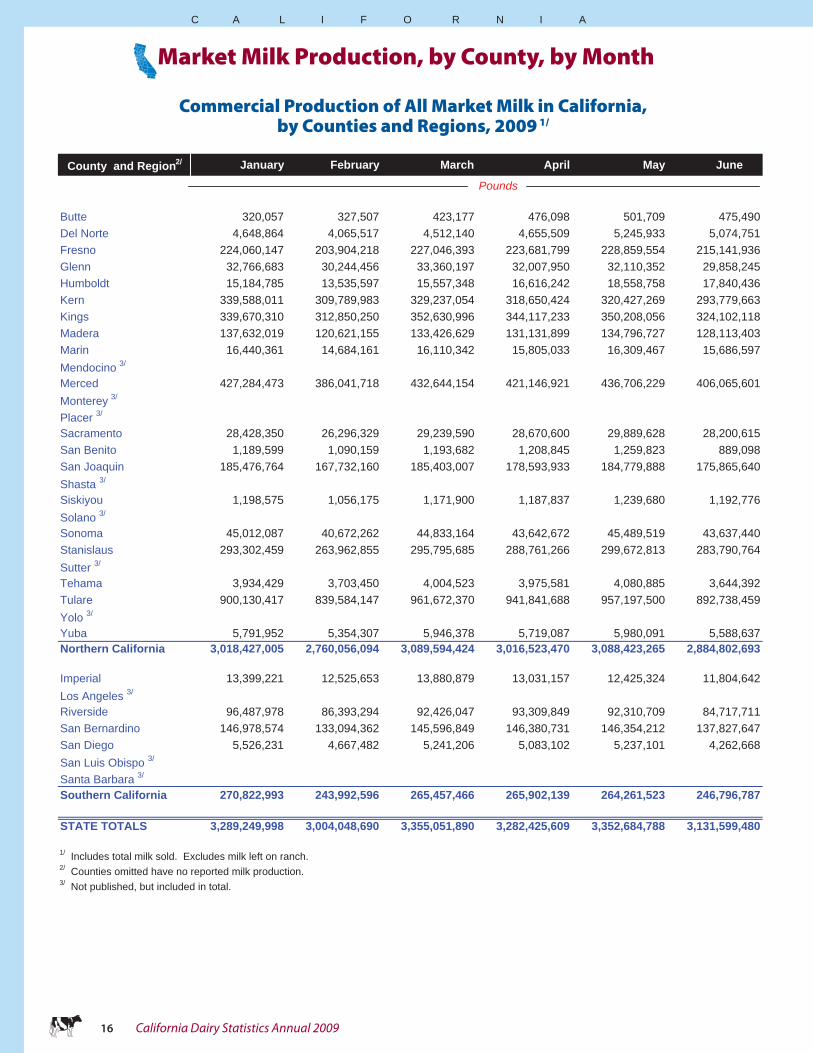
Commercial Production of All Market Milk in California,by Counties and Regions, 2009 1/
County and Region2/ January February March April May June
Pounds
Butte 320,057 327,507 423,177 476,098 501,709 475,490Del Norte 4,648,864 4,065,517 4,512,140 4,655,509 5,245,933 5,074,751Fresno 224,060,147 203,904,218 227,046,393 223,681,799 228,859,554 215,141,936Glenn 32,766,683 30,244,456 33,360,197 32,007,950 32,110,352 29,858,245Humboldt 15,184,785 13,535,597 15,557,348 16,616,242 18,558,758 17,840,436Kern 339,588,011 309,789,983 329,237,054 318,650,424 320,427,269 293,779,663Kings 339,670,310 312,850,250 352,630,996 344,117,233 350,208,056 324,102,118Madera 137,632,019 120,621,155 133,426,629 131,131,899 134,796,727 128,113,403Marin 16,440,361 14,684,161 16,110,342 15,805,033 16,309,467 15,686,597Mendocino 3/
Merced 427,284,473 386,041,718 432,644,154 421,146,921 436,706,229 406,065,601Monterey 3/
Placer 3/
Sacramento 28,428,350 26,296,329 29,239,590 28,670,600 29,889,628 28,200,615San Benito 1,189,599 1,090,159 1,193,682 1,208,845 1,259,823 889,098San Joaquin 185,476,764 167,732,160 185,403,007 178,593,933 184,779,888 175,865,640Shasta 3/
Siskiyou 1,198,575 1,056,175 1,171,900 1,187,837 1,239,680 1,192,776Solano 3/
Sonoma 45,012,087 40,672,262 44,833,164 43,642,672 45,489,519 43,637,440Stanislaus 293,302,459 263,962,855 295,795,685 288,761,266 299,672,813 283,790,764Sutter 3/
Tehama 3,934,429 3,703,450 4,004,523 3,975,581 4,080,885 3,644,392Tulare 900,130,417 839,584,147 961,672,370 941,841,688 957,197,500 892,738,459Yolo 3/
Yuba 5,791,952 5,354,307 5,946,378 5,719,087 5,980,091 5,588,637Northern California 3,018,427,005 2,760,056,094 3,089,594,424 3,016,523,470 3,088,423,265 2,884,802,693
Imperial 13,399,221 12,525,653 13,880,879 13,031,157 12,425,324 11,804,642Los Angeles 3/
Riverside 96,487,978 86,393,294 92,426,047 93,309,849 92,310,709 84,717,711San Bernardino 146,978,574 133,094,362 145,596,849 146,380,731 146,354,212 137,827,647San Diego 5,526,231 4,667,482 5,241,206 5,083,102 5,237,101 4,262,668San Luis Obispo 3/
Santa Barbara 3/
Southern California 270,822,993 243,992,596 265,457,466 265,902,139 264,261,523 246,796,787
STATE TOTALS 3,289,249,998 3,004,048,690 3,355,051,890 3,282,425,609 3,352,684,788 3,131,599,480
1/ Includes total milk sold. Excludes milk left on ranch.2/ Counties omitted have no reported milk production.3/ Not published, but included in total.
Market Milk Production, by County, by Month
C A L I F O R N I A
16 California Dairy Statistics Annual 2009

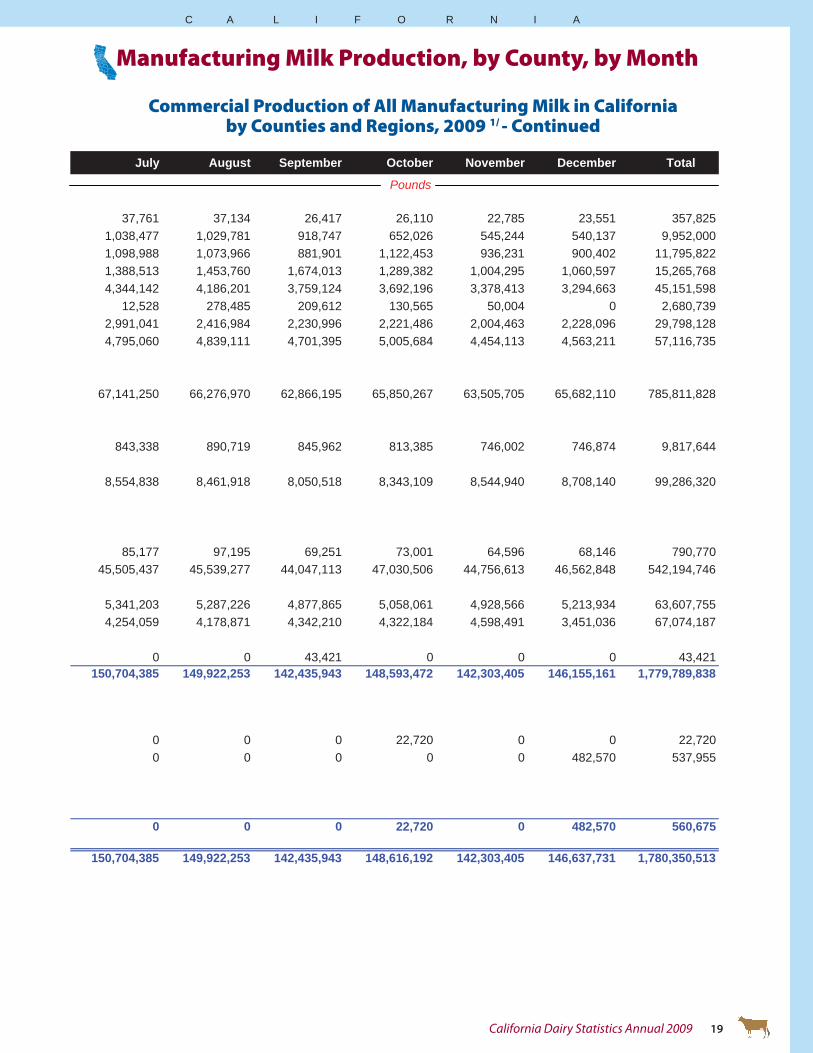
Commercial Production of All Market Milk in California,by Counties and Regions, 2009 1/ - Continued
July August September October November December Total
Pounds
504,516 470,314 430,385 407,558 373,514 334,142 5,044,4674,840,826 4,539,566 4,037,615 3,865,094 3,428,400 3,550,717 52,464,932
212,881,052 211,414,044 199,115,551 206,906,128 200,689,018 210,401,524 2,564,101,36429,480,124 29,276,490 27,441,431 29,646,441 29,329,139 31,767,909 367,289,41717,906,920 16,999,996 15,403,848 15,462,624 14,611,955 14,482,179 192,160,688
288,434,375 289,039,719 274,876,682 293,250,985 287,788,396 308,437,529 3,653,300,090318,637,432 316,572,645 294,824,065 315,842,204 309,592,864 329,518,529 3,908,566,702131,123,168 133,471,028 127,799,508 124,601,637 122,529,598 127,998,183 1,553,244,95415,494,489 15,227,080 14,048,923 14,319,805 13,828,761 14,223,673 182,178,692
406,534,973 410,967,347 390,651,481 404,620,988 394,266,762 408,062,349 4,924,992,996
27,385,514 27,024,976 25,502,774 26,155,467 25,307,228 25,952,355 328,053,426846,346 806,285 751,086 731,688 756,303 784,520 11,507,434
175,929,166 175,903,966 165,287,471 173,217,321 169,717,606 177,960,170 2,115,867,092
1,173,834 1,225,397 1,148,386 1,144,790 1,067,155 1,081,167 13,887,672
44,950,244 44,215,912 42,152,836 42,504,402 40,963,700 41,866,211 519,940,449282,580,576 281,798,912 267,709,863 278,470,069 270,722,970 282,197,903 3,388,766,135
3,105,420 2,997,106 2,852,514 2,963,947 2,866,498 3,110,300 41,239,045874,435,710 876,052,646 835,727,328 876,007,037 856,967,603 899,860,916 10,712,215,821
5,704,965 5,761,175 5,159,395 5,625,787 5,520,535 5,857,152 68,009,4612,854,541,643 2,854,778,920 2,706,576,482 2,827,716,401 2,762,133,657 2,899,698,601 34,763,272,655
10,752,934 10,570,116 9,505,670 10,207,651 11,071,024 12,306,244 141,480,515
81,237,319 80,097,739 72,833,517 77,750,704 77,105,318 81,202,016 1,015,872,201135,496,084 134,786,395 124,127,484 128,823,739 126,392,725 130,300,905 1,636,159,707
4,158,592 4,074,788 3,879,605 4,080,406 4,095,761 4,300,336 54,607,278
239,935,378 237,477,598 217,934,199 228,894,808 226,672,588 236,450,172 2,944,598,247
3,094,477,021 3,092,256,518 2,924,510,681 3,056,611,209 2,988,806,245 3,136,148,773 37,707,870,902
Market Milk Production, by County, by Month
C A L I F O R N I A
California Dairy Statistics Annual 2009 17

Commercial Production of All Manufacturing Milk in California,by Counties and Regions, 2009 1/
County and Region 2/ January February March April May June
Pounds
Butte 21,832 18,065 23,096 37,774 42,626 40,674Del Norte 726,432 594,790 715,523 955,238 1,138,990 1,096,615Fresno 968,289 821,617 1,054,827 913,331 1,052,109 971,708Glenn 819,054 844,824 1,164,614 1,427,660 1,771,189 1,367,867Humboldt 3,287,706 2,755,531 3,527,077 4,057,369 4,494,046 4,375,130Kern 189,935 53,148 621,071 938,334 197,057 0Kings 1,998,528 1,786,542 2,424,861 3,636,310 3,601,738 2,257,083Madera 4,893,980 4,339,448 4,695,202 4,688,966 5,099,164 5,041,401MarinMendocino 3/
Merced 65,847,810 60,373,784 66,369,546 66,307,361 69,385,553 66,205,277Monterey 3/
Placer 3/
Sacramento 847,723 770,248 814,755 801,016 841,353 856,269San BenitoSan Joaquin 8,164,658 7,547,849 8,214,567 8,019,300 8,398,075 8,278,408Shasta 3/
SiskiyouSolano 3/
Sonoma 47,991 43,288 47,926 48,376 60,455 85,368Stanislaus 45,056,078 40,364,683 45,129,936 45,364,195 47,585,310 45,252,750Sutter 3/
Tehama 5,794,437 5,160,490 5,752,007 5,428,939 5,483,307 5,281,720Tulare 17,486,212 4,759,505 4,650,520 4,830,460 5,503,757 4,696,882Yolo 3/
Yuba 0 0 0 0 0 0Northern California 159,350,845 133,198,600 148,616,051 151,030,108 158,256,010 149,223,605
Imperial Los Angeles 3/
Riverside 0 0 0 0 0 0San Bernardino 55,385 0 0 0 0 0San DiegoSan Luis Obispo 3/
Santa Barbara 3/
Southern California 55,385 0 0 0 0 0
STATE TOTALS 159,406,230 133,198,600 148,616,051 151,030,108 158,256,010 149,223,605
1/ Includes total milk sold. Excludes milk left on ranch.2/ Counties omitted have no reported milk production.3/ Not published, but included in total.
Manufacturing Milk Production, by County, by Month
C A L I F O R N I A
18 California Dairy Statistics Annual 2009
Commercial Production of All Manufacturing Milk in Californiaby Counties and Regions, 2009 1/ - Continued
July August September October November December Total
Pounds
37,761 37,134 26,417 26,110 22,785 23,551 357,8251,038,477 1,029,781 918,747 652,026 545,244 540,137 9,952,0001,098,988 1,073,966 881,901 1,122,453 936,231 900,402 11,795,8221,388,513 1,453,760 1,674,013 1,289,382 1,004,295 1,060,597 15,265,7684,344,142 4,186,201 3,759,124 3,692,196 3,378,413 3,294,663 45,151,598
12,528 278,485 209,612 130,565 50,004 0 2,680,7392,991,041 2,416,984 2,230,996 2,221,486 2,004,463 2,228,096 29,798,1284,795,060 4,839,111 4,701,395 5,005,684 4,454,113 4,563,211 57,116,735
67,141,250 66,276,970 62,866,195 65,850,267 63,505,705 65,682,110 785,811,828
843,338 890,719 845,962 813,385 746,002 746,874 9,817,644
8,554,838 8,461,918 8,050,518 8,343,109 8,544,940 8,708,140 99,286,320
85,177 97,195 69,251 73,001 64,596 68,146 790,77045,505,437 45,539,277 44,047,113 47,030,506 44,756,613 46,562,848 542,194,746
5,341,203 5,287,226 4,877,865 5,058,061 4,928,566 5,213,934 63,607,7554,254,059 4,178,871 4,342,210 4,322,184 4,598,491 3,451,036 67,074,187
0 0 43,421 0 0 0 43,421150,704,385 149,922,253 142,435,943 148,593,472 142,303,405 146,155,161 1,779,789,838
0 0 0 22,720 0 0 22,7200 0 0 0 0 482,570 537,955
0 0 0 22,720 0 482,570 560,675
150,704,385 149,922,253 142,435,943 148,616,192 142,303,405 146,637,731 1,780,350,513
Manufacturing Milk Production, by County, by Month
C A L I F O R N I A
California Dairy Statistics Annual 2009 19
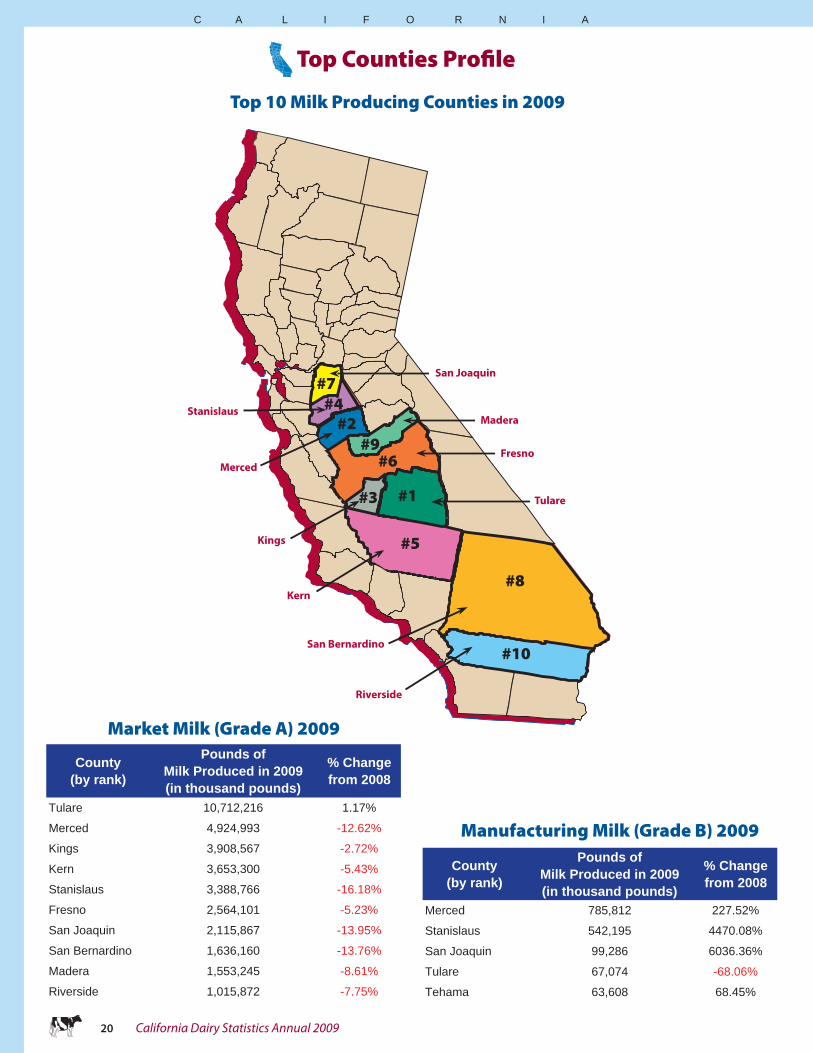
Top 10 Milk Producing Counties in 2009
Market Milk (Grade A) 2009
Manufacturing Milk (Grade B) 2009
County(by rank)
Pounds ofMilk Produced in 2009(in thousand pounds)
% Changefrom 2008
Tulare 10,712,216 1.17%
Merced 4,924,993 -12.62%
Kings 3,908,567 -2.72%
Kern 3,653,300 -5.43%
Stanislaus 3,388,766 -16.18%
Fresno 2,564,101 -5.23%
San Joaquin 2,115,867 -13.95%
San Bernardino 1,636,160 -13.76%
Madera 1,553,245 -8.61%
Riverside 1,015,872 -7.75%
County (by rank)
Pounds ofMilk Produced in 2009(in thousand pounds)
% Changefrom 2008
Merced 785,812 227.52%
Stanislaus 542,195 4470.08%
San Joaquin 99,286 6036.36%
Tulare 67,074 -68.06%
Tehama 63,608 68.45%
Tulare
Madera
Fresno
San Joaquin
Merced
Stanislaus
Kings
San Bernardino
Riverside
Kern
#1
#5
#8
#10
#3
#6#9
#2#4
#7
Top Counties Profi le
C A L I F O R N I A
20 California Dairy Statistics Annual 2009
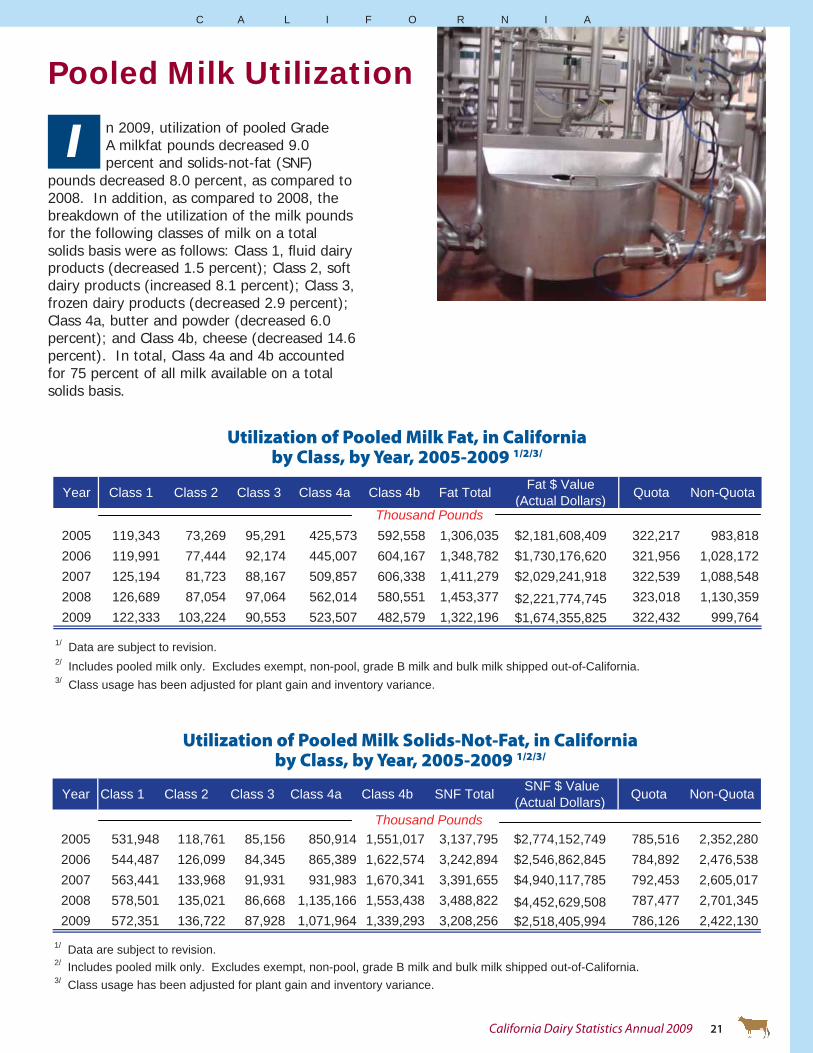
Ipounds decreased 8.0 percent, as compared to 2008. In addition, as compared to 2008, the breakdown of the utilization of the milk pounds for the following classes of milk on a total solids basis were as follows: Class 1, fl uid dairy
n 2009, utilization of pooled Grade A milkfat pounds decreased 9.0 percent and solids-not-fat (SNF)
products (decreased 1.5 percent); Class 2, soft dairy products (increased 8.1 percent); Class 3, frozen dairy products (decreased 2.9 percent); Class 4a, butter and powder (decreased 6.0 percent); and Class 4b, cheese (decreased 14.6 percent). In total, Class 4a and 4b accounted for 75 percent of all milk available on a total solids basis.
Utilization of Pooled Milk Fat, in Californiaby Class, by Year, 2005-2009 1/2/3/
Utilization of Pooled Milk Solids-Not-Fat, in Californiaby Class, by Year, 2005-2009 1/2/3/
Year Class 1 Class 2 Class 3 Class 4a Class 4b Fat Total Fat $ Value(Actual Dollars) Quota Non-Quota
2005 119,343 73,269 95,291 425,573 592,558 1,306,035 $2,181,608,409 322,217 983,8182006 119,991 77,444 92,174 445,007 604,167 1,348,782 $1,730,176,620 321,956 1,028,1722007 125,194 81,723 88,167 509,857 606,338 1,411,279 $2,029,241,918 322,539 1,088,5482008 126,689 87,054 97,064 562,014 580,551 1,453,377 $2,221,774,745 323,018 1,130,3592009 122,333 103,224 90,553 523,507 482,579 1,322,196 $1,674,355,825 322,432 999,764
1/ Data are subject to revision.2/ Includes pooled milk only. Excludes exempt, non-pool, grade B milk and bulk milk shipped out-of-California.3/ Class usage has been adjusted for plant gain and inventory variance.
Thousand Pounds
Year Class 1 Class 2 Class 3 Class 4a Class 4b SNF Total SNF $ Value(Actual Dollars) Quota Non-Quota
2005 531,948 118,761 85,156 850,914 1,551,017 3,137,795 $2,774,152,749 785,516 2,352,2802006 544,487 126,099 84,345 865,389 1,622,574 3,242,894 $2,546,862,845 784,892 2,476,5382007 563,441 133,968 91,931 931,983 1,670,341 3,391,655 $4,940,117,785 792,453 2,605,0172008 578,501 135,021 86,668 1,135,166 1,553,438 3,488,822 $4,452,629,508 787,477 2,701,3452009 572,351 136,722 87,928 1,071,964 1,339,293 3,208,256 $2,518,405,994 786,126 2,422,130
1/ Data are subject to revision.2/ Includes pooled milk only. Excludes exempt, non-pool, grade B milk and bulk milk shipped out-of-California.3/ Class usage has been adjusted for plant gain and inventory variance.
Thousand Pounds
Pooled Milk Utilization
C A L I F O R N I A
California Dairy Statistics Annual 2009 21

Utilization of Milk Produced in California, by Class, 2001-2009
Pooled Milk Utilization
0%
20%
40%
60%
80%
100%
2001 2003 2005 2007 2009
Class 1 Class 2 Class 3 Class 4a Class 4b
Net Milk Available in CaliforniaCalifornia Commercial Milk Production, Production Entering, Production Leaving,
Net Milk Available, in Thousand Pounds, 2005-2009
Year CaliforniaMilk Production
ProductionEntering California
ProductionLeaving California
Net Milk Availablein California
2005 37,521,450 1,220,251 299,443 38,442,258
2006 38,792,168 1,145,694 378,958 39,558,904
2007 40,646,097 963,038 414,020 41,195,115
2008 41,166,115 847,054 486,799 41,526,370
2009 39,488,221 756,829 478,707 39,766,344
Utilization of Milk Produced in California, by Class, 2008 vs. 2009
Class 4b40.2%
Class 1, 15.3%
Class 4a35.2%
Class 3, 3.9%
Class 2, 5.3%
C A L I F O R N I A C A L I F O R N I A
20092008
Class 4b43.2%
Class 4a34.3%
Class 2, 4.5%
Class 3, 3.7%
Class 1, 14.3%
22 California Dairy Statistics Annual 2009

Del Norte Siskiyou
Modoc
Lassen
Shasta Trinity
Humboldt
Mendocino
Tehama
Butte
Plumas Glenn
Lake Sierra Colusa
Yolo Sonoma
Yuba Nevada Placer
El Dorado
Sutter
Napa
Solano
Sacramento
Amador Alpine
Mono
San Francisco
Marin Contra Costa
San Joaquin Calaveras
San Mateo
Alameda Tuolumne
Santa Cruz
Santa Clara
Stanislaus Merced
Mariposa
Madera
San Benito Monterey
Fresno
Kings
Inyo
Tulare
Kern
Ventura
Orange
San Luis Obispo
Santa Barbara
San Bernardino
Riverside
Imperial
San Diego
Los Angeles
0-499 Lbs. Quota
501-4,999 Lbs. Quota5,000-24,999 Lbs. Quota 25,000-99,999 Lbs. Quota 100,000-199,999 Lbs. Quota 200,000-410,000 Lbs. Quota
Pounds of Quota
Where Is the Quota in California?California Pounds of Solids-Not-Fat Quota
On A Daily Basis, December 2009
Quota Transfer SummarySummary of Quota Transfers and Sales, Based on Solids-Not-Fat, 2004-2009
Quota in California & Quota Transfers
Number of Number of Average SNF AverageSellers Buyers Price 1/ Transferred Ratio
(dollars) (pounds)
2004 72 108 $460 77,498 2.45
2005 65 79 $478 60,243 2.44
2006 52 75 $501 63,249 2.42
2007 77 93 $495 75,267 2.43
2008 56 68 $534 98,654 2.44
2009 105 109 $415 87,978 2.411/ Sales without cows.
Year
C A L I F O R N I A
California Dairy Statistics Annual 2009 23
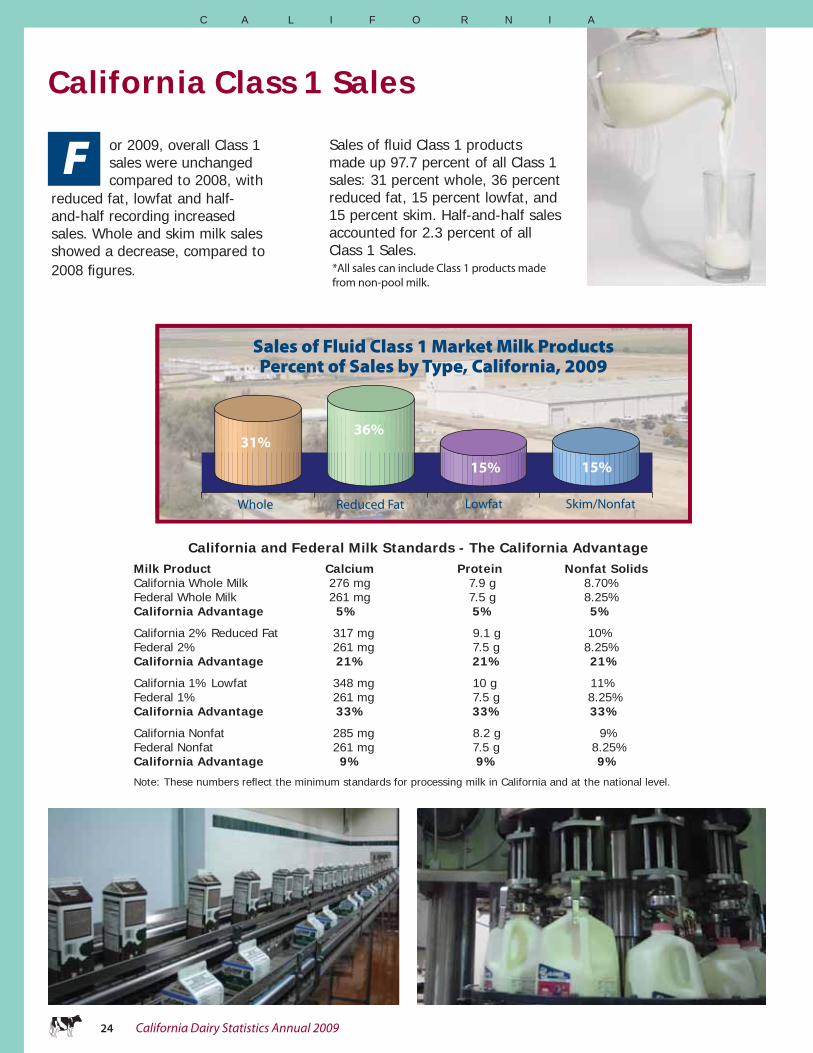
F or 2009, overall Class 1sales were unchanged compared to 2008, with
reduced fat, lowfat and half-and-half recording increased sales. Whole and skim milk sales showed a decrease, compared to 2008 fi gures.
California and Federal Milk Standards - The California AdvantageMilk Product Calcium Protein Nonfat SolidsCalifornia Whole Milk 276 mg 7.9 g 8.70%Federal Whole Milk 261 mg 7.5 g 8.25%California Advantage 5% 5% 5% California 2% Reduced Fat 317 mg 9.1 g 10%Federal 2% 261 mg 7.5 g 8.25%California Advantage 21% 21% 21% California 1% Lowfat 348 mg 10 g 11%Federal 1% 261 mg 7.5 g 8.25%California Advantage 33% 33% 33%
California Nonfat 285 mg 8.2 g 9%Federal Nonfat 261 mg 7.5 g 8.25%California Advantage 9% 9% 9%
Note: These numbers refl ect the minimum standards for processing milk in California and at the national level.
*All sales can include Class 1 products made from non-pool milk.
Sales of fl uid Class 1 products made up 97.7 percent of all Class 1 sales: 31 percent whole, 36 percent reduced fat, 15 percent lowfat, and 15 percent skim. Half-and-half sales accounted for 2.3 percent of all Class 1 Sales.
California Class 1 Sales
C A L I F O R N I A
15%
31%36%
15%
Whole Reduced Fat Lowfat Skim/Nonfat
Sales of Fluid Class 1 Market Milk ProductsPercent of Sales by Type, California, 2009
24 California Dairy Statistics Annual 2009
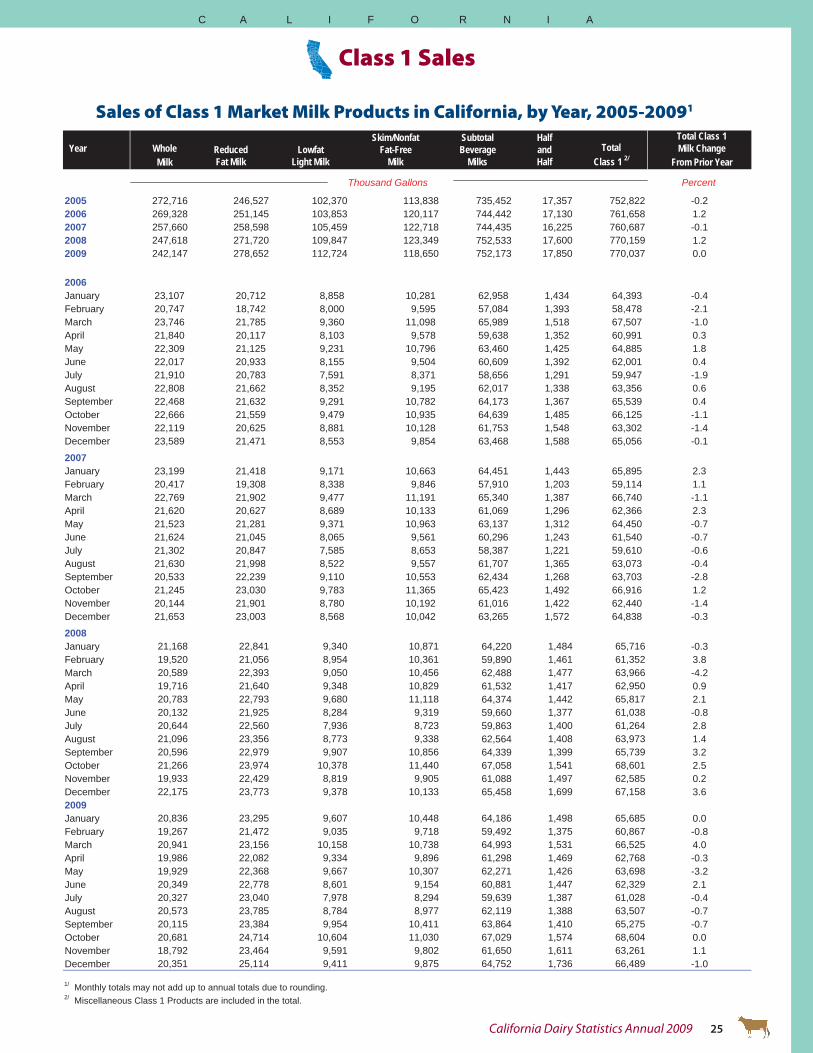
Sales of Class 1 Market Milk Products in California, by Year, 2005-20091
Class 1 Sales
Total Class 1 Year Whole Milk Change Milk From Prior Year
Percent
2005 272,716 246,527 102,370 113,838 735,452 17,357 752,822 -0.22006 269,328 251,145 103,853 120,117 744,442 17,130 761,658 1.22007 257,660 258,598 105,459 122,718 744,435 16,225 760,687 -0.12008 247,618 271,720 109,847 123,349 752,533 17,600 770,159 1.22009 242,147 278,652 112,724 118,650 752,173 17,850 770,037 0.0
2006January 23,107 20,712 8,858 10,281 62,958 1,434 64,393 -0.4February 20,747 18,742 8,000 9,595 57,084 1,393 58,478 -2.1March 23,746 21,785 9,360 11,098 65,989 1,518 67,507 -1.0April 21,840 20,117 8,103 9,578 59,638 1,352 60,991 0.3May 22,309 21,125 9,231 10,796 63,460 1,425 64,885 1.8June 22,017 20,933 8,155 9,504 60,609 1,392 62,001 0.4July 21,910 20,783 7,591 8,371 58,656 1,291 59,947 -1.9August 22,808 21,662 8,352 9,195 62,017 1,338 63,356 0.6September 22,468 21,632 9,291 10,782 64,173 1,367 65,539 0.4October 22,666 21,559 9,479 10,935 64,639 1,485 66,125 -1.1November 22,119 20,625 8,881 10,128 61,753 1,548 63,302 -1.4December 23,589 21,471 8,553 9,854 63,468 1,588 65,056 -0.1
2007January 23,199 21,418 9,171 10,663 64,451 1,443 65,895 2.3February 20,417 19,308 8,338 9,846 57,910 1,203 59,114 1.1March 22,769 21,902 9,477 11,191 65,340 1,387 66,740 -1.1April 21,620 20,627 8,689 10,133 61,069 1,296 62,366 2.3May 21,523 21,281 9,371 10,963 63,137 1,312 64,450 -0.7June 21,624 21,045 8,065 9,561 60,296 1,243 61,540 -0.7July 21,302 20,847 7,585 8,653 58,387 1,221 59,610 -0.6August 21,630 21,998 8,522 9,557 61,707 1,365 63,073 -0.4September 20,533 22,239 9,110 10,553 62,434 1,268 63,703 -2.8October 21,245 23,030 9,783 11,365 65,423 1,492 66,916 1.2November 20,144 21,901 8,780 10,192 61,016 1,422 62,440 -1.4December 21,653 23,003 8,568 10,042 63,265 1,572 64,838 -0.3
2008January 21,168 22,841 9,340 10,871 64,220 1,484 65,716 -0.3February 19,520 21,056 8,954 10,361 59,890 1,461 61,352 3.8March 20,589 22,393 9,050 10,456 62,488 1,477 63,966 -4.2April 19,716 21,640 9,348 10,829 61,532 1,417 62,950 0.9May 20,783 22,793 9,680 11,118 64,374 1,442 65,817 2.1June 20,132 21,925 8,284 9,319 59,660 1,377 61,038 -0.8July 20,644 22,560 7,936 8,723 59,863 1,400 61,264 2.8August 21,096 23,356 8,773 9,338 62,564 1,408 63,973 1.4September 20,596 22,979 9,907 10,856 64,339 1,399 65,739 3.2October 21,266 23,974 10,378 11,440 67,058 1,541 68,601 2.5November 19,933 22,429 8,819 9,905 61,088 1,497 62,585 0.2December 22,175 23,773 9,378 10,133 65,458 1,699 67,158 3.62009January 20,836 23,295 9,607 10,448 64,186 1,498 65,685 0.0February 19,267 21,472 9,035 9,718 59,492 1,375 60,867 -0.8March 20,941 23,156 10,158 10,738 64,993 1,531 66,525 4.0April 19,986 22,082 9,334 9,896 61,298 1,469 62,768 -0.3May 19,929 22,368 9,667 10,307 62,271 1,426 63,698 -3.2June 20,349 22,778 8,601 9,154 60,881 1,447 62,329 2.1July 20,327 23,040 7,978 8,294 59,639 1,387 61,028 -0.4August 20,573 23,785 8,784 8,977 62,119 1,388 63,507 -0.7September 20,115 23,384 9,954 10,411 63,864 1,410 65,275 -0.7October 20,681 24,714 10,604 11,030 67,029 1,574 68,604 0.0November 18,792 23,464 9,591 9,802 61,650 1,611 63,261 1.1December 20,351 25,114 9,411 9,875 64,752 1,736 66,489 -1.0
1/ Monthly totals may not add up to annual totals due to rounding.2/ Miscellaneous Class 1 Products are included in the total.
Skim/NonfatFat-Free
MilkTotal
Class 1 2/
Thousand Gallons
ReducedFat Milk
LowfatLight Milk
HalfandHalf
SubtotalBeverage
Milks
C A L I F O R N I A
California Dairy Statistics Annual 2009 25
Fluid Milk Sales Container Survey for October 2009Sales of Market Whole, Reduced Fat, Lowfat, and Skim Milks - October 2009
Reported by Number of Individual Units SoldWith Percent Comparison of Total Class 1 Sales
Fluid Milk Sales Container Survey, October 2009
WHOLE 2%REDUCED FAT
1%LOWFAT SKIM TOTAL NUMBER
OF UNITS
PERCENT OF OCTOBER 2009CLASS 1 SALES
PERCENT
6 Gallon 6 Gallon
Bag 25,416 16,116 3,119 4,491 49,142 0.41%
Plastic * * * * 36,925 0.31%
86,067 0.71%
5 Gallon 5 Gallon
Bag 3,011 1,438 2,974 1,124 8,547 0.06%
Plastic 0 0 0 0 0 0.00%
8,547 0.06%
3 Gallon 3 Gallon
Bag * 0 0 0 * 0.00%
Plastic 0 0 0 0 0 0.00%
* 0.00%
1 Gallon 1 GallonGlass 0 0 0 0 0 0.00%Paper 0 0 0 0 0 0.00%Plastic 17,132,738 20,103,742 4,963,095 5,655,011 47,854,586 65.90%
47,854,586 65.90% 1/2 Gallon 1/2 Gallon
Glass * * * * 29,170 0.02%Paper 5,278,191 7,008,245 4,114,834 5,332,257 21,733,527 14.96%Plastic 3,089,083 3,460,549 1,474,379 1,585,897 9,609,908 6.62%
31,372,605 21.60%
TOTAL 6 GALLON UNITS
TOTAL 1 GALLON UNITS
TOTAL 1/2 GALLON UNITS
IN NUMBER OF UNITS SOLD
ContainerSize &
Characteristic
TOTAL 3 GALLON UNITS
TOTAL 5 GALLON UNITS
C A L I F O R N I A
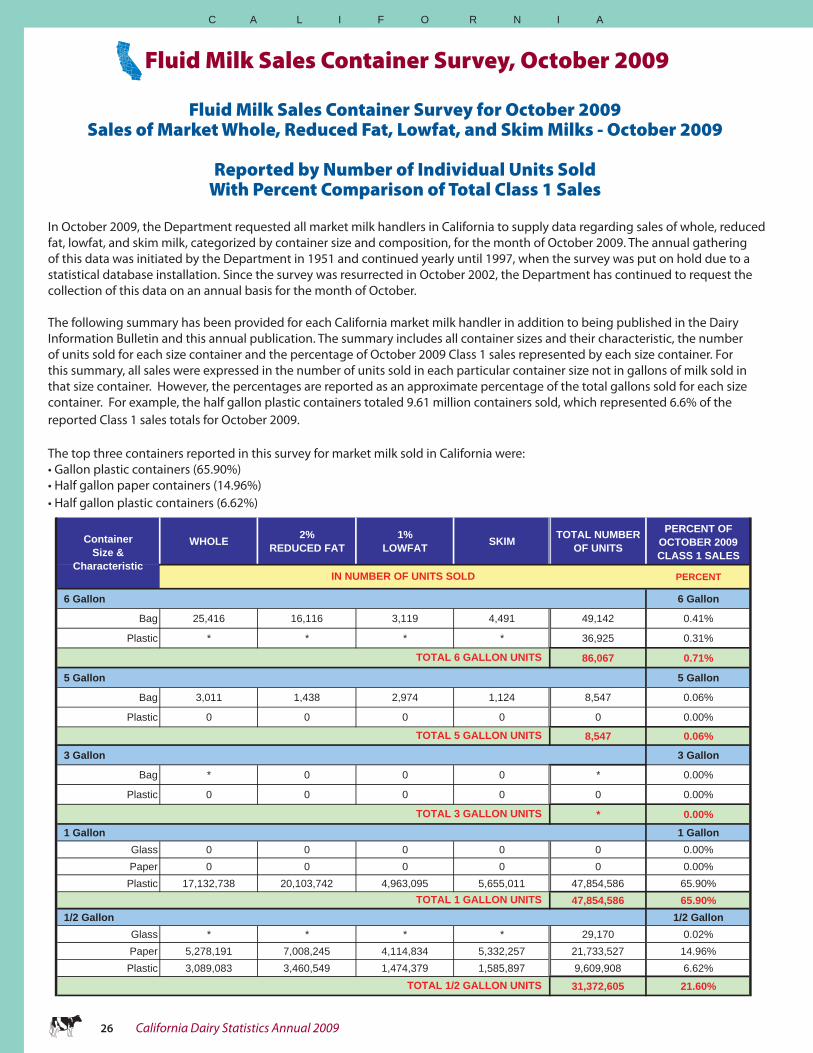
In October 2009, the Department requested all market milk handlers in California to supply data regarding sales of whole, reduced fat, lowfat, and skim milk, categorized by container size and composition, for the month of October 2009. The annual gathering of this data was initiated by the Department in 1951 and continued yearly until 1997, when the survey was put on hold due to a statistical database installation. Since the survey was resurrected in October 2002, the Department has continued to request the collection of this data on an annual basis for the month of October.
The following summary has been provided for each California market milk handler in addition to being published in the Dairy Information Bulletin and this annual publication. The summary includes all container sizes and their characteristic, the number of units sold for each size container and the percentage of October 2009 Class 1 sales represented by each size container. For this summary, all sales were expressed in the number of units sold in each particular container size not in gallons of milk sold in that size container. However, the percentages are reported as an approximate percentage of the total gallons sold for each size container. For example, the half gallon plastic containers totaled 9.61 million containers sold, which represented 6.6% of the reported Class 1 sales totals for October 2009.
The top three containers reported in this survey for market milk sold in California were:• Gallon plastic containers (65.90%)• Half gallon paper containers (14.96%)• Half gallon plastic containers (6.62%)
26 California Dairy Statistics Annual 2009
Fluid Milk Sales Container Survey, October 2009
C A L I F O R N I A
WHOLE 2%REDUCED FAT
1%LOWFAT SKIM TOTAL NUMBER
OF UNITS
PERCENT OF OCTOBER 2009CLASS 1 SALES
PERCENTIN NUMBER OF UNITS SOLD
ContainerSize &
Characteristic
Quart QuartGlass * * * * 14,957 0.01%Paper 1,693,107 2,211,026 905,756 1,350,131 6,160,020 2.12%Plastic 474,679 614,987 270,368 184,094 1,544,128 0.53%
7,719,105 2.66% Pint Pint
Paper 561,481 302,075 320,421 230,652 1,414,629 0.24%Plastic 452,386 262,315 318,622 0 1,033,323 0.18%
2,447,952 0.42% 1/3 Quart 1/3 Quart
Paper 307,505 497,041 326,428 68,722 1,199,696 0.14%Plastic 138,430 179,362 90,532 * 430,058 0.05%
1,629,754 0.19% 1/2 Pint 1/2 Pint
Paper 2,117,964 7,198,117 29,030,848 29,090,557 67,437,486 5.80%Plastic 0 * * 0 2,527,664 0.22%
69,965,150 6.02% 4 Oz. Pouch 4 Oz.
Paper 573,475 476,514 0 1,151,806 2,201,795 0.09%Plastic 0 0 0 0 0 0.00%
2,201,795 0.09% 8 Oz. Pouch 8 Oz.
Paper 0 * * * 6,104,061 0.53%Plastic 0 0 3,539,878 11,689,190 15,229,068 1.31%
21,333,129 1.84%12 Oz. 12 Oz.
Paper 0 0 0 0 0 0.00%Plastic 735,619 746,573 521,378 13,112 2,016,682 0.26%
2,016,682 0.26%14 Oz./13.5 Oz. 14 Oz.
Paper 0 0 0 0 0 0.00%Plastic 0 0 * 0 * 0.01%
* 0.01%Other Sizes/Types of Container Other Sizes13.5 oz Plastic 0 * 0 0 * 0.09%20 oz Paper 0 * * 0 31,093 0.01%96 oz plastic * * * * 76,158 0.08%320 gal Totes * * 0 0 * 0.07%
718,424 0.24%
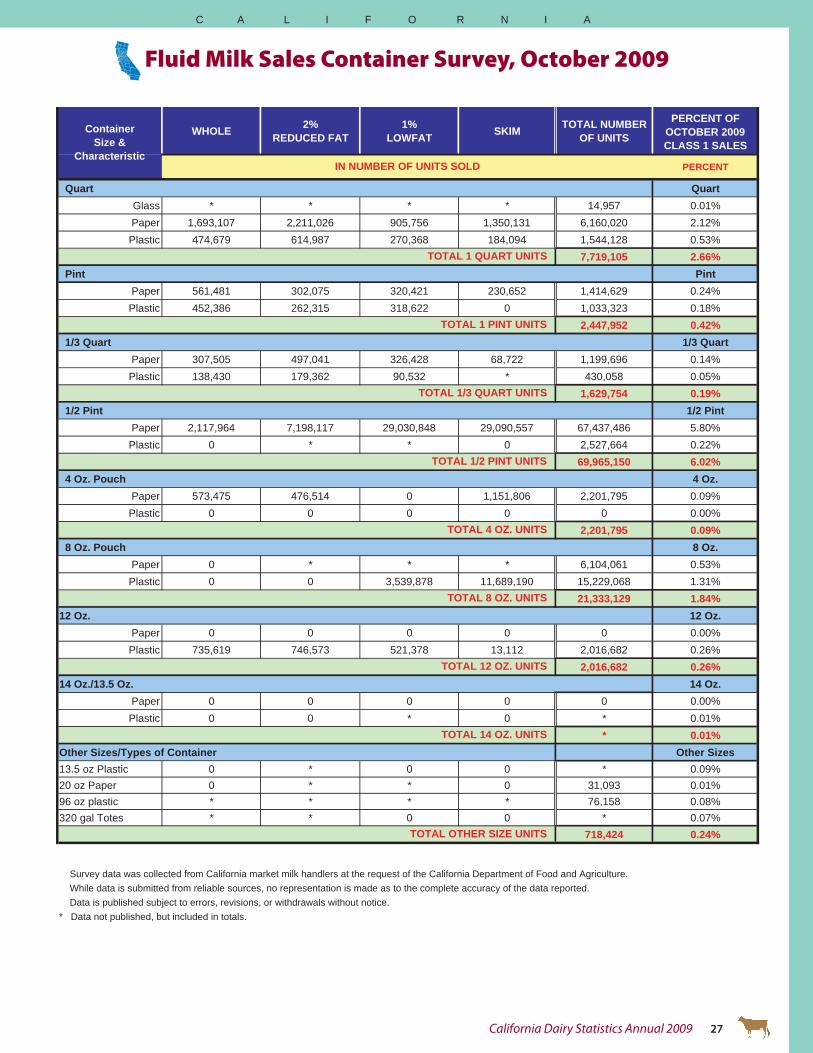
Survey data was collected from California market milk handlers at the request of the California Department of Food and Agriculture. While data is submitted from reliable sources, no representation is made as to the complete accuracy of the data reported. Data is published subject to errors, revisions, or withdrawals without notice.
TOTAL 4 OZ. UNITS
* Data not published, but included in totals.
TOTAL 14 OZ. UNITS
TOTAL 1 QUART UNITS
TOTAL 1 PINT UNITS
TOTAL OTHER SIZE UNITS
TOTAL 1/3 QUART UNITS
TOTAL 1/2 PINT UNITS
TOTAL 8 OZ. UNITS
TOTAL 12 OZ. UNITS
California Dairy Statistics Annual 2009 27
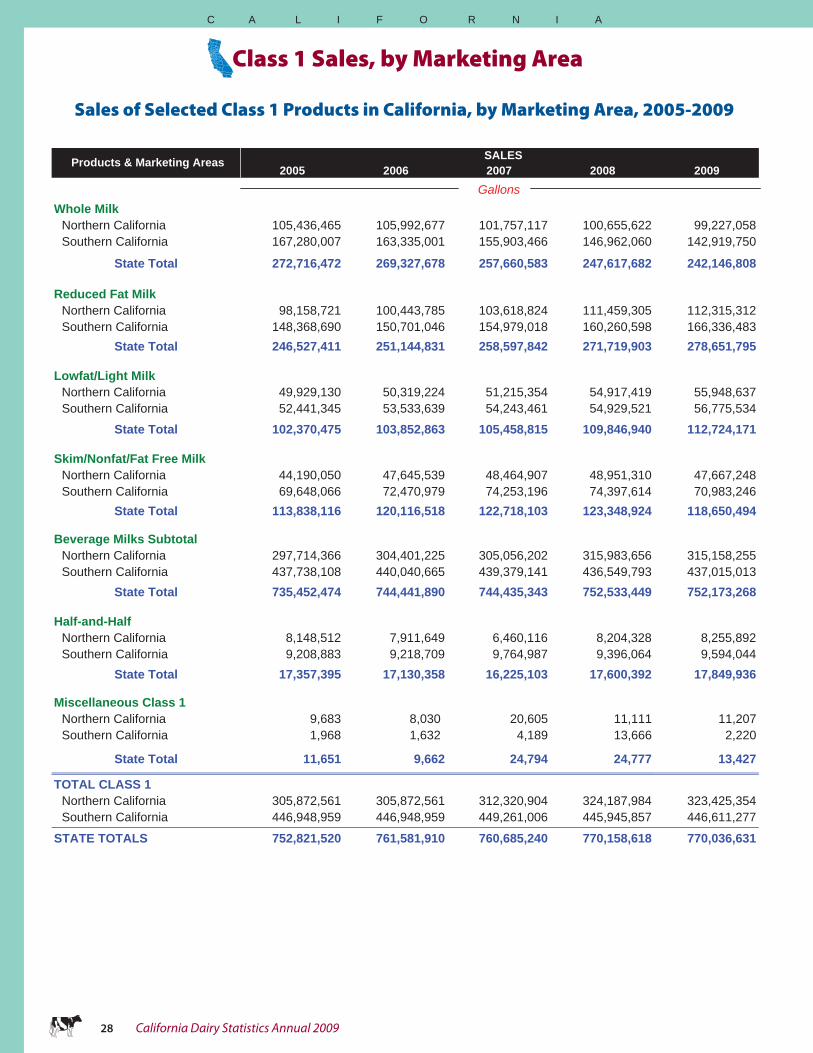
Sales of Selected Class 1 Products in California, by Marketing Area, 2005-2009
Class 1 Sales, by Marketing Area
2005 2006 2007 2008 2009
Whole MilkNorthern California 105,436,465 105,992,677 101,757,117 100,655,622 99,227,058Southern California 167,280,007 163,335,001 155,903,466 146,962,060 142,919,750
State Total 272,716,472 269,327,678 257,660,583 247,617,682 242,146,808
Reduced Fat MilkNorthern California 98,158,721 100,443,785 103,618,824 111,459,305 112,315,312Southern California 148,368,690 150,701,046 154,979,018 160,260,598 166,336,483
State Total 246,527,411 251,144,831 258,597,842 271,719,903 278,651,795
Lowfat/Light Milk Northern California 49,929,130 50,319,224 51,215,354 54,917,419 55,948,637Southern California 52,441,345 53,533,639 54,243,461 54,929,521 56,775,534
State Total 102,370,475 103,852,863 105,458,815 109,846,940 112,724,171
Skim/Nonfat/Fat Free MilkNorthern California 44,190,050 47,645,539 48,464,907 48,951,310 47,667,248Southern California 69,648,066 72,470,979 74,253,196 74,397,614 70,983,246
State Total 113,838,116 120,116,518 122,718,103 123,348,924 118,650,494
Beverage Milks SubtotalNorthern California 297,714,366 304,401,225 305,056,202 315,983,656 315,158,255Southern California 437,738,108 440,040,665 439,379,141 436,549,793 437,015,013
State Total 735,452,474 744,441,890 744,435,343 752,533,449 752,173,268
Half-and-HalfNorthern California 8,148,512 7,911,649 6,460,116 8,204,328 8,255,892Southern California 9,208,883 9,218,709 9,764,987 9,396,064 9,594,044
State Total 17,357,395 17,130,358 16,225,103 17,600,392 17,849,936
Miscellaneous Class 1Northern California 9,683 8,030 20,605 11,111 11,207Southern California 1,968 1,632 4,189 13,666 2,220
State Total 11,651 9,662 24,794 24,777 13,427
TOTAL CLASS 1Northern California 305,872,561 305,872,561 312,320,904 324,187,984 323,425,354Southern California 446,948,959 446,948,959 449,261,006 445,945,857 446,611,277
STATE TOTALS 752,821,520 761,581,910 760,685,240 770,158,618 770,036,631
SALES
Gallons
Products & Marketing Areas
C A L I F O R N I A
28 California Dairy Statistics Annual 2009

Cmanufactured dairy products, including butter, ice cream, and nonfat dry milk (NFDM).
Class 2 (Soft Dairy Products):Total cottage cheese production decreased 9.8 percent to 89.8 million pounds. Yogurt production continued to increase, up 6.6 percent compared to 2008. Sour cream and sour cream dressing production increased slightly by 2.0 percent, while buttermilk showed a marked 24.5 percent increase in production over last year. Other cream production increased 3.4 percent and manufacturing cream increased 2.8 percent compared to 2008.
Class 3 (Frozen Dairy Products):For 2009, total frozen production increased 7.5 percent to 177.4 million gallons. The shares of the total frozen product production were as follows: 83 percent ice
alifornia continues to lead the nation in the production of many
* All product totals can include products made from non-pool milk.
Manufacture of Dairy Products
C A L I F O R
percent), Hispanic at 5.5 percent (up 3.7 percent). Provolone and Parmesan cheeses accounted for 5.2 percent of total cheese production.
NFDM By the Numbers
7.4
832.3
19.31¢
716.2
Number of pounds of whole milk to make 1 pound of nonfat dry milk.
Million pounds of nonfat dry milk produced in California in 2009.
Weighted average cost to produce 1 pound of nonfat dry milk for all plants in California in 2008.
Million gallons of milk processed to produce nonfat dry milk in California in 2009.
Cheese By the Numbers
10
2.06
20.99¢
2,392
Number of pounds of whole milk to make 1 pound of cheese.
Billion Pounds of total cheese produced in California in 2009.
Weighted average cost to produce 1 pound of cheese for all plants in California in 2008.
Million gallons of milk processed to produce cheese in California, 2009.
Butter Facts and FiguresButter By the Numbers
21.2
520.3
15.53¢
1,283
Number of pounds of whole milk to make 1 pound of butter.
Million pounds of butter produced in California in 2009.
Weighted average cost to produce 1 pound of butter for all plants in California in 2008.
Million gallons of milk processed to produce butter in California, 2009.
cream, 10 percent ice milk, 2 percent sherbet, and 5 percent frozen yogurt.
Class 4a (Butter and Nonfat Dry Milk):Butter production was down in 2009, showing a 6.3 percent decrease to 520.3 million pounds. Nonfat dry milk production showed a 1.6 percent increase in production.
Class 4b (Cheese and Whey Byproducts):The year 2009 showed a 2.6 percent decrease in total cheese production to 2.06 billion pounds. The shares of total cheese production were: Mozarrella at 53.6 percent (down 0.3 percent), Cheddar at 17.7 percent (down 3.1 percent), Monterey at 13.6 percent (down 4.4
California Dairy Statistics Annual 2009 29
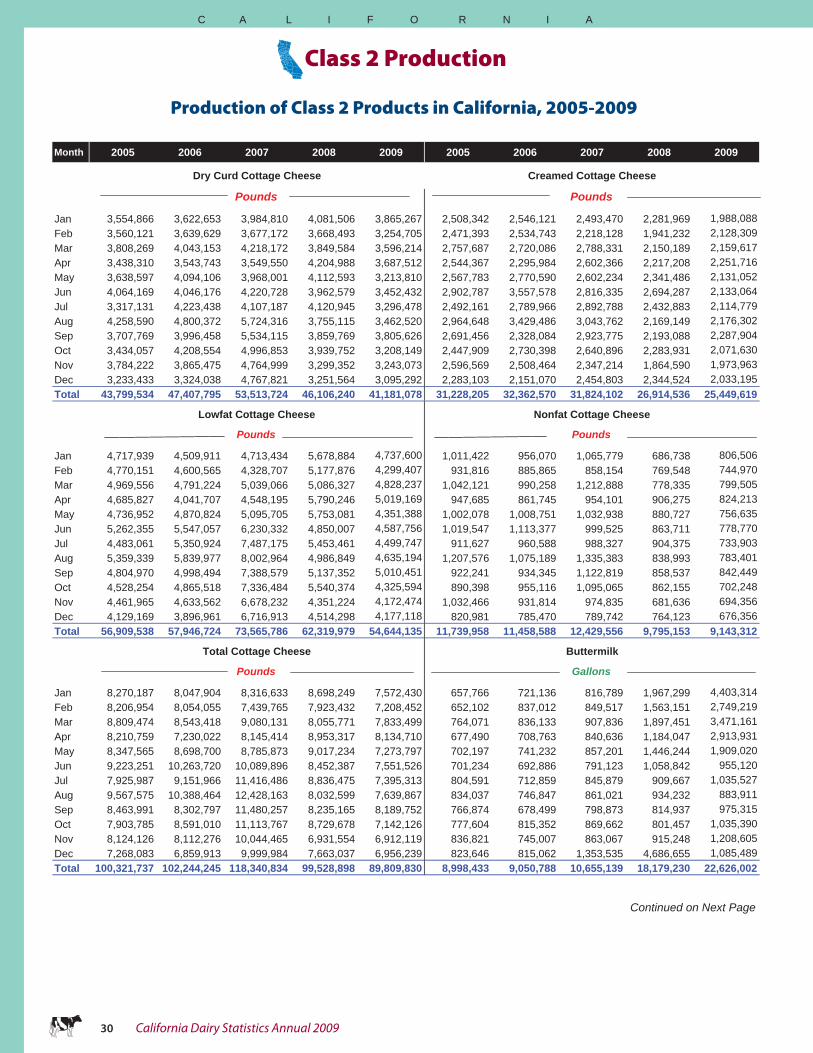
Production of Class 2 Products in California, 2005-2009
Class 2 Production
Month 2005 2006 2007 2008 2009 2005 2006 2007 2008 2009
Jan 3,554,866 3,622,653 3,984,810 4,081,506 3,865,267 2,508,342 2,546,121 2,493,470 2,281,969 1,988,088Feb 3,560,121 3,639,629 3,677,172 3,668,493 3,254,705 2,471,393 2,534,743 2,218,128 1,941,232 2,128,309Mar 3,808,269 4,043,153 4,218,172 3,849,584 3,596,214 2,757,687 2,720,086 2,788,331 2,150,189 2,159,617Apr 3,438,310 3,543,743 3,549,550 4,204,988 3,687,512 2,544,367 2,295,984 2,602,366 2,217,208 2,251,716May 3,638,597 4,094,106 3,968,001 4,112,593 3,213,810 2,567,783 2,770,590 2,602,234 2,341,486 2,131,052Jun 4,064,169 4,046,176 4,220,728 3,962,579 3,452,432 2,902,787 3,557,578 2,816,335 2,694,287 2,133,064Jul 3,317,131 4,223,438 4,107,187 4,120,945 3,296,478 2,492,161 2,789,966 2,892,788 2,432,883 2,114,779Aug 4,258,590 4,800,372 5,724,316 3,755,115 3,462,520 2,964,648 3,429,486 3,043,762 2,169,149 2,176,302Sep 3,707,769 3,996,458 5,534,115 3,859,769 3,805,626 2,691,456 2,328,084 2,923,775 2,193,088 2,287,904Oct 3,434,057 4,208,554 4,996,853 3,939,752 3,208,149 2,447,909 2,730,398 2,640,896 2,283,931 2,071,630Nov 3,784,222 3,865,475 4,764,999 3,299,352 3,243,073 2,596,569 2,508,464 2,347,214 1,864,590 1,973,963Dec 3,233,433 3,324,038 4,767,821 3,251,564 3,095,292 2,283,103 2,151,070 2,454,803 2,344,524 2,033,195Total 43,799,534 47,407,795 53,513,724 46,106,240 41,181,078 31,228,205 32,362,570 31,824,102 26,914,536 25,449,619
Jan 4,717,939 4,509,911 4,713,434 5,678,884 4,737,600 1,011,422 956,070 1,065,779 686,738 806,506Feb 4,770,151 4,600,565 4,328,707 5,177,876 4,299,407 931,816 885,865 858,154 769,548 744,970Mar 4,969,556 4,791,224 5,039,066 5,086,327 4,828,237 1,042,121 990,258 1,212,888 778,335 799,505Apr 4,685,827 4,041,707 4,548,195 5,790,246 5,019,169 947,685 861,745 954,101 906,275 824,213May 4,736,952 4,870,824 5,095,705 5,753,081 4,351,388 1,002,078 1,008,751 1,032,938 880,727 756,635Jun 5,262,355 5,547,057 6,230,332 4,850,007 4,587,756 1,019,547 1,113,377 999,525 863,711 778,770Jul 4,483,061 5,350,924 7,487,175 5,453,461 4,499,747 911,627 960,588 988,327 904,375 733,903Aug 5,359,339 5,839,977 8,002,964 4,986,849 4,635,194 1,207,576 1,075,189 1,335,383 838,993 783,401Sep 4,804,970 4,998,494 7,388,579 5,137,352 5,010,451 922,241 934,345 1,122,819 858,537 842,449Oct 4,528,254 4,865,518 7,336,484 5,540,374 4,325,594 890,398 955,116 1,095,065 862,155 702,248Nov 4,461,965 4,633,562 6,678,232 4,351,224 4,172,474 1,032,466 931,814 974,835 681,636 694,356Dec 4,129,169 3,896,961 6,716,913 4,514,298 4,177,118 820,981 785,470 789,742 764,123 676,356Total 56,909,538 57,946,724 73,565,786 62,319,979 54,644,135 11,739,958 11,458,588 12,429,556 9,795,153 9,143,312
Jan 8,270,187 8,047,904 8,316,633 8,698,249 7,572,430 657,766 721,136 816,789 1,967,299 4,403,314Feb 8,206,954 8,054,055 7,439,765 7,923,432 7,208,452 652,102 837,012 849,517 1,563,151 2,749,219Mar 8,809,474 8,543,418 9,080,131 8,055,771 7,833,499 764,071 836,133 907,836 1,897,451 3,471,161Apr 8,210,759 7,230,022 8,145,414 8,953,317 8,134,710 677,490 708,763 840,636 1,184,047 2,913,931May 8,347,565 8,698,700 8,785,873 9,017,234 7,273,797 702,197 741,232 857,201 1,446,244 1,909,020Jun 9,223,251 10,263,720 10,089,896 8,452,387 7,551,526 701,234 692,886 791,123 1,058,842 955,120Jul 7,925,987 9,151,966 11,416,486 8,836,475 7,395,313 804,591 712,859 845,879 909,667 1,035,527Aug 9,567,575 10,388,464 12,428,163 8,032,599 7,639,867 834,037 746,847 861,021 934,232 883,911Sep 8,463,991 8,302,797 11,480,257 8,235,165 8,189,752 766,874 678,499 798,873 814,937 975,315Oct 7,903,785 8,591,010 11,113,767 8,729,678 7,142,126 777,604 815,352 869,662 801,457 1,035,390Nov 8,124,126 8,112,276 10,044,465 6,931,554 6,912,119 836,821 745,007 863,067 915,248 1,208,605Dec 7,268,083 6,859,913 9,999,984 7,663,037 6,956,239 823,646 815,062 1,353,535 4,686,655 1,085,489Total 100,321,737 102,244,245 118,340,834 99,528,898 89,809,830 8,998,433 9,050,788 10,655,139 18,179,230 22,626,002
Continued on Next Page
Dry Curd Cottage Cheese
Pounds
Pounds
Lowfat Cottage Cheese
Creamed Cottage Cheese
Pounds
Nonfat Cottage Cheese
Pounds
Total Cottage Cheese
Pounds
Buttermilk
Gallons
C A L I F O R N I A
30 California Dairy Statistics Annual 2009
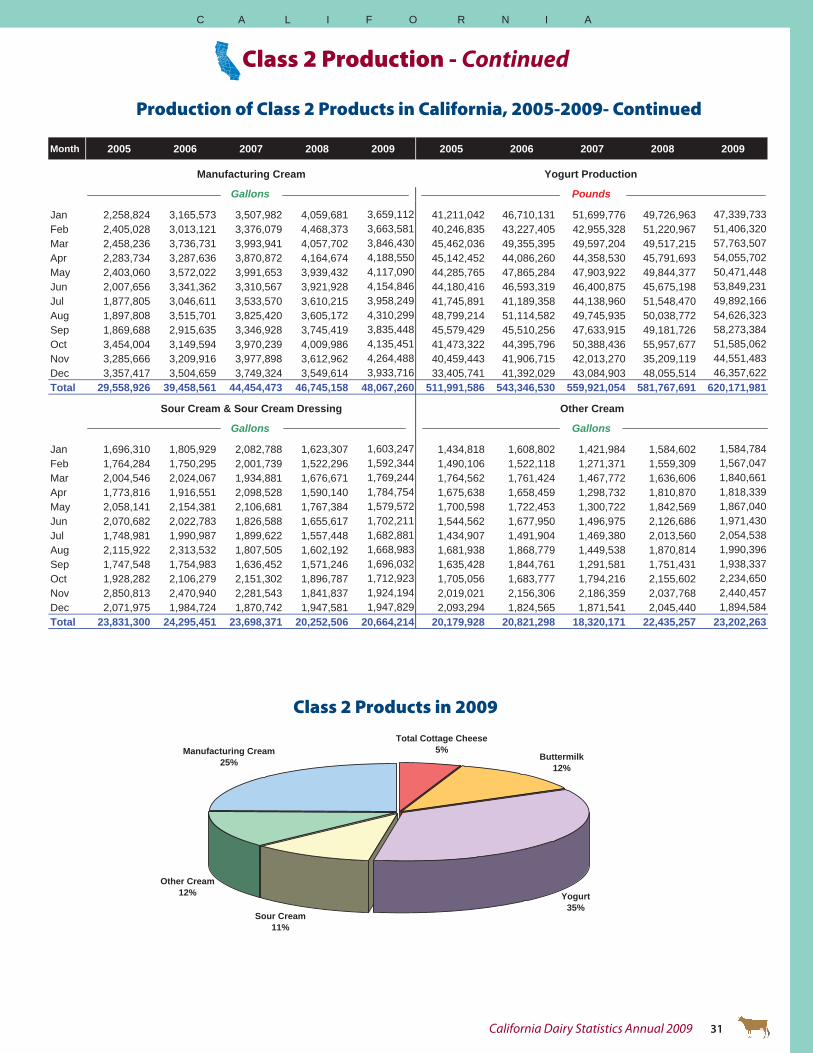
Production of Class 2 Products in California, 2005-2009- Continued
Class 2 Products in 2009
Class 2 Production - Continued
Month 2005 2006 2007 2008 2009 2005 2006 2007 2008 2009
Jan 2,258,824 3,165,573 3,507,982 4,059,681 3,659,112 41,211,042 46,710,131 51,699,776 49,726,963 47,339,733Feb 2,405,028 3,013,121 3,376,079 4,468,373 3,663,581 40,246,835 43,227,405 42,955,328 51,220,967 51,406,320Mar 2,458,236 3,736,731 3,993,941 4,057,702 3,846,430 45,462,036 49,355,395 49,597,204 49,517,215 57,763,507Apr 2,283,734 3,287,636 3,870,872 4,164,674 4,188,550 45,142,452 44,086,260 44,358,530 45,791,693 54,055,702May 2,403,060 3,572,022 3,991,653 3,939,432 4,117,090 44,285,765 47,865,284 47,903,922 49,844,377 50,471,448Jun 2,007,656 3,341,362 3,310,567 3,921,928 4,154,846 44,180,416 46,593,319 46,400,875 45,675,198 53,849,231Jul 1,877,805 3,046,611 3,533,570 3,610,215 3,958,249 41,745,891 41,189,358 44,138,960 51,548,470 49,892,166Aug 1,897,808 3,515,701 3,825,420 3,605,172 4,310,299 48,799,214 51,114,582 49,745,935 50,038,772 54,626,323Sep 1,869,688 2,915,635 3,346,928 3,745,419 3,835,448 45,579,429 45,510,256 47,633,915 49,181,726 58,273,384Oct 3,454,004 3,149,594 3,970,239 4,009,986 4,135,451 41,473,322 44,395,796 50,388,436 55,957,677 51,585,062Nov 3,285,666 3,209,916 3,977,898 3,612,962 4,264,488 40,459,443 41,906,715 42,013,270 35,209,119 44,551,483Dec 3,357,417 3,504,659 3,749,324 3,549,614 3,933,716 33,405,741 41,392,029 43,084,903 48,055,514 46,357,622Total 29,558,926 39,458,561 44,454,473 46,745,158 48,067,260 511,991,586 543,346,530 559,921,054 581,767,691 620,171,981
Jan 1,696,310 1,805,929 2,082,788 1,623,307 1,603,247 1,434,818 1,608,802 1,421,984 1,584,602 1,584,784Feb 1,764,284 1,750,295 2,001,739 1,522,296 1,592,344 1,490,106 1,522,118 1,271,371 1,559,309 1,567,047Mar 2,004,546 2,024,067 1,934,881 1,676,671 1,769,244 1,764,562 1,761,424 1,467,772 1,636,606 1,840,661Apr 1,773,816 1,916,551 2,098,528 1,590,140 1,784,754 1,675,638 1,658,459 1,298,732 1,810,870 1,818,339May 2,058,141 2,154,381 2,106,681 1,767,384 1,579,572 1,700,598 1,722,453 1,300,722 1,842,569 1,867,040Jun 2,070,682 2,022,783 1,826,588 1,655,617 1,702,211 1,544,562 1,677,950 1,496,975 2,126,686 1,971,430Jul 1,748,981 1,990,987 1,899,622 1,557,448 1,682,881 1,434,907 1,491,904 1,469,380 2,013,560 2,054,538Aug 2,115,922 2,313,532 1,807,505 1,602,192 1,668,983 1,681,938 1,868,779 1,449,538 1,870,814 1,990,396Sep 1,747,548 1,754,983 1,636,452 1,571,246 1,696,032 1,635,428 1,844,761 1,291,581 1,751,431 1,938,337Oct 1,928,282 2,106,279 2,151,302 1,896,787 1,712,923 1,705,056 1,683,777 1,794,216 2,155,602 2,234,650Nov 2,850,813 2,470,940 2,281,543 1,841,837 1,924,194 2,019,021 2,156,306 2,186,359 2,037,768 2,440,457Dec 2,071,975 1,984,724 1,870,742 1,947,581 1,947,829 2,093,294 1,824,565 1,871,541 2,045,440 1,894,584Total 23,831,300 24,295,451 23,698,371 20,252,506 20,664,214 20,179,928 20,821,298 18,320,171 22,435,257 23,202,263
Gallons
Yogurt Production Manufacturing Cream
Pounds
Sour Cream & Sour Cream Dressing Other Cream
Gallons Gallons
Yogurt35%
Sour Cream11%
Other Cream12%
Manufacturing Cream25%
Total Cottage Cheese5%
Buttermilk12%
C A L I F O R N I A
California Dairy Statistics Annual 2009 31
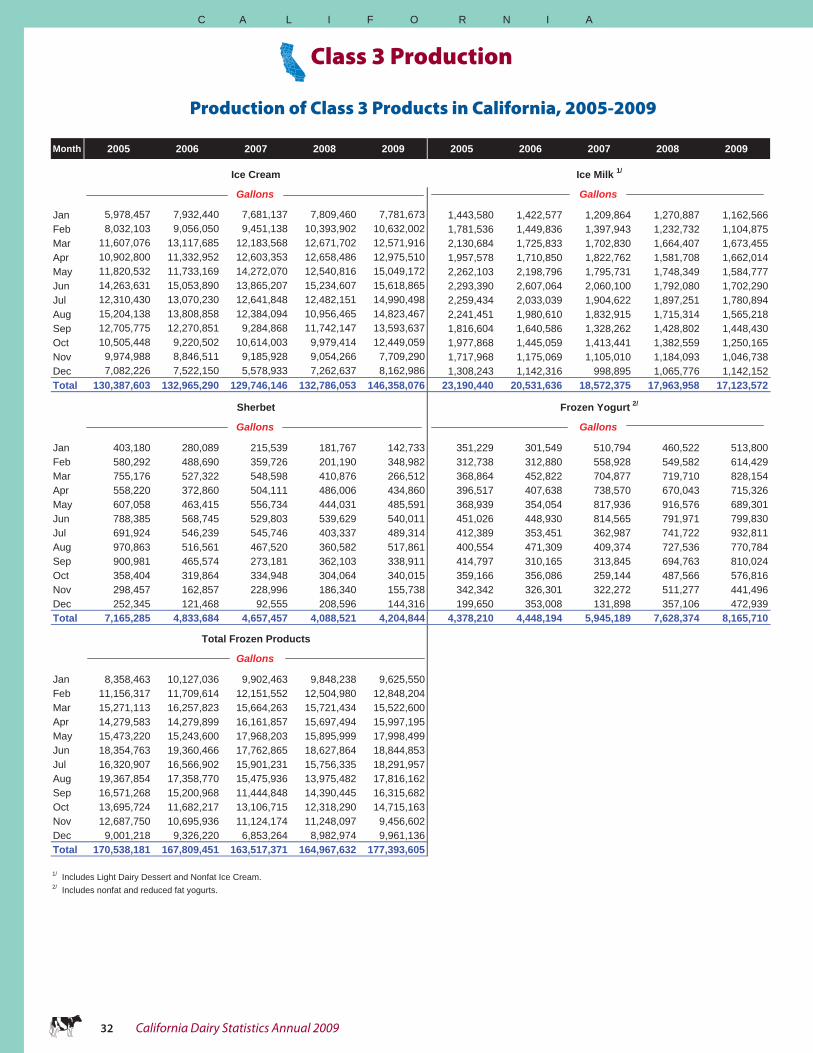
Production of Class 3 Products in California, 2005-2009
Class 3 Production
Month 2005 2006 2007 2008 2009 2005 2006 2007 2008 2009
Jan 5,978,457 7,932,440 7,681,137 7,809,460 7,781,673 1,443,580 1,422,577 1,209,864 1,270,887 1,162,566Feb 8,032,103 9,056,050 9,451,138 10,393,902 10,632,002 1,781,536 1,449,836 1,397,943 1,232,732 1,104,875Mar 11,607,076 13,117,685 12,183,568 12,671,702 12,571,916 2,130,684 1,725,833 1,702,830 1,664,407 1,673,455Apr 10,902,800 11,332,952 12,603,353 12,658,486 12,975,510 1,957,578 1,710,850 1,822,762 1,581,708 1,662,014May 11,820,532 11,733,169 14,272,070 12,540,816 15,049,172 2,262,103 2,198,796 1,795,731 1,748,349 1,584,777Jun 14,263,631 15,053,890 13,865,207 15,234,607 15,618,865 2,293,390 2,607,064 2,060,100 1,792,080 1,702,290Jul 12,310,430 13,070,230 12,641,848 12,482,151 14,990,498 2,259,434 2,033,039 1,904,622 1,897,251 1,780,894Aug 15,204,138 13,808,858 12,384,094 10,956,465 14,823,467 2,241,451 1,980,610 1,832,915 1,715,314 1,565,218Sep 12,705,775 12,270,851 9,284,868 11,742,147 13,593,637 1,816,604 1,640,586 1,328,262 1,428,802 1,448,430Oct 10,505,448 9,220,502 10,614,003 9,979,414 12,449,059 1,977,868 1,445,059 1,413,441 1,382,559 1,250,165Nov 9,974,988 8,846,511 9,185,928 9,054,266 7,709,290 1,717,968 1,175,069 1,105,010 1,184,093 1,046,738Dec 7,082,226 7,522,150 5,578,933 7,262,637 8,162,986 1,308,243 1,142,316 998,895 1,065,776 1,142,152Total 130,387,603 132,965,290 129,746,146 132,786,053 146,358,076 23,190,440 20,531,636 18,572,375 17,963,958 17,123,572
Jan 403,180 280,089 215,539 181,767 142,733 351,229 301,549 510,794 460,522 513,800Feb 580,292 488,690 359,726 201,190 348,982 312,738 312,880 558,928 549,582 614,429Mar 755,176 527,322 548,598 410,876 266,512 368,864 452,822 704,877 719,710 828,154Apr 558,220 372,860 504,111 486,006 434,860 396,517 407,638 738,570 670,043 715,326May 607,058 463,415 556,734 444,031 485,591 368,939 354,054 817,936 916,576 689,301Jun 788,385 568,745 529,803 539,629 540,011 451,026 448,930 814,565 791,971 799,830Jul 691,924 546,239 545,746 403,337 489,314 412,389 353,451 362,987 741,722 932,811Aug 970,863 516,561 467,520 360,582 517,861 400,554 471,309 409,374 727,536 770,784Sep 900,981 465,574 273,181 362,103 338,911 414,797 310,165 313,845 694,763 810,024Oct 358,404 319,864 334,948 304,064 340,015 359,166 356,086 259,144 487,566 576,816Nov 298,457 162,857 228,996 186,340 155,738 342,342 326,301 322,272 511,277 441,496Dec 252,345 121,468 92,555 208,596 144,316 199,650 353,008 131,898 357,106 472,939Total 7,165,285 4,833,684 4,657,457 4,088,521 4,204,844 4,378,210 4,448,194 5,945,189 7,628,374 8,165,710
Jan 8,358,463 10,127,036 9,902,463 9,848,238 9,625,550Feb 11,156,317 11,709,614 12,151,552 12,504,980 12,848,204Mar 15,271,113 16,257,823 15,664,263 15,721,434 15,522,600Apr 14,279,583 14,279,899 16,161,857 15,697,494 15,997,195May 15,473,220 15,243,600 17,968,203 15,895,999 17,998,499Jun 18,354,763 19,360,466 17,762,865 18,627,864 18,844,853Jul 16,320,907 16,566,902 15,901,231 15,756,335 18,291,957Aug 19,367,854 17,358,770 15,475,936 13,975,482 17,816,162Sep 16,571,268 15,200,968 11,444,848 14,390,445 16,315,682Oct 13,695,724 11,682,217 13,106,715 12,318,290 14,715,163Nov 12,687,750 10,695,936 11,124,174 11,248,097 9,456,602Dec 9,001,218 9,326,220 6,853,264 8,982,974 9,961,136Total 170,538,181 167,809,451 163,517,371 164,967,632 177,393,605
1/ Includes Light Dairy Dessert and Nonfat Ice Cream.2/ Includes nonfat and reduced fat yogurts.
Frozen Yogurt 2/
Gallons
Sherbet
Gallons
Total Frozen Products
Gallons
Ice Cream
Gallons
Ice Milk 1/
Gallons
C A L I F O R N I A
32 California Dairy Statistics Annual 2009
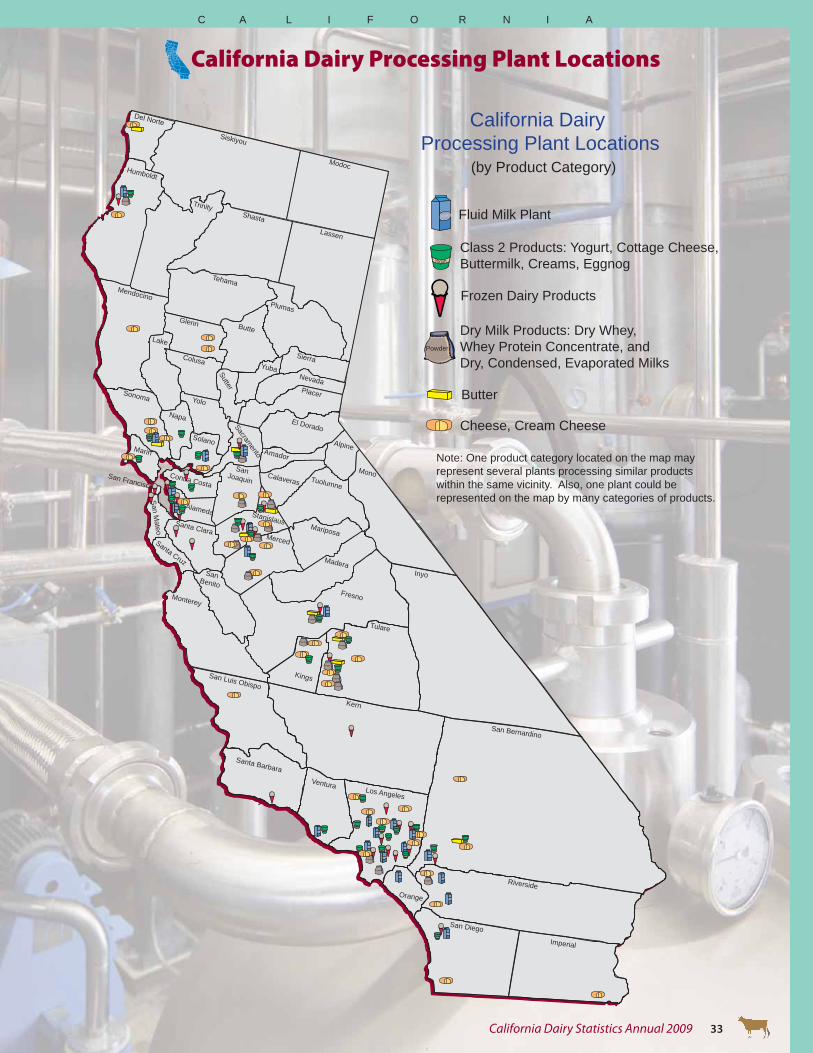
Del NorteDel Norte
SiskiyouSiskiyou
ModocModoc
LassenLassen
ShastaShasta
TrinityTrinity
HumboldtHumboldt
MendocinoMendocino
TehamaTehama
ButteButte
PlumasPlumas
GlennGlenn
LakeLake
SierraSierraColusaColusa
YoloYoloSonomaSonoma
YubaYubaNevadaNevadaPlacerPlacer
El DoradoEl Dorado
SutterSutter
NapaNapa
SolanoSolano
Sacramento
Sacramento Amador
Amador
AlpineAlpineMarinMarin
Contra CostaContra Costa
SanSanJoaquinJoaquin
CalaverasCalaveras
San Mateo
San Mateo
AlamedaAlameda
TuolumneTuolumne
Santa Cruz
Santa Cruz
Santa ClaraSanta Clara
StanislausStanislaus
MercedMerced
MariposaMariposa
MaderaMadera
SanSanBenitoBenito
MontereyMonterey FresnoFresno
KingsKings
San Luis ObispoSan Luis Obispo
Santa BarbaraSanta Barbara
VenturaVentura
Del Norte
Siskiyou
Modoc
Lassen
Shasta
Trinity
Humboldt
Mendocino
Tehama
Butte
PlumasGlenn
Lake
SierraColusa
YoloSonoma
YubaNevadaPlacer
El Dorado
Sutter
Napa
Solano
Sacramento Amador
Alpine
MonoSan Francisco
Marin
Contra Costa
SanJoaquin
Calaveras
San Mateo
Alameda
Tuolumne
Santa Cruz
Santa Clara
Stanislaus
Merced
Mariposa
MaderaSan
Benito
MontereyFresno
Kings
Inyo
Tulare
San Luis Obispo
Kern
Santa BarbaraVentura Los Angeles
Orange
San Diego
Imperial
Riverside
San Bernardino
California Dairy Processing Plant Locations
(by Product Category)
Fluid Milk Plant
Class 2 Products: Yogurt, Cottage Cheese, Buttermilk, Creams, Eggnog
Cheese, Cream Cheese
Frozen Dairy Products
Dry Milk Products: Dry Whey, Whey Protein Concentrate, and Dry, Condensed, Evaporated Milks
Butter
Milk
Powder
Yogurt
Note: One product category located on the map may represent several plants processing similar products within the same vicinity. Also, one plant could be represented on the map by many categories of products.
MilkMilk
Milk
Milk
Powder
Powder
Powder
Powder
Powder
Powder
Powder
Powder
Yogurt
Yogurt
Yogurt
Yogurt
Yogurt
Yogurt
Yogurt
Yogurt
Yogurt
Milk
Milk
Milk
Milk
Milk
Milk
Milk
Milk
Milk
Milk
Milk
Milk
Powder
Powder
Powder
Powder
Powder
Milk
Milk
Milk
Milk
Yogurt
Yogurt
Yogurt
Yogurt
Yogurt
Yogurt
Yogurt
Yogurt
Yogurt
Yogurt Yogurt
Yogurt
Yogurt
Yogurt
Yogurt
Yogurt
Yogurt
Yogurt
Milk
Milk
Yogurt
Yogurt
Yogurt
Yogurt
Powder
Powder
Powder
Powder
Powder
California Dairy Processing Plant Locations
C A L I F O R N I A
California Dairy Statistics Annual 2009 33
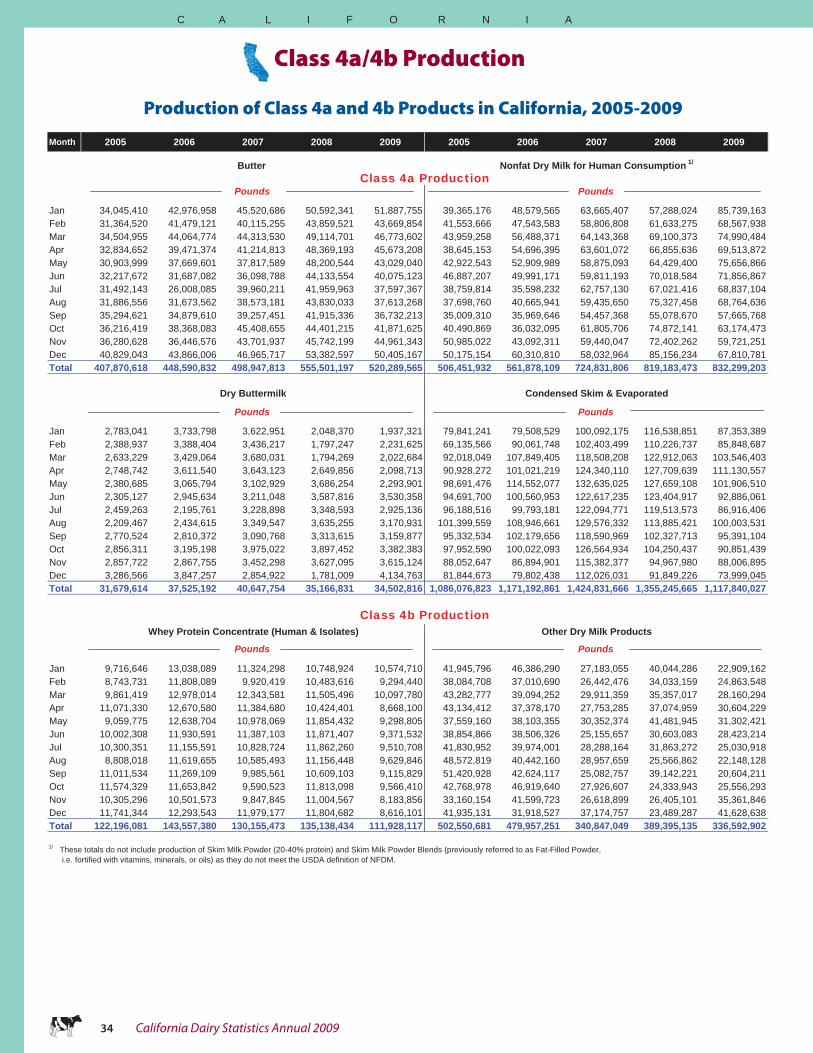
Production of Class 4a and 4b Products in California, 2005-2009
Class 4a/4b Production
Month 2005 2006 2007 2008 2009 2005 2006 2007 2008 2009
Jan 34,045,410 42,976,958 45,520,686 50,592,341 51,887,755 39,365,176 48,579,565 63,665,407 57,288,024 85,739,163Feb 31,364,520 41,479,121 40,115,255 43,859,521 43,669,854 41,553,666 47,543,583 58,806,808 61,633,275 68,567,938Mar 34,504,955 44,064,774 44,313,530 49,114,701 46,773,602 43,959,258 56,488,371 64,143,368 69,100,373 74,990,484Apr 32,834,652 39,471,374 41,214,813 48,369,193 45,673,208 38,645,153 54,696,395 63,601,072 66,855,636 69,513,872May 30,903,999 37,669,601 37,817,589 48,200,544 43,029,040 42,922,543 52,909,989 58,875,093 64,429,400 75,656,866Jun 32,217,672 31,687,082 36,098,788 44,133,554 40,075,123 46,887,207 49,991,171 59,811,193 70,018,584 71,856,867Jul 31,492,143 26,008,085 39,960,211 41,959,963 37,597,367 38,759,814 35,598,232 62,757,130 67,021,416 68,837,104Aug 31,886,556 31,673,562 38,573,181 43,830,033 37,613,268 37,698,760 40,665,941 59,435,650 75,327,458 68,764,636Sep 35,294,621 34,879,610 39,257,451 41,915,336 36,732,213 35,009,310 35,969,646 54,457,368 55,078,670 57,665,768Oct 36,216,419 38,368,083 45,408,655 44,401,215 41,871,625 40,490,869 36,032,095 61,805,706 74,872,141 63,174,473Nov 36,280,628 36,446,576 43,701,937 45,742,199 44,961,343 50,985,022 43,092,311 59,440,047 72,402,262 59,721,251Dec 40,829,043 43,866,006 46,965,717 53,382,597 50,405,167 50,175,154 60,310,810 58,032,964 85,156,234 67,810,781Total 407,870,618 448,590,832 498,947,813 555,501,197 520,289,565 506,451,932 561,878,109 724,831,806 819,183,473 832,299,203
Jan 2,783,041 3,733,798 3,622,951 2,048,370 1,937,321 79,841,241 79,508,529 100,092,175 116,538,851 87,353,389Feb 2,388,937 3,388,404 3,436,217 1,797,247 2,231,625 69,135,566 90,061,748 102,403,499 110,226,737 85,848,687Mar 2,633,229 3,429,064 3,680,031 1,794,269 2,022,684 92,018,049 107,849,405 118,508,208 122,912,063 103,546,403Apr 2,748,742 3,611,540 3,643,123 2,649,856 2,098,713 90,928,272 101,021,219 124,340,110 127,709,639 111,130,557May 2,380,685 3,065,794 3,102,929 3,686,254 2,293,901 98,691,476 114,552,077 132,635,025 127,659,108 101,906,510Jun 2,305,127 2,945,634 3,211,048 3,587,816 3,530,358 94,691,700 100,560,953 122,617,235 123,404,917 92,886,061Jul 2,459,263 2,195,761 3,228,898 3,348,593 2,925,136 96,188,516 99,793,181 122,094,771 119,513,573 86,916,406Aug 2,209,467 2,434,615 3,349,547 3,635,255 3,170,931 101,399,559 108,946,661 129,576,332 113,885,421 100,003,531Sep 2,770,524 2,810,372 3,090,768 3,313,615 3,159,877 95,332,534 102,179,656 118,590,969 102,327,713 95,391,104Oct 2,856,311 3,195,198 3,975,022 3,897,452 3,382,383 97,952,590 100,022,093 126,564,934 104,250,437 90,851,439Nov 2,857,722 2,867,755 3,452,298 3,627,095 3,615,124 88,052,647 86,894,901 115,382,377 94,967,980 88,006,895Dec 3,286,566 3,847,257 2,854,922 1,781,009 4,134,763 81,844,673 79,802,438 112,026,031 91,849,226 73,999,045Total 31,679,614 37,525,192 40,647,754 35,166,831 34,502,816 1,086,076,823 1,171,192,861 1,424,831,666 1,355,245,665 1,117,840,027
Jan 9,716,646 13,038,089 11,324,298 10,748,924 10,574,710 41,945,796 46,386,290 27,183,055 40,044,286 22,909,162Feb 8,743,731 11,808,089 9,920,419 10,483,616 9,294,440 38,084,708 37,010,690 26,442,476 34,033,159 24,863,548Mar 9,861,419 12,978,014 12,343,581 11,505,496 10,097,780 43,282,777 39,094,252 29,911,359 35,357,017 28,160,294Apr 11,071,330 12,670,580 11,384,680 10,424,401 8,668,100 43,134,412 37,378,170 27,753,285 37,074,959 30,604,229May 9,059,775 12,638,704 10,978,069 11,854,432 9,298,805 37,559,160 38,103,355 30,352,374 41,481,945 31,302,421Jun 10,002,308 11,930,591 11,387,103 11,871,407 9,371,532 38,854,866 38,506,326 25,155,657 30,603,083 28,423,214Jul 10,300,351 11,155,591 10,828,724 11,862,260 9,510,708 41,830,952 39,974,001 28,288,164 31,863,272 25,030,918Aug 8,808,018 11,619,655 10,585,493 11,156,448 9,629,846 48,572,819 40,442,160 28,957,659 25,566,862 22,148,128Sep 11,011,534 11,269,109 9,985,561 10,609,103 9,115,829 51,420,928 42,624,117 25,082,757 39,142,221 20,604,211Oct 11,574,329 11,653,842 9,590,523 11,813,098 9,566,410 42,768,978 46,919,640 27,926,607 24,333,943 25,556,293Nov 10,305,296 10,501,573 9,847,845 11,004,567 8,183,856 33,160,154 41,599,723 26,618,899 26,405,101 35,361,846Dec 11,741,344 12,293,543 11,979,177 11,804,682 8,616,101 41,935,131 31,918,527 37,174,757 23,489,287 41,628,638Total 122,196,081 143,557,380 130,155,473 135,138,434 111,928,117 502,550,681 479,957,251 340,847,049 389,395,135 336,592,902
1/ These totals do not include production of Skim Milk Powder (20-40% protein) and Skim Milk Powder Blends (previously referred to as Fat-Filled Powder, i.e. fortified with vitamins, minerals, or oils) as they do not meet the USDA definition of NFDM.
Class 4b Production
Pounds
Pounds
Pounds
Butter
Pounds
Other Dry Milk Products
Pounds
Whey Protein Concentrate (Human & Isolates)
Nonfat Dry Milk for Human Consumption 1/
Condensed Skim & Evaporated
Pounds
Dry Buttermilk
Class 4a Production
C A L I F O R N I A C A L I F O R N I A
34 California Dairy Statistics Annual 2009
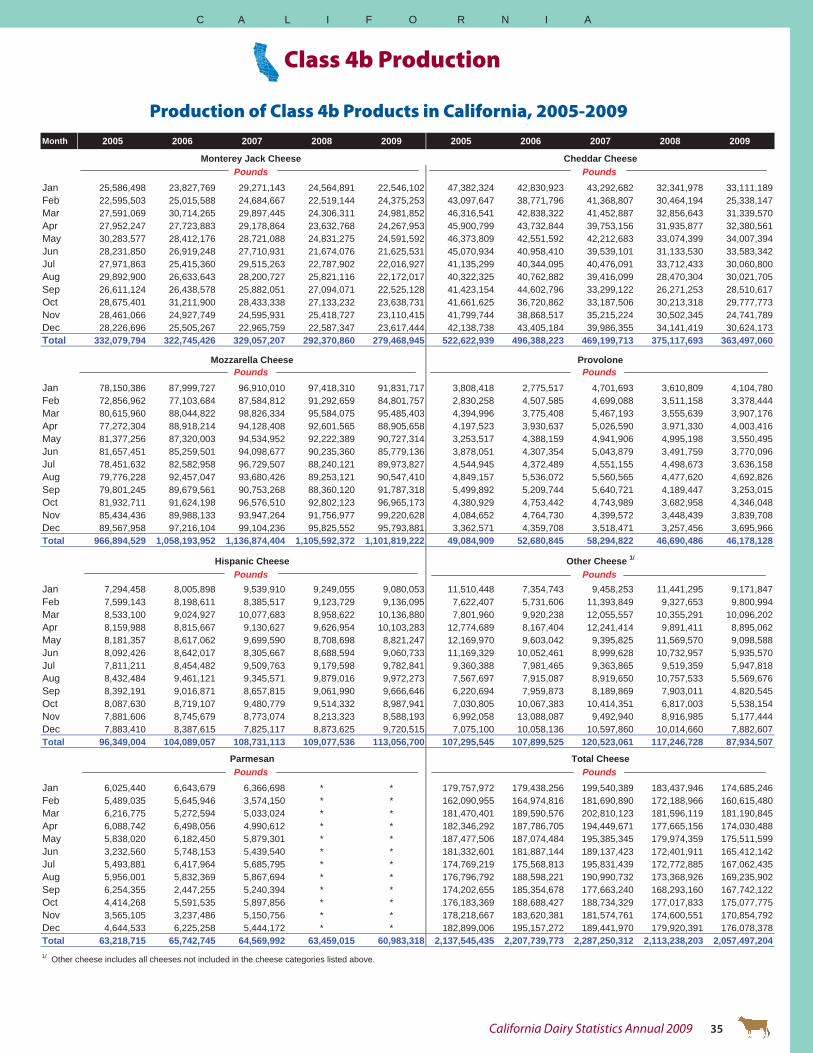
Production of Class 4b Products in California, 2005-2009
Class 4b Production
Month 2005 2006 2007 2008 2009 2005 2006 2007 2008 2009
Jan 25,586,498 23,827,769 29,271,143 24,564,891 22,546,102 47,382,324 42,830,923 43,292,682 32,341,978 33,111,189Feb 22,595,503 25,015,588 24,684,667 22,519,144 24,375,253 43,097,647 38,771,796 41,368,807 30,464,194 25,338,147Mar 27,591,069 30,714,265 29,897,445 24,306,311 24,981,852 46,316,541 42,838,322 41,452,887 32,856,643 31,339,570Apr 27,952,247 27,723,883 29,178,864 23,632,768 24,267,953 45,900,799 43,732,844 39,753,156 31,935,877 32,380,561May 30,283,577 28,412,176 28,721,088 24,831,275 24,591,592 46,373,809 42,551,592 42,212,683 33,074,399 34,007,394Jun 28,231,850 26,919,248 27,710,931 21,674,076 21,625,531 45,070,934 40,958,410 39,539,101 31,133,530 33,583,342Jul 27,971,863 25,415,360 29,515,263 22,787,902 22,016,927 41,135,299 40,344,095 40,476,091 33,712,433 30,060,800Aug 29,892,900 26,633,643 28,200,727 25,821,116 22,172,017 40,322,325 40,762,882 39,416,099 28,470,304 30,021,705Sep 26,611,124 26,438,578 25,882,051 27,094,071 22,525,128 41,423,154 44,602,796 33,299,122 26,271,253 28,510,617Oct 28,675,401 31,211,900 28,433,338 27,133,232 23,638,731 41,661,625 36,720,862 33,187,506 30,213,318 29,777,773Nov 28,461,066 24,927,749 24,595,931 25,418,727 23,110,415 41,799,744 38,868,517 35,215,224 30,502,345 24,741,789Dec 28,226,696 25,505,267 22,965,759 22,587,347 23,617,444 42,138,738 43,405,184 39,986,355 34,141,419 30,624,173Total 332,079,794 322,745,426 329,057,207 292,370,860 279,468,945 522,622,939 496,388,223 469,199,713 375,117,693 363,497,060
Jan 78,150,386 87,999,727 96,910,010 97,418,310 91,831,717 3,808,418 2,775,517 4,701,693 3,610,809 4,104,780Feb 72,856,962 77,103,684 87,584,812 91,292,659 84,801,757 2,830,258 4,507,585 4,699,088 3,511,158 3,378,444Mar 80,615,960 88,044,822 98,826,334 95,584,075 95,485,403 4,394,996 3,775,408 5,467,193 3,555,639 3,907,176Apr 77,272,304 88,918,214 94,128,408 92,601,565 88,905,658 4,197,523 3,930,637 5,026,590 3,971,330 4,003,416May 81,377,256 87,320,003 94,534,952 92,222,389 90,727,314 3,253,517 4,388,159 4,941,906 4,995,198 3,550,495Jun 81,657,451 85,259,501 94,098,677 90,235,360 85,779,136 3,878,051 4,307,354 5,043,879 3,491,759 3,770,096Jul 78,451,632 82,582,958 96,729,507 88,240,121 89,973,827 4,544,945 4,372,489 4,551,155 4,498,673 3,636,158Aug 79,776,228 92,457,047 93,680,426 89,253,121 90,547,410 4,849,157 5,536,072 5,560,565 4,477,620 4,692,826Sep 79,801,245 89,679,561 90,753,268 88,360,120 91,787,318 5,499,892 5,209,744 5,640,721 4,189,447 3,253,015Oct 81,932,711 91,624,198 96,576,510 92,802,123 96,965,173 4,380,929 4,753,442 4,743,989 3,682,958 4,346,048Nov 85,434,436 89,988,133 93,947,264 91,756,977 99,220,628 4,084,652 4,764,730 4,399,572 3,448,439 3,839,708Dec 89,567,958 97,216,104 99,104,236 95,825,552 95,793,881 3,362,571 4,359,708 3,518,471 3,257,456 3,695,966Total 966,894,529 1,058,193,952 1,136,874,404 1,105,592,372 1,101,819,222 49,084,909 52,680,845 58,294,822 46,690,486 46,178,128
Jan 7,294,458 8,005,898 9,539,910 9,249,055 9,080,053 11,510,448 7,354,743 9,458,253 11,441,295 9,171,847Feb 7,599,143 8,198,611 8,385,517 9,123,729 9,136,095 7,622,407 5,731,606 11,393,849 9,327,653 9,800,994Mar 8,533,100 9,024,927 10,077,683 8,958,622 10,136,880 7,801,960 9,920,238 12,055,557 10,355,291 10,096,202Apr 8,159,988 8,815,667 9,130,627 9,626,954 10,103,283 12,774,689 8,167,404 12,241,414 9,891,411 8,895,062May 8,181,357 8,617,062 9,699,590 8,708,698 8,821,247 12,169,970 9,603,042 9,395,825 11,569,570 9,098,588Jun 8,092,426 8,642,017 8,305,667 8,688,594 9,060,733 11,169,329 10,052,461 8,999,628 10,732,957 5,935,570Jul 7,811,211 8,454,482 9,509,763 9,179,598 9,782,841 9,360,388 7,981,465 9,363,865 9,519,359 5,947,818Aug 8,432,484 9,461,121 9,345,571 9,879,016 9,972,273 7,567,697 7,915,087 8,919,650 10,757,533 5,569,676Sep 8,392,191 9,016,871 8,657,815 9,061,990 9,666,646 6,220,694 7,959,873 8,189,869 7,903,011 4,820,545Oct 8,087,630 8,719,107 9,480,779 9,514,332 8,987,941 7,030,805 10,067,383 10,414,351 6,817,003 5,538,154Nov 7,881,606 8,745,679 8,773,074 8,213,323 8,588,193 6,992,058 13,088,087 9,492,940 8,916,985 5,177,444Dec 7,883,410 8,387,615 7,825,117 8,873,625 9,720,515 7,075,100 10,058,136 10,597,860 10,014,660 7,882,607Total 96,349,004 104,089,057 108,731,113 109,077,536 113,056,700 107,295,545 107,899,525 120,523,061 117,246,728 87,934,507
Jan 6,025,440 6,643,679 6,366,698 * * 179,757,972 179,438,256 199,540,389 183,437,946 174,685,246Feb 5,489,035 5,645,946 3,574,150 * * 162,090,955 164,974,816 181,690,890 172,188,966 160,615,480Mar 6,216,775 5,272,594 5,033,024 * * 181,470,401 189,590,576 202,810,123 181,596,119 181,190,845Apr 6,088,742 6,498,056 4,990,612 * * 182,346,292 187,786,705 194,449,671 177,665,156 174,030,488May 5,838,020 6,182,450 5,879,301 * * 187,477,506 187,074,484 195,385,345 179,974,359 175,511,599Jun 3,232,560 5,748,153 5,439,540 * * 181,332,601 181,887,144 189,137,423 172,401,911 165,412,142Jul 5,493,881 6,417,964 5,685,795 * * 174,769,219 175,568,813 195,831,439 172,772,885 167,062,435Aug 5,956,001 5,832,369 5,867,694 * * 176,796,792 188,598,221 190,990,732 173,368,926 169,235,902Sep 6,254,355 2,447,255 5,240,394 * * 174,202,655 185,354,678 177,663,240 168,293,160 167,742,122Oct 4,414,268 5,591,535 5,897,856 * * 176,183,369 188,688,427 188,734,329 177,017,833 175,077,775Nov 3,565,105 3,237,486 5,150,756 * * 178,218,667 183,620,381 181,574,761 174,600,551 170,854,792Dec 4,644,533 6,225,258 5,444,172 * * 182,899,006 195,157,272 189,441,970 179,920,391 176,078,378Total 63,218,715 65,742,745 64,569,992 63,459,015 60,983,318 2,137,545,435 2,207,739,773 2,287,250,312 2,113,238,203 2,057,497,2041/ Other cheese includes all cheeses not included in the cheese categories listed above.
Pounds Pounds
Pounds
,
Pounds
Mozzarella Cheese
Cheddar Cheese
Provolone
Total CheesePounds
ParmesanPounds
Hispanic CheesePounds
Other Cheese 1/
Pounds
Monterey Jack Cheese
C A L I F O R N I A
California Dairy Statistics Annual 2009 35
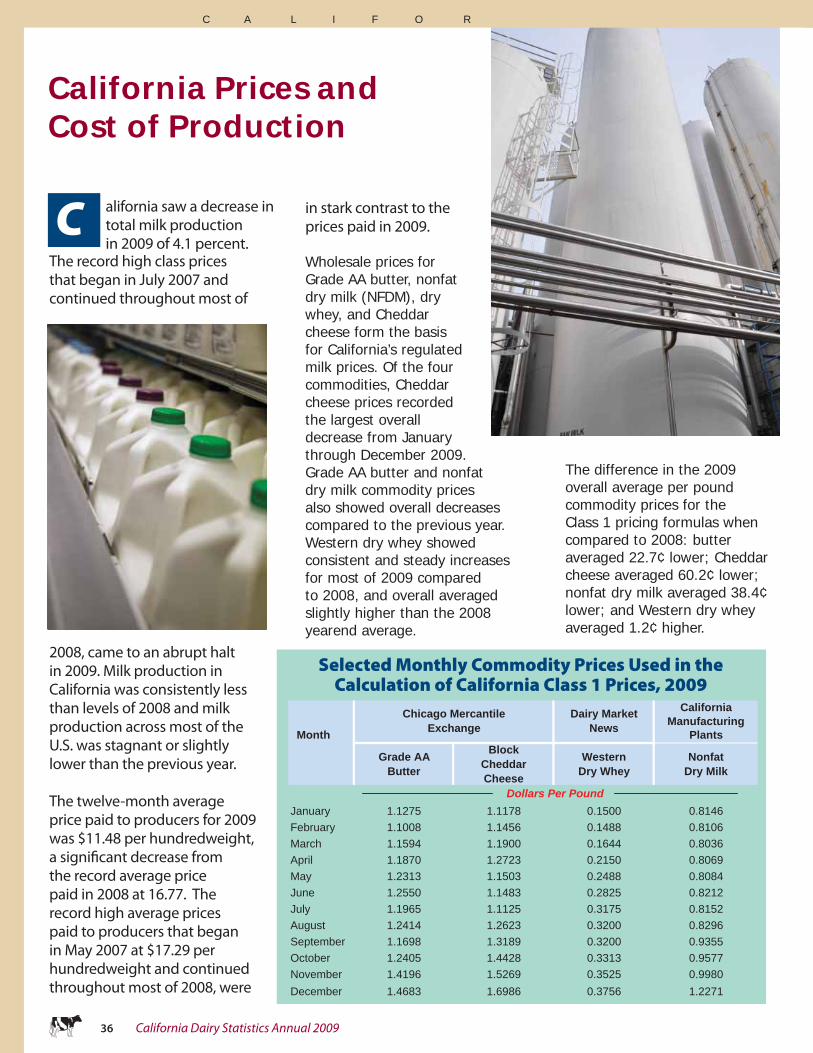
C alifornia saw a decrease in total milk productionin 2009 of 4.1 percent.
The record high class prices that began in July 2007 and continued throughout most of
2008, came to an abrupt halt in 2009. Milk production in California was consistently less than levels of 2008 and milk production across most of the U.S. was stagnant or slightly lower than the previous year.
The twelve-month average price paid to producers for 2009 was $11.48 per hundredweight, a signifi cant decrease from the record average price paid in 2008 at 16.77. The record high average prices paid to producers that began in May 2007 at $17.29 per hundredweight and continued throughout most of 2008, were
CaliforniaManufacturing
Month Plants
Grade AA Butter
Block Cheddar Cheese
WesternDry Whey
NonfatDry Milk
January 1.1275 1.1178 0.1500 0.8146February 1.1008 1.1456 0.1488 0.8106March 1.1594 1.1900 0.1644 0.8036April 1.1870 1.2723 0.2150 0.8069May 1.2313 1.1503 0.2488 0.8084June 1.2550 1.1483 0.2825 0.8212July 1.1965 1.1125 0.3175 0.8152August 1.2414 1.2623 0.3200 0.8296September 1.1698 1.3189 0.3200 0.9355October 1.2405 1.4428 0.3313 0.9577November 1.4196 1.5269 0.3525 0.9980December 1.4683 1.6986 0.3756 1.2271
Dollars Per Pound
Chicago Mercantile Exchange
Dairy Market News
California Prices and Cost of Production
in stark contrast to the prices paid in 2009.
Wholesale prices for Grade AA butter, nonfat dry milk (NFDM), dry whey, and Cheddar cheese form the basis for California’s regulated milk prices. Of the four commodities, Cheddar cheese prices recorded the largest overall decrease from January through December 2009. Grade AA butter and nonfat dry milk commodity prices also showed overall decreases compared to the previous year. Western dry whey showed consistent and steady increases for most of 2009 compared to 2008, and overall averaged slightly higher than the 2008 yearend average.
C A L I F O R
The difference in the 2009 overall average per pound commodity prices for the Class 1 pricing formulas when compared to 2008: butter averaged 22.7¢ lower; Cheddar cheese averaged 60.2¢ lower; nonfat dry milk averaged 38.4¢ lower; and Western dry whey averaged 1.2¢ higher.
Selected Monthly Commodity Prices Used in theCalculation of California Class 1 Prices, 2009
36 California Dairy Statistics Annual 2009
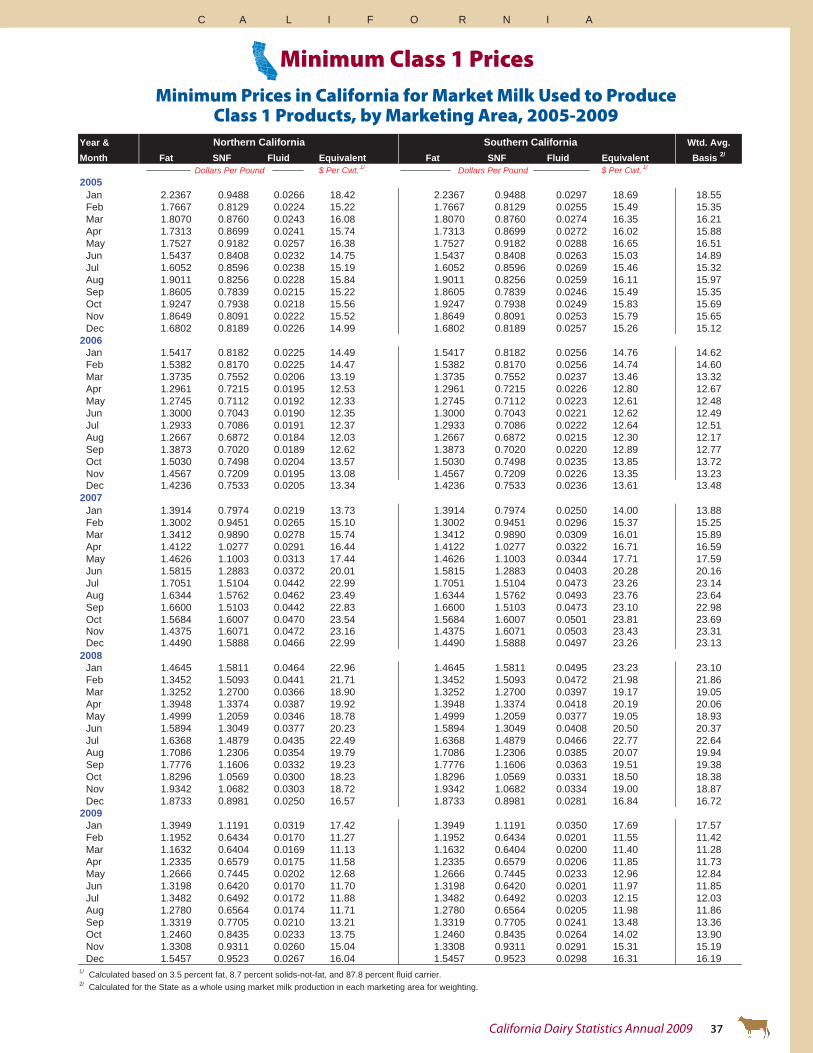
Minimum Prices in California for Market Milk Used to ProduceClass 1 Products, by Marketing Area, 2005-2009
Minimum Class 1 Prices
Year & Wtd. Avg.Month Fat SNF Fluid Equivalent Fat SNF Fluid Equivalent Basis 2/
Dollars Per Pound $ Per Cwt. 1/ $ Per Cwt. 1/
2005Jan 2.2367 0.9488 0.0266 18.42 2.2367 0.9488 0.0297 18.69 18.55Feb 1.7667 0.8129 0.0224 15.22 1.7667 0.8129 0.0255 15.49 15.35Mar 1.8070 0.8760 0.0243 16.08 1.8070 0.8760 0.0274 16.35 16.21Apr 1.7313 0.8699 0.0241 15.74 1.7313 0.8699 0.0272 16.02 15.88May 1.7527 0.9182 0.0257 16.38 1.7527 0.9182 0.0288 16.65 16.51Jun 1.5437 0.8408 0.0232 14.75 1.5437 0.8408 0.0263 15.03 14.89Jul 1.6052 0.8596 0.0238 15.19 1.6052 0.8596 0.0269 15.46 15.32Aug 1.9011 0.8256 0.0228 15.84 1.9011 0.8256 0.0259 16.11 15.97Sep 1.8605 0.7839 0.0215 15.22 1.8605 0.7839 0.0246 15.49 15.35Oct 1.9247 0.7938 0.0218 15.56 1.9247 0.7938 0.0249 15.83 15.69Nov 1.8649 0.8091 0.0222 15.52 1.8649 0.8091 0.0253 15.79 15.65Dec 1.6802 0.8189 0.0226 14.99 1.6802 0.8189 0.0257 15.26 15.12
2006Jan 1.5417 0.8182 0.0225 14.49 1.5417 0.8182 0.0256 14.76 14.62Feb 1.5382 0.8170 0.0225 14.47 1.5382 0.8170 0.0256 14.74 14.60Mar 1.3735 0.7552 0.0206 13.19 1.3735 0.7552 0.0237 13.46 13.32Apr 1.2961 0.7215 0.0195 12.53 1.2961 0.7215 0.0226 12.80 12.67May 1.2745 0.7112 0.0192 12.33 1.2745 0.7112 0.0223 12.61 12.48Jun 1.3000 0.7043 0.0190 12.35 1.3000 0.7043 0.0221 12.62 12.49Jul 1.2933 0.7086 0.0191 12.37 1.2933 0.7086 0.0222 12.64 12.51Aug 1.2667 0.6872 0.0184 12.03 1.2667 0.6872 0.0215 12.30 12.17Sep 1.3873 0.7020 0.0189 12.62 1.3873 0.7020 0.0220 12.89 12.77Oct 1.5030 0.7498 0.0204 13.57 1.5030 0.7498 0.0235 13.85 13.72Nov 1.4567 0.7209 0.0195 13.08 1.4567 0.7209 0.0226 13.35 13.23Dec 1.4236 0.7533 0.0205 13.34 1.4236 0.7533 0.0236 13.61 13.48
2007Jan 1.3914 0.7974 0.0219 13.73 1.3914 0.7974 0.0250 14.00 13.88Feb 1.3002 0.9451 0.0265 15.10 1.3002 0.9451 0.0296 15.37 15.25Mar 1.3412 0.9890 0.0278 15.74 1.3412 0.9890 0.0309 16.01 15.89Apr 1.4122 1.0277 0.0291 16.44 1.4122 1.0277 0.0322 16.71 16.59May 1.4626 1.1003 0.0313 17.44 1.4626 1.1003 0.0344 17.71 17.59Jun 1.5815 1.2883 0.0372 20.01 1.5815 1.2883 0.0403 20.28 20.16Jul 1.7051 1.5104 0.0442 22.99 1.7051 1.5104 0.0473 23.26 23.14Aug 1.6344 1.5762 0.0462 23.49 1.6344 1.5762 0.0493 23.76 23.64Sep 1.6600 1.5103 0.0442 22.83 1.6600 1.5103 0.0473 23.10 22.98Oct 1.5684 1.6007 0.0470 23.54 1.5684 1.6007 0.0501 23.81 23.69Nov 1.4375 1.6071 0.0472 23.16 1.4375 1.6071 0.0503 23.43 23.31Dec 1.4490 1.5888 0.0466 22.99 1.4490 1.5888 0.0497 23.26 23.13
2008Jan 1.4645 1.5811 0.0464 22.96 1.4645 1.5811 0.0495 23.23 23.10Feb 1.3452 1.5093 0.0441 21.71 1.3452 1.5093 0.0472 21.98 21.86Mar 1.3252 1.2700 0.0366 18.90 1.3252 1.2700 0.0397 19.17 19.05Apr 1.3948 1.3374 0.0387 19.92 1.3948 1.3374 0.0418 20.19 20.06May 1.4999 1.2059 0.0346 18.78 1.4999 1.2059 0.0377 19.05 18.93Jun 1.5894 1.3049 0.0377 20.23 1.5894 1.3049 0.0408 20.50 20.37Jul 1.6368 1.4879 0.0435 22.49 1.6368 1.4879 0.0466 22.77 22.64Aug 1.7086 1.2306 0.0354 19.79 1.7086 1.2306 0.0385 20.07 19.94Sep 1.7776 1.1606 0.0332 19.23 1.7776 1.1606 0.0363 19.51 19.38Oct 1.8296 1.0569 0.0300 18.23 1.8296 1.0569 0.0331 18.50 18.38Nov 1.9342 1.0682 0.0303 18.72 1.9342 1.0682 0.0334 19.00 18.87Dec 1.8733 0.8981 0.0250 16.57 1.8733 0.8981 0.0281 16.84 16.72
2009Jan 1.3949 1.1191 0.0319 17.42 1.3949 1.1191 0.0350 17.69 17.57Feb 1.1952 0.6434 0.0170 11.27 1.1952 0.6434 0.0201 11.55 11.42Mar 1.1632 0.6404 0.0169 11.13 1.1632 0.6404 0.0200 11.40 11.28Apr 1.2335 0.6579 0.0175 11.58 1.2335 0.6579 0.0206 11.85 11.73May 1.2666 0.7445 0.0202 12.68 1.2666 0.7445 0.0233 12.96 12.84Jun 1.3198 0.6420 0.0170 11.70 1.3198 0.6420 0.0201 11.97 11.85Jul 1.3482 0.6492 0.0172 11.88 1.3482 0.6492 0.0203 12.15 12.03Aug 1.2780 0.6564 0.0174 11.71 1.2780 0.6564 0.0205 11.98 11.86Sep 1.3319 0.7705 0.0210 13.21 1.3319 0.7705 0.0241 13.48 13.36Oct 1.2460 0.8435 0.0233 13.75 1.2460 0.8435 0.0264 14.02 13.90Nov 1.3308 0.9311 0.0260 15.04 1.3308 0.9311 0.0291 15.31 15.19Dec 1.5457 0.9523 0.0267 16.04 1.5457 0.9523 0.0298 16.31 16.19
1/ Calculated based on 3.5 percent fat, 8.7 percent solids-not-fat, and 87.8 percent fluid carrier.2/ Calculated for the State as a whole using market milk production in each marketing area for weighting.
Dollars Per Pound
Southern CaliforniaNorthern California
C A L I F O R N I A
California Dairy Statistics Annual 2009 37

C A L I F O R N I A
Whole ReducedFat Lowfat Skim Whole Reduced
Fat Lowfat Skim Whole ReducedFat Lowfat Skim
Albany 3.96 3.92 3.89 3.85 3.21 3.09 3.10 2.95 2.99 2.93 2.90 2.76Atlanta 4.08 4.14 4.08 4.13 3.50 3.52 3.41 3.47 2.45 2.45 2.33 2.40Baltimore 3.89 3.84 3.71 3.66 3.68 3.68 3.58 3.36 3.42 3.37 3.31 3.00Birmingham 4.12 4.07 4.03 4.11 3.79 3.75 3.76 3.70 3.27 3.18 3.17 3.17Boston 3.60 3.57 3.60 3.59 3.53 3.50 3.51 3.48 2.91 2.91 2.91 2.90Buffalo/Rochester 3.29 3.11 2.90 2.71 2.97 2.75 2.66 2.40 2.17 2.08 1.97 1.84Charlotte 4.06 4.01 4.01 3.97 3.41 3.35 3.32 3.32 3.04 3.06 3.08 3.05Chicago 3.14 3.03 3.02 3.03 2.63 2.53 2.49 2.46 2.58 2.39 2.40 2.35Cincinnati 2.96 2.94 2.89 2.89 2.90 2.87 2.81 2.81 2.07 2.04 1.98 1.99Cleveland 3.52 3.33 3.37 3.32 3.33 3.14 3.17 3.11 2.46 2.33 2.37 2.39Columbus 3.01 2.97 2.87 2.84 3.05 2.98 2.82 2.85 2.07 2.04 1.95 1.98Dallas 3.84 3.85 3.93 3.80 3.46 3.39 3.40 3.11 2.73 2.69 2.72 2.41Denver 3.27 3.18 3.19 3.05 2.93 2.87 2.93 2.77 2.31 2.24 2.29 2.13Des Moines 3.82 3.60 3.46 3.34 3.52 3.22 3.03 2.86 3.30 3.06 2.93 2.82Detroit 3.07 3.02 2.95 2.98 2.95 2.87 2.84 2.86 2.12 2.09 1.96 2.05Grand Rapids 3.23 3.16 3.14 3.13 2.90 2.80 2.97 2.78 2.33 2.26 2.11 2.17Hartford-New Haven 3.93 3.95 3.96 4.08 3.86 3.88 3.83 4.03 3.52 3.58 3.52 3.57Houston 3.76 3.65 3.56 3.52 3.43 3.41 3.31 3.18 2.65 2.61 2.58 2.37Indianapolis 3.18 3.15 3.08 3.12 3.07 3.00 2.95 2.95 2.23 2.21 2.12 2.14Jacksonville 4.22 4.19 4.19 4.18 3.65 3.60 3.57 3.58 3.20 3.13 3.17 3.16Kansas City 4.02 3.85 3.83 3.68 3.73 3.56 3.48 3.30 3.44 3.29 3.24 3.11Las Vegas 3.55 3.42 3.34 3.41 2.99 2.85 2.88 3.00 2.62 2.44 2.54 2.64Little Rock 4.10 4.03 3.92 3.85 3.69 3.54 3.31 3.24 3.23 3.18 3.15 3.12Los Angeles 3.62 3.51 3.69 3.27 2.99 2.75 2.93 2.61 2.81 2.72 2.86 2.54Louisville 3.48 3.37 3.14 3.20 3.34 3.29 3.12 3.12 2.42 2.39 2.26 2.29Memphis 4.09 3.96 3.63 3.72 3.72 3.55 3.18 3.17 2.95 2.90 2.68 2.77Miami 4.30 4.31 4.20 4.24 3.81 3.72 3.61 3.59 3.31 3.23 3.22 3.17Milwaukee 3.54 3.26 3.20 3.07 3.31 2.78 2.81 2.65 2.94 2.33 2.47 2.26Minneapolis 4.43 4.23 4.24 4.23 4.29 3.91 3.85 3.78 3.61 3.22 3.33 3.27Nashville 3.93 3.82 3.64 3.72 3.67 3.59 3.50 3.49 2.97 2.89 2.77 2.80New Orleans-Mobile 4.35 4.27 4.23 4.35 4.41 4.33 4.34 4.42 3.86 3.83 3.70 4.03New York 4.25 4.12 4.13 4.15 3.84 3.66 3.73 3.70 3.60 3.49 3.42 3.34Oklahoma City-Tulsa 4.01 3.92 3.83 3.85 3.72 3.58 3.50 3.39 3.36 3.26 3.20 3.19Omaha 3.79 3.48 3.32 3.22 3.53 3.30 3.09 2.96 3.00 2.86 2.73 2.67Orlando 4.21 4.19 4.19 4.19 3.63 3.57 3.55 3.55 3.18 3.16 3.16 3.15Philadelphia 4.05 3.93 3.83 3.79 3.86 3.71 3.59 3.49 3.58 3.49 3.36 3.27Phoenix 2.97 2.88 2.85 2.75 2.62 2.58 2.56 2.32 2.17 2.18 2.22 2.11Pittsburgh 3.74 3.61 3.54 3.52 3.57 3.40 3.31 3.28 3.24 3.14 3.07 3.03Portland 3.10 2.98 3.05 3.04 2.86 2.80 2.91 2.82 2.43 2.31 2.42 2.27Raleigh-Durham 4.07 4.01 3.95 3.93 3.72 3.65 3.69 3.65 3.56 3.53 3.63 3.55Richmond- Norfolk 4.27 4.27 4.10 4.08 3.54 3.50 3.39 3.34 3.18 3.16 3.03 2.99Sacramento 3.71 3.71 3.78 3.67 3.15 3.10 3.11 2.80 3.09 3.07 3.09 2.76Salt Lake City-Boise 3.14 2.93 2.91 3.10 2.68 2.39 2.37 2.53 2.25 2.07 2.04 2.23San Antonio 3.58 3.44 3.27 3.11 3.58 3.44 3.27 3.09 3.42 3.30 3.19 3.01San Diego 3.63 3.56 3.70 3.29 2.97 2.77 2.94 2.69 2.85 2.75 2.88 2.64San Francisco 3.91 3.83 4.38 3.82 3.20 3.05 3.21 2.85 3.15 3.05 3.16 2.83Seattle 3.21 3.03 3.10 3.08 3.03 2.86 2.97 2.89 2.56 2.43 2.59 2.45St Louis 3.90 3.71 3.70 3.58 3.46 3.26 3.17 3.05 3.14 2.99 3.06 2.97Syracuse 3.55 3.33 3.23 3.08 3.08 2.85 2.75 2.54 2.51 2.35 2.23 2.05Tampa 3.94 3.92 3.93 3.93 3.63 3.59 3.57 3.56 3.21 3.18 3.17 3.16Washington DC 3.88 3.87 3.78 3.86 3.67 3.63 3.54 3.62 3.51 3.48 3.41 3.48West Texas 3.76 3.67 3.59 3.56 3.45 3.30 3.32 3.26 2.91 2.79 2.82 2.69Total US 3.73 3.64 3.60 3.55 3.39 3.27 3.23 3.15 2.92 2.83 2.80 2.74
of milk within the specified market. Data includes organic milk. Data subject to revision.Source: AC Nielsen Scantrack Reports on Refrigerated Milk. The average price per gallon represents the weighted averages for specific brands
Weighted Average Prices in Dollars Per Gallon
City
December 2007 December 2008 December 2009
U.S. Retail Price Averages for Whole, Reduced Fat, Lowfat, and Skim MilkDecember 2007, 2008, 2009 Comparison
Average Retail Prices
U N I T E D S T A T E S
38 California Dairy Statistics Annual 2009
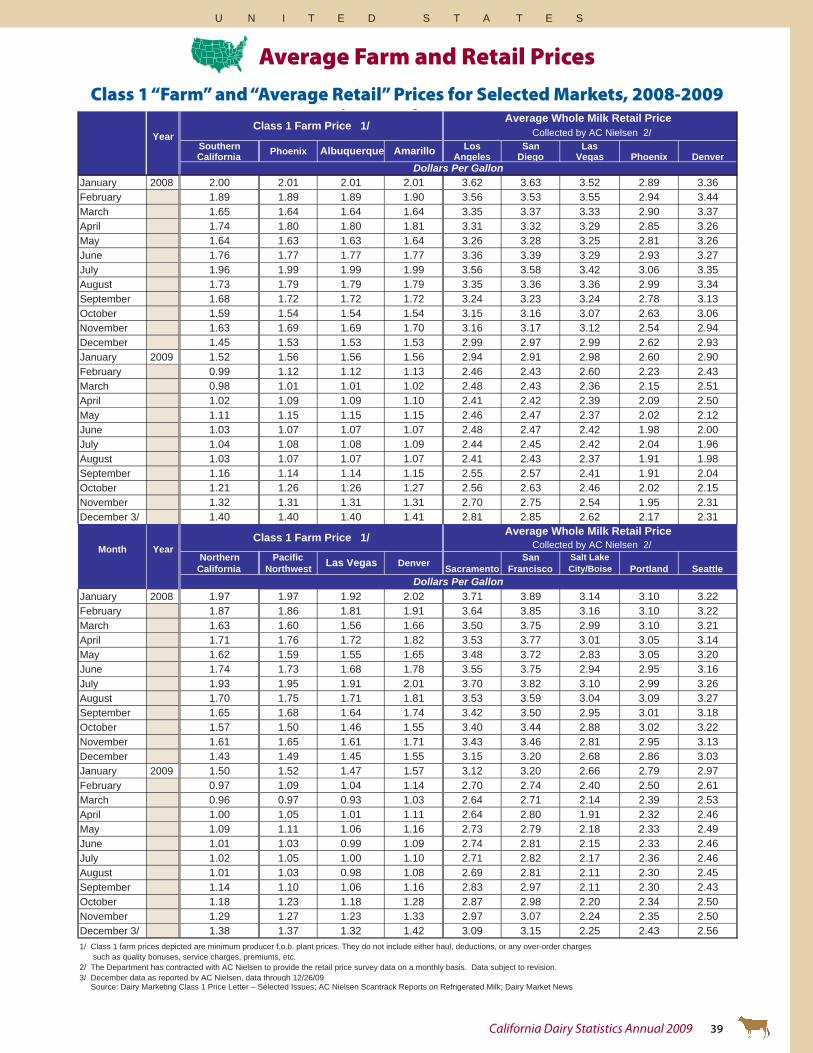
Southern Los San LasCalifornia Angeles Diego Vegas Phoenix Denver
January 2008 2.00 2.01 2.01 2.01 3.62 3.63 3.52 2.89 3.36February 1.89 1.89 1.89 1.90 3.56 3.53 3.55 2.94 3.44March 1.65 1.64 1.64 1.64 3.35 3.37 3.33 2.90 3.37April 1.74 1.80 1.80 1.81 3.31 3.32 3.29 2.85 3.26May 1.64 1.63 1.63 1.64 3.26 3.28 3.25 2.81 3.26June 1.76 1.77 1.77 1.77 3.36 3.39 3.29 2.93 3.27July 1.96 1.99 1.99 1.99 3.56 3.58 3.42 3.06 3.35August 1.73 1.79 1.79 1.79 3.35 3.36 3.36 2.99 3.34September 1.68 1.72 1.72 1.72 3.24 3.23 3.24 2.78 3.13October 1.59 1.54 1.54 1.54 3.15 3.16 3.07 2.63 3.06November 1.63 1.69 1.69 1.70 3.16 3.17 3.12 2.54 2.94December 1.45 1.53 1.53 1.53 2.99 2.97 2.99 2.62 2.93January 2009 1.52 1.56 1.56 1.56 2.94 2.91 2.98 2.60 2.90February 0.99 1.12 1.12 1.13 2.46 2.43 2.60 2.23 2.43March 0.98 1.01 1.01 1.02 2.48 2.43 2.36 2.15 2.51April 1.02 1.09 1.09 1.10 2.41 2.42 2.39 2.09 2.50May 1.11 1.15 1.15 1.15 2.46 2.47 2.37 2.02 2.12June 1.03 1.07 1.07 1.07 2.48 2.47 2.42 1.98 2.00July 1.04 1.08 1.08 1.09 2.44 2.45 2.42 2.04 1.96August 1.03 1.07 1.07 1.07 2.41 2.43 2.37 1.91 1.98September 1.16 1.14 1.14 1.15 2.55 2.57 2.41 1.91 2.04October 1.21 1.26 1.26 1.27 2.56 2.63 2.46 2.02 2.15November 1.32 1.31 1.31 1.31 2.70 2.75 2.54 1.95 2.31December 3/ 1.40 1.40 1.40 1.41 2.81 2.85 2.62 2.17 2.31
Northern Pacific San Salt LakeCalifornia Northwest Sacramento Francisco City/Boise Portland Seattle
January 2008 1.97 1.97 1.92 2.02 3.71 3.89 3.14 3.10 3.22February 1.87 1.86 1.81 1.91 3.64 3.85 3.16 3.10 3.22March 1.63 1.60 1.56 1.66 3.50 3.75 2.99 3.10 3.21April 1.71 1.76 1.72 1.82 3.53 3.77 3.01 3.05 3.14May 1.62 1.59 1.55 1.65 3.48 3.72 2.83 3.05 3.20June 1.74 1.73 1.68 1.78 3.55 3.75 2.94 2.95 3.16July 1.93 1.95 1.91 2.01 3.70 3.82 3.10 2.99 3.26August 1.70 1.75 1.71 1.81 3.53 3.59 3.04 3.09 3.27September 1.65 1.68 1.64 1.74 3.42 3.50 2.95 3.01 3.18October 1.57 1.50 1.46 1.55 3.40 3.44 2.88 3.02 3.22November 1.61 1.65 1.61 1.71 3.43 3.46 2.81 2.95 3.13December 1.43 1.49 1.45 1.55 3.15 3.20 2.68 2.86 3.03January 2009 1.50 1.52 1.47 1.57 3.12 3.20 2.66 2.79 2.97February 0.97 1.09 1.04 1.14 2.70 2.74 2.40 2.50 2.61March 0.96 0.97 0.93 1.03 2.64 2.71 2.14 2.39 2.53April 1.00 1.05 1.01 1.11 2.64 2.80 1.91 2.32 2.46May 1.09 1.11 1.06 1.16 2.73 2.79 2.18 2.33 2.49June 1.01 1.03 0.99 1.09 2.74 2.81 2.15 2.33 2.46July 1.02 1.05 1.00 1.10 2.71 2.82 2.17 2.36 2.46August 1.01 1.03 0.98 1.08 2.69 2.81 2.11 2.30 2.45September 1.14 1.10 1.06 1.16 2.83 2.97 2.11 2.30 2.43October 1.18 1.23 1.18 1.28 2.87 2.98 2.20 2.34 2.50November 1.29 1.27 1.23 1.33 2.97 3.07 2.24 2.35 2.50December 3/ 1.38 1.37 1.32 1.42 3.09 3.15 2.25 2.43 2.56
3/ December data as reported by AC Nielsen, data through 12/26/09 Source: Dairy Marketing Class 1 Price Letter – Selected Issues; AC Nielsen Scantrack Reports on Refrigerated Milk; Dairy Market News
1/ Class 1 farm prices depicted are minimum producer f.o.b. plant prices. They do not include either haul, deductions, or any over-order charges such as quality bonuses, service charges, premiums, etc.2/ The Department has contracted with AC Nielsen to provide the retail price survey data on a monthly basis. Data subject to revision.
Dollars Per Gallon
Average Whole Milk Retail Price Collected by AC Nielsen 2/Month Year
y g
Dollars Per Gallon
Average Whole Milk Retail Price Collected by AC Nielsen 2/ Year
AmarilloAlbuquerquePhoenix
Class 1 Farm Price 1/
DenverLas Vegas
Class 1 Farm Price 1/
Class 1 “Farm” and “Average Retail” Prices for Selected Markets, 2008-2009
Average Farm and Retail Prices
U N I T E D S T A T E S
California Dairy Statistics Annual 2009 39
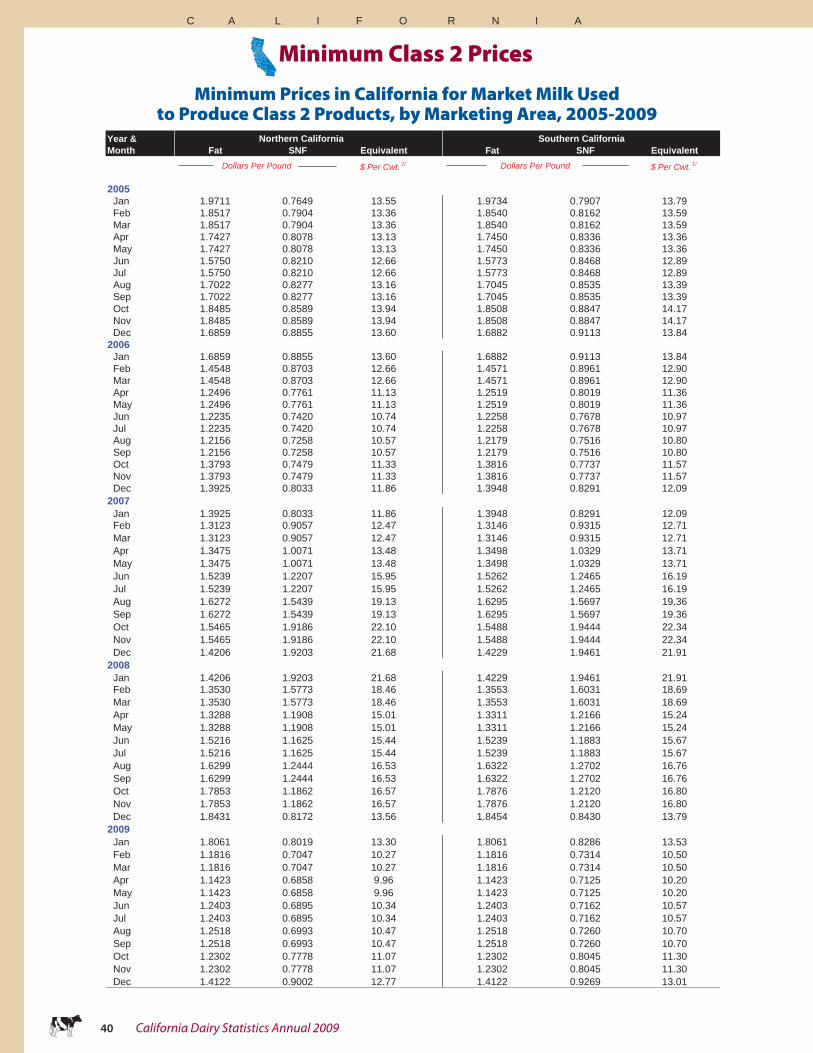
Minimum Prices in California for Market Milk Usedto Produce Class 2 Products, by Marketing Area, 2005-2009
Minimum Class 2 Prices
Year &Month Fat SNF Equivalent Fat SNF Equivalent
$ Per Cwt. 1/ $ Per Cwt. 1/
2005Jan 1.9711 0.7649 13.55 1.9734 0.7907 13.79Feb 1.8517 0.7904 13.36 1.8540 0.8162 13.59Mar 1.8517 0.7904 13.36 1.8540 0.8162 13.59Apr 1.7427 0.8078 13.13 1.7450 0.8336 13.36May 1.7427 0.8078 13.13 1.7450 0.8336 13.36Jun 1.5750 0.8210 12.66 1.5773 0.8468 12.89Jul 1.5750 0.8210 12.66 1.5773 0.8468 12.89Aug 1.7022 0.8277 13.16 1.7045 0.8535 13.39Sep 1.7022 0.8277 13.16 1.7045 0.8535 13.39Oct 1.8485 0.8589 13.94 1.8508 0.8847 14.17Nov 1.8485 0.8589 13.94 1.8508 0.8847 14.17Dec 1.6859 0.8855 13.60 1.6882 0.9113 13.84
2006Jan 1.6859 0.8855 13.60 1.6882 0.9113 13.84Feb 1.4548 0.8703 12.66 1.4571 0.8961 12.90Mar 1.4548 0.8703 12.66 1.4571 0.8961 12.90Apr 1.2496 0.7761 11.13 1.2519 0.8019 11.36May 1.2496 0.7761 11.13 1.2519 0.8019 11.36Jun 1.2235 0.7420 10.74 1.2258 0.7678 10.97Jul 1.2235 0.7420 10.74 1.2258 0.7678 10.97Aug 1.2156 0.7258 10.57 1.2179 0.7516 10.80Sep 1.2156 0.7258 10.57 1.2179 0.7516 10.80Oct 1.3793 0.7479 11.33 1.3816 0.7737 11.57Nov 1.3793 0.7479 11.33 1.3816 0.7737 11.57Dec 1.3925 0.8033 11.86 1.3948 0.8291 12.09
2007Jan 1.3925 0.8033 11.86 1.3948 0.8291 12.09Feb 1.3123 0.9057 12.47 1.3146 0.9315 12.71Mar 1.3123 0.9057 12.47 1.3146 0.9315 12.71Apr 1.3475 1.0071 13.48 1.3498 1.0329 13.71May 1.3475 1.0071 13.48 1.3498 1.0329 13.71Jun 1.5239 1.2207 15.95 1.5262 1.2465 16.19Jul 1.5239 1.2207 15.95 1.5262 1.2465 16.19Aug 1.6272 1.5439 19.13 1.6295 1.5697 19.36Sep 1.6272 1.5439 19.13 1.6295 1.5697 19.36Oct 1.5465 1.9186 22.10 1.5488 1.9444 22.34Nov 1.5465 1.9186 22.10 1.5488 1.9444 22.34Dec 1.4206 1.9203 21.68 1.4229 1.9461 21.91
2008Jan 1.4206 1.9203 21.68 1.4229 1.9461 21.91Feb 1.3530 1.5773 18.46 1.3553 1.6031 18.69Mar 1.3530 1.5773 18.46 1.3553 1.6031 18.69Apr 1.3288 1.1908 15.01 1.3311 1.2166 15.24May 1.3288 1.1908 15.01 1.3311 1.2166 15.24Jun 1.5216 1.1625 15.44 1.5239 1.1883 15.67Jul 1.5216 1.1625 15.44 1.5239 1.1883 15.67Aug 1.6299 1.2444 16.53 1.6322 1.2702 16.76Sep 1.6299 1.2444 16.53 1.6322 1.2702 16.76Oct 1.7853 1.1862 16.57 1.7876 1.2120 16.80Nov 1.7853 1.1862 16.57 1.7876 1.2120 16.80Dec 1.8431 0.8172 13.56 1.8454 0.8430 13.79
2009Jan 1.8061 0.8019 13.30 1.8061 0.8286 13.53Feb 1.1816 0.7047 10.27 1.1816 0.7314 10.50Mar 1.1816 0.7047 10.27 1.1816 0.7314 10.50Apr 1.1423 0.6858 9.96 1.1423 0.7125 10.20May 1.1423 0.6858 9.96 1.1423 0.7125 10.20Jun 1.2403 0.6895 10.34 1.2403 0.7162 10.57Jul 1.2403 0.6895 10.34 1.2403 0.7162 10.57Aug 1.2518 0.6993 10.47 1.2518 0.7260 10.70Sep 1.2518 0.6993 10.47 1.2518 0.7260 10.70Oct 1.2302 0.7778 11.07 1.2302 0.8045 11.30Nov 1.2302 0.7778 11.07 1.2302 0.8045 11.30Dec 1.4122 0.9002 12.77 1.4122 0.9269 13.01
Dollars Per Pound
Northern California
Dollars Per Pound
Southern California
C A L I F O R N I A
40 California Dairy Statistics Annual 2009

Minimum Class 3 Prices
Minimum Prices in California for Market Milk Usedto Produce Class 3 Products, by Marketing Area, 2005-2009
Minimum Class 3 Prices
Year &Month Fat SNF Equivalent Fat SNF Equivalent
$ Per Cwt. 1/ $ Per Cwt. 1/
2005Jan 1.9711 0.7592 13.50 1.9734 0.7592 13.51Feb 1.8517 0.7847 13.31 1.8540 0.7847 13.32Mar 1.8517 0.7847 13.31 1.8540 0.7847 13.32Apr 1.7427 0.8021 13.08 1.7450 0.8021 13.09May 1.7427 0.8021 13.08 1.7450 0.8021 13.09Jun 1.5750 0.8153 12.61 1.5773 0.8153 12.61Jul 1.5750 0.8153 12.61 1.5773 0.8153 12.61Aug 1.7022 0.8220 13.11 1.7045 0.8220 13.12Sep 1.7022 0.8220 13.11 1.7045 0.8220 13.12Oct 1.8485 0.8532 13.89 1.8508 0.8532 13.90Nov 1.8485 0.8532 13.89 1.8508 0.8532 13.90Dec 1.6859 0.8798 13.55 1.6882 0.8798 13.56
2006Jan 1.6859 0.8798 13.55 1.6882 0.8798 13.56Feb 1.4548 0.8646 12.61 1.4571 0.8646 12.62Mar 1.4548 0.8646 12.61 1.4571 0.8646 12.62Apr 1.2496 0.7704 11.08 1.2519 0.7704 11.08May 1.2496 0.7704 11.08 1.2519 0.7704 11.08Jun 1.2235 0.7363 10.69 1.2258 0.7363 10.70Jul 1.2235 0.7363 10.69 1.2258 0.7363 10.70Aug 1.2156 0.7201 10.52 1.2179 0.7201 10.53Sep 1.2156 0.7201 10.52 1.2179 0.7201 10.53Oct 1.3793 0.7422 11.28 1.3816 0.7422 11.29Nov 1.3793 0.7422 11.28 1.3816 0.7422 11.29Dec 1.3925 0.7976 11.81 1.3948 0.7976 11.82
2007Jan 1.3925 0.7976 11.81 1.3948 0.7976 11.82Feb 1.3123 0.9000 12.42 1.3146 0.9000 12.43Mar 1.3123 0.9000 12.42 1.3146 0.9000 12.43Apr 1.3475 1.0014 13.43 1.3498 1.0014 13.44May 1.3475 1.0014 13.43 1.3498 1.0014 13.44Jun 1.5239 1.2150 15.90 1.5262 1.2150 15.91Jul 1.5239 1.2150 15.90 1.5262 1.2150 15.91Aug 1.6272 1.5382 19.08 1.6295 1.5382 19.09Sep 1.6272 1.5382 19.08 1.6295 1.5382 19.09Oct 1.5465 1.9129 22.05 1.5488 1.9129 22.06Nov 1.5465 1.9129 22.05 1.5488 1.9129 22.06Dec 1.4206 1.9146 21.63 1.4229 1.9146 21.64
2008Jan 1.4206 1.9146 21.63 1.4229 1.9146 21.64Feb 1.3530 1.5716 18.41 1.3553 1.5716 18.42Mar 1.3530 1.5716 18.41 1.3553 1.5716 18.42Apr 1.3288 1.1851 14.96 1.3311 1.1851 14.97May 1.3288 1.1851 14.96 1.3311 1.1851 14.97Jun 1.5216 1.1568 15.39 1.5239 1.1568 15.40Jul 1.5216 1.1568 15.39 1.5239 1.1568 15.40Aug 1.6299 1.2387 16.48 1.6322 1.2387 16.49Sep 1.6299 1.2387 16.48 1.6322 1.2387 16.49Oct 1.7853 1.1805 16.52 1.7876 1.1805 16.53Nov 1.7853 1.1805 16.52 1.7876 1.1805 16.53Dec 1.8431 0.8115 13.51 1.8454 0.8115 13.52
2009Jan 1.8061 0.7962 13.25 1.8061 0.7962 13.25Feb 1.1816 0.6990 10.22 1.1816 0.6990 10.22Mar 1.1816 0.6990 10.22 1.1816 0.6990 10.22Apr 1.1423 0.6801 9.91 1.1423 0.6801 9.91May 1.1423 0.6801 9.91 1.1423 0.6801 9.91Jun 1.2403 0.6838 10.29 1.2403 0.6838 10.29Jul 1.2403 0.6838 10.29 1.2403 0.6838 10.29Aug 1.2518 0.6936 10.42 1.2518 0.6936 10.42Sep 1.2518 0.6936 10.42 1.2518 0.6936 10.42Oct 1.2302 0.7721 11.02 1.2302 0.7721 11.02Nov 1.2302 0.7721 11.02 1.2302 0.7721 11.02Dec 1.4122 0.8945 12.72 1.4122 0.8945 12.72
1/ Calculated on 3.5 percent fat and 8.7 percent solids-not-fat.
Dollars Per Pound
Northern California
Dollars Per Pound
Southern California
C A L I F O R N I A
California Dairy Statistics Annual 2009 41

Minimum Prices in California for Market Milk Usedto Produce Class 4a and 4b Products, by Marketing Area, 2005-2009
Minimum Class 4a/4b Prices
Month Fat SNF Equivalent Fat SNF Equivalent
$ Per Cwt. 1/ $ Per Cwt. 1/
2005Jan 1.6888 0.7301 12.26 1.6888 0.9729 14.38Feb 1.7303 0.7365 12.46 1.7303 0.9050 13.93Mar 1.6669 0.7446 12.31 1.6669 0.9241 13.87Apr 1.6001 0.7487 12.11 1.6001 1.0048 14.34May 1.4616 0.7589 11.72 1.4616 0.9512 13.39Jun 1.5694 0.7528 12.04 1.5694 0.9344 13.62Jul 1.7468 0.7681 12.80 1.7468 0.9080 14.01Aug 1.7784 0.7854 13.06 1.7784 0.7775 12.99Sep 1.8304 0.7980 13.35 1.8304 0.8995 14.23Oct 1.7498 0.8162 13.23 1.7498 0.8725 13.72Nov 1.5338 0.8204 12.51 1.5338 0.8417 12.69Dec 1.4164 0.8223 12.11 1.4164 0.9526 13.252006Jan 1.4050 0.7839 11.74 1.4050 0.8788 12.56Feb 1.2296 0.7217 10.58 1.2296 0.7853 11.14Mar 1.1814 0.6960 10.19 1.1814 0.7307 10.49Apr 1.1682 0.6843 10.04 1.1682 0.7285 10.43May 1.1906 0.6653 9.96 1.1906 0.7259 10.48Jun 1.1824 0.6543 9.83 1.1824 0.7485 10.65Jul 1.1605 0.6629 9.83 1.1605 0.7143 10.28Aug 1.3076 0.6809 10.50 1.3076 0.7152 10.80Sep 1.3769 0.6863 10.79 1.3769 0.8107 11.87Oct 1.3704 0.7156 11.02 1.3704 0.7592 11.40Nov 1.3406 0.7624 11.32 1.3406 0.8767 12.32Dec 1.2996 0.8162 11.65 1.2996 0.8989 12.372007Jan 1.2510 0.8666 11.92 1.2510 0.9297 12.47Feb 1.2626 0.9102 12.34 1.2626 1.0093 13.20Mar 1.3584 0.9753 13.24 1.3584 1.0777 14.13Apr 1.4222 1.0974 14.53 1.4222 1.1749 15.20May 1.5515 1.2153 16.00 1.5515 1.4509 18.05Jun 1.6032 1.3127 17.03 1.6032 1.7900 21.18Jul 1.5772 1.6465 19.84 1.5772 1.7260 20.54Aug 1.5468 1.8153 21.21 1.5468 1.6089 19.41Sep 1.4722 1.8933 21.62 1.4722 1.6304 19.34Oct 1.3580 1.9039 21.32 1.3580 1.4822 17.65Nov 1.4092 1.8080 20.66 1.4092 1.7028 19.75Dec 1.3778 1.6453 19.14 1.3778 1.5818 18.582008Jan 1.2541 1.3807 16.40 1.2541 1.4396 16.91Feb 1.2253 1.1490 14.28 1.2253 1.5229 17.54Mar 1.3583 1.1040 14.36 1.3583 1.4003 16.94Apr 1.4330 1.0689 14.31 1.4330 1.3532 16.79May 1.5361 1.1275 15.19 1.5361 1.5267 18.66Jun 1.5628 1.1653 15.61 1.5628 1.5685 19.12Jul 1.6230 1.1949 16.08 1.6230 1.3894 17.77Aug 1.7135 1.1779 16.24 1.7135 1.1659 16.14Sep 1.7830 1.0659 15.51 1.7830 1.1947 16.63Oct 1.8624 0.8071 13.54 1.8624 1.1618 16.63Nov 1.7498 0.6986 12.20 1.7498 1.0364 15.14Dec 1.2476 0.6651 10.15 1.2476 1.1011 13.952009Jan 1.1155 0.6463 9.53 1.1155 0.5878 9.02Feb 1.1014 0.6376 9.40 1.1014 0.7192 10.11Mar 1.1831 0.6360 9.67 1.1831 0.7249 10.45Apr 1.2110 0.6384 9.79 1.2110 0.7089 10.41May 1.2696 0.6426 10.03 1.2696 0.5859 9.54Jun 1.2562 0.6505 10.06 1.2562 0.5888 9.52Jul 1.2473 0.6500 10.02 1.2473 0.5773 9.39Aug 1.2364 0.6760 10.21 1.2364 0.8006 11.29Sep 1.2239 0.7816 11.08 1.2239 0.8176 11.40Oct 1.2847 0.8095 11.54 1.2847 0.9419 12.69Nov 1.5397 0.8929 13.16 1.5397 0.9619 13.76Dec 1.4776 1.1020 14.76 1.4776 1.1348 15.041/ Calculated based on 3.5 percent fat and 8.7 percent solids-not-fat.
Dollars Per Pound Dollars Per Pound Class 4a Class 4b
C A L I F O R N I A C A L I F O R N I A
42 California Dairy Statistics Annual 2009
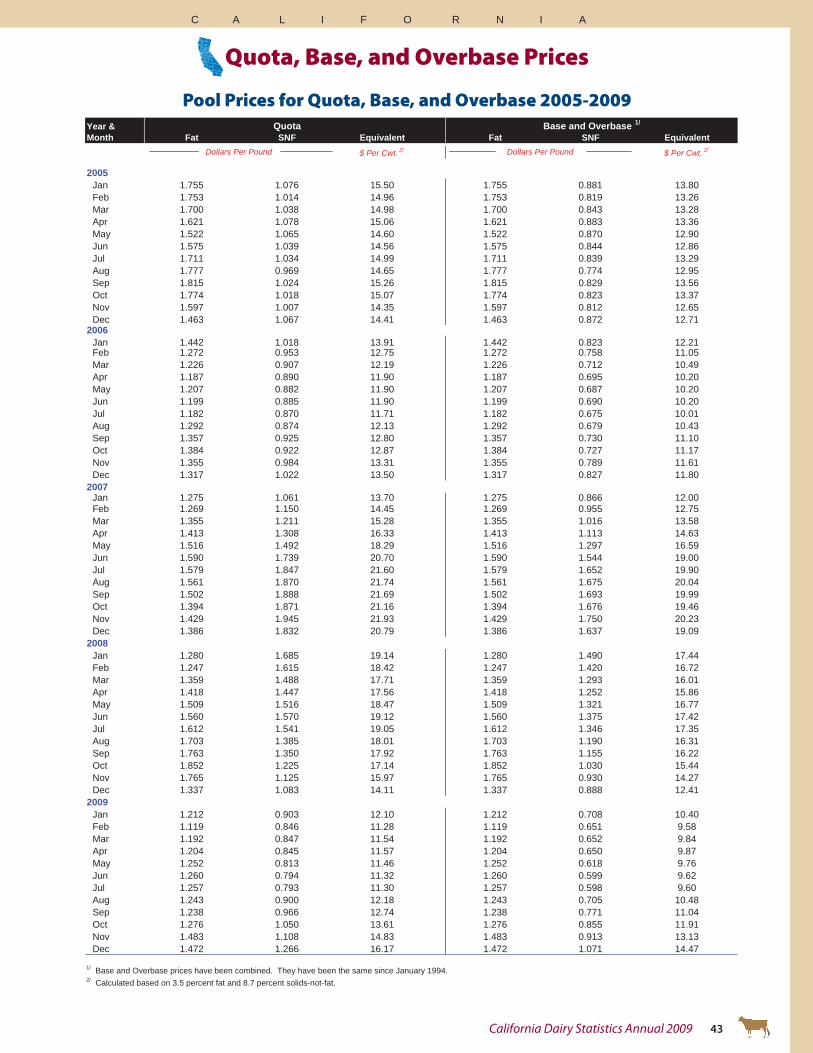
Pool Prices for Quota, Base, and Overbase 2005-2009
Quota, Base, and Overbase Prices
Year &Month Fat SNF Equivalent Fat SNF Equivalent
$ Per Cwt. 2/ $ Per Cwt. 2/
2005Jan 1.755 1.076 15.50 1.755 0.881 13.80Feb 1.753 1.014 14.96 1.753 0.819 13.26Mar 1.700 1.038 14.98 1.700 0.843 13.28Apr 1.621 1.078 15.06 1.621 0.883 13.36May 1.522 1.065 14.60 1.522 0.870 12.90Jun 1.575 1.039 14.56 1.575 0.844 12.86Jul 1.711 1.034 14.99 1.711 0.839 13.29Aug 1.777 0.969 14.65 1.777 0.774 12.95Sep 1.815 1.024 15.26 1.815 0.829 13.56Oct 1.774 1.018 15.07 1.774 0.823 13.37Nov 1.597 1.007 14.35 1.597 0.812 12.65Dec 1.463 1.067 14.41 1.463 0.872 12.71
2006Jan 1.442 1.018 13.91 1.442 0.823 12.21Feb 1.272 0.953 12.75 1.272 0.758 11.05Mar 1.226 0.907 12.19 1.226 0.712 10.49Apr 1.187 0.890 11.90 1.187 0.695 10.20May 1.207 0.882 11.90 1.207 0.687 10.20Jun 1.199 0.885 11.90 1.199 0.690 10.20Jul 1.182 0.870 11.71 1.182 0.675 10.01Aug 1.292 0.874 12.13 1.292 0.679 10.43Sep 1.357 0.925 12.80 1.357 0.730 11.10Oct 1.384 0.922 12.87 1.384 0.727 11.17Nov 1.355 0.984 13.31 1.355 0.789 11.61Dec 1.317 1.022 13.50 1.317 0.827 11.80
2007Jan 1.275 1.061 13.70 1.275 0.866 12.00Feb 1.269 1.150 14.45 1.269 0.955 12.75Mar 1.355 1.211 15.28 1.355 1.016 13.58Apr 1.413 1.308 16.33 1.413 1.113 14.63May 1.516 1.492 18.29 1.516 1.297 16.59Jun 1.590 1.739 20.70 1.590 1.544 19.00Jul 1.579 1.847 21.60 1.579 1.652 19.90Aug 1.561 1.870 21.74 1.561 1.675 20.04Sep 1.502 1.888 21.69 1.502 1.693 19.99Oct 1.394 1.871 21.16 1.394 1.676 19.46Nov 1.429 1.945 21.93 1.429 1.750 20.23Dec 1.386 1.832 20.79 1.386 1.637 19.09
2008Jan 1.280 1.685 19.14 1.280 1.490 17.44Feb 1.247 1.615 18.42 1.247 1.420 16.72Mar 1.359 1.488 17.71 1.359 1.293 16.01Apr 1.418 1.447 17.56 1.418 1.252 15.86May 1.509 1.516 18.47 1.509 1.321 16.77Jun 1.560 1.570 19.12 1.560 1.375 17.42Jul 1.612 1.541 19.05 1.612 1.346 17.35Aug 1.703 1.385 18.01 1.703 1.190 16.31Sep 1.763 1.350 17.92 1.763 1.155 16.22Oct 1.852 1.225 17.14 1.852 1.030 15.44Nov 1.765 1.125 15.97 1.765 0.930 14.27Dec 1.337 1.083 14.11 1.337 0.888 12.41
2009Jan 1.212 0.903 12.10 1.212 0.708 10.40Feb 1.119 0.846 11.28 1.119 0.651 9.58Mar 1.192 0.847 11.54 1.192 0.652 9.84Apr 1.204 0.845 11.57 1.204 0.650 9.87May 1.252 0.813 11.46 1.252 0.618 9.76Jun 1.260 0.794 11.32 1.260 0.599 9.62Jul 1.257 0.793 11.30 1.257 0.598 9.60Aug 1.243 0.900 12.18 1.243 0.705 10.48Sep 1.238 0.966 12.74 1.238 0.771 11.04Oct 1.276 1.050 13.61 1.276 0.855 11.91Nov 1.483 1.108 14.83 1.483 0.913 13.13Dec 1.472 1.266 16.17 1.472 1.071 14.47
1/ Base and Overbase prices have been combined. They have been the same since January 1994.2/ Calculated based on 3.5 percent fat and 8.7 percent solids-not-fat.
Quota
Dollars Per Pound
Base and Overbase 1/
Dollars Per Pound
C A L I F O R N I A
California Dairy Statistics Annual 2009 43

Dol
lars
per
Hun
dred
wei
ght
Average Prices Paid to Producers in CaliforniaFor Market Milk (Grade A), By Month, 2005-2009 1/2/
Average Prices Paid to Producers in CaliforniaFor Manufacturing Milk (Grade B), By Month, 2005-2009 1/2/
Average Prices Paid to Producers in CaliforniaFor All Bulk Milk (Grade A and Grade B), By Month, 2005-2009 1/2/
Average Prices Paid to Producers, All Bulk Milk, 2005-2009
Average Prices Paid to Producers
AnnualYear January February March April May June July August September October November December Average
2005 14.86 14.12 14.01 14.06 13.46 13.35 13.75 13.44 14.29 14.29 13.60 13.65 13.912006 13.13 11.83 11.29 10.89 10.72 10.70 10.44 10.90 11.75 11.94 12.44 12.70 11.562007 12.90 13.54 14.30 15.29 17.23 19.59 20.42 20.57 20.65 20.39 21.17 20.16 18.022008 18.47 17.60 16.77 16.57 17.43 17.99 17.83 16.86 16.88 16.30 15.17 13.34 16.772009 11.23 10.29 10.47 10.46 10.25 10.09 10.01 10.94 11.64 12.71 14.13 15.56 11.48
1/ Prices are F.O.B. plant, at actual test.2/ Includes in-state pool shipments and California milk shipped into Federal Milk Marketing Orders. Excludes bonuses and premiums and exempt production.
Dollars Per Hundredweight
AnnualYear January February March April May June July August September October November December Average
2005 15.52 14.95 14.64 14.94 13.98 14.47 14.67 14.39 15.51 15.25 14.48 14.89 14.812006 14.85 13.23 12.28 11.67 11.36 11.46 11.03 11.54 13.15 12.99 13.98 14.02 12.632007 14.03 14.58 15.39 16.43 19.32 22.03 21.71 20.59 20.69 19.43 21.68 20.77 18.892008 18.82 19.26 18.44 18.31 20.19 20.64 19.11 17.75 18.35 18.73 17.11 15.58 18.522009 10.15 11.14 11.45 11.36 10.37 10.29 10.09 12.10 12.36 13.91 15.46 16.70 12.12
1/ Prices are F.O.B. plant, at actual test.
Dollars Per Hundredweight
AnnualYear January February March April May June July August September October November December Average
2005 14.87 14.14 14.03 14.08 13.47 13.38 13.77 13.47 14.32 14.31 13.62 13.68 13.932006 13.17 11.86 11.31 10.91 10.73 10.71 10.46 10.92 11.79 11.97 12.47 12.73 11.592007 12.93 13.57 14.33 15.32 17.29 19.66 20.45 20.57 20.65 20.36 21.18 20.17 18.042008 18.48 17.63 16.80 16.60 17.48 18.03 17.86 16.87 16.90 16.34 15.20 13.38 16.802009 11.18 10.32 10.51 10.50 10.25 10.10 10.01 10.99 11.68 12.76 14.19 15.61 11.51
1/ Prices are F.O.B. plant, at actual test.2/ Includes in-state pool shipments and California milk shipped into Federal Milk Marketing Orders. Excludes bonuses and premiums.
Dollars Per Hundredweight
$8
$10
$12
$14
$16
$18
$20
$22
Janu
ary
Februa
ry
Marc
h Apri
l M
ay Ju
ne July
Augus
t
Septem
ber
Octobe
r
Novem
ber
Dec
embe
r
2005 2006 2007 2008 2009
C A L I F O R N I A C A L I F O R N I A
44 California Dairy Statistics Annual 2009

Mailbox Milk Prices for Selected Reported Areasin Federal Milk Orders and California, November 2008-November 2009
Dol
lars
Per
Hun
dred
wei
ght
Mailbox Milk Prices for Selected States and theAll Federal Milk Order Prices, November 2007-November 2009
Mailbox Milk Prices
Reporting Areas Nov '08 Dec Jan '09 Feb Mar Apr May Jun Jul Aug Sep Oct Nov
California $14.67 $12.83 $10.57 $9.80 $9.92 $9.88 $9.70 $9.63 $9.60 $10.51 $11.20 $12.30 $13.78New England States $18.19 $16.18 $14.95 $12.46 $12.25 $12.66 $12.65 $12.27 $12.22 $12.57 $13.45 $14.84 $15.90New York $17.03 $15.14 $13.94 $11.72 $11.52 $11.93 $11.96 $11.61 $11.47 $11.81 $12.64 $13.82 $14.84Eastern Pennsylvania $17.68 $15.63 $14.45 $11.98 $11.76 $12.16 $12.14 $11.73 $11.80 $12.12 $12.99 $14.43 $15.52Appalachian States $19.39 $16.58 $16.55 $13.20 $12.25 $12.70 $12.78 $12.36 $12.74 $13.04 $13.94 $15.30 $16.33Southeast States $20.26 $17.39 $17.05 $13.76 $12.47 $13.08 $13.15 $12.85 $13.38 $13.88 $14.77 $16.41 $16.93Southern Missouri $18.11 $15.54 $14.98 $11.69 $10.78 $11.09 $10.77 $10.77 $11.08 $11.51 $12.55 $14.23 $15.01Florida $21.70 $18.61 $18.39 $14.97 $13.61 $14.34 $14.70 $14.07 $14.81 $15.37 $16.20 $17.76 $17.86Western Pennsylvania $18.00 $15.92 $14.37 $11.89 $11.61 $12.07 $11.86 $11.53 $11.53 $11.97 $12.97 $14.60 $15.69Ohio $18.30 $16.32 $14.83 $12.28 $11.97 $12.43 $12.32 $11.87 $11.90 $12.45 $13.28 $14.88 $15.85Indiana $18.08 $15.83 $14.86 $12.00 $11.34 $11.76 $12.00 $11.37 $11.51 $11.90 $12.81 $14.27 $15.34Michigan $17.32 $15.74 $13.76 $11.51 $11.29 $11.74 $11.55 $11.16 $11.16 $11.69 $12.61 $14.02 $15.05Wisconsin $17.53 $16.63 $12.94 $11.24 $11.87 $12.17 $11.40 $11.24 $11.15 $12.25 $13.30 $14.54 $15.69Minnesota $17.32 $16.39 $12.77 $11.82 $12.27 $12.26 $11.49 $11.26 $11.27 $12.57 $13.48 $14.83 $15.77Iowa $17.13 $15.52 $13.60 $11.73 $11.84 $12.23 $11.81 $11.48 $11.33 $12.22 $13.23 $14.60 $15.66Illinois $17.44 $15.76 $13.38 $11.62 $11.84 $12.06 $11.80 $11.44 $10.91 $12.44 $13.29 $14.71 $15.69Corn Belt States $16.85 $15.20 $13.61 $11.33 $11.43 $11.62 $11.33 $10.96 $10.82 $11.69 $12.82 $14.12 $14.99Western Texas $16.33 $14.45 $12.98 $10.73 $10.73 $11.07 $10.59 $10.20 $10.43 $11.30 $12.22 $13.37 $14.65New Mexico $15.44 $14.00 $12.25 $10.03 $9.92 $10.26 $9.77 $9.37 $9.66 $10.51 $11.39 $12.52 $13.86Northwest States $16.38 $14.55 $12.75 $10.66 $10.95 $11.29 $10.87 $10.55 $10.57 $11.17 $12.17 $13.52 $14.84All Federal Order Areas $17.42 $16.12 $13.77 $11.61 $11.60 $11.96 $11.61 $11.27 $11.30 $12.04 $12.98 $14.29 $15.37
Dollars Per Hundredweight
$8.00
$10.00
$12.00
$14.00
$16.00
$18.00
$20.00
$22.00
Nov '07
Dec
Jan '08 Feb
March
April MayJune
July AugSept
Oct NovDec
Jan '09 Feb Apr
May Jun JulAug
Sep Oct Nov
California Northwest States New Mexico All Federal Order Areas
U N I T E D S T A T E S
California Dairy Statistics Annual 2009 45
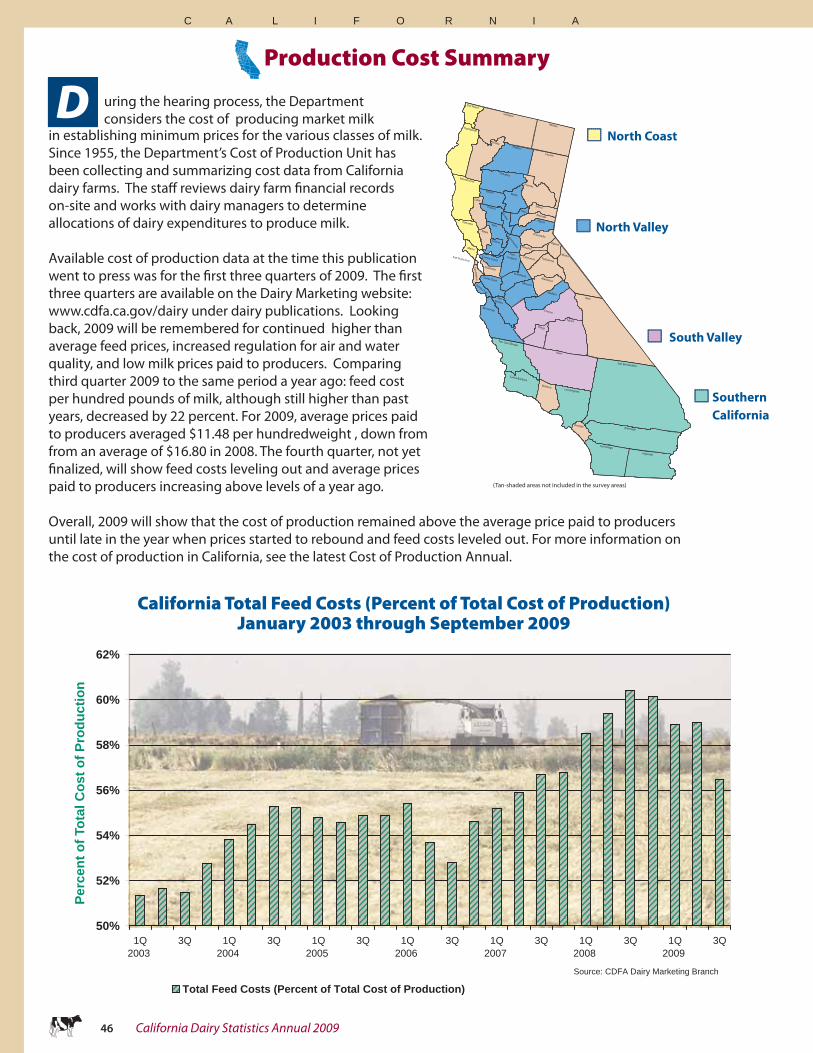
50%
52%
54%
56%
58%
60%
62%
1Q2003
3Q 1Q2004
3Q 1Q2005
3Q 1Q2006
3Q 1Q2007
3Q 1Q2008
3Q 1Q2009
3Q
Source: CDFA Dairy Marketing Branch
Total Feed Costs (Percent of Total Cost of Production)
in establishing minimum prices for the various classes of milk. Since 1955, the Department’s Cost of Production Unit has been collecting and summarizing cost data from California dairy farms. The staff reviews dairy farm fi nancial records on-site and works with dairy managers to determine allocations of dairy expenditures to produce milk.
Available cost of production data at the time this publication went to press was for the fi rst three quarters of 2009. The fi rst three quarters are available on the Dairy Marketing website: www.cdfa.ca.gov/dairy under dairy publications. Looking back, 2009 will be remembered for continued higher than average feed prices, increased regulation for air and water quality, and low milk prices paid to producers. Comparing third quarter 2009 to the same period a year ago: feed cost per hundred pounds of milk, although still higher than past years, decreased by 22 percent. For 2009, average prices paid to producers averaged $11.48 per hundredweight , down from from an average of $16.80 in 2008. The fourth quarter, not yet fi nalized, will show feed costs leveling out and average prices paid to producers increasing above levels of a year ago.
Overall, 2009 will show that the cost of production remained above the average price paid to producers until late in the year when prices started to rebound and feed costs leveled out. For more information on the cost of production in California, see the latest Cost of Production Annual.
uring the hearing process, the Department considers the cost of producing market milkD
Production Cost Summary
North Coast
North Valley
South Valley
SouthernCalifornia
California Total Feed Costs (Percent of Total Cost of Production)January 2003 through September 2009
C A L I F O R N I A C A L I F O R N I A
Perc
ent o
f Tot
al C
ost o
f Pro
duct
ion
46 California Dairy Statistics Annual 2009

he Department’s Manufacturing Cost Unit
collects and summarizes data from California dairy manufacuring plants. Any plant that produces Class 4a or Class 4b products may be asked to participate in the cost studies. The butter, nonfat dry milk (NFDM), dry whey powder, and Cheddar cheese study participants typically account
for at least 80 percent of these respective products manufactured in California. The Department annually reviews the cost of manufacturing milk into butter, NFDM, dry whey powder, and Cheddar cheese with other factors. These costs are considered when establishing the manufacturing cost allowances for the minimum pricing formulas during the hearing process. The table below shows
California milk processing plants are experiencing trends similar to what other dairy processing plants across the U.S. are experiencing: more milk processed at fewer dairy plants. From 1960 to 2008, the number of California processing plants decreased from about 600 to 118. The chart depicts the historical trend for the number of milk processing plants between 2001-2009. Note that the sum of all plants plants for 2009 exceeds the total of 118 plants because some plants are still multi-class. Interesting that while the pounds of milk produced has steadily increased, the number of plants handling the milk production has decreased.
Categorization of California Milk Processing PlantsBased Upon Classifi cation of Processed Products
Num
ber o
f Pla
nts
T
Summary of Weighted Average Manufacturing Costs,Butter, Nonfat Powder, Dry Whey Powder, and Cheddar Cheese
Manufacturing Cost Summary/Processing Plants
0
10
20
30
40
50
60
70
Class 1 Class 2 Class 3 Class 4a Class 4b
2001 2003 2005 2007 2009
the weighted average manufacturing costs per pound for butter (salted and unsalted), NFDM, Cheddar cheese, and dry whey powder. Costs included in this summary are packaging, processing labor, processing non-labor, general and administrative, return on investment and, for butter and Cheddar cheese, miscellaneous ingredients.
Cost PerPound
Numberof Plants
Cost PerPound
Numberof Plants
Cost PerPound
Numberof Plants
Cost PerPound
Numberof Plants
Study Periods Varied Feb-00 $0.0957 8 $0.1356 10 $0.1693 9 -- --
July 2000-Dec 2001 Nov-02 $0.1208 7 $0.1619 11 $0.1775 9 -- --
Jan-Dec 2002 Nov-03 $0.1235 7 $0.1464 10 $0.1632 9 -- --
Jan-Dec 2003 Nov-04 $0.1299 7 $0.1560 10 $0.1706 9 $0.2675 4
Jan-Dec 2004 Nov-05 $0.1368 8 $0.1543 10 $0.1769 7 $0.2673 3
Jan-Dec 2005 Nov-06 $0.1408 8 $0.1659 9 $0.1914 7 $0.2851 3
Jan-Dec 2006 Sep-07 $0.1373 7 $0.1664 8 $0.1988 7 $0.3099 3
Jan-Dec 2007 Sep-08 $0.1316 7 $0.1568 8 $0.2003 6 -- --
Jan-Dec 2008 Sep-09 $0.1553 8 $0.1931 9 $0.2099 6 -- --
Notes:
Costs include processing labor, non-labor processing, packaging, other ingredients (for butter and Cheddar cheese only), general and administrative, and return on investments at 7.45% for 2008.
No cost studies performed for Dry Whey Powder plants starting January 2007 due to less than 3 plants manufacturing Dry Whey Powder.
NONFAT DRY MILK CHEDDAR CHEESE DRY WHEY POWDER
Since 1996, the Cheddar cheese cost studies have included costs associated with Cheddar cheese plants producing 500-pound barrels and 640-pound blocks. However, costs for packaging labor and packaging expenses were replaced with the average of those costs associated with 40-lb. block plants.
Study Period
Release Date
BUTTER
C A L I F O R N I A
California Dairy Statistics Annual 2009 47
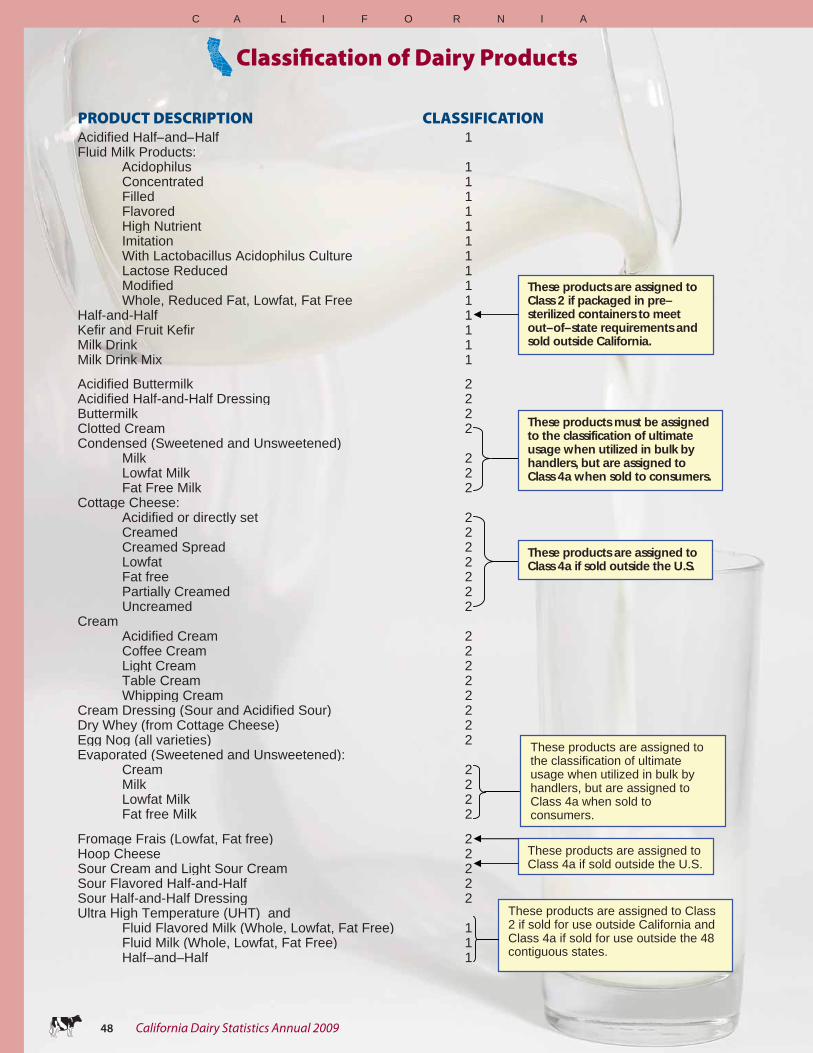
C A L I F O R N I A
PRODUCT DESCRIPTION CLASSIFICATION
Classifi cation of Dairy Products
Acidified Half–and–Half 1Fluid Milk Products: Acidophilus 1 Concentrated 1 Filled 1 Flavored 1 High Nutrient 1 Imitation 1 With Lactobacillus Acidophilus Culture 1 Lactose Reduced 1 Modified 1 Whole, Reduced Fat, Lowfat, Fat Free 1Half-and-Half 1Kefir and Fruit Kefir 1Milk Drink 1Milk Drink Mix 1
Acidified Buttermilk 2Acidified Half-and-Half Dressing 2Buttermilk 2Clotted Cream 2Condensed (Sweetened and Unsweetened) Milk 2 Lowfat Milk 2 Fat Free Milk 2Cottage Cheese: Acidified or directly set 2 Creamed 2 Creamed Spread 2 Lowfat 2 Fat free 2 Partially Creamed 2 Uncreamed 2Cream Acidified Cream 2 Coffee Cream 2 Light Cream 2 Table Cream 2 Whipping Cream 2Cream Dressing (Sour and Acidified Sour) 2Dry Whey (from Cottage Cheese) 2Egg Nog (all varieties) 2Evaporated (Sweetened and Unsweetened): Cream 2 Milk 2 Lowfat Milk 2 Fat free Milk 2
Fromage Frais (Lowfat, Fat free) 2Hoop Cheese 2Sour Cream and Light Sour Cream 2Sour Flavored Half-and-Half 2Sour Half-and-Half Dressing 2Ultra High Temperature (UHT) and Fluid Flavored Milk (Whole, Lowfat, Fat Free) 1 Fluid Milk (Whole, Lowfat, Fat Free) 1 Half–and–Half 1
These products are assigned to Class 2 if packaged in pre–sterilized containers to meet out–of–state requirements and sold outside California.
These products must be assigned to the classification of ultimate usage when utilized in bulk by handlers, but are assigned to Class 4a when sold to consumers.
These products are assigned to Class 4a if sold outside the U.S.
These products are assigned to the classification of ultimate usage when utilized in bulk by handlers, but are assigned to Class 4a when sold to consumers.
These products are assigned to Class 4a if sold outside the U.S.
These products are assigned to Class 2 if sold for use outside California and Class 4a if sold for use outside the 48 contiguous states.
C A L I F O R N I A
48 California Dairy Statistics Annual 2009
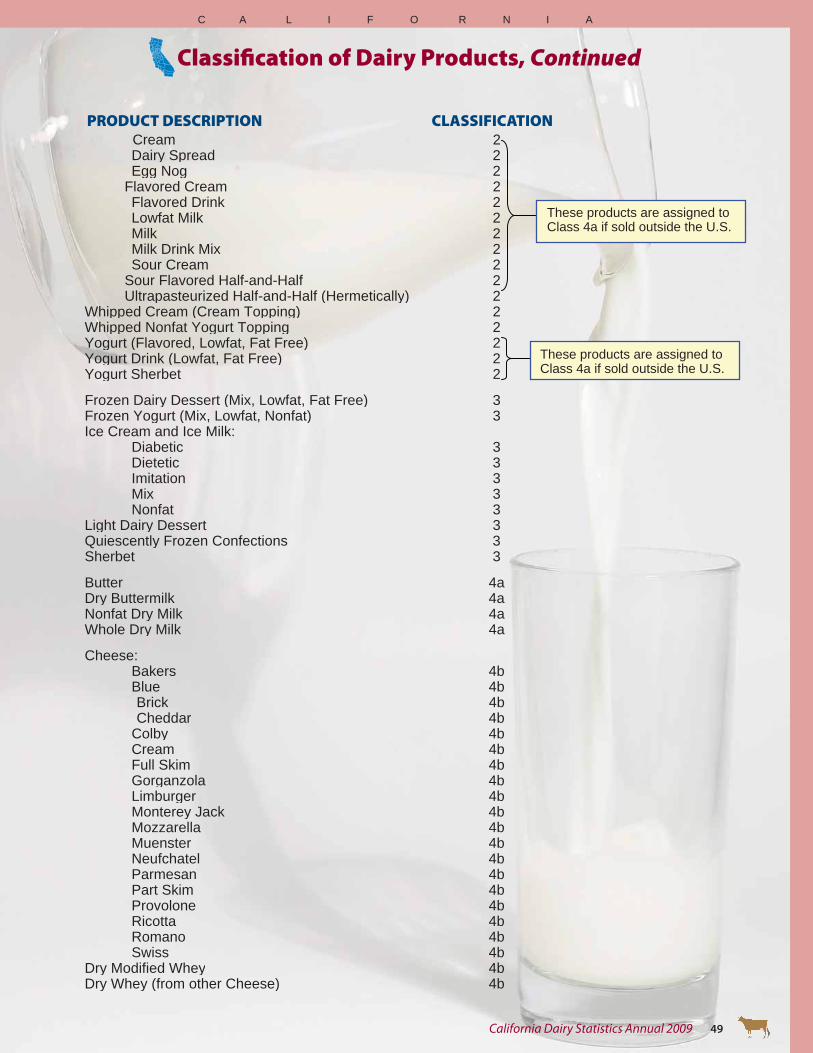
C A L I F O R N I A
Classifi cation of Dairy Products, Continued
PRODUCT DESCRIPTION CLASSIFICATION Cream 2 Dairy Spread 2 Egg Nog 2 Flavored Cream 2 Flavored Drink 2 Lowfat Milk 2 Milk 2 Milk Drink Mix 2 Sour Cream 2 Sour Flavored Half-and-Half 2 Ultrapasteurized Half-and-Half (Hermetically) 2Whipped Cream (Cream Topping) 2Whipped Nonfat Yogurt Topping 2Yogurt (Flavored, Lowfat, Fat Free) 2Yogurt Drink (Lowfat, Fat Free) 2Yogurt Sherbet 2
Frozen Dairy Dessert (Mix, Lowfat, Fat Free) 3Frozen Yogurt (Mix, Lowfat, Nonfat) 3Ice Cream and Ice Milk: Diabetic 3 Dietetic 3 Imitation 3 Mix 3 Nonfat 3Light Dairy Dessert 3Quiescently Frozen Confections 3Sherbet 3
Butter 4aDry Buttermilk 4aNonfat Dry Milk 4aWhole Dry Milk 4a
Cheese: Bakers 4b Blue 4b Brick 4b Cheddar 4b Colby 4b Cream 4b Full Skim 4b Gorganzola 4b Limburger 4b Monterey Jack 4b Mozzarella 4b Muenster 4b Neufchatel 4b Parmesan 4b Part Skim 4b Provolone 4b Ricotta 4b Romano 4b Swiss 4bDry Modified Whey 4bDry Whey (from other Cheese) 4b
These products are assigned to Class 4a if sold outside the U.S.
These products are assigned to Class 4a if sold outside the U.S.
California Dairy Statistics Annual 2009 49

C A L I F O R N I A
1919 19601930 1940 1950
1919California Department of Food and Agriculture established
Milk and Dairy Foods Control Branch established
1933
1935
1937
1945
1947
1949
1962
Desmond Act - establishes minimum wholesale and retail pricing (repealed 1978)
Young Act - establishes minimum producer pricing - Dairy Marketing Branch
Federal license (order) established - immediately enjoined by federal courts (repealed after passage of Young Act in 1935)
Federal Price Support for dairy industry established
Dairy Products Promotion Act - establishes the Dairy Council of California to foster education and promotional programs
Unfair Practices Act - Regulates unfair dairy business practices, prohibits sales below cost
Component pricing for fl uid milk products
Component pricing for manufactured products begins in 1965
California Historic Timeline
C A L I F O R N I A
50 California Dairy Statistics Annual 2009
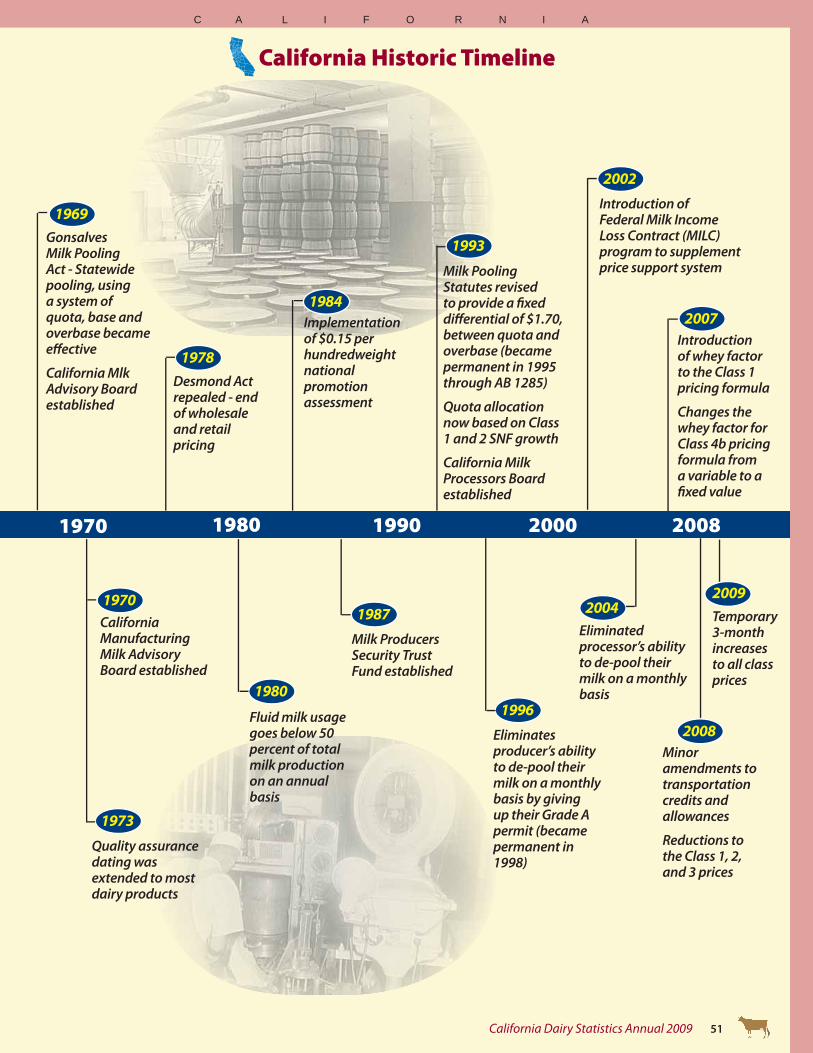
1970
1973
1969
1978
1980
1987
1996
1984
2002
1993
2004
2007
2008
Gonsalves Milk Pooling Act - Statewide pooling, using a system of quota, base and overbase became eff ective
California Mlk Advisory Board established
Quality assurance dating was extended to most dairy products
California Manufacturing Milk Advisory Board established
Fluid milk usage goes below 50 percent of total milk production on an annual basis
Milk Producers Security Trust Fund established
Desmond Act repealed - end of wholesale and retail pricing
Implementation of $0.15 per hundredweight national promotion assessment
Eliminates producer’s ability to de-pool their milk on a monthly basis by giving up their Grade A permit (became permanent in 1998)
Eliminated processor’s ability to de-pool their milk on a monthly basis
Minor amendments to transportation credits and allowances
Reductions to the Class 1, 2, and 3 prices
Milk Pooling Statutes revised to provide a fi xed diff erential of $1.70, between quota and overbase (became permanent in 1995 through AB 1285)
Quota allocation now based on Class 1 and 2 SNF growth
California Milk Processors Board established
Introduction of whey factor to the Class 1 pricing formula
Changes the whey factor for Class 4b pricing formula from a variable to a fi xed value
Introduction of Federal Milk Income Loss Contract (MILC) program to supplement price support system
2009Temporary 3-month increases to all class prices
C A L I F O R N I A
California Historic Timeline
1970 1980 1990 2000 2008
California Dairy Statistics Annual 2009 51

California Department of Food and AgricultureDairy Marketing Branch1220 N StreetSacramento, CA 95814(916) 341-5988 / Fax (916) 341-6697www.cdfa.ca.gov/dairy