DAIRY SHEEP ASSOCIATION OF NORTH AMERICA SYMPOSIUM · 8:00 am Black Pearl Creamery slide show tour...
105
Proceedings of the 22nd Annual DAIRY SHEEP ASSOCIATION OF NORTH AMERICA SYMPOSIUM Ithaca, New York, USA 2 – 4 December 2016
Transcript of DAIRY SHEEP ASSOCIATION OF NORTH AMERICA SYMPOSIUM · 8:00 am Black Pearl Creamery slide show tour...
Proceedings of the 22nd Annual
DAIRY SHEEP ASSOCIATION OF NORTH AMERICA SYMPOSIUM
Ithaca, New York, USA 2 – 4 December 2016
i
Proceedings of the 22nd Annual
DAIRY SHEEP ASSOCIATION OF NORTH AMERICA SYMPOSIUM
2 – 4 December 2016
Morrison Hall
Cornell University Ithaca, New York, USA
Organization and Sponsoring
Department of Animal Science, Cornell University (www.ansci.cornell.edu)
Dairy Sheep Association of North America (www.dsana.org/)
Companies serving the North American dairy sheep industry

ii
Symposium Organizing Committee
Michael Thonney, Ithaca, New York, USA – Chair Bee Tolman, Cazenovia, New York, USA
David Galton, Genoa, New York, USA Marie-Chantal Houde, Racine, Quebec, Canada Nancy Clark, Old Chatham, New York, USA
Veronica Pedraza, Cazenovia, New York, USA
Proceedings Editing and Compilation
Michael L. Thonney, Ithaca, New York, USA
Photographs on the Cover (clockwise from upper left)
Black Pearl Creamery ewes near Trumansburg, NY
Shadirah Shepherd milking ewes on the Cornell Campus, Ithaca, NY Northland Sheep Dairy ewes near Marathon, NY
Old Chatham Sheepherding Company Products, Old Chatham, NY Shepherd’s Way LLC milking parlor, Lock, NY
iii
Table of Contents Symposium Organizing Committee ................................................................................................ ii
Proceedings Editing and Compilation ............................................................................................ ii
Photographs on the Cover ............................................................................................................... ii
Program of Events........................................................................................................................... v
Sponsors ........................................................................................................................................ vii
VIRTUAL TOUR OF BLACK PEARL CREAMERY ................................................................. 1 Lauren and Kevin McKinzey (with Niko Kochendoerfer) VIRTUAL TOUR OF NORTHLAND SHEEP DAIRY ................................................................ 3 Maryrose Livingston and Donn Hewes SHEPHERD’S WAY LLC ............................................................................................................. 5 David and Sally Galton UPDATE ON SHEEP GENOMICS AND GENETICS ................................................................. 7 Christian J. Possbergh and Heather J. Huson ESTIMATING BREEDING VALUES FOR SHEEP: ESTIMATES OF GENETIC PARAMETERS AND TRENDS IN A CROSSBRED POPULATION OF DAIRY SHEEP ..... 10 Thomas W. Murphy and David L. Thomas IMPLEMENTATION OF GENETIC EVALUATION................................................................ 23 George R. Wiggans PARLOR DESIGN AND EQUIPMENT ..................................................................................... 26 Frank Welcome PREVENTION AND TREATMENT OF MASTITIS ................................................................. 30 Paul D. Virkler QUALITY MILK MANAGEMENT ............................................................................................ 34 Frank Welcom A GENETIC EVALUATION PROGRAM FOR DAIRY SHEEP IN CANADA: PRELIMINARY RESULTS FROM A PROJECT IN QUEBEC ................................................ 38 Johanne Cameron and Larry Schaeffer FERMENTABLE FIBER FOR MILKING SHEEP ON THE STAR SYSTEM ......................... 51 Nikola Kochendoerfer PREVENTION AND TREATMENT OF DAIRY SHEEP DISEASES ...................................... 57 Mary C. Smith
iv
DIGITAL NECROPSY EXAMINATION OF SHEEP AND GOATS ........................................ 65 Mary C. Smith FEEDING DAIRY SHEEP: NUTRITIONAL CHALLENGES AND OPPORTUNITIES......... 69 Antonello Cannas, Michael L. Thonney, and Mondina F. Lunesu INTEGRATED CONTROL OF INTERNAL PARASITES IN SMALL RUMINANTS ........... 81 tatiana L. Stanton and Michael L. Thonney SETTING UP A FARMSTEAD DAIRY ..................................................................................... 89 Rob Ralyea Recipients of the William J. Boylan Distinguished Service Award ............................................. 91
Locations and Chairs of the Organizing Committees of the Dairy Sheep Symposia ................... 91
Brief History of the Dairy Sheep Association of North America ................................................. 92
DSANA Presidents ....................................................................................................................... 92
Information from the Symposium Sponsors ................................................................................. 93

v
Program of Events
Thursday 1 December 2016
Evening Informal get together – Ramada Inn Bar & Lounge Friday 2 December 2016 146 Morrison Hall unless otherwise specified
7:30 am Registration, coffee and breakfast items Rm 132 8:00 am Black Pearl Creamery slide show tour – Lauren McKinzey, Owner 8:30 am Northland Sheep Dairy slide show tour – Maryrose Livingston, Owner 9:00 am Leave for tour of Shepherd’s Way LLC 9:35 am Tour of Shepherd’s Way LLC – Dr. Dave Galton, Owner
11:15 am Board bus to return to Cornell 11:50 am Arrive back in Ithaca 12:00 pm Lunch & Trade Show Morrison Hall Foyer & Rm 348 1:00 pm Welcome
Dr. Chris Watkins – Director of Cornell Cooperative Extension Dr. Patricia Johnson – Chairperson of Cornell Animal Science
1:20 pm Update on Sheep Genomics & Genetics – Chris Posbergh, PhD student, & Dr. Heather Huson, Animal Science, Cornell University
2:10 pm Estimating breeding values for sheep: Estimates of genetic parameters and trends in a crossbred population of dairy sheep – Dr. Dave Thomas, Animal Science, University of Wisconsin
3:00 pm Break & Trade Show Morrison Hall Foyer & Rm 132 3:30 pm Implementation of genetic evaluation – Dr. George Wiggans, USDA 4:20 pm Discussion of genetic evaluation (including semen importation) – Tom
Clark, Dr. Dave Galton, and speakers 5:00 pm End of presentations for Friday
5:15 pm to 6:30 pm
(dinner on your own)
Cheese and wine tasting, hors d'oeuvres 348 Morrison Hall Culinary Celebration of North American Artisanal Sheep Milk Cheeses. Cheese tasting open to all Symposium attendees.

vi
Saturday 3 December 2016 146 Morrison Hall unless otherwise specified
8:00 am Coffee and breakfast items Rm 132 8:15 am Parlor design and equipment – Dr. Frank Welcome, Animal Health
Diagnostic Center, CVM, Cornell University 9:00 am Prevention and treatment of mastitis – Dr. Paul Virkler, Animal
Health Diagnostic Center, CVM, Cornell University 9:45 am Break & Trade Show Morrison Hall Foyer & Rm 132
10:15 am Quality milk management – Dr. Frank Welcome, Animal Health Di-agnostic Center, CVM, Cornell University
11:00 am Factors affecting cheese quality – Veronica Pedraza, Meadowood Farms
12:00 pm Lunch, Trade Show, & DSANA business meeting Morrison Hall Foyer & Rm 348
1:30 pm GenOvis for Recordkeeping – Johanne Cameron, Le Centre d’exper-tise en production ovine du Québec
2:15 pm Recordkeeping: Producer panel experiences – Laurel Kieffer, Mary-rose Livingston, and others
3:00 pm Break & Trade Show Morrison Hall Foyer & Rm 132 3:30 pm Fermentable Fiber for Milking sheep on the STAR system – Nikola
Kochendoerfer, Graduate Student, Animal Science, Cornell University 4:30 pm Free time 5:30 pm Social time Morrison Hall Foyer & Rm 132 6:00 pm Banquet 348 Morrison Hall
Sunday 4 December 2016 146 Morrison Hall unless otherwise specified 8:45 am Coffee and breakfast items Rm 132 9:00 am Prevention and treatment of dairy sheep diseases – Dr. Mary Smith,
Ambulatory and Production Medicine, Cornell University 10:00 am Break & Trade Show Morrison Hall Foyer & Rm 132 10:30 am (must be pre-registered)
Sheep necropsy demonstration (limited to 40 participants) College of Veterinary Medicine Pathology Amphitheater – Dr. Mary Smith, Ambulatory and Production Medicine, Cornell University
10:30 am Feeding Dairy Sheep – Drs. Antonello Cannas, Animal Sciences, Uni-versity of Sassari, Italy & Mike Thonney, Animal Science, Cornell Uni-versity
12:00 pm Lunch & Trade Show Morrison Hall Foyer & Rm 348 1:00 pm Integrated control of internal parasites – Dr. tatiana Stanton, Animal
Science, Cornell University 2:00 pm Setting up a Farmstead Dairy – Rob Ralyea, Food Science, Cornell
University 3:00 pm Tour of Food Processing and Development
Laboratory (Pilot Plant) Stocking Hall – Rob Ralyea, Food Science, Cornell University
4:00 pm Safe travels home
vii
Sponsors Platinum
Hamby Dairy Supply 2402 S Water St Maysville, MO 64469, USA http://hambydairysupply.com/xcart/home.php?cat=17 Gold
Biotic Industries, Inc. 147 Edd Joyce Rd Bell Buckle, TN 37020, USA http://www.biotic.com/
EZ Animal Products 27 6th St. South Humboldt, IA 50548 http://www.udderlyez.com/
Land O’Lakes Animal Milk Products Co. 1080 County Road F West Shoreview, MN 55126, USA http://www.lolmilkreplacer.com/
Meadowood Farms 5157 Ridge Road Cazenovia, NY 13035 http://www.meadowoodfarms.com/
Shepherd’s Way LLC and Old Chatham Sheepherding Creamery 623 Bird Cemetery Rd Locke, NY 13092 https://www.oldchathamsheepherding.com/ 2016 sponsors are gratefully thanked for their generous support of the 22nd Annual Dairy Sheep Association of North America Symposium and for their interest and support of the North American dairy sheep industry. The symposium would not be possible without the financial support of these sponsors. Please support these sponsors as you purchase sheep milk products, or equipment, supplies, and services for your dairy sheep farm or sheep milk processing facility.
1
VIRTUAL TOUR OF BLACK PEARL CREAMERY Lauren and Kevin McKinzey (with Niko Kochendoerfer)
Black Pearl Creamery Trumansburg, New York, USA
Introduction
Black Pearl Creamery is a small-holder farm, milking 30 East Frisian dairy ewes, with an on farm creamery producing yogurt and cheese in Trumansburg, NY, managed but not yet certified organic. The family owns 113 acres, of which 55 acres are pasture, and leases an additional 40 acres of pasture. Kevin milks, feeds and manages the ewes and lambs. Lauren does the documen-tation and book-keeping, as well as administrative tasks and marketing. They share the workload of yogurt and cheese making.
Originally from Oregon, Lauren and Kevin grew vegetables in Idaho, Montana and then in Danby, NY before buying their farm near Trumansburg, NY. The farm got certified as dairy in 2014. They place high value in breeding for good milking animals without growing them too fast, and are currently working on figuring out the ideal scale for their operation.
Management In previous years the ewes have been milked twice a day until late August. This year, Lauren
and Kevin started to successfully only milk once a day. Kevin milks on a 4 stanchion parlor with a bucket milking system. The system runs between 10 and 11 inches of mercury vacuum at a pul-sation rate of 160 to 200. Their creamery is equipped with a 45-gallon vat pasteurizer with a 15-gallon jacket that allows for cooling the milk until the yogurt making process. The workload per milking shift is 1 hour for milking, 45 min for set up and cleaning. With additional chores and management tasks this amounts to a fulltime job for Kevin. They share the workload for yogurt making in the creamery, every 3rd day. The ewes are managed as follows in Table 1, and they op-erate their farm without additional employees.
Table 1. Year round management. Stage of Production Date Breeding Thanksgiving Lambing March 21- April 7 Weaning 5-7 weeks, in groups depending on DOB and weight Milking After weaning until mid-October
The ewes are grazed rotationally, with an anticipated 6 weeks resting period for the pasture in
between grazing for parasite control. The ewes are moved after every milking. Once the lambs are weaned at 5 to 7 weeks of nursing they are kept on pasture without concentrate feed. The re-placement ewes stay with the lambs, and get moved to the ewe group during breeding season. In winter the ewes and replacements are fed bailage hay, and are housed in a barn.

2
Productivity Data Even though the ewes are only milked once a day they are achieving a satisfactory yield (Ta-
ble 2). This year the family bought 5 replacement ewes, and kept 5 replacements out of their own flock. Table 2. Productivity data. Production Amount Lambs ~ 2 lambs/ewe/year Replacements 10 replacements 2016 Milk yield 2.8 lb/ewe/day Breeding rams 5 rams for sale in 2016
Marketing and Distribution The family has had great success with branding and marketing. They sell their yogurt in a broad variety of local businesses, to NYC restaurants, as well as directly on farm. Local designer Q Cassetti designed and drew their logo, which has become well known around the Ithaca area.
Table 3. Pricing. Product Pricing Distribution Yogurt $54/case of 12 pints Regional Access, NYC, CSA, local food markets $84/case of 12 quarts Regional Access, NYC, CSA, local food markets $8/quart Direct on farm $5/pint Direct on farm Lambs Market price Custom slaughterhouses Culled ewes Market price Local butcher "The Piggery", or own consumption
Going Forward
The farm has maxed out on their capacity for winter housing, as well as on their capacity of pasture close enough to the parlor. They are anticipating plans to increase their number of ani-mals while keeping the once a day milking schedule. Therefore, the family will be working to-ward the renovation of their second barn for winter housing, as well as on grant applications for additional fencing.
Contact
3227 Halseyville Road Trumansburg, New York 14886 Phone: 607-351-0489 [email protected]
3
VIRTUAL TOUR OF NORTHLAND SHEEP DAIRY http://www.northlandsheepdairy.com/ Maryrose Livingston and Donn Hewes
Northland Sheep Dairy Marathon, NY, USA
Introduction
Northland Sheep Dairy is a small, 100% grass based farm located 30 miles east of Ithaca, New York. We milk a small flock of crossbred sheep selected to thrive on our native pastures. Our animals are not fed any grain or by-products – they are 100% grass-fed. We never use anti-biotics and avoid the use of chemical wormers. We use natural and homeopathic remedies to support herd health.
We produce truly handmade sheep cheese on the farm, using only our own raw sheep milk from 100% grass-fed animals. We produce a number of hard and soft cheeses, aged in our own cheese cave.
Donn Hewes and Maryrose Livingston purchased Northland Sheep Dairy from the original owners, Jane and Karl North, after working in partnership with them for 5 years. Maryrose is the shepherd and cheesemaker and Donn works the farm with his team of draft horses and mules.
In addition to our sheep cheese, we grow and sell 100% grass-fed lamb and mutton, as well as tanned sheepskins.
Cheeses At Northland Sheep Dairy our sheep cheese is all made with raw milk produced by our own
100% grass-fed flock. The ewes lamb in mid-April, and we begin making cheese in late May. We milk the sheep twice daily throughout most of the season, and make cheese until the animals are dried off in late October. This means that all of the cheese we make is from milk produced by exclusively pasture-fed animals. The sheep are fed hay during the winter months when they are not lactating. We make cheese approximately every other day throughout the sea-son, and our cheeses are aged in our cheese cave for four months to two years where they de-velop natural rinds.
Tripletree Tomme A rustic Pyrennean-style natural rind hard cheese made with organic lamb rennet. Aged 4-12
months. Savory and nutty. This is great for a cheese plate, served with fresh apples and pears or dried apricots. It's also a wonderful addition to a potato gratin -- remove the rinds and grate it on top.
Black Mule Blue A Roquefort-style blue cheese made with organic lamb rennet. Aged 4-9 months. Creamy,
with hints of mushroom. Delicious crumbled into green salads, or add to roasted beets or squash.
Bergerino (occasionally available) A Pecorino-style hard cheese with a natural rind. Made with organic lamb rennet. Aged 12-
24 months. Deeply flavorful with caramel notes.

4
Cardonbert (occasionally available) A soft cheese in the Spanish Extremadura style, coagulated with home-grown cardoon flow-
ers.
Lamb and Mutton Our lamb and mutton are 100% grass fed. A USDA-certified, Animal Welfare Approved
butcher (Leona Meats in Troy, PA) processes our meats, and we take great care to ensure that the animals are handled and processed humanely with no stress. Our meats are dry-aged for maxi-mum tenderness and flavor.
Markets
• The Local Food Market 37 N Main Street Cortland NY 13045 607 662 4720 • The Piggery 423 Franklin St Ithaca, NY 14850 607 272 2276 • The Good Life Farm CSA+ 4017 Hickok Road Interlaken, NY 607 351 3313
Horse and mule power The Northland Sheep Dairy uses horses and mules to perform a variety of tasks on our farm,
from plowing snow in the winter to making hay for the sheep flock in the summer. We strive to be 100% horse-powered but rely on tractor power just a few days a year to move bedding packs and turn compost. Check out the videos page to learn more about the horse-powered aspect of our farm!
Teamster and co-owner of the Northland Sheep Dairy Donn Hewes has been working with and training horses and mules for 20+ years, and recently has started a school on the farm to teach new teamsters. Please visit teamsterschool.com for more info!
Videos of the Farm Contact Maryrose Livingston and Donn Hewes 3501 Hoxie Gorge - Freetown Rd Marathon, NY 13803 Phone: 607-849-4442 (land line) E-mail: [email protected]
Please note: Some GPS/ mapping services will take you past our farm further down Hoxie Gorge road. If your mapping service has you taking Russell Hill Road, DON'T DO IT! That's a seasonal road and unless you are driving an ATV or a team of mules that road will be difficult for you to traverse.
5
SHEPHERD’S WAY LLC OLD CHATHAM SHEEPHERDING CREAMERY
David and Sally Galton Shepherd’s Way LLC
Locke, NY, USA Introduction
Shepherd’s Way LLC , a family owned farmstead business was a partner with the Old Chat-ham Sheepherding Company for several years. David and Sally Galton, owners of Shepherd’s Way expressed their passion for the products produced by Old Chatham Sheepherding Company. They decided to venture into the world of artisanal sheep’s milk products by purchasing the com-pany.
Shepherd’s Way and Old Chatham Sheepherding Company are continually growing and strive to produce the highest quality sheep’s milk cheeses and yogurts. Shepherd’s Way is lo-cated in Locke, NY where the sheep enjoy their new facilities that offer them a friendly environ-ment. The milk is transported from the farm directly to Old Chatham Sheepherding Company that is located in Old Chatham, NY. The creamery team of professionals hand-crafts and pack-ages the award winning products and are dedicated to continuing the traditions of Old Chatham Sheepherding Company as well as developing new traditions in years to come.
Old Chatham Sheepherding Creamery Old Chatham Sheepherding Company was born back in 1993 when Tom and Nancy Clark
bought 600 acres of lush grassy fields in Old Chatham, New York to form a sheep dairy farm. It soon became the largest of its kind in the United States. The Clark’s were involved in every as-pect of the operation for nearly twenty years, from helping design the barns and the creamery to making the cheese itself.
Old Chatham’s Camembert, Ewe’s Blue, Kinderhook Creek and sheep’s milk yogurts have since won numerous awards and appear on restaurant menus and in the cheese cases of the best specialty food stores throughout the country.
Dave and Sally Galton purchased Old Chatham Sheepherding Company from Tom and Nancy in December of 2014 and continue to produce Old Chatham’s original line of artisanal cheeses and sheep’s milk yogurts.
Shepherd’s Way Shepherd’s Way, the Galton family farm, has been working in conjunction with Old Chat-
ham Sheepherding Company for the past several years. We recently built a state of the art facility in the Finger Lakes Region of New York, where the sheep are now located. Our flock is cur-rently made up of 2,100 dairy sheep that are milked twice a day. The flock is fed a combination of locally sourced hay and grains. Our milk is transported directly to the creamery where it's crafted into our signature sheep’s milk cheeses and yogurts.
Black Sheep Cheese & Yogurt Black Sheep Cheese & Yogurt is the brand for Old Chatham Sheepherding Creamery prod-
ucts, which can be found across the United States. Our products are most easily found at major

6
grocery chains, specialty cheese shops, and gourmet markets as well as health food stores, and co-ops. Also, look for us on the menu at some of the best restaurants in the country.
Nancy's Hudson Valley Camembert Our Iconic Nancy's Hudson Valley Camembert is a lush blend of sheep's milk, cow's milk
and cow's cream. This soft-ripened cheese is lusciously creamy, rich and buttery. Available in whole wheels, pre-wrapped and wedged, or in a unique square shape!
Ewe’s Blue Old Chatham's Ewe's Blue is truly one of a kind. Made with 100% pure sheep's milk and
reminiscent of Roquefort, this blue is creamy, fruity and leaves a pleasing bite. Available in whole wheels or pre-wrapped and wedged.
Kinderhook Creek A pure sheep's milk, soft-ripened cheese. This bloomy rind surrounds a wonderfully creamy,
earthy center that will become oozy upon reaching its peak. Available in 14oz or 3.5oz mini wheels.
Yogurt
• 100% Sheep's Milk - No Thickeners - No Stabilizers • Live & Active Pro-biotic Cultures • Real flavors
o American Cherry o Blueberry o Ginger o Maple o Plain o Vanilla Bean
7
UPDATE ON SHEEP GENOMICS AND GENETICS
Christian J. Posbergh and Heather J. Huson Cornell University
Ithaca, New York, USA
Background In recent years, the majority of genetic and genomic research in livestock has focused on spe-
cies of larger economic value such as dairy cattle and swine. As genetic and genomic technolo-gies drop in price more industries, including sheep, are trying to take advantage of these data for use in their breeding systems. Sheep genetics research has generally taken a single candidate gene approach to identify polymorphisms responsible for major differences in important traits such as ovulation rate, scrapie resistance, and color. Complex traits such as out of season lamb-ing, feed efficiency, and meat quality have not been researched extensively yet because they are polygenic and difficult to measure consistently. These complex traits are more important to pro-ducers and are what producers want genomic solutions to.
Most shepherds in the U.S. have not yet taken advantage of classical genetic selection due to a variety of reasons. Because of this, there are not large reference populations for sheep ge-nomics research within the U.S like there are in Europe, Australia, or New Zealand. In order for producers to fully utilize genetic and genomic selection, shepherds must begin to consistently record economically important traits. Despite this genetic and genomic research has provided some advances to the industry.
Genomic & Genetic Technology As technology advances and prices for genetic technology decreases more researchers and
producers are seeking to evaluate and reap the benefits of marker assisted selection and genomic selection of complex traits. Some of these methods include High-Density single nucleotide poly-morphism (SNP) microarrays, Genotyping-by-Sequencing, and Whole Genome Sequencing. Each technology has their benefits and drawbacks depending on the application of the project and financial constraints.
Genomic Selection In order to use genomic selection within the sheep industry, the effect of SNPs need to be de-
termined to incorporate them into the evaluation model. Reliable record keeping must occur across the industry in traits that are economically important. Reference populations are needed to combine genotype and phenotype information to determine the effect of these SNPs. Ideally a different reference population would be used for each breed but because of the diversity of sheep breeds present in the US this poses a logistical and financial challenge to attain the sample size needed for accurate estimated breeding values (EBVs).
Genomic selection can increase the accuracy of EBVs, reduce generation interval length, and improve selection in complex traits allowing the industry to produce more efficiently.
Scrapie Resistance Scrapie has been almost eradicated within the United States through the use of monitoring
tools and genetic selection towards less susceptible genotypes. Most shepherds are using genetic
8
selection to test their sheep for codons within the PRNP gene associated with scrapie susceptibil-ity, the most commonly tested being codon 171, 154, and 136. This research was conducted in the major commercial breeds.
While shepherds utilize codon testing as a selection tool, there are some misinterpretations of what the genotypes actually mean and their importance in less studied sheep breeds. Currently these tests are run as individual tests which reduce the efficiency of testing many individuals. Be-cause shepherds utilize codon testing, which is marker assisted selection, it should be fairly straightforward to convey to shepherds the principles of genomic selection.
Parentage In recent years, determining parentage in sheep and goats has increased in importance lead-
ing to the development of new parentage panels. Prior to these developments, most parentage panels used approximately twenty microsatellite markers, short regions of repeated DNA. With the ability to genotype hundreds and thousands of SNPs on a single microarray for less expense than microsatellites, several companies and research groups have published smaller (approxi-mately 100-300 SNPs) marker sets that provide greater than 99% accuracy in parental assign-ment (Heaton et al. 2014; Clarke et al. 2016).
In order to use genomic selection efficiently, parentage assignment is vital to properly assign breeding values with a high accuracy to the correct sheep. If large farms wish to use genomic se-lection towards a variety of traits, parentage assignment will be necessary if multi-sire breeding groups are used to reduce management costs.
Dairy Sheep Genomics To date numerous genetic studies attempted to map major Quantitative Trait Loci (QTL) re-
lated to milk yield, protein composition, somatic cell score, and other dairy related traits in sheep (Barillet et al, 2001; Giambra et al, 2014). These studies yielded some major QTLs but a large portion of the variance remained unexplained, leading to the conclusion there are a large number of small effects as opposed to a small number of large effects. These small SNP effects can be incorporated into genomic selection equations. As of this writing, none of these major QTLs are offered commercially.
Majority of dairy sheep genomic selection research has originated from France with the La-caune breed. Progeny testing and estimated breeding values are utilized in France for milk pro-duction and composition and have been since the 1980s. Using Genomic Estimated Breeding Values (gEBVs) resulted in a higher accuracy in younger animals for lowly heritable traits and faster rate of genetic gain (Duchemin et al, 2012). New Zealand sheep research has also utilized genomic selection within one of their dairy flocks. Using genotyping by sequencing technology they were able to generate gEBVs for several dairy traits in a reasonable amount of time and at an inexpensive cost without any traditional breeding values previously calculated. This technique holds promise for the US dairy sheep industry to generate gEBVs.
Future Directions Sheep genomes are being sequenced at a faster rate which is allowing researchers to identify
variants responsible for a wide variety of phenotypes. Most of these are outside the U.S. but as technology improves and prices decrease for whole genome sequencing, genotyping by sequenc-ing, and SNP chips the overall benefit to the US Sheep industry will be greater. As SNP effects are determined it is likely that specific panels will be developed for specific breeds or breed
9
groups within the industry. Genotyping by Sequencing is being used extensively in the New Zea-land sheep industry to reduce costs while providing the same amount of information that SNP chips provide. This technology is still improving but could be used in the US Sheep industry to generate gEBVs.
References Barillet, F., R. Rupp, S. Mignon-Grasteau, J. M. Astruc, and M. Jacquin. 2001. Genetic analysis
for mastitis resistance and milk somatic cell score in French Lacaune dairy sheep. Genet Sel Evol 33(4):397-415. doi: 10.1051/gse:2001124
Clarke, S., K. Dodds, R. Brauning, T. van Stijn, R. Anderson, and J. McEwan. 2016. SNP par-entage testing in sheep - a comparison of technologies. In: 35th International Society For An-imal Genetics Conference, Salt Lake City, Utah, United States
Duchemin, S., C. Colombani, A. Legarra, G. Baloche, H. Larroque, J.-M. Astruc, F. Barillet, C. Robert-Granié, and E. Manfredi. 2012. Genomic selection in the French Lacaune dairy sheep breed. Journal of dairy science 95(5):2723-2733.
Giambra, I. J., H. Brandt, and G. Erhardt. 2014. Milk protein variants are highly associated with milk performance traits in East Friesian Dairy and Lacaune sheep. Small Ruminant Research doi: 10.1016/j.smallrumres.2014.09.001
Heaton, M. P., K. A. Leymaster, T. S. Kalbfleisch, J. W. Kijas, S. M. Clarke, J. McEwan, J. F. Maddox, V. Basnayake, D. T. Petrik, B. Simpson, T. P. L. Smith, C. G. Chitko-McKown, and C. and the International Sheep Genomics. 2014. SNPs for Parentage Testing and Tracea-bility in Globally Diverse Breeds of Sheep. PLoS ONE 9(4):e94851. doi: 10.1371/jour-nal.pone.0094851
10
ESTIMATING BREEDING VALUES FOR SHEEP: ESTIMATES OF GENETIC PA-RAMETERS AND TRENDS IN A CROSSBRED POPULATION OF DAIRY SHEEP
Thomas W. Murphy1 and David L. Thomas2 1Montana State University, Bozeman, Montana, USA
2University of Wisconsin-Madison, Madison, Wisconsin, USA
Background
The overall goal of most North American dairy sheep producers is to decrease operational costs while increasing enterprise returns, thereby maximizing profitability. From a management standpoint, it may be fairly straightforward to identify areas where you can decrease costs and increase returns. You can invest in new feeders that limit the amount of hay wastage, you can plant varieties of grasses and legumes that will extend the grazing season, and you can find alter-native markets for your lamb, milk, and cheese, to name a few. However, from a breeding and selection standpoint, identifying individual animals that will provide your operation with more saleable product in the future is not so clear-cut. The following sections will identify important concepts in genetic evaluation, some results from the Spooner Agricultural Research Station’s (ARS) historic data base, and practices that are necessary in order to implement a successful ge-netic improvement program.
Important Concepts in a Genetic Evaluation Program
There is no question that an across-flock genetic evaluation program for North American dairy sheep would be desirable. It would enable producers to more accurately identify genetically superior rams and ewes. Because of environmental influences, the performance of an individual for a trait (e.g., milk yield, fat content, litter size) is not necessarily an accurate indicator of its true genetic merit for that trait. Therefore, accurately identifying and correcting for environmen-tal effects (i.e., non-genetic effects) is key to an effective genetic improvement program. The Basic Genetic Model
The phenotype of an animal, or its performance for a trait that can be seen or measured, has several components that can be formulized mathematically as:
𝑃𝑃 = µ + 𝐵𝐵𝐵𝐵 + 𝐺𝐺𝐺𝐺𝐵𝐵 + 𝐸𝐸 (Bourdon, 2000). An animal’s phenotype or performance (P) is the summation of the population mean perfor-mance (µ) and the animal’s breeding value (BV), gene combination value (GCV), and environ-mental (E) deviations. The true breeding value of an individual is the sum of the independent ef-fects of all its genes that affect a quantitative trait. The gene combination value of an individual represents favorable and unfavorable interactions within and between genes, and is dependent upon the entire genotype of the animal. The environmental effect of an individual represents all of the non-genetic effects which influence its performance. Breeding values, gene combination values, and environmental effects can be positive or negative and are centered around zero. Therefore, individuals can have similar phenotypes but very different breeding values, gene com-bination values, and environmental effects.
Environmental effects such as nutrition and management are not inherited in future genera-tions. Furthermore, parents pass a random sample of half of their genes, and not their genotypes, to their progeny, so the gene combination value of an individual is not inherited in a predictable manner from his/her parents. However, since a parent transmits half of his/her genes to each
11
progeny, the expectation is that half of each parent’s breeding value is transmitted to each off-spring. Consequently, breeding value is of major importance to animal breeders. Since the num-ber of genes and their independent effects on performance traits are not known, the true breeding values of animals are not known. Lucky for us, breeding values can be estimated from the simi-larities among related animals for phenotypic performance. However, in order to accurately esti-mate breeding values, we must first identify the non-genetic effects which can influence the phe-notype of dairy sheep and adjust the phenotype for these effects in some manner.
Many research projects have been conducted at the University of Wisconsin-Madison’s Spooner ARS to determine the effects of various nutritional, management, health, and animal factors (e.g., lamb sex, lamb type of birth, ewe age) on the performance of dairy sheep. While many of these non-genetic effects are very important for determining the level of performance and profitability, they can mask breeding value differences among animals if they are applied differentially to sheep in the flock. As many of these non-genetic factors as possible need to be accounted for in order to accurately estimate breeding values of dairy sheep. The following sub-sections will discuss the important non-genetic effects that influence dairy ewe performance. Non-genetic effects on dairy ewe performance – lamb rearing systems
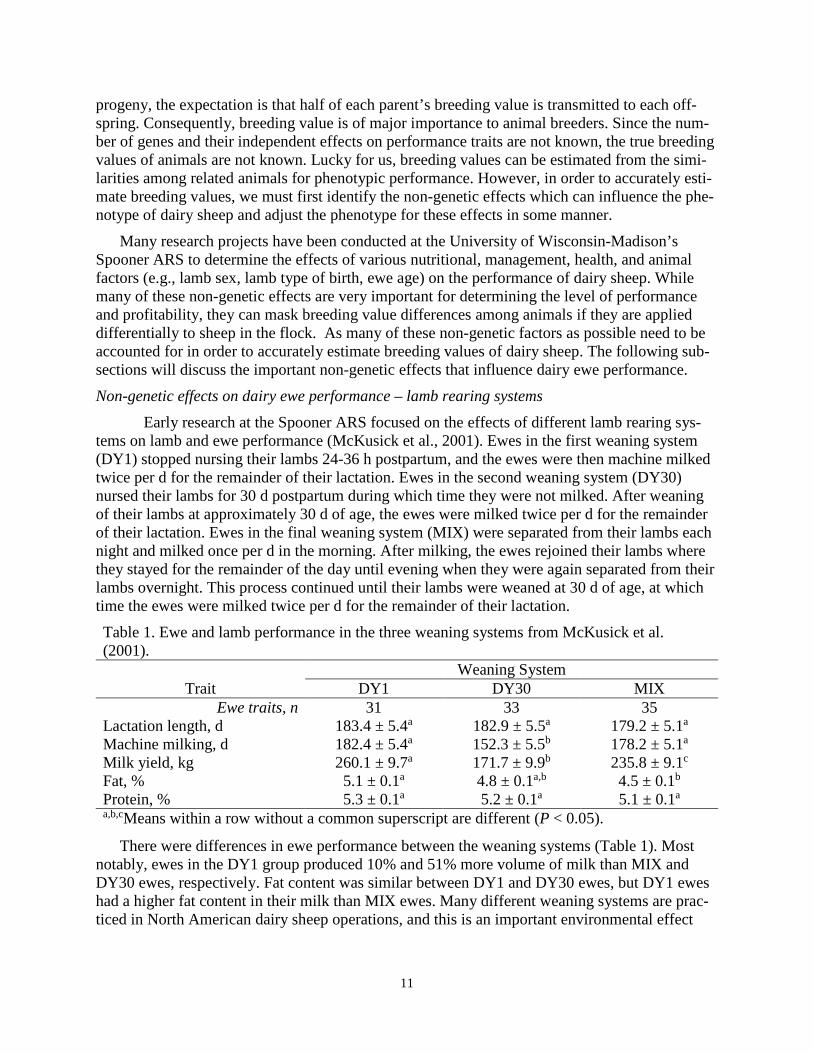
Early research at the Spooner ARS focused on the effects of different lamb rearing sys-tems on lamb and ewe performance (McKusick et al., 2001). Ewes in the first weaning system (DY1) stopped nursing their lambs 24-36 h postpartum, and the ewes were then machine milked twice per d for the remainder of their lactation. Ewes in the second weaning system (DY30) nursed their lambs for 30 d postpartum during which time they were not milked. After weaning of their lambs at approximately 30 d of age, the ewes were milked twice per d for the remainder of their lactation. Ewes in the final weaning system (MIX) were separated from their lambs each night and milked once per d in the morning. After milking, the ewes rejoined their lambs where they stayed for the remainder of the day until evening when they were again separated from their lambs overnight. This process continued until their lambs were weaned at 30 d of age, at which time the ewes were milked twice per d for the remainder of their lactation. Table 1. Ewe and lamb performance in the three weaning systems from McKusick et al. (2001). Weaning System
Trait DY1 DY30 MIX Ewe traits, n 31 33 35
Lactation length, d 183.4 ± 5.4a 182.9 ± 5.5a 179.2 ± 5.1a
Machine milking, d 182.4 ± 5.4a 152.3 ± 5.5b 178.2 ± 5.1a
Milk yield, kg 260.1 ± 9.7a 171.7 ± 9.9b 235.8 ± 9.1c
Fat, % 5.1 ± 0.1a 4.8 ± 0.1a,b 4.5 ± 0.1b
Protein, % 5.3 ± 0.1a 5.2 ± 0.1a 5.1 ± 0.1a
a,b,cMeans within a row without a common superscript are different (P < 0.05).
There were differences in ewe performance between the weaning systems (Table 1). Most notably, ewes in the DY1 group produced 10% and 51% more volume of milk than MIX and DY30 ewes, respectively. Fat content was similar between DY1 and DY30 ewes, but DY1 ewes had a higher fat content in their milk than MIX ewes. Many different weaning systems are prac-ticed in North American dairy sheep operations, and this is an important environmental effect
12
that will need to be accounted for to be able to accurately estimate breeding values for lactation traits. Non-genetic effects on dairy ewe performance – nutritional, biological, and systematic effects
Several studies at the Spooner ARS have evaluated the effect of various ewe nutritional treat-ments on lactation performance. One early project was conducted in 1998 and utilized 97 East Friesian-cross ewes that had been fed in drylot until mid-lactation. For the remainder of lactation, 48 ewes stayed in drylot while 49 grazed orchard grass-kura clover pasture (unpublished data; Thomas et al., 2014). The ewes that had access to pasture produced, on average, 10.5% more milk throughout lactation than the drylot ewes.
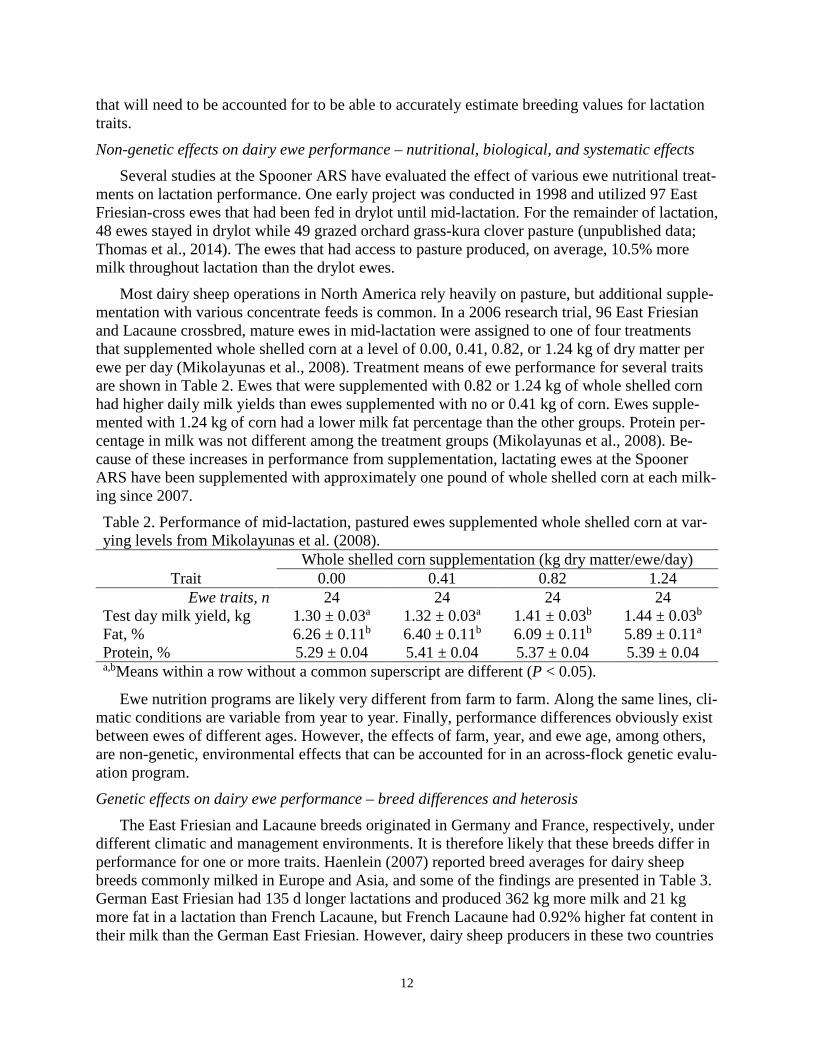
Most dairy sheep operations in North America rely heavily on pasture, but additional supple-mentation with various concentrate feeds is common. In a 2006 research trial, 96 East Friesian and Lacaune crossbred, mature ewes in mid-lactation were assigned to one of four treatments that supplemented whole shelled corn at a level of 0.00, 0.41, 0.82, or 1.24 kg of dry matter per ewe per day (Mikolayunas et al., 2008). Treatment means of ewe performance for several traits are shown in Table 2. Ewes that were supplemented with 0.82 or 1.24 kg of whole shelled corn had higher daily milk yields than ewes supplemented with no or 0.41 kg of corn. Ewes supple-mented with 1.24 kg of corn had a lower milk fat percentage than the other groups. Protein per-centage in milk was not different among the treatment groups (Mikolayunas et al., 2008). Be-cause of these increases in performance from supplementation, lactating ewes at the Spooner ARS have been supplemented with approximately one pound of whole shelled corn at each milk-ing since 2007. Table 2. Performance of mid-lactation, pastured ewes supplemented whole shelled corn at var-ying levels from Mikolayunas et al. (2008).
Whole shelled corn supplementation (kg dry matter/ewe/day) Trait 0.00 0.41 0.82 1.24
Ewe traits, n 24 24 24 24 Test day milk yield, kg 1.30 ± 0.03a 1.32 ± 0.03a 1.41 ± 0.03b 1.44 ± 0.03b
Fat, % 6.26 ± 0.11b 6.40 ± 0.11b 6.09 ± 0.11b 5.89 ± 0.11a
Protein, % 5.29 ± 0.04 5.41 ± 0.04 5.37 ± 0.04 5.39 ± 0.04 a,bMeans within a row without a common superscript are different (P < 0.05).
Ewe nutrition programs are likely very different from farm to farm. Along the same lines, cli-matic conditions are variable from year to year. Finally, performance differences obviously exist between ewes of different ages. However, the effects of farm, year, and ewe age, among others, are non-genetic, environmental effects that can be accounted for in an across-flock genetic evalu-ation program. Genetic effects on dairy ewe performance – breed differences and heterosis
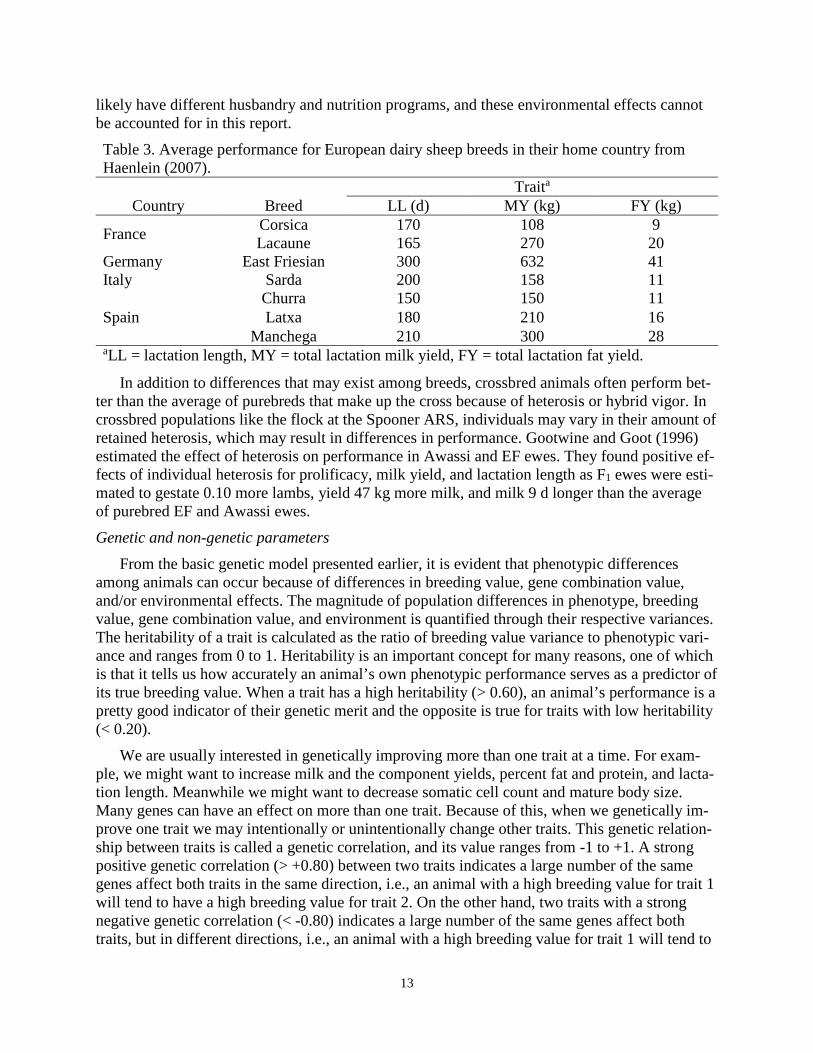
The East Friesian and Lacaune breeds originated in Germany and France, respectively, under different climatic and management environments. It is therefore likely that these breeds differ in performance for one or more traits. Haenlein (2007) reported breed averages for dairy sheep breeds commonly milked in Europe and Asia, and some of the findings are presented in Table 3. German East Friesian had 135 d longer lactations and produced 362 kg more milk and 21 kg more fat in a lactation than French Lacaune, but French Lacaune had 0.92% higher fat content in their milk than the German East Friesian. However, dairy sheep producers in these two countries
13
likely have different husbandry and nutrition programs, and these environmental effects cannot be accounted for in this report. Table 3. Average performance for European dairy sheep breeds in their home country from Haenlein (2007).
Traita
Country Breed LL (d) MY (kg) FY (kg)
France Corsica 170 108 9 Lacaune 165 270 20
Germany East Friesian 300 632 41 Italy Sarda 200 158 11
Spain Churra 150 150 11 Latxa 180 210 16
Manchega 210 300 28 aLL = lactation length, MY = total lactation milk yield, FY = total lactation fat yield.
In addition to differences that may exist among breeds, crossbred animals often perform bet-ter than the average of purebreds that make up the cross because of heterosis or hybrid vigor. In crossbred populations like the flock at the Spooner ARS, individuals may vary in their amount of retained heterosis, which may result in differences in performance. Gootwine and Goot (1996) estimated the effect of heterosis on performance in Awassi and EF ewes. They found positive ef-fects of individual heterosis for prolificacy, milk yield, and lactation length as F1 ewes were esti-mated to gestate 0.10 more lambs, yield 47 kg more milk, and milk 9 d longer than the average of purebred EF and Awassi ewes. Genetic and non-genetic parameters
From the basic genetic model presented earlier, it is evident that phenotypic differences among animals can occur because of differences in breeding value, gene combination value, and/or environmental effects. The magnitude of population differences in phenotype, breeding value, gene combination value, and environment is quantified through their respective variances. The heritability of a trait is calculated as the ratio of breeding value variance to phenotypic vari-ance and ranges from 0 to 1. Heritability is an important concept for many reasons, one of which is that it tells us how accurately an animal’s own phenotypic performance serves as a predictor of its true breeding value. When a trait has a high heritability (> 0.60), an animal’s performance is a pretty good indicator of their genetic merit and the opposite is true for traits with low heritability (< 0.20).
We are usually interested in genetically improving more than one trait at a time. For exam-ple, we might want to increase milk and the component yields, percent fat and protein, and lacta-tion length. Meanwhile we might want to decrease somatic cell count and mature body size. Many genes can have an effect on more than one trait. Because of this, when we genetically im-prove one trait we may intentionally or unintentionally change other traits. This genetic relation-ship between traits is called a genetic correlation, and its value ranges from -1 to +1. A strong positive genetic correlation (> +0.80) between two traits indicates a large number of the same genes affect both traits in the same direction, i.e., an animal with a high breeding value for trait 1 will tend to have a high breeding value for trait 2. On the other hand, two traits with a strong negative genetic correlation (< -0.80) indicates a large number of the same genes affect both traits, but in different directions, i.e., an animal with a high breeding value for trait 1 will tend to
14
have a low breeding value for trait 2.. However, a positive genetic correlation is not necessarily good and a negative genetic correlation is not necessarily bad. For example, if milk yield and so-matic cell count have a positive genetic correlation in a population, genetic improvement in milk yield would potentially come with increased somatic cell count.
Genetic evaluation of Spooner ARS dairy sheep Data description
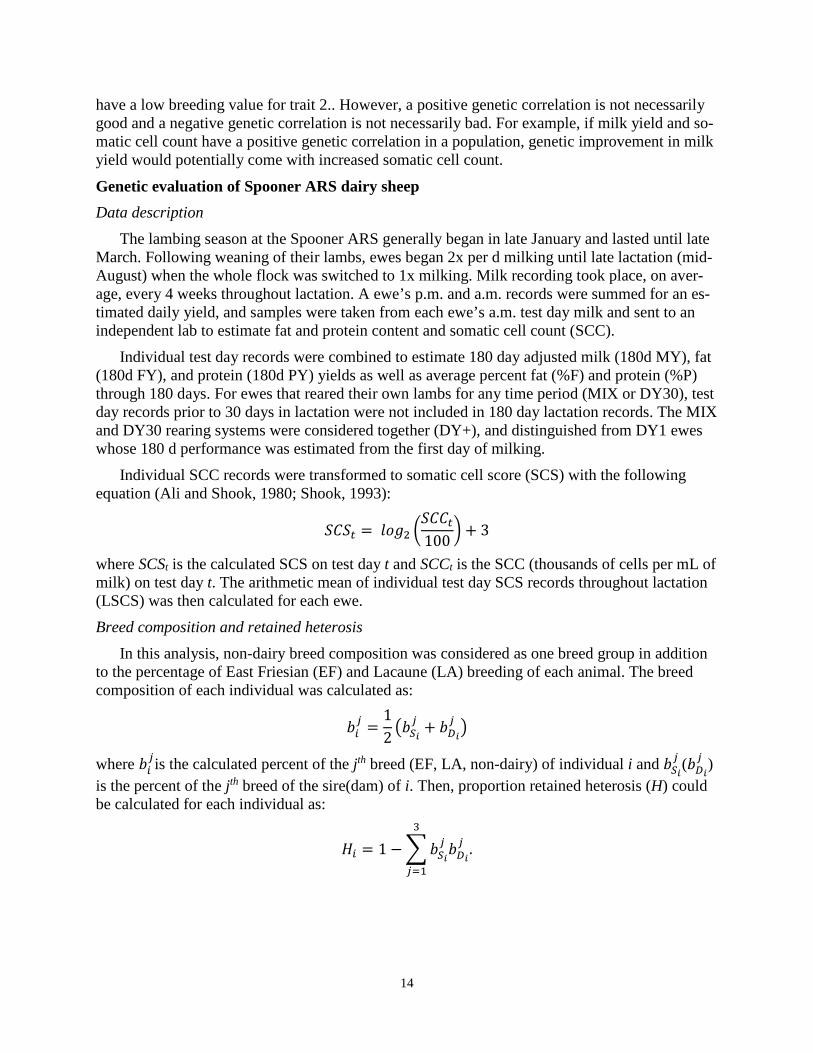
The lambing season at the Spooner ARS generally began in late January and lasted until late March. Following weaning of their lambs, ewes began 2x per d milking until late lactation (mid-August) when the whole flock was switched to 1x milking. Milk recording took place, on aver-age, every 4 weeks throughout lactation. A ewe’s p.m. and a.m. records were summed for an es-timated daily yield, and samples were taken from each ewe’s a.m. test day milk and sent to an independent lab to estimate fat and protein content and somatic cell count (SCC).
Individual test day records were combined to estimate 180 day adjusted milk (180d MY), fat (180d FY), and protein (180d PY) yields as well as average percent fat (%F) and protein (%P) through 180 days. For ewes that reared their own lambs for any time period (MIX or DY30), test day records prior to 30 days in lactation were not included in 180 day lactation records. The MIX and DY30 rearing systems were considered together (DY+), and distinguished from DY1 ewes whose 180 d performance was estimated from the first day of milking.
Individual SCC records were transformed to somatic cell score (SCS) with the following equation (Ali and Shook, 1980; Shook, 1993):
𝑆𝑆𝐺𝐺𝑆𝑆𝑡𝑡 = 𝑙𝑙𝑙𝑙𝑙𝑙2 �𝑆𝑆𝐺𝐺𝐺𝐺𝑡𝑡100
� + 3
where SCSt is the calculated SCS on test day t and SCCt is the SCC (thousands of cells per mL of milk) on test day t. The arithmetic mean of individual test day SCS records throughout lactation (LSCS) was then calculated for each ewe. Breed composition and retained heterosis
In this analysis, non-dairy breed composition was considered as one breed group in addition to the percentage of East Friesian (EF) and Lacaune (LA) breeding of each animal. The breed composition of each individual was calculated as:
𝑏𝑏𝑖𝑖𝑗𝑗 =
12�𝑏𝑏𝑆𝑆𝑖𝑖
𝑗𝑗 + 𝑏𝑏𝐷𝐷𝑖𝑖𝑗𝑗 �
where 𝑏𝑏𝑖𝑖𝑗𝑗is the calculated percent of the jth breed (EF, LA, non-dairy) of individual i and 𝑏𝑏𝑆𝑆𝑖𝑖
𝑗𝑗 (𝑏𝑏𝐷𝐷𝑖𝑖𝑗𝑗 )
is the percent of the jth breed of the sire(dam) of i. Then, proportion retained heterosis (H) could be calculated for each individual as:
𝐻𝐻𝑖𝑖 = 1 −�𝑏𝑏𝑆𝑆𝑖𝑖𝑗𝑗 𝑏𝑏𝐷𝐷𝑖𝑖
𝑗𝑗3
𝑗𝑗=1
.
15
Statistical models The ewe traits of interest were number of lambs born (NLB), LSCS, 180d MY, 180d FY,
180d PY, %F, and %P. Ewes were removed from the analyses if they were less than 12.5% dairy breeding (EF + LA), had a machine milking length less than 70 d, were culled or died mid-lacta-tion, or were treated for mastitis or other illness at any point during lactation. Additionally, a LSCS record needed to be the average of at least 3 individual test dates to be included in the analysis. After editing the dataset, there were 5,438 NLB records from 1,969 individual ewes and 4,696 LSCS and , 4,763 180d MY, 180d FY, 180d PY, %F, and %P records from 1,688 individ-ual ewes.
To estimate the non-additive genetic effects on ewe performance, univariate linear mixed models included the fixed effects of year of lambing (1995 – 2015), weaning system (included for lactation traits only; DY1 or DY+), age of ewe (1 – 6 years), and the random effect of ewe. Additionally, ewe’s EF and LA breed composition and individual retained heterosis were fit as linear covariates. All ewe traits were analyzed using the MIXED procedure of SAS (Version 9.3).
After the significant non-additive genetic effects for each trait were determined, two multi-ple-trait repeatability models were employed in ASReml (Version 4) from which genetic param-eters of and among traits were estimated and breeding values were predicted. The first model jointly analyzed NLB, 180d MY, 180d FY, 180d PY, and LSCS while the second model ana-lyzed NLB, 180dMY, %F, %P, and LSCS. Estimated breeding values of ewes with records were then regressed onto their year of birth to determine the genetic trend in traits over the years. Age, weaning system, breed, and heterosis effects on ewe performance
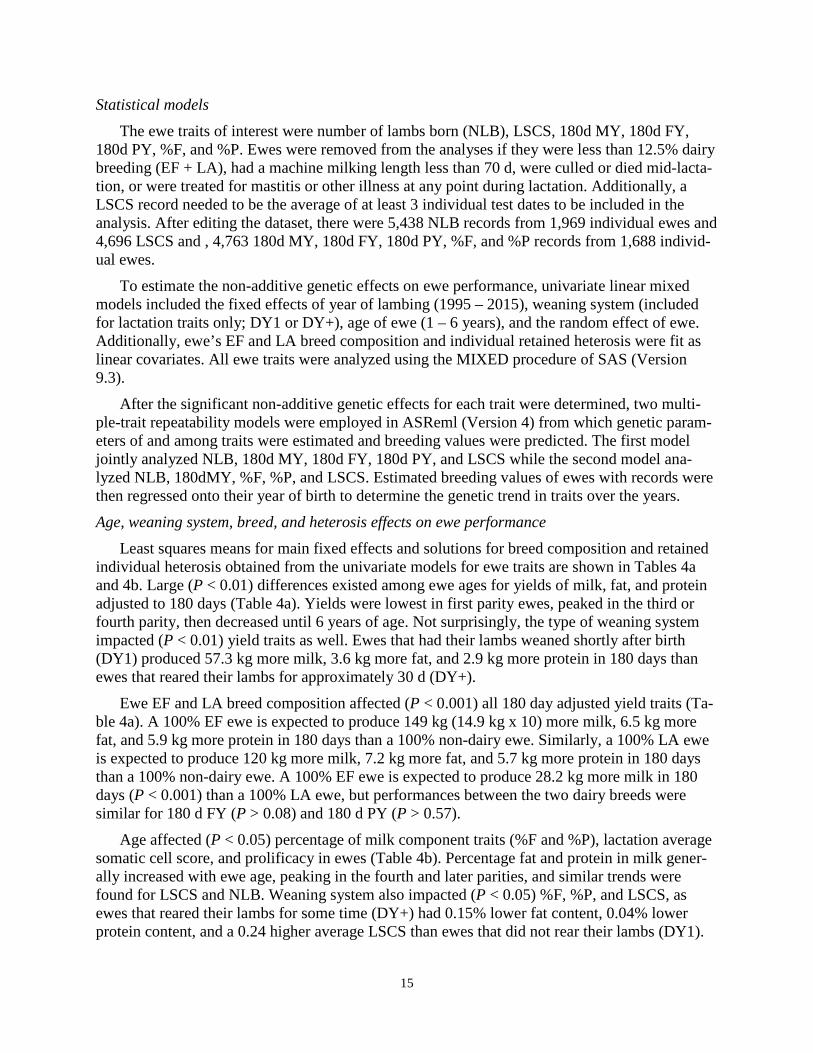
Least squares means for main fixed effects and solutions for breed composition and retained individual heterosis obtained from the univariate models for ewe traits are shown in Tables 4a and 4b. Large (P < 0.01) differences existed among ewe ages for yields of milk, fat, and protein adjusted to 180 days (Table 4a). Yields were lowest in first parity ewes, peaked in the third or fourth parity, then decreased until 6 years of age. Not surprisingly, the type of weaning system impacted (P < 0.01) yield traits as well. Ewes that had their lambs weaned shortly after birth (DY1) produced 57.3 kg more milk, 3.6 kg more fat, and 2.9 kg more protein in 180 days than ewes that reared their lambs for approximately 30 d (DY+).
Ewe EF and LA breed composition affected (P < 0.001) all 180 day adjusted yield traits (Ta-ble 4a). A 100% EF ewe is expected to produce 149 kg (14.9 kg x 10) more milk, 6.5 kg more fat, and 5.9 kg more protein in 180 days than a 100% non-dairy ewe. Similarly, a 100% LA ewe is expected to produce 120 kg more milk, 7.2 kg more fat, and 5.7 kg more protein in 180 days than a 100% non-dairy ewe. A 100% EF ewe is expected to produce 28.2 kg more milk in 180 days (P < 0.001) than a 100% LA ewe, but performances between the two dairy breeds were similar for 180 d FY (P > 0.08) and 180 d PY (P > 0.57).
Age affected (P < 0.05) percentage of milk component traits (%F and %P), lactation average somatic cell score, and prolificacy in ewes (Table 4b). Percentage fat and protein in milk gener-ally increased with ewe age, peaking in the fourth and later parities, and similar trends were found for LSCS and NLB. Weaning system also impacted (P < 0.05) %F, %P, and LSCS, as ewes that reared their lambs for some time (DY+) had 0.15% lower fat content, 0.04% lower protein content, and a 0.24 higher average LSCS than ewes that did not rear their lambs (DY1).
16
Table 4a. Least-squares means (± standard errors) for the main effects of ewe age (Age) and weaning system (Wean) and solutions for ewe breed and heterosis effects for 180 d adjusted milk (180d MY), fat (180d FY), and protein yield (180d PY).
Trait Effect Level 180d MY (kg) 180d FY (kg) 180d PY (kg)
Age
1 180.9 ± 1.84d 10.3 ± 0.11d 8.63 ± 0.09d
2 262.9 ± 2.11b 15.3 ± 0.13c 12.9 ± 0.10b
3 286.9 ± 2.43a 17.2 ± 0.15a 14.4 ± 0.12a
4 281.7 ± 2.92a 17.5 ± 0.18a 14.2 ± 0.14a
5 256.6 ± 3.53b 16.1 ± 0.22b 13.0 ± 0.17b
6 233.8 ± 4.67c 14.7 ± 0.29c 11.9 ± 0.23c
Wean DY1 279.1 ± 1.92a 17.0 ± 0.12a 14.0 ± 0.09a
DY+ 221.8 ± 2.84b 13.4 ± 0.18b 11.1 ± 0.14b
Breeding‡ EF 14.9 ± 1.13* 0.652 ± 0.068* 0.587 ± 0.053* LA 12.0 ± 1.21* 0.720 ± 0.074* 0.570 ± 0.058* HI 3.25 ± 0.62* 0.221 ± 0.037* 0.166 ± 0.029*
a,b,c,dMeans within a trait and effect are different (P < 0.05). *Coefficient is different from zero (P < 0.001). ‡EF = ewe percentage East Friesian breed composition; LA = ewe percentage Lacaune breed
composition; HI = percentage retained individual heterosis. EF, LA, and HI solutions are expressed per 10% increase.
Table 4b. Least-squares means (± standard errors) for the main effects of ewe age (Age) and weaning system (Wean) and solutions for ewe breed and heterosis effects for percentage milk fat (%F) and protein (%P), number of lambs born (NLB), and somatic cell score (LSCS).
Trait Effect Level %F %P LSCS NLB (n)
Age
1 5.68 ± 0.02e 4.80 ± 0.01d 2.85 ± 0.04c 1.63 ± 0.01d
2 5.76 ± 0.02d 4.95 ± 0.01c 2.73 ± 0.04d 1.88 ± 0.02c
3 5.92 ± 0.02c 5.01 ± 0.01b 2.81 ± 0.05c,d 2.12 ± 0.02b
4 6.09 ± 0.02b 5.05 ± 0.01a 2.88 ± 0.06b,c 2.20 ± 0.03a
5 6.15 ± 0.03a 5.06 ± 0.01a 3.04 ± 0.08a,b 2.10 ± 0.03b
6 6.13 ± 0.04a,b 5.07 ± 0.02a 3.12 ± 0.10a 2.24 ± 0.05a
Wean DY1 6.03 ± 0.02a 5.01 ± 0.01a 2.78 ± 0.04b - DY+ 5.88 ± 0.02b 4.97 ± 0.01b 3.02 ± 0.06a -
Breeding‡ EF -0.110 ± 0.005* -0.075 ± 0.005* ns ns LA ns -0.025 ± 0.005* 0.087 ± 0.012* -0.026 ± 0.004* HI ns ns ns 0.014 ± 0.004*
a,b,c,d,eMeans within a trait and effect are different (P < 0.05). *Coefficient is different from zero (P < 0.001). nsCoefficient is not different from zero (P > 0.15). ‡EF = ewe percentage East Friesian breed composition; LA = ewe percentage Lacaune breed
composition; HI = percentage retained individual heterosis. EF, LA, and HI solutions are ex-pressed per 10% increase.

17
Relative to non-dairy breeding, EF and LA breeding had a negative effect on %P but only EF breeding had a negative effect on %F (Table 4b). A 100% EF ewe is expected to have 1.1% less (P < 0.001) fat content and 0.75% less (P < 0.001) protein content than a 100% non-dairy ewe. A 100% LA ewe is expected to have 0.25% less (P < 0.001) protein content but similar (P > 0.16) fat content than a 100% non-dairy ewe. A 100% LA ewe is expected to have 0.5% more (P < 0.001) protein content than a 100% EF ewe. A 100% EF ewe is expected to have a similar (P > 0.92) performance for NLB and LSCS than a non-dairy ewe. However, LA breed composition adversely (P < 0.01) affected LSCS and NLB, as a 100% LA ewe is expected to have a 0.87 higher average LSCS and gestate 0.26 fewer lambs than a 100% EF or non-dairy ewe (Table 4b). Estimates of genetic parameters
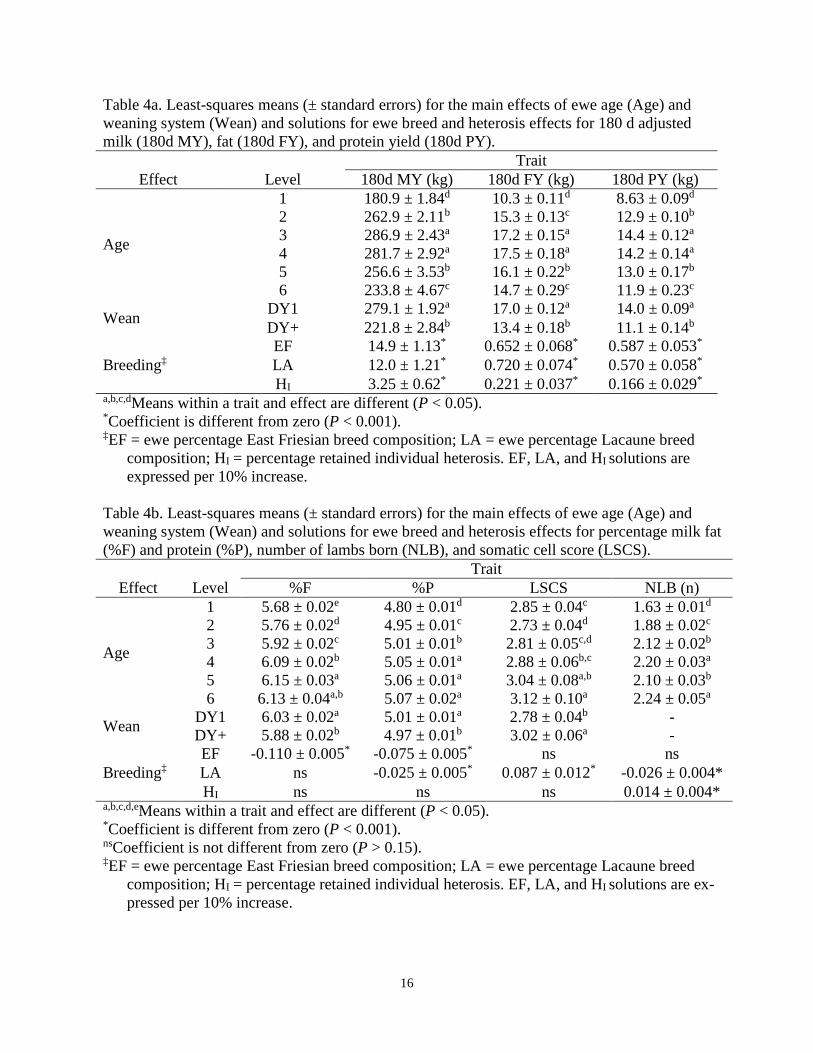
Genetic and non-genetic parameter estimates across traits are displayed in Tables 5a and 5b. Prolificacy and LSCS were estimated to be lowly heritable in both models (0.07 to 0.08 and 0.13, respectively). This indicates that, although genetic progress can certainly be made in NLB and LSCS, an individual’s phenotype for these traits is a poor predictor of their true genetic merit. Milk, fat, and protein yields adjusted to 180 days were all moderately heritable (0.26 to 0.32). Percentage fat and protein in milk were both highly heritable (0.53 and 0.61, respectively). These heritability estimates for lactation performance traits are within the range that has been reported in dairy cattle and goats, as well as European dairy sheep populations.
Prolificacy (NLB) was estimated to have low genetic correlations with the 180 d adjusted yield traits (-0.06 to 0.05) and LSCS (0.07 ± 0.18). The yield traits were all highly positively ge-netically correlated with one another (0.91 to 0.96), indicating that genetic improvement in 180d MY will result in genetic improvement in 180d FY and 180d PY as well. Milk, fat, and protein yields adjusted to 180 days were all moderately positively, and unfavorably, genetically corre-lated with LSCS (0.29 ± 0.13, 0.40 ± 0.13, and 0.29 ± 0.13, respectively). Therefore, one down-fall of focusing solely on genetic improvement of milk yield is that increased susceptibility to mastitis will likely follow. Table 5a. Estimates of heritability on the diagonal and genetic correlations (above diagonal) of and among number of lambs born per ewe lambing, 180 d adjusted milk yield, 180 d adjusted fat yield, 180 d adjusted protein yield, and lactation average somatic cell score.
Traitsa NLB 180d MY 180d FY 180d PY LSCS NLB 0.07 ± 0.02 0.05 ± 0.14 -0.06 ± 0.15 0.02 ± 0.14 0.07 ± 0.18 180d MY - 0.32 ± 0.04 0.91 ± 0.02 0.96 ± 0.01 0.29 ± 0.13 180d FY - - 0.26 ± 0.04 0.94 ± 0.01 0.40 ± 0.13 180d PY - - - 0.30 ± 0.04 0.29 ± 0.13 LSCS - - - - 0.13 ± 0.03 aNLB = number of lambs born per ewe lambing; 180d MY = 180 d adjusted milk yield; 180d
FY = 180 d adjusted fat yield; 180d PY = 180 d adjusted protein yield; LSCS = lactation average test-day somatic cell score.
Percentage fat and protein in milk were positively genetically correlated with each other (0.60 ± 0.05), but both were negatively genetically correlated with 180d MY (-0.31 ± 0.08 and -0.34 ± 0.08, respectively) (Table 5b). Again, if milk yield is the only selection criteria for North American dairy sheep, future generations will experience decreases in component content which could have negative consequences for cheese makers. The estimated genetic correlation between
18
LSCS and %P was low (0.03 ± 0.11), however, LSCS and %F were moderately positively genet-ically correlated (0.21 ± 0.11). Interestingly, NLB and %P were not genetically correlated (-0.01 ± 0.12), but the estimated genetic correlation between NLB and %F was moderately negative (-0.26 ± 0.12). Table 5b. Estimates of heritability on the diagonal and genetic correlations (above diagonal) of and among number of lambs born per ewe lambing, 180 d adjusted milk yield, percentage fat in milk, percentage protein in milk, and lactation average somatic cell score.
Traitsa NLB 180d MY %F %P LSCS NLB 0.08 ± 0.02 0.06 ± 0.17 -0.26 ± 0.12 -0.01 ± 0.12 0.06 ± 0.17 180d MY - 0.31 ± 0.04 -0.31 ± 0.08 -0.34 ± 0.08 0.30 ± 0.13 %F - - 0.53 ± 0.04 0.60 ± 0.05 0.21 ± 0.11 %P - - - 0.61 ± 0.04 0.03 ± 0.11 LSCS - - - - 0.13 ± 0.03 aNLB = number of lambs born per ewe lambing; 180d MY = 180 d adjusted milk yield; %F =
percentage fat in milk; %P = percentage protein in milk; LSCS = lactation average test-day somatic cell score.
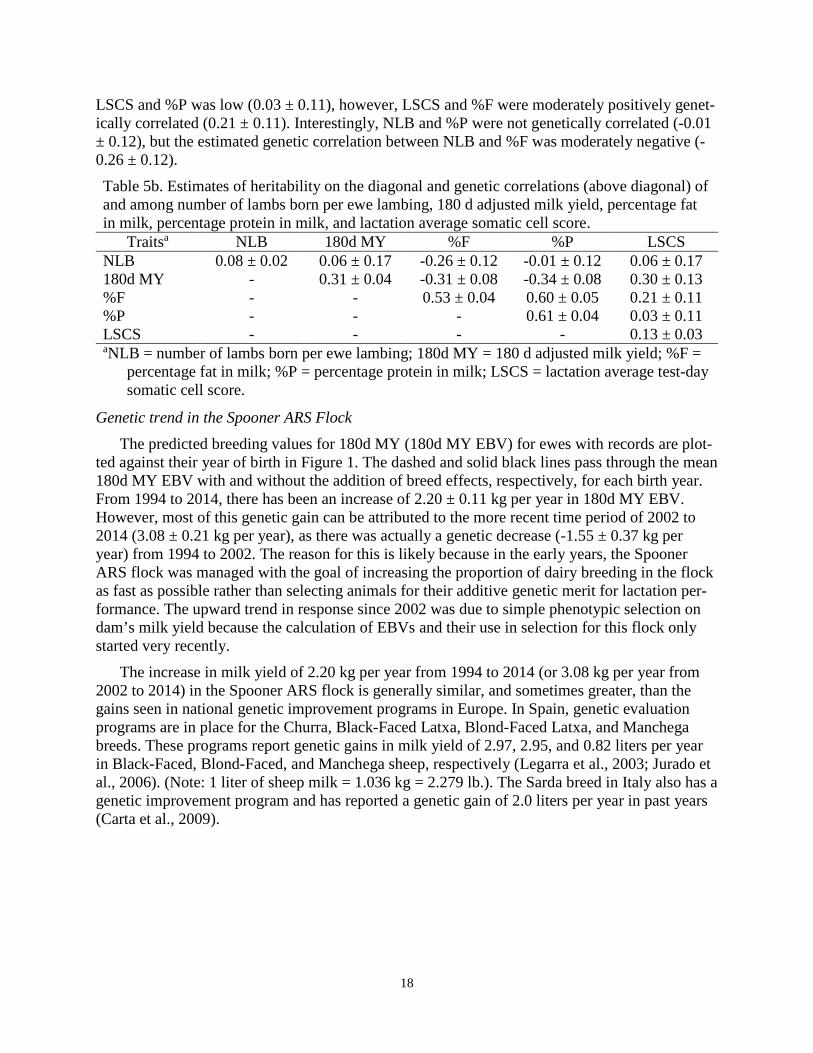
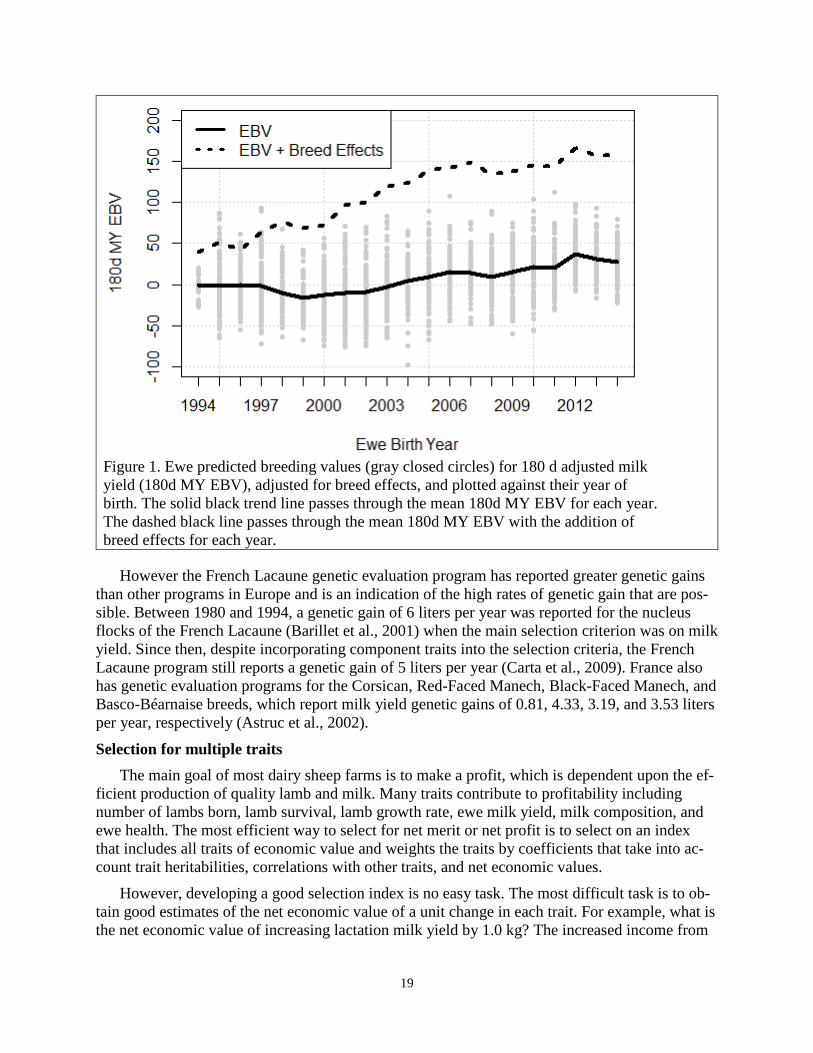
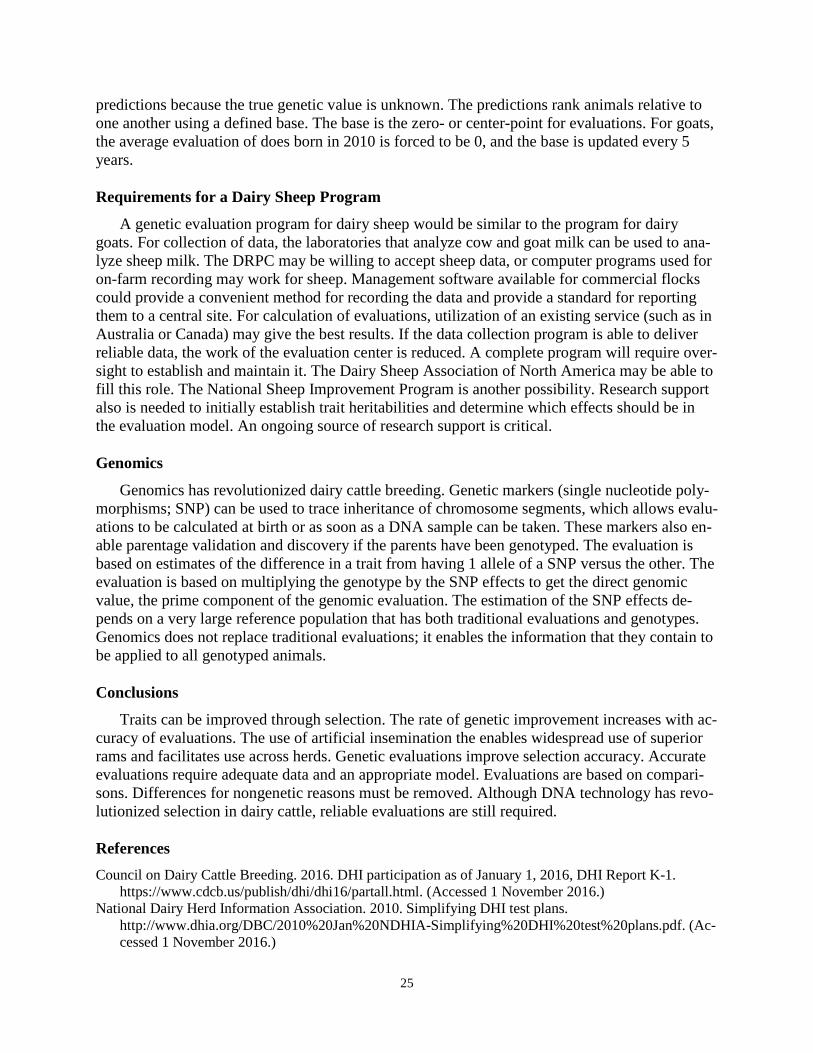
Genetic trend in the Spooner ARS Flock The predicted breeding values for 180d MY (180d MY EBV) for ewes with records are plot-
ted against their year of birth in Figure 1. The dashed and solid black lines pass through the mean 180d MY EBV with and without the addition of breed effects, respectively, for each birth year. From 1994 to 2014, there has been an increase of 2.20 ± 0.11 kg per year in 180d MY EBV. However, most of this genetic gain can be attributed to the more recent time period of 2002 to 2014 (3.08 ± 0.21 kg per year), as there was actually a genetic decrease (-1.55 ± 0.37 kg per year) from 1994 to 2002. The reason for this is likely because in the early years, the Spooner ARS flock was managed with the goal of increasing the proportion of dairy breeding in the flock as fast as possible rather than selecting animals for their additive genetic merit for lactation per-formance. The upward trend in response since 2002 was due to simple phenotypic selection on dam’s milk yield because the calculation of EBVs and their use in selection for this flock only started very recently.
The increase in milk yield of 2.20 kg per year from 1994 to 2014 (or 3.08 kg per year from 2002 to 2014) in the Spooner ARS flock is generally similar, and sometimes greater, than the gains seen in national genetic improvement programs in Europe. In Spain, genetic evaluation programs are in place for the Churra, Black-Faced Latxa, Blond-Faced Latxa, and Manchega breeds. These programs report genetic gains in milk yield of 2.97, 2.95, and 0.82 liters per year in Black-Faced, Blond-Faced, and Manchega sheep, respectively (Legarra et al., 2003; Jurado et al., 2006). (Note: 1 liter of sheep milk = 1.036 kg = 2.279 lb.). The Sarda breed in Italy also has a genetic improvement program and has reported a genetic gain of 2.0 liters per year in past years (Carta et al., 2009).
19
Figure 1. Ewe predicted breeding values (gray closed circles) for 180 d adjusted milk yield (180d MY EBV), adjusted for breed effects, and plotted against their year of birth. The solid black trend line passes through the mean 180d MY EBV for each year. The dashed black line passes through the mean 180d MY EBV with the addition of breed effects for each year.
However the French Lacaune genetic evaluation program has reported greater genetic gains
than other programs in Europe and is an indication of the high rates of genetic gain that are pos-sible. Between 1980 and 1994, a genetic gain of 6 liters per year was reported for the nucleus flocks of the French Lacaune (Barillet et al., 2001) when the main selection criterion was on milk yield. Since then, despite incorporating component traits into the selection criteria, the French Lacaune program still reports a genetic gain of 5 liters per year (Carta et al., 2009). France also has genetic evaluation programs for the Corsican, Red-Faced Manech, Black-Faced Manech, and Basco-Béarnaise breeds, which report milk yield genetic gains of 0.81, 4.33, 3.19, and 3.53 liters per year, respectively (Astruc et al., 2002).
Selection for multiple traits The main goal of most dairy sheep farms is to make a profit, which is dependent upon the ef-
ficient production of quality lamb and milk. Many traits contribute to profitability including number of lambs born, lamb survival, lamb growth rate, ewe milk yield, milk composition, and ewe health. The most efficient way to select for net merit or net profit is to select on an index that includes all traits of economic value and weights the traits by coefficients that take into ac-count trait heritabilities, correlations with other traits, and net economic values.
However, developing a good selection index is no easy task. The most difficult task is to ob-tain good estimates of the net economic value of a unit change in each trait. For example, what is the net economic value of increasing lactation milk yield by 1.0 kg? The increased income from
20
the extra 1.0 kg of milk is easy to calculate, but the cost of producing the extra 1.0 kg of milk is not so easy to determine. How much more feed does it take to produce the extra milk, how much longer does it take to milk a ewe with more milk production, what is the effect of the extra milk on the incidence of mastitis, etc., etc. etc.? While determining the net economic value of a kg of milk may not be easy, determining the net economic value of some other traits, such as milk pro-tein percentage, may be even more difficult.
Regardless of the challenges, a publicly available software package, ECOWEIGHT (Wolf et al., 2011a, b), was used to develop net profit selection indexes for dairy sheep using genetic pa-rameters estimated from the Spooner ARS flock records and costs of inputs and prices for prod-ucts from the Spooner ARS operation or estimated from national or regional sources. The traits included were NLB, lamb birth weight (BW), lamb 30 day weight (WW), 180d MY, 180d FY, 180 d PY, %F, and %P.
Indexes were calculated for two general production scenarios: 1) MILK - all milk sold to a processor on a weight basis with no premiums/discounts for percentage of fat and protein and 2) CHEESE - all milk processed into cheese on the farm. In both scenarios, the combined effects of changes in the non-lactation traits of NLB, BW, and WW only accounted for 5% to 14% of the changes in profitability. Under the MILK scenario, a change in 180 d MY accounted for over 80% of the change in profitability, and in the CHEESE scenario, a change in fat and protein (ei-ther % or yield) accounted for 73% to 84% of the change in profitability. Since it is important for cheese processing to maintain a high content of fat and protein in sheep milk, the recommended index, including only lactation traits, was:
Net Profit Index = (1.2 x EBV180d MY) + (280 x EBV%F) + (268 x EBV%P)
Does selection on EBVs work? Of course, the answer to the above question is “yes.” An EBV is an estimate of genetic value
of an animal, and selection on an estimate of genetic value, assuming that it is a good estimate calculated in a proper manner, is a better selection criterion than selecting on the raw phenotypic record. While we know this is true, it is always good to have some data that demonstrates this truism for non-believers.
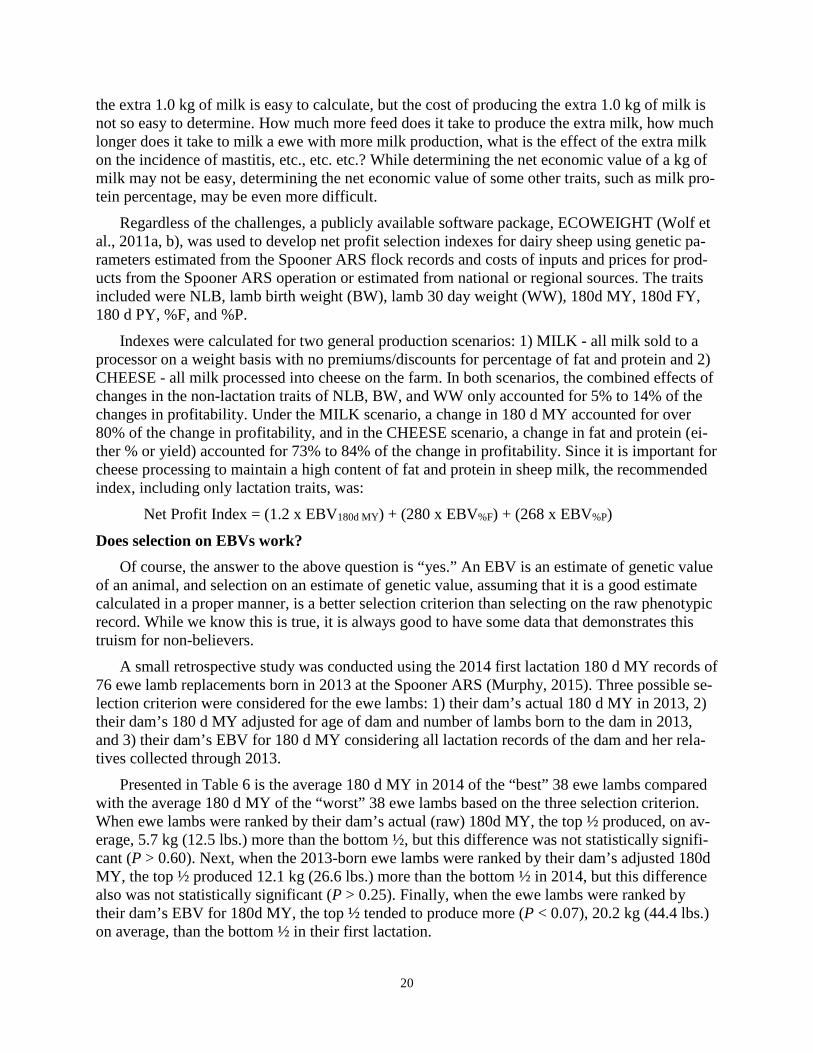
A small retrospective study was conducted using the 2014 first lactation 180 d MY records of 76 ewe lamb replacements born in 2013 at the Spooner ARS (Murphy, 2015). Three possible se-lection criterion were considered for the ewe lambs: 1) their dam’s actual 180 d MY in 2013, 2) their dam’s 180 d MY adjusted for age of dam and number of lambs born to the dam in 2013, and 3) their dam’s EBV for 180 d MY considering all lactation records of the dam and her rela-tives collected through 2013.
Presented in Table 6 is the average 180 d MY in 2014 of the “best” 38 ewe lambs compared with the average 180 d MY of the “worst” 38 ewe lambs based on the three selection criterion. When ewe lambs were ranked by their dam’s actual (raw) 180d MY, the top ½ produced, on av-erage, 5.7 kg (12.5 lbs.) more than the bottom ½, but this difference was not statistically signifi-cant (P > 0.60). Next, when the 2013-born ewe lambs were ranked by their dam’s adjusted 180d MY, the top ½ produced 12.1 kg (26.6 lbs.) more than the bottom ½ in 2014, but this difference also was not statistically significant (P > 0.25). Finally, when the ewe lambs were ranked by their dam’s EBV for 180d MY, the top ½ tended to produce more (P < 0.07), 20.2 kg (44.4 lbs.) on average, than the bottom ½ in their first lactation.
21
These results suggest that selection on the basis of any objective record is better than random selection without objective information, but selection on the best estimate of genetic value (the dam’s EBV in this case) is the most effective. Table 6. Least square means ± standard errors for 180d MY of ewe lambs whose dam was in the top or bottom half among all dams for 3 selection criteria. Selection Criterion
Dam Group Raw 180d MY, kg Adjusted 180d MY, kg EBV 180d MY, kg Top ½ 212.7 ± 7.8 215.8 ± 7.6 219.8 ± 7.5
Bottom ½ 207.0 ± 7.7 203.7 ± 7.7 199.6 ± 7.6 Top - Bottom 5.7 12.1 20.2*
*P < 0.07.
Conclusions There are several practices that are necessary to adopt before a genetic improvement program
can be implemented for North American dairy sheep flocks. First and foremost, routine milk re-cording (i.e., every 4 weeks) needs to implemented by participating flocks. Additionally, accu-rate pedigrees of all animals need to be maintained and genetic relatedness among animals within and between flocks has to be determined. This requires single-sire matings and a single national animal identification system that is capable of tracking animals that move from flock to flock and sires that are used in multiple flocks. Finally, genetic improvement only comes with a great deal of record-keeping and a lot of patience.
Buzzwords like “genomics” often conjure up images of being able to extract DNA from an animal at birth and immediately determining their genetic potential. Indeed, other livestock in-dustries are able to implement such technologies. However, the only reason they can do so is be-cause their genomic breeding values are backed by many, many years of parentage identification, performance recording, and pedigree-based estimated breeding values. The American sheep in-dustry needs to start at the basics before such state-of-the-art technologies are feasible.
Traditionally, the North American dairy sheep industry has relied on importing European germplasm as its main source of genetic improvement. To a lesser extent, replacement animals have been selected on their performance or the performance of their close female relatives. Though these methods can yield appreciable genetic gains, importing foreign genetics may con-tinue to be heavily regulated and expensive, and phenotypic selection is inaccurate for lowly or moderately heritable traits. A genetic evaluation program would be an invaluable development for North American dairy sheep, but it comes with a cost, and key practices must first be imple-mented.
References Ali, A. K. A. and G. E. Shook. 1980. An optimum transformation for somatic cell concentration
in milk. J. Dairy Sci. 63:487-490. Astruc, J. M., F. Barillet, A. Barbat, V. Clément, and D. Boichard. 2002. Genetic evaluation of
dairy sheep in France. 7th World Congr. Genet. Appl. Livest. Prod., Montpellier, France. 01:45.
Barillet, F., C. Marie, M. Jacquin, G. Lagriffoul, and J. M. Astruc. 2001. The French Lacaune dairy sheep breed: use in France and abroad in the last 40 years. Liv. Prod. Sci. 71:17-29.
22
Bourdon, R. M. 2000. Understanding animal breeding. 2nd Ed. Prentice-Hall, Inc., Upper Saddle River, NJ.
Carta, A., S. Casu, and S. Salaris. 2009. Invited review: Current state of genetic improvement in dairy sheep. J. Dairy Sci. 92:5814-5833.
Gootwine, E. and H. Goot. 1996. Lamb and milk production of Awassi and East-Friesian sheep and their crosses under Mediterranean environment. Small Rum. Res. 20:255-260.
Haenlein, G. F. W. 2007. About the evolution of goat and sheep milk production. Small Rum. Res. 68:3-6.
Jurado, J. J., M. Serrano, and M. D. Pérez-Guzmán. 2006. Análisis del progreso genético ob-tenido en el esquema de selection de la raza ovina Manchega. ITEA J. 102:41-54.
Legarra, A., E. Ugarte, and F. Arrese. 2003. Analysis of the genetic progress in the Latxa breed breeding program. Informacio Tecnico-Economica Agraria 99A:192–202.
McKusick, B. C., D. L. Thomas and Y. M. Berger. 2001. Effects of weaning systems on com-mercial milk production and lamb growth of East Friesian dairy sheep. J. Dairy Sci. 84:1660-1668.
Mikolayunas, C. M., D. L. Thomas, K. A. Albrecht, D. K. Combs, Y. M. Berger, and S. R. Eck-erman. 2008. Effects of supplementation and stage of lactation on performance of grazing dairy ewes. J. Dairy Sci. 91:1477-1485.
Murphy, T. W. 2015. Estimated breeding values do predict future performance. Proc. 63rd An-nual Spooner Sheep Day, Dept. Anim. Sci., Univ. Wisconsin-Madison. pp. 3-8.
Shook, G. E. 1993. Genetic improvement of mastitis through selection on somatic cell count. Veterinary Clinics of North America – Food Animal Practice. 9:563-581.
Thomas, D. L., Y. M. Berger, B. C. McKusick and C. M. Mikolayunas. 2014. Dairy sheep pro-duction research at the University of Wisconsin-Madison, USA – a review. J. Anim. Sci. and Biotech. 5:22.
Wolf, J., M. Wolfová, Z. Krupová, and E. Krupa. 2011. User’s manual for the program package ECOWEIGHT, Version 5.1.1. Part 3A: program EWSH2 for sheep, Version 1.0.2.
Wolf, J. and M. Wolfová. 2011. User’s manual for the program package ECOWEIGHT, Version 5.1.1. Part 3B: program GFSH for gene flow in sheep, Version 1.0.3.
23
IMPLEMENTATION OF GENETIC EVALUATION
George R. Wiggans Council on Dairy Cattle Breeding
Bowie, Maryland, USA Background
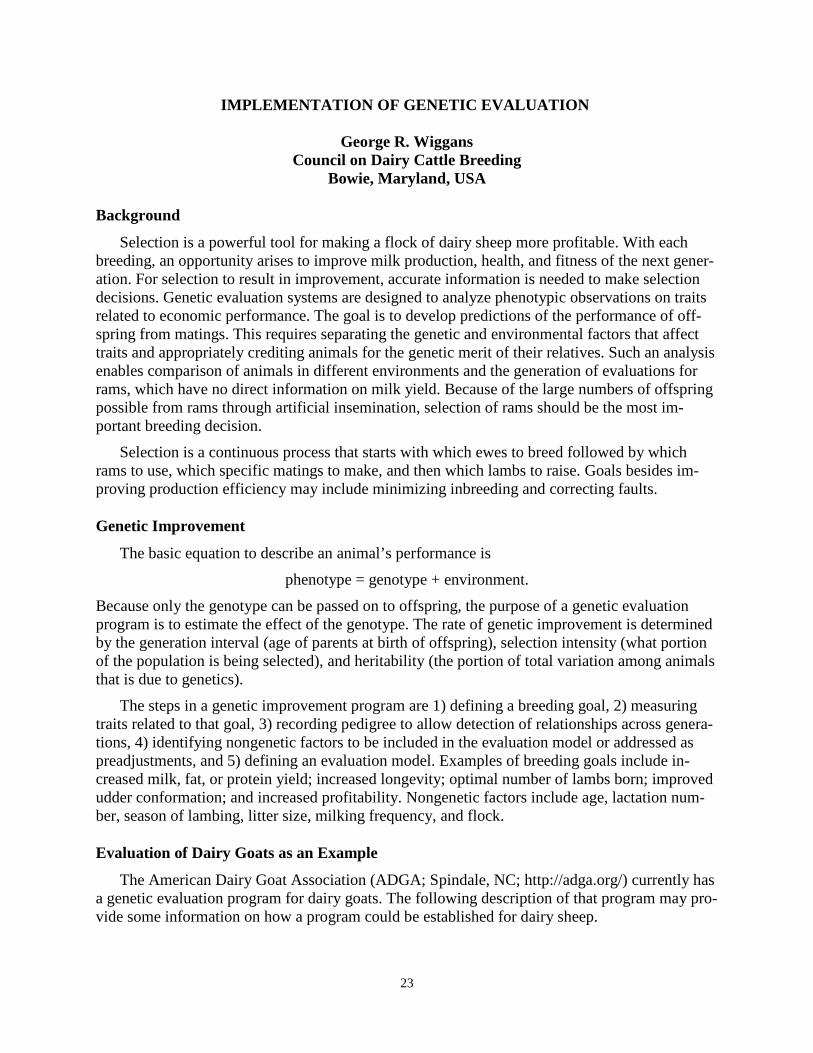
Selection is a powerful tool for making a flock of dairy sheep more profitable. With each breeding, an opportunity arises to improve milk production, health, and fitness of the next gener-ation. For selection to result in improvement, accurate information is needed to make selection decisions. Genetic evaluation systems are designed to analyze phenotypic observations on traits related to economic performance. The goal is to develop predictions of the performance of off-spring from matings. This requires separating the genetic and environmental factors that affect traits and appropriately crediting animals for the genetic merit of their relatives. Such an analysis enables comparison of animals in different environments and the generation of evaluations for rams, which have no direct information on milk yield. Because of the large numbers of offspring possible from rams through artificial insemination, selection of rams should be the most im-portant breeding decision.
Selection is a continuous process that starts with which ewes to breed followed by which rams to use, which specific matings to make, and then which lambs to raise. Goals besides im-proving production efficiency may include minimizing inbreeding and correcting faults. Genetic Improvement
The basic equation to describe an animal’s performance is phenotype = genotype + environment.
Because only the genotype can be passed on to offspring, the purpose of a genetic evaluation program is to estimate the effect of the genotype. The rate of genetic improvement is determined by the generation interval (age of parents at birth of offspring), selection intensity (what portion of the population is being selected), and heritability (the portion of total variation among animals that is due to genetics).
The steps in a genetic improvement program are 1) defining a breeding goal, 2) measuring traits related to that goal, 3) recording pedigree to allow detection of relationships across genera-tions, 4) identifying nongenetic factors to be included in the evaluation model or addressed as preadjustments, and 5) defining an evaluation model. Examples of breeding goals include in-creased milk, fat, or protein yield; increased longevity; optimal number of lambs born; improved udder conformation; and increased profitability. Nongenetic factors include age, lactation num-ber, season of lambing, litter size, milking frequency, and flock. Evaluation of Dairy Goats as an Example
The American Dairy Goat Association (ADGA; Spindale, NC; http://adga.org/) currently has a genetic evaluation program for dairy goats. The following description of that program may pro-vide some information on how a program could be established for dairy sheep.
24
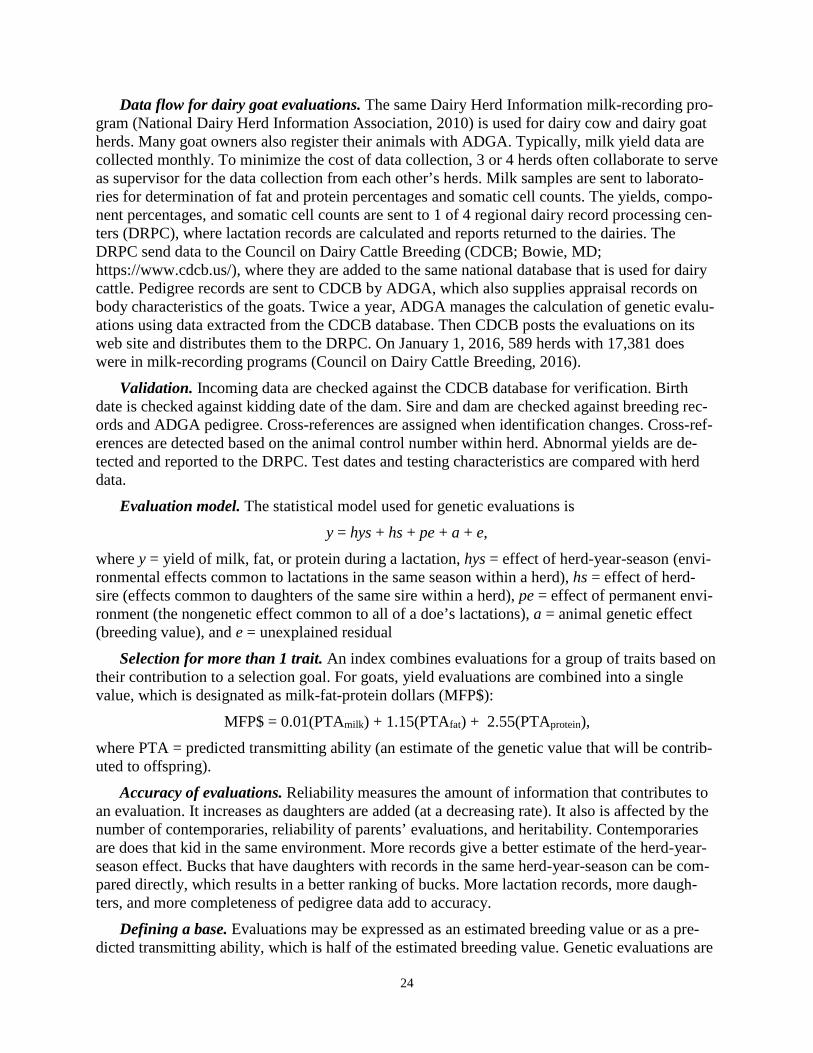
Data flow for dairy goat evaluations. The same Dairy Herd Information milk-recording pro-gram (National Dairy Herd Information Association, 2010) is used for dairy cow and dairy goat herds. Many goat owners also register their animals with ADGA. Typically, milk yield data are collected monthly. To minimize the cost of data collection, 3 or 4 herds often collaborate to serve as supervisor for the data collection from each other’s herds. Milk samples are sent to laborato-ries for determination of fat and protein percentages and somatic cell counts. The yields, compo-nent percentages, and somatic cell counts are sent to 1 of 4 regional dairy record processing cen-ters (DRPC), where lactation records are calculated and reports returned to the dairies. The DRPC send data to the Council on Dairy Cattle Breeding (CDCB; Bowie, MD; https://www.cdcb.us/), where they are added to the same national database that is used for dairy cattle. Pedigree records are sent to CDCB by ADGA, which also supplies appraisal records on body characteristics of the goats. Twice a year, ADGA manages the calculation of genetic evalu-ations using data extracted from the CDCB database. Then CDCB posts the evaluations on its web site and distributes them to the DRPC. On January 1, 2016, 589 herds with 17,381 does were in milk-recording programs (Council on Dairy Cattle Breeding, 2016).
Validation. Incoming data are checked against the CDCB database for verification. Birth date is checked against kidding date of the dam. Sire and dam are checked against breeding rec-ords and ADGA pedigree. Cross-references are assigned when identification changes. Cross-ref-erences are detected based on the animal control number within herd. Abnormal yields are de-tected and reported to the DRPC. Test dates and testing characteristics are compared with herd data.
Evaluation model. The statistical model used for genetic evaluations is y = hys + hs + pe + a + e,
where y = yield of milk, fat, or protein during a lactation, hys = effect of herd-year-season (envi-ronmental effects common to lactations in the same season within a herd), hs = effect of herd-sire (effects common to daughters of the same sire within a herd), pe = effect of permanent envi-ronment (the nongenetic effect common to all of a doe’s lactations), a = animal genetic effect (breeding value), and e = unexplained residual
Selection for more than 1 trait. An index combines evaluations for a group of traits based on their contribution to a selection goal. For goats, yield evaluations are combined into a single value, which is designated as milk-fat-protein dollars (MFP$):
MFP$ = 0.01(PTAmilk) + 1.15(PTAfat) + 2.55(PTAprotein), where PTA = predicted transmitting ability (an estimate of the genetic value that will be contrib-uted to offspring).
Accuracy of evaluations. Reliability measures the amount of information that contributes to an evaluation. It increases as daughters are added (at a decreasing rate). It also is affected by the number of contemporaries, reliability of parents’ evaluations, and heritability. Contemporaries are does that kid in the same environment. More records give a better estimate of the herd-year-season effect. Bucks that have daughters with records in the same herd-year-season can be com-pared directly, which results in a better ranking of bucks. More lactation records, more daugh-ters, and more completeness of pedigree data add to accuracy.
Defining a base. Evaluations may be expressed as an estimated breeding value or as a pre-dicted transmitting ability, which is half of the estimated breeding value. Genetic evaluations are
25
predictions because the true genetic value is unknown. The predictions rank animals relative to one another using a defined base. The base is the zero- or center-point for evaluations. For goats, the average evaluation of does born in 2010 is forced to be 0, and the base is updated every 5 years. Requirements for a Dairy Sheep Program
A genetic evaluation program for dairy sheep would be similar to the program for dairy goats. For collection of data, the laboratories that analyze cow and goat milk can be used to ana-lyze sheep milk. The DRPC may be willing to accept sheep data, or computer programs used for on-farm recording may work for sheep. Management software available for commercial flocks could provide a convenient method for recording the data and provide a standard for reporting them to a central site. For calculation of evaluations, utilization of an existing service (such as in Australia or Canada) may give the best results. If the data collection program is able to deliver reliable data, the work of the evaluation center is reduced. A complete program will require over-sight to establish and maintain it. The Dairy Sheep Association of North America may be able to fill this role. The National Sheep Improvement Program is another possibility. Research support also is needed to initially establish trait heritabilities and determine which effects should be in the evaluation model. An ongoing source of research support is critical. Genomics
Genomics has revolutionized dairy cattle breeding. Genetic markers (single nucleotide poly-morphisms; SNP) can be used to trace inheritance of chromosome segments, which allows evalu-ations to be calculated at birth or as soon as a DNA sample can be taken. These markers also en-able parentage validation and discovery if the parents have been genotyped. The evaluation is based on estimates of the difference in a trait from having 1 allele of a SNP versus the other. The evaluation is based on multiplying the genotype by the SNP effects to get the direct genomic value, the prime component of the genomic evaluation. The estimation of the SNP effects de-pends on a very large reference population that has both traditional evaluations and genotypes. Genomics does not replace traditional evaluations; it enables the information that they contain to be applied to all genotyped animals. Conclusions
Traits can be improved through selection. The rate of genetic improvement increases with ac-curacy of evaluations. The use of artificial insemination the enables widespread use of superior rams and facilitates use across herds. Genetic evaluations improve selection accuracy. Accurate evaluations require adequate data and an appropriate model. Evaluations are based on compari-sons. Differences for nongenetic reasons must be removed. Although DNA technology has revo-lutionized selection in dairy cattle, reliable evaluations are still required. References Council on Dairy Cattle Breeding. 2016. DHI participation as of January 1, 2016, DHI Report K-1.
https://www.cdcb.us/publish/dhi/dhi16/partall.html. (Accessed 1 November 2016.) National Dairy Herd Information Association. 2010. Simplifying DHI test plans.
http://www.dhia.org/DBC/2010%20Jan%20NDHIA-Simplifying%20DHI%20test%20plans.pdf. (Ac-cessed 1 November 2016.)

26
PARLOR DESIGN AND EQUIPMENT Frank Welcome
Quality Milk Production Services, Cornell University Ithaca, New York, USA
Introduction Ewes are usually milked on an elevated platform from the rear. A bucket system is portable
and suitable for smaller dairies. Larger dairies can usually justify the expense of a parlor milking system. There are several different designs for parlor milking systems. Parlors usually have a sin-gle row of stanchions, parallel stanchions, or are rotary-style. The Dairy Practices Council pub-lishes several helpful guides specifically addressing small ruminant dairy farming. DPC Guide-line 70 provides a practical discussion, for dairymen and certified equipment dealers, of the in-stallation, cleaning, and sanitizing of small ruminant milking systems. The recommendations are kept in line with those of 3-A Accepted Practices for Design, Fabrication, and Installation of Milking and Milk Handling Equipment, and with the Milking Machine Manufacturers Council of the Farm and Industrial Equipment Institute. Subjects discussed pertaining to cleaning and sani-tizing include: steps in cleaning mechanical cleaned pipeline systems, cleaning and sanitizing bucket milking machines, cleaning pulsation lines, cleaning farm milk tanks, and troubleshooting cleaning problems.
Careful planning needs to assure: o Suitable potable water supply for sanitation as well as an ample supply for the animals. o Plans for the disposal of waste from milk houses as it contains cleaning residues and milk
waste (see Guidelines 15). o Milkhouse and milking center plans including provision for adequate ventilation. o Properly designed milking and milk cooling systems. o Reliable electrical supply and back-up generator.
Milking Machine Function
Basic to the operation of any milking machines "negative" pressure between one-third and one-half of the atmosphere in a confined space (bucket, pipeline, tube and hose). This pressure differential moves milk away from the animal’s teats, or fluids away from any opening since air rushes in to equalize pressure. A continuous vacuum at the teat end would stress the teats so air is admitted between the shell and liner by an air vent in the claw or inflation. The pulsator allows the collapse of teatcup liners (inflations) and massage the teats. Milk should flow directly away from each teat preventing flooding or cross contamination between glands. Agitating milk during harvest leads to possible foaming and increased rancidity, so milk should flow gently through milk lines and not mix with air. Conversely, pulsing air and fluids are needed to create turbulent and fast moving slugs of rinsing, washing and sanitizing solutions to effectively clean milking systems.
Milking System Issues Unique to Small Ruminants ISO standards specify the minimum requirements for milkline and vacuum pump sizing for
small ruminant milking systems. Your local milking machine company representative can advise
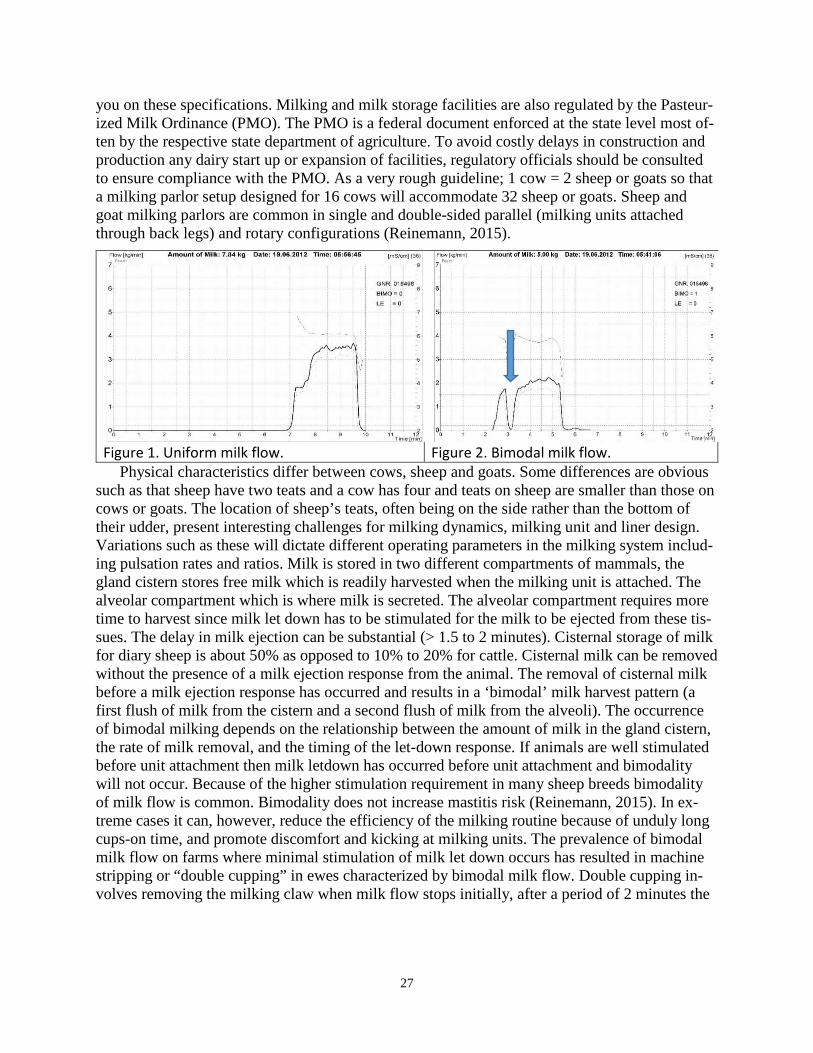
27
you on these specifications. Milking and milk storage facilities are also regulated by the Pasteur-ized Milk Ordinance (PMO). The PMO is a federal document enforced at the state level most of-ten by the respective state department of agriculture. To avoid costly delays in construction and production any dairy start up or expansion of facilities, regulatory officials should be consulted to ensure compliance with the PMO. As a very rough guideline; 1 cow = 2 sheep or goats so that a milking parlor setup designed for 16 cows will accommodate 32 sheep or goats. Sheep and goat milking parlors are common in single and double-sided parallel (milking units attached through back legs) and rotary configurations (Reinemann, 2015).
Figure 1. Uniform milk flow.
Figure 2. Bimodal milk flow.
Physical characteristics differ between cows, sheep and goats. Some differences are obvious such as that sheep have two teats and a cow has four and teats on sheep are smaller than those on cows or goats. The location of sheep’s teats, often being on the side rather than the bottom of their udder, present interesting challenges for milking dynamics, milking unit and liner design. Variations such as these will dictate different operating parameters in the milking system includ-ing pulsation rates and ratios. Milk is stored in two different compartments of mammals, the gland cistern stores free milk which is readily harvested when the milking unit is attached. The alveolar compartment which is where milk is secreted. The alveolar compartment requires more time to harvest since milk let down has to be stimulated for the milk to be ejected from these tis-sues. The delay in milk ejection can be substantial (> 1.5 to 2 minutes). Cisternal storage of milk for diary sheep is about 50% as opposed to 10% to 20% for cattle. Cisternal milk can be removed without the presence of a milk ejection response from the animal. The removal of cisternal milk before a milk ejection response has occurred and results in a ‘bimodal’ milk harvest pattern (a first flush of milk from the cistern and a second flush of milk from the alveoli). The occurrence of bimodal milking depends on the relationship between the amount of milk in the gland cistern, the rate of milk removal, and the timing of the let-down response. If animals are well stimulated before unit attachment then milk letdown has occurred before unit attachment and bimodality will not occur. Because of the higher stimulation requirement in many sheep breeds bimodality of milk flow is common. Bimodality does not increase mastitis risk (Reinemann, 2015). In ex-treme cases it can, however, reduce the efficiency of the milking routine because of unduly long cups-on time, and promote discomfort and kicking at milking units. The prevalence of bimodal milk flow on farms where minimal stimulation of milk let down occurs has resulted in machine stripping or “double cupping” in ewes characterized by bimodal milk flow. Double cupping in-volves removing the milking claw when milk flow stops initially, after a period of 2 minutes the
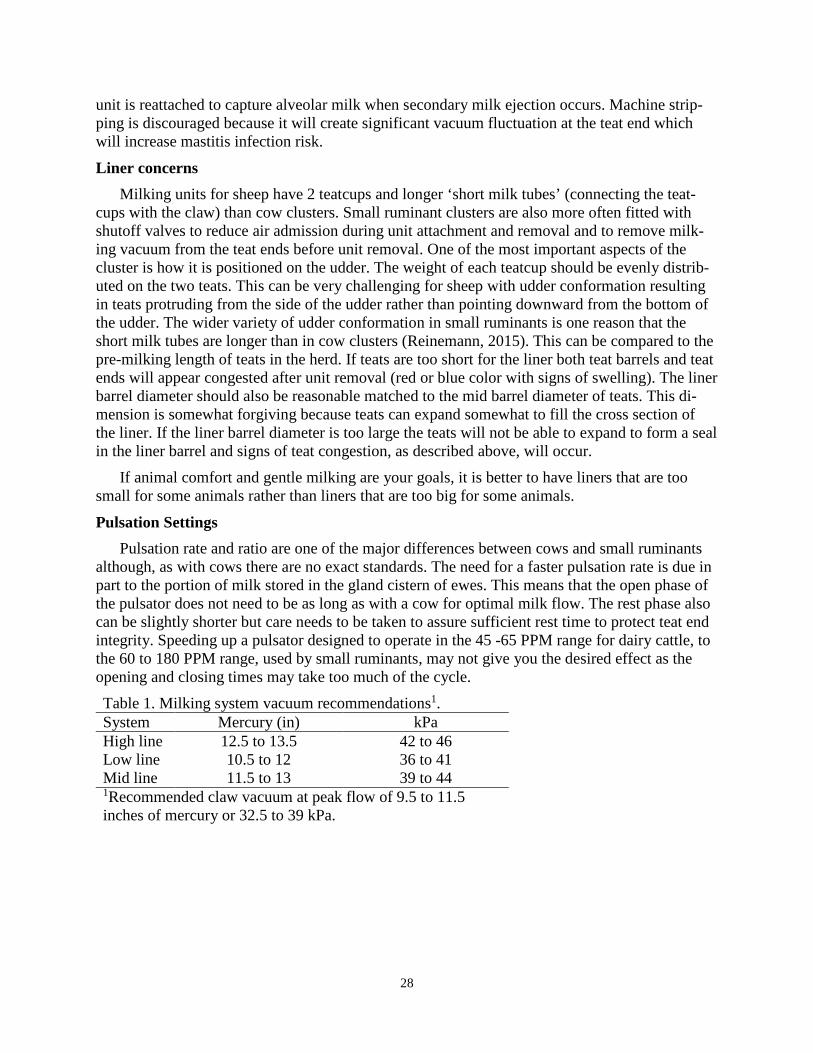
28
unit is reattached to capture alveolar milk when secondary milk ejection occurs. Machine strip-ping is discouraged because it will create significant vacuum fluctuation at the teat end which will increase mastitis infection risk.
Liner concerns Milking units for sheep have 2 teatcups and longer ‘short milk tubes’ (connecting the teat-
cups with the claw) than cow clusters. Small ruminant clusters are also more often fitted with shutoff valves to reduce air admission during unit attachment and removal and to remove milk-ing vacuum from the teat ends before unit removal. One of the most important aspects of the cluster is how it is positioned on the udder. The weight of each teatcup should be evenly distrib-uted on the two teats. This can be very challenging for sheep with udder conformation resulting in teats protruding from the side of the udder rather than pointing downward from the bottom of the udder. The wider variety of udder conformation in small ruminants is one reason that the short milk tubes are longer than in cow clusters (Reinemann, 2015). This can be compared to the pre-milking length of teats in the herd. If teats are too short for the liner both teat barrels and teat ends will appear congested after unit removal (red or blue color with signs of swelling). The liner barrel diameter should also be reasonable matched to the mid barrel diameter of teats. This di-mension is somewhat forgiving because teats can expand somewhat to fill the cross section of the liner. If the liner barrel diameter is too large the teats will not be able to expand to form a seal in the liner barrel and signs of teat congestion, as described above, will occur.
If animal comfort and gentle milking are your goals, it is better to have liners that are too small for some animals rather than liners that are too big for some animals.
Pulsation Settings Pulsation rate and ratio are one of the major differences between cows and small ruminants
although, as with cows there are no exact standards. The need for a faster pulsation rate is due in part to the portion of milk stored in the gland cistern of ewes. This means that the open phase of the pulsator does not need to be as long as with a cow for optimal milk flow. The rest phase also can be slightly shorter but care needs to be taken to assure sufficient rest time to protect teat end integrity. Speeding up a pulsator designed to operate in the 45 -65 PPM range for dairy cattle, to the 60 to 180 PPM range, used by small ruminants, may not give you the desired effect as the opening and closing times may take too much of the cycle. Table 1. Milking system vacuum recommendations1. System Mercury (in) kPa High line 12.5 to 13.5 42 to 46 Low line 10.5 to 12 36 to 41 Mid line 11.5 to 13 39 to 44 1Recommended claw vacuum at peak flow of 9.5 to 11.5 inches of mercury or 32.5 to 39 kPa.
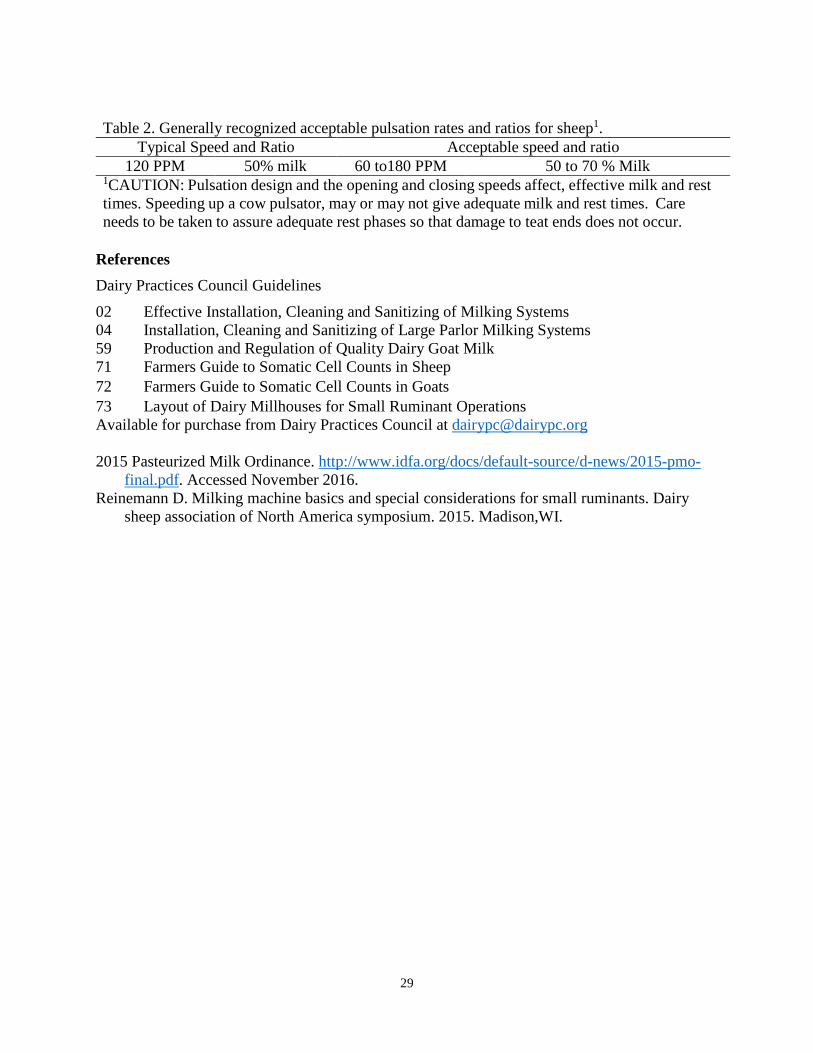
29
Table 2. Generally recognized acceptable pulsation rates and ratios for sheep1. Typical Speed and Ratio Acceptable speed and ratio
120 PPM 50% milk 60 to180 PPM 50 to 70 % Milk 1CAUTION: Pulsation design and the opening and closing speeds affect, effective milk and rest times. Speeding up a cow pulsator, may or may not give adequate milk and rest times. Care needs to be taken to assure adequate rest phases so that damage to teat ends does not occur.
References Dairy Practices Council Guidelines 02 Effective Installation, Cleaning and Sanitizing of Milking Systems 04 Installation, Cleaning and Sanitizing of Large Parlor Milking Systems 59 Production and Regulation of Quality Dairy Goat Milk 71 Farmers Guide to Somatic Cell Counts in Sheep 72 Farmers Guide to Somatic Cell Counts in Goats 73 Layout of Dairy Millhouses for Small Ruminant Operations Available for purchase from Dairy Practices Council at [email protected] 2015 Pasteurized Milk Ordinance. http://www.idfa.org/docs/default-source/d-news/2015-pmo-
final.pdf. Accessed November 2016. Reinemann D. Milking machine basics and special considerations for small ruminants. Dairy
sheep association of North America symposium. 2015. Madison,WI.
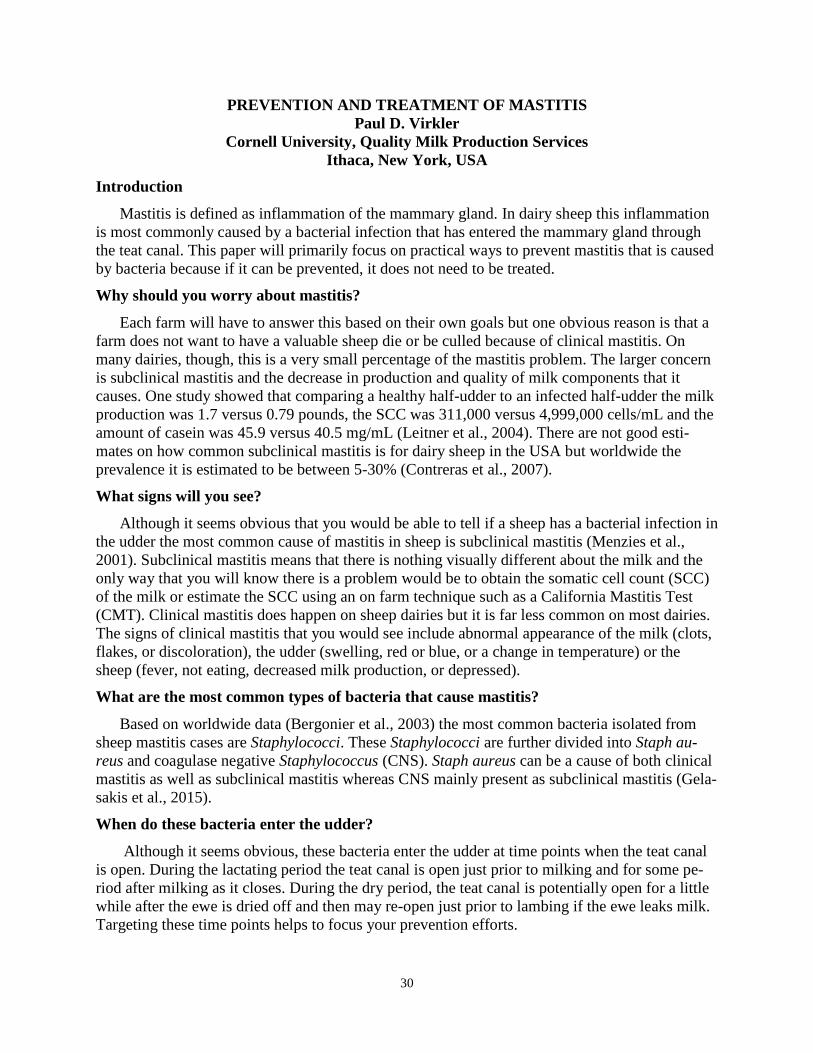
30
PREVENTION AND TREATMENT OF MASTITIS Paul D. Virkler
Cornell University, Quality Milk Production Services Ithaca, New York, USA
Introduction
Mastitis is defined as inflammation of the mammary gland. In dairy sheep this inflammation is most commonly caused by a bacterial infection that has entered the mammary gland through the teat canal. This paper will primarily focus on practical ways to prevent mastitis that is caused by bacteria because if it can be prevented, it does not need to be treated.
Why should you worry about mastitis?
Each farm will have to answer this based on their own goals but one obvious reason is that a farm does not want to have a valuable sheep die or be culled because of clinical mastitis. On many dairies, though, this is a very small percentage of the mastitis problem. The larger concern is subclinical mastitis and the decrease in production and quality of milk components that it causes. One study showed that comparing a healthy half-udder to an infected half-udder the milk production was 1.7 versus 0.79 pounds, the SCC was 311,000 versus 4,999,000 cells/mL and the amount of casein was 45.9 versus 40.5 mg/mL (Leitner et al., 2004). There are not good esti-mates on how common subclinical mastitis is for dairy sheep in the USA but worldwide the prevalence it is estimated to be between 5-30% (Contreras et al., 2007).
What signs will you see?
Although it seems obvious that you would be able to tell if a sheep has a bacterial infection in the udder the most common cause of mastitis in sheep is subclinical mastitis (Menzies et al., 2001). Subclinical mastitis means that there is nothing visually different about the milk and the only way that you will know there is a problem would be to obtain the somatic cell count (SCC) of the milk or estimate the SCC using an on farm technique such as a California Mastitis Test (CMT). Clinical mastitis does happen on sheep dairies but it is far less common on most dairies. The signs of clinical mastitis that you would see include abnormal appearance of the milk (clots, flakes, or discoloration), the udder (swelling, red or blue, or a change in temperature) or the sheep (fever, not eating, decreased milk production, or depressed).
What are the most common types of bacteria that cause mastitis?
Based on worldwide data (Bergonier et al., 2003) the most common bacteria isolated from sheep mastitis cases are Staphylococci. These Staphylococci are further divided into Staph au-reus and coagulase negative Staphylococcus (CNS). Staph aureus can be a cause of both clinical mastitis as well as subclinical mastitis whereas CNS mainly present as subclinical mastitis (Gela-sakis et al., 2015).
When do these bacteria enter the udder?
Although it seems obvious, these bacteria enter the udder at time points when the teat canal is open. During the lactating period the teat canal is open just prior to milking and for some pe-riod after milking as it closes. During the dry period, the teat canal is potentially open for a little while after the ewe is dried off and then may re-open just prior to lambing if the ewe leaks milk. Targeting these time points helps to focus your prevention efforts.
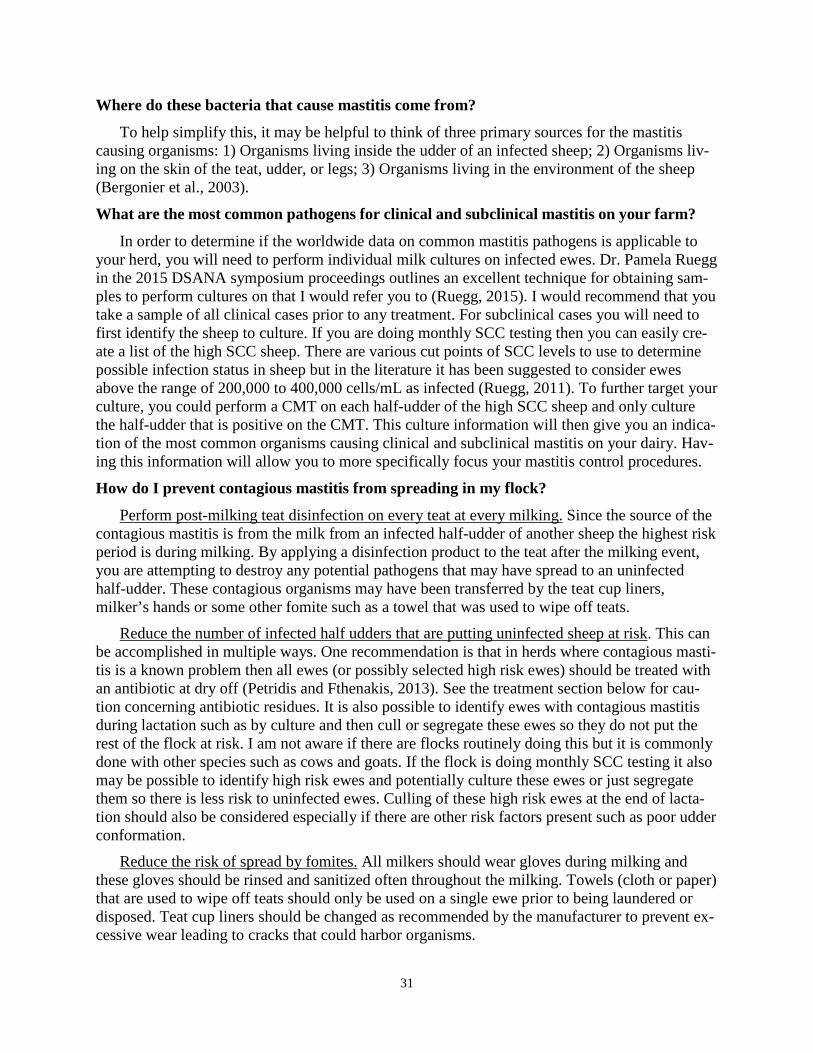
31
Where do these bacteria that cause mastitis come from?
To help simplify this, it may be helpful to think of three primary sources for the mastitis causing organisms: 1) Organisms living inside the udder of an infected sheep; 2) Organisms liv-ing on the skin of the teat, udder, or legs; 3) Organisms living in the environment of the sheep (Bergonier et al., 2003).
What are the most common pathogens for clinical and subclinical mastitis on your farm?
In order to determine if the worldwide data on common mastitis pathogens is applicable to your herd, you will need to perform individual milk cultures on infected ewes. Dr. Pamela Ruegg in the 2015 DSANA symposium proceedings outlines an excellent technique for obtaining sam-ples to perform cultures on that I would refer you to (Ruegg, 2015). I would recommend that you take a sample of all clinical cases prior to any treatment. For subclinical cases you will need to first identify the sheep to culture. If you are doing monthly SCC testing then you can easily cre-ate a list of the high SCC sheep. There are various cut points of SCC levels to use to determine possible infection status in sheep but in the literature it has been suggested to consider ewes above the range of 200,000 to 400,000 cells/mL as infected (Ruegg, 2011). To further target your culture, you could perform a CMT on each half-udder of the high SCC sheep and only culture the half-udder that is positive on the CMT. This culture information will then give you an indica-tion of the most common organisms causing clinical and subclinical mastitis on your dairy. Hav-ing this information will allow you to more specifically focus your mastitis control procedures.
How do I prevent contagious mastitis from spreading in my flock?
Perform post-milking teat disinfection on every teat at every milking. Since the source of the contagious mastitis is from the milk from an infected half-udder of another sheep the highest risk period is during milking. By applying a disinfection product to the teat after the milking event, you are attempting to destroy any potential pathogens that may have spread to an uninfected half-udder. These contagious organisms may have been transferred by the teat cup liners, milker’s hands or some other fomite such as a towel that was used to wipe off teats.
Reduce the number of infected half udders that are putting uninfected sheep at risk. This can be accomplished in multiple ways. One recommendation is that in herds where contagious masti-tis is a known problem then all ewes (or possibly selected high risk ewes) should be treated with an antibiotic at dry off (Petridis and Fthenakis, 2013). See the treatment section below for cau-tion concerning antibiotic residues. It is also possible to identify ewes with contagious mastitis during lactation such as by culture and then cull or segregate these ewes so they do not put the rest of the flock at risk. I am not aware if there are flocks routinely doing this but it is commonly done with other species such as cows and goats. If the flock is doing monthly SCC testing it also may be possible to identify high risk ewes and potentially culture these ewes or just segregate them so there is less risk to uninfected ewes. Culling of these high risk ewes at the end of lacta-tion should also be considered especially if there are other risk factors present such as poor udder conformation.
Reduce the risk of spread by fomites. All milkers should wear gloves during milking and these gloves should be rinsed and sanitized often throughout the milking. Towels (cloth or paper) that are used to wipe off teats should only be used on a single ewe prior to being laundered or disposed. Teat cup liners should be changed as recommended by the manufacturer to prevent ex-cessive wear leading to cracks that could harbor organisms.

32
Reduce the risk of bringing in ewes with infected half-udders. Any purchased ewes should be cultured prior to being introduced to the milking flock to reduce the risk of bringing in conta-gious mastitis.
Consider the milking order of a flock. The early lactation younger ewes should ideally be milked first as they are the least likely to be infected on most dairies. If monthly SCC testing is being done then any ewe that has a repeated high SCC (greater than 200,000 to 400,000 cells/ml) should be milked toward the end of milking. It is also possible that the CMT could be performed on a monthly basis and any ewes that are repeated high on the CMT could be moved to a pen that is milked last.
Promote healthy teat skin. Some of these contagious mastitis pathogens can first colonize the teat skin so keeping this skin healthy will allow it to naturally resist colonization. Controlling the environmental conditions to minimize the amount of extreme cold, excessive moisture, and wind that teats are exposed to should help. Using a post-dip with a good emollient package and mak-ing sure that the entire teat is covered should also promote healthy teat skin.
How do I reduce the risk of mastitis causing pathogens found in the environment from gaining access to the teat canal?
I am using the word, “environment,” in this context to include mastitis causing bacteria that are found on the teat, skin, legs, wool, bedding, etc.
Reduce the amount of mastitis causing organisms at the teat end during milking. Since the teat canal is opened during milking it is critical that the teat end is clean prior to the teat cup liner being attached. Depending on the cleanliness of the teats prior to milking there may be a benefit to applying a pre-dip disinfection as part of the milking routine. This pre-dip should have at least 30 seconds of contact time and then be completely wiped off with an individual towel prior to unit attachment. Milkers should be trained to specifically focus on wiping the teat end as well as the barrel of the teat to ensure that both are completely cleaned before the teat cups are attached. If cloth towels are used they should be washed with detergent and dried prior to being re-used.
Reduce the amount of mastitis causing organisms that teats are exposed to outside the milk-ing center. Keeping the housing area of the ewes as clean and dry as possible at all times will re-duce the pathogen load that the teats are exposed to. This also helps to reduce the work load of the milkers that have to clean the teats at the next milking. Controlling the stocking density of each pen will also help to maintain a clean and dry environment.
Reduce the risk of teat damage caused by the milking equipment. Setting the milking system up with the appropriate vacuum levels and pulsation parameters is essential to properly milk the ewes. These settings along with proper teat cup liner alignment will reduce the risk of liner slips during milking which can potentially create teat end impacts depending on the specific milking equipment used. Having a properly timed and consistent milking routine and removing units as soon as milking is finished will also help reduce the risk of teat damage caused by excessive overmilking.
Keep the milking center and milking units clean. If the milking units and milking floor are excessively dirty it can increase the risk that teats will be exposed to a larger pathogen load. The mouthpiece lip of the liner is one critical area to keep clean as this can expose the teat end and barrel of the teat to pathogens as the unit is attached or removed.
33
Keep the environment that dry ewes are kept in as clean and dry as possible. It is important for ewes just after dry off and just prior to lambing that the environment they are housed in be as clean and dry as possible. Monitor the stocking density in these pens as well to help control the exposure to environmental pathogens.
Treatment of Mastitis
Since there are no approved drugs for the treatment of ovine mastitis in the USA and there has been limited work done on the withdrawal periods for antibiotics in lactating sheep it makes this topic very difficult to address in any detail. Each farm should have an established relation-ship with a veterinarian as it is possible for them to legally prescribe antibiotics for mastitis treat-ment under strict guidelines outlined for the extra-label use of drugs. These guidelines specify that the prescribing veterinarian must provide a meat and milk withdrawal time for the drugs be-ing used. It would also be prudent for the farm to have their veterinarian develop a written stand-ard treatment protocol for severe clinical mastitis that farm personnel could carry out to at least provide supportive treatment in the event that a veterinarian was not immediately available.
If the veterinarian and the farm do decide to use intramammary treatments either during lac-tation or the dry period then it is critical that the herd veterinarian review the proper administra-tion technique with all personnel who are authorized to perform this task. It is also imperative that the farm have a fail-safe way to ensure that no treated ewes are milked into the tank as it is likely that a residue could occur.
Conclusion
Mastitis in dairy sheep can be a challenging disease because the most common presentation is subclinical mastitis. Even though there are not visible signs, the effect of subclinical mastitis on milk production and milk components of infected ewes make it worthwhile to focus manage-ment time in order to prevent this disease in your flock.
References Bergonier, D., R. de Cremoux, R. Rupp, G. Lagriffoul, and X. Berthelot. 2003. Mastitis of dairy small ru-
minants. Vet Res 34:689-716. Contreras, A., D. Sierra, A. Sanchez, J.C. Corrales, J.C. Marco, M.J. Paape, and C. Gonzalo. 2007. Masti-
tis in small ruminants. Small Rumin Res 68:145-153. Gelasakis, A.I., V.S. Mayrogianni, I.G. Petridis, N.G. Vasileiou, and G.C. Fthenakis. 2015. Mastitis in
sheep – The last 10 years and the future of research. Vet Microbiol 181:136-146. Leitner, G., M. Chaffer, A. Shamay, F. Shapiro, U. Merin, E. Ezra, A. Saran, and N. Silanikove. 2004.
Changes in milk composition as affected by subclinical mastitis in sheep. J Dairy Sci 87: 46-52. Menzies, P.I., S.Z. Ramanoon. 2001. Mastitis of sheep and goats. Vet Clin North Am Food Anim Pract
17:333-358. Petridis, I.G., and G.C. Fthenakis. 2014. Administration of antibiotics to ewes at the beginning of the dry-
period. J Dairy Res 81:9-15 Ruegg, P.L. 2011. Mastitis in small ruminants. AABP Proc 44: 111-119 Ruegg, P.L. 2015. Udder health for production of quality sheep milk. DSANA Symposium Proc 17-23.
34
QUALITY MILK MANAGEMENT
Frank Welcome Quality Milk Production Services, Cornell University
Ithaca, New York, USA
Introduction Quality milk is produced to predetermined standards, some are regulated other standards are
set by the producer and processor. Measurements such as bacteria levels, somatic cell count, but-terfat, protein and others are dependent upon management strategies implemented during milk harvest. Pre-milking hygiene procedures influence both bacteria counts in milk and incidence of infection. At the same time, adding steps to milking routine can reduce milking parlor profitabil-ity. How to manage for both quality and profitability can be a challenge.
Until recently sheep dairying did not have a strong scientific background in the development of sound quality production methods. It is only since the mechanical milking of sheep was intro-duced in France in 1962 that research on sheep milking has been undertaken in most European countries where sheep are kept for dairying (Bencini, 1997). Quality of sheep milk refers to its capability to be transformed into high quality dairy products, and to produce high yields of these products from each pound of milk. High protein, fat and total solids concentrations in the milk are associated with high yields in the resulting dairy products. However other measures of qual-ity such as Somatic cell count (SCC), Bacteria count (Standard Plate Count –SPC) and freezing point also influence the quality of manufactured products like cheese and yogurt. As a conse-quence, the milk of sheep has a higher yield of dairy products than the milk of cows and goats because it has higher concentrations of protein, fat and total solids. Once the milk is harvested and delivered to the cheese maker there is little to be done to improve milk quality. The milk re-ceived should be of high microbiological quality, free of antibiotics and have quality components (fat, protein) within acceptable limits.
Farm factors influencing milk quality include biosecurity, milking procedures, milking sys-tem performance, environment & housing, nutrition, culling, record keeping and monitoring milk quality parameters, and treatment protocols.
Biosecurity in Dairy Flocks Biosecurity refers to the management practices that are undertaken to prevent the introduc-
tion and spread of diseases. The introduction of new animals poses the single greatest risk to bi-osecurity. Anytime a new animal is introduced to the flock, there is a potential risk of that animal introducing a new disease. You should not purchase animals from flocks or farms in which you observe lameness, abscesses (contagious lymphadenitis), sore mouth, ringworm, or other clinical signs of disease. Other diseases that may be of concern and affect productivity and milk quality include Q fever, Johne’s disease, Staph aureus and mycoplasma mastitis. When planning flock expansion consult with a veterinarian with expertise in small ruminant health and management.
35
Milking Routine and Procedures Although the distinction between these two terms is not universally recognized, milking rou-
tine can be described as “the system by which milkers move through a milking parlor”. Milking procedures are appropriately defined as “the steps that define the routine” (e.g. cowside activities performed by each milker). Prep time has been defined as the time to manually clean and dry the teat surface. Strategies for milk harvesting and sanitation vary around the world. Specific milk-ing procedures such as pre dipping and forestripping have been proven to be beneficial to im-prove milk quality. There is mounting evidence that pre-milking procedures to stimulate milk let down improves milk yield although this concept is not universally accepted. Apparently the milk let down reflex of sheep is complicated and the exact stimuli to maximize milk let down and har-vest milk efficiently is not clearly elucidated.
Milk quality goals of the manager dictate the number and type of milking procedures utilized within a milking routine. Milker training is crucial to successful milking parlor management. Ewes can be milked by hand or by machine, regardless of the method use, hygiene is of primary importance. Ewes are usually milked on an elevated platform from the rear. There are several different designs for parlor milking systems. Each design has its advantages and disadvantages as discussed earlier. Difficulties in managing the sanitary quality of sheep milk derive from a series of factors including the low level of production per head, the milking system, the difficulty in-volved in machine milking, the conditions under which the herds or flocks are raised, adverse climatic conditions and the spread of production over a wide geographic arear (Klinger 1997). In the absence of pasteurization, all cheeses made from raw milk should be subjected to strict peri-odic controls.
Somatic Cell Count The health of the sheep in general, and of the mammary glands in particular, influence both
the quantity and the quality of the milk produced. The most common pathology of the mammary gland in sheep dairies is mastitis, an inflammation of the udder caused by infection of the mam-mary tissue. Mastitis is economically important for sheep dairies because it reduces milk produc-tion and causes qualitative changes in milk composition which alter the processing performance of the milk and the qualitative characteristics of the dairy products obtained. This is due to a de-creased capacity of the mammary secretory cells and to an increased permeability of the mam-mary epithelium that causes the passage of blood components directly into the milk. The somatic cell count is correlated with the health of the mammary gland though the somatic cell count and the bacteria count of the milk are not necessarily correlated. The somatic cell count (SCC) is a regulated measure of milk quality in the US (upper limit = 750,000 cells/mL) and represents the level of the inflammatory reaction in the face of infection. The SCC a component of the innate immune defense of the mammary gland, and number of somatic cells increases considerably in the event of an inflammatory reaction within the mammary gland
The milk of dairy cows and sheep suffering from mastitis does not clot and is not suitable for cheese production. A high somatic cell count results in changes in the composition of milk, with a reduction in fat, casein and total solids, and an increase in total nitrogen, non-protein nitrogen and whey proteins. Milk minerals have also been reported to change, with increased chloride and
36
decreased phosphate, citric acid, potassium and magnesium, and a consequent increase in pH. These changes are also accompanied by a deterioration of the clotting parameters such as rennet-ing time, rate of curd formation and curd consistency, and a reduced cheese yield due to an in-creased loss of fat in the whey. More research is required to establish if high somatic cell counts are of relevance to the manufacture of sheep milk cheese.
Bacterial Count (Standard Plate Count) The regulated bacterial count in milk is due to the presence of microorganisms some of
which can be advantageous for transformation into cheeses (Lactobacillus spp., Lactococcus spp., Streptococcus spp.), while others can cause human diseases (e.g. Listeria, Salmonella, Bru-cella), problems in the maturation of the dairy products (e.g. Enterobacteriaceae, coliforms, psy-chrotrophs, Clostridium spp.). Psychotropic bacteria such as pseudomonas and paenibacillus thrive at temperatures below 7oC and produce lipolytic and proteolytic enzymes which destabi-lize the casein micelles and alter the clotting properties of milk. Enterobacteriaceae and coli-forms are generally of fecal origin and ferment the lactose in the cheeses producing large quanti-ties of gas, causing early spoilage of the cheese.
Environment & Housing When confined to a building, a bred ewe requires 12 to 16 square feet of living space. Lamb-
ing pens should be 16 to 25 square feet in size. In group housing, a ewe with her lambs needs 16 to 20 square feet. Feeder lambs need 8 to 10 square feet. Less space is required if sheep are raised on slatted floors or if they have access to an exercise area or pasture. Shearing before housing will allow stocking rates in the barn to be increased by up to 20%. (http://www.sheep101.info/201/housing.html)
Table 1. Recommended housing space (square feet) for sheep and lambs.
Sheep Dirt lot Open shed Confinement (dirt floor)
Confinement (slatted floors)
Bred ewe 20 8 12 to 16 8 to 10 Ewe with lambs 25 12 16 to 20 10 to 12 Ram 20 8 20 to 30 14 to 20 Feeder lamb 15-20 6 8 to 10 4 to 6 Source: Midwest Plan Service, Sheep Housing and Equipment Handbook, 1982
Adequate ventilation is necessary to provide a healthy atmosphere in the barns. Acceptable bedding materials should provide a clean, dry and comfortable area for resting.
Milking system performance. Milking system performance should be checked according to manufacturer’s specifications.
Performance should be evaluate at least annually using methods established by the National Mastitis Council.
37
Nutrition Metabolic disease can be a common problem in early lactation in most dairy ruminant spe-
cies. Common problems such as ketosis/pregnancy toxemia can endanger the life of the ewe and greatly limit milk production. Ensuring that ewes have a balanced diet which includes minerals and vitamin supplementation that meets her nutritional needs is extremely important. They rec-ommended that the energy and protein content of the ration must be adequate to support mainte-nance as well as milk production. Assuming 7% fat content in milk, the production of each liter of milk requires 1.7 Mcal, or 7.1 MJ, of metabolizable energy. Excessively high doses of concen-trates can reduce the intake of fiber and therefore reduce chewing times and rumen pH. This can depress milk production and reduce the concentration of fat in milk probably because they cause rumen acidosis.
Culling Culling may be the only means of managing some ewes that are compromising milk quality.
Animals with clinical mastitis unresponsive to therapy or with contagious pathogens such a Staphylococcus aureus are obvious cull candidates. Ewes with udder conformation issues that make milking difficult or are a mastitis risk should also be considered for culling.
Record keeping and monitoring milk quality parameters All flock managers should develop production and quality goals for their dairies. At the very
least measures of milk quality (BMSCC, Standard Plate Count) should be recorded on a regular basis to allow for early recognition and intervention if and when problems occur.
Treatment protocols Concise records of treatments and identification and segregation of treated animals should be
kept. The Food and Drug Administration (FDA) has specific record keeping requirements for food producing animals.
References Bencini A, et al. The quality of sheep milk: a review. Australian Journal of Experimental Agri-
culture, 1997, 37, 485–504. Furhmann T. Quality milk starts with quality management. National Mastitis Council Annual
Meeting Proceedings, 2002. http://www.sheep101.info/201/dairysheep.html Klinger I. Public health and the safety of milk and milk products from sheep and goats. Rev Sci
Tech. 1997 Aug;16 (2):482-8.
38
A GENETIC EVALUATION PROGRAM FOR DAIRY SHEEP IN CANADA: PRELIMI-NARY RESULTS FROM A PROJECT IN QUEBEC
Johanne Cameron1, Larry Schaeffer2
1Centre d’expertise en production ovine du Québec, La Pocatière, Québec, Canada 2University of Guelph, Ontario, Canada
Introduction
Recently, in Quebec, the dairy sheep industry has grown. Demand for fine cheeses has in-creased and consumers are requesting these new, local products. For producers, as for proces-sors, production of large quantities of high quality milk has become a necessity. It is essential to identify animals with the potential for high milk production in order to achieve these objectives and to contribute to the profitability of dairy sheep farms. How is it possible to improve the milk production potential for sheep? In the past, the introduction of dairy breeds into the sheep popu-lation (mainly East Friesian) contributed to an improvement in the average milk production. Now, on many dairy farms, herds are mainly composed of dairy sheep purebred females (East Friesian, Lacaune, and a few British Milk sheep), hybrids of dairy breeds (crosses between two purebred sheep) and/or females with a high percentage of purebred dairy blood. In the absence of a specialized genetic evaluation program for dairy sheep, it was possible for producers to im-prove the milk production potential of their animals by selecting those that produced more milk. Milk production is a highly heritability trait, which means that the trait is more easily transmitted to the next generation when compared to other characteristics (such as prolificacy, for example). Selection based on the amount of milk produced by an animal can allow for overall improvement in this trait for the population. However, this type of selection has its limits, especially if we also wish to improve the milk quality (fat and protein level). Although quite heritable, selection on the amount of milk produced may be at the expense of milk composition. In fact, French studies show a negative genetic correlation between milk yield and protein level (-.047 ± 0.05), and be-tween milk yield and fat content (-0.34 ± 0.07). These results indicate that selection based only on milk yield can be detrimental to the quality of the product. Since sheep milk is generally pro-duced primarily for processing, maintaining its quality is essential (fat, protein, somatic cells). Given this situation, it seemed essential to develop a genetic program for dairy sheep within Quebec, and the entire country.
Summary of the project, goals and methodology
A project was developed in the fall of 2012 by the Quebec sheep industry (Federation of Pro-ducers of lambs and sheep of Quebec - FPAMQ) in collaboration with the Centre d’expertise en production ovine du Québec (CEPOQ – a center for research and development of the sheep in-dustry), Valacta (a Center specialized in dairy cattle milk production) and the Center for Genetic Improvement of Livestock (CGIL) from the University of Guelph. The main objective of the project was to set up a Genetic evaluation program adapted for the dairy sheep industry through integration of precise measurements of milk sheep components. This project also included spe-cific objectives:
• Develop a milk analysis system for precisely evaluating the components of sheep milk; • Define the lactation curve of our local dairy sheep; • Develop a North American Genetic Evaluation Program for Dairy sheep (online data base); • Disseminate the genetic selection principles to sheep farmers in Quebec.
39
The project began during the spring of 2013 and data collection (for the purposes of the pro-ject) continued until fall of 2014. Although the project ended in December 2014, producers have continued to take production data on their flock. However, the results presented in this document only cover the period of 2013 and 2014. CEPOQ was responsible for project coordination and data collection, Valacta was responsible for milk samples and analyses and CGIL (Larry Schaeffer) was responsible for the development of the genetic evaluation program. CEPOQ also carried out statistical analysis using data included in the database.
To obtain the data necessary for the project, producers were to submit their flock inventory (complete permanent identification of each animal, date of birth, breed, and complete pedigree, if available) and lambing data to the genetic evaluation program, GenOvis. GenOvis is the Cana-dian genetic evaluation program available for meat sheep in Canada, which is managed by CEPOQ in Quebec. This program is also the result of a partnership between three organizations from the industry (CEPOQ, Ontario Sheep Marketing Agency, Canadian Sheep Breeders). The dairy sheep information was incorporated into GenOvis. In order to collect dairy data (milk yield, milk component), Valacta’s staff was responsible for milk recording at the farm. Each month, a person from Valacta conducted test day records: the milk yield was recorded for PM and AM milking (or 24hs, in certain cases) and a milk sample was collected for each ewe. The milk samples were then sent to Valacta’s laboratory (Sainte-Anne-de-Bellevue, Quebec, Can-ada). At the laboratory, the milk was tested for fat and protein content, somatic cell count, urea, lactose and beta-hydroxybutyrate (BHB).
In order to adapt the infrared analysis curves to sheep milk, Valacta validated calibration curves. It is important to mention that in the past, Valacta was using infrared analysis curves adapted for dairy cattle milk to estimate the milk component of other species (sheep, goat). This was probably not adequate since there are differences in the composition and structure of the main molecules of milk from one species to another and these differences can significantly influ-ence the measurements. To this end, several series of milk samples were collected from the sheep milk producers to use as standards to calibrate the infrared analyzer. These analyses were designed to test the suitability of using standards prepared with sheep's milk instead of cows’ milk. To develop the standards, tank samples were collected four times from each farm. The ex-act composition of these standards were determined by official chemical methods and compared with the values obtained by infrared analyzer.
The following data were considered in the genetic evaluation model for all evaluated animals:
• ATQ permanent identification for all animals (RFID tags) for GenOvis and Valacta database; • Flock identification and province; • Sheep breed or cross; • Animal birth date; • Age at first lambing, if available; • Number of parities (first, second or later); • Lambing data (lambing date, beginning of lactation); • Number born (missing data for many ewes); • Date of Test day record (for milk yield and milk quality); • Number of days in milk on the test day record; • Interval between start of PM test day record and start of AM test day record; • Milk quality and quantity.
40
The main traits analyzed were AM milk yield, PM milk yield, 24h milk yield, fat and protein percentage (%), somatic cell count (SCC), urea (mg N/dl) and beta-hydroxybutyrate level (BHB, mmol/l). The lactation period considered for the genetic evaluation program covered the lacta-tion period from days 5 to 220. Apart from this interval, this data was not considered in the lacta-tion curve for the genetic evaluation. Note that a minimum of 4 complete test day records were needed to make an adequate lactation curve and perform genetic analysis on an animal (milk yield and/or milk component).
During 2013, 8 herds participated in the project and a ninth was added in 2014. On top of this data, it was possible to add all the production data already stored in Valacta’s database, for a to-tal of 2,878 sheep being sampled. There was a total of 3,023 animals with pedigree information included, of which 145 were rams and 1,277 were ewes.
During the project, many problems arose that impacted the analysis. In some cases, the per-manent identification of the animal sampled was not complete (RFID tag - only 4, 5, 6 or 7 num-bers were taken instead of 9), which created duplicates or unrecognized animals in the genetic evaluation database. In other cases, the lambing data was incomplete (lambing date or number of lambs born were missing). The sheep without lambing dates were rejected from analysis because it was impossible to trace the lactation curve. Clearly, this project has highlighted the importance good quality farm input data. Genetic evaluation model. Model planned and current operational model.
When the project started, a genetic model was created and was planned for the Dairy sheep industry. The original model accounted for the following factors:
• Flock-year-season effects where years and seasons of lambing were separated for each flock. The seasons were going to be each month of lambing, but then this was reduced to two month seasons.
• Breed-Parity-Age-Season effects which assumed that there were different age groups within parities 1 and 2, and two-month seasons of lambing, and that these differed by breed defini-tions.
• Breed-Parity-Year-Season effects assumed year-season of lambing effects were different for each breed-parity group.
• Breed-Parity-Number Born effects assumed that the effect of number of lambs born differed for each breed-parity group.
• Breed-Parity-Milking Interval effects for AM and PM yield traits only were to account for the time elapsed between milkings, and that this effect was different for each breed-parity group.
• Animal Permanent Environmental effects, for each animal having test day records, and these would differ depending on parity.
• Animal Additive Genetic effects, for each animal in the pedigree. • Residual effects, where the variance of residual effects could change during the lactation. Five
intervals were created based on phenotypic standard deviations of test-day records of all traits. The intervals were:
1) Days 5 to 48; 2) Days 49 to 76; 3) Days 77 to 111;
4) Days 112 to 146; 5) Days 147 to 220.
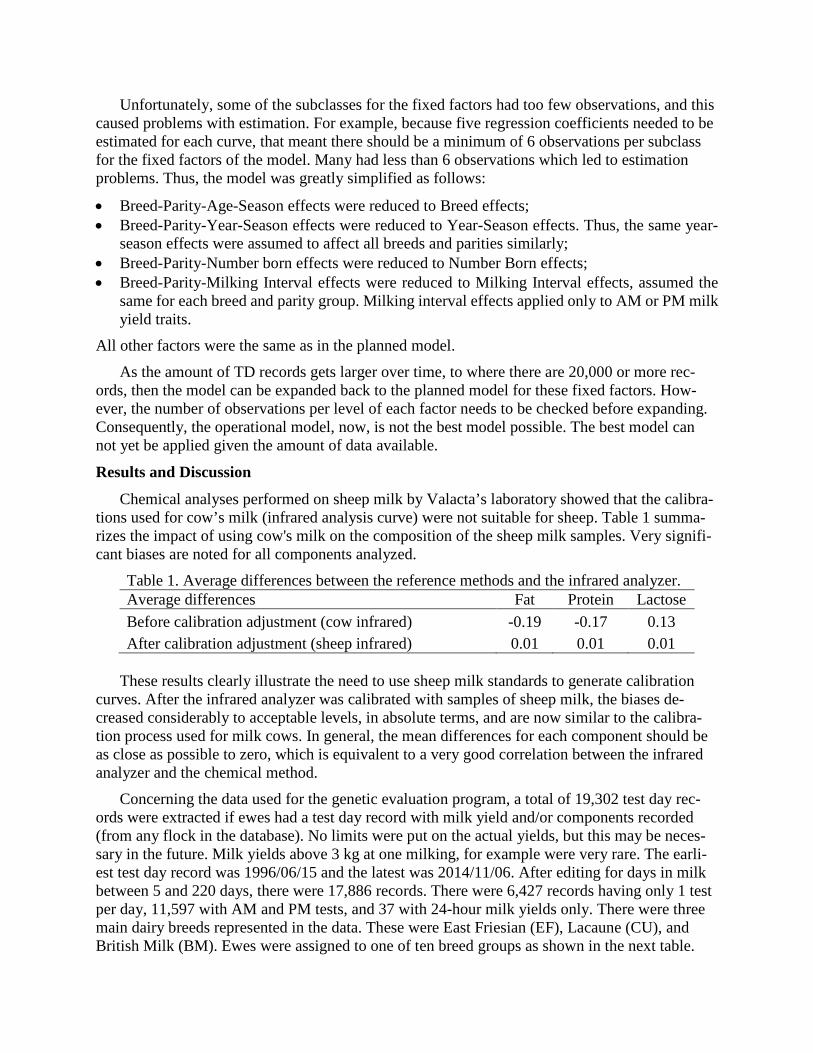
Unfortunately, some of the subclasses for the fixed factors had too few observations, and this caused problems with estimation. For example, because five regression coefficients needed to be estimated for each curve, that meant there should be a minimum of 6 observations per subclass for the fixed factors of the model. Many had less than 6 observations which led to estimation problems. Thus, the model was greatly simplified as follows:
• Breed-Parity-Age-Season effects were reduced to Breed effects; • Breed-Parity-Year-Season effects were reduced to Year-Season effects. Thus, the same year-
season effects were assumed to affect all breeds and parities similarly; • Breed-Parity-Number born effects were reduced to Number Born effects; • Breed-Parity-Milking Interval effects were reduced to Milking Interval effects, assumed the
same for each breed and parity group. Milking interval effects applied only to AM or PM milk yield traits.
All other factors were the same as in the planned model. As the amount of TD records gets larger over time, to where there are 20,000 or more rec-
ords, then the model can be expanded back to the planned model for these fixed factors. How-ever, the number of observations per level of each factor needs to be checked before expanding. Consequently, the operational model, now, is not the best model possible. The best model can not yet be applied given the amount of data available.
Results and Discussion
Chemical analyses performed on sheep milk by Valacta’s laboratory showed that the calibra-tions used for cow’s milk (infrared analysis curve) were not suitable for sheep. Table 1 summa-rizes the impact of using cow's milk on the composition of the sheep milk samples. Very signifi-cant biases are noted for all components analyzed.
Table 1. Average differences between the reference methods and the infrared analyzer. Average differences Fat Protein Lactose Before calibration adjustment (cow infrared) -0.19 -0.17 0.13 After calibration adjustment (sheep infrared) 0.01 0.01 0.01
These results clearly illustrate the need to use sheep milk standards to generate calibration
curves. After the infrared analyzer was calibrated with samples of sheep milk, the biases de-creased considerably to acceptable levels, in absolute terms, and are now similar to the calibra-tion process used for milk cows. In general, the mean differences for each component should be as close as possible to zero, which is equivalent to a very good correlation between the infrared analyzer and the chemical method.
Concerning the data used for the genetic evaluation program, a total of 19,302 test day rec-ords were extracted if ewes had a test day record with milk yield and/or components recorded (from any flock in the database). No limits were put on the actual yields, but this may be neces-sary in the future. Milk yields above 3 kg at one milking, for example were very rare. The earli-est test day record was 1996/06/15 and the latest was 2014/11/06. After editing for days in milk between 5 and 220 days, there were 17,886 records. There were 6,427 records having only 1 test per day, 11,597 with AM and PM tests, and 37 with 24-hour milk yields only. There were three main dairy breeds represented in the data. These were East Friesian (EF), Lacaune (CU), and British Milk (BM). Ewes were assigned to one of ten breed groups as shown in the next table.

42
Table 2. Breed groups used in the genetic model and group composition records. Group # Breed composition Records
1 75% EF or better (EF = East-Friesian) 10,669 2 75% CU or better (CU = Lacaune) 946 3 75% BM or better (BM = British Milk Sheep) 23 4 50% EF - 50% CU 681 5 50% EF - 50% BM 30 6 50% CU - 50% BM 0 7 50-74% EF 2286 8 50-74% CU 934 9 50-74% BM 71 10 All other 1221
Below are tables of raw means for the different breed groups. Tables 3 and 4 present the re-sults for the main production traits evaluated during the study (milk yield, fat and protein con-tent).
Table 3. Average milk production (kg/day) for each breed group. Group # Breed composition AM milk PM milk 24-h milk
1 75% EF or better 0.92 0.73 1.54 2 75% CU or better 1.10 0.66 1.20 3 75% BM or better 0.88 0.71 - 4 50% EF - 50% CU 0.97 0.71 0.85 5 50% EF - 50% BM 0.75 0.56 - 6 50% CU - 50% BM - - - 7 50-74% EF 0.82 0.56 1.03 8 50-74% CU 0.96 0.62 1.07 9 50-74% BM 0.56 0.45 0.76 10 All other 0.81 0.55 0.66
While it is tempting to compare breeds to determine which are the most productive, the varia-ble amount of data in the different purebreds or crossbreds proved to be a problem. In some cases, the amount of data came from only a few herds and in many cases, the performance could be explained by management decisions instead of the real potential of the breed. Statistical anal-yses were performed to determine the presence of significant effects (i.e. flock management) im-pacting the productivity of animals. However, to perform these analyses, breeds with small popu-lations were removed from the analysis (BM and BM crosses). The following table shows the overall average productivity of sheep sampled and the significant effects observed. In this table, 76.9% of the data is represented by the East-Friesian and crosses.
Statistical analysis has shown that the parity (number of lambings, lactation number) had a significant effect on milk production and fat level. As we expected, ewes in their second lacta-tion (and later), produced more milk, and also more fat, than ewes in their first lactation. How-ever, statistical analyses did not demonstrate any effect of parity on milk protein content. Statisti-cal analyses also showed a significant effect for a Breed*Flock interaction for all traits studied. In fact, in statistics, with an interaction between two variables (Breed*Flock), it is not possible to evaluate if the performance is the result of the breed alone, or the flock management alone. In

43
this case, this Breed*Flock interaction means that a breed may perform better than another, be-cause of the flock management. This confirms that, with our current data, it is impossible to compare the breeds against each other. For lactose, the results showed similar levels between parities, flocks and breeds (no effect). As expected, lactose were also lower than observed for dairy cattle. Table 6 presents the results for somatic cell score (log of somatic cell count), urea and beta-hydroxybutyrate level.
Table 4. Fat, protein and lactose level (%) for each breed group. Group # Breed composition Fat % Protein % Lactose %
1 75% EF or better 5.70 4.86 4.74 2 75% CU or better 5.51 5.04 4.73 3 75% BM or better 5.95 5.27 4.69 4 50% EF - 50% CU 5.88 5.20 4.68 5 50% EF - 50% BM 5.81 5.43 4.75 6 50% CU - 50% BM - - - 7 50-74% EF 5.74 4.97 4.71 8 50-74% CU 5.58 5.01 4.73 9 50-74% BM 4.76 4.89 4.62 10 All other 5.80 4.90 4.71
Table 5. Average milk yield, fat and protein content for all breeds (except BM) and effects of breeds, parity and flock. Item Average Min-Max Effects Milk (kg/day) 1.39 ± 0.79 0.10 to 5.80 P B*F Fat (%) 5.72 ± 1.31 1.63 to 13.33 P B*F Protein (%) 4.92 ± 0.71 1.65 to 12.41 B*F * Significant effects (p < 0.05) B = Breed P = Parity F = Flock.
According to Somatic cell count (SCC) and Somatic cell score (SCS), the data presented in
table 6 is the result of a logarithmic adjustment that allows analysis through the genetic evalua-tion program. The results (from lab analysis) show that somatic cell count (SCC) averaged 736,000 for all breeds evaluated during the study (results from 1000 to 9 999 000 SSC). This re-sult is too high and needs to be reduced. Our statistical analysis shows a significant breed*flock interaction. Some flocks had high levels of SCC (over 1 000 000), which probably affected the data.
For urea, our statistical analysis showed a significant effect of parity on the level of milk urea. Second, and subsequent, parity ewes showed higher levels of urea than first parity ewes. We also observed a significant flock effect for this element with some flocks showing higher lev-els of urea (39.9 mg N/dl). Again, our analysis showed a significant effect for breed*flock inter-action. Three flocks showed high levels of urea, which is probably a reflection of feed manage-ment.
For BHB, analyses were done using the “Cetolab” analysis from Valacta. Cetolab was devel-oped for dairy cattle and many samples where needed to adjust the analyses to correctly deter-mine BHB level for this species. For dairy cattle, Cetolab is useful to identify cattle affected by ketosis. With this analysis, we know that cattle showing BHB levels over 0.20 mmol/l are af-
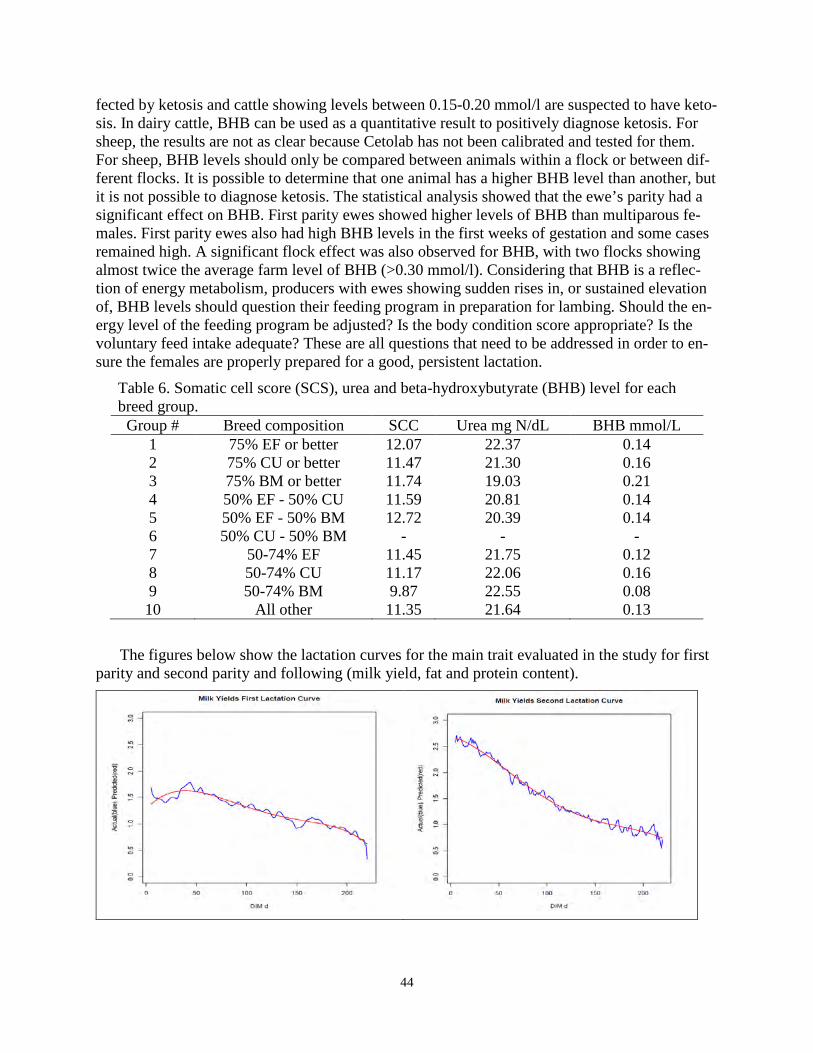
44
fected by ketosis and cattle showing levels between 0.15-0.20 mmol/l are suspected to have keto-sis. In dairy cattle, BHB can be used as a quantitative result to positively diagnose ketosis. For sheep, the results are not as clear because Cetolab has not been calibrated and tested for them. For sheep, BHB levels should only be compared between animals within a flock or between dif-ferent flocks. It is possible to determine that one animal has a higher BHB level than another, but it is not possible to diagnose ketosis. The statistical analysis showed that the ewe’s parity had a significant effect on BHB. First parity ewes showed higher levels of BHB than multiparous fe-males. First parity ewes also had high BHB levels in the first weeks of gestation and some cases remained high. A significant flock effect was also observed for BHB, with two flocks showing almost twice the average farm level of BHB (>0.30 mmol/l). Considering that BHB is a reflec-tion of energy metabolism, producers with ewes showing sudden rises in, or sustained elevation of, BHB levels should question their feeding program in preparation for lambing. Should the en-ergy level of the feeding program be adjusted? Is the body condition score appropriate? Is the voluntary feed intake adequate? These are all questions that need to be addressed in order to en-sure the females are properly prepared for a good, persistent lactation.
Table 6. Somatic cell score (SCS), urea and beta-hydroxybutyrate (BHB) level for each breed group.
Group # Breed composition SCC Urea mg N/dL BHB mmol/L 1 75% EF or better 12.07 22.37 0.14 2 75% CU or better 11.47 21.30 0.16 3 75% BM or better 11.74 19.03 0.21 4 50% EF - 50% CU 11.59 20.81 0.14 5 50% EF - 50% BM 12.72 20.39 0.14 6 50% CU - 50% BM - - - 7 50-74% EF 11.45 21.75 0.12 8 50-74% CU 11.17 22.06 0.16 9 50-74% BM 9.87 22.55 0.08 10 All other 11.35 21.64 0.13
The figures below show the lactation curves for the main trait evaluated in the study for first
parity and second parity and following (milk yield, fat and protein content).
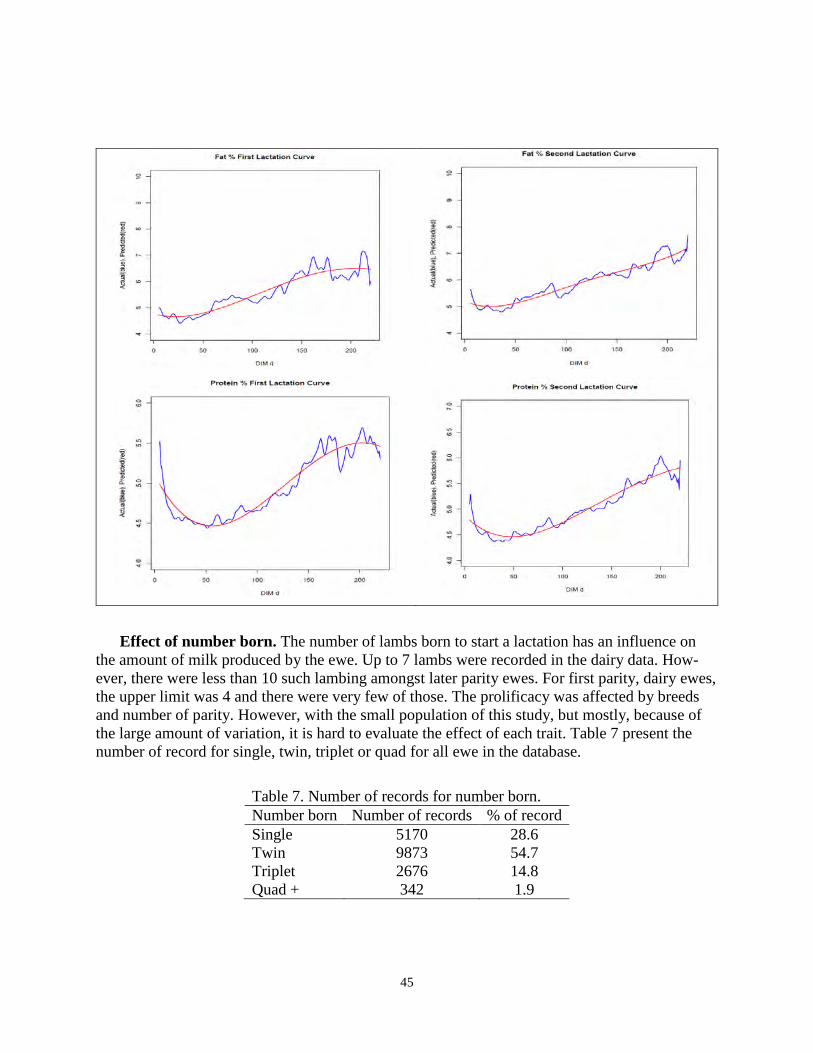
45
Effect of number born. The number of lambs born to start a lactation has an influence on the amount of milk produced by the ewe. Up to 7 lambs were recorded in the dairy data. How-ever, there were less than 10 such lambing amongst later parity ewes. For first parity, dairy ewes, the upper limit was 4 and there were very few of those. The prolificacy was affected by breeds and number of parity. However, with the small population of this study, but mostly, because of the large amount of variation, it is hard to evaluate the effect of each trait. Table 7 present the number of record for single, twin, triplet or quad for all ewe in the database.
Table 7. Number of records for number born. Number born Number of records % of record Single 5170 28.6 Twin 9873 54.7 Triplet 2676 14.8 Quad + 342 1.9
46
The average number of lambs born (for all breeds) was 1.90 lambs born/lambing. The result of the effect of the number born on the milk production at first parity, second parity and later, are presented in tables 8 and 9.
Table 8. First Parity - effect of number of lambs born. Trait (2)-(1) (3)-(1) 4)-(1) AM milk (220d) 2.92 3.01 - PM milk (220d) 1.14 1.95 - 24h milk (220d) -0.03 1.16 - Fat (%) 0.00 0.10 - Protein (%) 0.10 0.20 - SCS 0.06 0.11 -
Table 9. Second Parity and later - effect of number of lambs born. Trait (2)-(1) (3)-(1) 4)-(1) AM milk (220d) 3.87 3.92 - PM milk (220d) 1.55 3.98 - 24h milk (220d) 6.27 7.82 - Fat (%) -0.03 -0.04 - Protein (%) 0.10 0.20 - SCS 0.06 0.11 -
There seems to be more milk produced by ewes with two lambs over ewes with one lamb,
and a slight increase of ewes with three lambs over ewes with two. There were not enough obser-vations to know if this trend continued with 4 lambs born. In any case, these are small increases.
Accuracies and Percentiles of EBVs. The most important part of this project was the devel-opment of the Dairy Sheep Genetic Evaluation Program to obtain EBVs for the traits analyzed in the population. Accuracies and percentile rankings were calculated for each trait using the same selection index approximation as used in the evaluations for growth and reproduction (for meat sheep). So the factors included into the accuracies are:
• The number of test day records for an animal; • The number of female progenies that also have test day records. • The sire and his number of daughters; • The dam and her number of test day records; • The dam and her number of daughters.
Genetic correlations between traits are not taken into account in the accuracy calculations. Thus the accuracies are conservative estimates, and deliberately kept lower than they might be.
As said previously, there were a total of 3,023 animals in the pedigree information, of which 145 were rams and 1277 were dams of ewes. Only 12 animals were inbred. Tables 10 and 11 present the range of the EBVs calculated on the population. The EBVs are expressed in the unit of each trait for complete 220 days lactation. In these Tables, the EBVs are presented for the whole population, so they are not described for each breed. Milk, fat, protein, and lactose yields are yields over the entire lactation from day 5 to 220 days. The percentages are the average daily percentage, as for SCS, urea, and BHB.

47
Table 10. EBVs Range for the traits measured on the population for ewe in first parity – results for the genetic evaluation run done in April 2015.
Trait Minimum Maximum Average EBV SD Milk yield, kg -171 213 -10.8 46.0 Fat yield, kg - 9.8 13.5 - 0.7 2.7 Protein yield, kg - 8.4 11.2 - 0.4 2.3 Lactose yield, kg - 7.9 10.3 - 0.6 2.2 Fat % - 0.85 1.14 - 0.01 0.29 Protein % - 0.64 1.04 0.06 0.21 Lactose % - 0.73 0.41 - 0.03 0.12 SCS - 1.91 2.64 - 0.01 0.46 Urea - 4.65 7.20 - 0.20 1.28 BHB - 0.09 0.11 0.00 0.02
Table 11. EBV range for the traits measured on the population for ewe in second parity and later – results for the genetic evaluation run done in April 2015.
Trait Minimum Maximum Average EBV SD Milk yield, kg -267 333 -17.9 64.4 Fat yield, kg -15.8 17.3 -1.3 3.9 Protein yield, kg -13.2 15.0 -0.8 3.2 Lactose yield, kg -12.4 15.8 -0.9 3.0 Fat % -1.13 1.41 -0.02 0.36 Protein % -0.75 1.28 0.08 0.24 Lactose % -0.68 0.32 -0.02 0.10 SCS -2.05 2.90 -0.03 0.66 Urea -6.34 9.97 -0.24 1.49 BHB -0.08 0.12 -0.01 0.02
As an example in interpreting these previous data, the best ewe (first parity) from the dairy sheep population could produce, on average, 213 kg more milk than the average first parity ewe of the same breed. In order to help producers, percentiles are available and allow to identify quickly the best animals in the population for each trait.
Estimates of Variances. Tables 12 and 13 present the proportions of total variation that can be explained by genetics (heritability), permanent environment of the animal (flock, manage-ment, etc.), the rest being explained by the flock-year season effect (as explained in the genetic model below).
In the tables, the estimates of the proportion of genetic variances (heritability) out of the total variance remain high for the dairy traits. In the literature, Barillet (1994) studied 130,409 ewes from 2,670 rams, and reported heritabilities of 0.30, 0.28, and 0.29 for milk, fat and protein yields for the Lacaune breed of France. In a paper published in 2007, Barillet et al., report mod-erate heritability for milk, fat and protein yield (~0.30) and higher heritabilities for fat and pro-tein contents (∼0.50–0.60). Oravcova (2007) gave values of 0.15, 0.10, and 0.25 for milk, fat, and protein for 2,196 test day records (much less data than our population) of Lacaune ewes from Slovakia. Bauer et al. (2012) studied Lacaune and East Friesian ewes in the Czech Republic with a data set of similar size to the Quebec population. They found a heritability for milk yield
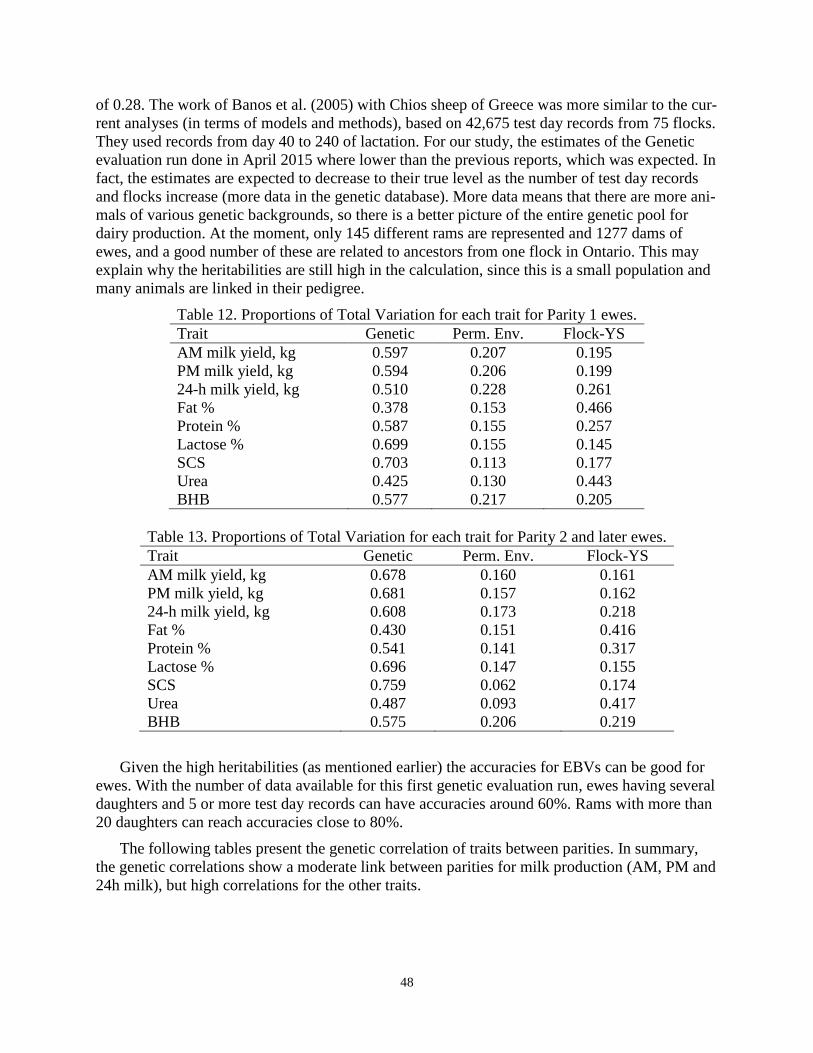
48
of 0.28. The work of Banos et al. (2005) with Chios sheep of Greece was more similar to the cur-rent analyses (in terms of models and methods), based on 42,675 test day records from 75 flocks. They used records from day 40 to 240 of lactation. For our study, the estimates of the Genetic evaluation run done in April 2015 where lower than the previous reports, which was expected. In fact, the estimates are expected to decrease to their true level as the number of test day records and flocks increase (more data in the genetic database). More data means that there are more ani-mals of various genetic backgrounds, so there is a better picture of the entire genetic pool for dairy production. At the moment, only 145 different rams are represented and 1277 dams of ewes, and a good number of these are related to ancestors from one flock in Ontario. This may explain why the heritabilities are still high in the calculation, since this is a small population and many animals are linked in their pedigree.
Table 12. Proportions of Total Variation for each trait for Parity 1 ewes. Trait Genetic Perm. Env. Flock-YS AM milk yield, kg 0.597 0.207 0.195 PM milk yield, kg 0.594 0.206 0.199 24-h milk yield, kg 0.510 0.228 0.261 Fat % 0.378 0.153 0.466 Protein % 0.587 0.155 0.257 Lactose % 0.699 0.155 0.145 SCS 0.703 0.113 0.177 Urea 0.425 0.130 0.443 BHB 0.577 0.217 0.205
Table 13. Proportions of Total Variation for each trait for Parity 2 and later ewes. Trait Genetic Perm. Env. Flock-YS AM milk yield, kg 0.678 0.160 0.161 PM milk yield, kg 0.681 0.157 0.162 24-h milk yield, kg 0.608 0.173 0.218 Fat % 0.430 0.151 0.416 Protein % 0.541 0.141 0.317 Lactose % 0.696 0.147 0.155 SCS 0.759 0.062 0.174 Urea 0.487 0.093 0.417 BHB 0.575 0.206 0.219
Given the high heritabilities (as mentioned earlier) the accuracies for EBVs can be good for
ewes. With the number of data available for this first genetic evaluation run, ewes having several daughters and 5 or more test day records can have accuracies around 60%. Rams with more than 20 daughters can reach accuracies close to 80%.
The following tables present the genetic correlation of traits between parities. In summary, the genetic correlations show a moderate link between parities for milk production (AM, PM and 24h milk), but high correlations for the other traits.
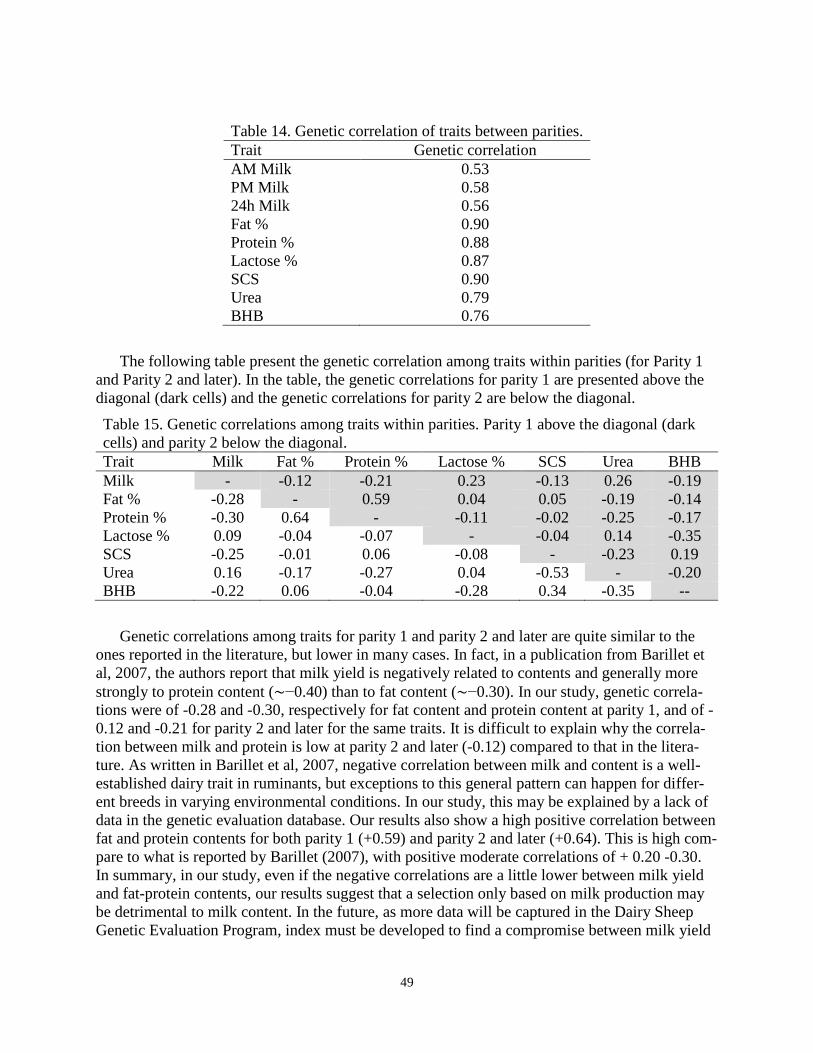
49
Table 14. Genetic correlation of traits between parities. Trait Genetic correlation AM Milk 0.53 PM Milk 0.58 24h Milk 0.56 Fat % 0.90 Protein % 0.88 Lactose % 0.87 SCS 0.90 Urea 0.79 BHB 0.76
The following table present the genetic correlation among traits within parities (for Parity 1
and Parity 2 and later). In the table, the genetic correlations for parity 1 are presented above the diagonal (dark cells) and the genetic correlations for parity 2 are below the diagonal. Table 15. Genetic correlations among traits within parities. Parity 1 above the diagonal (dark cells) and parity 2 below the diagonal. Trait Milk Fat % Protein % Lactose % SCS Urea BHB Milk - -0.12 -0.21 0.23 -0.13 0.26 -0.19 Fat % -0.28 - 0.59 0.04 0.05 -0.19 -0.14 Protein % -0.30 0.64 - -0.11 -0.02 -0.25 -0.17 Lactose % 0.09 -0.04 -0.07 - -0.04 0.14 -0.35 SCS -0.25 -0.01 0.06 -0.08 - -0.23 0.19 Urea 0.16 -0.17 -0.27 0.04 -0.53 - -0.20 BHB -0.22 0.06 -0.04 -0.28 0.34 -0.35 --
Genetic correlations among traits for parity 1 and parity 2 and later are quite similar to the
ones reported in the literature, but lower in many cases. In fact, in a publication from Barillet et al, 2007, the authors report that milk yield is negatively related to contents and generally more strongly to protein content (∼−0.40) than to fat content (∼−0.30). In our study, genetic correla-tions were of -0.28 and -0.30, respectively for fat content and protein content at parity 1, and of -0.12 and -0.21 for parity 2 and later for the same traits. It is difficult to explain why the correla-tion between milk and protein is low at parity 2 and later (-0.12) compared to that in the litera-ture. As written in Barillet et al, 2007, negative correlation between milk and content is a well-established dairy trait in ruminants, but exceptions to this general pattern can happen for differ-ent breeds in varying environmental conditions. In our study, this may be explained by a lack of data in the genetic evaluation database. Our results also show a high positive correlation between fat and protein contents for both parity 1 (+0.59) and parity 2 and later (+0.64). This is high com-pare to what is reported by Barillet (2007), with positive moderate correlations of + 0.20 -0.30. In summary, in our study, even if the negative correlations are a little lower between milk yield and fat-protein contents, our results suggest that a selection only based on milk production may be detrimental to milk content. In the future, as more data will be captured in the Dairy Sheep Genetic Evaluation Program, index must be developed to find a compromise between milk yield

50
and milk content. This genetic selection index will need to be implemented in order to improve simultaneously milk yield and content with the ultimate objective to increase cheese yield and cheese output.
Conclusions
This project demonstrated the need for on farm data capture quality. Permanent identification of animals, pedigree depth, complete and well detailed lambing data are essentials. Producers in-terested in genetic evaluation should therefore be prepared to note these items to obtain complete and reliable genetic results. For producers, it is possible to send only milk production data to the genetic evaluation program (AM, PM, 24-h milk). However, this method does not allow generat-ing EBVs for selecting on milk composition (protein, fat contents). Our results show that selec-tion based solely on dairy production could be to the detriment of dairy components. Milk ana-lyzes represent a cost to producers. Henceforth, adjustment of the calibration curves better justi-fies this investment, since the analyzed data are now representative of the real composition of sheep milk. Although these analyzes have a cost, they are essentials to an effective selection for milk quantity and quality. A minimum of 4 test day records allows for a more accurate lactation curve and a more reliable genetic evaluation. These test day do not need to be done 30 days apart, some producers doing the test day record every 40-60 days to reduce the cost.
To date, the Canadian dairy sheep genetic evaluation program has been completed. As soon as more than 20,000 to 25,000 reliable and complete data are available in the genetic database, it will be possible to use the preliminary genetic model that was developed by the geneticist Larry Schaeffer. For now, the genetic program uses a simplified model. Producers are currently send-ing their data to the Center of Expertise in Quebec Sheep Production to be captured in the ge-netic program by the staff. Animal identification issues still exists and several producers fail to provide lambing data, which cause trouble to the genetic evaluation program. This makes it im-possible to trace the lactation curve. Thus a change in the lambing period routines is essential for obtaining genetic data on dairy performance (need to have complete and accurate lambing data).
In the coming months, geneticists are preparing dairy export data files (EBVs, reports) and will test import files containing on farm data (milk yield, milk content). The section for lambing data capture is reliable and complete in the genetic evaluation system GenOvis. There is still work to be done, but Canada will soon be able to offer a genetic evaluation program for North American dairy sheep.
Acknowledgements
Bill Skotniki, Analyst programer, CGIL; Cathy Thériault Landry, CEPOQ; Mélanie Laro-chelle, CEPOQ; Robert Moore, Ph.D. Valacta; Caroline Brunelle, Valacta; The Staff of Valacta; Jacques Kirouac, Logiciel Bergère; Ferme Lait brebis du Nord; Bergerie Nouvelle-France; Ber-gerie La Comtoiserie; Ferme du Chien Blanc; Ferme Mouton Blanc; Ferme Fou du Berger; Ferme Solida ; Bergerie Les Roses; Bergerie laitière Sargy.
51
FERMENTABLE FIBER FOR MILKING SHEEP ON THE STAR SYSTEM Nikola Kochendoerfer
Cornell University Ithaca, New York, USA
Introduction
The US imports 50 to 60% of the world’s annual exports in sheep dairy products, enumerat-ing a demand that has risen by 30% in the past 20 years as measured by imports (Thomas, 2014). Considering the vast forage availability and idle acreage in the Northeastern US, this deficiency in domestic production presents huge opportunities. One of the reasons that sheep dairy produc-tion in the US is still in early stages is its seasonal character. That goes in hand with major limi-tations and difficulties for sheep dairy producers listed in the literature, ranging from uneven la-bor loads, uneven distribution of nutrient requirements of the flock, seasonal income, and diffi-culties to synchronize lambing seasons (Sitzia et al., 2015). Compared to Europe there hasn’t been nearly as much effort put into genetic improvement and, except at the University of Wis-consin Spooner station, little research into new management strategies. In addition, due to strin-gent import restrictions, little new genetic material is available for breeding.
With a focus on nutrition, this paper and the corresponding presentation discuss design, course, and cornerstones of a recently started two-year research project here on the Cornell cam-pus, milking 45 Finnsheep × Dorset meat ewes in short lactations year-round on the STAR accel-erated lambing system.
Acknowledging advantages and disadvantages of seasonal production for family and other small-holder farms, the study aims for a two-fold approach: 1) a management blueprint for add-ing a second value to meat sheep production and 2) nutritional guidelines toward maintaining health, high level production, and optimal body condition in ewes being milked in an intense, ac-celerated system, with the goal to milk a high number of sheep in the first part of lactation. The question raised and hoped to be answered throughout this project is what diet best supports high productivity in ewes (namely high milk yields), the ability to breed out of season, and a high number of offspring.
Methods The STAR accelerated lambing system, developed by Brian Magee and Doug Hogue at Cor-
nell University in the 1980s, is adapted to a total dairy situation in this project, with lambs re-moved from their dams within the first 12 hours and reared artificially. The participating ewes are in three STAR groups and milked in consecutive 73 to103-day lactations, for five successive lactations per year, while being managed in two groups: 1) lambing and lactating (⅓ of the ewes at a time) and 2) gestating (⅓ of the ewes) and breeding (⅓ of the ewes). Each ewe on the sched-ule will lamb 1.67 times a year, with 7.6 months between each lambing. Each ewe will be rebred during days 73 to 103 into lactation. The lactating ewes are kept in a barn and are randomly as-signed to one of three diets containing different levels of pfNDF (potentially fermentable NDF), 30, 35, and 40%, respectively. There are 12 ewes in each STAR group, with 4 ewes fed each diet. The ewes undergo an adaption period to their assigned diet prior to lambing, and are fed their diets twice daily ad libitum with a small amount of hay being offered. Feed refused and amount of feed offered is recorded twice daily. Digestibility may be measured using chromic ox-ide as a marker. Body weights are collected weekly during lactation, as well as before breeding
52
and at scanning for pregnancy at 73 days after the start of breeding. Milk yields are recorded twice daily for each ewe and milk samples are collected weekly and analyzed for protein and fat content, fatty acid composition, and somatic cell count.
This project will allow us to collect a rigorous data set that will follow the participating ewes through up to three lactations in different seasons. We expect to be able to derive complete lacta-tion curves from each participating ewe under each dietary regimen that will help to refine rec-ommended levels of fermentable fiber in diets of lactating ewes.
Background Most studies with data for lactation curves of traditional meat sheep were done by either
weigh-suckle-weigh methods of ewes nursing lambs or in mixed milking and nursing systems (Table 4). These data don’t qualify as predictors for milk yields for meat sheep milked from day one in a dairy environment. The data from this project will help to close that gap in the literature. Furthermore, we will try to keep the experience of the participating ewes as close to an actual farm environment as possible to allow for a more accurate assessment of the feasibility of adapt-ing the STAR system with meat sheep to sheep dairying.
In a review of dairy sheep research at Spooner, Wisconsin, data of East Frisian, East Frisian cross bred, and Dorset ewes, predict their lactation lengths to 188.6, 126.2 , and 97.2 days re-spectively (Thomas, 2014). Utilizing meat sheep for dairying, lactation is significantly shortened to between 73 and 103 days. This may provide a significant opportunity. According to the litera-ture for dairy sheep, 25% of total milk production happens in the first 30 days of lactation (Folman et al., 1966). Even though peak lactation dates range from 7 to 30 days for meat sheep (Cardellino, 2002; Peterson, 2005) higher yields in the first part of lactation could be skimmed off and might subsequently generate higher total yield averages which, when accumulated over one year of production, might result in yields approaching those of dairy sheep in one annual lac-tation.
Table 4. Milk potential of non-dairy sheep
Non-dairy sheep breeds Peak milk yields g/d Literature Suffolk and Targhee ewes 3,744 g/d (8.25 lb) (Ramsey et al., 1998) Targhee ewes 2,459 g/d (5.42 lb) (Reynolds, 1991) Hamphire ewes 3,584 g/d (7.90 lb) (Gardner and Hogue, 1966) Crossbred ewes 3,680 g/d (8.11 lb) (Cardellino and Benson, 2002)
Because they will be lambing 1.67 times per year, meat sheep breeds managed under the STAR accelerated lambing schedule will likely produce more lambs per year than dairy sheep. Data from the Spooner, Wisconsin station showed that dairy ewes produced 1.85 lambs per year for East Frisian, and 1.69 per year for Lacaune (Thomas, 2014), while in comparison the Cornell flock with its Finnsheep × Dorset is above 2 per year and could be much higher. The number of offspring not only matters for revenue generated from selling lambs for meat or breeding pur-poses, but it also highly impacts lactation and milk yield (Peterson, 2005). Yields increase up 63% for twin vs single lambs (Snowder and Glimp, 1991), and 20% for triplets vs twins (Loerch et al., 1985). The highest differences were observed in early lactation between ewes with single and twin lambs (Cardellino, 2002). When working toward a dual purpose system, a high number of offspring is crucial to ensure economic sustainability.
53
Although McKusick (2001) observed that lambs reared artificially had a lower BW at 120 days, that might depend upon the management of artificial rearing. Work at Spooner, Wisconsin suggests great success with rearing artificially (Berger, 1993). Data collected in the first lactation period of our project indicate that lambs reared artificially can grow at least as fast as lambs reared by ewes with average daily gains of 300 g (0.66 lb) during the first 3 to 4 weeks of growth.
Late lactation milk often has a higher somatic cell count (Pulina et al., 2006) which might be another advantage of shorter lactations even though this might be offset by an overall higher so-matic cell count for ewes in a total dairy environment with lambs removed shortly after birth (McKusick, 2001). Studies comparing different weaning systems suggest that the milk fat con-tent is higher for ewes in total dairy situations milked from day 1 (McKusick, 2001), possibly an-other benefit of the proposed system.
A further contemplation is the reevaluation of traditional lambing times. Studies show that ewes bred in June and lactating beginning in November have reached higher lactation yields, suggesting that traditional lambing times might have disadvantages (Sitzia et al., 2015).
Taking the aforementioned data into consideration, the management of meat ewes utilized for dual purpose production with ⅓ of the flock lactating at any given time throughout the year, and adding a second value, milk, seems feasible given nutritional management to ensure optimal body condition during breeding to enable aseasonality, and a high number of offspring, as well as reduced negative nutrient balance in early lactation.
Nutritional Aspects Potentially fermentable fiber (pfNDF) is defined and calculated as NDF – 1 × maintenance
INDF, with 1 × maintenance INDF being determined by the concentration of indigestible dry matter at 1 × maintenance (Thonney, 2017), minus 10 to15% metabolic fecal losses (Van Soest, 1994). Due to their high content of pfNDF and pectins (that are fermented like NDF), soy hulls are being used in this study to research ideal dietary levels to support high level production in an accelerated, dual-purpose system. Previous research at Cornell showed that pfNDF and INDF were better predictors of intake in growing lambs than NDF alone (Thonney and Hogue, 2013). Many highly relevant feed stuffs and forages share the nutritional trait of high pfNDF content. Therefore, guidelines derived by feeding soy hulls can be adapted to other feeding strategies and can be useful for dairy sheep farmers throughout North America.
There is evidence in the literature that level of intake influences digestibility (Tyrrell and Moe, 1975; Bodensteiner et al., 2000; Hein et al., 2009). With higher intake, passage rate in-creases and digestibility decreases. This might ensure a high nutrient supply, yet possibly be une-conomical. Passage rate decreases and digestibility increases with lower levels of intake. Accord-ing to research done at Cornell, the source of NDF impacts intake and, subsequently, digestibility (Schotthofer et al., 2007; Thonney and Hogue, 2007). This must be considered when assessing economic sustainability of feeding strategies.
It has been suggested that soy hulls increase the risk of acidosis due to a lack of physically-effective fiber in dairy cows (Mertens, 1997). However, this doesn’t appear to be the case with sheep. Lactating ewes have been fed a 70% soy hull diet ad libitum with no forage at Cornell without any incidences of acidosis. In contrast, including minimum levels of pfNDF in diets fed to sheep that ensure maximum intake allows for healthy rumen function (Schotthofer, 2007;
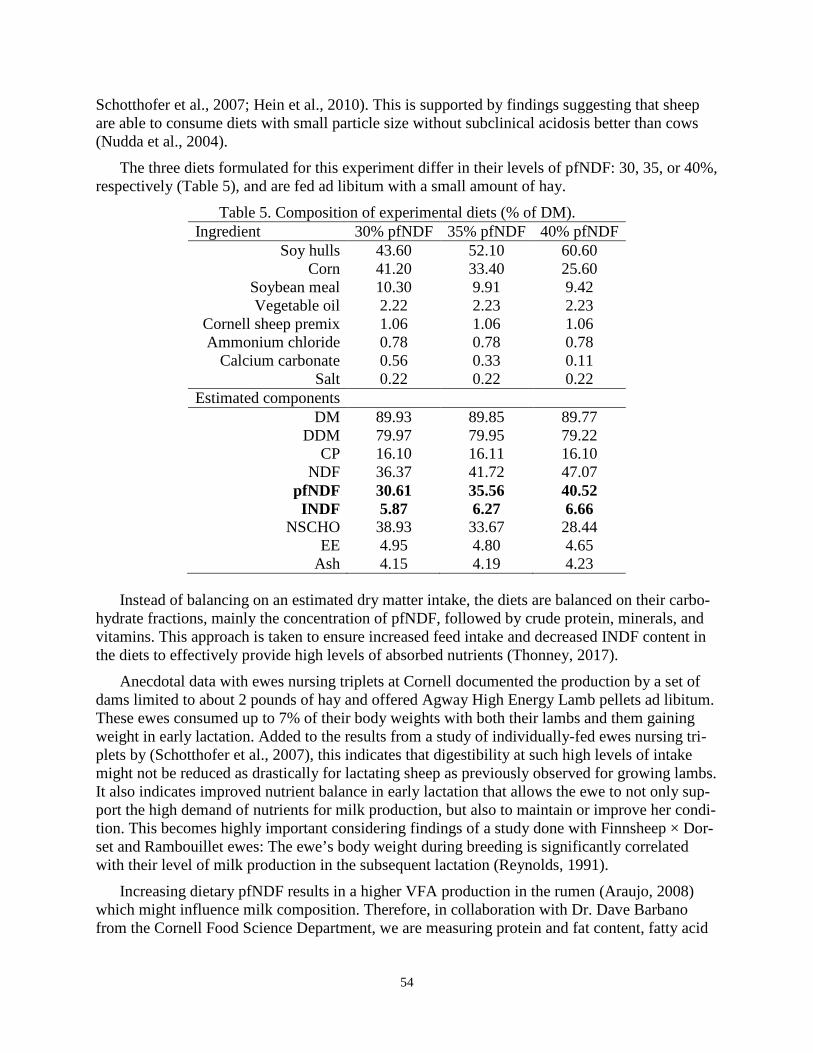
54
Schotthofer et al., 2007; Hein et al., 2010). This is supported by findings suggesting that sheep are able to consume diets with small particle size without subclinical acidosis better than cows (Nudda et al., 2004).
The three diets formulated for this experiment differ in their levels of pfNDF: 30, 35, or 40%, respectively (Table 5), and are fed ad libitum with a small amount of hay.
Table 5. Composition of experimental diets (% of DM). Ingredient 30% pfNDF 35% pfNDF 40% pfNDF
Soy hulls 43.60 52.10 60.60 Corn 41.20 33.40 25.60
Soybean meal 10.30 9.91 9.42 Vegetable oil 2.22 2.23 2.23
Cornell sheep premix 1.06 1.06 1.06 Ammonium chloride 0.78 0.78 0.78
Calcium carbonate 0.56 0.33 0.11 Salt 0.22 0.22 0.22
Estimated components DM 89.93 89.85 89.77
DDM 79.97 79.95 79.22 CP 16.10 16.11 16.10
NDF 36.37 41.72 47.07 pfNDF 30.61 35.56 40.52 INDF 5.87 6.27 6.66
NSCHO 38.93 33.67 28.44 EE 4.95 4.80 4.65
Ash 4.15 4.19 4.23
Instead of balancing on an estimated dry matter intake, the diets are balanced on their carbo-hydrate fractions, mainly the concentration of pfNDF, followed by crude protein, minerals, and vitamins. This approach is taken to ensure increased feed intake and decreased INDF content in the diets to effectively provide high levels of absorbed nutrients (Thonney, 2017).
Anecdotal data with ewes nursing triplets at Cornell documented the production by a set of dams limited to about 2 pounds of hay and offered Agway High Energy Lamb pellets ad libitum. These ewes consumed up to 7% of their body weights with both their lambs and them gaining weight in early lactation. Added to the results from a study of individually-fed ewes nursing tri-plets by (Schotthofer et al., 2007), this indicates that digestibility at such high levels of intake might not be reduced as drastically for lactating sheep as previously observed for growing lambs. It also indicates improved nutrient balance in early lactation that allows the ewe to not only sup-port the high demand of nutrients for milk production, but also to maintain or improve her condi-tion. This becomes highly important considering findings of a study done with Finnsheep × Dor-set and Rambouillet ewes: The ewe’s body weight during breeding is significantly correlated with their level of milk production in the subsequent lactation (Reynolds, 1991).
Increasing dietary pfNDF results in a higher VFA production in the rumen (Araujo, 2008) which might influence milk composition. Therefore, in collaboration with Dr. Dave Barbano from the Cornell Food Science Department, we are measuring protein and fat content, fatty acid
55
composition, and milk urea nitrogen as well as somatic cell counts to further asses the effect of different levels of pfNDF on milk composition.
Guidelines in the literature suggest ideal levels of 37% NDF for feeding dairy ewes (Pulina, 2004). Should these be the same for meat sheep managed and milked under the STAR system? The anticipated result of the digestion trial of this study will provide a benchmark for dietary pfNDF levels to ensure high milk production, maintenance of body condition, aseasonality, high numbers of offspring, and circumvention of nutritional diseases, while upholding appropriate di-gestibility to ensure economic sustainability.
Acknowledgements This project is funded through a Federal Capacity Fund (HATCH grant), and a NESARE
graduate student grant.
References Araujo, R. C. P., A.V.;Susin, I.; Urano, F.S.; Mendes, C.Q.; Rodrigues, G.H.; Packer, I.U. 2008.
Apparent digestibility of diets with combinationsof soybean hulls and coastsross (Cynodon sp.) hay offered to ram lambs. Sci. Agric. 65: 581-588.
Berger, Y. M. S., R.A. 1993. Raising lambs on milk replacer. Proceedings Spooner Sheep Day: 39-47.
Bodensteiner, K. J., K. P. McNatty, C. M. Clay, C. L. Moeller, and H. R. Sawyer. 2000. Expression of growth and differentiation factor-9 in the ovaries of fetal sheep homozygous or heterozygous for the Inverdale prolificacy gene (FecXI). Biology of Reproduction 62: 1479-1485.
Cardellino, R. A., and M. E. Benson. 2002. Lactation curves of commercial ewes rearing lambs. Journal of Animal Science 80: 23-27.
Cardellino, R. A. B., M.E. 2002. Lactation curves of commercial ewes rearing lambs. Journal of Animal Science 80: 23-27.
Folman, Y., R. Volcani, and E. Eyal. 1966. Mother-Offspring Relashionships in Awassi Sheep .1. Effect of different suckling regimes and Time of Weaning on Lactation Curve and Milk Yield in Dairy Flocks. Journal of Agricultural Science 67: 359-&.
Gardner, R. W., and D. E. Hogue. 1966. Milk production, milk composition and energetic efficiency of Hampshire and Corriedale ewes fed to maintain body weight. J. Anim. Sci 25: 789-795.
Hein, D. C., M. L. Thonney, D. A. Ross, and D. E. Hogue. 2009. Effect of level of intake on digestibility of NDF in soy hulls. In: Cornell Nutrition Conference. p 61-68.
Hein, D. C., M. L. Thonney, D. A. Ross, and D. E. Hogue. 2010. Effect of level of intake on digestibility of NDF of soybean hull diets in sheep. Journal of Dairy Science 93: 785-785.
Loerch, S. C., K. E. McClure, and C. F. Parker. 1985. Effects of Number of Lambs Suckled and Supplemental Protein-Source on Lactating Ewe Performance. Journal of Animal Science 60: 6-13.
McKusick, B. C. T., D.L.; Berger, Y.M. 2001. Effect of weaning system on commercial milk production and lamb growth of East Friesian dairy sheep. Journal of Dairy Science 84: 1660-1668.
Mertens, D. R. 1997. Creating a system for meeting the fiber requirements of dairy cows. Journal of Dairy Science 80: 1463-1481.
56
Nudda, A., S. Fancellu, F. Porcu, F. Boe, and A. Cannas. 2004. Responses of milk fat composition to dietary non-fiber carbohydrates in Sarda dairy sheep. Journal of Animal Science 82: 310-310.
Peterson, S. W. K., P.R.; Morris, S.T.; Lopez-Villalobos, N.; Morel, P.C.H. 2005. Milk production in East Friesian-cross ewes lambing year round. Proceedings of the New Zealand Society of Animal Production 65: 173-177.
Pulina, G. 2004. Dairy Sheep Nutrition. CABI Publishing, Wallingford, Oxfordshire, UK. Pulina, G., A. Nudda, G. Battacone, and A. Cannas. 2006. Effects of nutrition on the contents of
fat, protein, somatic cells, aromatic compounds, and undesirable substances in sheep milk. Animal Feed Science and Technology 131: 255-291.
Ramsey, W. S., P. G. Hatfield, and J. D. Wallace. 1998. Relationships among ewe milk production and ewe and lamb forage intake in Suffolk and Targhee ewes nursing single or twin lambs. Journal of Animal Science 76: 1247-1253.
Reynolds, L. L. B., D.L. 1991. Assessing dairy potential of Western White-Faced ewes. Journal of Animal Science 69: 1354-1362.
Schotthofer, M. A. 2007. Effect of Level of Fermentable NDF on Feed Intake and Production of Lactating Ewes, Cornell University, Ithaca, NY.
Schotthofer, M. A., M. L. Thonney, and D. E. Hogue. 2007. Effect of level of fermentable NDF on feed intake and production of lactating ewes. Journal of Animal Science 85: 180-181.
Sitzia, M. et al. 2015. Feeding and management techniques to favour summer sheep milk and cheese production in the Mediterranean environment. Small Ruminant Research 126 (Suppl. 1): 43-58.
Snowder, G. D., and H. A. Glimp. 1991. Influence of Breed, Number of Suckling Lambs, and Stage of Lactation on Ewe Milk-Production and Lamb Growth Under Range Condiitons. Journal of Animal Science 69: 923-930.
Thomas, D. L. 2014. Dairy sheep production research at the University of Wisconsin-Madison - a review. Journal of Animal Science and Biotechnology.
Thonney, M. L. 2017. Sheep nutrition: formulated diets. In: J. P. C. Greyling (ed.) Achieving Sustainable Production of Sheep. Burleigh Dodds Science Publishing Limited Cambridge.
Thonney, M. L., and D. E. Hogue. 2007. Formulation of ruminant diets using potentially-fermentable NDF and nonstructural carbohydrates. In: Cornell Nutrition Conference. p 113-123.
Thonney, M. L., and D. E. Hogue. 2013. Fermentable fiber for diet formulation. In: Cornell Nutrition Conference, Syracuse, NY. p 174-189.
Tyrrell, H. F., and P. W. Moe. 1975. Effect of intake on digestive efficiency. J. Dairy Sci 58: 1151-1163.
Van Soest, P. J. 1994. Nutritional Ecology of the Ruminant. 2nd ed. Comstock Publishing Associates (Cornell University Press), Ithaca, NY.
57
PREVENTION AND TREATMENT OF DAIRY SHEEP DISEASES Mary C. Smith DVM
Ambulatory and Production Medicine Clinic, Cornell University Ithaca, NY 14853 USA
You Need a Veterinarian for Your Flock The relative importance of health problems in dairy sheep flocks will depend on where you
live, what you feed your sheep, and many aspects of your management, including where the sheep originated. You need a veterinarian who can visit the farm, examine the animals and their environment, and give you advice on how to keep the sheep healthy and the dairy products pro-duced on the farm safe and wholesome.
Your veterinarian can make a more accurate diagnosis than can Dr. Google. Your veterinar-ian can submit samples to a diagnostic laboratory for correctly identifying problems and for monitoring disease status of animals within the flock. Your veterinarian can help you to establish prevention, treatment, and eradication protocols and to monitor the success of those protocols, with the intent to refine them as needed.
If you do not yet have a flock veterinarian, consider these approaches to locating one: 1) contact large animal veterinary practices in your area and ask for the clinician with an inter-
est in small ruminants - this may be one of the younger associates in the practice, or the older veterinarians may have sheep flocks of their own.
2) contact your extension agent or other sheep owners in your area for suggestions 3) use the Find a Veterinarian function at <www.aasrp.org>, the American Association of Small
Ruminant Practitioners. The members of this organization cared enough about sheep and goats to pay annual dues and they have access to a listserve to get specific questions an-swered by their colleagues if they encounter an unfamiliar situation on your farm.
Veterinarian Client Patient Relationship You and your veterinarian need to establish a VCPR, a veterinarian client patient relation-
ship, and renew it annually. This is a legal requirement for obtaining prescription drugs, for the use of any extralabel drugs an animal may require, and for obtaining a veterinary feed directive if drugs need to be added to the feed of the sheep. The veterinarian supplies directions for the dose and duration of treatment and specifies milk and meat withdrawals that will be required. The owner must agree to follow the veterinarian’s directions. This veterinarian must see the animals being treated or regularly visit the farm, to be able to accurately assess the situation. This veteri-narian must be readily available if follow-up is needed. A veterinarian at a drug supply house elsewhere in the country cannot be part of a valid VCPR.
Meat and Milk Withdrawals Very few medications are approved by the Food and Drug Administration (FDA) and la-
beled for dairy sheep. Any drugs that are needed but not labeled for sheep or for the condition being treated are extralabel, and their use requires a VCPR, The veterinarian needs to contact FARAD, the Food Animal Residue Avoidance Databank <http://www.farad.org/> to obtain ad-vice on meat and milk withdrawals for the drug treatment regimen prescribed. You must keep a treatment list that specifies what drug was given to what sheep on what date(s) and when milk or
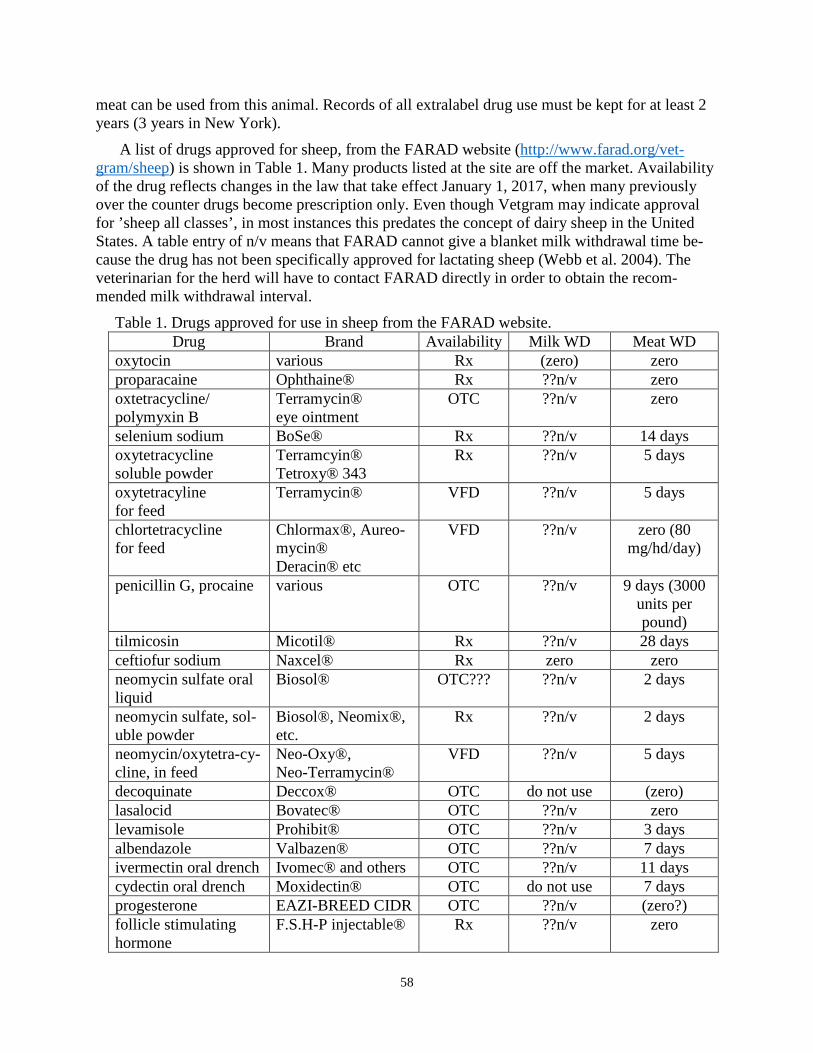
58
meat can be used from this animal. Records of all extralabel drug use must be kept for at least 2 years (3 years in New York).
A list of drugs approved for sheep, from the FARAD website (http://www.farad.org/vet-gram/sheep) is shown in Table 1. Many products listed at the site are off the market. Availability of the drug reflects changes in the law that take effect January 1, 2017, when many previously over the counter drugs become prescription only. Even though Vetgram may indicate approval for ’sheep all classes’, in most instances this predates the concept of dairy sheep in the United States. A table entry of n/v means that FARAD cannot give a blanket milk withdrawal time be-cause the drug has not been specifically approved for lactating sheep (Webb et al. 2004). The veterinarian for the herd will have to contact FARAD directly in order to obtain the recom-mended milk withdrawal interval.
Table 1. Drugs approved for use in sheep from the FARAD website. Drug Brand Availability Milk WD Meat WD
oxytocin various Rx (zero) zero proparacaine Ophthaine® Rx ??n/v zero oxtetracycline/ polymyxin B
Terramycin® eye ointment
OTC ??n/v zero
selenium sodium BoSe® Rx ??n/v 14 days oxytetracycline soluble powder
Terramcyin® Tetroxy® 343
Rx ??n/v 5 days
oxytetracyline for feed
Terramycin® VFD ??n/v 5 days
chlortetracycline for feed
Chlormax®, Aureo-mycin® Deracin® etc
VFD ??n/v zero (80 mg/hd/day)
penicillin G, procaine various OTC ??n/v 9 days (3000 units per pound)
tilmicosin Micotil® Rx ??n/v 28 days ceftiofur sodium Naxcel® Rx zero zero neomycin sulfate oral liquid
Biosol® OTC??? ??n/v 2 days
neomycin sulfate, sol-uble powder
Biosol®, Neomix®, etc.
Rx ??n/v 2 days
neomycin/oxytetra-cy-cline, in feed
Neo-Oxy®, Neo-Terramycin®
VFD ??n/v 5 days
decoquinate Deccox® OTC do not use (zero) lasalocid Bovatec® OTC ??n/v zero levamisole Prohibit® OTC ??n/v 3 days albendazole Valbazen® OTC ??n/v 7 days ivermectin oral drench Ivomec® and others OTC ??n/v 11 days cydectin oral drench Moxidectin® OTC do not use 7 days progesterone EAZI-BREED CIDR OTC ??n/v (zero?) follicle stimulating hormone
F.S.H-P injectable® Rx ??n/v zero

59
Table 1. Drugs approved for use in sheep from the FARAD website. Drug Brand Availability Milk WD Meat WD
zeranol Ralgro® implant OTC (off market)
do not use 40 days
[permethrin - not FDA product]
Ultraboss, and others OTC (zero) Zero
• Rx means by prescription. • OTC means over the counter. • VFD means veterinary feed directive, and no extralabel use of drugs is allowed in feed. • ??n/v means that FARAD must be contacted, as there is no specific approval for dairy
sheep.
Basic Disease Prevention - Biosecurity Infectious diseases are bought and paid for. You must know what diseases sheep get and how
they are spread. You should avoid buying or borrowing animals that carry these diseases, but even if you ask all the right questions the seller may be unaware and a purchased ram or ewe could be an inapparent carrier. Always quarantine new purchases (rams, ewes, lambs) and show animals for at least three weeks and examine or test them at the beginning and end of the quaran-tine period. Treat new animals for internal parasites and for footrot before releasing them from quarantine. Some diseases with long incubation periods can still slip past the quarantine, so buy from disease-free flocks.
Basic Disease Prevention - Vaccination Programs The most basic vaccine is a combined tetanus-enterotoxemia product, which requires two ini-
tial doses three or four weeks apart and then boosters. Tetanus protection probably lasts at least a year, but a booster vaccination to the ewe in late pregnancy will maximize antibodies in the co-lostrum to protect the lambs. Vaccines are permitted and encouraged in organic programs but typically have at least a 21 day meat withdrawal. The enterotoxemia protection probably lasts 6 months or less. If you feed high levels of concentrates or lush grass more than 6 months after the last booster was given, another booster is indicated. If the lactation is relative short and the for-age is not lush in late lactation or gestation, then you can probably get by with only giving prelambing boosters. In some parts of the country other clostridial infections are a problem and your veterinarian may recommend an 8-way clostridial product that contains tetanus. Many 7-way cattle clostridial products do not contain a tetanus component.
Other vaccines that might be given will depend on the disease status of the flock and are dis-cussed below under specific conditions. These include vaccines for abortion diseases (Campylo-bacter and Chlamydia), sore mouth, and caseous lymphadenitis. There is NO vaccine available in the United States for pneumonia in sheep, for footrot in sheep, for pinkeye in sheep, or for ovine progressive pneumonia, toxoplasmosis, or scrapie.
Basic Disease Prevention - Nutrition Many diseases of sheep have a nutritional component. These include the metabolic diseases
pregnancy toxemia and hypocalcemia, lactic acidosis, and copper poisoning and copper defi-ciency. Furthermore, an appropriate nutritional program is necessary if the sheep is to have a functional immune system to resist disease challenges. Forages need to be tested for quality; this requires sampling multiple bales of hay or haylage and submitting the representative combined
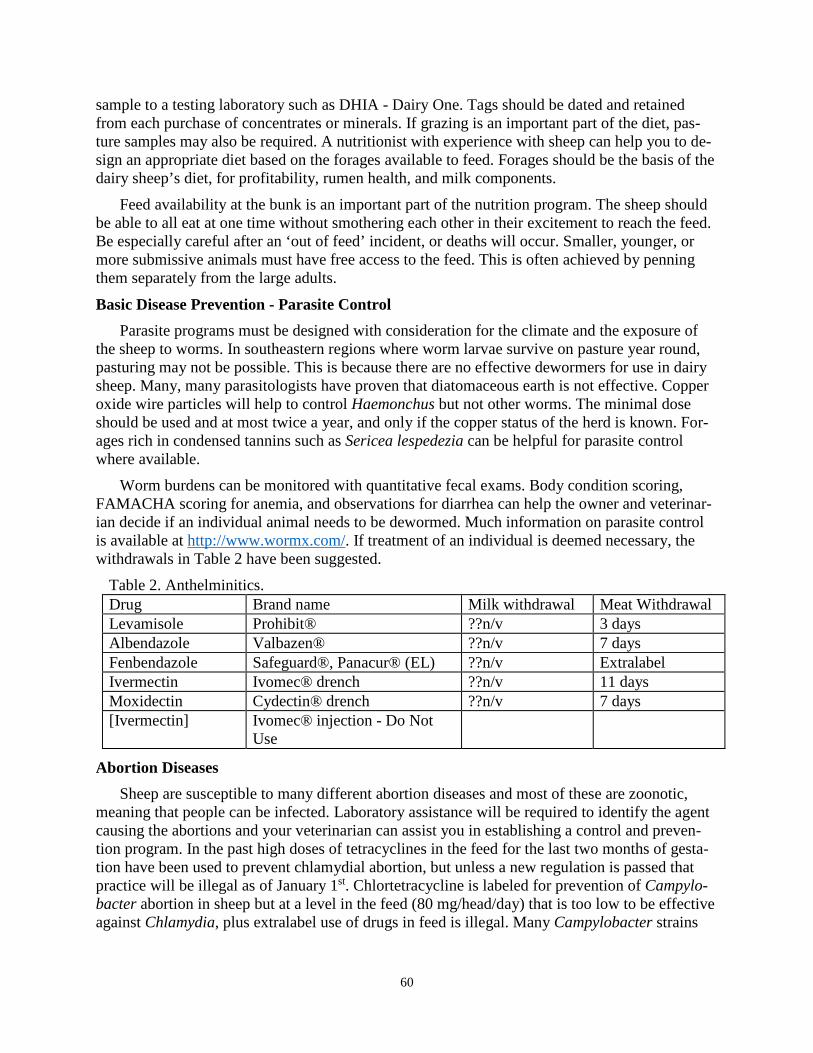
60
sample to a testing laboratory such as DHIA - Dairy One. Tags should be dated and retained from each purchase of concentrates or minerals. If grazing is an important part of the diet, pas-ture samples may also be required. A nutritionist with experience with sheep can help you to de-sign an appropriate diet based on the forages available to feed. Forages should be the basis of the dairy sheep’s diet, for profitability, rumen health, and milk components.
Feed availability at the bunk is an important part of the nutrition program. The sheep should be able to all eat at one time without smothering each other in their excitement to reach the feed. Be especially careful after an ‘out of feed’ incident, or deaths will occur. Smaller, younger, or more submissive animals must have free access to the feed. This is often achieved by penning them separately from the large adults.
Basic Disease Prevention - Parasite Control Parasite programs must be designed with consideration for the climate and the exposure of
the sheep to worms. In southeastern regions where worm larvae survive on pasture year round, pasturing may not be possible. This is because there are no effective dewormers for use in dairy sheep. Many, many parasitologists have proven that diatomaceous earth is not effective. Copper oxide wire particles will help to control Haemonchus but not other worms. The minimal dose should be used and at most twice a year, and only if the copper status of the herd is known. For-ages rich in condensed tannins such as Sericea lespedezia can be helpful for parasite control where available.
Worm burdens can be monitored with quantitative fecal exams. Body condition scoring, FAMACHA scoring for anemia, and observations for diarrhea can help the owner and veterinar-ian decide if an individual animal needs to be dewormed. Much information on parasite control is available at http://www.wormx.com/. If treatment of an individual is deemed necessary, the withdrawals in Table 2 have been suggested.
Table 2. Anthelminitics. Drug Brand name Milk withdrawal Meat Withdrawal Levamisole Prohibit® ??n/v 3 days Albendazole Valbazen® ??n/v 7 days Fenbendazole Safeguard®, Panacur® (EL) ??n/v Extralabel Ivermectin Ivomec® drench ??n/v 11 days Moxidectin Cydectin® drench ??n/v 7 days [Ivermectin] Ivomec® injection - Do Not
Use
Abortion Diseases Sheep are susceptible to many different abortion diseases and most of these are zoonotic,
meaning that people can be infected. Laboratory assistance will be required to identify the agent causing the abortions and your veterinarian can assist you in establishing a control and preven-tion program. In the past high doses of tetracyclines in the feed for the last two months of gesta-tion have been used to prevent chlamydial abortion, but unless a new regulation is passed that practice will be illegal as of January 1st. Chlortetracycline is labeled for prevention of Campylo-bacter abortion in sheep but at a level in the feed (80 mg/head/day) that is too low to be effective against Chlamydia, plus extralabel use of drugs in feed is illegal. Many Campylobacter strains
61
are resistant to tetracyclines, so vaccination and exclusion will be the best way to prevent these abortion diseases.
Listerial abortions can be limited by not feeding spoiled haylages and silages and toxoplas-mosis abortions by keeping young kittens out of the feed and the hay mow. Purchased ewes or ewe lambs should be bred to lamb later than the rest of the flock, to avoid an outbreak if they are carrying chlamydia.
When abortions do occur, remove the aborting female and the fetuses and placentas from the group of pregnant animals at once. Wear gloves when handling these items and burn, bury, com-post deeply, or send to the landfill any fetuses and placentas that are not needed for laboratory diagnosis.
Pregnancy Toxemia Sheep late pregnant with multiple lambs may develop a metabolic disease characterized by
ketones in the urine and blood as well as acidosis in the blood. Initially the sheep is lethargic and eating poorly, perhaps with swollen lower legs. It may have some other problem such as indiges-tion or pneumonia that initially put it off feed, or it may be blind from polioencephalomalacia as a sequella to indigestion or it may be hypocalcemic from not eating. Treatment is difficult (intra-venous and oral fluids, oral propylene glycol, calcium, dextrose, B vitamins, force feeding, 20 mg of dexamethasone to induce parturition, or a C section) and often unsuccessful, depending on how close the ewe is to her due date. Fluid from inside the eye can be checked for elevated ke-tones (beta hydroxybutyrate) to confirm the diagnosis if the sheep dies.
As it is common for the ewe and the lambs to all die as a result of pregnancy toxemia, each case should be evaluated closely for underlying causes that can be prevented in the other ewes. Have they been allowed to get too fat, so they cannot physically eat enough ration to meet the needs of the developing lambs? Is the hay of poor quality, again limiting consumption? Is there too much grain in the diet that has caused an indigestion? Is it an individual animal problem be-cause that ewe was old with bad teeth and could not chew her hay? Closer observation of other late pregnant ewes will allow more timely intervention.
Hypocalcemia This is another metabolic problem, most common in late pregnant or peak lactation animals.
An inadequate dietary supply of calcium or magnesium, excess dietary potassium, off feed event, or excessive exercise may cause the sheep to be stiff and then go down because its muscles are weak. The ewe may turn its head around towards its udder or lie with the head and neck out-stretched, appearing to breathe hard. The diagnosis can be made with a blood test or by response to therapy, typically 60 cc of 23% calcium borogluconate injected under the skin, with 15 cc given in each of 4 spots. A veterinarian could give the calcium very slowly in the jugular vein, and if no injectable calcium is immediately available, TUMS® tablets orally will supply some calcium to the ewe. The calcium concentration in the diet should be checked and corrected if necessary with additional dicalcium phosphate in concentrates or salt or by feeding more leg-umes high in calcium after parturition.
Mastitis This is a very important disease of dairy sheep, causing decreased production, increased so-
matic cell counts, and deaths. It is discussed elsewhere in this symposium. Milk cultures will be necessary to identify the organisms involved. Prevention will require establishment of proper
62
milking routines and milking equipment settings and maintenance. Ewes with mastitis or teat le-sions should be milked last.
Listeriosis This infectious disease can cause abortions in ewes, deaths in neonatal lambs marked by liver
infections, and eye infections, however neurologic disease is seen most commonly. Possible signs include circling, drooling, weak jaw or tongue hanging out, and inability to blink. The sheep can die very quickly, even if you use extralabel antibiotics prescribed by your veterinarian and fluid therapy. It is especially important to monitor the quality of silages, as they can be heav-ily contaminated with listeria organisms if not maintained at a pH of 5 or below until fed. There must be no holes in silage bags. Manger sweepings from dairy cows are a common source of the disease. The organism grows well at cold temperatures, and many outbreaks occur in confine-ment animals in the winter, but listeriosis can also strike sheep grazing on wet pastures. Labora-tory confirmation will be required to rule out other neurologic diseases such as rabies and deer-worm migration in the brain. Sheep with typical neurologic signs must not be slaughtered for food.
Ovine Progressive Pneumonia This is a chronic viral infection of adult sheep that most commonly causes respiratory diffi-
culty/exercise intolerance and weight loss but can also cause a very hard udder with very little milk available or swollen joints, especially the front ‘knees’. The virus is most easily spread through respiratory secretions in housed sheep but can be passed in milk or spread by reusing needles or surgical equipment contaminated with blood. Milking machines can spread the virus by allowing milk from one ewe inside the teat cup to go up into the udder of the next ewe milked with that cluster.
Infected sheep never clear the virus and there is no vaccine. Blood tests are available, alt-hough the one most commonly used in the United States is directed against the closely related caprine arthritis-encephalitis virus. Most herds will not be able to afford culling all infected sheep, but a long term control program could involve raising replacement lambs separate from the adults after weaning (or from birth, if raised artificially) and testing these animals at 6 months of age. Positives are removed from the group. Negative ewe lambs are never allowed to mix with the original, infected herd and are milked before the original herd, to avoid spread by the milking machine. They should be tested several times a year, in case a lamb seroconverts late or the virus gets into the group because of a lapse in biosecurity. Positive animals are relocated into the original, infected herd. Another tool that may become useful but has not been evaluated in dairy sheep is to select for genetic resistance to the virus, using a commercial test offered by several laboratories.
Caseous Lymphadenitis Contagious abscesses caused by Corynebacterium pseudotuberculosis develop in external
lymph nodes, especially in front of the shoulder and on the flank just in front of the hind leg of sheep. The infection spreads to other sheep when an abscess comes to a head and breaks open, contaminating the environment, or when opened by shearing equipment. Lice or keds that cause the sheep to rub on posts or fences also contribute to introducing the organism into the skin of another sheep. The incubation period can be 6 months or longer, and it is easy to introduce the infection to a farm with animals, including goats, that appear healthy.

63
Some sheep have internal abscesses, in lungs, liver or kidneys. These animals will eventually produce poorly and lose weight. They also will shed the germ in respiratory secretions or feces. If the abscesses are in two body cavities the carcass will be condemned at slaughter. Blood tests are not reliable for identifying infected sheep, so herds experiencing losses from this disease should consider vaccinating twice, a month apart, then annually. Reaction to the vaccine may cause a temporary drop in appetite and milk production, especially in infected sheep.
Footrot Two bacterial organisms, Dichelobacter nodosus and Fusobacterium necrophorum, work to-
gether to cause a moist dermatitis between the toes that often progresses to underrunning of the sole from the heel and severe lameness. There is a bad odor from the foot. Affected sheep may hold up a foot or walk on their knees. This painful condition is a serious welfare issue and must be addressed. The disease is typically bought and paid for with hours of work inspecting and treating feet. Any sheep or goats acquired from a farm that has footrot can introduce the disease to a sheep dairy, even if they appear normal on arrival. Incoming animals should be treated dur-ing the quarantine period as if they were infected. Systemic antibiotics might be used in replace-ment animals or dry ewes, under the advice of the herd veterinarian with due attention to meat residues. To avoid the need to discard milk, lactating ewes can be treated with one hour soaks in a 10% zinc sulfate solution with an added laundry soap wetting agent. Culling is indicated for sheep with deformed feet from chronic footrot. There is no effective vaccine available in the North America.
Pink Eye Several organisms, but especially mycoplasma and chlamydia species, can cause an infec-
tious keratoconjunctivitis in sheep. Animals that have been previously infected but seemed to re-cover will shed the organisms again when stressed, especially after moving to a new herd. Mild cases show tearing of the eyes and squinting while in severe cases the clear outer surface of the eye (cornea) becomes cloudy, white or red, and central ulcers may form and perforate. Blood vessels grow in from the edge of the cornea to try to heal the lesions. This painful condition will decrease feed consumption and milk production. Your veterinarian may prescribe oxytetracy-cline by injection or as an eye ointment for individual animals. Treatment of mild cases is not ad-vised as the antibiotics cannot eradicate the infection and the sheep needs to develop local im-munity in the eyes, which takes time. If young lambs are suspected to have pinkeye they must be examined very closely to rule out entropion, an inward rolling of the eyelid margin. There is no effective vaccine for pink eye in sheep.
Sore Mouth This viral skin disease is also known at contagious ecthyma or orf. It typically causes prolif-
erative scabs on the lips and face of young lambs but when first introduced to a naive flock can cause skin lesions in adults also. These are especially serious if they develop on the teats of ewes, because staphylococcal bacteria in the scabs will travel up into the udder, causing mastitis, including fatal gangrenous mastitis. Lambs with lip lesions can spread the virus to their dam or to other ewes from which they try to steal milk. Skin lesions typically last four or five weeks but heal without a scar. People are susceptible to this virus and should wear disposable gloves when handling infected animals.
64
A commercial vaccine is available from Colorado Serum Co, <http://www.colorado-se-rum.com/csc/ovine_ectmya.html> or an autogenous live vaccine can be made by grinding up scabs and rubbing the suspension into the skin of lambs on the inside of the thigh or ear. Vaccine should not be used in uninfected flocks, as it consists of live virus and will introduce the disease to the farm. The virus can persist for many months in bedding, and the disease is mostly likely to remain a problem on the farm if there is a steady flow of new, susceptible lambs into the pens. Some adults are inapparent carriers of the virus, with purchased rams most often being blamed for an outbreak.
Johne’s Disease or Paratuberculosis This is a chronic bacterial infection of the intestine with Mycobacterium avium subsp. para-
tuberculosis that interferes with absorption of nutrients. The affected sheep is at least a year old (up to 8 or more years) when signs first develop even though it probably was first infected as a young lamb. The disease is spread by the fecal oral route, so crowding the sheep or not bedding them deeply may increase the number of infected lambs. Although cattle with Johne’s disease typically have profuse diarrhea and a good appetite, most clinical sheep have no diarrhea and just milk poorly and get thin. They may have a picky appetite. There are no good tests to identify in-fected sheep before clinical signs appear, and even when the animal is emaciated, microscopic examination of the intestines (ileocecal junction) and intestinal lymph nodes is usually needed to confirm the diagnosis.
There is no treatment for this disease, and if the affected animal is allowed to remain in the herd it will shed millions of organisms that can infect other sheep and can survive on pasture or wherever the manure is spread, for a year or more. Thus an important part of control is to keep thin animals out of lambing pens and cull them promptly. Johne’s disease can also be introduced to the farm with colostrum or manger sweepings or manure spread on pasture from an infected dairy cow farm.
Most sheep dairy farmers do not know if they have this disease or not. In a study of dairy flocks in Ontario, Canada, about 2/3 were judged to have Johne’s disease on the farm and almost half of the sheep on the infected farms were thought to be infected (Bauman et al. 2016). There is no vaccine available in North America to protect sheep against this infection.
References Bauman C.A., A. Jones-Bitton, P. Menzies, N. Toft, J. Jansen, and D. Kelton. 2016. Prevalence of paratu-
berculosis in the dairy goat and dairy sheep industries in Ontario, Canada. Canadian Vet J. 57(2):169-175.
National Research Council. 2007. Nutrient Requirements of Small Ruminants: Sheep, Goats, Cervids, and New World Camelids. National Academies Press, Washington DC.
Pugh, D.G. and Baird N. 2011. Sheep & Goat Medicine, 2nd edition. Elsevier/Saunders, Maryland Heights MO.
Sheep Industry Development Program: S. I. D. Sheep Production Handbook [choose 'shop'], 2015 Edi-tion, Vol 8. now with USB drive. Available at 9785 Maroon Circle, Suite 360, Englewood, CO 80112 phone 303-771-3500 ext 108 for $89.95.
Webb, A.I., R. E. Baynes, A. L. Craigmill, J. E. Riviere, S. R. R. Haskell. 2004. Drugs approved for small ruminants. J Amer Vet Med Assoc 224(4):520-523.
65
DIGITAL NECROPSY EXAMINATION OF SHEEP AND GOATS Mary C. Smith DVM
Ambulatory and Production Medicine Cornell College of Veterinary Medicine
Ithaca New York 14853 USA
Much useful information about the individual dead animal and health issues in the flock can be gleaned by performing a necropsy. However the body rots quickly, which makes interpreta-tion of lesions difficult. A veterinarian may be unable to examine the body within a few hours after death or the loss may occur on a weekend, making a professional examination expensive. The purpose of this presentation is to describe a protocol for performing a necropsy and docu-menting it by digital photography. A trained producer could do the necropsy and forward the im-ages to his veterinarian, or a veterinarian could submit the images, with or without collected specimens, to a diagnostic laboratory for evaluation by a trained pathologist. A complete set of photographs might total 16 to 20 images, but often fewer will be needed in neonates or young an-imals. A video of the necropsy of a cow, also applicable to sheep and goats, is available at https://secure.vet.cornell.edu/virtualvet/bovine/default.aspx.
Most importance should be placed on diagnosis of conditions that can be managed or that represent flock problems. If possible, contact the flock veterinarian in advance. That veterinarian may request additional photographs or samples, depending on the animal being examined and the diseases for which it was at risk. For instance, the bladder and penis should always be checked in males for evidence of urinary obstruction. Emaciated adults should have photographs and sam-ples taken of the area where the small intestine enters the cecum, to monitor for paratuberculosis (Johne’s disease). Do NOT open the body if your veterinarian is concerned about anthrax. 1) Assemble waterproof gloves, a knife and sharpener, foot trimmers for opening the chest of
young lambs and pruning shears for opening the chest of older animals. Also have a ruler and several watertight jars or Ziplock bags for taking samples. Ideally, an assistant should take the photos. If this is not possible, wrap all of the camera except the lens in saran wrap or a plastic bag to keep it clean.
2) Print the linked form and record in dark ink the owner’s name, veterinarian, ID of sheep (name, tag, or ‘lamb from xxxx’), breed, sex, age, approximate weight, body condition score, date of exam, and interval from death until necropsy. Photograph this sheet now and at the end of the necropsy, after filling in a tentative diagnosis.
3) Photograph the head and any ear tags or tattoos present. Check for a cleft palate or mal-formed jaws and photograph if found. Photograph incisors if they don’t match reported age of the animal or if the age of an adult is unknown.
4) Examine both sides of the animal and its head and legs for wounds, enlarged lymph nodes, or externally visible abnormalities and photograph any that are found.
5) Spread the eyelids open and photograph the sclera (white part of eyeball), cornea (central, normally clear part of eyeball), and conjunctiva (tissue lining the inner surface of the lower eyelid) of the palest eye or any eye with an obvious lesion [anemia (very white conjunctiva), icterus (yellow or muddy brown sclera), keratitis (cornea not clear)]. The conjunctiva is nor-mally more reddened on the eye that was down when death occurred.

66
6) Place the body left side down in a location where clean-up will be easy. 7) Photograph the body next to a ruler, measuring tape, or other item of known size. 8) Lift the tail and examine the area around the anus and vulva or down the back end to the top
of the scrotum and photograph if abnormalities seen. [scours, prolapses, fetal parts protrud-ing, placenta, intestines hanging out]
9) Take a close-up photo of the udder of females or of the scrotum and prepuce (where the male urinates), if visible. Feel these tissues; cut into them and repeat the photograph if they feel abnormal.
10) Insert the knife into the axilla (armpit) and cut skin (from the inside out to avoid dulling the knife) and muscles to completely fold back the front leg. Cut the skin along the ventral mid-line, forward up the neck towards the head and check for wounds [predator attack], abscesses or large thyroid glands [goiter]. Cut the skin backwards along the abdomen towards the pel-vis. Insert the knife into the hip joint, being careful to not enter the abdomen, and cut skin and muscle to fold back the hind leg. Peel back the skin from the side of the body. Cut care-fully through the muscle layer along the last rib to enter the abdomen without cutting stom-ach or intestines, and fold back/remove the abdominal body wall to expose internal organs.
11) Cut the diaphragm (muscular sheet between chest and abdomen) where it attaches to the rib cage. Use the knife, foot trimmers, or pruning shears to cut all of the ribs through the carti-lage part close to the sternum (breast bone). Depending on the age of the animal, break or cut the ribs near the spine to fold back or remove the rib cage. Note/photograph preexisting rib fractures.
12) Photograph the exposed organs and fat of the chest and abdomen, with close-ups of any-thing that appears abnormal. [fat or lack thereof and yellow color of fat, fluid or blood in ab-domen, fluid in chest, liver lesions, lung lesions]. Fold back or remove the fat-filled or filmy sheet (omentum) for a better view of the stomachs, intestines, and kidneys. Take another photograph of the deeper organs now exposed.
13) Open the pericardial sac (heart sac) in place, photograph its contents if fluid or clots present. 14) Slice the right kidney (the upper one, farther towards the head) lengthwise and photo-
graph. Find and examine the other kidney and photograph if it seems abnormal. 15) Move organs as necessary to expose the bladder and uterus. This may require releasing gas
from the rumen with the tip of the knife. Photograph the bladder or uterus in place if a problem or pregnancy is suspected. Open the bladder if it is full. Open the uterus if large enough to be in the abdomen and photograph if abnormalities or fetuses are discovered.
16) Remove and slice/examine the liver and gall bladder and photograph anything that seems abnormal. Check for abscesses between the umbilicus and the liver of lambs.
17) On thin adults, examine the incisor teeth and slit the cheeks with the knife to expose the mo-lar teeth. Photograph if teeth are missing or irregular.
18) Cut the tongue free from the lower jaws and small supporting bones and pull on it while free-ing the trachea (windpipe) and esophagus from the neck down to the chest. Continue pulling and cutting to remove the heart and lungs from the chest, cutting the aorta and esophagus at the diaphragm and the attachments of the heart sac (pericardium). Open the trachea and

67
esophagus lengthwise. If the body was severely bloated, photograph the lining of the esophagus in the neck and chest. Spread out the lung lobes and photograph the view from the top if parts of the lung feel firm. This step is not necessary if a lamb was stillborn, con-firmed by failure of a piece of lung to float. Slice into any parts of the lung that feel firm and photograph the slices.
19) Open the heart if a problem is suspected or no cause of death has yet been identified. Exam-ine all heart valves and check for any defects in the wall between the left and right sides of the heart.
20) Go back to the abomasum (4th stomach) and open it to examine/photograph contents and look for milk in lambs and Haemonchus (barberpole worms) if the animal was old enough to have been on pasture or if the conjunctiva was pale.
21) Open the rumen and examine the contents for color, consistency, presence of grain or identi-fiable plant fragments or foreign material, and measure pH if appropriate pH paper is availa-ble. Photograph rumen contents if they do not appear normal. Save rumen contents in a watertight container if toxicology might be needed.
22) Save frozen a piece of liver and half of the right kidney if toxicology or trace mineral analy-sis may be needed.
23) Save fecal material from the rectum or cecum (pouch of intestine between small intestines and large intestine) in case needed for parasitological exam [if scours, anemia, or emaciation or for herd monitoring purposes].
24) Skin the head and use the foot trimmers to open the skull of neonatal lambs with mal-formed limbs or neurologic signs noted. Do not open the skull of older animals unless proper precautions can be taken to avoid human exposure if the animal might have died of rabies.
25) Dispose of all body parts properly (legal methods vary with state and country). 26) Record your preliminary diagnosis or concerns on the original paper form and photo-
graph it again. Forward the history and photos to your veterinarian. If possible discuss the findings with the veterinarian before disposal of the body, in case laboratory testing is needed. The veterinarian may forward the images to the diagnostic lab if cause of death is not obvious and the animal represents a herd problem.

68
Sheep or Goat Necropsy Record Owner’s name: Owner’s phone number:
Email:
Veterinarian: Animal ID, including name, number and color of all tags, tattoos. For neonates indicate “lamb from xxxx” Breed: Age:
Sex:
Approximate weight:
lb kg
Body condition score (1 to 5 scale, where 5 is fat): Signs of disease observed before death: Date and time of death: Date and time of exam: Postmortem interval:
hours days
Tentative diagnosis or concerns after necropsy:
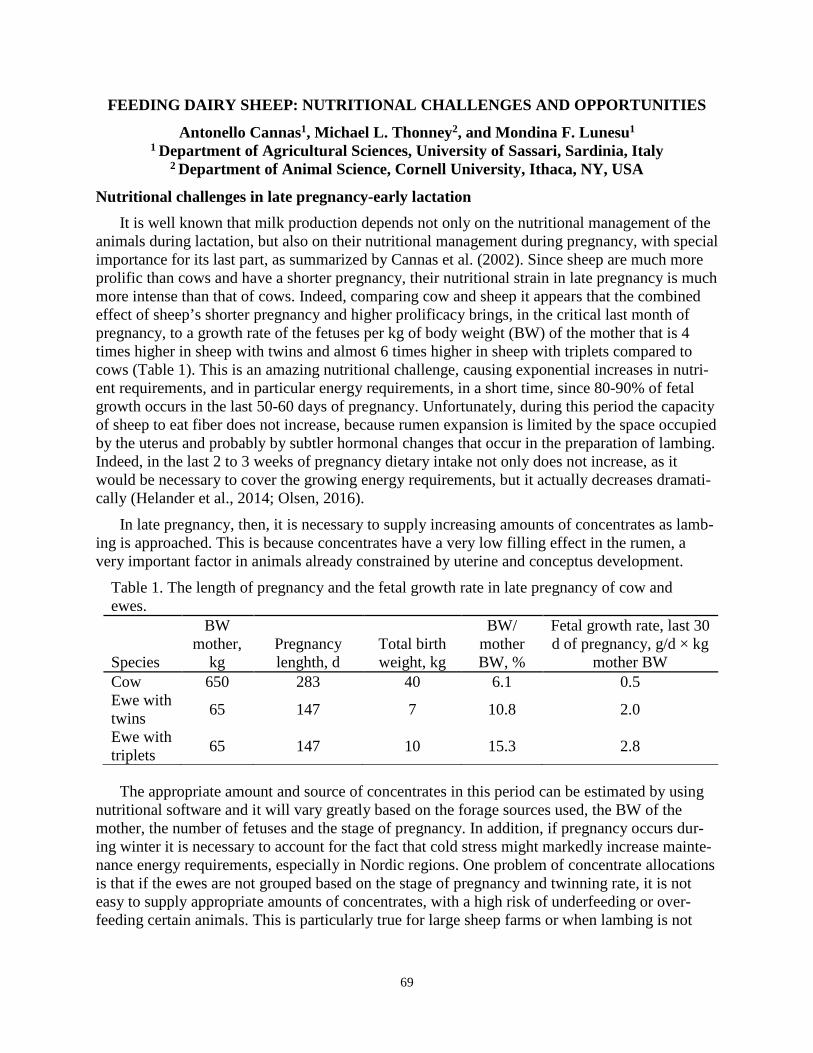
69
FEEDING DAIRY SHEEP: NUTRITIONAL CHALLENGES AND OPPORTUNITIES
Antonello Cannas1, Michael L. Thonney2, and Mondina F. Lunesu1 1 Department of Agricultural Sciences, University of Sassari, Sardinia, Italy
2 Department of Animal Science, Cornell University, Ithaca, NY, USA
Nutritional challenges in late pregnancy-early lactation It is well known that milk production depends not only on the nutritional management of the
animals during lactation, but also on their nutritional management during pregnancy, with special importance for its last part, as summarized by Cannas et al. (2002). Since sheep are much more prolific than cows and have a shorter pregnancy, their nutritional strain in late pregnancy is much more intense than that of cows. Indeed, comparing cow and sheep it appears that the combined effect of sheep’s shorter pregnancy and higher prolificacy brings, in the critical last month of pregnancy, to a growth rate of the fetuses per kg of body weight (BW) of the mother that is 4 times higher in sheep with twins and almost 6 times higher in sheep with triplets compared to cows (Table 1). This is an amazing nutritional challenge, causing exponential increases in nutri-ent requirements, and in particular energy requirements, in a short time, since 80-90% of fetal growth occurs in the last 50-60 days of pregnancy. Unfortunately, during this period the capacity of sheep to eat fiber does not increase, because rumen expansion is limited by the space occupied by the uterus and probably by subtler hormonal changes that occur in the preparation of lambing. Indeed, in the last 2 to 3 weeks of pregnancy dietary intake not only does not increase, as it would be necessary to cover the growing energy requirements, but it actually decreases dramati-cally (Helander et al., 2014; Olsen, 2016).
In late pregnancy, then, it is necessary to supply increasing amounts of concentrates as lamb-ing is approached. This is because concentrates have a very low filling effect in the rumen, a very important factor in animals already constrained by uterine and conceptus development.
Table 1. The length of pregnancy and the fetal growth rate in late pregnancy of cow and ewes.
Species
BW mother,
kg Pregnancy lenghth, d
Total birth weight, kg
BW/ mother BW, %
Fetal growth rate, last 30 d of pregnancy, g/d × kg
mother BW Cow 650 283 40 6.1 0.5 Ewe with twins 65 147 7 10.8 2.0
Ewe with triplets 65 147 10 15.3 2.8
The appropriate amount and source of concentrates in this period can be estimated by using nutritional software and it will vary greatly based on the forage sources used, the BW of the mother, the number of fetuses and the stage of pregnancy. In addition, if pregnancy occurs dur-ing winter it is necessary to account for the fact that cold stress might markedly increase mainte-nance energy requirements, especially in Nordic regions. One problem of concentrate allocations is that if the ewes are not grouped based on the stage of pregnancy and twinning rate, it is not easy to supply appropriate amounts of concentrates, with a high risk of underfeeding or over-feeding certain animals. This is particularly true for large sheep farms or when lambing is not
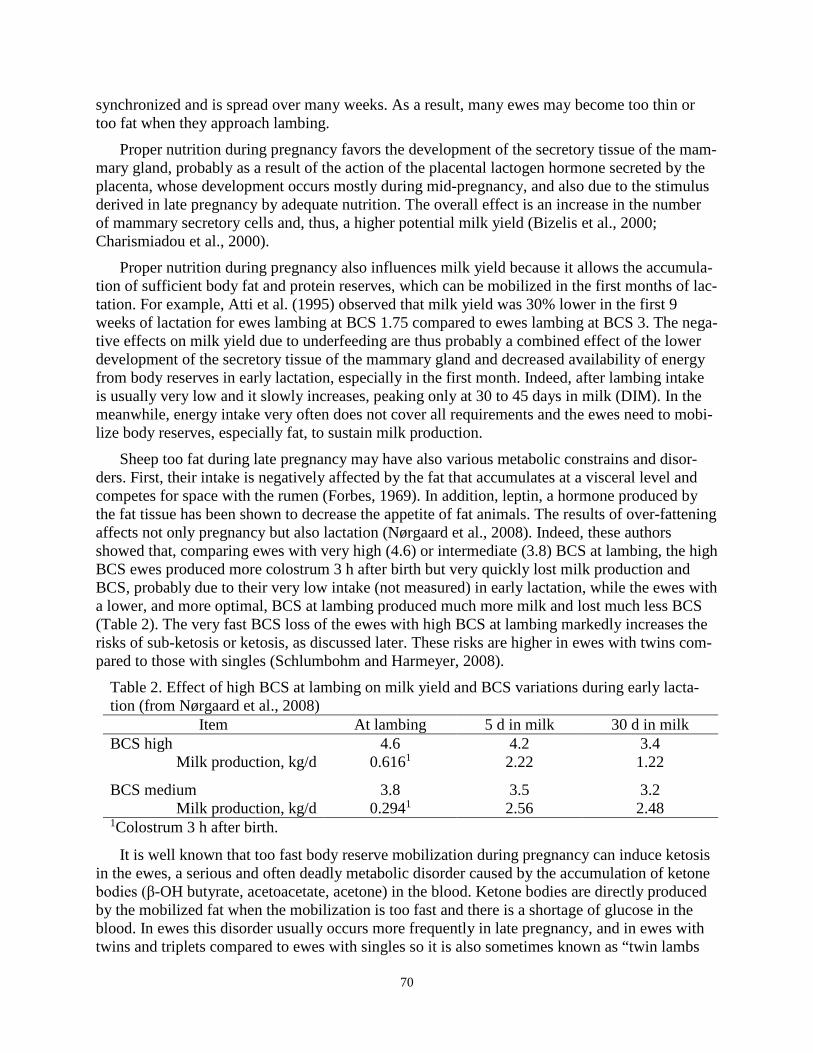
70
synchronized and is spread over many weeks. As a result, many ewes may become too thin or too fat when they approach lambing.
Proper nutrition during pregnancy favors the development of the secretory tissue of the mam-mary gland, probably as a result of the action of the placental lactogen hormone secreted by the placenta, whose development occurs mostly during mid-pregnancy, and also due to the stimulus derived in late pregnancy by adequate nutrition. The overall effect is an increase in the number of mammary secretory cells and, thus, a higher potential milk yield (Bizelis et al., 2000; Charismiadou et al., 2000).
Proper nutrition during pregnancy also influences milk yield because it allows the accumula-tion of sufficient body fat and protein reserves, which can be mobilized in the first months of lac-tation. For example, Atti et al. (1995) observed that milk yield was 30% lower in the first 9 weeks of lactation for ewes lambing at BCS 1.75 compared to ewes lambing at BCS 3. The nega-tive effects on milk yield due to underfeeding are thus probably a combined effect of the lower development of the secretory tissue of the mammary gland and decreased availability of energy from body reserves in early lactation, especially in the first month. Indeed, after lambing intake is usually very low and it slowly increases, peaking only at 30 to 45 days in milk (DIM). In the meanwhile, energy intake very often does not cover all requirements and the ewes need to mobi-lize body reserves, especially fat, to sustain milk production.
Sheep too fat during late pregnancy may have also various metabolic constrains and disor-ders. First, their intake is negatively affected by the fat that accumulates at a visceral level and competes for space with the rumen (Forbes, 1969). In addition, leptin, a hormone produced by the fat tissue has been shown to decrease the appetite of fat animals. The results of over-fattening affects not only pregnancy but also lactation (Nørgaard et al., 2008). Indeed, these authors showed that, comparing ewes with very high (4.6) or intermediate (3.8) BCS at lambing, the high BCS ewes produced more colostrum 3 h after birth but very quickly lost milk production and BCS, probably due to their very low intake (not measured) in early lactation, while the ewes with a lower, and more optimal, BCS at lambing produced much more milk and lost much less BCS (Table 2). The very fast BCS loss of the ewes with high BCS at lambing markedly increases the risks of sub-ketosis or ketosis, as discussed later. These risks are higher in ewes with twins com-pared to those with singles (Schlumbohm and Harmeyer, 2008).
Table 2. Effect of high BCS at lambing on milk yield and BCS variations during early lacta-tion (from Nørgaard et al., 2008)
Item At lambing 5 d in milk 30 d in milk BCS high 4.6 4.2 3.4
Milk production, kg/d 0.6161 2.22 1.22 BCS medium 3.8 3.5 3.2
Milk production, kg/d 0.2941 2.56 2.48 1Colostrum 3 h after birth.
It is well known that too fast body reserve mobilization during pregnancy can induce ketosis in the ewes, a serious and often deadly metabolic disorder caused by the accumulation of ketone bodies (β-OH butyrate, acetoacetate, acetone) in the blood. Ketone bodies are directly produced by the mobilized fat when the mobilization is too fast and there is a shortage of glucose in the blood. In ewes this disorder usually occurs more frequently in late pregnancy, and in ewes with twins and triplets compared to ewes with singles so it is also sometimes known as “twin lambs
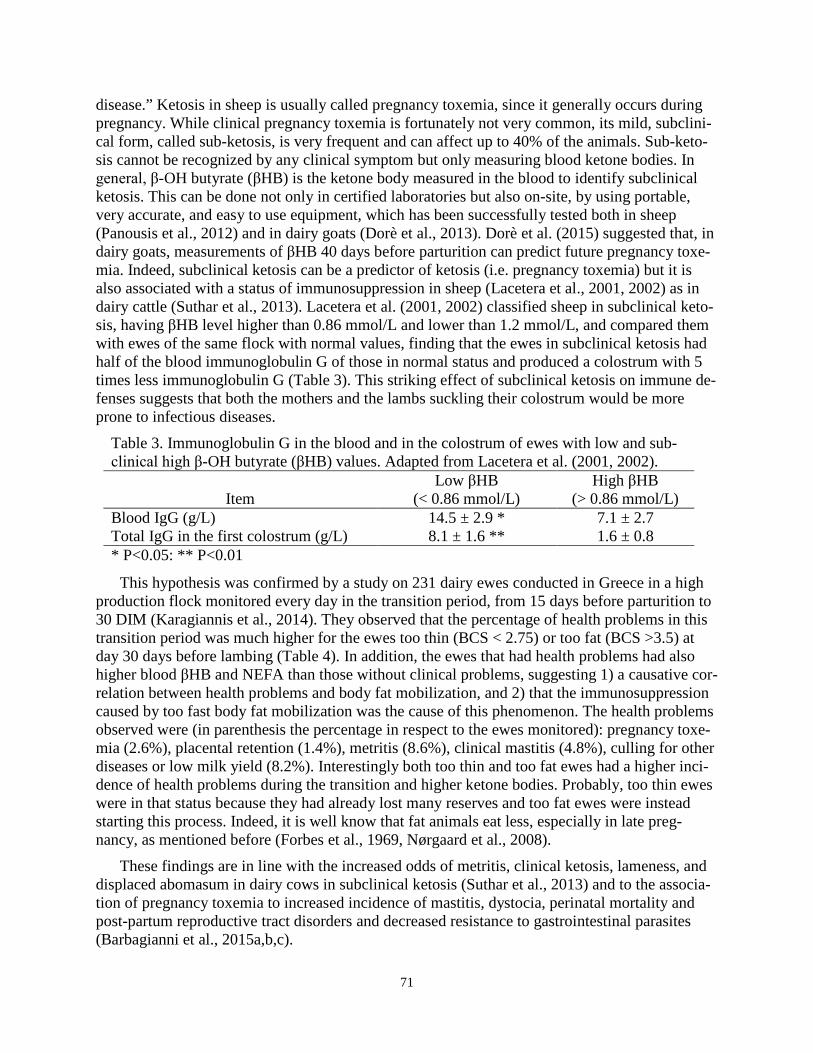
71
disease.” Ketosis in sheep is usually called pregnancy toxemia, since it generally occurs during pregnancy. While clinical pregnancy toxemia is fortunately not very common, its mild, subclini-cal form, called sub-ketosis, is very frequent and can affect up to 40% of the animals. Sub-keto-sis cannot be recognized by any clinical symptom but only measuring blood ketone bodies. In general, β-OH butyrate (βHB) is the ketone body measured in the blood to identify subclinical ketosis. This can be done not only in certified laboratories but also on-site, by using portable, very accurate, and easy to use equipment, which has been successfully tested both in sheep (Panousis et al., 2012) and in dairy goats (Dorè et al., 2013). Dorè et al. (2015) suggested that, in dairy goats, measurements of βHB 40 days before parturition can predict future pregnancy toxe-mia. Indeed, subclinical ketosis can be a predictor of ketosis (i.e. pregnancy toxemia) but it is also associated with a status of immunosuppression in sheep (Lacetera et al., 2001, 2002) as in dairy cattle (Suthar et al., 2013). Lacetera et al. (2001, 2002) classified sheep in subclinical keto-sis, having βHB level higher than 0.86 mmol/L and lower than 1.2 mmol/L, and compared them with ewes of the same flock with normal values, finding that the ewes in subclinical ketosis had half of the blood immunoglobulin G of those in normal status and produced a colostrum with 5 times less immunoglobulin G (Table 3). This striking effect of subclinical ketosis on immune de-fenses suggests that both the mothers and the lambs suckling their colostrum would be more prone to infectious diseases.
Table 3. Immunoglobulin G in the blood and in the colostrum of ewes with low and sub-clinical high β-OH butyrate (βHB) values. Adapted from Lacetera et al. (2001, 2002).
Item Low βHB
(< 0.86 mmol/L) High βHB
(> 0.86 mmol/L) Blood IgG (g/L) 14.5 ± 2.9 * 7.1 ± 2.7 Total IgG in the first colostrum (g/L) 8.1 ± 1.6 ** 1.6 ± 0.8 * P<0.05: ** P<0.01
This hypothesis was confirmed by a study on 231 dairy ewes conducted in Greece in a high production flock monitored every day in the transition period, from 15 days before parturition to 30 DIM (Karagiannis et al., 2014). They observed that the percentage of health problems in this transition period was much higher for the ewes too thin (BCS < 2.75) or too fat (BCS >3.5) at day 30 days before lambing (Table 4). In addition, the ewes that had health problems had also higher blood βHB and NEFA than those without clinical problems, suggesting 1) a causative cor-relation between health problems and body fat mobilization, and 2) that the immunosuppression caused by too fast body fat mobilization was the cause of this phenomenon. The health problems observed were (in parenthesis the percentage in respect to the ewes monitored): pregnancy toxe-mia (2.6%), placental retention (1.4%), metritis (8.6%), clinical mastitis (4.8%), culling for other diseases or low milk yield (8.2%). Interestingly both too thin and too fat ewes had a higher inci-dence of health problems during the transition and higher ketone bodies. Probably, too thin ewes were in that status because they had already lost many reserves and too fat ewes were instead starting this process. Indeed, it is well know that fat animals eat less, especially in late preg-nancy, as mentioned before (Forbes et al., 1969, Nørgaard et al., 2008).
These findings are in line with the increased odds of metritis, clinical ketosis, lameness, and displaced abomasum in dairy cows in subclinical ketosis (Suthar et al., 2013) and to the associa-tion of pregnancy toxemia to increased incidence of mastitis, dystocia, perinatal mortality and post-partum reproductive tract disorders and decreased resistance to gastrointestinal parasites (Barbagianni et al., 2015a,b,c).
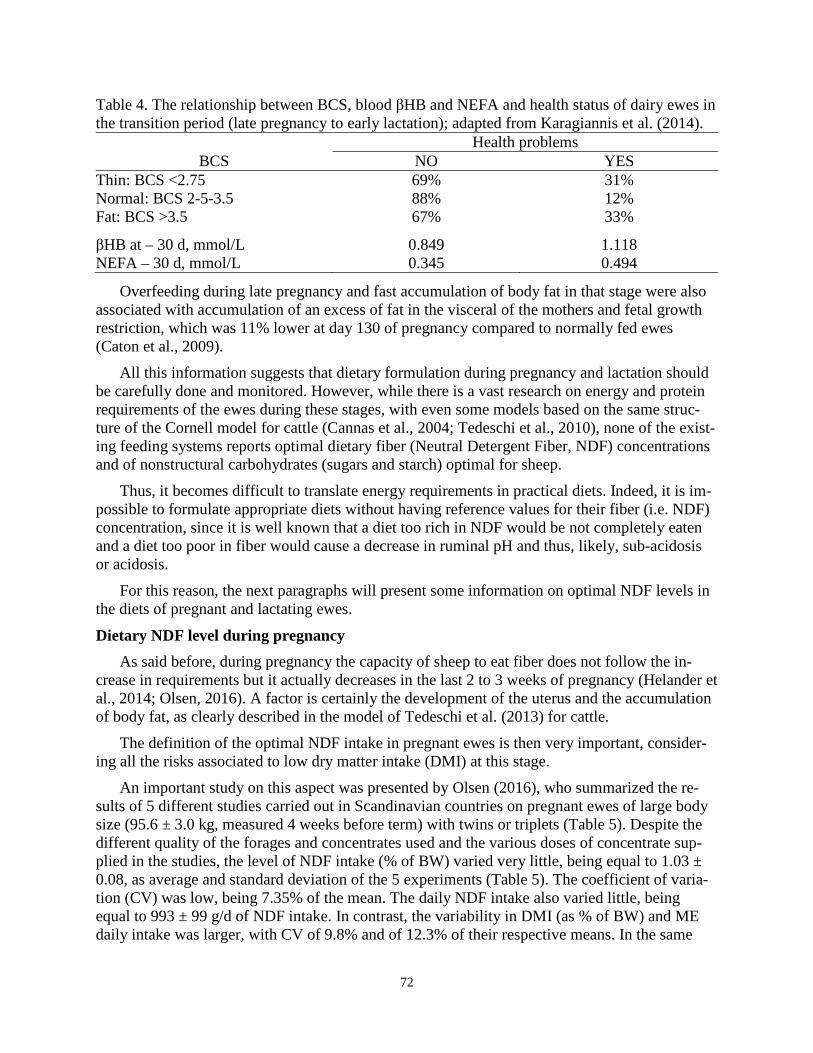
72
Table 4. The relationship between BCS, blood βHB and NEFA and health status of dairy ewes in the transition period (late pregnancy to early lactation); adapted from Karagiannis et al. (2014).
Health problems BCS NO YES
Thin: BCS <2.75 69% 31% Normal: BCS 2-5-3.5 88% 12% Fat: BCS >3.5 67% 33% βHB at – 30 d, mmol/L 0.849 1.118 NEFA – 30 d, mmol/L 0.345 0.494
Overfeeding during late pregnancy and fast accumulation of body fat in that stage were also associated with accumulation of an excess of fat in the visceral of the mothers and fetal growth restriction, which was 11% lower at day 130 of pregnancy compared to normally fed ewes (Caton et al., 2009).
All this information suggests that dietary formulation during pregnancy and lactation should be carefully done and monitored. However, while there is a vast research on energy and protein requirements of the ewes during these stages, with even some models based on the same struc-ture of the Cornell model for cattle (Cannas et al., 2004; Tedeschi et al., 2010), none of the exist-ing feeding systems reports optimal dietary fiber (Neutral Detergent Fiber, NDF) concentrations and of nonstructural carbohydrates (sugars and starch) optimal for sheep.
Thus, it becomes difficult to translate energy requirements in practical diets. Indeed, it is im-possible to formulate appropriate diets without having reference values for their fiber (i.e. NDF) concentration, since it is well known that a diet too rich in NDF would be not completely eaten and a diet too poor in fiber would cause a decrease in ruminal pH and thus, likely, sub-acidosis or acidosis.
For this reason, the next paragraphs will present some information on optimal NDF levels in the diets of pregnant and lactating ewes.
Dietary NDF level during pregnancy As said before, during pregnancy the capacity of sheep to eat fiber does not follow the in-
crease in requirements but it actually decreases in the last 2 to 3 weeks of pregnancy (Helander et al., 2014; Olsen, 2016). A factor is certainly the development of the uterus and the accumulation of body fat, as clearly described in the model of Tedeschi et al. (2013) for cattle.
The definition of the optimal NDF intake in pregnant ewes is then very important, consider-ing all the risks associated to low dry matter intake (DMI) at this stage.
An important study on this aspect was presented by Olsen (2016), who summarized the re-sults of 5 different studies carried out in Scandinavian countries on pregnant ewes of large body size (95.6 ± 3.0 kg, measured 4 weeks before term) with twins or triplets (Table 5). Despite the different quality of the forages and concentrates used and the various doses of concentrate sup-plied in the studies, the level of NDF intake (% of BW) varied very little, being equal to 1.03 ± 0.08, as average and standard deviation of the 5 experiments (Table 5). The coefficient of varia-tion (CV) was low, being 7.35% of the mean. The daily NDF intake also varied little, being equal to 993 ± 99 g/d of NDF intake. In contrast, the variability in DMI (as % of BW) and ME daily intake was larger, with CV of 9.8% and of 12.3% of their respective means. In the same
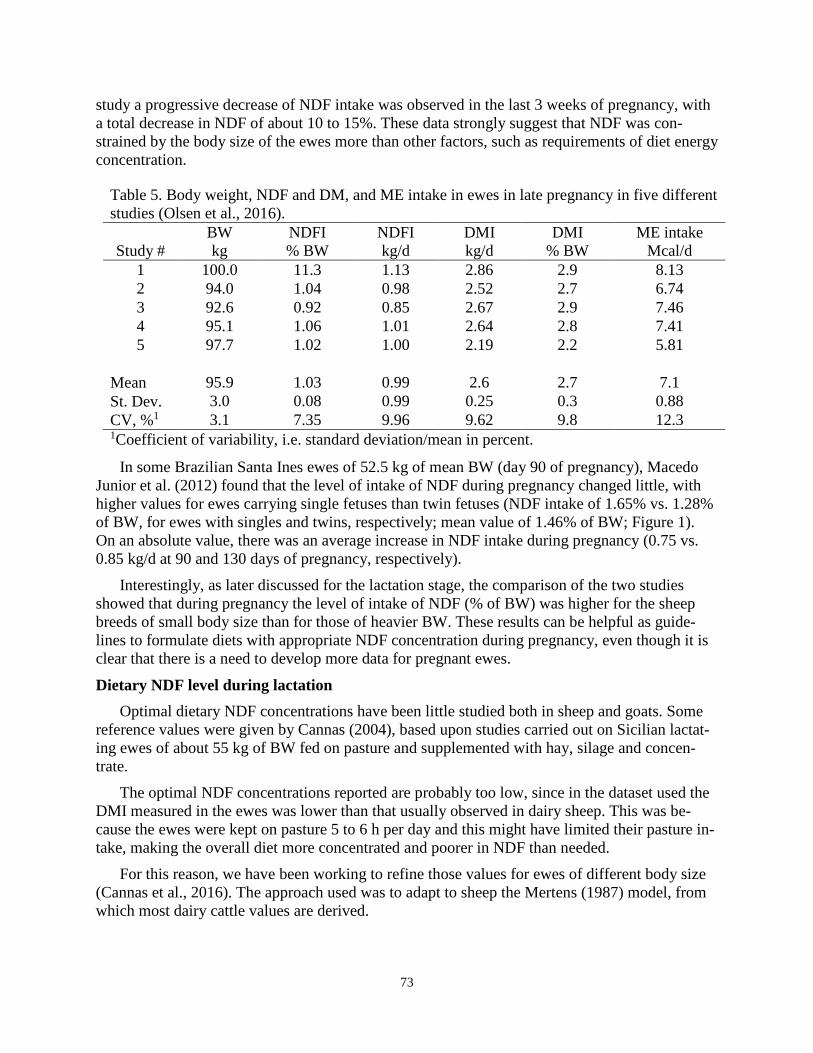
73
study a progressive decrease of NDF intake was observed in the last 3 weeks of pregnancy, with a total decrease in NDF of about 10 to 15%. These data strongly suggest that NDF was con-strained by the body size of the ewes more than other factors, such as requirements of diet energy concentration.
In some Brazilian Santa Ines ewes of 52.5 kg of mean BW (day 90 of pregnancy), Macedo Junior et al. (2012) found that the level of intake of NDF during pregnancy changed little, with higher values for ewes carrying single fetuses than twin fetuses (NDF intake of 1.65% vs. 1.28% of BW, for ewes with singles and twins, respectively; mean value of 1.46% of BW; Figure 1). On an absolute value, there was an average increase in NDF intake during pregnancy (0.75 vs. 0.85 kg/d at 90 and 130 days of pregnancy, respectively).
Interestingly, as later discussed for the lactation stage, the comparison of the two studies showed that during pregnancy the level of intake of NDF (% of BW) was higher for the sheep breeds of small body size than for those of heavier BW. These results can be helpful as guide-lines to formulate diets with appropriate NDF concentration during pregnancy, even though it is clear that there is a need to develop more data for pregnant ewes.
Dietary NDF level during lactation Optimal dietary NDF concentrations have been little studied both in sheep and goats. Some
reference values were given by Cannas (2004), based upon studies carried out on Sicilian lactat-ing ewes of about 55 kg of BW fed on pasture and supplemented with hay, silage and concen-trate.
The optimal NDF concentrations reported are probably too low, since in the dataset used the DMI measured in the ewes was lower than that usually observed in dairy sheep. This was be-cause the ewes were kept on pasture 5 to 6 h per day and this might have limited their pasture in-take, making the overall diet more concentrated and poorer in NDF than needed.
For this reason, we have been working to refine those values for ewes of different body size (Cannas et al., 2016). The approach used was to adapt to sheep the Mertens (1987) model, from which most dairy cattle values are derived.
Table 5. Body weight, NDF and DM, and ME intake in ewes in late pregnancy in five different studies (Olsen et al., 2016).
Study # BW kg
NDFI % BW
NDFI kg/d
DMI kg/d
DMI % BW
ME intake Mcal/d
1 100.0 11.3 1.13 2.86 2.9 8.13 2 94.0 1.04 0.98 2.52 2.7 6.74 3 92.6 0.92 0.85 2.67 2.9 7.46 4 95.1 1.06 1.01 2.64 2.8 7.41 5 97.7 1.02 1.00 2.19 2.2 5.81
Mean 95.9 1.03 0.99 2.6 2.7 7.1 St. Dev. 3.0 0.08 0.99 0.25 0.3 0.88 CV, %1 3.1 7.35 9.96 9.62 9.8 12.3 1Coefficient of variability, i.e. standard deviation/mean in percent.
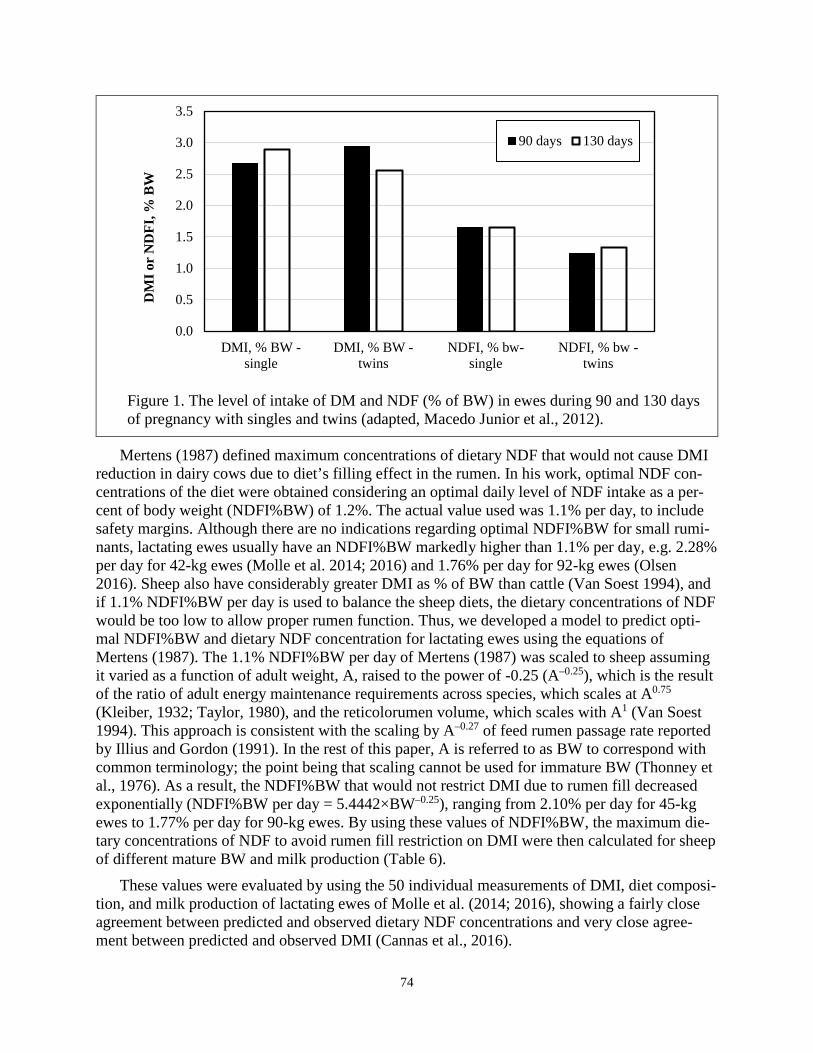
74
Figure 1. The level of intake of DM and NDF (% of BW) in ewes during 90 and 130 days of pregnancy with singles and twins (adapted, Macedo Junior et al., 2012).
Mertens (1987) defined maximum concentrations of dietary NDF that would not cause DMI reduction in dairy cows due to diet’s filling effect in the rumen. In his work, optimal NDF con-centrations of the diet were obtained considering an optimal daily level of NDF intake as a per-cent of body weight (NDFI%BW) of 1.2%. The actual value used was 1.1% per day, to include safety margins. Although there are no indications regarding optimal NDFI%BW for small rumi-nants, lactating ewes usually have an NDFI%BW markedly higher than 1.1% per day, e.g. 2.28% per day for 42-kg ewes (Molle et al. 2014; 2016) and 1.76% per day for 92-kg ewes (Olsen 2016). Sheep also have considerably greater DMI as % of BW than cattle (Van Soest 1994), and if 1.1% NDFI%BW per day is used to balance the sheep diets, the dietary concentrations of NDF would be too low to allow proper rumen function. Thus, we developed a model to predict opti-mal NDFI%BW and dietary NDF concentration for lactating ewes using the equations of Mertens (1987). The 1.1% NDFI%BW per day of Mertens (1987) was scaled to sheep assuming it varied as a function of adult weight, A, raised to the power of -0.25 (A–0.25), which is the result of the ratio of adult energy maintenance requirements across species, which scales at A0.75 (Kleiber, 1932; Taylor, 1980), and the reticolorumen volume, which scales with A1 (Van Soest 1994). This approach is consistent with the scaling by A–0.27 of feed rumen passage rate reported by Illius and Gordon (1991). In the rest of this paper, A is referred to as BW to correspond with common terminology; the point being that scaling cannot be used for immature BW (Thonney et al., 1976). As a result, the NDFI%BW that would not restrict DMI due to rumen fill decreased exponentially (NDFI%BW per day = 5.4442×BW–0.25), ranging from 2.10% per day for 45-kg ewes to 1.77% per day for 90-kg ewes. By using these values of NDFI%BW, the maximum die-tary concentrations of NDF to avoid rumen fill restriction on DMI were then calculated for sheep of different mature BW and milk production (Table 6).
These values were evaluated by using the 50 individual measurements of DMI, diet composi-tion, and milk production of lactating ewes of Molle et al. (2014; 2016), showing a fairly close agreement between predicted and observed dietary NDF concentrations and very close agree-ment between predicted and observed DMI (Cannas et al., 2016).
0.0
0.5
1.0
1.5
2.0
2.5
3.0
3.5
DMI, % BW -single
DMI, % BW -twins
NDFI, % bw-single
NDFI, % bw -twins
DM
I or
ND
FI, %
BW
90 days 130 days
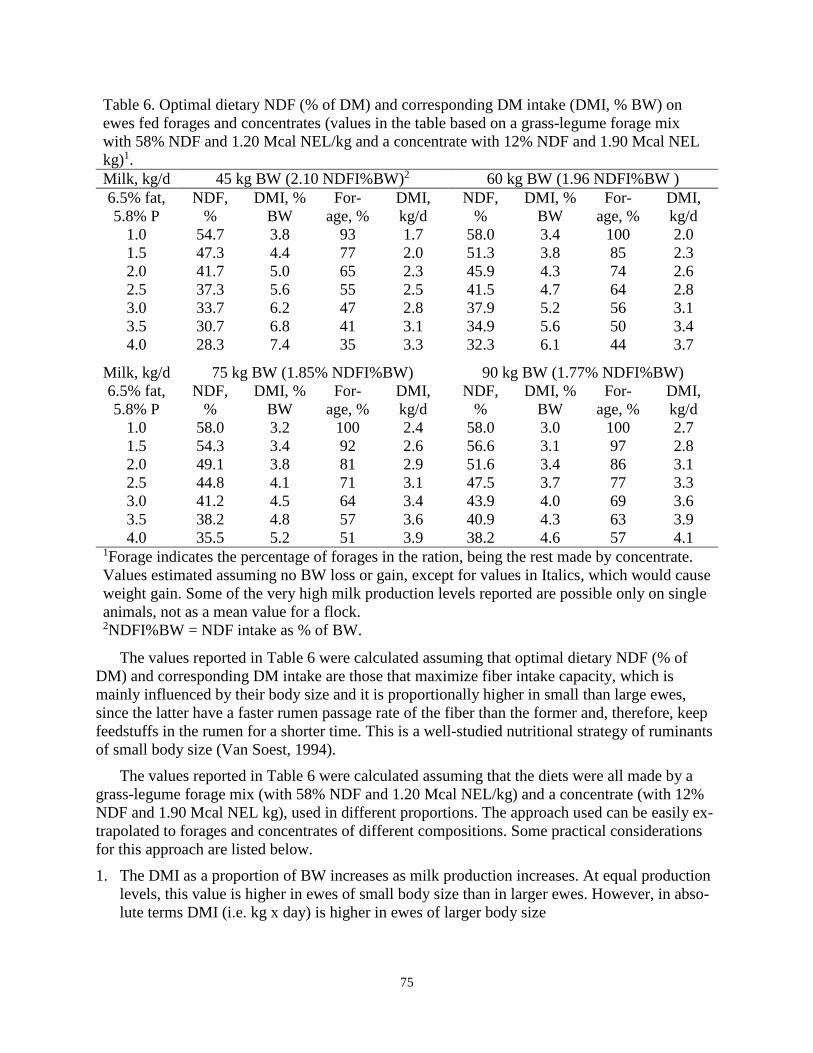
75
Table 6. Optimal dietary NDF (% of DM) and corresponding DM intake (DMI, % BW) on ewes fed forages and concentrates (values in the table based on a grass-legume forage mix with 58% NDF and 1.20 Mcal NEL/kg and a concentrate with 12% NDF and 1.90 Mcal NEL kg)1. Milk, kg/d 45 kg BW (2.10 NDFI%BW)2 60 kg BW (1.96 NDFI%BW ) 6.5% fat, 5.8% P
NDF, %
DMI, % BW
For-age, %
DMI, kg/d
NDF, %
DMI, % BW
For-age, %
DMI, kg/d
1.0 54.7 3.8 93 1.7 58.0 3.4 100 2.0 1.5 47.3 4.4 77 2.0 51.3 3.8 85 2.3 2.0 41.7 5.0 65 2.3 45.9 4.3 74 2.6 2.5 37.3 5.6 55 2.5 41.5 4.7 64 2.8 3.0 33.7 6.2 47 2.8 37.9 5.2 56 3.1 3.5 30.7 6.8 41 3.1 34.9 5.6 50 3.4 4.0 28.3 7.4 35 3.3 32.3 6.1 44 3.7
Milk, kg/d 75 kg BW (1.85% NDFI%BW) 90 kg BW (1.77% NDFI%BW) 6.5% fat, 5.8% P
NDF, %
DMI, % BW
For-age, %
DMI, kg/d
NDF, %
DMI, % BW
For-age, %
DMI, kg/d
1.0 58.0 3.2 100 2.4 58.0 3.0 100 2.7 1.5 54.3 3.4 92 2.6 56.6 3.1 97 2.8 2.0 49.1 3.8 81 2.9 51.6 3.4 86 3.1 2.5 44.8 4.1 71 3.1 47.5 3.7 77 3.3 3.0 41.2 4.5 64 3.4 43.9 4.0 69 3.6 3.5 38.2 4.8 57 3.6 40.9 4.3 63 3.9 4.0 35.5 5.2 51 3.9 38.2 4.6 57 4.1
1Forage indicates the percentage of forages in the ration, being the rest made by concentrate. Values estimated assuming no BW loss or gain, except for values in Italics, which would cause weight gain. Some of the very high milk production levels reported are possible only on single animals, not as a mean value for a flock. 2NDFI%BW = NDF intake as % of BW.
The values reported in Table 6 were calculated assuming that optimal dietary NDF (% of DM) and corresponding DM intake are those that maximize fiber intake capacity, which is mainly influenced by their body size and it is proportionally higher in small than large ewes, since the latter have a faster rumen passage rate of the fiber than the former and, therefore, keep feedstuffs in the rumen for a shorter time. This is a well-studied nutritional strategy of ruminants of small body size (Van Soest, 1994).
The values reported in Table 6 were calculated assuming that the diets were all made by a grass-legume forage mix (with 58% NDF and 1.20 Mcal NEL/kg) and a concentrate (with 12% NDF and 1.90 Mcal NEL kg), used in different proportions. The approach used can be easily ex-trapolated to forages and concentrates of different compositions. Some practical considerations for this approach are listed below. 1. The DMI as a proportion of BW increases as milk production increases. At equal production
levels, this value is higher in ewes of small body size than in larger ewes. However, in abso-lute terms DMI (i.e. kg x day) is higher in ewes of larger body size
76
2. Optimal dietary NDF decreases as milk production increases. At equal production levels, this value is higher in large than in small ewes. Thus, large ewes can use a higher proportion of forage in the diet at equal production levels. For ewes of small body size, at the very high production level the percentage of the forage in the diet can be so low to pose risks of rumen acidosis. In this case, part of the starchy concentrates should be substituted by sources of very digestible fiber and pectins, such as beet pulp or soyhulls. Dietary NDF concentration would increase above the values suggested in Table 6 but probably DMI would increase as well, with beneficial effects on rumen health and milk production (Araujo et al., 2008).
3. The NDF values of Table 6 are in part affected by the quality of the forage. With forages of better quality (lower NDF content and higher NEL concentration) than those used to develop the table, a larger proportion of the diet can be made by forages, thus fewer concentrates are needed. The contrary occurs for low quality forages.
The approach used to develop these reference NDF values did not consider the effects of the quality of NDF, in terms of its content of fermentable fiber and lignin. Future developments will consider the quality of NDF as a factor to be accounted for. The important issue of the proportion of fermentable and indigestible NDF in the diet will be covered in more details in next para-graph.
Effect of Fermentable NDF on Feed Intake Details about the effect of the proportion of dietary potentially-fermentable fiber (pfNDF; di-
gestible NDF as a proportion of dietary dry matter) on expected maintenance of rumen function and its positive relationship to feed intake were presented at the 20th DSANA Symposium (Thonney, 2014). The briefest version can be summarized in one short sentence: “Ruminants need fermentable fiber.” Surprisingly, this seems to be a mystery to many ruminant nutritionists. The longer short version is: 1) that ruminant species developed on diets composed primarily of fiber; 2) that only the fiber that can be fermented by bacteria and protozoa in the rumen or lower gut is important in sheep nutrition; 3) that the main end products of NDF fermentation (volatile fatty acids or VFAs; primarily acetic acid, propionic acid, and butyric acid) help to maintain ru-minal function, are absorbed directly across the rumen wall, and serve as the primary substrates for glucose and fatty acids needed for metabolism; 4) that too high a proportion of dietary indi-gestible NDF limits feed intake; while 5) feed intake continuously increases as dietary pfNDF increases. Thus, optimizing the dietary concentration of pfNDF will increase feed intake and minimize nutritional challenges during late pregnancy and early lactation.
The proportion of NDF that is digestible varies with the digestibility of specific feed ingredi-ents and declines with the faster rate of passage associated with higher levels of feed intake. Therefore, instead of total dietary NDF, diets should be balanced on pfNDF, where pfNDF is stated in concentration units determined at 1× maintenance levels of intake. pfNDF at 1× mainte-nance levels of intake can be calculated easily from the numerous values for digestibility of feed ingredients (dry matter digestibility, DMD) determined over the last 150 years at maintenance levels of intake.
The calculation of pfNDF is: Eq 1: Indigestible dry matter: 1 – DMD Eq 2: Indigestible NDF (INDF): Results from Eq 1 – metabolic fecal losses
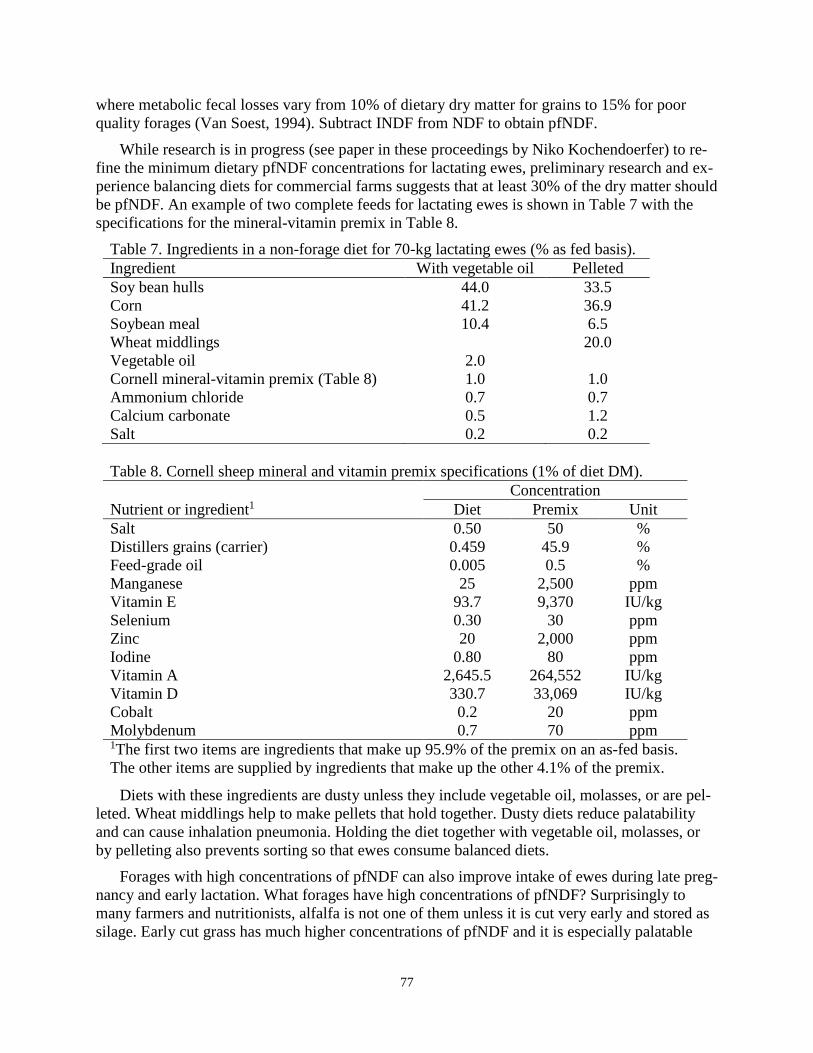
77
where metabolic fecal losses vary from 10% of dietary dry matter for grains to 15% for poor quality forages (Van Soest, 1994). Subtract INDF from NDF to obtain pfNDF.
While research is in progress (see paper in these proceedings by Niko Kochendoerfer) to re-fine the minimum dietary pfNDF concentrations for lactating ewes, preliminary research and ex-perience balancing diets for commercial farms suggests that at least 30% of the dry matter should be pfNDF. An example of two complete feeds for lactating ewes is shown in Table 7 with the specifications for the mineral-vitamin premix in Table 8.
Table 7. Ingredients in a non-forage diet for 70-kg lactating ewes (% as fed basis). Ingredient With vegetable oil Pelleted Soy bean hulls 44.0 33.5 Corn 41.2 36.9 Soybean meal 10.4 6.5 Wheat middlings 20.0 Vegetable oil 2.0 Cornell mineral-vitamin premix (Table 8) 1.0 1.0 Ammonium chloride 0.7 0.7 Calcium carbonate 0.5 1.2 Salt 0.2 0.2
Table 8. Cornell sheep mineral and vitamin premix specifications (1% of diet DM).
Concentration Nutrient or ingredient1 Diet Premix Unit Salt 0.50 50 % Distillers grains (carrier) 0.459 45.9 % Feed-grade oil 0.005 0.5 % Manganese 25 2,500 ppm Vitamin E 93.7 9,370 IU/kg Selenium 0.30 30 ppm Zinc 20 2,000 ppm Iodine 0.80 80 ppm Vitamin A 2,645.5 264,552 IU/kg Vitamin D 330.7 33,069 IU/kg Cobalt 0.2 20 ppm Molybdenum 0.7 70 ppm 1The first two items are ingredients that make up 95.9% of the premix on an as-fed basis. The other items are supplied by ingredients that make up the other 4.1% of the premix.
Diets with these ingredients are dusty unless they include vegetable oil, molasses, or are pel-leted. Wheat middlings help to make pellets that hold together. Dusty diets reduce palatability and can cause inhalation pneumonia. Holding the diet together with vegetable oil, molasses, or by pelleting also prevents sorting so that ewes consume balanced diets.
Forages with high concentrations of pfNDF can also improve intake of ewes during late preg-nancy and early lactation. What forages have high concentrations of pfNDF? Surprisingly to many farmers and nutritionists, alfalfa is not one of them unless it is cut very early and stored as silage. Early cut grass has much higher concentrations of pfNDF and it is especially palatable
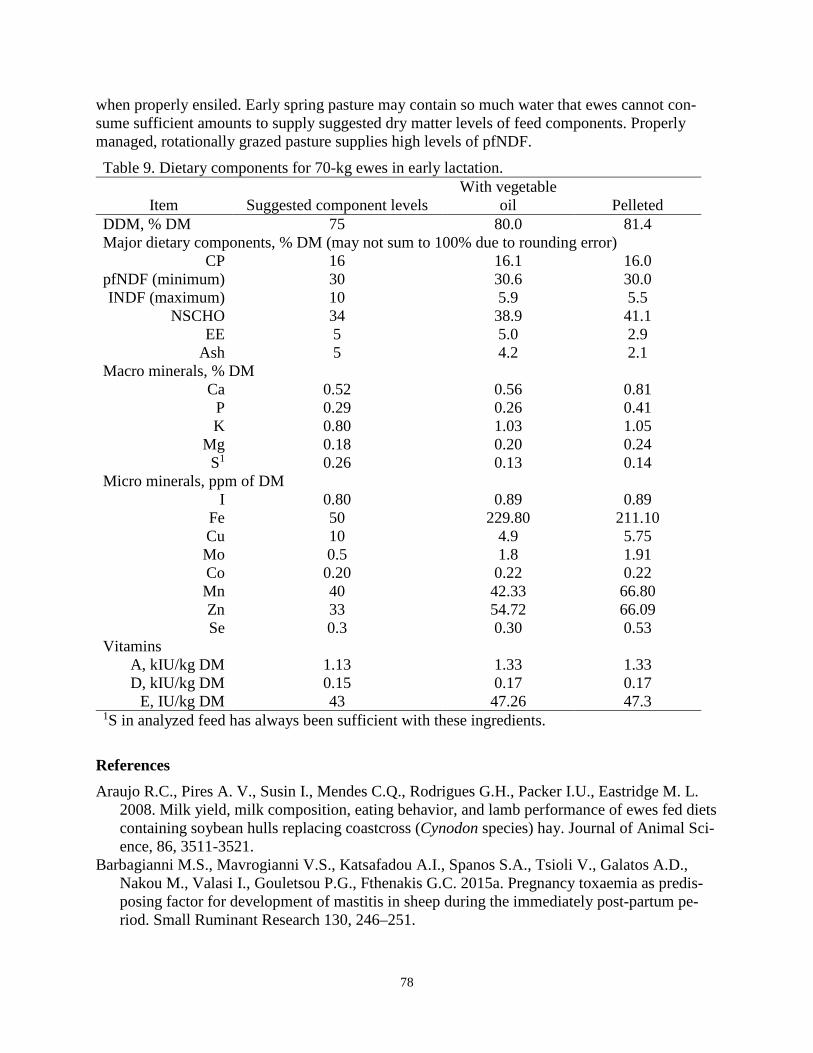
78
when properly ensiled. Early spring pasture may contain so much water that ewes cannot con-sume sufficient amounts to supply suggested dry matter levels of feed components. Properly managed, rotationally grazed pasture supplies high levels of pfNDF. Table 9. Dietary components for 70-kg ewes in early lactation.
Item Suggested component levels With vegetable
oil Pelleted DDM, % DM 75 80.0 81.4 Major dietary components, % DM (may not sum to 100% due to rounding error)
CP 16 16.1 16.0 pfNDF (minimum) 30 30.6 30.0 INDF (maximum) 10 5.9 5.5
NSCHO 34 38.9 41.1 EE 5 5.0 2.9
Ash 5 4.2 2.1 Macro minerals, % DM
Ca 0.52 0.56 0.81 P 0.29 0.26 0.41 K 0.80 1.03 1.05
Mg 0.18 0.20 0.24 S1 0.26 0.13 0.14
Micro minerals, ppm of DM I 0.80 0.89 0.89
Fe 50 229.80 211.10 Cu 10 4.9 5.75 Mo 0.5 1.8 1.91 Co 0.20 0.22 0.22 Mn 40 42.33 66.80 Zn 33 54.72 66.09 Se 0.3 0.30 0.53
Vitamins A, kIU/kg DM 1.13 1.33 1.33 D, kIU/kg DM 0.15 0.17 0.17
E, IU/kg DM 43 47.26 47.3 1S in analyzed feed has always been sufficient with these ingredients.
References Araujo R.C., Pires A. V., Susin I., Mendes C.Q., Rodrigues G.H., Packer I.U., Eastridge M. L.
2008. Milk yield, milk composition, eating behavior, and lamb performance of ewes fed diets containing soybean hulls replacing coastcross (Cynodon species) hay. Journal of Animal Sci-ence, 86, 3511-3521.
Barbagianni M.S., Mavrogianni V.S., Katsafadou A.I., Spanos S.A., Tsioli V., Galatos A.D., Nakou M., Valasi I., Gouletsou P.G., Fthenakis G.C. 2015a. Pregnancy toxaemia as predis-posing factor for development of mastitis in sheep during the immediately post-partum pe-riod. Small Ruminant Research 130, 246–251.

79
Barbagianni M.S., Giannenas E., Papadopoulos E., Petridis I.G., Spanos S.A., Gouletsou P.G., Valasi I., Fthenakis G.C. 2015b. Pregnancy toxaemia in ewes: development of an experi-mental model and potential interactions with gastrointestinal nematode infections. Small Ru-minant Research, 133, 102–107.
Barbagianni M.S., Spanos S.A., Ioannidi K.S., Vasileiou N.G.C., Katsafadou A.I., Valasi I., Gouletsou P.G., Fthenakis G.C. 2015c. Increased incidence of peri-parturient problems in ewes with pregnancy toxaemia. Small Ruminant Research, 132, 111–114.
Cannas A. 2004. Feeding of lactating ewes. In: Pulina G. (Ed.), Dairy sheep nutrition. CAB In-ternational, Wallingford, Oxon, UK, pp. 79-108.
Cannas A., Nudda A., Pulina G. 2002. Nutritional strategies to improve lactation persistency in dairy ewes. Proceedings of the 8th Great Lakes Dairy Sheep Symposium, Cornell University, Ithaca, NY, USA, 17-59.
Cannas A., Tedeschi L.O., Fox D.G., Pell A.N., Van Soest P.J. 2004. A mechanistic model to predict nutrient requirements and feed biological values for sheep. Journal of Animal Sci-ence, 82, 149-169.
Cannas A., Tedeschi L.O., Molle G., Atzori A.S., Dimauro C., Lunesu M.F. 2016. Prediction of optimal NDF intake in sheep. Canadian Journal of Animal Science, 96, 628-629.
Caton J.S., Reed J.J., Aitken R.P, Milne J.S., Borowicz P.P., Reynolds L.P., Redmer D.A. Wal-lace J.M. 2009. Effects of maternal nutrition and stage of gestation on body weight, visceral organ mass, and indices of jejunal cellularity, proliferation, and vascularity in pregnant ewe lambs. 87:222-235.
Doré V., Dubuc J., Bélanger A.M., Buczinski S. 2013. Short communication: Evaluation of the accuracy of an electronic on-farm test to quantify blood β-hydroxybutyrate concentration in dairy goats. Journal of Dairy Science, 96, 4505–4507.
Doré V., Dubuc J., Bélanger A.M., Buczinski S. 2015. Definition of prepartum hyperketonemia in dairy goats. Journal of Dairy Science, 98, 4535–4543.
Forbes J. M. 1969. The effect of pregnancy and fatness on the volume of rumen contents in the ewe. The Journal of Agricultural Science, 72, 119-121.
Illius, A. W., and Gordon, I. J. 1991. Prediction of intake and digestion in ruminants by a model of rumen kinetics integrating animal size and plant characteristics. J. agric. Sci., Camb. 116: 145-57.
Karagiannis I., Panousis N., Kiossis E., Tsakmakidis I., Lafi S., Arsenos G., Boscos C., Brozos Ch.2014. Associations of pre-lambing body condition score and serum β-hydroxybutyric acid and non-esterified fatty acids concentrations with periparturient health of Chios dairy ewes. Small Ruminant Research, 120, 164-173
Kleiber, M. 1932. Body size and metabolism. Hilgardia 6: 315. Lacetera N., Bernabucci U., Ronchi B., Nardone A. 2001. Effect of subclinical pregnancy toxe-
mia on immune responses in sheep. American Journal of Veterinary Research, 62, 1020-1024 Lacetera N., Franci N., Scalia D., Bernabucci U., Ronchi B., Nardone A. 2002. Effects on func-
tions of ovine blood mononuclear cells for each of several fatty acids at concentrations found in plasma of healthy and ketotic ewes. American Journal of Veterinary Research 63:7, 958-962.
Macedo Junior G.D.L., Benevides Y.I., Campos W.E., Borges I., Rodriguez N.M., Ferreira D.A. 2012. Nutrient intake and digestibility and ruminal rate passage in pregnant ewes. Ciência Animal Brasileira, 13, 429-439.
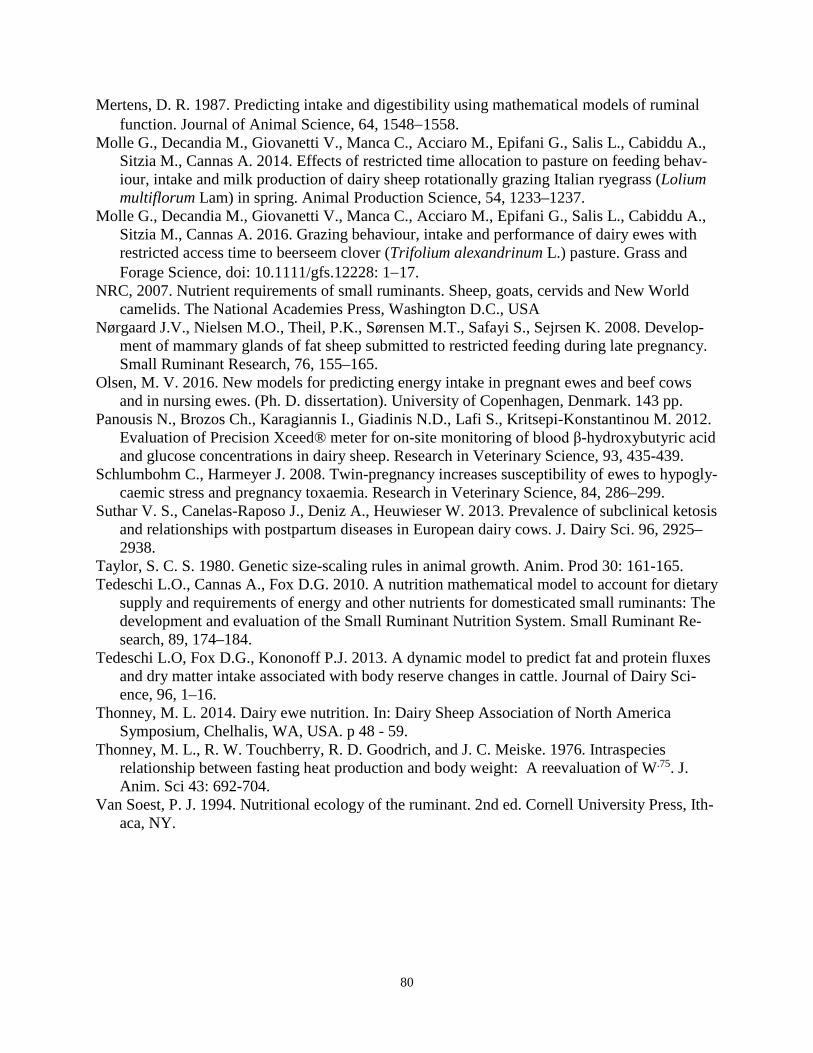
80
Mertens, D. R. 1987. Predicting intake and digestibility using mathematical models of ruminal function. Journal of Animal Science, 64, 1548−1558.
Molle G., Decandia M., Giovanetti V., Manca C., Acciaro M., Epifani G., Salis L., Cabiddu A., Sitzia M., Cannas A. 2014. Effects of restricted time allocation to pasture on feeding behav-iour, intake and milk production of dairy sheep rotationally grazing Italian ryegrass (Lolium multiflorum Lam) in spring. Animal Production Science, 54, 1233–1237.
Molle G., Decandia M., Giovanetti V., Manca C., Acciaro M., Epifani G., Salis L., Cabiddu A., Sitzia M., Cannas A. 2016. Grazing behaviour, intake and performance of dairy ewes with restricted access time to beerseem clover (Trifolium alexandrinum L.) pasture. Grass and Forage Science, doi: 10.1111/gfs.12228: 1−17.
NRC, 2007. Nutrient requirements of small ruminants. Sheep, goats, cervids and New World camelids. The National Academies Press, Washington D.C., USA
Nørgaard J.V., Nielsen M.O., Theil, P.K., Sørensen M.T., Safayi S., Sejrsen K. 2008. Develop-ment of mammary glands of fat sheep submitted to restricted feeding during late pregnancy. Small Ruminant Research, 76, 155–165.
Olsen, M. V. 2016. New models for predicting energy intake in pregnant ewes and beef cows and in nursing ewes. (Ph. D. dissertation). University of Copenhagen, Denmark. 143 pp.
Panousis N., Brozos Ch., Karagiannis I., Giadinis N.D., Lafi S., Kritsepi-Konstantinou M. 2012. Evaluation of Precision Xceed® meter for on-site monitoring of blood β-hydroxybutyric acid and glucose concentrations in dairy sheep. Research in Veterinary Science, 93, 435-439.
Schlumbohm C., Harmeyer J. 2008. Twin-pregnancy increases susceptibility of ewes to hypogly-caemic stress and pregnancy toxaemia. Research in Veterinary Science, 84, 286–299.
Suthar V. S., Canelas-Raposo J., Deniz A., Heuwieser W. 2013. Prevalence of subclinical ketosis and relationships with postpartum diseases in European dairy cows. J. Dairy Sci. 96, 2925–2938.
Taylor, S. C. S. 1980. Genetic size-scaling rules in animal growth. Anim. Prod 30: 161-165. Tedeschi L.O., Cannas A., Fox D.G. 2010. A nutrition mathematical model to account for dietary
supply and requirements of energy and other nutrients for domesticated small ruminants: The development and evaluation of the Small Ruminant Nutrition System. Small Ruminant Re-search, 89, 174–184.
Tedeschi L.O, Fox D.G., Kononoff P.J. 2013. A dynamic model to predict fat and protein fluxes and dry matter intake associated with body reserve changes in cattle. Journal of Dairy Sci-ence, 96, 1–16.
Thonney, M. L. 2014. Dairy ewe nutrition. In: Dairy Sheep Association of North America Symposium, Chelhalis, WA, USA. p 48 - 59.
Thonney, M. L., R. W. Touchberry, R. D. Goodrich, and J. C. Meiske. 1976. Intraspecies relationship between fasting heat production and body weight: A reevaluation of W.75. J. Anim. Sci 43: 692-704.
Van Soest, P. J. 1994. Nutritional ecology of the ruminant. 2nd ed. Cornell University Press, Ith-aca, NY.
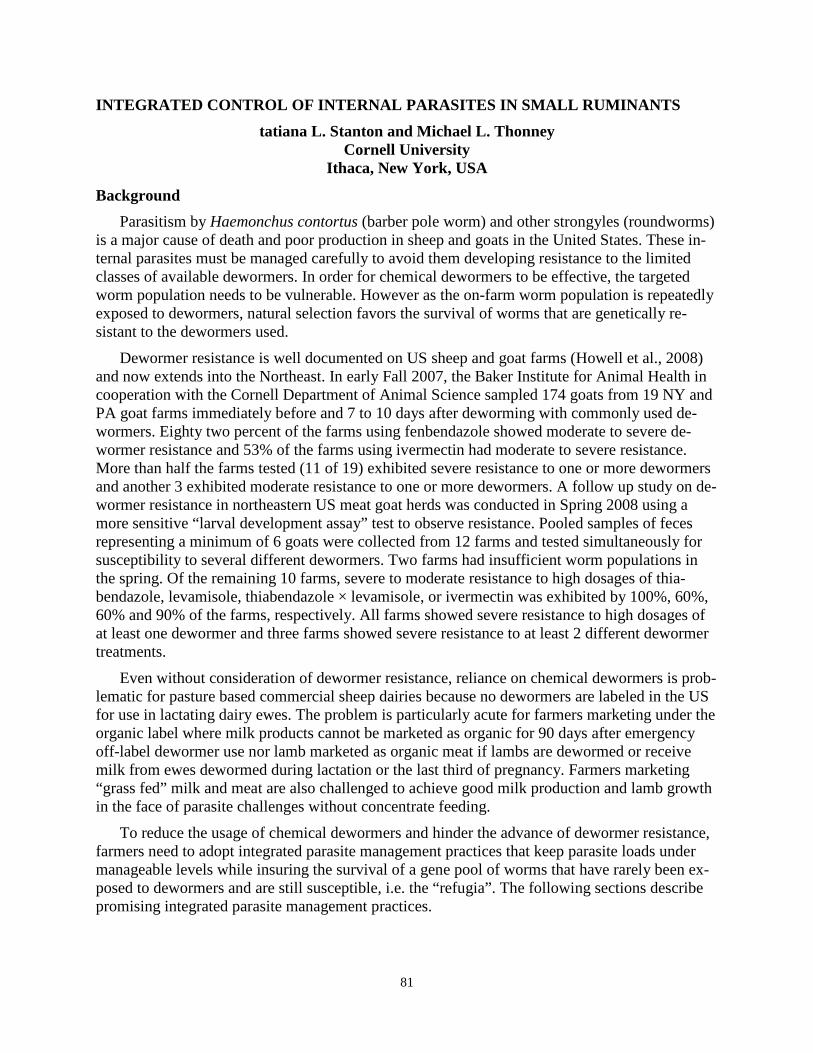
81
INTEGRATED CONTROL OF INTERNAL PARASITES IN SMALL RUMINANTS tatiana L. Stanton and Michael L. Thonney
Cornell University Ithaca, New York, USA
Background Parasitism by Haemonchus contortus (barber pole worm) and other strongyles (roundworms)
is a major cause of death and poor production in sheep and goats in the United States. These in-ternal parasites must be managed carefully to avoid them developing resistance to the limited classes of available dewormers. In order for chemical dewormers to be effective, the targeted worm population needs to be vulnerable. However as the on-farm worm population is repeatedly exposed to dewormers, natural selection favors the survival of worms that are genetically re-sistant to the dewormers used.
Dewormer resistance is well documented on US sheep and goat farms (Howell et al., 2008) and now extends into the Northeast. In early Fall 2007, the Baker Institute for Animal Health in cooperation with the Cornell Department of Animal Science sampled 174 goats from 19 NY and PA goat farms immediately before and 7 to 10 days after deworming with commonly used de-wormers. Eighty two percent of the farms using fenbendazole showed moderate to severe de-wormer resistance and 53% of the farms using ivermectin had moderate to severe resistance. More than half the farms tested (11 of 19) exhibited severe resistance to one or more dewormers and another 3 exhibited moderate resistance to one or more dewormers. A follow up study on de-wormer resistance in northeastern US meat goat herds was conducted in Spring 2008 using a more sensitive “larval development assay” test to observe resistance. Pooled samples of feces representing a minimum of 6 goats were collected from 12 farms and tested simultaneously for susceptibility to several different dewormers. Two farms had insufficient worm populations in the spring. Of the remaining 10 farms, severe to moderate resistance to high dosages of thia-bendazole, levamisole, thiabendazole × levamisole, or ivermectin was exhibited by 100%, 60%, 60% and 90% of the farms, respectively. All farms showed severe resistance to high dosages of at least one dewormer and three farms showed severe resistance to at least 2 different dewormer treatments.
Even without consideration of dewormer resistance, reliance on chemical dewormers is prob-lematic for pasture based commercial sheep dairies because no dewormers are labeled in the US for use in lactating dairy ewes. The problem is particularly acute for farmers marketing under the organic label where milk products cannot be marketed as organic for 90 days after emergency off-label dewormer use nor lamb marketed as organic meat if lambs are dewormed or receive milk from ewes dewormed during lactation or the last third of pregnancy. Farmers marketing “grass fed” milk and meat are also challenged to achieve good milk production and lamb growth in the face of parasite challenges without concentrate feeding.
To reduce the usage of chemical dewormers and hinder the advance of dewormer resistance, farmers need to adopt integrated parasite management practices that keep parasite loads under manageable levels while insuring the survival of a gene pool of worms that have rarely been ex-posed to dewormers and are still susceptible, i.e. the “refugia”. The following sections describe promising integrated parasite management practices.
82
Targeted Selective Deworming and Judicious Use of Dewormers A primary cause of dewormer resistance and destruction of a farm’s refugia is deworming the
entire flock or herd at the same time. Parasites are not equally distributed across individuals in a flock. Instead, general estimates are that approximately 20 to 30% of the flock harbors 80% of the worm load and are responsible for the buildup of worm populations in pastures over the graz-ing season. The task of targeted selective deworming is to identify and deworm only those ani-mals in need of deworming and/or shedding large amounts of eggs. Targeted selective deworm-ing (TSD) in small ruminants has been shown to prolong dewormer efficacy (Kenyon and Jack-son, 2012). Although, a farmer could implement TSD by fecal sampling their entire flock regu-larly, this is time consuming and expensive and does not identify animals with low tolerance to worms that are not shedding many eggs. Instead we generally use visual cues, sometimes in combination with production records, to identify the specific individuals requiring deworming.
One valuable tool to identify sheep or goats in need of deworming for barber pole worm (H. contortus) is using FAMACHA cards to score animals for anemia based upon the color of the membrane of the inside eyelid. Anemia is a typical sign of H. contortus infection. It is NOT an accurate indicator of infection for other important parasitic roundworms. These worms often dis-rupt the digestive system and typically result in diarrhea, weight loss and poor hair/fleece condi-tion. Therefore we often recommend a “5 point check” to monitor small ruminants to determine which individuals to deworm. The checks can be tailored to a farm’s specific parasite problems but generally include FAMACHA scoring, body condition scoring or weight monitoring, check-ing dag scores or for the presence of diarrhea, and examining animals for bottle jaws and/or other danger signs of particular parasites.
Monitoring practices help retain refugia and reduce pasture contamination only if done fre-quently enough. This is generally every two weeks during the grazing season and monthly in other seasons. However, monitoring may need to be weekly during peak parasite periods if a large number of animals are showing elevated FAMACHA scores. If the worm problem is al-lowed to persist too long then a large percentage of the flock will need deworming simultane-ously, defeating the purpose of selective deworming. These checks help to recognize animals re-peatedly needing deworming and can identify specific management weaknesses. For example, if recently weaned lambs or ewes starting lactation with the highest milk production are most prob-lematic than you may need to re-examine your weaning strategies or lactation diets. However, the genes for building up immunity to worms in small ruminants are often unrelated to milk or growth ability of individual sheep and goats. Therefore, selective deworming can help identify those animals for culling that exhibit poor immunity to worms without having an environmental explanation (nursing large litter, coping with a separate health problem) for their susceptibility. Parasite resistance traits are low to moderately inherited in small ruminants depending on the worm challenge in the environment (Riley and Van Wyk, 2009). Therefore, monitoring can be used to compare lambs or ewes to identify sires with potential for genetic selection for worm re-sistance.
Dewormers are highly effective at saving the lives of heavily parasitized animals. To combat resistance, try to avoid giving dewormers by injection or as pour-on. For best effect, dewormers should be given orally far back in the mouth using a drenching gun or syringe extender to help deliver the dewormer to the rumen where it will bind to rumen particulates and exposure will be optimal rather than being delivered directly to the abomasum (simple stomach) where exposure
83
may be too brief. Even when some dewormer resistance has developed, the effectiveness of de-wormers in the benzimidazole family (i.e. albendazole, fenbendazole) can be prolonged by fast-ing animals 12 hours prior to deworming or by repeating the dose 12 hours later. Avoid fasting animals in late pregnancy/early lactation as fasting may result in ketosis. Rotation of dewormer families may actually hasten dewormer resistance. Therefore, continuing to use the same de-wormer class until it fails in effectiveness is recommended except when that dewormer is inef-fective against the particular stage or type of worm targeted.
Evasive Grazing Parasitic roundworms are basically a pasture problem. They are susceptible to ammonia and
do not survive well in the deep bedding pack of most winter barns. In hoop houses or green-houses with shallow or no bedding, worm larvae survival is also reduced by drying out of the fe-cal pellets. Instead, worm larvae thrive on pastures and in barnyards where grazing material is present and manure contamination is significant.
Evasive grazing is a term for managing pastures using parasite control as a primary consider-ation. The goal is to adopt a pasture rotation strategy that 1) moves animals out of a section of pasture fast enough to prevent infection from feces deposited during the current grazing period (autoinfection) and 2) allows a long enough rest period that there is substantial die off of infec-tious larvae before animals return to that section to graze (Colvin et al., 2008). Decisions about pasture height, timing of spring entry into pastures, types of animals exposed to pasture (dry stock, lactating females, young stock), management of pasture sections during the rest period and management of small pastures bordering the barn also have a major impact on worm loads in sheep and goats.
Barber pole worm (H. contortus) eggs take 3 to 5 days to hatch at 77 to 79˚F and 15 to 30 days to hatch at 50 to 52˚F (Rose, 2016). During the grazing season in the Northeast we gener-ally assume it takes about 5 to 14 days for barber pole worm to mature from an egg to an L3 larva capable of infecting a sheep or goat. Recommendations to avoid autoinfection are to re-move sheep and goats from a pasture within 4 days in warmer weather (late spring, summer) and 7 days in cooler seasons (fall). Because most of the worm larvae are located in the bottom 2 inches of forage, animals should be moved earlier if pastures get too short (i.e. 3 to 4 inches). Height considerations are probably not as crucial in the first pass through in Spring.
In tropical conditions, populations of H. contortus infectious larvae on pasture regrowth in rotational pasture systems appear to peak about 14 days and then decrease substantially by 42 days when animals are moved weekly (Mahieu et al., 2008). However, studies in temperate re-gions indicated that H. contortus L3 populations on pasture regrowth peak later (~6 weeks) and take as much as 13 weeks to decrease substantially on pastures grazed 2 to 4 weeks (Eysker et al., 2005). Individual larvae can survive for many months on a pasture. However, resting pas-tures for ≥ 60 days after removal of small ruminants can drastically reduce exposure to infectious larvae.
To maintain forage quality under these extreme rest periods, pastures may need to be mowed or grazed by an unrelated species between rotations to keep them from becoming too mature. There are additional advantages for parasite control from either mowing the paddocks or grazing them with an unrelated livestock species during the “rest” period. In hot dry weather, close mow-ing of pastures shortly after removal of the goats or sheep dries out fecal pellets, reducing larvae
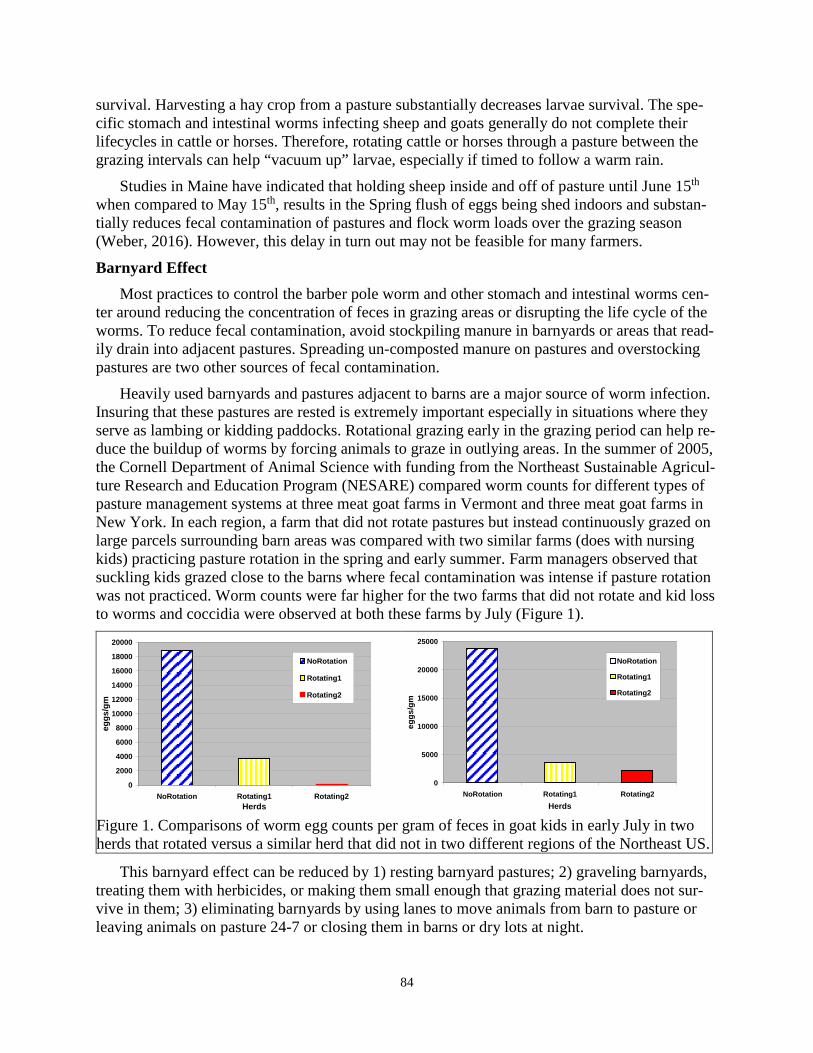
84
survival. Harvesting a hay crop from a pasture substantially decreases larvae survival. The spe-cific stomach and intestinal worms infecting sheep and goats generally do not complete their lifecycles in cattle or horses. Therefore, rotating cattle or horses through a pasture between the grazing intervals can help “vacuum up” larvae, especially if timed to follow a warm rain.
Studies in Maine have indicated that holding sheep inside and off of pasture until June 15th when compared to May 15th, results in the Spring flush of eggs being shed indoors and substan-tially reduces fecal contamination of pastures and flock worm loads over the grazing season (Weber, 2016). However, this delay in turn out may not be feasible for many farmers.
Barnyard Effect Most practices to control the barber pole worm and other stomach and intestinal worms cen-
ter around reducing the concentration of feces in grazing areas or disrupting the life cycle of the worms. To reduce fecal contamination, avoid stockpiling manure in barnyards or areas that read-ily drain into adjacent pastures. Spreading un-composted manure on pastures and overstocking pastures are two other sources of fecal contamination.
Heavily used barnyards and pastures adjacent to barns are a major source of worm infection. Insuring that these pastures are rested is extremely important especially in situations where they serve as lambing or kidding paddocks. Rotational grazing early in the grazing period can help re-duce the buildup of worms by forcing animals to graze in outlying areas. In the summer of 2005, the Cornell Department of Animal Science with funding from the Northeast Sustainable Agricul-ture Research and Education Program (NESARE) compared worm counts for different types of pasture management systems at three meat goat farms in Vermont and three meat goat farms in New York. In each region, a farm that did not rotate pastures but instead continuously grazed on large parcels surrounding barn areas was compared with two similar farms (does with nursing kids) practicing pasture rotation in the spring and early summer. Farm managers observed that suckling kids grazed close to the barns where fecal contamination was intense if pasture rotation was not practiced. Worm counts were far higher for the two farms that did not rotate and kid loss to worms and coccidia were observed at both these farms by July (Figure 1).
Figure 1. Comparisons of worm egg counts per gram of feces in goat kids in early July in two herds that rotated versus a similar herd that did not in two different regions of the Northeast US.
This barnyard effect can be reduced by 1) resting barnyard pastures; 2) graveling barnyards, treating them with herbicides, or making them small enough that grazing material does not sur-vive in them; 3) eliminating barnyards by using lanes to move animals from barn to pasture or leaving animals on pasture 24-7 or closing them in barns or dry lots at night.
0
2000
4000
6000
8000
10000
12000
14000
16000
18000
20000
NoRotation Rotating1 Rotating2Herds
eggs
/gm
NoRotation
Rotating1
Rotating2
0
5000
10000
15000
20000
25000
NoRotation Rotating1 Rotating2Herds
eggs
/gm
NoRotation
Rotating1
Rotating2
85
Please note that certain management systems are inherently less likely to be impacted by worms. Evasive grazing practices may not be necessary in flocks and herds that wean young stock prior to the grazing season to market or raise off pasture and only manage dry ewes or does (whose immune systems should be fully functional) on pasture.
Use of Copper Oxide Wire Particles in IPM Several studies, particularly in the Southeast US, have shown that dosing sheep and goats
with copper oxide wire particles (COWP) can reduce barber pole worm infections (Burke et al., 2013). Sheep, unlike goats, are ten times more susceptible to copper toxicity than cattle. Copper is an important livestock nutrient deficient in many soils. Copper oxide wire particles were de-veloped as a slow release form of copper to address these copper deficiencies. They are adminis-tered orally with the goal that they will lodge in the true stomach (abomasum) long enough to permit acid solubilization of the copper for absorption in the small intestine. Because much of their action takes place in the abomasum, they target primarily H. contortus rather than other par-asitic roundworms. The pH of the true stomach is crucial to their effectiveness. Infection with brown stomach worm (Teladorsagia circumcincta) damages the gastric glands, thus increasing the pH of the abomasum and the chyme (partly digested food expelled from the abomasum into the small intestine), and preventing release of copper from the COWP (Bang et al., 1990).
From 2012 until 2016, the Cornell Sheep and Goat Program conducted numerous on-farm trials to test the effect of COWP dosing on H. contortus infection on NY sheep and goat farms. The effect of oral dosing with copper oxide wire particles (COWP) on gastrointestinal nematode infections in lactating dairy goats and sheep is not well documented. Additionally, some farmers worry about copper residues in the milk or poor curd formation after COWP dosing. Therefore one study was conducted at a commercial goat dairy in Northern NY. Sixteen, 15, and 15 lactat-ing does were given HCOWP (1 g/10 kg live weight), MCOWP (2 g/head), or LCOWP (1 g/head), respectively. Individual fecal samples were collected and FAMACHA scores were rec-orded on days 0, 14, 28, and 42 after dosing. Individual milk samples were analyzed for copper concentrations on days 0, 14, and 42. Individual blood samples were collected on day 42 to measure aspartate aminotransferase (AST), an indicator of copper toxicity. No long term effect of COWP level on either overall strongyle or H. contortus fecal populations was observed. How-ever, H. contortus eggs per gram (epg) decreased similarly for HCOWP and MCOWP from 0 to 14 days; changes were -1153 ± 469.4 and -1226 ± 484.8 epg, respectively, while H. contortus eggs increased by 107 ± 484.8 epg for LCOWP (P = 0.036 vs MCOWP and HCOWP). Curd for-mation for 4 cheese types remained consistent the week following COWP treatment. Milk copper increased slightly between day 0 (0.131 ppm) and day 14 (0.174 ppm) but individual values were all within the pre-treatment range and highest levels of copper recorded were below maximum allowable levels. Changes in milk copper concentration from 0 to 42 days were not significant. However, in separate paired t tests, copper concentrations increased significantly (P = 0.003) from 0.105 ± 0.019 to 0.171 ± 0.019 ppm from 0 to 14 days for HCOWP but not for MCOWP (P = 0.12) or LCOWP (P = 0.14). Copper toxicity elicits AST activity of > 300 ppm. Plasma AST concentrations on day 42 were 118 ± 6.9, 121 ± 7.2, and 113 ± 7.2 ppm for HCOWP, MCOWP and LCOWP, respectively, and did not differ significantly. In this study, dosing dairy does with 2 g COWP/head as compared to 1 g/10 kg live weight caused similar reductions in H. contortus epg and significantly lower increases in milk copper concentrations from Day 0 to Day 14 with only 25% (small does) to 50% (large does) as much COWP.
86
The results of our Northeast studies on COWP dosing were extremely variable from farm to farm. Dosing with COWP at 0.5 g/head and 1.0 g/head was very effective at reducing H. contor-tus egg counts in weaned lambs during the grazing season at the St. Lawrence County Cornell Cooperative Extension Learning Farm from 2012 to 2015. This farm historically provided no supplemental copper to their flock. However results on other farms indicated only short term re-ductions in H. Contortus egg counts from dosing or no significant difference in worm loads be-tween treated and control animals.
Southeast researchers recommend using COWP as part of a FAMACHA program where ani-mals scoring 3 receive COWP dosing (0.5 to 1.0 g per lamb, 1 to 2 g per ewe) and animals scor-ing higher receive an effective dewormer. They caution that farmers should verify that COWP is working in their flock and consult with their veterinarians about risks of copper toxicity.
Use of High Tannin Forage Legumes in IPM In the southeastern US, consumption of Lespedeza (Sericea lespedeza), a forage legume con-
taining condensed tannins, has reliably reduced parasitic roundworm infections in sheep and goats (Lange et al., 2006; Shaik et al., 2006). However, Lespedeza is not winter hardy in North-east climates. Condensed tannins in numerous forages may suppress strongyle infections through direct effects on worms and/or improved immune response in the host because of improved pro-tein nutrition (Min and Hart, 2003). Birdsfoot trefoil (Lotus corniculatus L.), is a forage legume containing condensed tannins that IS well adapted the Northeast. In preliminary studies, it has shown some anti-parasite effects in small ruminants (Heckendorn et al., 2007; Marley et al., 2003).
Cornell University, as part of a USDA Organic Research and Extension Initiative project with several other universities, has solicited Northeast sheep and goat farmers to establish -1to 3-acre fields of Birdsfoot Trefoil (BFT) under organic practices and conduct grazing trials the fol-lowing year to compare the worm loads of lambs and kids grazing BFT versus conventional pas-tures. Preliminary results from some of these grazing trials follow.
In one study at a commercial sheep dairy, lambs born the last 3 weeks of April were raised on dairy dams until June 1st and then put to pasture with yearling ewes. As part of the plan for worm prevention, lambs had received a “once in their life” dose of COWP at 2 g/head. Farm pol-icy was to graze lambs and yearlings for as long as possible on land not used for the dairy flock. This necessitated using low fertility fields owned by other land owners. A low phosphorous (2 lb/acre), acidic (soil pH 5.3) field was dedicated to the grazing trial with part of it planted in Bruce BFT. Fences were moved daily but animals could backtrack for 3 days. Lambs on conven-tional pasture (CP) and BFT received ~273 and 197 sq ft/head/day of new pasture respectively because of differences in forage production. The BFT group averaged better FAMACHA scores in weeks 4 and 6 (1.6 vs. 2.5, and 1.1vs 2.0). Fecal egg counts were similar for both groups until week 6 when average egg counts were 1488 epg and 1062 epg for the BFT and CP lambs respec-tively. Larval cultures at the beginning and end of the 6-week grazing trial indicated that nodular worm (Oesophagostomum columbianum) was the primary worm represented with only a low percentage of H. contortus. Daily weight gains averaged 0.33 lb/head and 0.12 lb/head for lambs grazing BFT and CP respectively.
In contrast, a similar study was done in a flock of Dorset/Icelandic lambs where H. contortus was the primary parasitic worm and field fertility was substantially better. The 6-week grazing trial started immediately after weaning. Fecal egg counts for both groups rose sharply after
87
weaning but were similar for both groups until week 6 when average egg counts were 4550 epg and 6955 epg for the BFT and CP lambs respectively. Average FAMACHA scores were similar for both groups until week 6 when the BFT group averaged better FAMACHA scores (1.9 vs. 3.1). Daily weight gains averaged 0.48 lb/head and 0.36 lb/head for BFT and CP grazed lambs respectively. Trial combining Birdsfoot trefoil (BFT) grazing with COWP dosing
In this study, roundworm infections were compared for lambs receiving 3 different nutri-tional treatments for 8 weeks after weaning in combination with or without COWP (1 g bolus) dosing two weeks pre-weaning. Eight lambs each were assigned to each of the following treat-ments: BFT + COWP, BFT alone, Conventional pasture (CP) + COWP, CP alone, or Hay/Grain (HG) + COWP. Pastured lambs were moved ~ every 5 days and drylot lambs were fed second cut grass-hay ad lib (13.5% crude protein, 64% total digestible nutrients on dry matter basis) and approximately one pound/head/day of concentrate feed (15.4% CP, 77%TDN as DM).
All lambs receiving COWP 2 weeks pre-weaning appeared to have lower roundworm egg counts and more desirable FAMACHA scores for 8 weeks post weaning as compared to the group of lambs on BFT pasture alone and especially lambs on CP alone. These changes in round-worm egg counts resulted almost entirely from changes in the H. contortus worm egg population. In addition, no lambs on the BFT pasture alone, the BFT + COWP or the CP + COWP treat-ments had to be dewormed over the 70-day study. In contrast, 2 lambs required deworming on the HG + COWP treatment, and 4 of 8 lambs on CP alone had to be dewormed based on severe anemia and weakness. Daily weight gains over the 70 d study averaged 0.3 lb, 0.25 lb, 0.22 lb, 0.18 lb, and 0.16 lb for BFT + COWP, HG + COWP, BFT, CP + COWP and CP treatments, re-spectively. Dewormed lambs were included in these weight averages. Weight gains for HG + COWP and CP alone would probably have been worse if the heavily parasitized lambs requiring deworming in these two treatments had not been dewormed. In this study, lambs given both COWP and BFT appeared to outperform lambs receiving both COWP and Hay/Grain. The good growth of lambs on BFT despite the absence of concentrates has important implications for lambs managed as “grass fed” as well as for organic and conventional farmers raising weaned lambs on pasture.
Conclusion There are several management strategies that sheep and goat farmers can adopt to reduce de-
pendency on chemical dewormers and mitigate some of the potential consequences of dewormer resistance. Targeted selective deworming and evasive grazing are two effective management practices. However, they require thoughtful planning and labor commitments. The jury is still out on the effectiveness of COWP dosing and BFT grazing to combat worm loads in vulnerable ani-mals such as growing lambs and kids. However, the good growth of lambs on BFT in combina-tion with COWP dosing, despite the absence of concentrates, has important implications for lambs managed as “grass fed” as well as for organic and conventional farmers raising weaned lambs on pasture.
88
References Bang K.S., A.S. Familton, and A.R. Sykes. 1990. Effect of ostertagiasis on copper status in
sheep: A study involving use of copper oxide wire particles. Res. Vet. Sci. 49:306–314. Burke, J.M, J.E. Miller, and T.H. Terrill. 2013. Copper Oxide Wire Particle to Control Haemon-
chus contortus in Sheep and Goats. In 10th Anniversary Conference of the American Consor-tium for Small Ruminant Parasite Control (May 2013).
Colvin, A.F., S.W. Walkden-Brown, M.R. Knox, and J.M. Scott. 2008. Intensive rotational graz-ing assists control of gastrointestinal nematodosis of sheep in a cool temperate environment with summer-dominant rainfall. Veterinary Parasitology 153:108–120.
Eysker, M., N. Bakker, F.N. Kooyman, and H.W. Ploeger. 2005. The possibilities and limitations of evasive grazing as a control measure for parasitic gastroenteritis in small ruminants in temperate climates. Vet. Parasitology 129:95–104.
Heckendorn, F., D.A. Haring, V. Maurer, M. Senn, and H. Hertzberg. 2007. Individual admin-istration of three tanniferous forage plants to lambs artificially infected with Haemonchus contortus and Cooperia curticei. Veterinary Parasitology 146:123-134
Howell, S.B., J.M. Burke, J.E. Miller, T.H. Terrill, E. Valencia, M.J. Williams, L.H. Williamson, A.M. Zajac, and R.M Kaplan.2008. Anthelmintic resistance on sheep and goat farms in the southeastern United States. J. Am. Vet. Med. Assoc. 233:1913-1919.
Kenyon F. and F. Jackson. 2012. Targeted flock/herd and individual ruminant treatment ap-proaches. Vet. Parasitology.186:10-17.
Lange, K., D.D. Olcott, J.E. Miller, J.A. Mosjidis, T.H. Terrill, J.M. Burke, and M.T. Kearney. 2006. Effect of sericea lespedeza (Lespedeza cuneata) fed as hay, on natural and experi-maental Haemonchus contortus infections in lambs. Vet. Parasitology 141:273-278.
Mahieu, M.K., H. Archimede, J. Fleury, N. Mandonnet, and G. Alexandre. 2008. Intensive graz-ing system for small ruminants in the Tropics:The French West Indies experience and per-spectives. Small Ruminant Res 77:195–207.
Marley, C., R. Cook, R. Keatinge, J. Barrett, and N. Lampkin. 2003. The effect of birdsfoot tre-foil (Lotus corniculatus) and chicory (Cichorium intybus) on parasite intensities and perfor-mance of lambs naturally infected with helminth parasites. Vet. Parasitology 112:147-155.
Min, B. R. and S. P. Hart. 2003. Tannins for suppression of internal parasites. Journal of Animal Science 81(E.Supple.2):E102-E109.
Riley, D.G. and J.A. Van Wyk. 2009. Genetic parameters for FAMACHA score and related traits for host resistance/resilience and production at differing severities of worm challenge in a Merino flock in South Africa. Vet. Parasitology. 164:44-52.
Rose, J.H., 1963. Observations on the free-living stages of the stomach worm Haemonchus con-tortus. Parasitology 53:469–481.
Shaik, S.A., T.H. Terrill, J.E. Miller, B. Kouakou, G. Kannan, R. M. Kaplan, J.M. Burke, and J. Mosjidis. 2006. Sericea lespedeza hay as a natural deworming agent against Haemonchus contortus infection in goats. Vet. Parasitology 139:150–157.
Weber, J. Personal communication. June 10, 2016.

89
SETTING UP A FARMSTEAD DAIRY Rob Ralyea
Cornell University Ithaca, NY, USA
Getting Started Required
• Satisfactory sanitation inspection • Satisfactory water sample bacteria test results or approved water source by health department • Processing plant superintendent • Proper product labels • Sanitary processing equipment
May require
• Milk dealer license • Approved milk drug residue testing facility:
o On site approved testing lab. o Outside testing approved lab w/ licensed & certified technicians or pre-tested product.
• Approved pasteurization equipment & satisfactory testing inspection • Satisfactory recirculated water bacteria test results • Animal herd health requirements • Interstate milk shippers rating (FDA) listing
Suggested
• Product Recall Action Plan • Federal Food Establishment Registration
Additional resources
• Cornell Cooperative Extension- County • Cornell Cooperative Extension Food Science (http://www.milkfacts.info/)
o Robert Ralyea [email protected] o Steve Murphy [email protected]
• DPC- Dairy Practices Council Guidelines www.dairypc.org Before Getting Started
• Work with Cornell Cooperative Extension: Discuss ideas, gather resources • Work with Cornell University & SUNY Morrisville
o How would I make my product? o Would I have a market for my product; with a cost margin? o How much milk will it take to make my product? o Have product tasting & constructive comments by students.
90
• Try to have the product made in an inspected facility
o Understand equipment, cost, processing, packaging, labeling, and marketing the prod-uct.
o Test marketing. • Call the Division of Milk Control with any specific questions you may have. Office 518-457-
1772. • We do have some information resources, but we do not recommend any specific building,
materials or equipment manufacturers. Prepare a general plan
• Product(s) to be made- processing description. • Type and size of container, labels. • Ingredients, volumes, product storage. • Farm and/or plant: diagram of proposed rooms including product intake, raw product storage,
processing area, boiler room, laboratory, dry storage, floor drains, toilet and septic facilities (cannot be connected to milkroom or processing drains), ventilation.
• Note and discuss building material types and lighting to be used. o Indicate equipment location with size dimensions and distance between the equip-
ment and adjacent equipment, wall, or door. o Equipment can not be located over floor drains. Avoid overhead condensate.
• Contact the Department of Agriculture & Markets Division of Milk Control and Dairy Ser-vices. Set up a meeting to discuss your plans and review the site if need be. Be prepared to adjust plans as necessary. It is difficult to answer some questions without enough or proper information. Call 518-457-1772 or [email protected] 518-265-2398
• Stay in contact with the Dairy Product Specialist. That way they know at what step of pro-gress you are at and can answer some questions along the way. Also, if they are in the area and have the opportunity they can stop and visit.
• I can review most drawings and plans submitted electronically. • Milk production and processing are not simple and no two locations are exactly the same. It
is not recommended that you start a building or purchase any equipment without consulting with someone who has dairy industry regulatory knowledge.
• If possible an inspector will look at used or new equipment here in New York State prior to purchase.
• Sometimes out-of-state equipment reviews can be arranged; some states have a fee for it. • Finally, after the initial inspection a review of the processing will be made and official prod-
uct samples taken for bacteria and standard of identity. A wholesome product made with consumer confidence is your and our goal.
91
Recipients of the William J. Boylan Distinguished Service Award (The DSANA Distinguished Service Award prior to 2009.)
2003 David Thomas, Madison, Wisconsin, USA – Dairy sheep researcher 2004 Daniel Guertin, Stillwater, Minnesota, USA – Dairy sheep producer 2005 (no award given) 2006 Pat Elliot, Rapidan, Virginia, USA – Dairy sheep producer and artisan cheese maker 2007 Tom and Nancy Clark, Old Chatham, New York, USA – Dairy sheep producers and
sheep milk processors 2008 William Wendorff, Cross Plains, Wisconsin, USA – Sheep milk processing researcher 2009 Yves Berger, Spooner, Wisconsin, USA – Dairy sheep researcher 2010 Eric Bzikot, Conn, Ontario, Canada – Dairy sheep producer and sheep milk processor 2011 Tom and Laurel Kieffer, Strum, Wisconsin, USA – Dairy sheep producers 2012 Bill Halligan, Bushnell, Nebraska, USA – Dairy sheep producer 2013 Axel Meister, Markdale, Ontario, Canada – Dairy sheep producer and early importer of
East Friesian dairy sheep into North America 2014 Terry Felda, Ione, Oregon, USA – Dairy sheep producer 2015 Sid Cook, La Valle, Wisconsin, USA – Sheep milk processor
Locations and Chairs of the Organizing Committees of the Dairy Sheep Symposia
1995 1st Great Lakes Dairy Sheep Symposium Madison, Wisconsin, USA; Yves Berger – Chair
1996 2nd Great Lakes Dairy Sheep Symposium Madison, Wisconsin, USA; Yves Berger - Chair
1997 3rd Great Lakes Dairy Sheep Symposium Madison, Wisconsin, USA; Yves Berger – Chair
1998 4th Great Lakes Dairy Sheep Symposium Madison, Wisconsin, USA; Yves Berger – Chair
1999 5th Great Lakes Dairy Sheep Symposium Brattleboro, Vermont, USA; Carol Delaney - Chair
2000 6th Great Lakes Dairy Sheep Symposium Guelph, Ontario, Canada; Axel Meister - Chair
2001 7th Great Lakes Dairy Sheep Symposium Eau Claire, Wisconsin, USA; Yves Berger - Chair
2002 8th Great Lakes Dairy Sheep Symposium Ithaca, New York, USA; Michael Thonney - Chair
2003 9th Great Lakes Dairy Sheep Symposium Québec, Québec, Canada; Lucille Giroux - Chair
2004 10th Great Lakes Dairy Sheep Symposium Hudson, Wisconsin, USA; Yves Berger - Chair
2005 11th Great Lakes Dairy Sheep Symposium Burlington, Vermont, USA; Carol Delaney - Chair
92
2006 12th Great Lakes Dairy Sheep Symposium La Crosse, Wisconsin, USA; Yves Berger - Chair
2007 13th Great Lakes Dairy Sheep Symposium Guelph, Ontario, Canada; Eric Bzikot - Chair
2008 14th Great Lakes Dairy Sheep Symposium Maryville, Tennessee, USA; Claire Mikolayunas - Chair
2009 15th Great Lakes Dairy Sheep Symposium Albany, New York, USA; Claire Mikolayunas - Chair
2010 16th Great Lakes Dairy Sheep Symposium Eau Claire, Wisconsin, USA; Claire Mikolayunas - Chair
2011 17th Great Lakes Dairy Sheep Symposium Petaluma, California, USA; Cynthia Callahan – Chair
2012 18th Dairy Sheep Association of North America Symposium Dulles, Virginia, USA; Laurel Kieffer – Chair
2013 19th Dairy Sheep Association of North America Symposium Cambridge, Ontario, Canada; Eric Bzikot - Chair
2014 20th Dairy Sheep Association of North America Symposium Chehalis, Washington, USA; Terry Felda, Brad and Megan Gregory – Co-Chairs
2015 21st Dairy Sheep Association of North America Symposium Madison, Wisconsin, USA; Brenda Jensen and David Thomas – Co-Chairs
2016 22nd Dairy Sheep Association of North America Symposium Ithaca, New York, USA; Michael Thonney, Chair
Brief History of the Dairy Sheep Association of North America
November 1-3, 2001 – Decision made at the 7th Great Lakes Dairy Sheep Symposium, Eau Claire, Wisconsin, to form the Dairy Sheep Association of North America. Nancy Clark, New York, elected the interim/organizational President.
June 26, 2002 – DSANA by-laws, written by Nancy Clark, New York; Alistair McKenzie, Que-bec; Carol Delaney, Vermont; and Charles Capaldi, Wisconsin, were adopted.
November 7, 2002 - Charter Meeting of DSANA held at the 8th Great Lakes Dairy Sheep Sym-posium, Cornell University, Ithaca, New York
DSANA Presidents
2002 – 2004: Nancy Clark, New York 2004 – 2005: Mike Thonney, New York 2005 – 2007: Larry Meisegeier, Wisconsin 2007 – 2009: Claire Mikolayunas, Wisconsin 2009 – 2011: Bill Halligan, Nebraska 2011 – 2012: Laurel Kieffer, Wisconsin 2012 – 2013: Bill Halligan, Nebraska 2013 – 2015: Michael Histon, Maryland 2015 – 2016: Laurel Kieffer, Wisconsin
93
Information from the Symposium Sponsors

94
95