dairy report - aphis.usda.gov · Part I: Reference of Dairy Health and Management in the United...
92
Dairy 2002 Part I: Reference of Dairy Health and Management in the United States, 2002 United States Department of Agriculture Animal and Plant Health Inspection Service Veterinary Services National Animal Health Monitoring System December 2002
Transcript of dairy report - aphis.usda.gov · Part I: Reference of Dairy Health and Management in the United...
Dairy 2002Part I: Reference of Dairy Health andManagement in the United States, 2002
United StatesDepartment ofAgriculture
Animal andPlant HealthInspectionService
VeterinaryServices
NationalAnimal HealthMonitoringSystem
December 2002
The U.S. Department of Agriculture (USDA) prohibitsdiscrimination in all its programs and activities onthe basis of race, color, national origin, sex, religion,age, disability, political beliefs, sexual orientation, ormarital or family status. (Not all prohibited basesapply to all programs.) Persons with disabilities whorequire alternative means for communication of pro-gram information (Braille, large print, audiotape, etc.)should contact USDA’s TARGET Center at (202)720–2600 (voice and TDD).
To file a complaint of discrimination, write USDA,Director, Office of Civil Rights, Room 326–W, WhittenBuilding, 1400 Independence Avenue, SW,Washington, DC 20250–9410 or call (202) 720–5964(voice and TDD). USDA is an equal opportunityprovider and employer.
Mention of companies or commercial products doesnot imply recommendation or endorsement by theUSDA over others not mentioned. USDA neitherguarantees nor warrants the standard of any productmentioned. Product names are mentioned solely toreport factually on available data and to provide spe-cific information.
USDA:APHIS:VS:CEAHNRRC Building B., M.S. 2E72150 Centre AvenueFort Collins, CO 80526-8117970.494.7000E-mail: [email protected]/vs/ceah/cahm
#N377.1202

USDA APHIS VS / i
Acknowledgements
This report was prepared from material received and analyzed by the United StatesDepartment of Agriculture (USDA), Animal and Plant Health Inspection Service(APHIS), Veterinary Services (VS) during a study of health management and animalhealth on dairy operations.
The Dairy 2002 study was a cooperative effort between State and Federal agricul-tural statisticians, animal health officials, university researchers, extension person-nel, owners, and operators. We want to thank the hundreds of industry memberswho helped determine the direction and objectives of this study by participating infocus groups.
Thanks also to the National Agricultural Statistics Service (NASS) enumerators,State and Federal Veterinary Medical Officers (VMOs), and Animal HealthTechnicians (AHTs) who visited the operations and collected the data. Their hardwork and dedication to the National Animal Health Monitoring System (NAHMS) areinvaluable. The roles of the producer, Area Veterinarian in Charge (AVIC), NAHMSCoordinator, VMO, AHT, and NASS enumerator were critical in providing qualitydata for Dairy 2002 reports. Thanks also to the personnel at the Centers forEpidemiology and Animal Health (CEAH) for their efforts in generating and distribut-ing valuable reports from Dairy 2002 data.
Additional biological sampling and testing were afforded by the generous contribu-tions of collaborators for the Dairy 2002 study, including:
• USDA:APHIS, National Veterinary Services Laboratory • USDA:ARS, National Animal Disease Center • USDA:ARS, Beltsville Animal Research Center • USDA:ARS, Russell Research Center • Colorado State University, College of Veterinary Medicine and
Biomedical Sciences• BIOCOR Animal Health• IDEXX• University of California at Davis• TREK Diagnostic Systems • Antel BioSystems, Inc.
All participants are to be commended for their efforts, particularly the producerswhose voluntary efforts made the Dairy 2002 study possible.
Thomas E. WaltonDirectorCenters for Epidemiology and Animal Health

ii / Dairy 2002
Suggested bibliographic citation for this report:USDA. 2002. Part I: Reference of Dairy Health and Management in the UnitedStates, 2002USDA:APHIS:VS,CEAH, National Animal Health Monitoring System, Fort Collins, CO#N377.1202
Contacts for further information:Questions or comments on Dairy 2002 study methods or requests for additionaldata analysis: Dr. Brian McCluskey: 970.494.7000Information on reprints or other NAHMS reports: Mr. Brad Doty: 970.494.7000E-mail: [email protected]

USDA APHIS VS / iii
Introduction 1Terms Used in This Report 2
Section I: Population Estimates 4A. Dairy Herd Information & Management Practices 4
1. Record-keeping systems 42. Individual animal identification 63. Herd identification 84. Breed of dairy cows 95. Cow registration 106. Number of bulls used 127. Rolling herd average milk production 128. Days dry 159. Calving interval 1610. Age at first calving 1711. Feed rations 1812. Pasture management 2113. Bovine somatotropin (bST) 2314. Drenching 2715. Quality assurance programs 28
B. Dairy Heifers 301. Colostrum management 302. Medicated milk-replacer 363. Weaning age 384. Source of heifers 395. Home-raised heifers 40
C. Culled Cows 401. Removals from herd 402. Destination 413. Reason for culling 43
D. Health Management 441. Vaccination 442. Types of BVD vaccine 493. BVD strains used 514. Preventive practices 52
Table of Contents
iv / Dairy 2002
E. Births, Illnesses, and Deaths 531. Dairy calves born alive 532. Abortions 533. Dairy cow morbidity 544. Mortality 575. Carcass disposal 60
F. Housing 611. Housing facilities 612. Separate maternity housing 643. Milking facilities 64
G. Biosecurity 651. Physical contact with unweaned calves 652. Physical contact with other animals 653. Frequency of physical contact with deer 664. Biosecurity for new arrivals 68
Section II: Methodology 77A. Needs Assessment 77B. Sampling and Estimation 78C. Data Collection 79D. Data Analysis 79
Appendix I: Sample Profile 80A. Responding Sites 80
Appendix II: U.S. Milk Cow Population and Operations 81
Introduction
USDA APHIS VS / 1
The National Animal Health Monitoring System (NAHMS) is a nonregulatory divisionof the United States Department of Agriculture (USDA) designed to help meet animalhealth information needs. NAHMS has collected data on dairy health and manage-ment practices through two previous studies.
The NAHMS 1991-92 National Dairy Heifer Evaluation Project (NDHEP) provided thedairy industry’s first national baseline information on the health and management ofdairy cattle in the United States. Just months after the study’s first results werereleased in 1993, cases of acute bovine viral diarrhea (BVD) surfaced in the UnitedStates following a 1993 outbreak in Canada. NDHEP information on producer vac-cination and biosecurity practices helped officials address the risk of disease spreadand target educational efforts on vaccination protocols. In addition, vital informationon the prevalence of Cryptosporidium parvum and shedding by calves was availableto officials and the public during a spring 1993 outbreak of related human illness inMilwaukee, Wisconsin. Later that year, another outbreak of human illness wasreported in the Pacific Northwest, this time related to Escherichia coli 0157:H7.NDHEP data on the bacteria’s prevalence in dairy cattle helped officials define pub-lic risks as well as research needs. This baseline picture of the industry also helpedidentify additional research and educational efforts in various production areas, suchas feed management and weaning age.
Introduction
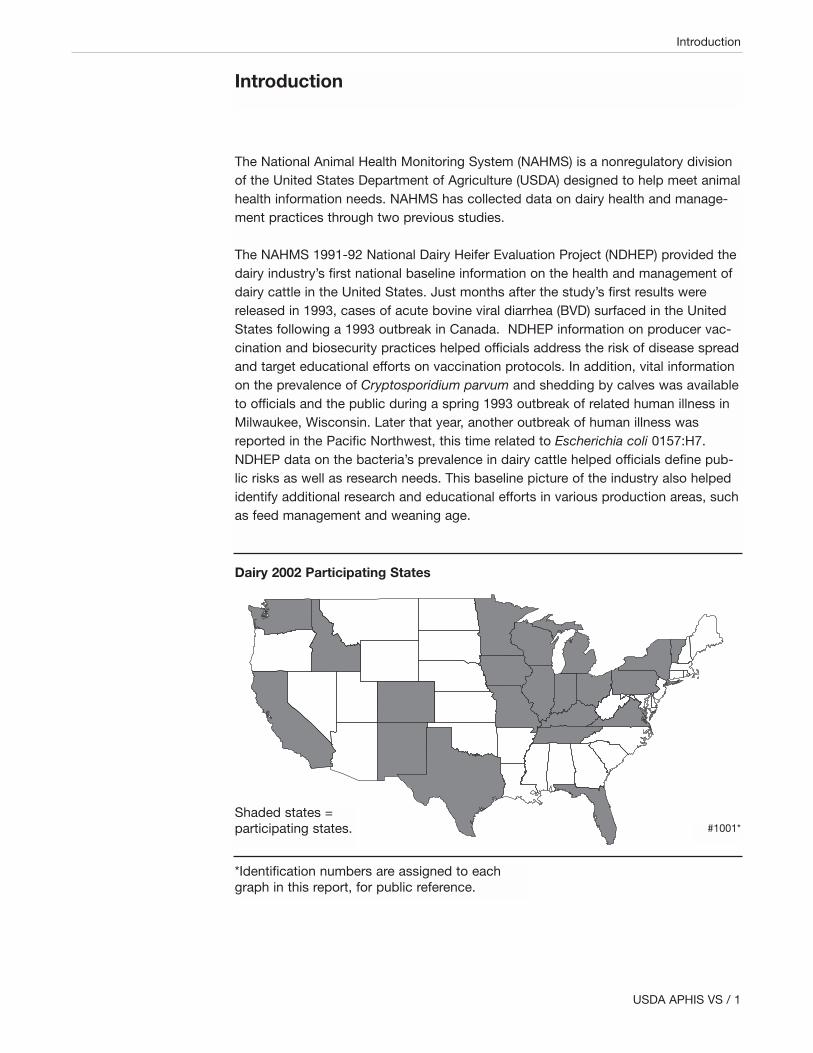
Dairy 2002 Participating States
Shaded states =participating states. #1001*
*Identification numbers are assigned to eachgraph in this report, for public reference.
Introduction
2 / Dairy 2002
Information from the NAHMS Dairy ‘96 study helped the U.S. dairy industry identifyeducational needs and prioritize research efforts on such timely topics as antibioticusage and Johne’s disease, as well as digital dermatitis, bovine leukosis virus (BLV),and potential foodborne pathogens, including E. coli, Salmonella, andCampylobacter.
Part 1: Reference of Dairy Health and Management in the United States, 2002 is thefirst in a series of reports containing national information from the NAHMS Dairy2002 study conducted in 21 major dairy States (see map). Dairy 2002 was designedto provide information to both participants and industry from operations represent-ing 82.8 percent of the U.S. dairy operations and 85.5 percent of the U.S. dairycows. Data were collected from December 31, 2001, through February 12, 2002.
The methods used and number of respondents in the study can be found at the endof this report.
Further information on NAHMS studies and reports is available online at :www.aphis.usda.gov/vs/ceah/cahm
For questions about this report or additional copies, please contact:
USDA:APHIS:VS:CEAHNRRC Building B., M.S. 2E72150 Centre Avenue, Fort Collins, CO 80526-8117970.494.7000
Cow: Female dairy bovine that has calved at least once.
Cow Average: The average value for all cows; the reported value for each operationmultiplied by the number of cows on that operation is summed over all operationsand divided by the number of cows on all operations. This way, results are adjustedfor the number of cows on each operation. For instance, on page 13 the averagerolling herd milk production for each operation is multiplied by the number of cowson each operation. This product is then summed over all operations and divided bythe sum of cows over all operations. The result is the average rollong herd milk pro-duction for all cows.
Heifer: Female dairy bovine that has not yet calved.
Terms Used inThis Report
Introduction
USDA APHIS VS / 3
Operation average: The average value for all operations: A single value for eachoperation is summed over all operations reporting divided by the number of opera-tions reporting. For example, operation average age at first calving (shown on page13) is calculated by summing reported average age over all operations divided bythe number of operations.
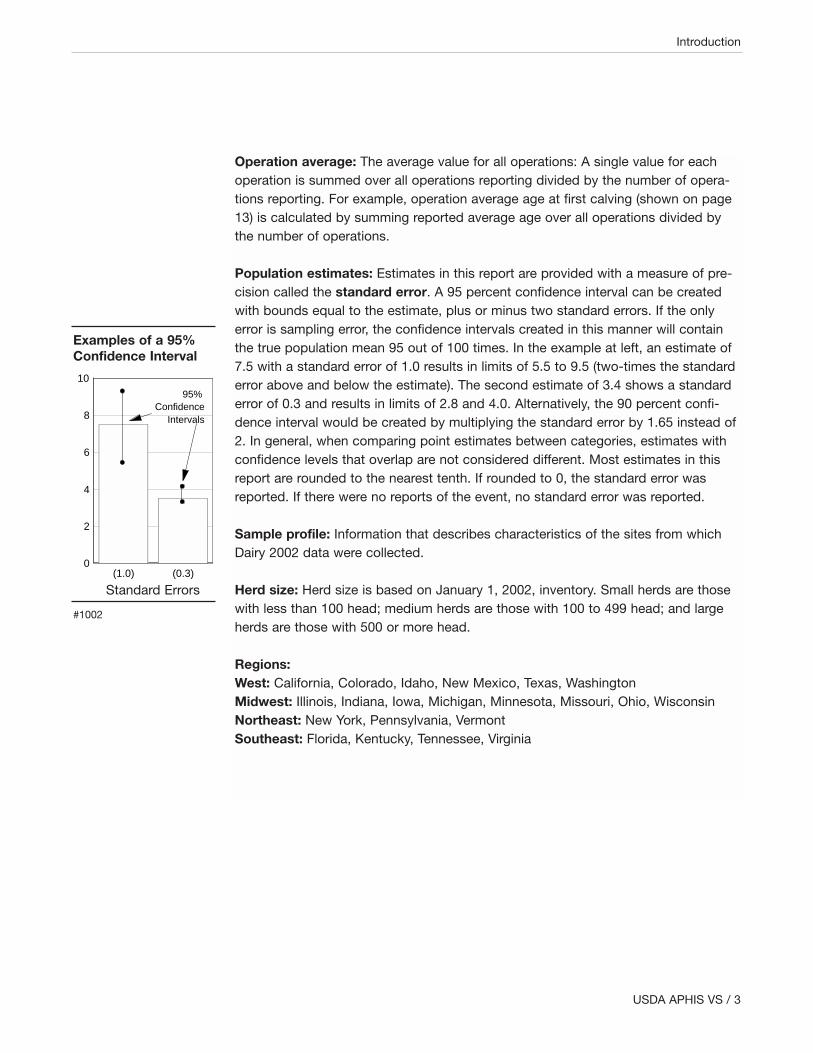
Population estimates: Estimates in this report are provided with a measure of pre-cision called the standard error. A 95 percent confidence interval can be createdwith bounds equal to the estimate, plus or minus two standard errors. If the onlyerror is sampling error, the confidence intervals created in this manner will containthe true population mean 95 out of 100 times. In the example at left, an estimate of7.5 with a standard error of 1.0 results in limits of 5.5 to 9.5 (two-times the standarderror above and below the estimate). The second estimate of 3.4 shows a standarderror of 0.3 and results in limits of 2.8 and 4.0. Alternatively, the 90 percent confi-dence interval would be created by multiplying the standard error by 1.65 instead of2. In general, when comparing point estimates between categories, estimates withconfidence levels that overlap are not considered different. Most estimates in thisreport are rounded to the nearest tenth. If rounded to 0, the standard error wasreported. If there were no reports of the event, no standard error was reported.
Sample profile: Information that describes characteristics of the sites from whichDairy 2002 data were collected.
Herd size: Herd size is based on January 1, 2002, inventory. Small herds are thosewith less than 100 head; medium herds are those with 100 to 499 head; and largeherds are those with 500 or more head.
Regions: West: California, Colorado, Idaho, New Mexico, Texas, WashingtonMidwest: Illinois, Indiana, Iowa, Michigan, Minnesota, Missouri, Ohio, WisconsinNortheast: New York, Pennsylvania, VermontSoutheast: Florida, Kentucky, Tennessee, Virginia
(1.0) (0.3)0
2
4
6
8
10
95% Confidence
Intervals
Examples of a 95%Confidence Interval
Standard Errors
#1002

Section I: Population Estimates
4 / Dairy 2002
1. Record-keeping systemsSome type of record-keeping system was used to help manage animals on almostall (95.2 percent) operations, which accounted for 97.9 percent of all cows. Almosthalf (44.8 percent) of operations were enrolled in the Dairy Herd ImprovementAssociation (DHIA), accounting for 50.2 percent of all dairy cows. Although a smallpercentage (19.4 percent) of operations used on-farm computer record systems,they accounted for nearly half (49.6 percent) of all cows. Large operations weremore likely to have computer record systems than small operations.
a. Percentage of operations (and percentage of dairy cows on these operations) bytype of individual animal record-keeping systems used for the dairy operation:
Record-keeping Percent Standard Percent StandardSystem Operations Error Dairy Cows Error
Hand written, suchas a ledger ornotebook 74.3 (1.1) 58.5 (1.2)
Dairy Herd Improvement Association (DHIA) 44.8 (1.3) 50.2 (1.3)
Off-farm computer record system other than DHIA 5.0 (0.5) 8.5 (0.8)
On-farm computer data record system 19.4 (0.9) 49.6 (1.1)
Other system 4.1 (0.5) 4.3 (0.5)
Any record-keeping system 95.2 (0.6) 97.9 (0.3)
The majority (45.4 percent) of farms with on-farm computer record systems reported“other” as the primary type of computerized record system used, which includedhomemade spreadsheets (Excel, etc.), Westfalia, Boumatic, and some smaller pro-grams. Although only 19.4 percent of operations used Dairy Comp 305, these oper-ations accounted for almost half (48.5 percent) the cows whose records were keptvia on-farm computer. Computerized record-keeping systems may assist producersin managing their operations more efficiently and effectively.
Section I: Population Estimates
A. Dairy HerdInformation &ManagementPractices

b. For operations using on-farm computer data record systems, percentage of oper-ations (and percentage of dairy cows on these operations) by primary computerizedrecord system used:
Primary On-farmRecord System Percent Standard Percent StandardUsed Operations Error Cows Error
Dairy Comp 305 19.4 (1.7) 48.5 (1.9)
PC Dart 12.5 (1.4) 10.3 (0.8)
Dairy Plan V 2.5 (0.6) 2.5 (0.5)
Dairy Quest 6.9 (1.2) 6.6 (0.9)
DHI Plus 13.3 (1.7) 13.7 (1.3)
Other 45.4 (2.7) 18.4 (1.4)
Total 100.0 100.0
USDA APHIS VS / 5
Section I: Population Estimates
48.5
10.3
2.56.6
13.718.419.4
12.5
2.56.9
13.3
45.4
0
10
20
30
40
50
60
Percent
Dairy Comp305
PC Dart Dairy Plan V Dairy Quest DHI Plus Other
Operations Cows
Percent of Operations* (and Percent of Dairy Cows on These Operations) byPrimary Type of Computer Record-keeping System Used
Computer Record-keeping System
*For operations using on-farm computer record-keeping system. #1003
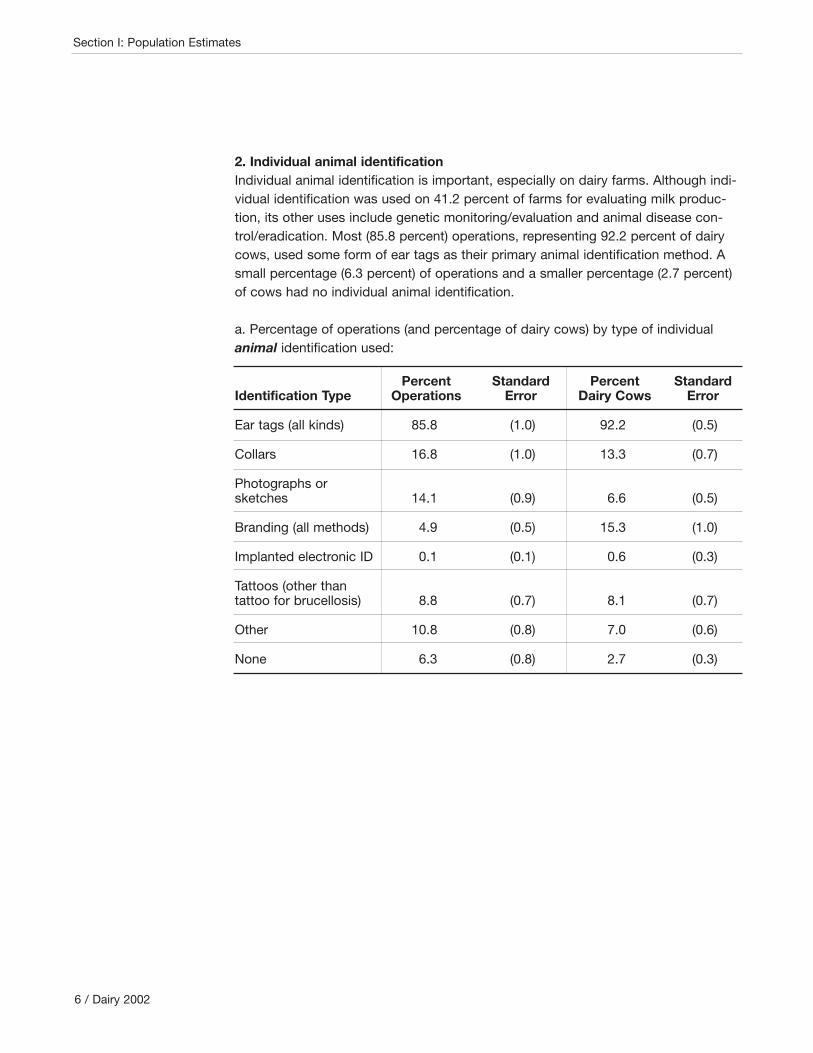
2. Individual animal identificationIndividual animal identification is important, especially on dairy farms. Although indi-vidual identification was used on 41.2 percent of farms for evaluating milk produc-tion, its other uses include genetic monitoring/evaluation and animal disease con-trol/eradication. Most (85.8 percent) operations, representing 92.2 percent of dairycows, used some form of ear tags as their primary animal identification method. Asmall percentage (6.3 percent) of operations and a smaller percentage (2.7 percent)of cows had no individual animal identification.
a. Percentage of operations (and percentage of dairy cows) by type of individualanimal identification used:
Percent Standard Percent StandardIdentification Type Operations Error Dairy Cows Error
Ear tags (all kinds) 85.8 (1.0) 92.2 (0.5)
Collars 16.8 (1.0) 13.3 (0.7)
Photographs or sketches 14.1 (0.9) 6.6 (0.5)
Branding (all methods) 4.9 (0.5) 15.3 (1.0)
Implanted electronic ID 0.1 (0.1) 0.6 (0.3)
Tattoos (other than tattoo for brucellosis) 8.8 (0.7) 8.1 (0.7)
Other 10.8 (0.8) 7.0 (0.6)
None 6.3 (0.8) 2.7 (0.3)
6 / Dairy 2002
Section I: Population Estimates
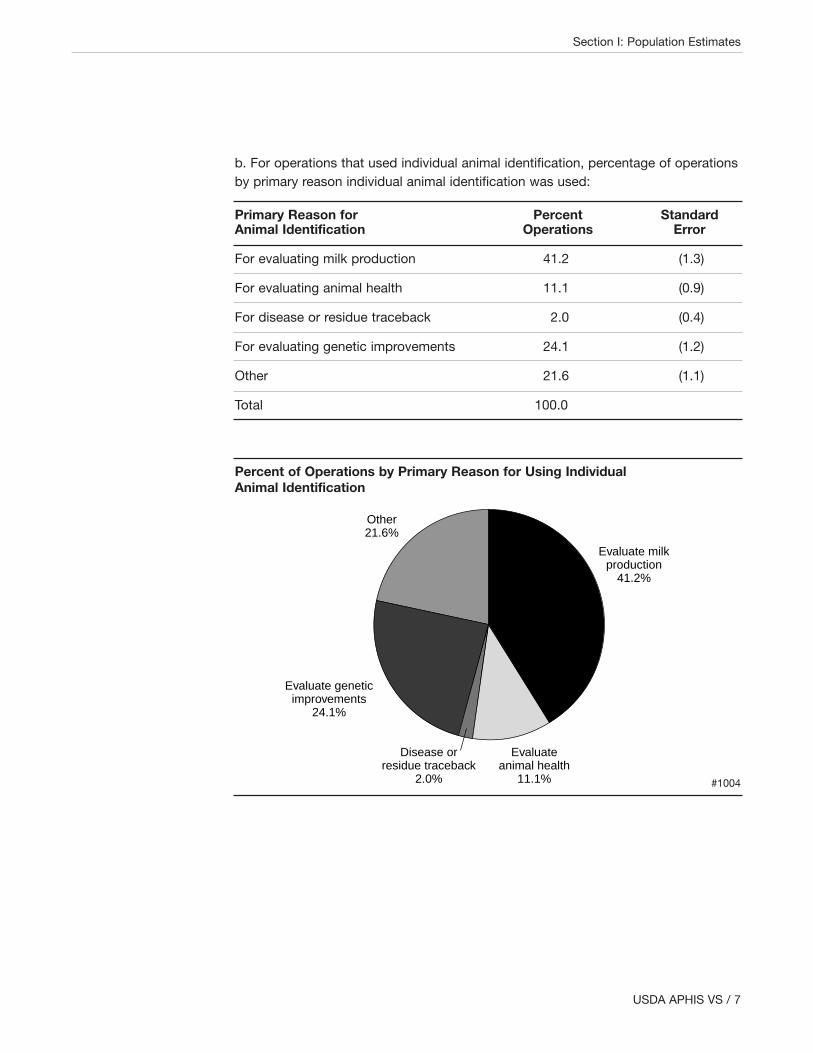
b. For operations that used individual animal identification, percentage of operationsby primary reason individual animal identification was used:
Primary Reason for Percent StandardAnimal Identification Operations Error
For evaluating milk production 41.2 (1.3)
For evaluating animal health 11.1 (0.9)
For disease or residue traceback 2.0 (0.4)
For evaluating genetic improvements 24.1 (1.2)
Other 21.6 (1.1)
Total 100.0
USDA APHIS VS / 7
Section I: Population Estimates
Evaluate milkproduction
41.2%
Other21.6%
Evaluate geneticimprovements
24.1%
Disease orresidue traceback
2.0%
Evaluateanimal health
11.1%
Percent of Operations by Primary Reason for Using IndividualAnimal Identification
#1004
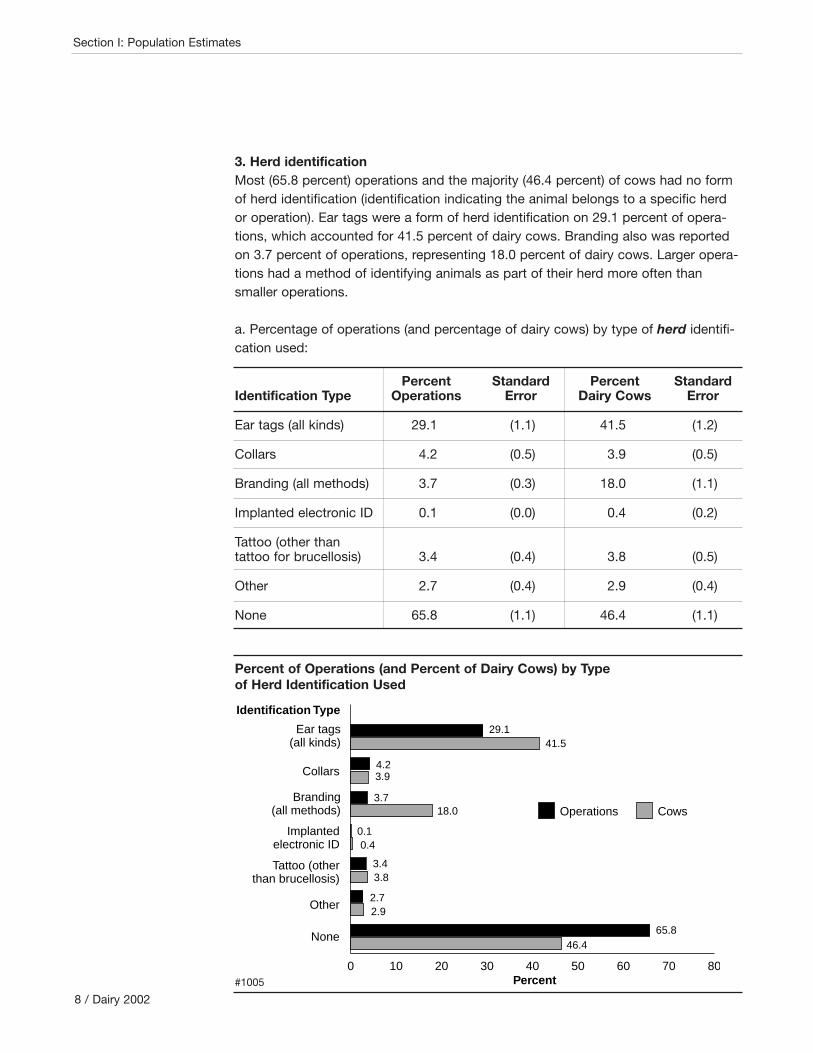
3. Herd identificationMost (65.8 percent) operations and the majority (46.4 percent) of cows had no formof herd identification (identification indicating the animal belongs to a specific herdor operation). Ear tags were a form of herd identification on 29.1 percent of opera-tions, which accounted for 41.5 percent of dairy cows. Branding also was reportedon 3.7 percent of operations, representing 18.0 percent of dairy cows. Larger opera-tions had a method of identifying animals as part of their herd more often thansmaller operations.
a. Percentage of operations (and percentage of dairy cows) by type of herd identifi-cation used:
Percent Standard Percent StandardIdentification Type Operations Error Dairy Cows Error
Ear tags (all kinds) 29.1 (1.1) 41.5 (1.2)
Collars 4.2 (0.5) 3.9 (0.5)
Branding (all methods) 3.7 (0.3) 18.0 (1.1)
Implanted electronic ID 0.1 (0.0) 0.4 (0.2)
Tattoo (other than tattoo for brucellosis) 3.4 (0.4) 3.8 (0.5)
Other 2.7 (0.4) 2.9 (0.4)
None 65.8 (1.1) 46.4 (1.1)
8 / Dairy 2002
Section I: Population Estimates
0 10 20 30 40 50 60 70 80
Identification Type
Ear tags(all kinds)
Collars
Branding(all methods)
Implantedelectronic ID
Tattoo (otherthan brucellosis)
Other
None
Operations Cows
29.141.5
4.23.9
3.718.0
0.10.4
3.43.8
2.72.9
65.846.4
Percent
Percent of Operations (and Percent of Dairy Cows) by Typeof Herd Identification Used
#1005
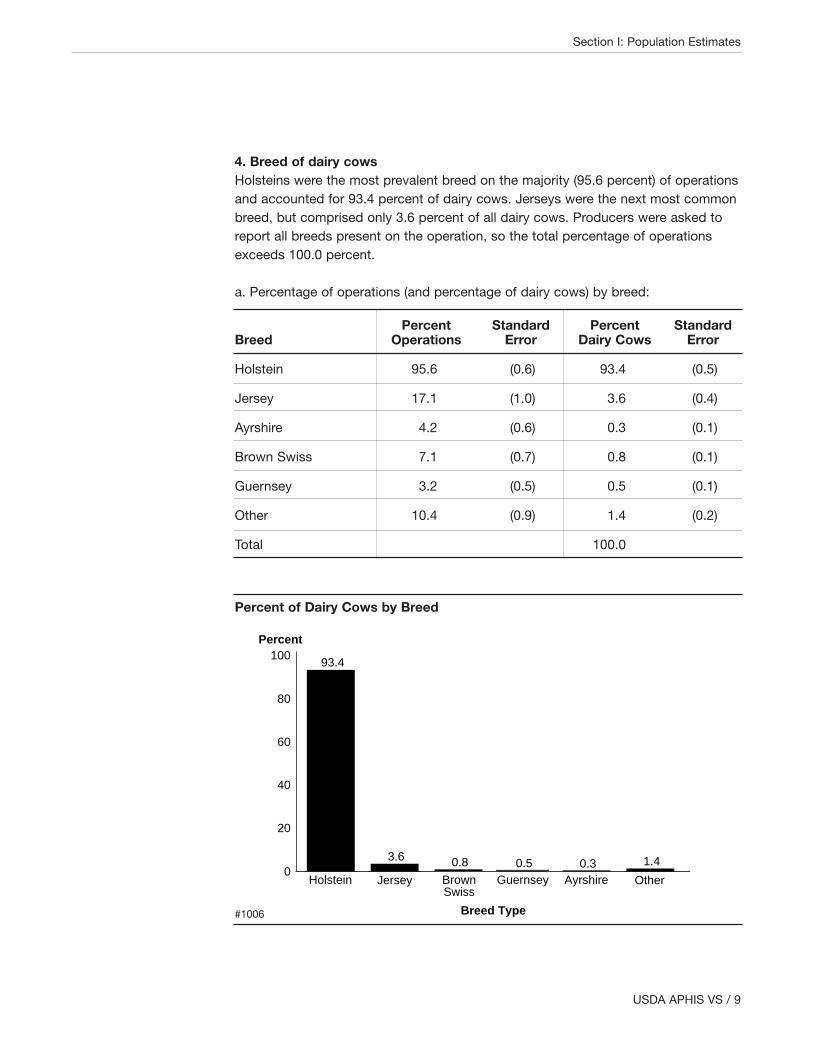
4. Breed of dairy cowsHolsteins were the most prevalent breed on the majority (95.6 percent) of operationsand accounted for 93.4 percent of dairy cows. Jerseys were the next most commonbreed, but comprised only 3.6 percent of all dairy cows. Producers were asked toreport all breeds present on the operation, so the total percentage of operationsexceeds 100.0 percent.
a. Percentage of operations (and percentage of dairy cows) by breed:
Percent Standard Percent StandardBreed Operations Error Dairy Cows Error
Holstein 95.6 (0.6) 93.4 (0.5)
Jersey 17.1 (1.0) 3.6 (0.4)
Ayrshire 4.2 (0.6) 0.3 (0.1)
Brown Swiss 7.1 (0.7) 0.8 (0.1)
Guernsey 3.2 (0.5) 0.5 (0.1)
Other 10.4 (0.9) 1.4 (0.2)
Total 100.0
USDA APHIS VS / 9
Section I: Population Estimates
93.4
3.6 0.8 0.5 0.3 1.40
20
40
60
80
100Percent
Holstein Jersey BrownSwiss
Guernsey Ayrshire Other
Breed Type
Percent of Dairy Cows by Breed
#1006
Holsteins were the main breed on 92.4 percent of operations. Jerseys were the mainbreed on 3.8 percent of operations.
b. Percentage of operations by main breed:
Breed Percent Operations Standard Error
Holstein 92.4 (0.7)
Jersey 3.8 (0.5)
Ayrshire 0.3 (0.1)
Brown Swiss 0.9 (0.2)
Guernsey 1.1 (0.3)
Other 1.5 (0.4)
Total 100.0
5. Cow registrationLarge herds had the smallest percentage (7.2 percent) of dairy cows registered,compared to medium herds (18.5 percent) and small herds (15.9 percent). Themajority (71.6 percent) of operations surveyed did not own any registered dairycows, while 7.6 percent of operations owned registered dairy cows exclusively. Most(76.9 percent) operations had less than 10.0 percent of their dairy cows registered.
a. Percentage of dairy cows registered with a breed association, by herd size:
Percent Dairy Cows
Herd Size (Number of Dairy Cows)Small Medium Large
(Less than 100) (100-499) (500 or More) All Operations
Std. Std. Std. Std.Percent Error Percent Error Percent Error Percent Error
15.9 (1.1) 18.5 (1.3) 7.2 (1.1) 13.5 (0.7)
10 / Dairy 2002
Section I: Population Estimates

b. Percentage of operations by percentage of dairy cows registered:
Percent of Dairy Cows Registered Percent Operations Standard Error
0 71.6 (1.2)
1 to 24.9 9.4 (0.7)
25 to 49.9 4.0 (0.6)
50 to 74.9 3.2 (0.4)
75 to 99.9 4.2 (0.5)
100 7.6 (0.7)
Total 100.0
c. Percentage of operations by registration level (percentage of dairy cows regis-tered) and by herd size:
Herd Size (Number of Dairy Cows)Small Medium Large
(Less than 100) (100-499) (500 or More) All Operations
Percent of Dairy Cows Percent Std. Percent Std. Percent Std. Percent Std.Registered Oper. Error Oper. Error Oper. Error Oper. Error
Less than 10 78.3 (1.4) 69.9 (1.9) 85.7 (1.8) 76.9 (1.1)
10 to 75.9 11.1 (1.0) 15.5 (1.5) 10.2 (1.5) 12.0 (0.8)
76 or more 10.6 (1.0) 14.6 (1.4) 4.1 (1.1) 11.1 (0.8)
Total 100.0 100.0 100.0 100.0
USDA APHIS VS / 11
Section I: Population Estimates
6. Number of bulls usedMost (54.9 percent) operations used bulls as a component of their breeding pro-gram, and 89.3 percent of these bulls were dairy bulls.
a. Percentage of operations by the number of bulls in the January 1, 2002, inventoryused for breeding dairy cows or heifers:
Number of Bulls Used Percent Operations Standard Error
0 45.1 (1.4)
1 31.1 (1.3)
2 to 4 19.1 (1.0)
5 or more 4.7 (0.3)
Total 100.0
b. Percentage of bulls used for breeding dairy cows or heifers that were dairy bulls:
Percent Dairy Bulls Standard Error
89.3 (1.3)
7. Rolling herd average milk productionThe rolling herd average (RHA) was 18,235 pounds per cow (averaged across alloperations) and 20,210 pounds per cow (averaged across all cows). RHA increasedas herd size increased.
a. Percentage of operations by rolling herd average milk production:
Average (in Pounds) Percent Operations Standard Error
Less than 14,000 13.1 (1.0)
14,000 to 15,999 12.9 (0.9)
16,000 to 17,999 16.0 (0.9)
18,000 to 19,999 23.1 (1.1)
20,000 to 21,999 16.8 (1.0)
22,000 or more 18.1 (0.9)
Total 100.0
12 / Dairy 2002
Section I: Population Estimates
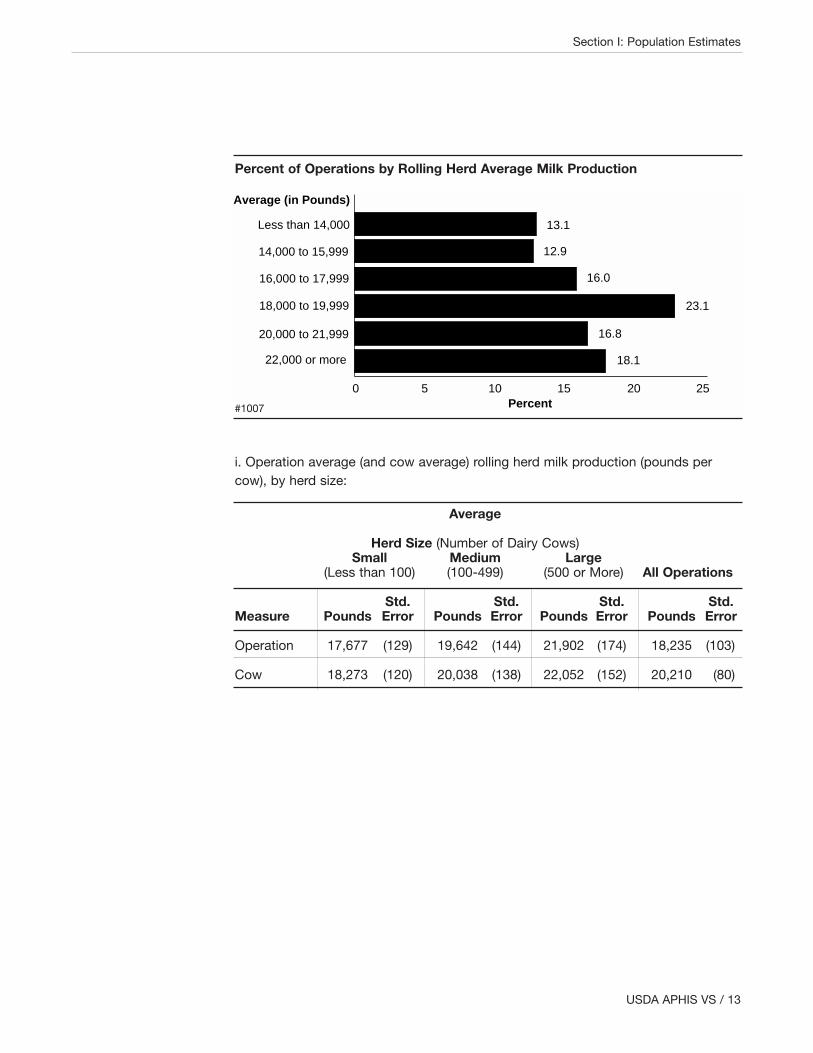
i. Operation average (and cow average) rolling herd milk production (pounds percow), by herd size:
Average
Herd Size (Number of Dairy Cows)Small Medium Large
(Less than 100) (100-499) (500 or More) All Operations
Std. Std. Std. Std.Measure Pounds Error Pounds Error Pounds Error Pounds Error
Operation 17,677 (129) 19,642 (144) 21,902 (174) 18,235 (103)
Cow 18,273 (120) 20,038 (138) 22,052 (152) 20,210 (80)
USDA APHIS VS / 13
Section I: Population Estimates
0 5 10 15 20 25Percent
Less than 14,000
14,000 to 15,999
16,000 to 17,999
20,000 to 21,999
22,000 or more
Average (in Pounds)
18,000 to 19,999
13.1
12.9
16.0
23.1
16.8
18.1
Percent of Operations by Rolling Herd Average Milk Production
#1007
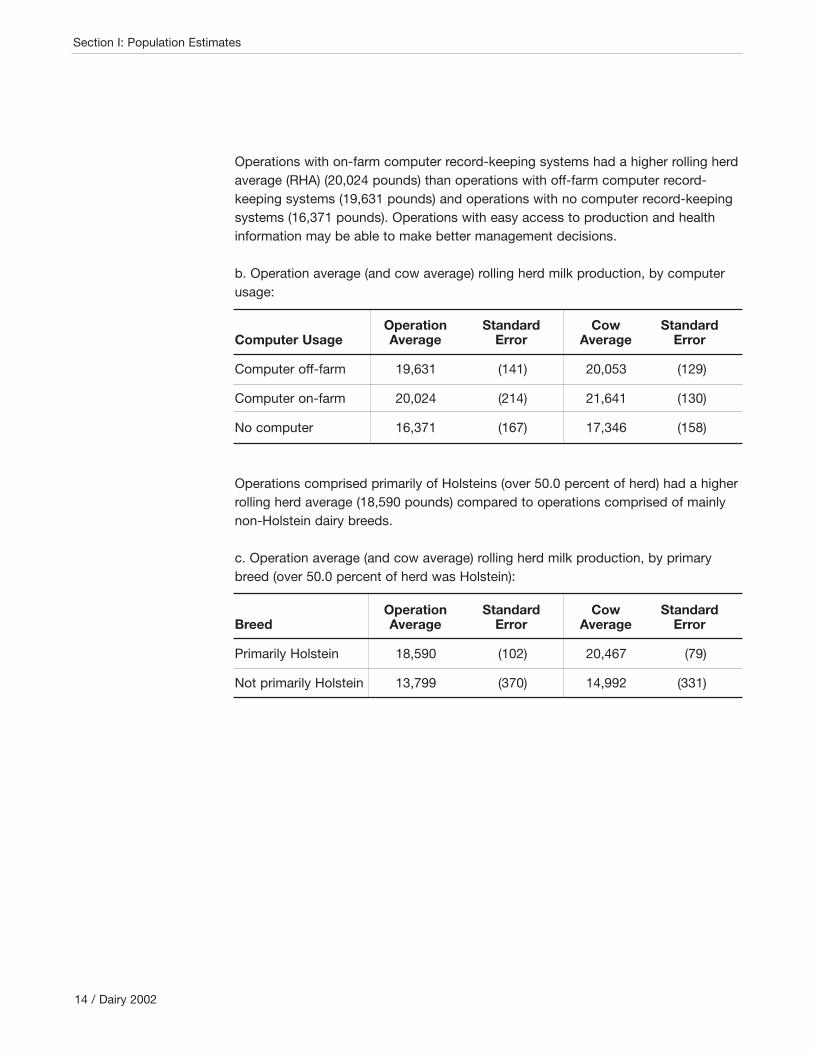
Operations with on-farm computer record-keeping systems had a higher rolling herdaverage (RHA) (20,024 pounds) than operations with off-farm computer record-keeping systems (19,631 pounds) and operations with no computer record-keepingsystems (16,371 pounds). Operations with easy access to production and healthinformation may be able to make better management decisions.
b. Operation average (and cow average) rolling herd milk production, by computerusage:
Operation Standard Cow StandardComputer Usage Average Error Average Error
Computer off-farm 19,631 (141) 20,053 (129)
Computer on-farm 20,024 (214) 21,641 (130)
No computer 16,371 (167) 17,346 (158)
Operations comprised primarily of Holsteins (over 50.0 percent of herd) had a higherrolling herd average (18,590 pounds) compared to operations comprised of mainlynon-Holstein dairy breeds.
c. Operation average (and cow average) rolling herd milk production, by primarybreed (over 50.0 percent of herd was Holstein):
Operation Standard Cow StandardBreed Average Error Average Error
Primarily Holstein 18,590 (102) 20,467 (79)
Not primarily Holstein 13,799 (370) 14,992 (331)
14 / Dairy 2002
Section I: Population Estimates
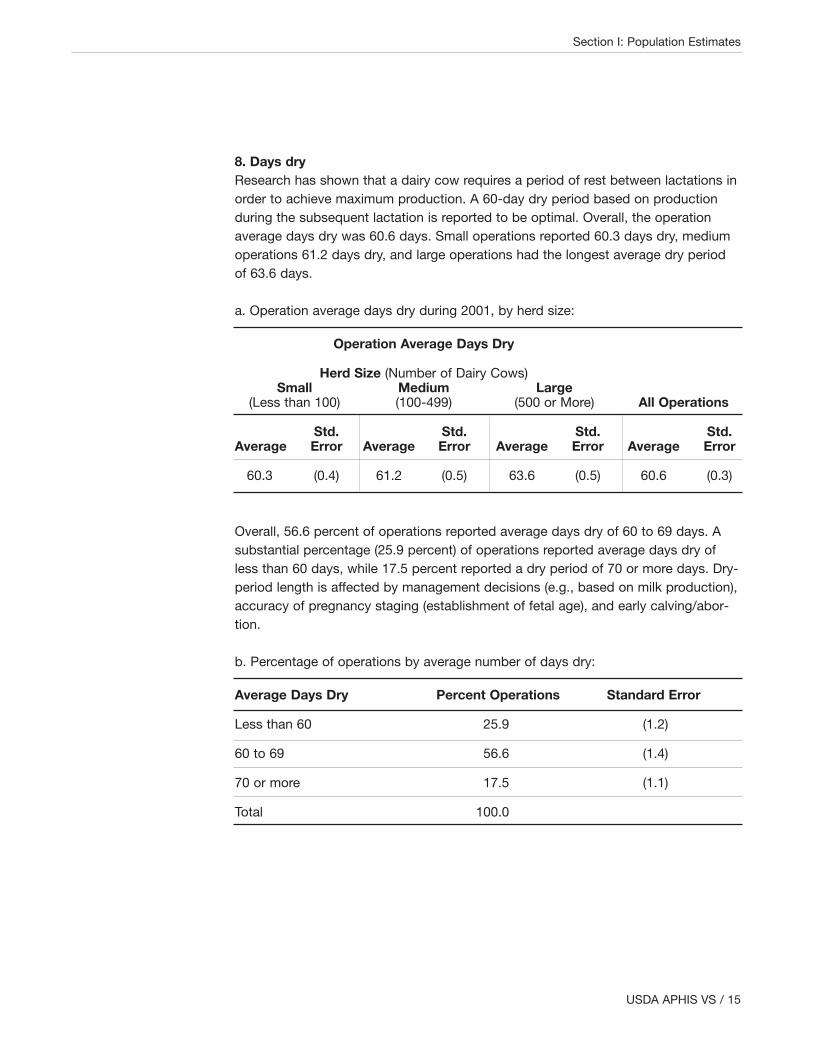
8. Days dryResearch has shown that a dairy cow requires a period of rest between lactations inorder to achieve maximum production. A 60-day dry period based on productionduring the subsequent lactation is reported to be optimal. Overall, the operationaverage days dry was 60.6 days. Small operations reported 60.3 days dry, mediumoperations 61.2 days dry, and large operations had the longest average dry periodof 63.6 days.
a. Operation average days dry during 2001, by herd size:
Operation Average Days Dry
Herd Size (Number of Dairy Cows)Small Medium Large
(Less than 100) (100-499) (500 or More) All Operations
Std. Std. Std. Std.Average Error Average Error Average Error Average Error
60.3 (0.4) 61.2 (0.5) 63.6 (0.5) 60.6 (0.3)
Overall, 56.6 percent of operations reported average days dry of 60 to 69 days. Asubstantial percentage (25.9 percent) of operations reported average days dry ofless than 60 days, while 17.5 percent reported a dry period of 70 or more days. Dry-period length is affected by management decisions (e.g., based on milk production),accuracy of pregnancy staging (establishment of fetal age), and early calving/abor-tion.
b. Percentage of operations by average number of days dry:
Average Days Dry Percent Operations Standard Error
Less than 60 25.9 (1.2)
60 to 69 56.6 (1.4)
70 or more 17.5 (1.1)
Total 100.0
USDA APHIS VS / 15
Section I: Population Estimates

9. Calving intervalDairy cows are most productive when they conceive within 90 days after calving,calve and reach peak milk production as quickly and as often as possible. Calvinginterval is a measure of reproductive efficiency, and the recommended interval is 12to 13 months. Overall, operations reported an average calving interval of 13.3months. As farm size increased, the calving interval increased slightly.
a. Operation average calving interval (in months) for dairy cows during 2001, by herdsize:
Operation Average (in Months)
Herd Size (Number of Dairy Cows)Small Medium Large
(Less than 100) (100-499) (500 or More) All Operations
Std. Std. Std. Std.Average Error Average Error Average Error Average Error
13.2 (0.1) 13.4 (0.1) 13.7 (0.1) 13.3 (0.0)
Most (53.1 percent) operations reported a calving interval of less than 13 months.Only 3.9 percent of operations reported a 16-month or longer calving interval.
b. Percentage of operations by calving interval (in months) for dairy cows:
Number of Months Percent Operations Standard Error
Less than 13 53.1 (1.4)
13 to 15 43.0 (1.3)
16 or more 3.9 (0.6)
Total 100.0
16 / Dairy 2002
Section I: Population Estimates
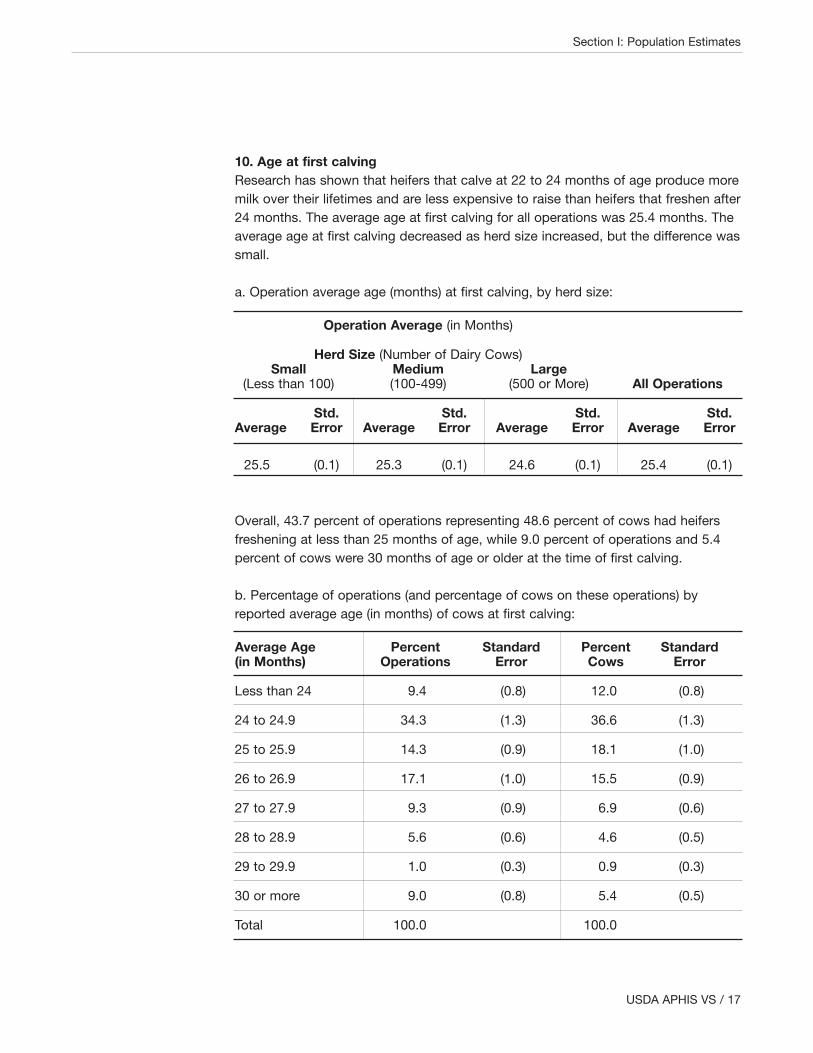
10. Age at first calvingResearch has shown that heifers that calve at 22 to 24 months of age produce moremilk over their lifetimes and are less expensive to raise than heifers that freshen after24 months. The average age at first calving for all operations was 25.4 months. Theaverage age at first calving decreased as herd size increased, but the difference wassmall.
a. Operation average age (months) at first calving, by herd size:
Operation Average (in Months)
Herd Size (Number of Dairy Cows)Small Medium Large
(Less than 100) (100-499) (500 or More) All Operations
Std. Std. Std. Std.Average Error Average Error Average Error Average Error
25.5 (0.1) 25.3 (0.1) 24.6 (0.1) 25.4 (0.1)
Overall, 43.7 percent of operations representing 48.6 percent of cows had heifersfreshening at less than 25 months of age, while 9.0 percent of operations and 5.4percent of cows were 30 months of age or older at the time of first calving.
b. Percentage of operations (and percentage of cows on these operations) byreported average age (in months) of cows at first calving:
Average Age Percent Standard Percent Standard(in Months) Operations Error Cows Error
Less than 24 9.4 (0.8) 12.0 (0.8)
24 to 24.9 34.3 (1.3) 36.6 (1.3)
25 to 25.9 14.3 (0.9) 18.1 (1.0)
26 to 26.9 17.1 (1.0) 15.5 (0.9)
27 to 27.9 9.3 (0.9) 6.9 (0.6)
28 to 28.9 5.6 (0.6) 4.6 (0.5)
29 to 29.9 1.0 (0.3) 0.9 (0.3)
30 or more 9.0 (0.8) 5.4 (0.5)
Total 100.0 100.0
USDA APHIS VS / 17
Section I: Population Estimates
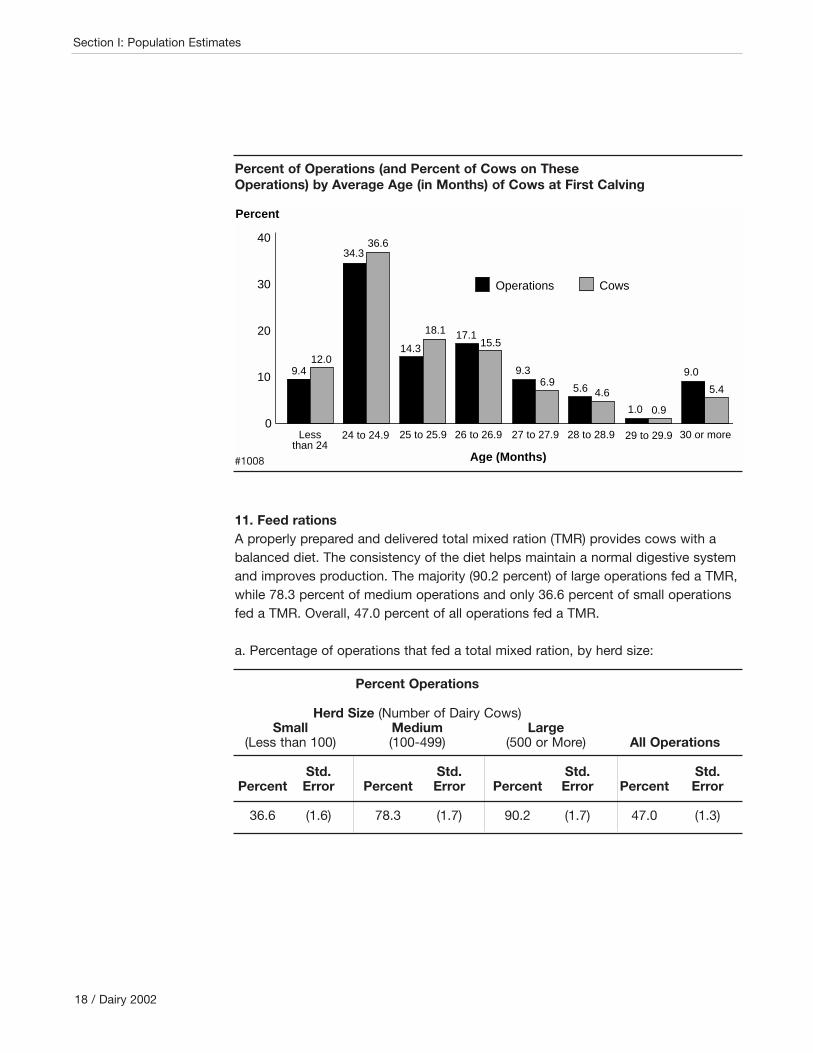
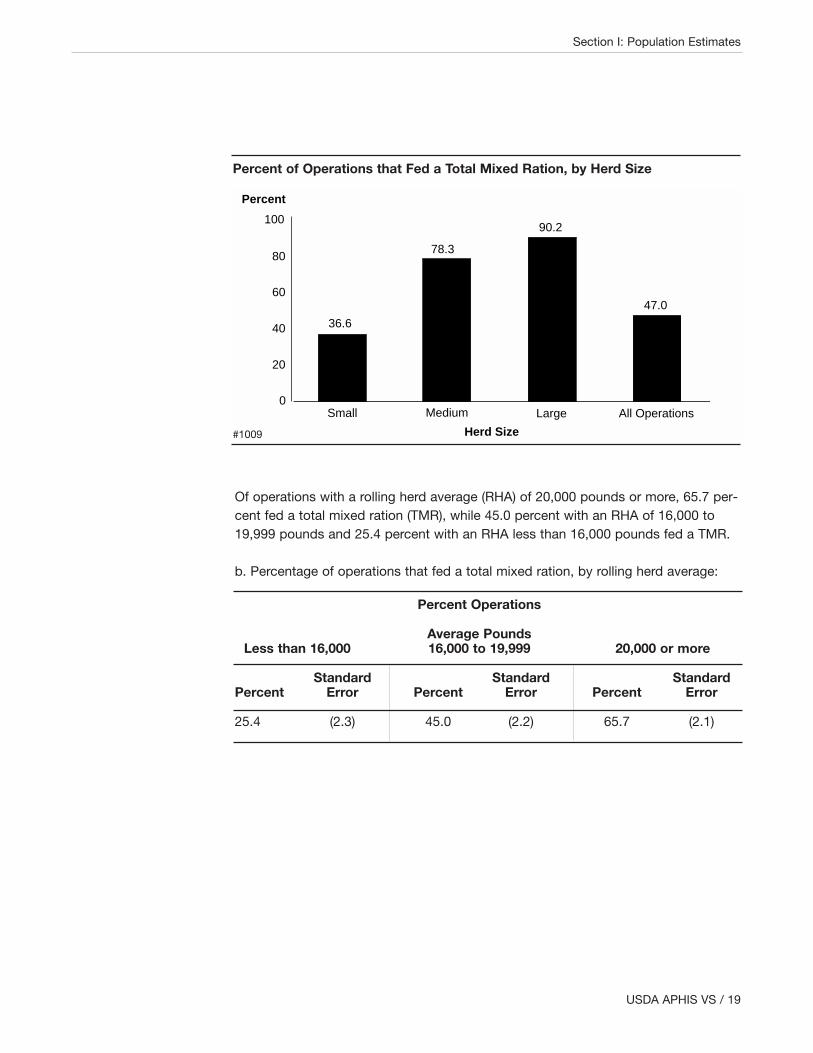
11. Feed rationsA properly prepared and delivered total mixed ration (TMR) provides cows with abalanced diet. The consistency of the diet helps maintain a normal digestive systemand improves production. The majority (90.2 percent) of large operations fed a TMR,while 78.3 percent of medium operations and only 36.6 percent of small operationsfed a TMR. Overall, 47.0 percent of all operations fed a TMR.
a. Percentage of operations that fed a total mixed ration, by herd size:
Percent Operations
Herd Size (Number of Dairy Cows)Small Medium Large
(Less than 100) (100-499) (500 or More) All Operations
Std. Std. Std. Std.Percent Error Percent Error Percent Error Percent Error
36.6 (1.6) 78.3 (1.7) 90.2 (1.7) 47.0 (1.3)
18 / Dairy 2002
Section I: Population Estimates
0
10
20
30
40
Operations Cows
Lessthan 24
24 to 24.9 25 to 25.9 26 to 26.9 27 to 27.9 28 to 28.9 29 to 29.9 30 or more
Percent
Age (Months)
9.412.0
34.336.6
14.3
18.1 17.115.5
9.36.9
5.6 4.6
1.0 0.9
9.0
5.4
Percent of Operations (and Percent of Cows on TheseOperations) by Average Age (in Months) of Cows at First Calving
#1008
Of operations with a rolling herd average (RHA) of 20,000 pounds or more, 65.7 per-cent fed a total mixed ration (TMR), while 45.0 percent with an RHA of 16,000 to19,999 pounds and 25.4 percent with an RHA less than 16,000 pounds fed a TMR.
b. Percentage of operations that fed a total mixed ration, by rolling herd average:
Percent Operations
Average PoundsLess than 16,000 16,000 to 19,999 20,000 or more
Standard Standard StandardPercent Error Percent Error Percent Error
25.4 (2.3) 45.0 (2.2) 65.7 (2.1)
USDA APHIS VS / 19
Section I: Population Estimates
0
20
40
60
80
100
Small Medium Large All Operations
Herd Size
Percent
36.6
78.3
90.2
47.0
Percent of Operations that Fed a Total Mixed Ration, by Herd Size
#1009

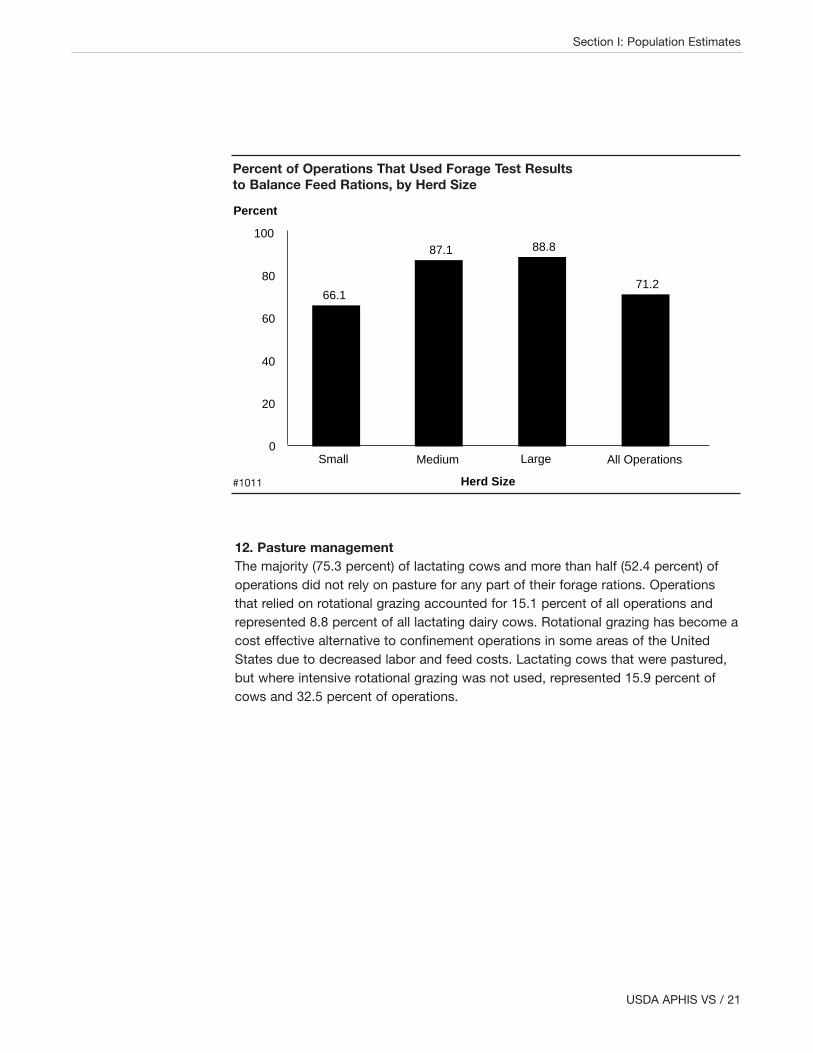
Forage testing allows producers to optimize purchased feeds and also manage con-sumption of nutrients. Ration formulation balances nutrients, including protein, ener-gy, fiber, and minerals. For example, increased potassium intake by dry cowsincreases the probability that they will develop hypocalcemia (milk fever) at freshen-ing, and potassium intake can be decreased when the forage level is known. Most(71.2 percent) operations used forage test results to balance feed rations. Large andmedium operations used forage results more often (88.8 percent and 87.1 percent,respectively) than small operations (66.1 percent).
c. Percentage of operations that used forage test results to balance feed rations, byherd size:
Percent Operations
Herd Size (Number of Dairy Cows)Small Medium Large
(Less than 100) (100-499) (500 or More) All Operations
Std. Std. Std. Std.Percent Error Percent Error Percent Error Percent Error
66.1 (1.6) 87.1 (1.3) 88.8 (1.8) 71.2 (1.2)
20 / Dairy 2002
Section I: Population Estimates
0
15
30
45
60
75
Less than16,000 pounds
16,000 to19,999 pounds
20,000 poundsor more
Rolling Herd Average
Percent
25.4
45.0
65.7
Percent of Operations that Fed a Total Mixed Ration,by Rolling Herd Average
#1010
12. Pasture managementThe majority (75.3 percent) of lactating cows and more than half (52.4 percent) ofoperations did not rely on pasture for any part of their forage rations. Operationsthat relied on rotational grazing accounted for 15.1 percent of all operations andrepresented 8.8 percent of all lactating dairy cows. Rotational grazing has become acost effective alternative to confinement operations in some areas of the UnitedStates due to decreased labor and feed costs. Lactating cows that were pastured,but where intensive rotational grazing was not used, represented 15.9 percent ofcows and 32.5 percent of operations.
USDA APHIS VS / 21
Section I: Population Estimates
66.1
87.1 88.8
71.2
0
20
40
60
80
100
Small Medium All Operations
Percent
Herd Size
Large
Percent of Operations That Used Forage Test Resultsto Balance Feed Rations, by Herd Size
#1011

a. Percentage of operations (and percentage of cows on these operations) by prac-tice that best describes the operations’ use of pasture during the growing season aspart of forage rations for lactating cows:
Percent Standard Percent StandardPasture Usage Operations Error Cows Error
Did not rely on pasture for any part of lactating cows’ rations 52.4 (1.3) 75.3 (0.8)
Relied on pasture to provide forage for lactating cows and moved cows to new pasture at least once a week 15.1 (1.0) 8.8 (0.6)
Relied on pasture to provide forage for lactating cows but did not move cows to new pasture at least once a week 32.5 (1.3) 15.9 (0.7)
Total 100.0 100.0
22 / Dairy 2002
Section I: Population Estimates
52.4%
15.1%
32.5%
Operations
8.8%
15.9%
Cows
Did not rely on pasture for any part of rationUsed pasture for forage and moved cows to new pasture once a weekUsed pasture for forage but did not move cows once a week
75.3%
Percent of Operations (and Percent of Cows) by Practice that Best Describesthe Operations’ Use of Pasture as Part of Forage Rations for Lactating Cows
#1012

13. Bovine somatotropin (bST)Bovine somatotropin (bST) is a hormone that increases milk production. Overall,15.2 percent of operations used bST, while 22.3 percent of cows received the hor-mone. Large operations used bST most commonly (54.4 percent), followed by themedium operations (32.2 percent) and small operations (8.8 percent).
a. Percentage of operations (and percentage of cows milked on January 1, 2002)that used bST in cows during the current lactation (at the time of the Dairy 2002interview), by herd size:
Percent
Herd Size (Number of Dairy Cows)Small Medium Large
(Less than 100) (100-499) (500 or More) All Operations
Std. Std. Std. Std.Measure Percent Error Percent Error Percent Error Percent Error
Operations 8.8 (0.8) 32.2 (1.9) 54.4 (2.6) 15.2 (0.8)
Cows 6.2 (0.7) 24.5 (1.5) 34.1 (1.8) 22.3 (0.8)
USDA APHIS VS / 23
Section I: Population Estimates
6.2
24.5
34.1
22.3
8.8
32.2
54.4
15.2
0
10
20
30
40
50
60
Operations CowsPercent
LargeMediumSmall All operationsHerd Size
Percent of Operations (and Percent Cows*) that Used bST in CowsDuring the Current Lactation (at the Time of Interview), by Herd Size
#1013
* Cows milked on January 1, 2002
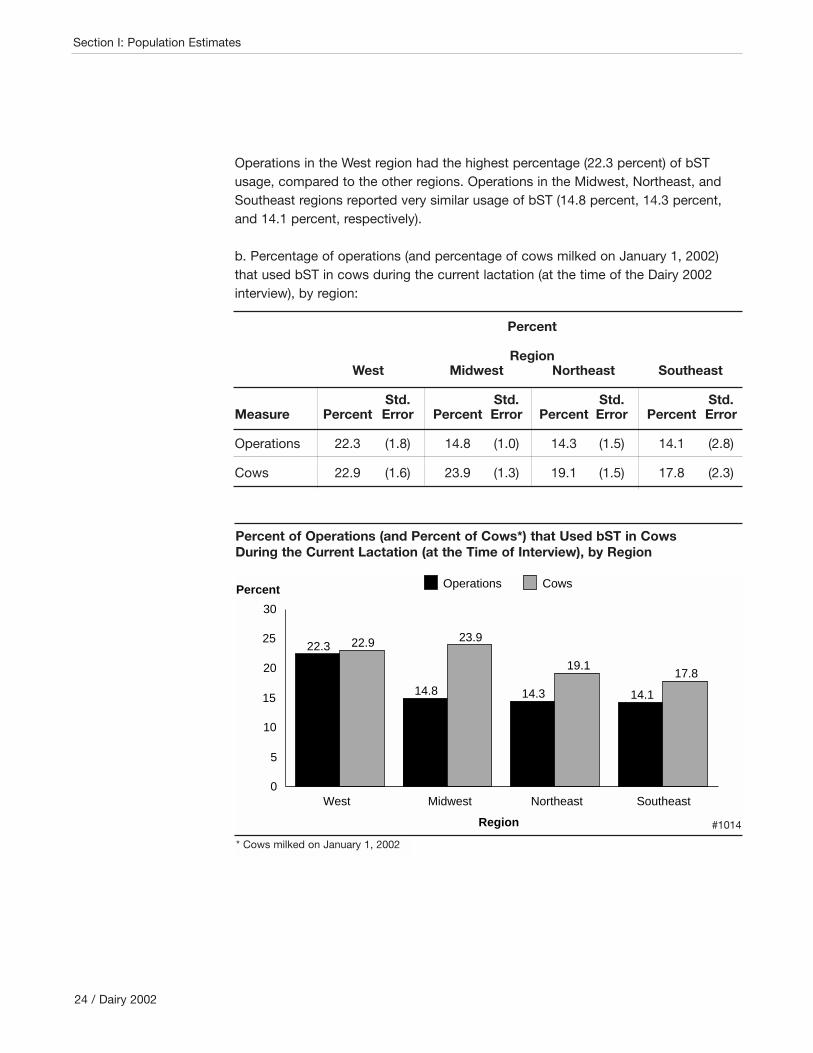
Operations in the West region had the highest percentage (22.3 percent) of bSTusage, compared to the other regions. Operations in the Midwest, Northeast, andSoutheast regions reported very similar usage of bST (14.8 percent, 14.3 percent,and 14.1 percent, respectively).
b. Percentage of operations (and percentage of cows milked on January 1, 2002)that used bST in cows during the current lactation (at the time of the Dairy 2002interview), by region:
Percent
RegionWest Midwest Northeast Southeast
Std. Std. Std. Std.Measure Percent Error Percent Error Percent Error Percent Error
Operations 22.3 (1.8) 14.8 (1.0) 14.3 (1.5) 14.1 (2.8)
Cows 22.9 (1.6) 23.9 (1.3) 19.1 (1.5) 17.8 (2.3)
24 / Dairy 2002
Section I: Population Estimates
22.9 23.9
19.117.8
22.3
14.8 14.3 14.1
0
5
10
15
20
25
30
Operations CowsPercent
West Midwest Northeast Southeast
Region
Percent of Operations (and Percent of Cows*) that Used bST in CowsDuring the Current Lactation (at the Time of Interview), by Region
#1014
* Cows milked on January 1, 2002

According to the bST product label, for optimal efficiency bST should be adminis-tered to cows 57 to 70 days after calving. Overall, 49.6 percent of operations fol-lowed the manufacturer’s guidelines, while 43.5 percent administered bST 71 ormore days after calving. Delayed administration of bST may benefit reproduction infirst-calf heifers as well as cows with lower body condition scores. A total of 5.0 per-cent of operations administered bST 31 to 56 days after calving, and 1.9 percentadministered the hormone 30 days or less after calving.
c. For operations that used bST, percentage of operations by number of days aftercalving that the initial dose of bST was administered:
Number Days After CalvingInitial Dose of bST Administered Percent Operations Standard Error
30 or less 1.9 (0.8)
31 to 56 5.0 (1.9)
57 to 70 49.6 (3.6)
71 or more 43.5 (3.6)
Total 100.0
For all operations, 81 days was the average number of days after calving that theinitial dose of bST was administered.
d. Operation average number of days after calving that the initial dose of bST wasadministered:
Operation Average Days Standard Error
81 (2.2)
USDA APHIS VS / 25
Section I: Population Estimates
Approximately 80 percent of operations administered the final dose of bST 250 daysor more after calving, while 47.5 percent gave the last dose of bST 250 to 299 daysafter calving, and 32.6 percent administered the final dose 300 or more days post-calving.
e. For operations that used bST, percentage of operations by number of days aftercalving that the last dose of bST was administered:
Number Days After CalvingLast Dose of bST Administered Percent Operations Standard Error
Less than 200 10.1 (1.8)
200 to 249 9.8 (2.3)
250 to 299 47.5 (3.6)
300 or more 32.6 (3.1)
Total 100.0
The industry goal for dry-off is 305 days post-calving. The manufacturer suggestsadministering bST 14 days before dry-off (291 days after calving). For all operations,270 days was the average number of days after calving that the final dose of bSTwas given.
f. Operation average number of days into lactation that the last dose of bST wasadministered:
Operation Average Days Standard Error
270 (4.3)
26 / Dairy 2002
Section I: Population Estimates

The majority of operations that reported “other” cited a combination of cost, animalhealth, public health, and too difficult to administer as the primary reason bST wasnot used.
g. For operations not using bST, percentage of operations by primary reason bSTwas not used:
Reason bST Not Used Percent Operations Standard Error
Cost 19.7 (1.2)
Animal health 26.1 (1.3)
Public health 7.9 (0.8)
Too difficult to administer 9.1 (0.9)
Other 37.2 (1.5)
Total 100.0
14. DrenchingOral drenching with an energy source at the time of calving may be effective inreducing energy deficits and improving milk production (Stokes, et. al.). Overall, 20.1percent of operations reported drenching. Only 28.9 percent of cows received anoral drench at the time of freshening. Routine drenching was most common on largeoperations (39.4 percent) and least common on small operations (18.9 percent).
a. Percentage of operations (and percentage of cows on these operations) that rou-tinely drenched (oral liquid or paste) dairy cows with propylene glycol or anotherenergy source (e.g., glycerol, calcium propionate), by herd size:
Percent
Herd Size (Number of Dairy Cows)Small Medium Large
(Less than 100) (100-499) (500 or More) All Operations
Std. Std. Std. Std.Measure Percent Error Percent Error Percent Error Percent Error
Operations 18.9 (1.3) 21.3 (1.7) 39.4 (2.7) 20.1 (1.1)
Cows 21.8 (1.5) 23.8 (1.9) 39.3 (2.6) 28.9 (1.2)
USDA APHIS VS / 27
Section I: Population Estimates

15. Quality assurance programsQuality assurance programs (QAPs) provide guidelines designed to ensure that man-agement, animal health, and husbandry practices are followed in order to producequality products. Overall, 40.6 percent of all operations participated in one or moreQAP1. Across all herd sizes, local milk cooperative/processor sponsored programshad the highest overall percentage of participants (35.2 percent of operations).Regardless of herd size, national industry sponsored programs had the lowest per-centage of participants (2.8 percent of operations). Participation in QAPs decreasedas herd size decreased.
a. Percentage of operations that participated in the following types of quality assur-ance programs during 2001, by herd size:
Percent Operations
Herd Size (Number of Dairy Cows)Small Medium Large
(Less than 100) (100-499) (500 or More) All Operations
QualityAssurance Std. Std. Std. Std.Program Percent Error Percent Error Percent Error Percent Error
State sponsored 5.6 (0.7) 14.3 (1.4) 15.9 (1.9) 7.8 (0.6)
Local milk cooperative/processor sponsored 32.3 (1.6) 42.7 (2.0) 54.5 (2.7) 35.2 (1.3)
National industry sponsored 2.5 (0.5) 3.5 (0.8) 4.5 (1.1) 2.8 (0.4)
Other 2.7 (0.5) 2.6 (0.7) 5.0 (1.1) 2.8 (0.4)
Any of the above 36.6 (1.6) 51.4 (2.1) 62.6 (2.7) 40.6 (1.3)
1Each category of QAPs may not have been available to all operations. There arecurrently no minimum accepted standards or requirements for QAPs.
28 / Dairy 2002
Section I: Population Estimates

The West region led all regions with 57.9 percent overall participation in one or morequality assurance program (QAP). The other regions had nearly 40 percent participa-tion. The West region had the highest percentage of local milk cooperative/proces-sor sponsored involvement as well. The Southeast region had the lowest local milkcooperative/processor sponsored involvement (27.1 percent of operations).
b. Percentage of operations that participated in the following types of quality assur-ance programs during 2001, by region:
Percent Operations
RegionWest Midwest Northeast Southeast
QualityAssurance Std. Std. Std. Std.Program Percent Error Percent Error Percent Error Percent Error
State sponsored 12.7 (2.0) 7.7 (0.9) 5.2 (1.0) 13.4 (2.7)
Local milkcooperative/processor sponsored 51.6 (3.1) 34.0 (1.8) 34.8 (2.3) 27.1 (3.4)
National industry sponsored 4.6 (1.5) 3.2 (0.6) 1.5 (0.7) 2.1 (0.9)
Other 2.3 (0.7) 3.2 (0.6) 2.1 (0.7) 2.2 (0.9)
Any of the above 57.9 (3.0) 39.7 (1.8) 37.9 (2.4) 37.6 (3.5)
USDA APHIS VS / 29
Section I: Population Estimates
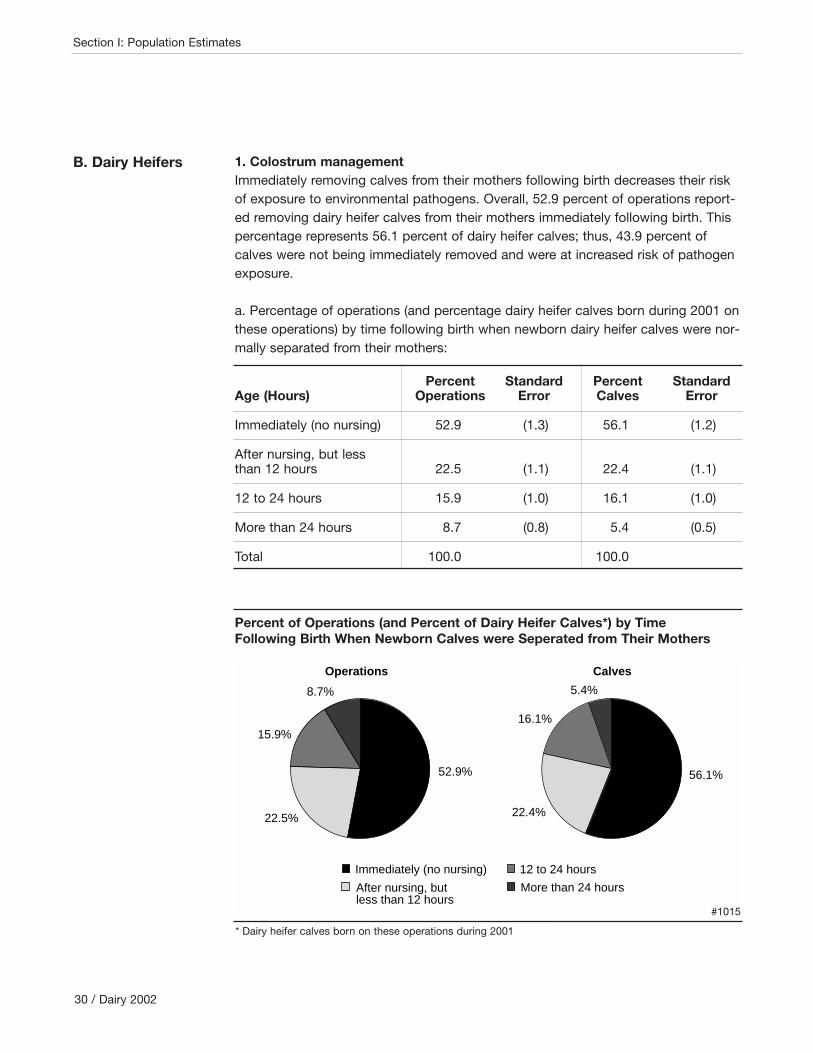
1. Colostrum managementImmediately removing calves from their mothers following birth decreases their riskof exposure to environmental pathogens. Overall, 52.9 percent of operations report-ed removing dairy heifer calves from their mothers immediately following birth. Thispercentage represents 56.1 percent of dairy heifer calves; thus, 43.9 percent ofcalves were not being immediately removed and were at increased risk of pathogenexposure.
a. Percentage of operations (and percentage dairy heifer calves born during 2001 onthese operations) by time following birth when newborn dairy heifer calves were nor-mally separated from their mothers:
Percent Standard Percent StandardAge (Hours) Operations Error Calves Error
Immediately (no nursing) 52.9 (1.3) 56.1 (1.2)
After nursing, but less than 12 hours 22.5 (1.1) 22.4 (1.1)
12 to 24 hours 15.9 (1.0) 16.1 (1.0)
More than 24 hours 8.7 (0.8) 5.4 (0.5)
Total 100.0 100.0
30 / Dairy 2002
Section I: Population Estimates
B. Dairy Heifers
52.9%
22.5%
15.9%
8.7%
Operations
56.1%
22.4%
16.1%
5.4%
Calves
Immediately (no nursing)
After nursing, butless than 12 hours
12 to 24 hours
More than 24 hours
Percent of Operations (and Percent of Dairy Heifer Calves*) by TimeFollowing Birth When Newborn Calves were Seperated from Their Mothers
#1015
* Dairy heifer calves born on these operations during 2001

By not immediately removing calves from their dams, the first feeding of colostrummay occur through nursing, therefore making it difficult to guarantee that an ade-quate amount of colostrum is consumed by the newborn calves. Colostrum feedingat first nursing occurred on 30.5 percent of operations, representing 23.1 percent ofcalves. Hand-feeding colostrum from a bucket or bottle occurred on 64.8 percent ofoperations, representing 63.5 percent of dairy heifer calves. A much smaller percent-age (4.4 percent) of operations used esophageal feeders to feed newborn dairyheifer calves.
b. Percentage of operations (and percentage of dairy heifer calves born during 2001on these operations) by method used normally for first feeding of colostrum to new-born dairy heifers:
Percent Standard Percent StandardMethod of Delivery Operations Error Calves Error
During first nursing 30.5 (1.2) 23.1 (1.0)
Hand-fed from bucket or bottle 64.8 (1.3) 63.5 (1.2)
Hand-fed using esophageal feeder 4.4 (0.5) 12.7 (0.9)
Did not get colostrum 0.3 (0.1) 0.7 (0.3)
Total 100.0 100.0
The Bovine Alliance on Management and Nutrition’s Guide to Colostrum andColostrum Management for Dairy Calves suggests that 3 quarts of high qualitycolostrum be fed to calves by nipple bottle within 1 hour of birth and repeated in 12hours; or that 4 quarts of high quality colostrum be fed by esophageal feeder within1 hour of birth. These methods ensure that newborn calves get adequate colostrum.For operations that hand-fed colostrum: 31.4 percent of operations, representing38.2 percent of calves, were feeding 4 quarts or more of colostrum; 47.2 percent ofoperations, representing 45.3 percent of calves, were feeding more than 2 quartsbut less than 4 quarts; and 21.4 percent of operations, representing 16.5 percent ofcalves, were feeding 2 quarts or less. Therefore, most hand-fed calves received atleast 2 quarts of colostrum. However, there were still a number of calves that werenot receiving an adequate quantity of colostrum.
USDA APHIS VS / 31
Section I: Population Estimates
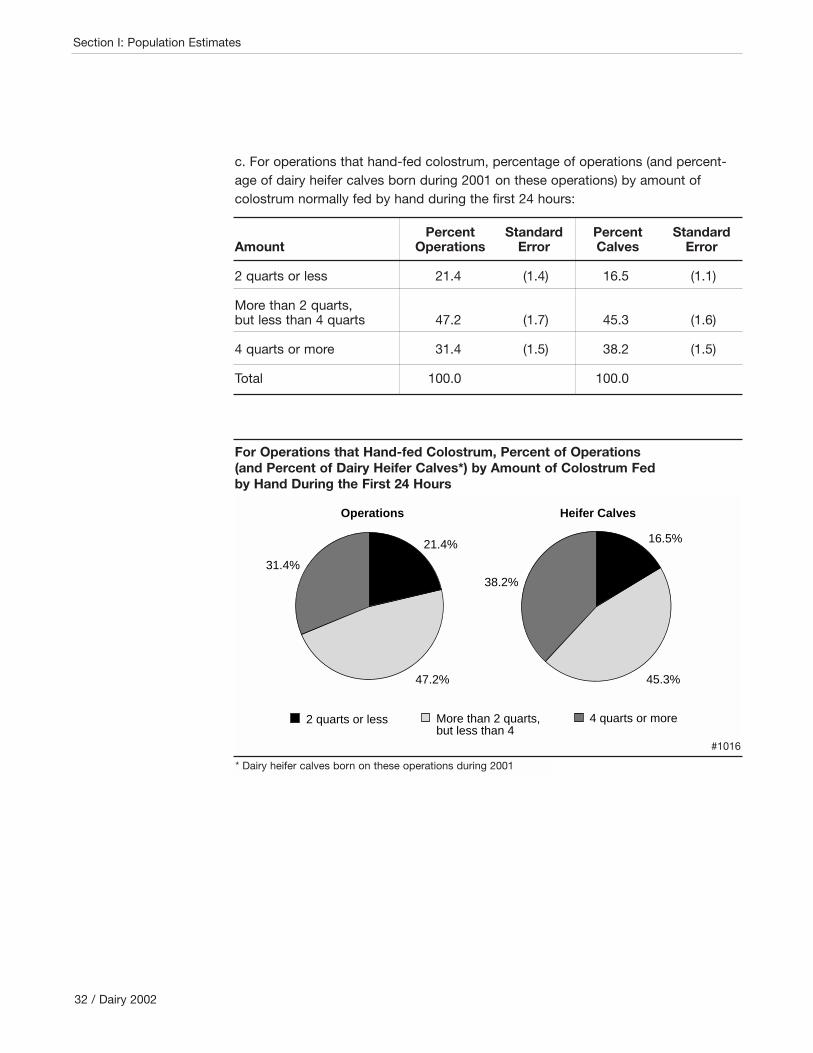
c. For operations that hand-fed colostrum, percentage of operations (and percent-age of dairy heifer calves born during 2001 on these operations) by amount ofcolostrum normally fed by hand during the first 24 hours:
Percent Standard Percent StandardAmount Operations Error Calves Error
2 quarts or less 21.4 (1.4) 16.5 (1.1)
More than 2 quarts, but less than 4 quarts 47.2 (1.7) 45.3 (1.6)
4 quarts or more 31.4 (1.5) 38.2 (1.5)
Total 100.0 100.0
32 / Dairy 2002
Section I: Population Estimates
21.4%
47.2%
31.4%
Operations
16.5%
45.3%
38.2%
Heifer Calves
2 quarts or less More than 2 quarts,but less than 4
4 quarts or more
For Operations that Hand-fed Colostrum, Percent of Operations(and Percent of Dairy Heifer Calves*) by Amount of Colostrum Fedby Hand During the First 24 Hours
#1016
* Dairy heifer calves born on these operations during 2001

Only a very small percentage (3.9 percent) of operations measured the quality ofcolostrum, although 28.6 percent of large operations had adopted this practice.
d. For operations that normally hand-fed colostrum or let calves get colostrum atfirst nursing, percentage of operations that measured immunoglobulin (Ig) levels incolostrum, by herd size:
Percent Operations
Herd Size (Number of Dairy Cows)Small Medium Large
(Less than 100) (100-499) (500 or More) All Operations
Std. Std. Std. Std.Percent Error Percent Error Percent Error Percent Error
1.5 (0.4) 8.6 (1.1) 28.6 (2.4) 3.9 (0.4)
e. For operations that measured immunoglobulin (Ig) levels, percentage of opera-tions by primary method used for measuring immunoglobulin:
Primary Method Used Percent Operations Standard Error
Colostrometer 87.7 (4.3)
Other 12.3 (4.3)
Total 100.0
Pooling colostrum from more than one cow increases the risk of spreading milk-borne pathogens to more than one calf. Overall, 27.0 percent of operations pooledcolostrum. A much higher percentage (70.6 percent) of large operations pooledcolostrum than did medium (37.4 percent) and small (22.1 percent) operations.
f. For operations that normally hand-fed colostrum, percentage of operations thatpooled colostrum from more than one cow, by herd size:
Percent Operations
Herd Size (Number of Dairy Cows)Small Medium Large
(Less than 100) (100-499) (500 or More) All Operations
Std. Std. Std. Std.Percent Error Percent Error Percent Error Percent Error
22.1 (1.4) 37.4 (2.0) 70.6 (2.4) 27.0 (1.1)
USDA APHIS VS / 33
Section I: Population Estimates

Proper storage of excess colostrum protects its quality and increases the amount ofimmunoglobulin delivered to the newborn calf. Colostrum, if fed to calves immedi-ately after collection, does not require storage. No storage of colostrum occurred on59.6 percent of operations. The most common storage methods were freezing (27.7percent of operations) and refrigeration (7.8 percent of operations). A much higherpercentage of large operations used some form of colostrum storage than did medi-um and small operations.
g. For operations that normally hand-fed colostrum, percentage of operations by pri-mary method of excess colostrum storage and by herd size:
Percent Operations
Herd Size (Number of Dairy Cows)Small Medium Large
(Less than 100) (100-499) (500 or More) All Operations
Storage Std. Std. Std. Std.Method Percent Error Percent Error Percent Error Percent Error
Stored without refrigeration 4.9 (0.8) 2.6 (0.6) 4.3 (1.2) 4.4 (0.6)
Stored in refrigerator 4.4 (0.6) 14.1 (1.4) 43.4 (2.7) 7.8 (0.6)
Stored in freezer 24.6 (1.4) 38.7 (2.0) 29.4 (2.4) 27.7 (1.1)
Other 0.7 (0.3) 0.0 (--) 0.1 (0.1) 0.5 (0.2)
Not stored 65.4 (1.6) 44.6 (2.1) 22.8 (2.4) 59.6 (1.3)
Total 100.0 100.0 100.0 100.0
34 / Dairy 2002
Section I: Population Estimates

h. For operations that normally hand-fed colostrum, percentage of operations thatpasteurized colostrum, by herd size:
Percent Operations
Herd Size (Number of Dairy Cows)Small Medium Large
(Less than 100) (100-499) (500 or More) All Operations
Std. Std. Std. Std.Percent Error Percent Error Percent Error Percent Error
0.4 (0.2) 0.8 (0.3) 3.6 (0.9) 0.6 (0.2)
USDA APHIS VS / 35
Section I: Population Estimates
0
15
30
45
60
75 Stored without refrigerationStored in refrigeratorStored in freezerOtherNot stored
Percent
Small Medium Large All Operations
Herd Size
4.9 4.4
24.6
0.7
65.4
2.6
14.1
38.7
0.0
44.6
4.3
43.4
29.4
0.1
22.8
4.47.8
27.7
0.5
59.6
Percent of Operations by Primary Method of Excess ColostrumStorage and by Herd Size
#1017

Waste milk was fed to dairy heifer calves on 87.2 percent of operations. Waste milkwas pasteurized prior to feeding on only 1.0 percent of operations. However, a high-er percentage (11.3 percent) of large operations pasteurized waste milk compared tomedium (1.0 percent) and small (0.5 percent) operations. Pasteurizing waste milkreduces and in some cases eliminates pathogens in milk, thus reducing calves’exposure to these pathogens.
i. Percentage of operations that pasteurized waste milk fed to dairy heifer calves, byherd size:
Percent Operations
Herd Size (Number of Dairy Cows)Small Medium Large
(Less than 100) (100-499) (500 or More) All Operations
Std. Std. Std. Std.Pasteurized Percent Error Percent Error Percent Error Percent Error
Yes 0.5 (0.2) 1.0 (0.4) 11.3 (1.6) 1.0 (0.2)
No 87.0 (1.1) 85.3 (1.6) 74.2 (2.4) 86.2 (0.9)
Not fed waste milk 12.5 (1.1) 13.7 (1.5) 14.5 (2.0) 12.8 (0.9)
Total 100.0 100.0 100.0 100.0
2. Medicated milk-replacerUnweaned dairy heifers are commonly fed milk-replacers, many of which containvarious medications. These medications are intended to decrease the incidence ofcommon diseases during the neonatal period (e.g., scours and pneumonia). A totalof 55.7 percent of operations used milk replacer that contained medication.Oxytetracycline with neomycin was the most common medication (25.6 percent ofoperations). Oxytetracycline alone was the second most common medication (13.7percent of operations).
36 / Dairy 2002
Section I: Population Estimates

a. Percentage of operations that fed medicated milk-replacer to dairy heifer calvesduring 2001, by medication used:
Medication Used Percent Operations Standard Error
Chlortetracycline (CTC) 7.1 (0.7)
Oxytetracycline (OTC) 13.7 (0.8)
Oxytetracycline with neomycin (OTC/NEO) 25.6 (1.2)
Decoquinate 12.8 (0.9)
Lasalocid 3.2 (0.4)
Other 3.6 (0.5)
Any 55.7 (1.3)
USDA APHIS VS / 37
Section I: Population Estimates
7.1
13.7
25.6
12.8
3.2
3.6
55.7
0 10 20 30 40 50 60Percent
Chlortetracycline (CTC)
Oxytetracycline (OTC)
Oxytetracycline with Neomycin
Decoquinate
Lasalocid
Other
Any
Medication
Percent of Operations that Fed Medicated Milk-replacer to DairyHeifer Calves During 2001, by Medication Used
#1018

3. Weaning ageThe average weaning age of dairy heifer calves for all operations was 8.4 weeks.There were only small differences across the different herd sizes: 7.9 weeks for smallherds; 8.1 weeks for medium herds; and 9.0 weeks for large herds.
a. Average age at weaning (in weeks) of dairy heifer calves, by herd size:
Average Age (in weeks)
Herd Size (Number of Dairy Cows)Small Medium Large
(Less than 100) (100-499) (500 or More) All Operations
Std. Std. Std. Std.Average Error Average Error Average Error Average Error
7.9 (0.1) 8.1 (0.1) 9.0 (0.1) 8.4 (0.1)
b. Percentage of operations by average weaning age of dairy heifer calves:
Average Weaning Age (In Weeks) Percent Operations Standard Error
3 or less 0.6 (0.2)
4 4.7 (0.6)
5 6.0 (0.7)
6 18.2 (1.1)
7 8.6 (0.7)
8 36.8 (1.3)
9 3.6 (0.5)
10 8.0 (0.7)
11 1.0 (0.3)
12 9.7 (0.8)
13 or more 2.8 (0.4)
Total 100.0
38 / Dairy 2002
Section I: Population Estimates

4. Source of heifersA total of 98.1 percent of producers reported that heifers were born and raised ontheir operation, accounting for 89.5 percent of dairy heifers. Producers reported thatheifers were born on the operation but raised elsewhere on 3.6 percent of opera-tions, accounting for 7.2 percent of dairy heifers. These operations sent heifers pri-marily to contract heifer raisers. Heifers not born on the operation were a source ofheifers on 6.7 percent of operations, accounting for 3.3 percent of heifers. Thesecategories are not mutually exclusive. For example, some producers may havereported that they both raised some heifers on the operation and also sent heifersoff the farm to be raised, which is why the total percentage of operations exceeds100 percent.
a. Percentage of operations and percentage of dairy heifer (dairy cow replacementsand dairy heifer calves) inventory on January 1, 2002, by source of dairy heifers:
Percent Standard Percent Dairy StandardSource Operations Error Heifers Error
Heifers were born and raised on the operation 98.1 (0.3) 89.5 (1.0)
Heifers were born on the operation and raised somewhere else 3.6 (0.4) 7.2 (0.8)
Heifers were born else- where (off the operation) 6.7 (0.7) 3.3 (0.8)
Total 100.0
USDA APHIS VS / 39
Section I: Population Estimates
89.5
7.2 3.3
98.1
3.6 6.70
20
40
60
80
100
Operations Heifers
Percent
Born and raisedon operation
Born on operation,raised elsewhere
Born elsewhere
Source
Percent of Operations and Percent of Dairy Heifer Inventory* onJanuary 1, 2002, by Source of Dairy Heifers
#1019
*Dairy cow replacements and dairy heifer calves

5. Home-raised heifersa. Percentage of operations by percentage of milking string that was home-raisedreplacements1:
Percent of Home-raised Replacements Percent Operations Standard Error
0 8.4 (0.8)
0.1 to 10.0 3.9 (0.6)
10.1 to 20.0 23.2 (1.2)
20.1 to 30.0 33.1 (1.3)
30.1 to 40.0 23.2 (1.1)
40.1 or more 8.2 (0.7)
Total 100.0
1Number of home-raised replacements that entered the milking string during 2001,as a percentage of the January 1, 2002, dairy cow inventory.
1. Removals from herdOverall, 25.5 percent of all dairy cows were removed permanently from their respec-tive herd during 2001. Large operations had the highest percentage (27.5 percent) ofcows removed.
a. Percentage of dairy cows removed permanently from the herd during 2001, as apercentage of the January 1, 2002, dairy cow inventory, by herd size:
Percent Cows
Herd Size (Number of Dairy Cows)Small Medium Large
(Less than 100) (100-499) (500 or More) All Operations
Std. Std. Std. Std.Percent Error Percent Error Percent Error Percent Error
24.9 (0.6) 23.9 (0.5) 27.5 (0.6) 25.5 (0.3)
40 / Dairy 2002
Section I: Population Estimates
C. Culled Cows
The West region had the highest percentage (26.7 percent) of dairy cows removedpermanently from the herd during 2001, and the Southeast region had the lowestpercentage (22.6 percent) of dairy cows removed.
b. Percentage of dairy cows removed permanently from the herd during 2001, as apercentage of the January 1, 2002, dairy cow inventory, by region:
Percent Cows
RegionWest Midwest Northeast Southeast
Std. Std. Std. Std.Percent Error Percent Error Percent Error Percent Error
26.7 (0.6) 25.4 (0.5) 24.2 (0.7) 22.6 (0.8)
Of the dairy cows removed permanently from the herd during 2001, 94.3 percentwere culled and 5.7 percent were sent directly to another dairy.
c. For dairy cows removed permanently from the herd during 2001, percentage ofcows by where they were sent following removal:
Sent Percent Cows Standard Error
Directly to another dairy 5.7 (0.6)
Culled 94.3 (0.6)
Total 100.0
2. DestinationOf the dairy cows culled during 2001, the majority (78.5 percent) went to a market,auction, or stockyard. Cows that went directly to a packer or slaughter plantaccounted for 20.8 percent of culled cows. As herd size increased so did the per-centage of cows that went directly to a packer or slaughter plant.
USDA APHIS VS / 41
Section I: Population Estimates
a. For operations that culled dairy cows during 2001, percentage of culled dairycows by destination and by herd size:
Percent Culled Cows
Herd Size (Number of Dairy Cows)Small Medium Large
(Less than 100) (100-499) (500 or More) All Operations
Std. Std. Std. Std.Destination Percent Error Percent Error Percent Error Percent Error
Market, auction, or stockyard 83.6 (1.2) 78.2 (1.6) 75.1 (2.2) 78.5 (1.1)
Directly to a packer or slaughter plant 15.8 (1.2) 21.0 (1.6) 24.2 (2.2) 20.8 (1.1)
Sent elsewhere 0.6 (0.2) 0.8 (0.3) 0.7 (0.3) 0.7 (0.2)
Total 100.0 100.0 100.0 100.0
b. For operations that culled dairy cows during 2001, percentage of culled dairycows by destination and by region:
Percent Culled Cows
RegionWest Midwest Northeast Southeast
Std. Std. Std. Std.Destination Percent Error Percent Error Percent Error Percent Error
Market, auction, or stockyard 76.3 (2.2) 80.0 (1.4) 80.2 (1.8) 79.9 (2.9)
Directly to a packer or slaughter plant 22.9 (2.2) 19.7 (1.4) 18.5 (1.7) 19.7 (2.9)
Sent elsewhere 0.8 (0.3) 0.3 (0.1) 1.3 (0.4) 0.4 (0.2)
Total 100.0 100.0 100.0 100.0
42 / Dairy 2002
Section I: Population Estimates

3. Reason for cullingCulled dairy cows represent a significant income loss to dairy producers. Producersand veterinarians must continue to focus on the major reasons for culling and lookto improve strategies that reduce culling. The majority of cows were culled for udderhealth and reproductive problems, 26.9 percent and 26.5 percent, respectively.Poor production not related to the listed problems accounted for 19.3 percent ofculled cows, followed by lameness/injury at 16.3 percent.
a. For operations that culled dairy cows, percentage of dairy cows culled, by producer-reported reason for culling:
Producer-reported Reason Percent Cows Standard Error
Udder or mastitis problem 26.9 (0.5)
Lameness or injury 16.3 (0.4)
Disease 6.0 (0.3)
Aggressiveness or belligerence (kickers) 0.9 (0.1)
Reproductive problems 26.5 (0.5)
Poor production not related to listed problems 19.3 (0.7)
Other 4.1 (0.4)
Total 100.0
USDA APHIS VS / 43
Section I: Population Estimates
26.9%
16.3%
6.0%0.9%
26.5%
19.3%
4.1%
Udder/mastitis problem
Lameness/injury
Disease
Aggresiveness/belligerence
Reproductive problems
Poor production*
Other
Percent of Dairy Cows Culled, by Producer-reported Reason for Culling
#1020
*Unrelated to the other listed problems

1. VaccinationFor dairy heifers, large operations reported the highest percentage of vaccineusage across all vaccine types, with the exception of parainfluenza, Hemophilussomnus, and Mycobacterium paratuberculosis vaccines, where medium operationsreported the highest percentage of usage. A total of 15.6 percent of operations didnot give any vaccinations to dairy heifers, with 18.3 percent, 7.5 percent, and 2.9percent of small, medium, and large operations, respectively, administering no vac-cinations. It is interesting to note that only 51.0 percent of all operations vaccinateddairy heifers for brucellosis, a 12.8 percent decrease since the NAHMS Dairy ’96study, where 63.8 percent of operations vaccinated heifers for brucellosis. Thisdecrease may be indicative of the United States advancing toward the eradication ofbovine brucellosis.
44 / Dairy 2002
Section I: Population Estimates
D. HealthManagement

a. Percentage of operations that normally vaccinated dairy heifers for the followingdiseases, by herd size:
Percent Operations
Herd Size (Number of Dairy Cows)Small Medium Large
(Less than 100) (100-499) (500 or More) All Operations
Std. Std. Std. Std.Disease Pct. Error Pct. Error Pct. Error Pct. Error
Bovine viral diarrhea (BVD) 67.5 (1.6) 83.3 (1.5) 88.2 (2.0) 71.5 (1.2)
Infectious bovine rhinotracheitis (IBR) 62.8 (1.6) 79.6 (1.7) 84.6 (2.1) 67.0 (1.3)
Parainfluenza Type 3 (PI3) 55.9 (1.7) 73.3 (1.8) 72.3 (2.6) 60.0 (1.3)
Bovine respiratory syncytial virus (BRSV) 53.9 (1.7) 70.8 (1.9) 76.5 (2.4) 58.2 (1.3)
Hemophilus somnus 29.0 (1.5) 39.1 (2.0) 38.0 (2.5) 31.4 (1.2)
Leptospirosis 61.3 (1.7) 76.4 (1.8) 79.9 (2.3) 65.1 (1.3)
Salmonella 14.2 (1.2) 22.3 (1.7) 42.0 (2.6) 16.8 (1.0)
E. coli mastitis 16.1 (1.2) 34.9 (2.0) 52.8 (2.7) 21.3 (1.0)
Clostridia 27.4 (1.4) 47.3 (2.0) 63.2 (2.7) 32.8 (1.1)
Brucellosis 47.8 (1.6) 58.6 (2.0) 74.4 (2.3) 51.0 (1.3)
Mycobacterium paratuberculosis(Johne’s disease) 4.1 (0.7) 6.2 (1.1) 4.1 (0.9) 4.6 (0.5)
Neospora 3.0 (0.5) 4.8 (0.9) 9.2 (1.6) 3.6 (0.4)
Other 6.5 (0.7) 8.9 (1.2) 6.0 (1.2) 6.9 (0.6)
None 18.3 (1.4) 7.5 (1.1) 2.9 (0.7) 15.6 (1.1)
For dairy heifers, operations in the West region reported the highest percentage ofvaccine usage across all vaccine types, with the exception of Hemophilus somnus,leptospirosis, and clostridia, where usage was similar for the West and Southeastregions. Clostridial vaccine was used on the highest percentage of operations in theSoutheast region. The Northeast region had the highest percentage of operationsthat administered no vaccines (23.3 percent), followed by the Midwest (14.7 per-cent), Southeast (6.1 percent) and the West (3.5 percent) regions.
USDA APHIS VS / 45
Section I: Population Estimates
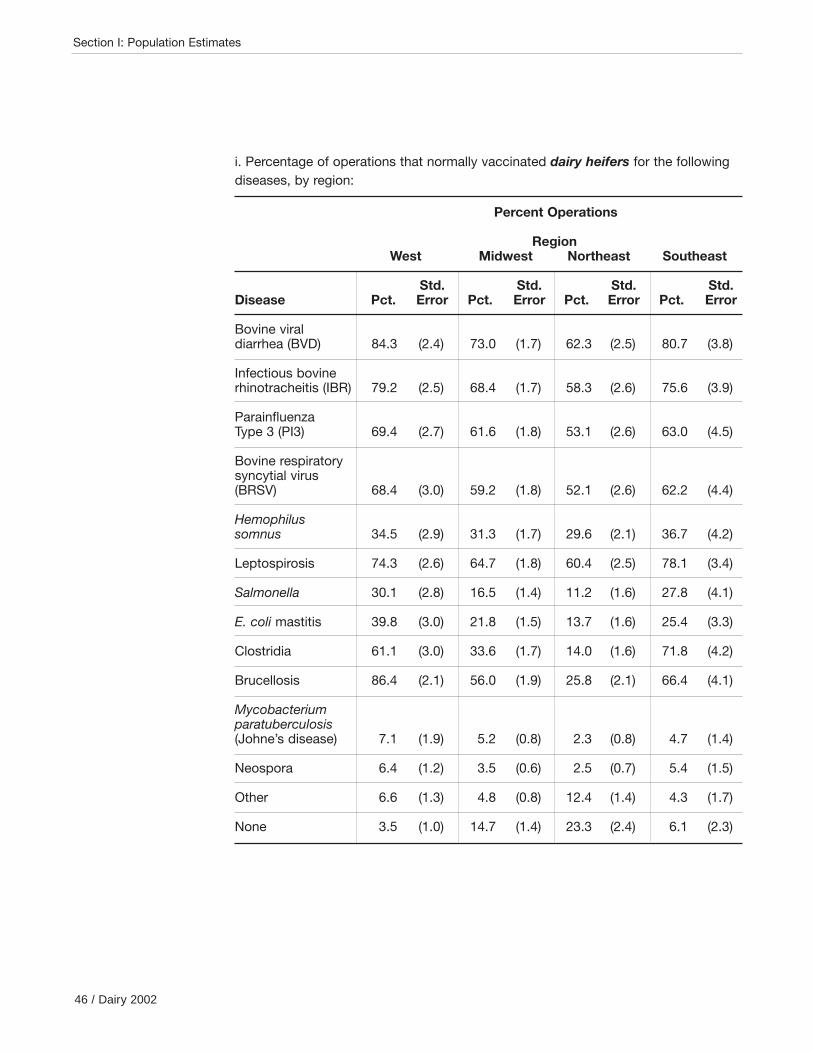
i. Percentage of operations that normally vaccinated dairy heifers for the followingdiseases, by region:
Percent Operations
RegionWest Midwest Northeast Southeast
Std. Std. Std. Std.Disease Pct. Error Pct. Error Pct. Error Pct. Error
Bovine viral diarrhea (BVD) 84.3 (2.4) 73.0 (1.7) 62.3 (2.5) 80.7 (3.8)
Infectious bovine rhinotracheitis (IBR) 79.2 (2.5) 68.4 (1.7) 58.3 (2.6) 75.6 (3.9)
Parainfluenza Type 3 (PI3) 69.4 (2.7) 61.6 (1.8) 53.1 (2.6) 63.0 (4.5)
Bovine respiratory syncytial virus (BRSV) 68.4 (3.0) 59.2 (1.8) 52.1 (2.6) 62.2 (4.4)
Hemophilus somnus 34.5 (2.9) 31.3 (1.7) 29.6 (2.1) 36.7 (4.2)
Leptospirosis 74.3 (2.6) 64.7 (1.8) 60.4 (2.5) 78.1 (3.4)
Salmonella 30.1 (2.8) 16.5 (1.4) 11.2 (1.6) 27.8 (4.1)
E. coli mastitis 39.8 (3.0) 21.8 (1.5) 13.7 (1.6) 25.4 (3.3)
Clostridia 61.1 (3.0) 33.6 (1.7) 14.0 (1.6) 71.8 (4.2)
Brucellosis 86.4 (2.1) 56.0 (1.9) 25.8 (2.1) 66.4 (4.1)
Mycobacterium paratuberculosis(Johne’s disease) 7.1 (1.9) 5.2 (0.8) 2.3 (0.8) 4.7 (1.4)
Neospora 6.4 (1.2) 3.5 (0.6) 2.5 (0.7) 5.4 (1.5)
Other 6.6 (1.3) 4.8 (0.8) 12.4 (1.4) 4.3 (1.7)
None 3.5 (1.0) 14.7 (1.4) 23.3 (2.4) 6.1 (2.3)
46 / Dairy 2002
Section I: Population Estimates

For dairy cows, large operations reported the highest percentage of vaccine usageacross all vaccine types, with the exception of parainfluenza, where the percentagewas comparable to medium operations. A total of 17.2 percent of operations did notadminister any vaccinations, with 20.7 percent, 7.5 percent, and 0.5 percent ofsmall, medium, and large operations, respectively, administering no vaccinations.
b. Percentage of operations that normally vaccinated dairy cows for the followingdiseases, by herd size:
Percent Operations
Herd Size (Number of Dairy Cows)Small Medium Large
(Less than 100) (100-499) (500 or More) All Operations
Std. Std. Std. Std.Disease Pct. Error Pct. Error Pct. Error Pct. Error
Bovine viral diarrhea (BVD) 70.0 (1.6) 86.3 (1.4) 92.1 (1.5) 74.2 (1.2)
Infectious bovine rhinotracheitis (IBR) 65.1 (1.6) 82.0 (1.6) 85.3 (2.1) 69.3 (1.3)
Parainfluenza Type 3 (PI3) 58.2 (1.6) 74.6 (1.8) 74.3 (2.4) 62.2 (1.3)
Bovine respiratory syncytial virus (BRSV) 57.1 (1.7) 72.8 (1.8) 78.9 (2.2) 61.1 (1.3)
Hemophilus somnus 30.1 (1.5) 39.7 (2.0) 40.4 (2.5) 32.4 (1.2)
Leptospirosis 66.0 (1.6) 81.7 (1.6) 89.6 (1.8) 70.1 (1.3)
Salmonella 13.7 (1.2) 24.6 (1.8) 44.6 (2.7) 17.1 (1.0)
E. coli mastitis 24.1 (1.4) 52.2 (2.1) 74.1 (2.4) 31.7 (1.2)
Clostridia 19.8 (1.3) 38.3 (2.0) 58.8 (2.6) 25.0 (1.1)
Neospora 2.5 (0.5) 4.8 (0.9) 10.9 (1.9) 3.3 (0.4)
Other 6.8 (0.8) 8.6 (1.2) 5.9 (1.2) 7.2 (0.6)
None 20.7 (1.4) 7.5 (1.2) 0.5 (0.5) 17.2 (1.1)
USDA APHIS VS / 47
Section I: Population Estimates

For dairy cows, operations in the West region reported the highest percentage ofvaccine usage for bovine viral diarrhea, infectious bovine rhinotracheitis, bovine res-piratory syncytial virus, E. coli, and clostridia. The Northeast region had the lowestpercentage of operations administering all types of vaccines, with the exception ofHemophilus somnus, where the percentage of usage was similar to the otherregions. The Northeast and Midwest regions reported the highest percentage ofoperations administering no vaccines, 19.1 percent and 18.3 percent, respectively.
i. Percentage of operations that normally vaccinated dairy cows for the followingdiseases, by region:
Percent Operations
RegionWest Midwest Northeast Southeast
Std. Std. Std. Std.Disease Pct. Error Pct. Error Pct. Error Pct. Error
Bovine viral diarrhea (BVD) 81.9 (2.7) 75.4 (1.6) 68.9 (2.5) 75.2 (4.1)
Infectious bovine rhinotracheitis (IBR) 76.1 (2.8) 70.5 (1.7) 64.4 (2.5) 69.7 (4.2)
Parainfluenza Type 3 (PI3) 65.2 (3.0) 64.1 (1.7) 57.8 (2.6) 58.1 (4.5)
Bovine respiratory syncytial virus (BRSV) 67.2 (3.0) 62.4 (1.8) 57.1 (2.6) 57.8 (4.5)
Hemophilus somnus 35.8 (2.9) 31.6 (1.7) 32.7 (2.2) 34.1 (4.2)
Leptospirosis 80.1 (2.6) 69.1 (1.8) 67.9 (2.5) 76.6 (3.3)
Salmonella 30.6 (2.8) 17.1 (1.4) 11.0 (1.5) 25.9 (4.1)
E. coli mastitis 58.5 (3.0) 32.5 (1.7) 20.4 (1.7) 38.3 (4.0)
Clostridia 47.6 (3.0) 26.0 (1.5) 13.0 (1.5) 39.3 (4.4)
Neospora 6.4 (1.2) 3.4 (0.6) 1.9 (0.6) 4.8 (1.4)
Other 6.3 (1.3) 5.0 (0.8) 13.3 (1.6) 3.1 (1.5)
None 7.0 (2.0) 18.3 (1.5) 19.1 (2.3) 12.2 (2.6)
48 / Dairy 2002
Section I: Population Estimates

Vaccines for bovine viral diarrhea (BVD) virus were administered to dairy heifers on71.5 percent of operations and to dairy cows on 74.2 percent of operations. Ofthese operations, killed and modified live BVD vaccines were given to dairy heiferson 50.6 percent and 49.2 percent of operations, respectively. Killed and modifiedlive BVD vaccines were given to dairy cows on 61.9 percent and 36.7 percent ofoperations, respectively. For operations that gave BVD vaccinations to cows, 82.9percent gave annual BVD booster vaccinations.
2. Types of BVD vaccinea. For operations that gave BVD vaccinations to dairy heifers, percentage of opera-tions by type of BVD vaccine given:
Percent Operations
Type of BVD Standard Did Not Standard Not StandardVaccine Given Error Know Error Given Error Total
Killed 50.6 (1.6) 12.7 (1.1) 36.7 (1.5) 100.0
Modified Live 49.2 (1.6) 12.5 (1.1) 38.3 (1.5) 100.0
b. For operations that gave BVD vaccinations to dairy cows, percentage of opera-tions by type of BVD vaccine given:
Percent Operations
Type of BVD Standard Did Not Standard Not StandardVaccine Given Error Know Error Given Error Total
Killed 61.9 (1.5) 11.8 (1.1) 26.3 (1.3) 100.0
Modified Live 36.7 (1.5) 11.6 (1.1) 51.7 (1.5) 100.0
USDA APHIS VS / 49
Section I: Population Estimates
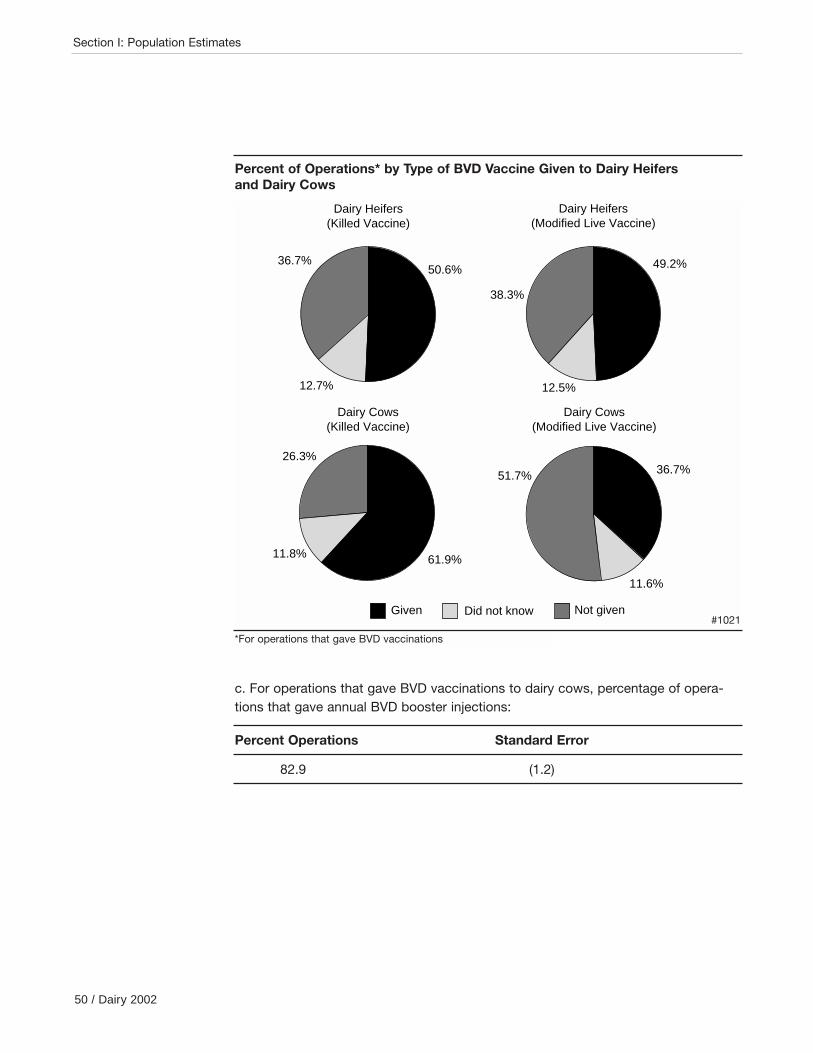
c. For operations that gave BVD vaccinations to dairy cows, percentage of opera-tions that gave annual BVD booster injections:
Percent Operations Standard Error
82.9 (1.2)
50 / Dairy 2002
Section I: Population Estimates
50.6%
12.7%
36.7%
Dairy Heifers(Killed Vaccine)
49.2%
12.5%
38.3%
Dairy Heifers(Modified Live Vaccine)
61.9%11.8%
26.3%
Dairy Cows(Killed Vaccine)
36.7%
11.6%
51.7%
Dairy Cows(Modified Live Vaccine)
Given Did not know Not given
Percent of Operations* by Type of BVD Vaccine Given to Dairy Heifersand Dairy Cows
#1021
*For operations that gave BVD vaccinations

3. BVD strains usedSince the identification of Type II BVD virus in the early 1990s, the ability of one typeof BVD vaccine to protect for the other type of BVD virus has been of concern toproducers. Vaccines are available that contain Type I, Type II, or a combination ofboth. For operations that administered a BVD vaccine, 5.4 percent administeredType I vaccine only, 7.6 percent administered Type II vaccine only, and 39.4 percentadministered BVD vaccine containing both types. Many operations (47.6 percent)did not know which type of BVD vaccine was administered.
a. For operations that gave BVD vaccinations, percentage of operations by strain ofBVD contained in vaccine administered:
BVD Strain Percent Standard Error
Type I only 5.4 (0.6)
Type II only 7.6 (0.9)
Combination of Type I and Type II 39.4 (1.4)
Did not know 47.6 (1.5)
Total 100.0
USDA APHIS VS / 51
Section I: Population Estimates
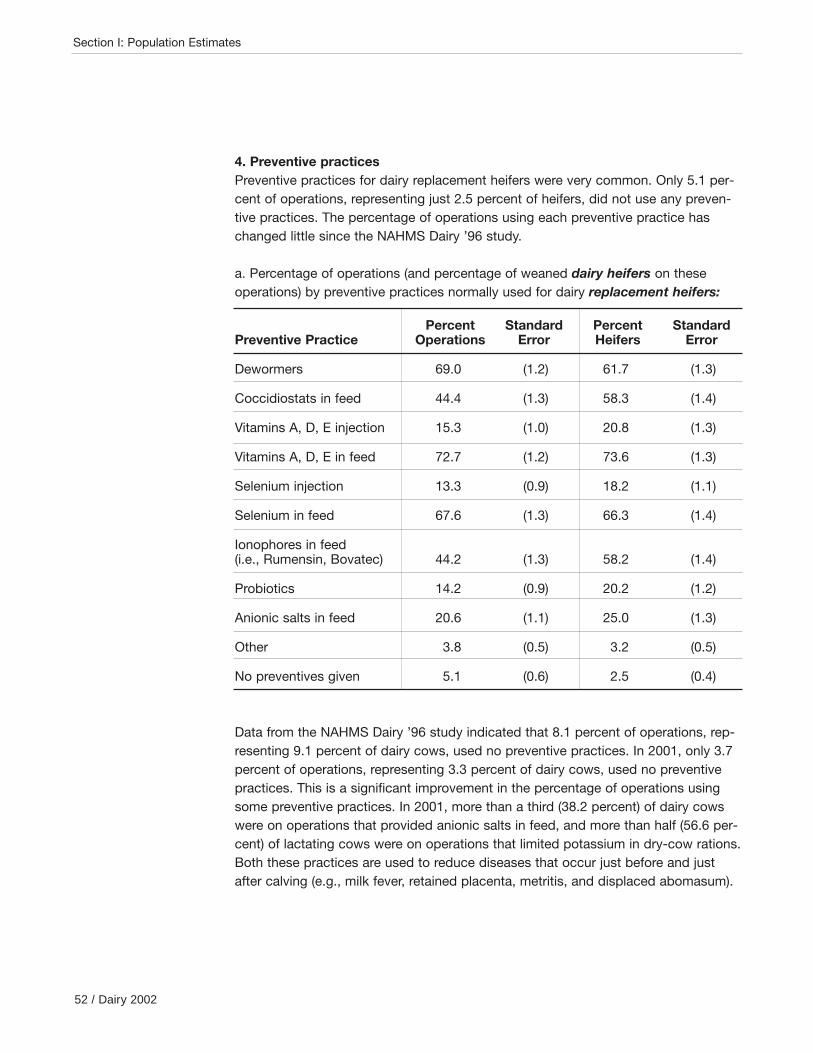
4. Preventive practicesPreventive practices for dairy replacement heifers were very common. Only 5.1 per-cent of operations, representing just 2.5 percent of heifers, did not use any preven-tive practices. The percentage of operations using each preventive practice haschanged little since the NAHMS Dairy ’96 study.
a. Percentage of operations (and percentage of weaned dairy heifers on theseoperations) by preventive practices normally used for dairy replacement heifers:
Percent Standard Percent StandardPreventive Practice Operations Error Heifers Error
Dewormers 69.0 (1.2) 61.7 (1.3)
Coccidiostats in feed 44.4 (1.3) 58.3 (1.4)
Vitamins A, D, E injection 15.3 (1.0) 20.8 (1.3)
Vitamins A, D, E in feed 72.7 (1.2) 73.6 (1.3)
Selenium injection 13.3 (0.9) 18.2 (1.1)
Selenium in feed 67.6 (1.3) 66.3 (1.4)
Ionophores in feed (i.e., Rumensin, Bovatec) 44.2 (1.3) 58.2 (1.4)
Probiotics 14.2 (0.9) 20.2 (1.2)
Anionic salts in feed 20.6 (1.1) 25.0 (1.3)
Other 3.8 (0.5) 3.2 (0.5)
No preventives given 5.1 (0.6) 2.5 (0.4)
Data from the NAHMS Dairy ’96 study indicated that 8.1 percent of operations, rep-resenting 9.1 percent of dairy cows, used no preventive practices. In 2001, only 3.7percent of operations, representing 3.3 percent of dairy cows, used no preventivepractices. This is a significant improvement in the percentage of operations usingsome preventive practices. In 2001, more than a third (38.2 percent) of dairy cowswere on operations that provided anionic salts in feed, and more than half (56.6 per-cent) of lactating cows were on operations that limited potassium in dry-cow rations.Both these practices are used to reduce diseases that occur just before and justafter calving (e.g., milk fever, retained placenta, metritis, and displaced abomasum).
52 / Dairy 2002
Section I: Population Estimates

b. Percentage of operations (and percentage of dairy cows on these operations) bypreventive practices normally used for lactating cows:
Percent Standard Percent StandardPreventive Practice Operations Error Cows Error
Dewormers 60.3 (1.3) 46.1 (1.1)
Vitamins A, D, E injection 17.1 (1.0) 24.4 (1.2)
Vitamins A, D, E in feed 80.2 (1.1) 78.2 (1.1)
Selenium injection 18.0 (1.0) 24.1 (1.1)
Selenium in feed 75.7 (1.1) 72.3 (1.1)
Probiotics 20.4 (1.0) 28.1 (1.2)
Anionic salts in feed 27.0 (1.2) 38.2 (1.2)
Limited potassium in dry cow ration 45.0 (1.3) 56.6 (1.3)
Other 5.4 (0.6) 5.0 (0.6)
No preventives given 3.7 (0.6) 3.3 (0.5)
1. Dairy calves born aliveApproximately 9 out of 10 (88.8 percent) cows and heifers produced live calves dur-ing 2001. The remaining 11.2 percent either had dead calves or other reproductiveproblems that led to an increased calving interval over 12 months.
a. Calves born alive during 2001, as a percentage of the January 1, 2002, dairy cowinventory:
Percent Standard Error
88.8 (0.5)
2. AbortionsAbortion rate is traditionally defined as fetal loss prior to term divided by all con-firmed pregnancies. A reasonable goal for abortions would be 3 to 5 percent of con-firmed pregnancies. In this study, abortion rate was calculated by dividing thereported number of cows that aborted by the total calves born alive plus the numberof cows that aborted. Abortion occurred in 4.0 percent of pregnancies across alloperations. Large operations had the highest percentage (4.9 percent) of abortions.
USDA APHIS VS / 53
Section I: Population Estimates
E. Births, Illnesses,and Deaths
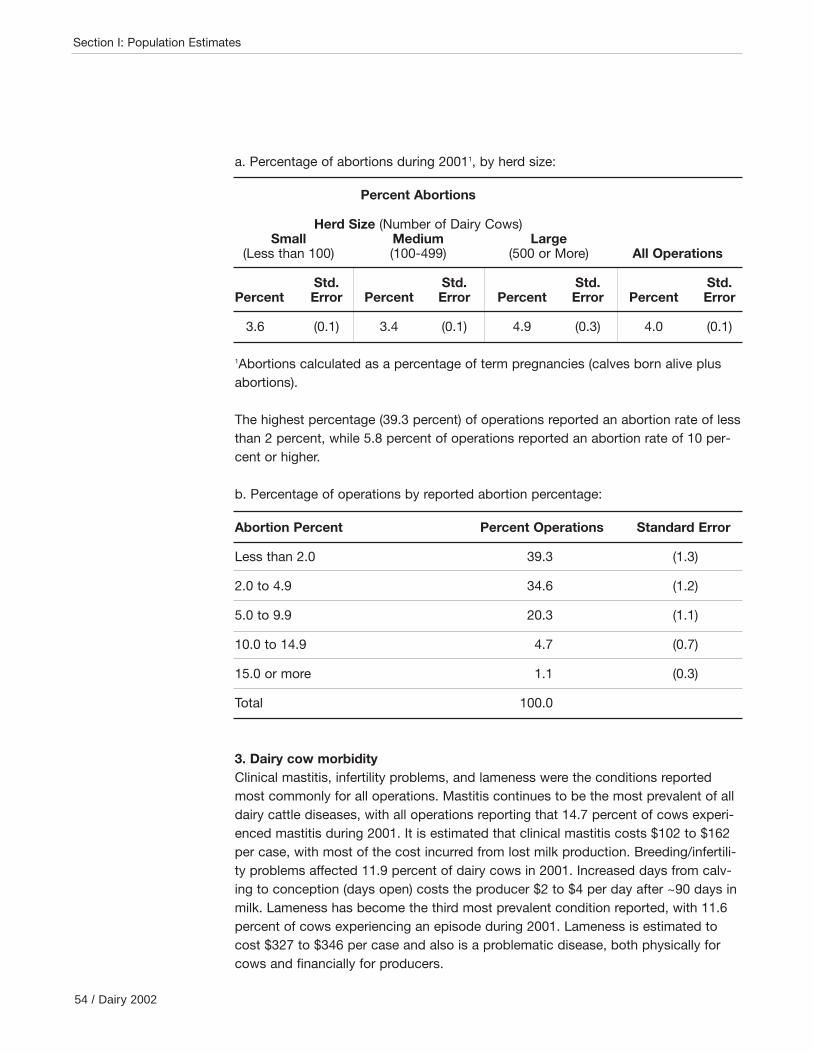
a. Percentage of abortions during 20011, by herd size:
Percent Abortions
Herd Size (Number of Dairy Cows)Small Medium Large
(Less than 100) (100-499) (500 or More) All Operations
Std. Std. Std. Std.Percent Error Percent Error Percent Error Percent Error
3.6 (0.1) 3.4 (0.1) 4.9 (0.3) 4.0 (0.1)
1Abortions calculated as a percentage of term pregnancies (calves born alive plusabortions).
The highest percentage (39.3 percent) of operations reported an abortion rate of lessthan 2 percent, while 5.8 percent of operations reported an abortion rate of 10 per-cent or higher.
b. Percentage of operations by reported abortion percentage:
Abortion Percent Percent Operations Standard Error
Less than 2.0 39.3 (1.3)
2.0 to 4.9 34.6 (1.2)
5.0 to 9.9 20.3 (1.1)
10.0 to 14.9 4.7 (0.7)
15.0 or more 1.1 (0.3)
Total 100.0
3. Dairy cow morbidityClinical mastitis, infertility problems, and lameness were the conditions reportedmost commonly for all operations. Mastitis continues to be the most prevalent of alldairy cattle diseases, with all operations reporting that 14.7 percent of cows experi-enced mastitis during 2001. It is estimated that clinical mastitis costs $102 to $162per case, with most of the cost incurred from lost milk production. Breeding/infertili-ty problems affected 11.9 percent of dairy cows in 2001. Increased days from calv-ing to conception (days open) costs the producer $2 to $4 per day after ~90 days inmilk. Lameness has become the third most prevalent condition reported, with 11.6percent of cows experiencing an episode during 2001. Lameness is estimated tocost $327 to $346 per case and also is a problematic disease, both physically forcows and financially for producers.
54 / Dairy 2002
Section I: Population Estimates

a. Percentage of dairy cows1 that producers identified as having the following condi-tions during 2001, by herd size:
Percent Dairy Cows
Herd Size (Number of Dairy Cows)Small Medium Large
(Less than 100) (100-499) (500 or More) All Operations
Producer-identified Std. Std. Std. Std.Health Problem Pct. Error Pct. Error Pct. Error Pct. Error
Clinical mastitis 15.6 (0.4) 13.6 (0.5) 14.7 (0.7) 14.7 (0.3)
Lameness 11.2 (0.4) 14.1 (0.6) 10.0 (0.6) 11.6 (0.3)
Respiratory problems 2.4 (0.2) 3.1 (0.2) 2.5 (0.1) 2.7 (0.1)
Retained placenta (more than 24 hours) 9.2 (0.3) 8.5 (0.3) 6.0 (0.4) 7.8 (0.2)
Infertility problems (not pregnant 150 days after calving) 11.7 (0.4) 11.3 (0.4) 12.5 (0.6) 11.9 (0.3)
Other reproductive problems (dystocia, metritis) 2.9 (0.2) 3.8 (0.2) 4.5 (0.4) 3.7 (0.2)
Diarrhea (more than 48 hours) 4.2 (0.4) 2.2 (0.1) 2.1 (0.2) 2.8 (0.2)
Milk fever 7.6 (0.3) 5.3 (0.2) 2.9 (0.2) 5.2 (0.1)
Displaced abomasum 3.8 (0.2) 4.3 (0.2) 2.4 (0.1) 3.5 (0.1)
Neurological problems 0.4 (0.1) 0.3 (0.0) 0.3 (0.1) 0.3 (0.0)
Other health-related problems 1.1 (0.2) 1.1 (0.2) 0.2 (0.0) 0.8 (0.1)
1As a percentage of January 1, 2002, cow inventory
USDA APHIS VS / 55
Section I: Population Estimates
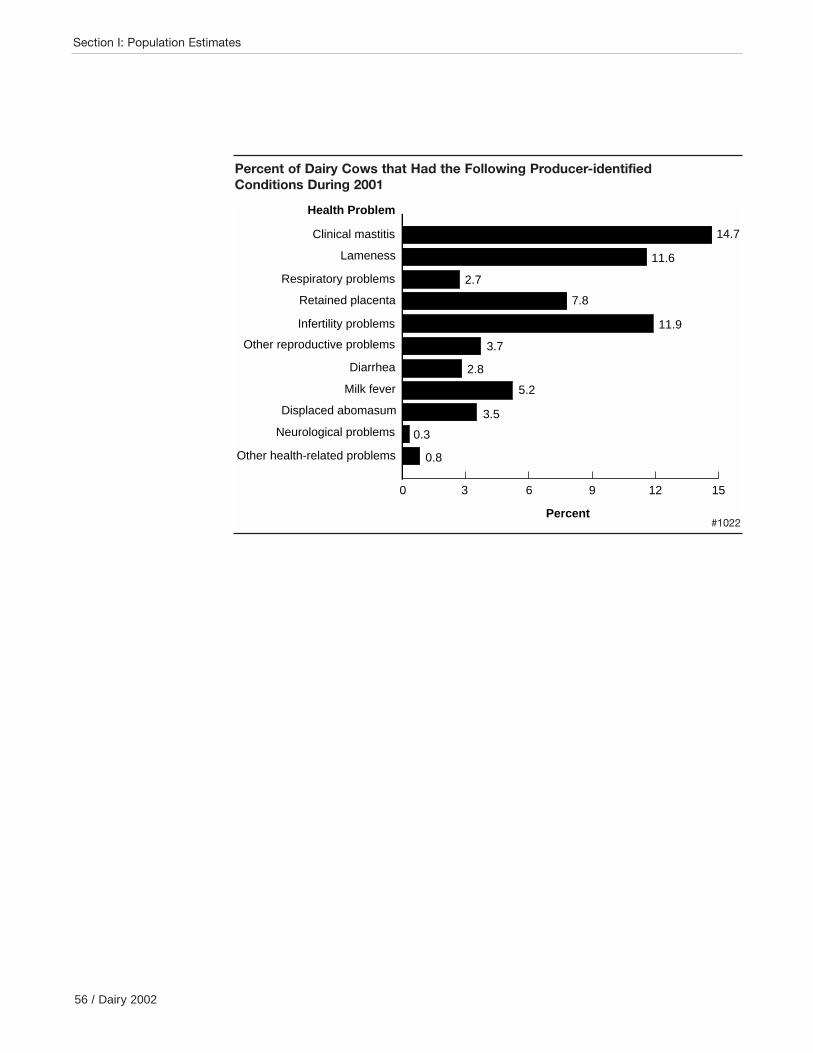
56 / Dairy 2002
Section I: Population Estimates
Clinical mastitis
Lameness
Respiratory problems
Retained placenta
Infertility problems
Other reproductive problems
Diarrhea
Milk fever
Displaced abomasum
Neurological problems
Other health-related problems
Health Problem
Percent
0 3 6 9 12 15
0.8
0.3
3.5
5.2
2.8
3.7
11.9
7.8
2.7
11.6
14.7
Percent of Dairy Cows that Had the Following Producer-identifiedConditions During 2001
#1022

4. MortalityOverall, 8.7 percent of dairy heifers born alive died prior to weaning. Large opera-tions had the lowest percentage (7.7 percent) of unweaned heifer deaths. Nearly 2percent (1.9) of weaned heifer calves died between weaning and calving. Mediumoperations had the highest percentage (2.1 percent) of weaned heifer deaths. For alloperations, 4.8 percent (as a percentage of the January 1, 2002, inventory) of dairycows died during 2001. Small operations had the lowest percentage (4.4 percent) ofcow deaths.
a. Percentage of unweaned dairy heifer calves1 (from birth to weaning), weanedheifers2 (from weaning age to first calving), and dairy cows3 that died during 2001,by herd size:
Percent
Herd Size (Number of Dairy Cows)Small Medium Large
(Less than 100) (100-499) (500 or More) All Operations
Std. Std. Std. Std.Type of Animal Pct. Error Pct. Error Pct. Error Pct. Error
Unweaned heifers 9.1 (0.4) 9.4 (0.3) 7.7 (0.5) 8.7 (0.2)
Weaned heifers 1.8 (0.1) 2.1 (0.1) 1.8 (0.1) 1.9 (0.1)
Cows 4.4 (0.1) 5.0 (0.1) 4.9 (0.1) 4.8 (0.1)
1As a percentage of dairy heifers born alive2As a percentage of January 1, 2002, heifer inventory (weaning age to calving)3As a percentage of January 1, 2002, dairy cow inventory
Calf scours, diarrhea, and other digestive problems accounted for 62.1 percent of allunweaned heifer deaths. Respiratory problems were the second leading cause ofunweaned heifer deaths, representing 21.3 percent of all deaths. Respiratory prob-lems accounted for 50.4 percent of weaned heifer deaths, followed by unknown rea-sons, which accounted for 16.0 percent of weaned heifer deaths. Unknown reasons accounted for the largest percentage (19.8 percent) of cowdeaths. Necropsies are essential in determining the cause of death so that preven-tive measures can be implemented. Calving problems (17.4 percent), mastitis (17.1percent) and lameness/injury (13.9 percent) were the next three highest causes ofcow deaths, respectively. Management practices that reduce both calf and cow lossduring or immediately subsequent to calving should be reviewed.
USDA APHIS VS / 57
Section I: Population Estimates

b. Percentage of total unweaned dairy heifer calf deaths, weaned heifer deaths, anddairy cow deaths, by producer-attributed cause:
Percent
Unweaned Heifers Weaned Heifers Cows
Producer- Percent Std. Percent Std. Percent Std.attributed Cause Deaths Error Deaths Error Deaths Error
Scours, diarrhea, or other digestive problems 62.1 (1.1) 12.3 (1.0) 8.6 (0.5)
Respiratory problems 21.3 (0.9) 50.4 (1.6) 10.3 (0.5)
Poison 0.1 (0.0) 1.1 (0.4) 0.4 (0.1)
Put down due to lameness or injury 0.5 (0.1) 6.4 (0.6) 13.9 (0.6)
Lack of coordination or severe depression 0.4 (0.1) 0.3 (0.1) 1.4 (0.2)
Mastitis NA NA 17.1 (0.6)
Calving problems 4.1 (0.6) NA 17.4 (0.7)
Joint or navel problems 1.7 (0.2) 1.4 (0.3) NA
Other known reasons 2.9 (0.4) 12.1 (1.2) 11.1 (0.6)
Unknown reasons 6.9 (0.8) 16.0 (1.1) 19.8 (0.9)
Total 100.0 100.0 100.0
58 / Dairy 2002
Section I: Population Estimates

USDA APHIS VS / 59
Section I: Population Estimates
Scours, diarrhea, otherdigestive problems
Respiratory problems
Poison
Lameness or injury
Lack of coordinationor severe depression
Mastitis
Calving problems
Other known reasons
Unknown reasons
Percent
8.6
10.3
0.4
13.9
1.4
17.1
17.4
11.1
19.8
0 5 10 15 20
Percent of Total Dairy Cow Deaths, by Producer-attributed Cause
#1023

5. Carcass disposalRendering was the most common method of disposal for dead calves (43.8 percentof operations) and dead cows (62.4 percent of operations). Burial was the secondmost prevalent method of disposal for dead calves (35.3 percent of operations) anddead cows (22.7 percent of operations), followed by composting (10.1 percent ofoperations for dead calves and 6.9 percent of operations for dead cows).Composting carcasses has become more prevalent because of the restriction onruminant protein feeding and the increased fees charged by rendering companies topick up animals. Composting utilizes old feedstuffs and manure to create an envi-ronment for microorganisms that accelerates the natural decomposition process.With composting, decomposition of a mature dairy cow carcass takes approximate-ly 6 to 8 months.
a. Percentage of operations by primary method used to dispose of dead calves andcows:
Calves Cows
Percent Standard Percent StandardMethod of Disposal Operations Error Operations Error
Buried 35.3 (1.3) 22.7 (1.1)
Burned/incinerated 2.8 (0.4) 2.2 (0.4)
Rendered 43.8 (1.3) 62.4 (1.2)
Composted 10.1 (0.8) 6.9 (0.7)
Landfill 2.4 (0.4) 1.9 (0.3)
Other 5.6 (0.6) 3.9 (0.5)
Total 100.0 100.0
60 / Dairy 2002
Section I: Population Estimates

1. Housing facilitiesThe most common inside housing type used for unweaned dairy heifers was individ-ual animal areas (58.1 percent of operations), followed by multiple animal areas (30.3percent of the operations). “None” was reported as the primary type of inside hous-ing on 9.5 percent of operations, indicating that these unweaned heifers typicallylived outside or were sent off-site to be raised. The primary inside housing type forweaned dairy heifers was multiple animal areas (78.7 percent of the operations). Tiestall or stanchion barns were the most common inside housing type for lactatingdairy cows on 52.5 percent of operations, followed by freestall (30.8 percent) andmultiple animal areas (11.2 percent). For housing maternity cows inside, 32.0 per-cent of operations reported using individual animal areas; multiple animal areas wereused for inside maternity housing1 on 29.3 percent of operations.
a. Percentage of operations by primary type of housing facility used during 2001:
Percent Operations
Unweaned Weaned Lactating MaternityDairy Heifers Dairy Heifers Dairy Cows Housing
Std. Std. Std. Std.Housing Type Pct. Error Pct. Error Pct. Error Pct. Error
Freestall 2.1 (0.4) 5.8 (0.6) 30.8 (1.0) 6.9 (0.7)
Individual animal area (pen) 58.1 (1.4) 4.9 (0.6) 0.6 (0.2) 32.0 (1.3)
Multiple animal area 30.3 (1.3) 78.7 (1.1) 11.2 (0.8) 29.3 (1.1)
Tie stall or stanchion NA NA 6.8 (0.7) 52.5 (1.1) 16.5 (1.1)
None 9.5 (0.8) 3.8 (0.4) 4.9 (0.4) 15.3 (1.0)
Total 100.0 100.0 100.0 100.0
1Maternity housing refers to facilities or outside areas used for dairy cows about tocalve that are separate from facilities used by lactating cows.
USDA APHIS VS / 61
Section I: Population Estimates
F. Housing
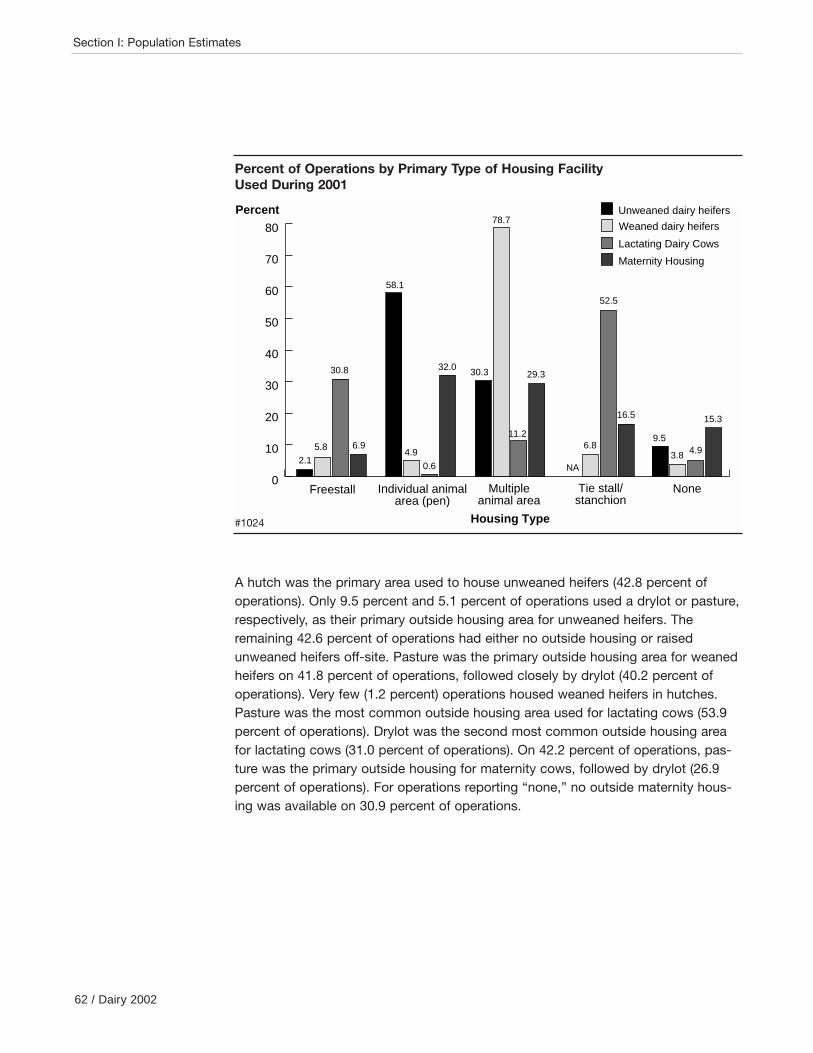
A hutch was the primary area used to house unweaned heifers (42.8 percent ofoperations). Only 9.5 percent and 5.1 percent of operations used a drylot or pasture,respectively, as their primary outside housing area for unweaned heifers. Theremaining 42.6 percent of operations had either no outside housing or raisedunweaned heifers off-site. Pasture was the primary outside housing area for weanedheifers on 41.8 percent of operations, followed closely by drylot (40.2 percent ofoperations). Very few (1.2 percent) operations housed weaned heifers in hutches.Pasture was the most common outside housing area used for lactating cows (53.9percent of operations). Drylot was the second most common outside housing areafor lactating cows (31.0 percent of operations). On 42.2 percent of operations, pas-ture was the primary outside housing for maternity cows, followed by drylot (26.9percent of operations). For operations reporting “none,” no outside maternity hous-ing was available on 30.9 percent of operations.
62 / Dairy 2002
Section I: Population Estimates
30.8
0.6
11.2
52.5
4.95.84.9
78.7
6.83.8
Unweaned dairy heifers
Weaned dairy heifers
Lactating Dairy Cows
Maternity Housing
Percent
Freestall Individual animalarea (pen)
Multipleanimal area
None
Housing Type
2.1
6.9
58.1
32.0
NA
29.3
9.5
15.3
Tie stall/stanchion
30.3
16.5
0
10
20
30
40
50
60
70
80
Percent of Operations by Primary Type of Housing FacilityUsed During 2001
#1024
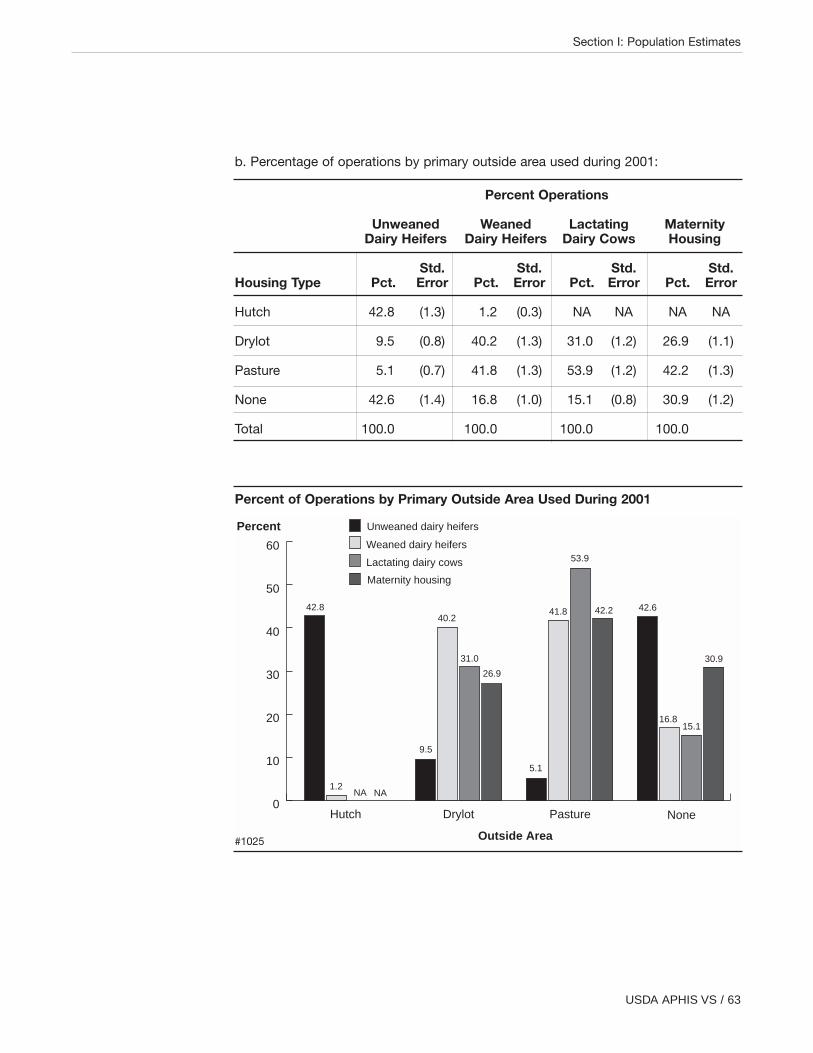
b. Percentage of operations by primary outside area used during 2001:
Percent Operations
Unweaned Weaned Lactating MaternityDairy Heifers Dairy Heifers Dairy Cows Housing
Std. Std. Std. Std.Housing Type Pct. Error Pct. Error Pct. Error Pct. Error
Hutch 42.8 (1.3) 1.2 (0.3) NA NA NA NA
Drylot 9.5 (0.8) 40.2 (1.3) 31.0 (1.2) 26.9 (1.1)
Pasture 5.1 (0.7) 41.8 (1.3) 53.9 (1.2) 42.2 (1.3)
None 42.6 (1.4) 16.8 (1.0) 15.1 (0.8) 30.9 (1.2)
Total 100.0 100.0 100.0 100.0
USDA APHIS VS / 63
Section I: Population Estimates
1.2
40.241.8
16.8
42.8
9.5
5.1
42.6
Unweaned dairy heifers
Weaned dairy heifers
Lactating dairy cows
Maternity housing
Percent
Hutch Drylot Pasture None
Outside Area
NA NA
31.0
42.2
53.9
15.1
30.9
26.9
0
10
20
30
40
50
60
Percent of Operations by Primary Outside Area Used During 2001
#1025

2. Separate maternity housingHousing for maternity cows (“close-up” pens) was separate from housing used forlactating dairy cows on 53.1 percent of all operations. Separate maternity housingwas most common among large operations (91.9 percent), followed by the mediumoperations (81.6 percent). Small operations were least likely to use separate mater-nity housing (43.5 percent of operations). Separate housing for cows within 2 to 3weeks of calving is a useful management strategy for accommodating the nutritionaland environmental adjustments needed to prevent post-calving diseases.
a. Percentage of operations where maternity housing was separate from housingused for lactating dairy cows, by herd size:
Percent Operations
Herd Size (Number of Dairy Cows)Small Medium Large
(Less than 100) (100-499) (500 or More) All Operations
Std. Std. Std. Std.Percent Error Percent Error Percent Error Percent Error
43.5 (1.6) 81.6 (1.7) 91.9 (1.5) 53.1 (1.3)
3. Milking facilitiesThe majority (70.0 percent) of cows were milked in a parlor. However, only 37.1 per-cent of operations used a parlor as their primary milking facility. A tie stall or stan-chion barn was used as the primary milking facility on 61.9 percent of operations,but only 28.9 percent of cows were milked in this type of facility.
a. Percentage of operations (and percentage of cows on these operations) by pri-mary milking facility used in 2001:
Percent Standard Percent StandardFacility Type Operations Error Cows Error
Parlor 37.1 (1.0) 70.0 (0.8)
Tie stall or stanchion 61.9 (1.0) 28.9 (0.8)
Other 1.0 (0.2) 1.1 (0.2)
Total 100.0 100.0
64 / Dairy 2002
Section I: Population Estimates

1. Physical contact with unweaned calvesIsolating unweaned calves from other age classes of cattle on dairy operations is animportant management practice that helps reduce disease in unweaned calves.Unweaned calves had contact with weaned calves not yet of breeding age on 22.8percent of operations. In addition, unweaned calves had contact with bred heifersand adult cattle on 13.3 percent and 15.4 percent of operations, respectively.
a. Percentage of operations (and percentage of dairy heifer calves born on theseoperations) where after separation from the mother, unweaned heifer calves hadphysical contact1 with the following:
Percent Standard Percent StandardAge Group Operations Error Calves Error
Weaned calves not yet of breeding age 22.8 (1.2) 15.5 (0.9)
Bred heifers not yet calved 13.3 (0.9) 11.1 (0.8)
Adult cattle 15.4 (1.0) 11.8 (0.9)
1Physical contact is defined as nose-to-nose contact or sniffing/touching/lickingeach other, including through a fence.
2. Physical contact with other animalsPhysical contact between dairy cattle and/or their feed and other animal speciesoccurs on U.S. dairy operations. With the exception of dogs, cats, and deer, a smallpercentage of operations reported that this contact was occurring. Overall, 70.6 per-cent, 87.8 percent, and 53.1 percent of operations reported contact between femaledairy cattle or their feed with dogs, cats, and deer respectively. There were someregional differences in the percentages of cat and deer contact. There were onlyminor differences in the percentages between regions for contact with otherspecies.
USDA APHIS VS / 65
Section I: Population Estimates
G. Biosecurity
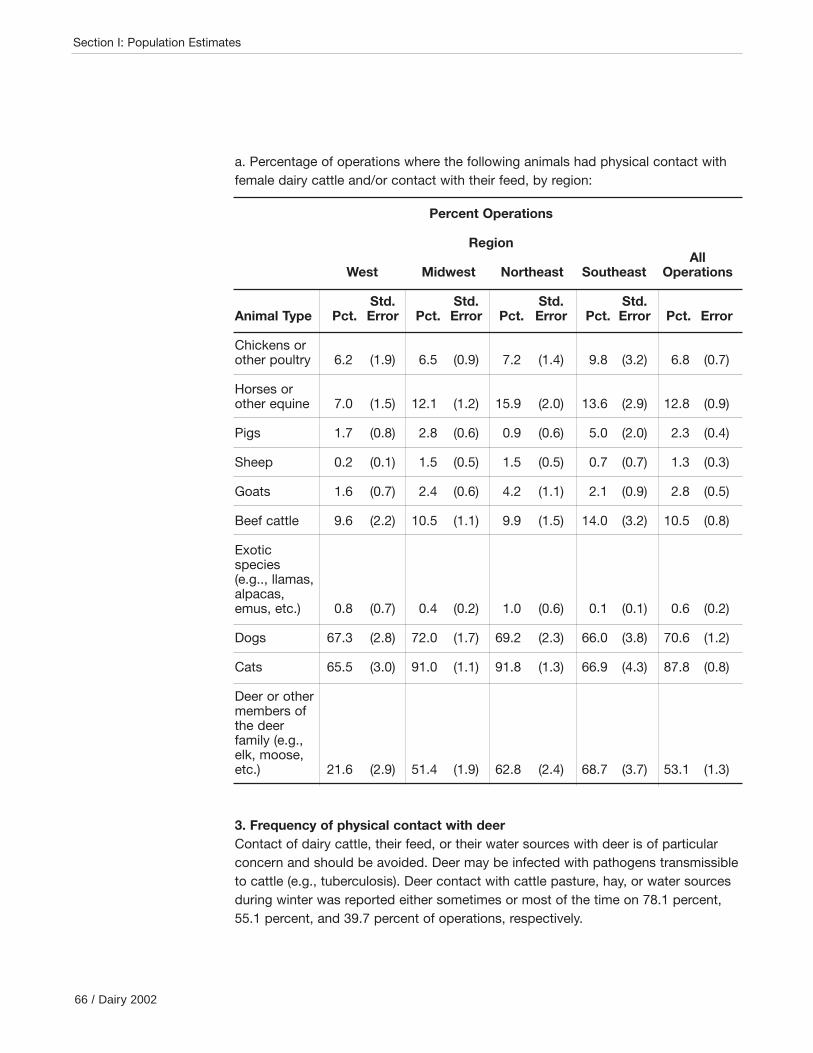
a. Percentage of operations where the following animals had physical contact withfemale dairy cattle and/or contact with their feed, by region:
Percent Operations
RegionAll
West Midwest Northeast Southeast Operations
Std. Std. Std. Std.Animal Type Pct. Error Pct. Error Pct. Error Pct. Error Pct. Error
Chickens or other poultry 6.2 (1.9) 6.5 (0.9) 7.2 (1.4) 9.8 (3.2) 6.8 (0.7)
Horses or other equine 7.0 (1.5) 12.1 (1.2) 15.9 (2.0) 13.6 (2.9) 12.8 (0.9)
Pigs 1.7 (0.8) 2.8 (0.6) 0.9 (0.6) 5.0 (2.0) 2.3 (0.4)
Sheep 0.2 (0.1) 1.5 (0.5) 1.5 (0.5) 0.7 (0.7) 1.3 (0.3)
Goats 1.6 (0.7) 2.4 (0.6) 4.2 (1.1) 2.1 (0.9) 2.8 (0.5)
Beef cattle 9.6 (2.2) 10.5 (1.1) 9.9 (1.5) 14.0 (3.2) 10.5 (0.8)
Exotic species (e.g.., llamas, alpacas, emus, etc.) 0.8 (0.7) 0.4 (0.2) 1.0 (0.6) 0.1 (0.1) 0.6 (0.2)
Dogs 67.3 (2.8) 72.0 (1.7) 69.2 (2.3) 66.0 (3.8) 70.6 (1.2)
Cats 65.5 (3.0) 91.0 (1.1) 91.8 (1.3) 66.9 (4.3) 87.8 (0.8)
Deer or other members of the deer family (e.g., elk, moose, etc.) 21.6 (2.9) 51.4 (1.9) 62.8 (2.4) 68.7 (3.7) 53.1 (1.3)
3. Frequency of physical contact with deerContact of dairy cattle, their feed, or their water sources with deer is of particularconcern and should be avoided. Deer may be infected with pathogens transmissibleto cattle (e.g., tuberculosis). Deer contact with cattle pasture, hay, or water sourcesduring winter was reported either sometimes or most of the time on 78.1 percent,55.1 percent, and 39.7 percent of operations, respectively.
66 / Dairy 2002
Section I: Population Estimates

a. For operations that reported that deer had physical contact with dairy cows, dairyheifers, or their feed, percentage of operations by frequency of deer access to thefollowing during winter:
Percent Operations
Accessed Accessed MostNo Access Sometimes of the Time
AreasAccessed Std. Std. Std.by Deer Percent Error Percent Error Percent Error Total
Pasture 21.9 (1.5) 21.4 (1.6) 56.7 (1.9) 100.0
Hay 44.9 (1.9) 16.9 (1.4) 38.2 (1.8) 100.0
Water sources used by cattle 60.3 (1.8) 13.8 (1.2) 25.9 (1.6) 100.0
Deer contact with cattle pasture, hay, or water sources during summer was reportedas occurring either sometimes or most of the time by 93.5 percent, 69.7 percent,and 58.9 percent of operations, respectively.
b. For operations that reported that deer had physical contact with dairy cows, dairyheifers, or their feed, percentage of operations by frequency of deer access to thefollowing during summer:
Percent Operations
Accessed Accessed MostNo Access Sometimes of the Time
AreasAccessed Std. Std. Std.by Deer Percent Error Percent Error Percent Error Total
Pasture 6.5 (0.8) 24.2 (1.6) 69.3 (1.7) 100.0
Hay 30.3 (1.8) 21.0 (1.5) 48.7 (1.9) 100.0
Water sources used by cattle 41.1 (1.9) 19.7 (1.4) 39.2 (1.8) 100.0
USDA APHIS VS / 67
Section I: Population Estimates

4. Biosecurity for new arrivals:New additions to dairy operations can introduce new diseases to the herd. Carefulscrutiny of the source of new additions and brief isolation or quarantine once theanimals are on the dairy are good management practices. Not surprisingly, bredheifers and lactating cows were the classes of cattle that were brought onto themost operations, with 15.8 percent of all operations reporting that bred heifers wereadded and 16.4 percent of operations reporting that lactating cows were added.Large operations (54.4 percent) were more likely to add bred heifers than medium(28.9 percent) and small (10.4 percent) operations. Beef or dairy cattle were broughtonto 45.7 percent of all operations.
a. Percentage of operations that brought the following classes of cattle onto theoperation during 2001, by herd size:
Percent Operations
Herd Size (Number of Dairy Cows)Small Medium Large All
(Less than 100) (100-499) (500 or More) Operations
Std. Std. Std. Std.Class of Cattle Pct. Error Pct. Error Pct. Error Pct. Error
Unweaned calves (dairy or beef) 4.9 (0.9) 6.0 (1.1) 3.2 (1.1) 5.1 (0.7)
Dairy heifers (weaned but not bred) 5.8 (0.8) 9.0 (1.2) 13.2 (1.9) 6.7 (0.7)
Bred dairy heifers 10.4 (1.0) 28.9 (1.9) 54.4 (2.7) 15.8 (0.9)
Lactating dairy cows 14.4 (1.2) 22.7 (1.8) 21.7 (2.3) 16.4 (1.0)
Dry dairy cows 5.7 (0.8) 6.9 (1.1) 6.3 (1.0) 5.9 (0.6)
Beef heifers and cows 1.5 (0.4) 1.6 (0.4) 1.1 (0.3) 1.5 (0.3)
Dairy bulls (weaned) 11.9 (1.1) 17.7 (1.5) 28.4 (2.4) 13.7 (0.9)
Beef bulls (weaned) 2.1 (0.5) 2.9 (0.6) 2.7 (0.9) 2.3 (0.4)
Steers (weaned) 1.0 (0.3) 1.6 (0.5) 0.1 (0.1) 1.1 (0.3)
Any beef or dairy cattle 40.1 (1.7) 61.2 (2.0) 75.3 (2.3) 45.7 (1.4)
68 / Dairy 2002
Section I: Population Estimates
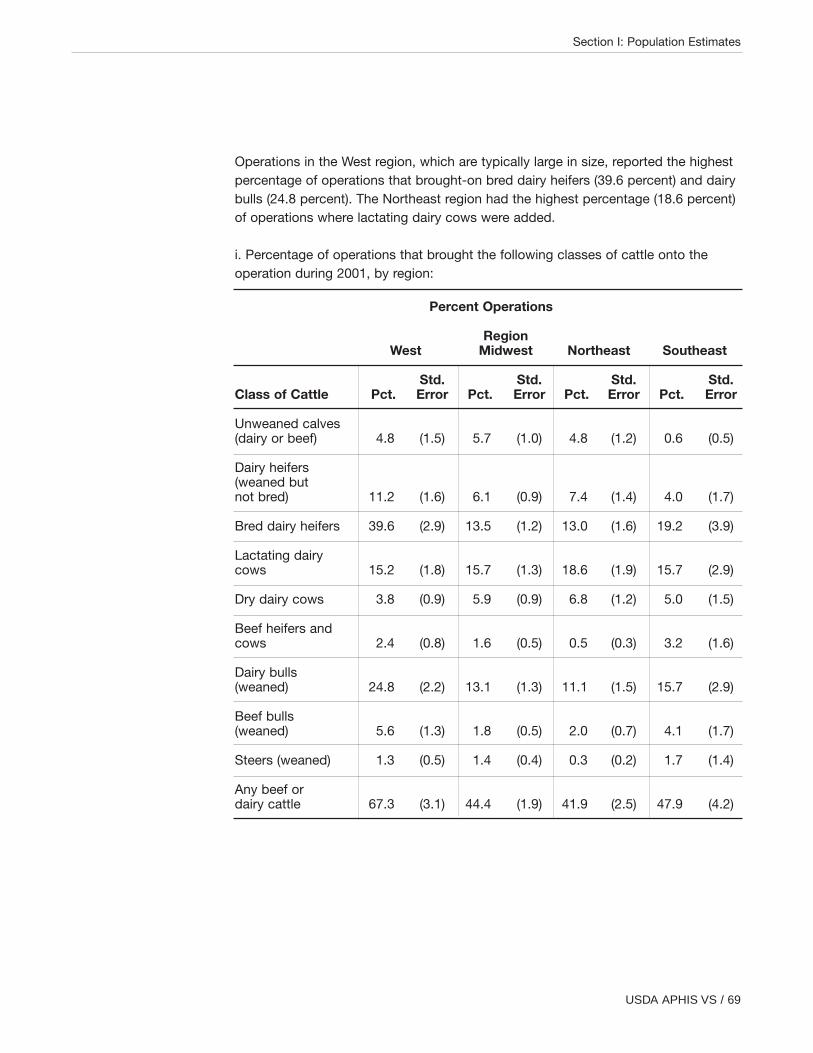
Operations in the West region, which are typically large in size, reported the highestpercentage of operations that brought-on bred dairy heifers (39.6 percent) and dairybulls (24.8 percent). The Northeast region had the highest percentage (18.6 percent)of operations where lactating dairy cows were added.
i. Percentage of operations that brought the following classes of cattle onto theoperation during 2001, by region:
Percent Operations
RegionWest Midwest Northeast Southeast
Std. Std. Std. Std.Class of Cattle Pct. Error Pct. Error Pct. Error Pct. Error
Unweaned calves (dairy or beef) 4.8 (1.5) 5.7 (1.0) 4.8 (1.2) 0.6 (0.5)
Dairy heifers (weaned but not bred) 11.2 (1.6) 6.1 (0.9) 7.4 (1.4) 4.0 (1.7)
Bred dairy heifers 39.6 (2.9) 13.5 (1.2) 13.0 (1.6) 19.2 (3.9)
Lactating dairy cows 15.2 (1.8) 15.7 (1.3) 18.6 (1.9) 15.7 (2.9)
Dry dairy cows 3.8 (0.9) 5.9 (0.9) 6.8 (1.2) 5.0 (1.5)
Beef heifers and cows 2.4 (0.8) 1.6 (0.5) 0.5 (0.3) 3.2 (1.6)
Dairy bulls (weaned) 24.8 (2.2) 13.1 (1.3) 11.1 (1.5) 15.7 (2.9)
Beef bulls (weaned) 5.6 (1.3) 1.8 (0.5) 2.0 (0.7) 4.1 (1.7)
Steers (weaned) 1.3 (0.5) 1.4 (0.4) 0.3 (0.2) 1.7 (1.4)
Any beef or dairy cattle 67.3 (3.1) 44.4 (1.9) 41.9 (2.5) 47.9 (4.2)
USDA APHIS VS / 69
Section I: Population Estimates

b. For operations that brought dairy cows (lactating or dry) and bred dairy heifersonto the operation during 2001, number of dairy cows and bred dairy heifersbrought onto the operation as a percentage of the January 1, 2002, dairy cow inven-tory, by herd size:
Percent Cows/Bred Dairy Heifers
Herd Size (Number of Dairy Cows)Small Medium Large All
(Less than 100) (100-499) (500 or More) Operations
Std. Std. Std. Std.Animal Type Pct. Error Pct. Error Pct. Error Pct. Error
Dairy cows 15.5 (1.4) 14.5 (1.4) 13.8 (1.6) 14.5 (0.9)
Bred dairy heifers 14.6 (2.2) 14.3 (2.4) 19.7 (1.4) 17.5 (1.1)
70 / Dairy 2002
Section I: Population Estimates

Quarantining1 new additions helps prevent the introduction of new diseases. Onlyunweaned dairy or beef calves (37.0 percent) and weaned steers (40.0 percent) werequarantined on more than one-quarter of operations. For the most common classesof cattle brought onto dairy operations, bred heifers and lactating cows, only a smallpercentage of operations quarantined these new additions, 19.6 percent and 9.5percent, respectively.
c. For operations that brought the following classes of cattle onto the operation dur-ing 2001, percentage of operations that quarantined any animals upon arrival at theoperation:
Class of Cattle Percent Operations Standard Error
Unweaned calves (dairy or beef) 37.0 (7.3)
Dairy heifers (weaned but not bred) 23.9 (3.9)
Bred dairy heifers 19.6 (2.3)
Lactating dairy cows 9.5 (1.6)
Dry dairy cows 7.1 (2.2)
Beef heifers and cows 24.0 (8.5)
Dairy bulls (weaned) 15.9 (2.4)
Beef bulls (weaned) 23.6 (6.5)
Steers (weaned) 40.0 (11.4)
Any beef or dairy cattle 20.6 (1.6)
1Quarantine refers to the physical separation of new additions from animals in theexisting herd.
USDA APHIS VS / 71
Section I: Population Estimates
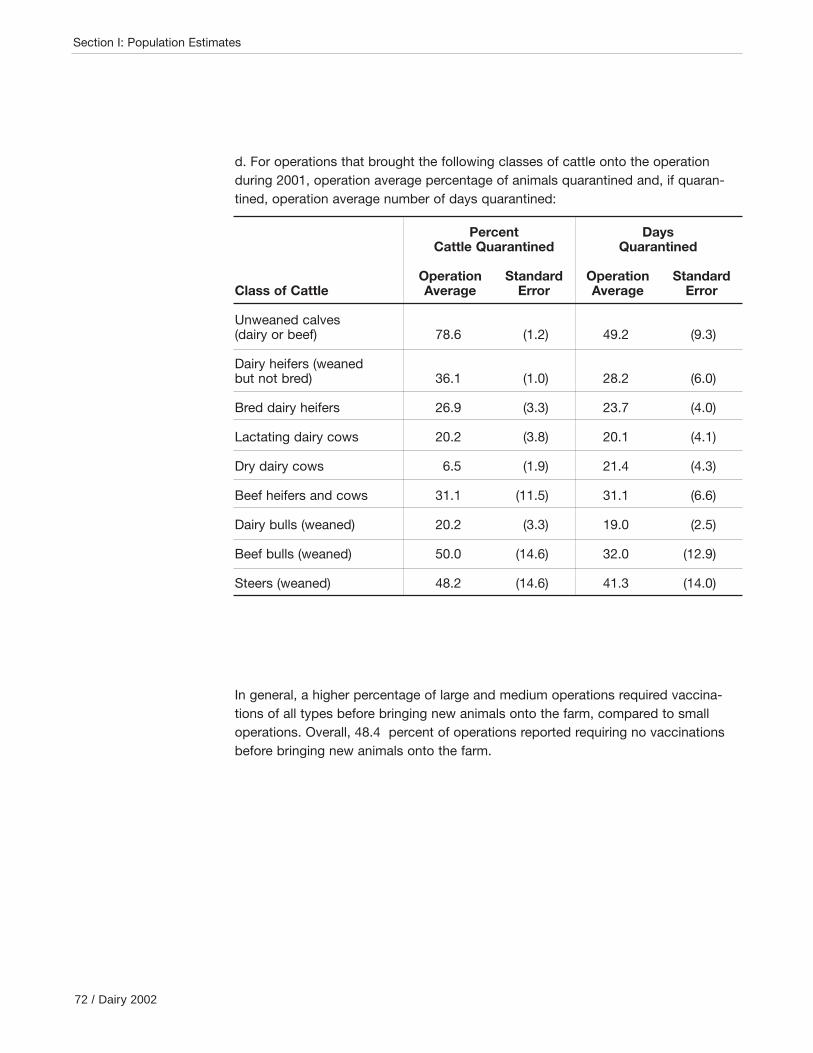
d. For operations that brought the following classes of cattle onto the operation during 2001, operation average percentage of animals quarantined and, if quaran-tined, operation average number of days quarantined:
Percent DaysCattle Quarantined Quarantined
Operation Standard Operation StandardClass of Cattle Average Error Average Error
Unweaned calves (dairy or beef) 78.6 (1.2) 49.2 (9.3)
Dairy heifers (weanedbut not bred) 36.1 (1.0) 28.2 (6.0)
Bred dairy heifers 26.9 (3.3) 23.7 (4.0)
Lactating dairy cows 20.2 (3.8) 20.1 (4.1)
Dry dairy cows 6.5 (1.9) 21.4 (4.3)
Beef heifers and cows 31.1 (11.5) 31.1 (6.6)
Dairy bulls (weaned) 20.2 (3.3) 19.0 (2.5)
Beef bulls (weaned) 50.0 (14.6) 32.0 (12.9)
Steers (weaned) 48.2 (14.6) 41.3 (14.0)
In general, a higher percentage of large and medium operations required vaccina-tions of all types before bringing new animals onto the farm, compared to smalloperations. Overall, 48.4 percent of operations reported requiring no vaccinationsbefore bringing new animals onto the farm.
72 / Dairy 2002
Section I: Population Estimates

e. For operations that brought beef or dairy cattle onto the operation during 2001,percentage of operations using the following methods of disease control beforebringing animals on farm:
i. Vaccination normally required by operation, by herd size:
Percent Operations
Herd Size (Number of Dairy Cows)Small Medium Large All
(Less than 100) (100-499) (500 or More) Operations
Std. Std. Std. Std.Vaccination Type Pct. Error Pct. Error Pct. Error Pct. Error
Brucellosis 33.4 (2.5) 51.3 (2.7) 60.0 (3.1) 39.9 (1.9)
Bovine viral diarrhea (BVD) 36.2 (2.5) 51.2 (2.7) 53.9 (3.2) 41.3 (1.9)
Infectious bovine rhinotracheitis (IBR) 35.8 (2.6) 50.5 (2.7) 51.2 (3.2) 40.8 (1.9)
Leptospirosis 32.5 (2.5) 48.5 (2.7) 47.5 (3.2) 37.8 (1.8)
Neospora 11.1 (1.6) 15.5 (1.8) 16.1 (2.3) 12.6 (1.2)
Other 4.3 (0.8) 8.4 (1.4) 7.7 (1.5) 5.6 (0.7)
None 55.4 (2.7) 36.0 (2.7) 28.1 (3.0) 48.4 (2.0)
USDA APHIS VS / 73
Section I: Population Estimates
39.9 41.3 40.837.8
12.6
5.6
48.4Percent
Brucellosis BVD IBR Leptospirosis Neospora Other None
Vaccination Type
0
10
20
30
40
50
Percent of Operations by Vaccination Required Before BringingNew Animals On Farm
#1026
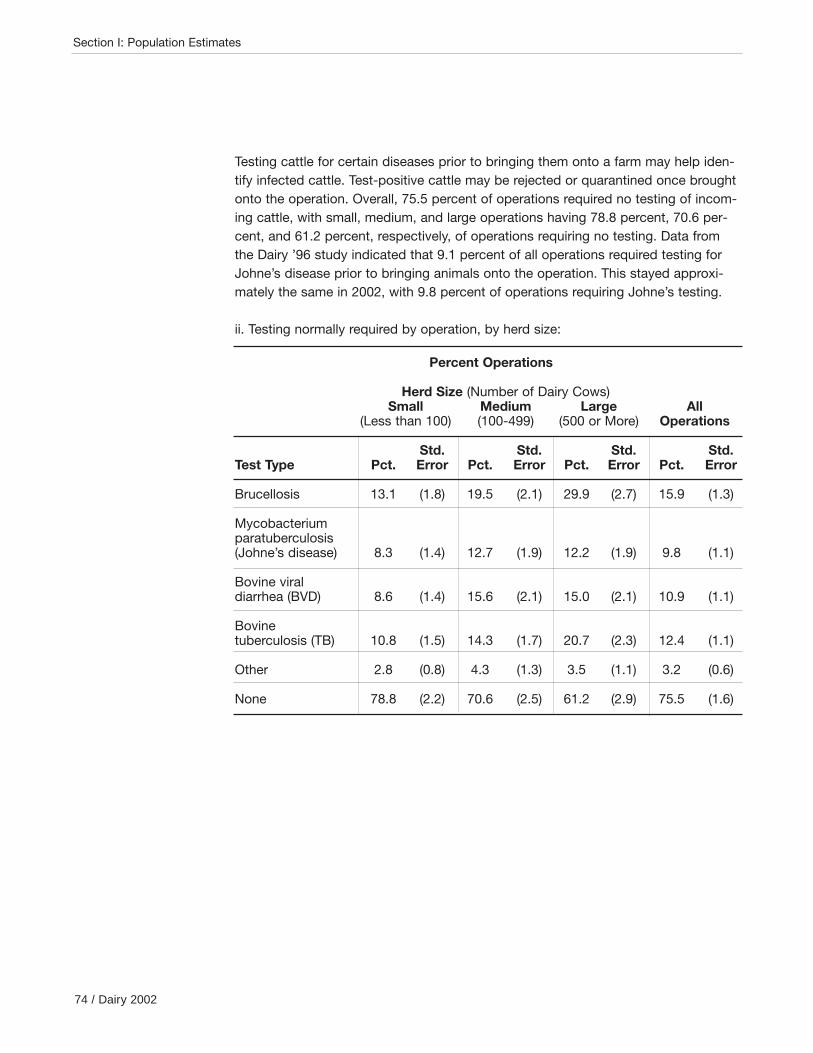
Testing cattle for certain diseases prior to bringing them onto a farm may help iden-tify infected cattle. Test-positive cattle may be rejected or quarantined once broughtonto the operation. Overall, 75.5 percent of operations required no testing of incom-ing cattle, with small, medium, and large operations having 78.8 percent, 70.6 per-cent, and 61.2 percent, respectively, of operations requiring no testing. Data fromthe Dairy ’96 study indicated that 9.1 percent of all operations required testing forJohne’s disease prior to bringing animals onto the operation. This stayed approxi-mately the same in 2002, with 9.8 percent of operations requiring Johne’s testing.
ii. Testing normally required by operation, by herd size:
Percent Operations
Herd Size (Number of Dairy Cows)Small Medium Large All
(Less than 100) (100-499) (500 or More) Operations
Std. Std. Std. Std.Test Type Pct. Error Pct. Error Pct. Error Pct. Error
Brucellosis 13.1 (1.8) 19.5 (2.1) 29.9 (2.7) 15.9 (1.3)
Mycobacterium paratuberculosis (Johne’s disease) 8.3 (1.4) 12.7 (1.9) 12.2 (1.9) 9.8 (1.1)
Bovine viral diarrhea (BVD) 8.6 (1.4) 15.6 (2.1) 15.0 (2.1) 10.9 (1.1)
Bovine tuberculosis (TB) 10.8 (1.5) 14.3 (1.7) 20.7 (2.3) 12.4 (1.1)
Other 2.8 (0.8) 4.3 (1.3) 3.5 (1.1) 3.2 (0.6)
None 78.8 (2.2) 70.6 (2.5) 61.2 (2.9) 75.5 (1.6)
74 / Dairy 2002
Section I: Population Estimates

Testing of individual cow milk samples and/or bulk tank milk samples are suggestedbiosecurity practices for preventing introduction of contagious mastitis organisms.Overall, 26.8 percent of operations required individual cow’s milk somatic cellcounts; 16.6 percent required a somatic cell count of the bulk tank; 11.0 percentrequired individual cow’s milk culture; and 10.6 percent required a bulk tank culture.Compared to the Dairy ’96 study, slight increases occurred in the percentage ofoperations that required testing for all four test procedures. In general, the percent-age of operations that required testing increased as the size of operation increased.
USDA APHIS VS / 75
Section I: Population Estimates
15.9
9.8 10.9 12.4
3.2
75.5Percent
Brucellosis Johne'sDisease
BVD TB Other None
Test Type
0
10
20
30
40
50
60
70
80
Percent of Operations by Testing Normally Required BeforeBringing Animals On Farm
#1027
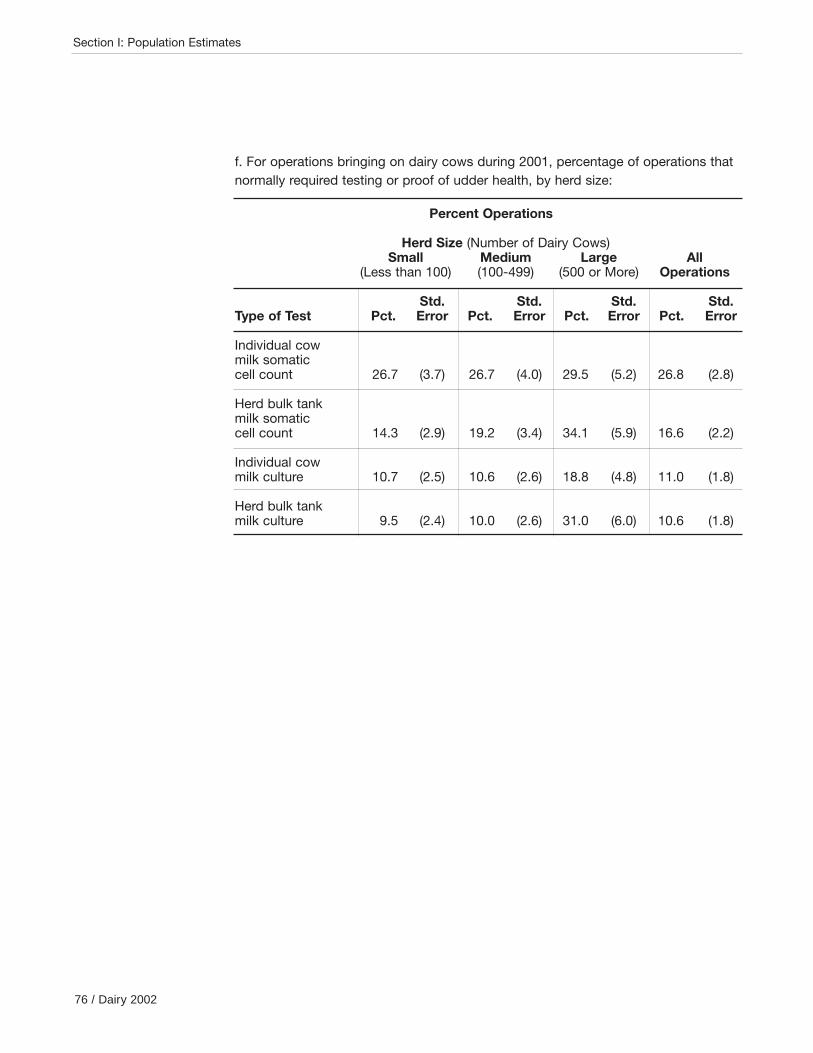
f. For operations bringing on dairy cows during 2001, percentage of operations thatnormally required testing or proof of udder health, by herd size:
Percent Operations
Herd Size (Number of Dairy Cows)Small Medium Large All
(Less than 100) (100-499) (500 or More) Operations
Std. Std. Std. Std.Type of Test Pct. Error Pct. Error Pct. Error Pct. Error
Individual cow milk somatic cell count 26.7 (3.7) 26.7 (4.0) 29.5 (5.2) 26.8 (2.8)
Herd bulk tank milk somatic cell count 14.3 (2.9) 19.2 (3.4) 34.1 (5.9) 16.6 (2.2)
Individual cow milk culture 10.7 (2.5) 10.6 (2.6) 18.8 (4.8) 11.0 (1.8)
Herd bulk tank milk culture 9.5 (2.4) 10.0 (2.6) 31.0 (6.0) 10.6 (1.8)
76 / Dairy 2002
Section I: Population Estimates
NAHMS develops study objectives by exploring existing literature and contactingindustry members about their informational needs and priorities during a needsassessment phase. The objective of the needs assessment for the NAHMS Dairy2002 study was to conduct a national survey to collect information from U.S. dairyproducers and others associated with the dairy industry about what they perceivedto be the most important dairy health and productivity issues. A driving force of theneeds assessment was to receive as much input as possible from a variety of pro-ducers, as well as from industry experts and representatives, veterinarians, exten-sion specialists, universities, and dairy organizations.
Focus group meetings were held at various locations across the United States tohelp determine the focus of the study.
Birmingham, AL October 21, 2000United States Animal Health Association (USAHA)
Kansas City, MO October 31, 2000American Feed Industry Association (AFIA)Dairy Nutrition Committee
Teleconference December 15, 2000Bovine Alliance on Management and Nutrition (BAMN)
San Antonio, TX February 4, 2001American Farm Bureau FederationDairy Advisory Committee
Riverdale, MD February 16, 2001Government Perspective MeetingAPHIS, FSIS, FDA, and ARS
In addition, a short form asking for rankings of major dairy issues was provided viamultiple data collection modes. There were 155 responses completed via the Web,90 by hard copy, and 1 completed via telephone.
The focus group meeting input was merged with other responses to determine Dairy2002 study objectives.
USDA APHIS VS / 77
Section II: Methodology
Section II: Methods
A. NeedsAssessment

1. State selection
The preliminary selection of States to be included in the study was done in January2001, using the National Agricultural Statistics Service (NASS), USDA January 28,2000, Cattle Report. A goal for NAHMS national studies is to include States thataccount for at least 70 percent of the animals and producer population in the UnitedStates. The initial review of States identified 20 major States with 84 percent of themilk cow inventory and 81 percent of the operations with milk cows (dairy herds).The States were: CA, FL, ID, IL, IN, IA, KY, MI, MN, MO, NM, NY, OH, PA, TN, TX,VT, VA, WA, and WI.
A memo identifying these 20 States was provided in February 2001 to theUSDA:APHIS:VS CEAH Director and, in turn, the VS Regional Directors. EachRegional Director sought input from their respective States about being included orexcluded from the study. By midyear, Colorado was included, based on the State’sinterest.
2. Operation selection
The list sampling frame was provided by the NASS. Within each State a stratifiedrandom sample was selected. The size indicator was the number of milk cows foreach operation. The NASS selected a sample of dairy producers in each State formaking the NASS January 1 cattle estimates. The list sample from the January 2001survey was used as the screening sample. Those producers reporting one or moremilk cows on January 1, 2001, were included in the sample for contact in January2002. Due to the predicted large workload, the sample was reduced in two States(KY and PA), for a final screening sample of 3,876 operations.
3. Population inferences
Inferences cover the population of dairy producers with at least one milk cow in the21 States. As of January 1, 2002, these States accounted for 85.5 percent(7,790,000 head) of milk cows in the United States and 82.8 percent (80,810) ofoperations with milk cows in the United States. (See appendix II for respective dataon individual States.) All respondent data were statistically weighted to reflect thepopulation from which they were selected. The inverse of the probability of selectionfor each operation was the initial selection weight. This selection weight was adjusted for nonresponse within each State and size group to allow for inferencesback to the original population from which the sample was selected.
78 / Dairy 2002
Section II: Methodology
B. Sampling andEstimation
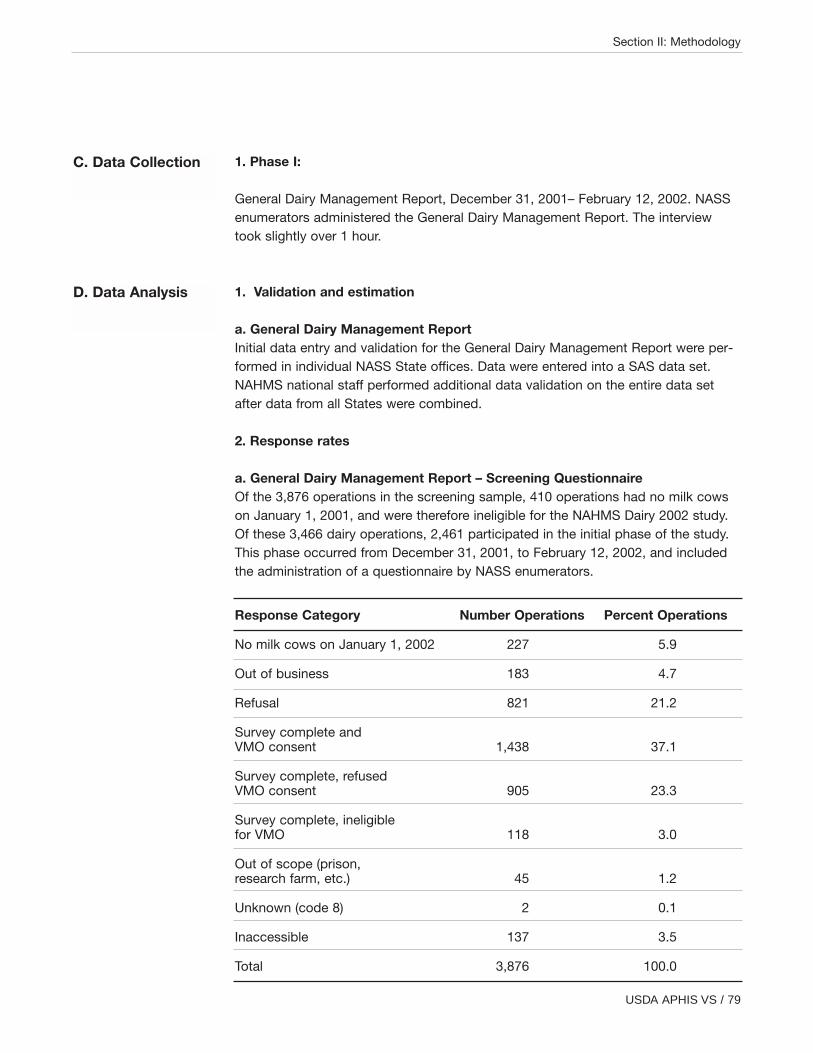
1. Phase I:
General Dairy Management Report, December 31, 2001– February 12, 2002. NASSenumerators administered the General Dairy Management Report. The interviewtook slightly over 1 hour.
1. Validation and estimation
a. General Dairy Management ReportInitial data entry and validation for the General Dairy Management Report were per-formed in individual NASS State offices. Data were entered into a SAS data set.NAHMS national staff performed additional data validation on the entire data setafter data from all States were combined.
2. Response rates
a. General Dairy Management Report – Screening QuestionnaireOf the 3,876 operations in the screening sample, 410 operations had no milk cowson January 1, 2001, and were therefore ineligible for the NAHMS Dairy 2002 study.Of these 3,466 dairy operations, 2,461 participated in the initial phase of the study.This phase occurred from December 31, 2001, to February 12, 2002, and includedthe administration of a questionnaire by NASS enumerators.
Response Category Number Operations Percent Operations
No milk cows on January 1, 2002 227 5.9
Out of business 183 4.7
Refusal 821 21.2
Survey complete and VMO consent 1,438 37.1
Survey complete, refused VMO consent 905 23.3
Survey complete, ineligible for VMO 118 3.0
Out of scope (prison, research farm, etc.) 45 1.2
Unknown (code 8) 2 0.1
Inaccessible 137 3.5
Total 3,876 100.0
USDA APHIS VS / 79
Section II: Methodology
C. Data Collection
D. Data Analysis

1a. Total inventory, by herd size
Herd Size (Total Inventory) Number of Responding Sites
Less than 100 1,131
100 to 499 820
500 or more 510
Total 2,461
1b. Number of responding sites, by region
Region Number of Responding Sites
West 525
Midwest 1,085
Northeast 596
Southeast 255
Total 2,461
80 / Dairy 2002
Appendix I: Sample Profile
Appendix I: Sample Profile
A. RespondingSites

Number of milk cows on January 1, 20021 Number of(Thousand Head) Operations 2001
Milk cows on Milk cows onoperations operations Operations Operationswith 1 or with 30 or with 1 or with 30 or
Region State more head more head more head more head
West California 1,620 1,618.4 2,500 2,200Colorado 91 90.0 800 220Idaho 377 375.5 1,000 770New Mexico 290 289.4 500 165Texas 310 306.9 2,100 1,150Washington 247 246.3 1,000 700Total 2,935 2,926.5 7,900 5,205
Midwest Illinois 115 111.6 1,900 1,420Indiana 154 140.1 2,900 1,400Iowa 205 194.8 3,500 2,680Michigan 297 282.2 3,300 2,250Minnesota 500 480.0 7,800 6,700Missouri 140 133.0 3,700 2,100Ohio 260 236.6 5,200 2,800Wisconsin 1,280 1,232.6 19,100 15,950Total 2,951 2,810.8 47,400 35,300
Northeast New York 675 661.5 7,200 5,900Pennsylvania 588 564.5 10,300 8,500Vermont 154 152.5 1,600 1,470Total 1,417 1,378.4 19,100 15,870
Southeast Florida 152 151.4 510 220Kentucky 125 115.0 2,900 1,600Tennessee 90 87.8 1,500 870Virginia 120 116.4 1,500 1,010Total 487 470.6 6,410 3,700
Total (21 States) 7,790 7,586.3 80,810 60,075(85.5% of U.S.) (85.5% of U.S.) (82.8% of U.S.) (86.6% of U.S.)
Total U.S. (50 States) 9,109.6 8,872.8 97,560 69,405
1Source: NASS Cattle, February 1, 2002. An operation is any place having one or more head of milk cows, excluding cows used to nurse calves, on hand at any time during the year.
USDA APHIS VS / 81
Appendix II: U.S. Milk Cow Population and Operations
Appendix II: U.S. Milk Cow Population and Operations
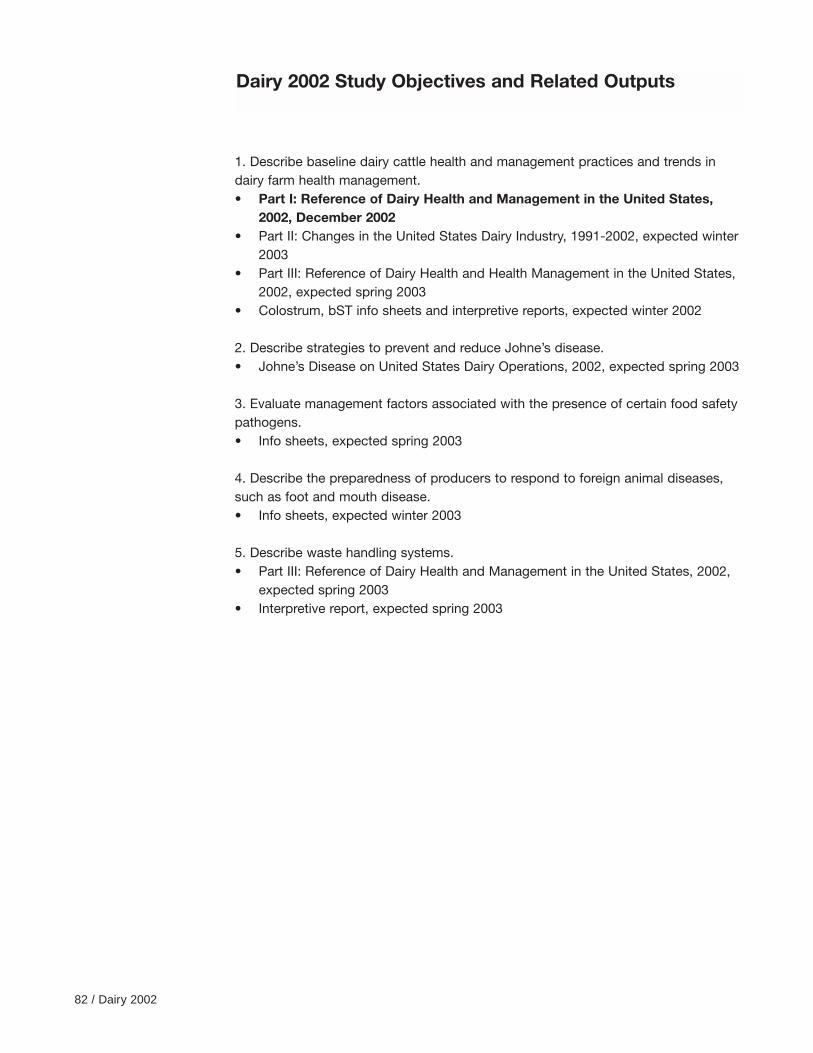
1. Describe baseline dairy cattle health and management practices and trends indairy farm health management.• Part I: Reference of Dairy Health and Management in the United States,
2002, December 2002• Part II: Changes in the United States Dairy Industry, 1991-2002, expected winter
2003• Part III: Reference of Dairy Health and Health Management in the United States,
2002, expected spring 2003• Colostrum, bST info sheets and interpretive reports, expected winter 2002
2. Describe strategies to prevent and reduce Johne’s disease.• Johne’s Disease on United States Dairy Operations, 2002, expected spring 2003
3. Evaluate management factors associated with the presence of certain food safetypathogens.• Info sheets, expected spring 2003
4. Describe the preparedness of producers to respond to foreign animal diseases,such as foot and mouth disease.• Info sheets, expected winter 2003
5. Describe waste handling systems.• Part III: Reference of Dairy Health and Management in the United States, 2002,
expected spring 2003• Interpretive report, expected spring 2003
82 / Dairy 2002
Dairy 2002 Study Objectives and Related Outputs