Dairy Campus - The transition period and metabolic …...The transition period and metabolic...
40
The transition period and metabolic diseases in relation to fertility Stephen LeBlanc International Dairy Nutrition Symposium 2017
Transcript of Dairy Campus - The transition period and metabolic …...The transition period and metabolic...
The transition period and metabolic diseases in relation to fertility
Stephen LeBlanc
International Dairy Nutrition Symposium 2017
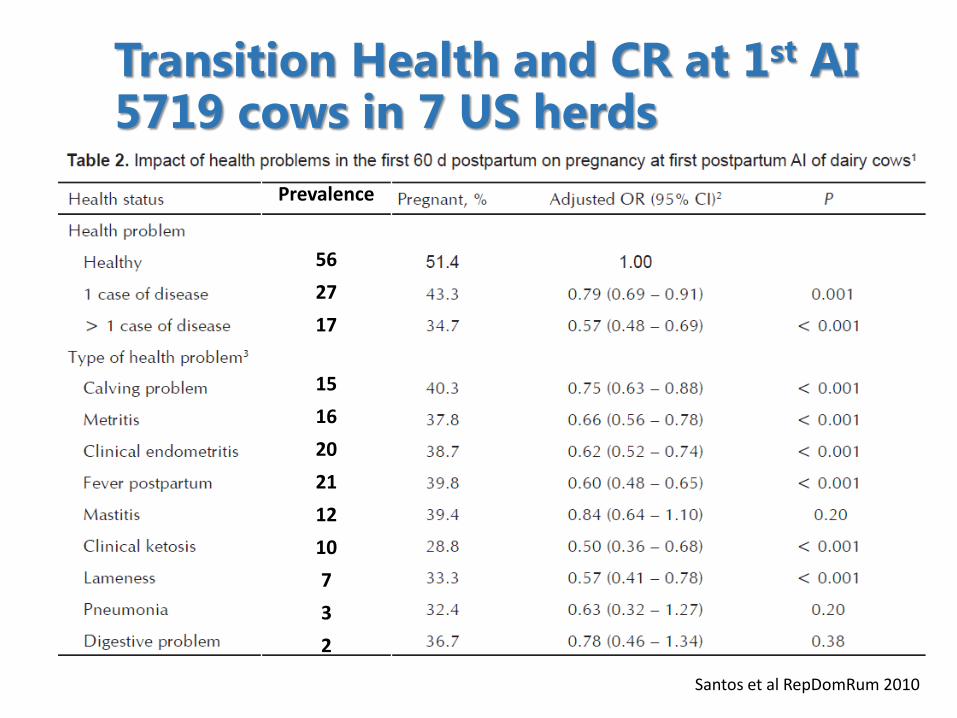
Transition Health and CR at 1st AI5719 cows in 7 US herds
Santos et al RepDomRum 2010
Prevalence
56
27
17
15
16
20
21
12
10
7
3
2
Dry period nutrition and
reproduction• Pooled analysis of 7 studies of controlled (
100% NRC) vs. high (> 100% NRC) energy
factorial experiments in far-off and close-
up dry period (Cardoso et al 2013)
• CE in close-up associated with
–Shorter time to pregnancy (157 vs 167 d)
–Higher NEL intake postpartum
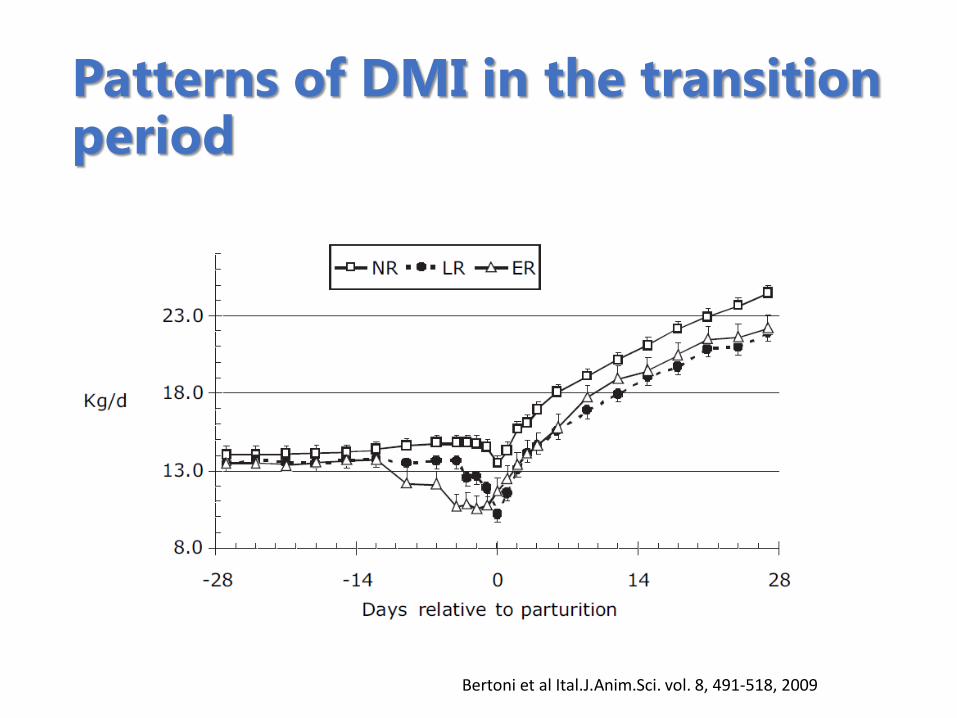
Patterns of DMI in the transition period
Bertoni et al Ital.J.Anim.Sci. vol. 8, 491-518, 2009
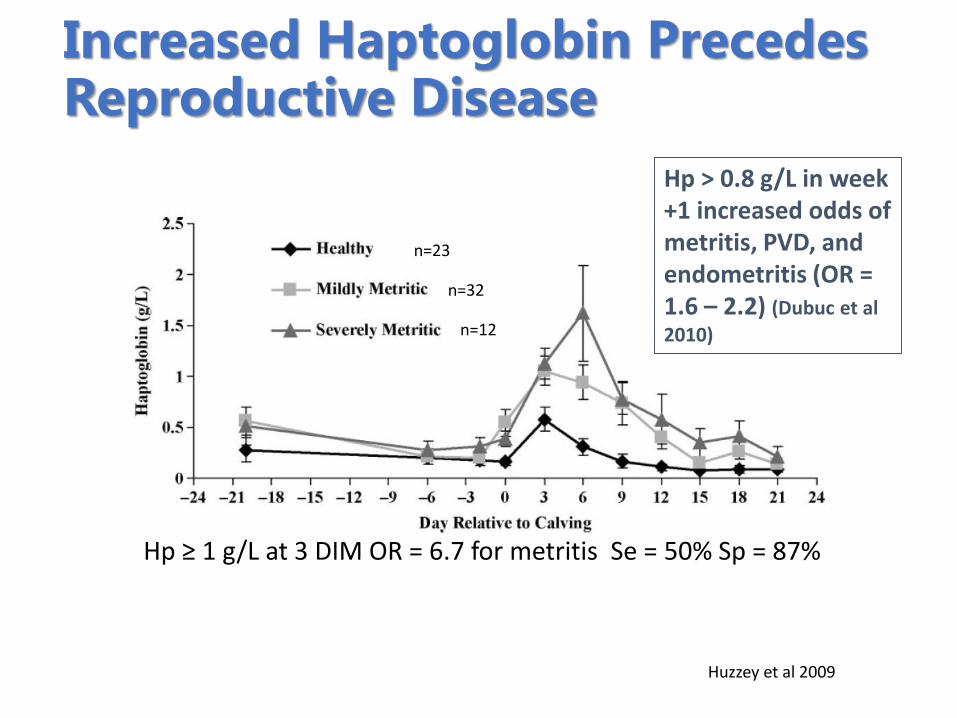
Increased Haptoglobin Precedes Reproductive Disease
Huzzey et al 2009
Hp ≥ 1 g/L at 3 DIM OR = 6.7 for metritis Se = 50% Sp = 87%
n=12
n=23
n=32
Hp > 0.8 g/L in week +1 increased odds of metritis, PVD, and endometritis (OR = 1.6 – 2.2) (Dubuc et al
2010)
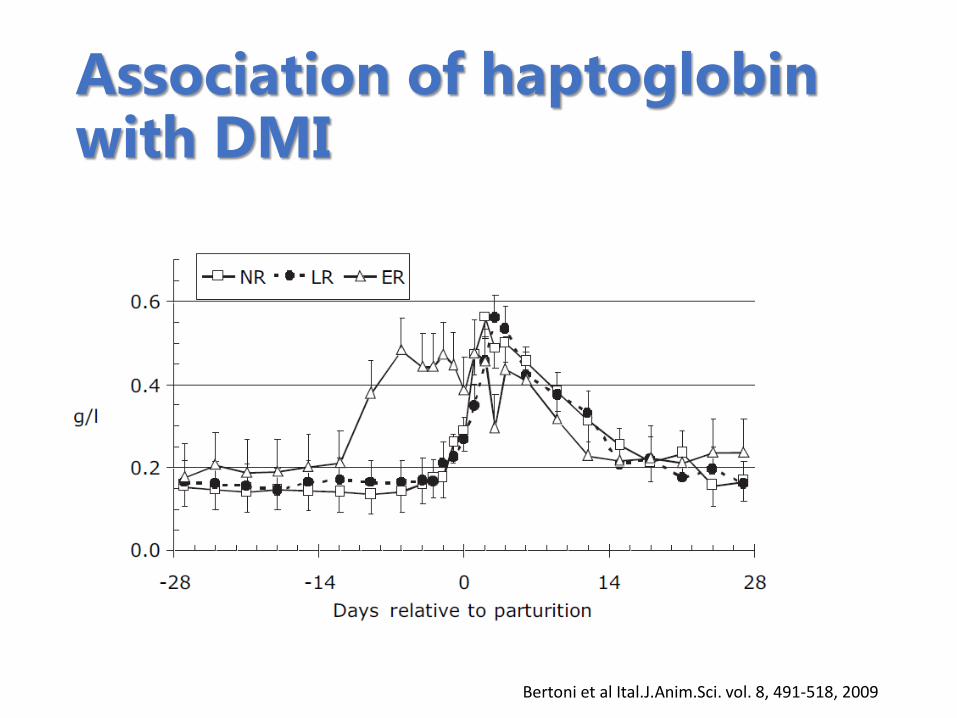
Association of haptoglobinwith DMI
Bertoni et al Ital.J.Anim.Sci. vol. 8, 491-518, 2009
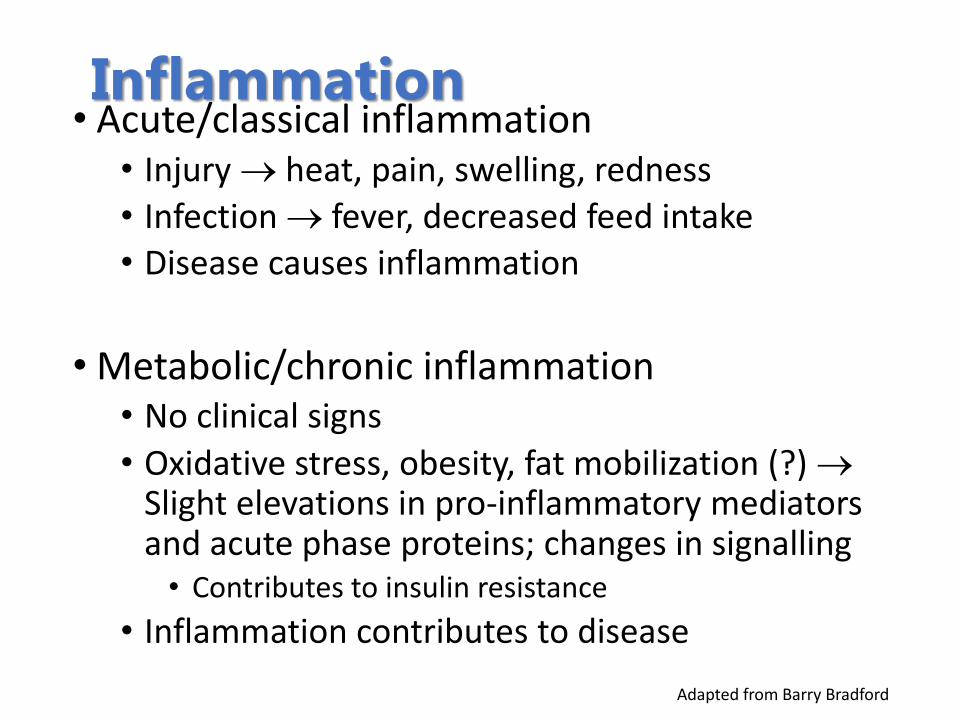
Inflammation• Acute/classical inflammation
• Injury heat, pain, swelling, redness
• Infection fever, decreased feed intake• Disease causes inflammation
• Metabolic/chronic inflammation• No clinical signs
• Oxidative stress, obesity, fat mobilization (?) Slight elevations in pro-inflammatory mediators and acute phase proteins; changes in signalling
• Contributes to insulin resistance
• Inflammation contributes to disease
Adapted from Barry Bradford
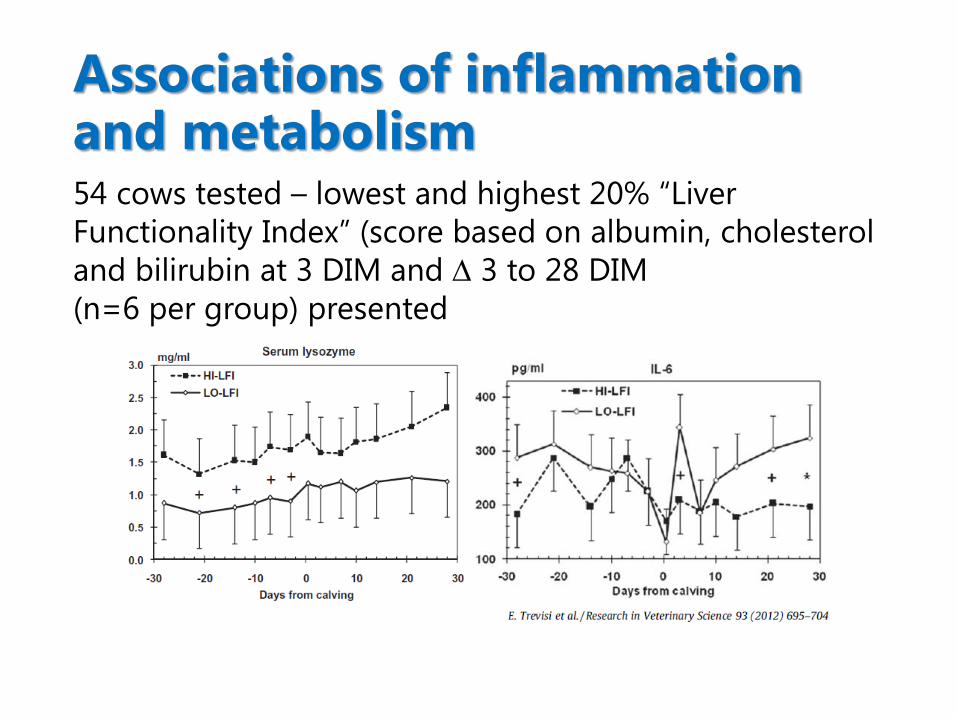
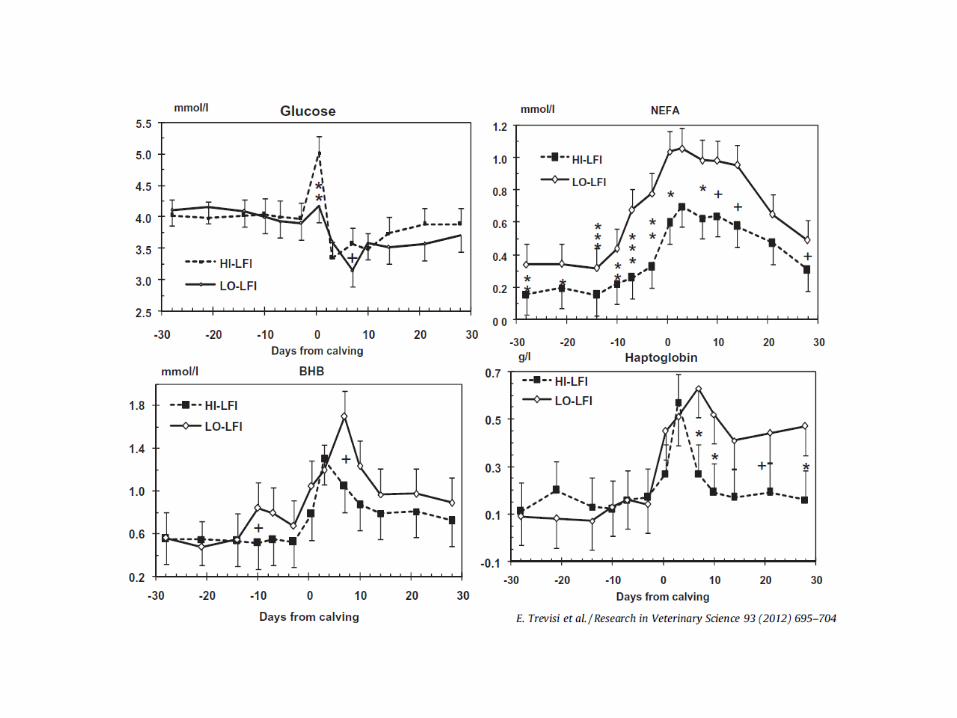
Associations of inflammation and metabolism54 cows tested – lowest and highest 20% “Liver
Functionality Index” (score based on albumin, cholesterol
and bilirubin at 3 DIM and 3 to 28 DIM
(n=6 per group) presented
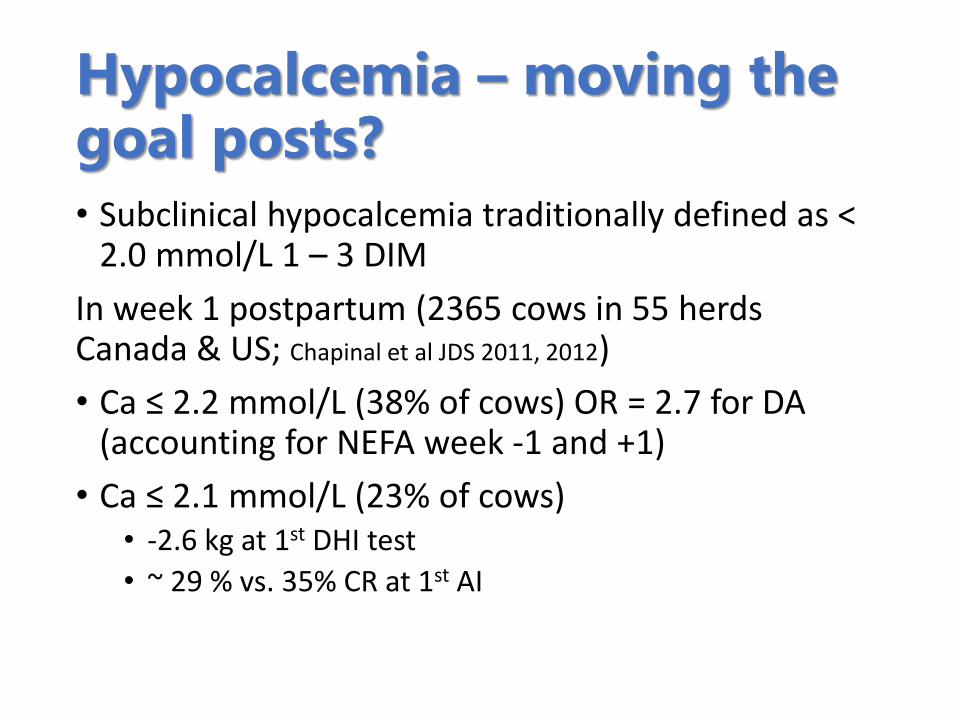
Hypocalcemia – moving the goal posts?
• Subclinical hypocalcemia traditionally defined as < 2.0 mmol/L 1 – 3 DIM
In week 1 postpartum (2365 cows in 55 herds Canada & US; Chapinal et al JDS 2011, 2012)
• Ca ≤ 2.2 mmol/L (38% of cows) OR = 2.7 for DA (accounting for NEFA week -1 and +1)
• Ca ≤ 2.1 mmol/L (23% of cows) • -2.6 kg at 1st DHI test
• ~ 29 % vs. 35% CR at 1st AI
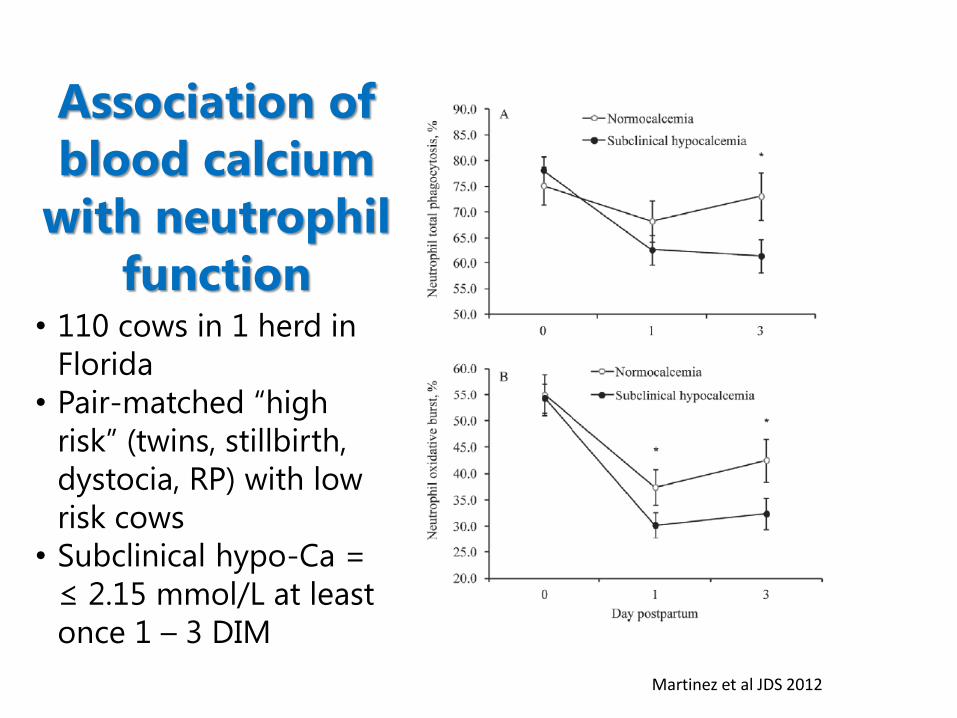
Association of
blood calcium
with neutrophil
function
Martinez et al JDS 2012
• 110 cows in 1 herd in
Florida
• Pair-matched “high
risk” (twins, stillbirth,
dystocia, RP) with low
risk cows
• Subclinical hypo-Ca =
≤ 2.15 mmol/L at least
once 1 – 3 DIM
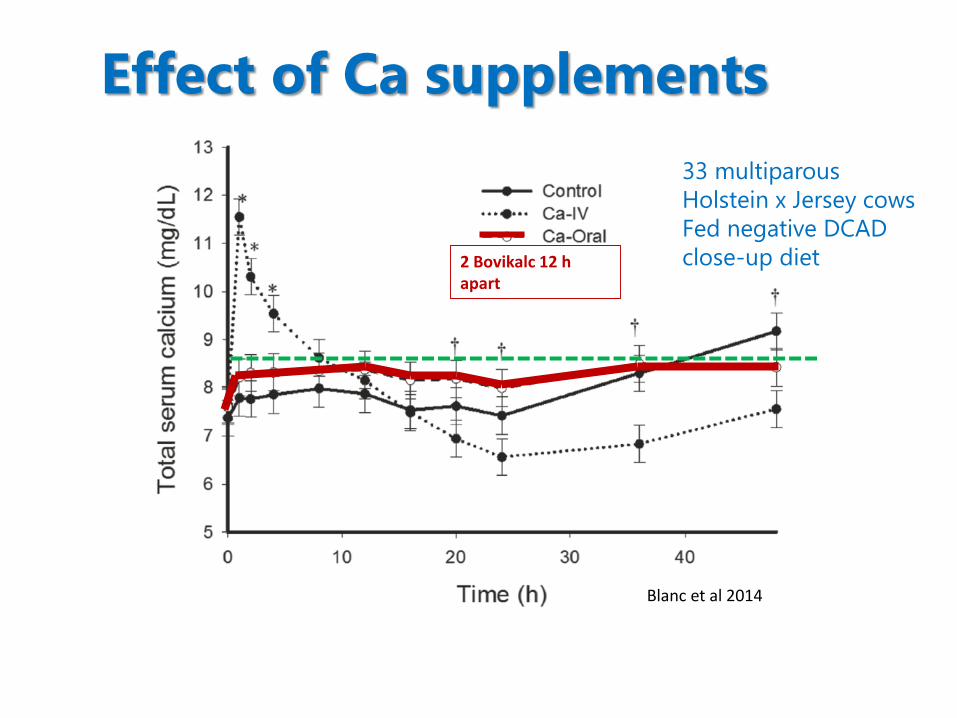
Blanc et al 2014
33 multiparous
Holstein x Jersey cows
Fed negative DCAD
close-up diet2 Bovikalc 12 h apart
Effect of Ca supplements
Prevention or treatment of hypocalcemia• One study (Miller and Oetzel, 2012) supplemented cows
with oral calcium after calving found:• an increase in milk production in higher producing cows
• decrease in health problems among lame cows
• Calcium supplements can reduce clinical milk fever
• Calcium supplements can modestly increase blood [Ca] in cows with low blood [Ca] (Miltenburg et al, 2016; Blanc et al 2016; Martinez et al 2016; Amanlou et al 2016)
• Effects of calcium supplements on risk of disease• None Miltenburg et al, 2016
• None to worse Martinez et al 2016 a, b
• Better Amanlou et al 2016
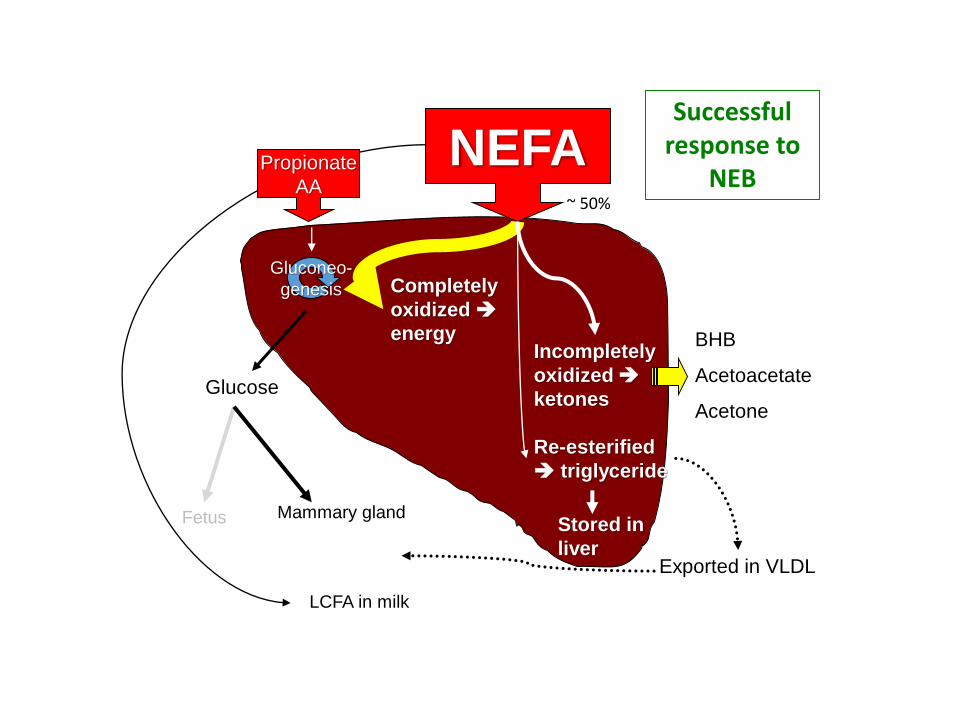
Re-esterified
triglyceride
Stored in
liverExported in VLDL
Gluconeo-
genesis
Propionate
AA
NEFA
Glucose
Fetus Mammary gland
Incompletely
oxidized
ketones
Completely
oxidized
energy BHB
Acetoacetate
Acetone
Successful response to
NEB~ 50%
LCFA in milk
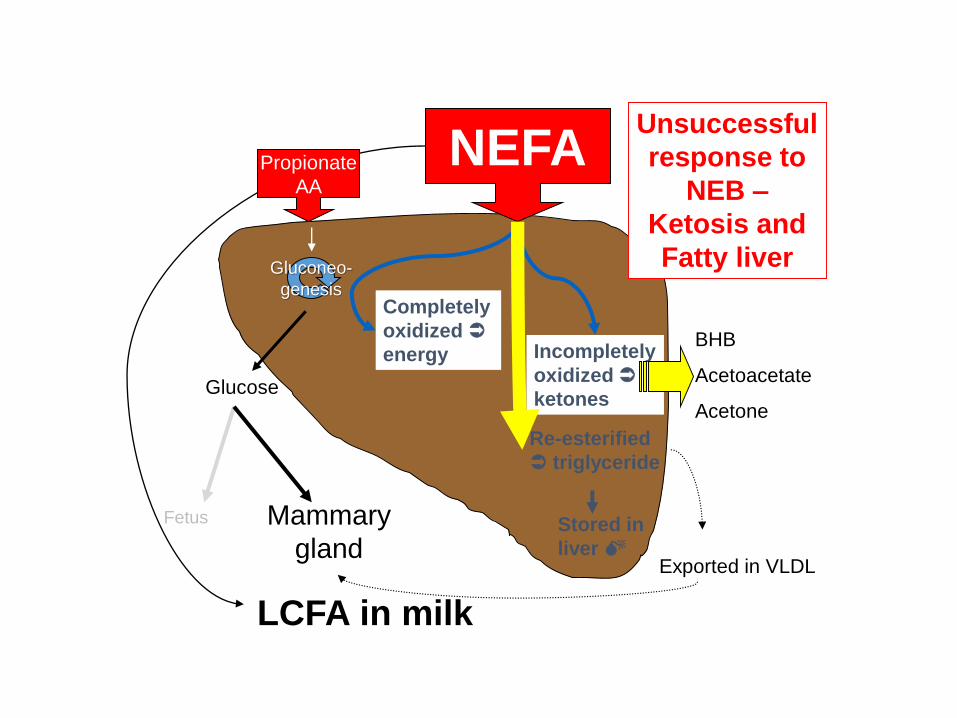
Re-esterified
triglyceride
Stored in
liver Exported in VLDL
Gluconeo-
genesis
Propionate
AA
NEFA
Glucose
Fetus Mammary
gland
Incompletely
oxidized
ketones
Completely
oxidized
energyBHB
Acetoacetate
Acetone
Unsuccessful
response to
NEB –
Ketosis and
Fatty liver
LCFA in milk
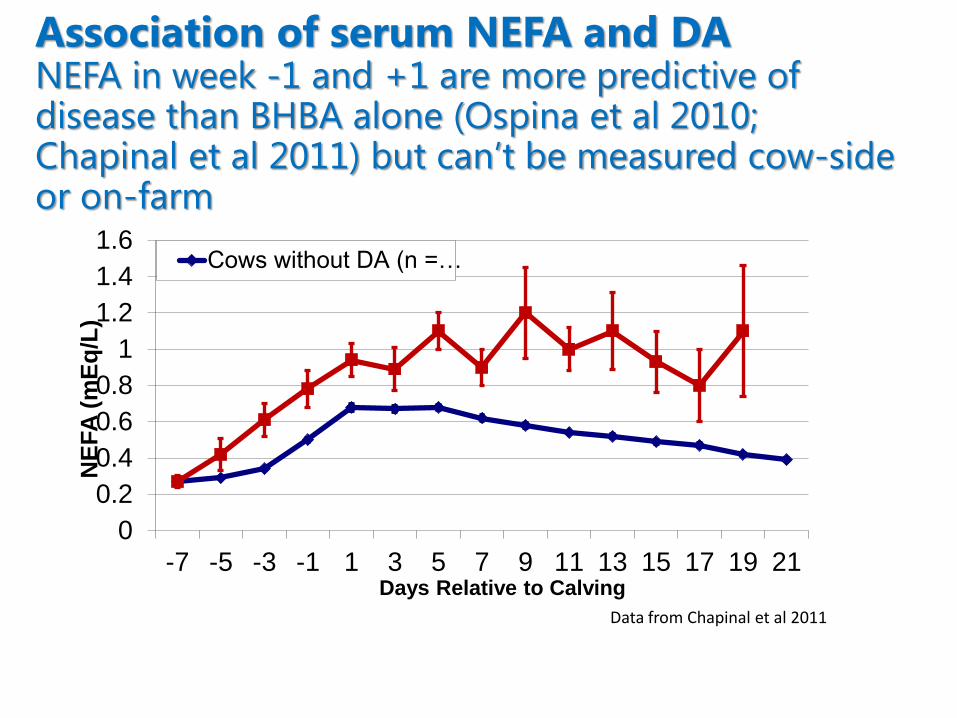
Association of serum NEFA and DANEFA in week -1 and +1 are more predictive of disease than BHBA alone (Ospina et al 2010; Chapinal et al 2011) but can’t be measured cow-side or on-farm
0
0.2
0.4
0.6
0.8
1
1.2
1.4
1.6
-7 -5 -3 -1 1 3 5 7 9 11 13 15 17 19 21
NE
FA
(m
Eq
/L)
Days Relative to Calving
Cows without DA (n =…
Data from Chapinal et al 2011
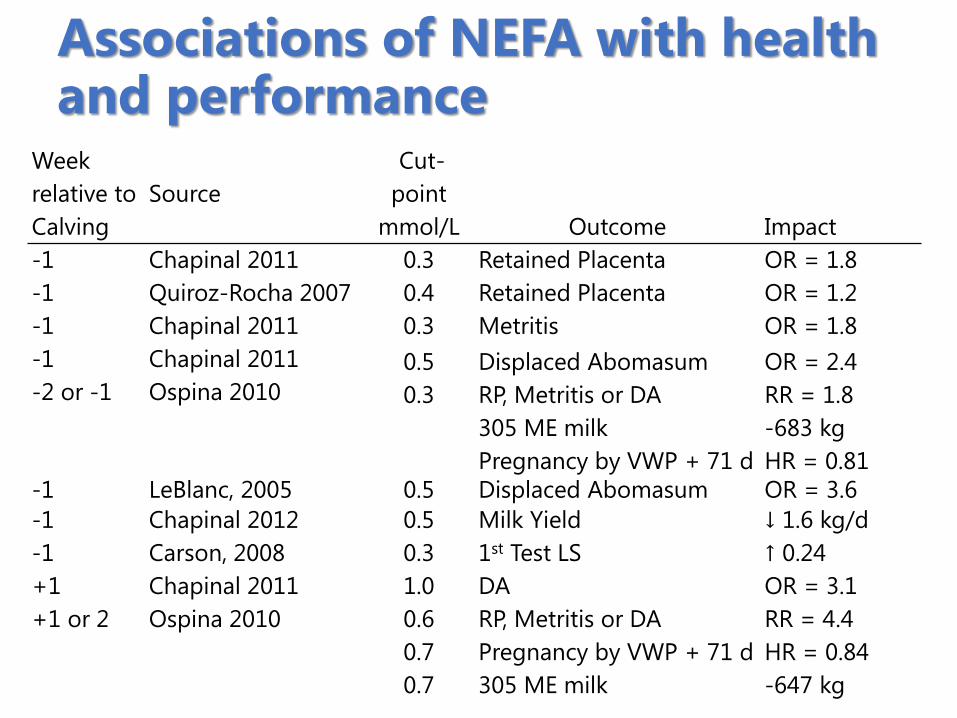
Associations of NEFA with health and performance
Week
relative to
Calving
Source
Cut-
point
mmol/L Outcome Impact
-1 Chapinal 2011 0.3 Retained Placenta OR = 1.8
-1 Quiroz-Rocha 2007 0.4 Retained Placenta OR = 1.2
-1 Chapinal 2011 0.3 Metritis OR = 1.8
-1 Chapinal 2011 0.5 Displaced Abomasum OR = 2.4
-2 or -1 Ospina 2010 0.3 RP, Metritis or DA RR = 1.8
305 ME milk -683 kg
Pregnancy by VWP + 71 d HR = 0.81
-1 LeBlanc, 2005 0.5 Displaced Abomasum OR = 3.6
-1 Chapinal 2012 0.5 Milk Yield ↓ 1.6 kg/d
-1 Carson, 2008 0.3 1st Test LS ↑ 0.24
+1 Chapinal 2011 1.0 DA OR = 3.1
+1 or 2 Ospina 2010 0.6 RP, Metritis or DA RR = 4.4
0.7 Pregnancy by VWP + 71 d HR = 0.84
0.7 305 ME milk -647 kg
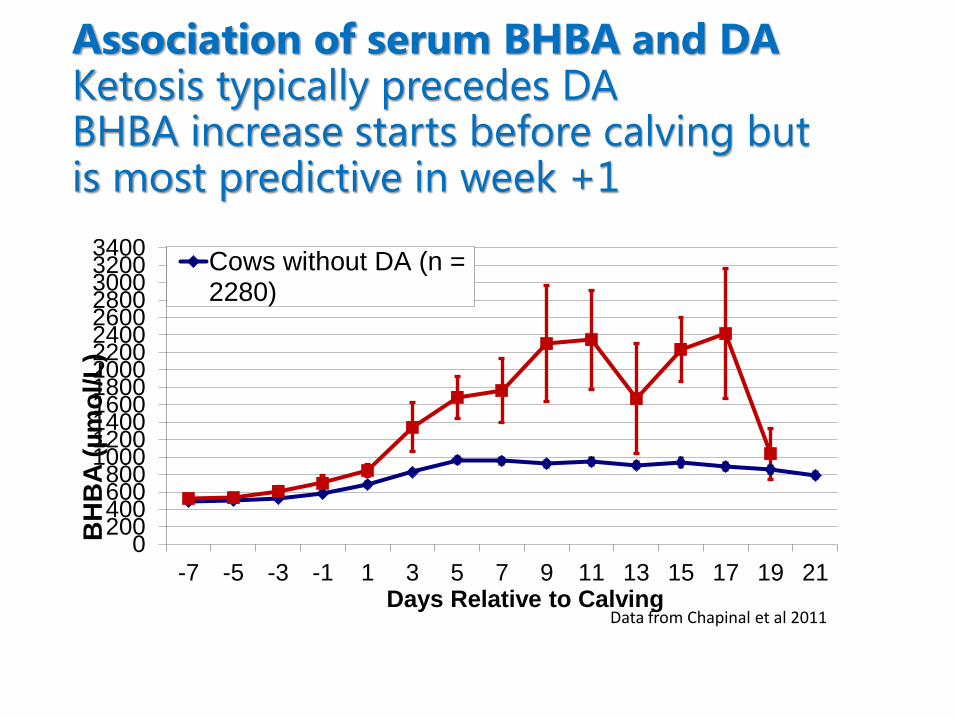
Association of serum BHBA and DAKetosis typically precedes DABHBA increase starts before calving but is most predictive in week +1
0200400600800
1000120014001600180020002200240026002800300032003400
-7 -5 -3 -1 1 3 5 7 9 11 13 15 17 19 21
BH
BA
(µ
mo
l/L
)
Days Relative to Calving
Cows without DA (n =2280)
Data from Chapinal et al 2011
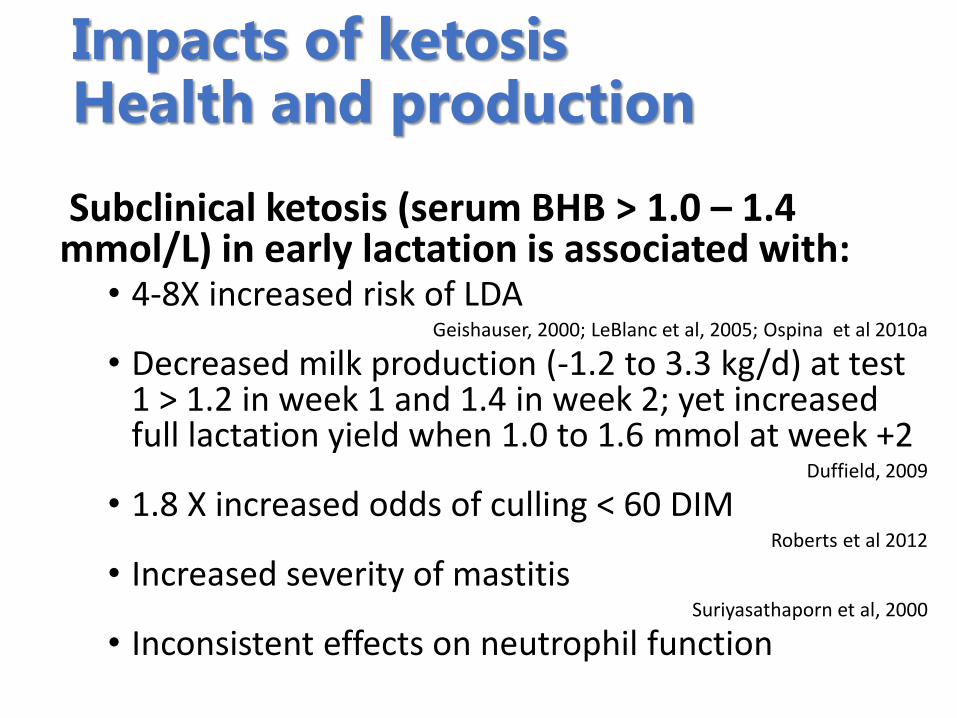
Impacts of ketosisHealth and production
Subclinical ketosis (serum BHB > 1.0 – 1.4 mmol/L) in early lactation is associated with:
• 4-8X increased risk of LDAGeishauser, 2000; LeBlanc et al, 2005; Ospina et al 2010a
• Decreased milk production (-1.2 to 3.3 kg/d) at test 1 > 1.2 in week 1 and 1.4 in week 2; yet increased full lactation yield when 1.0 to 1.6 mmol at week +2
Duffield, 2009
• 1.8 X increased odds of culling < 60 DIMRoberts et al 2012
• Increased severity of mastitisSuriyasathaporn et al, 2000
• Inconsistent effects on neutrophil function

Subclinical ketosis (serum BHB > 1.0 – 1.4 mmol/L) in early lactation is associated with:
• 3 X Increased risk of metritis (not in all studies)
Hammon et al 2006; Duffield et al 2009
• 1.4 X greater odds of endometritis (uterine inflammation based on cytology) at 35 DIM
Dubuc et al 2011
• 1.5 X increased odds of being anovular (not cyclic) at 63 DIM (19% vs. 13% of cows)
Walsh et al 2007; Dubuc et al 2012
• Decrease in pregnancy at first AI
Walsh et al, 2007
• Point prevalence (20 cows, 1 test, BHB ≥ 1.4 mmol/L) ≥ 20% associated with herd annual pregnancy at 1st AI < 40%
Dubuc & Denis-Robichaud, 2017
• BHB > 1.2 mmol/L in any of 1st 5 weeks postpartum associated with lower 6-week in-calf in pasture system (78 vs. 85%)
Compton et al 2015
Impacts of ketosis -Reproduction
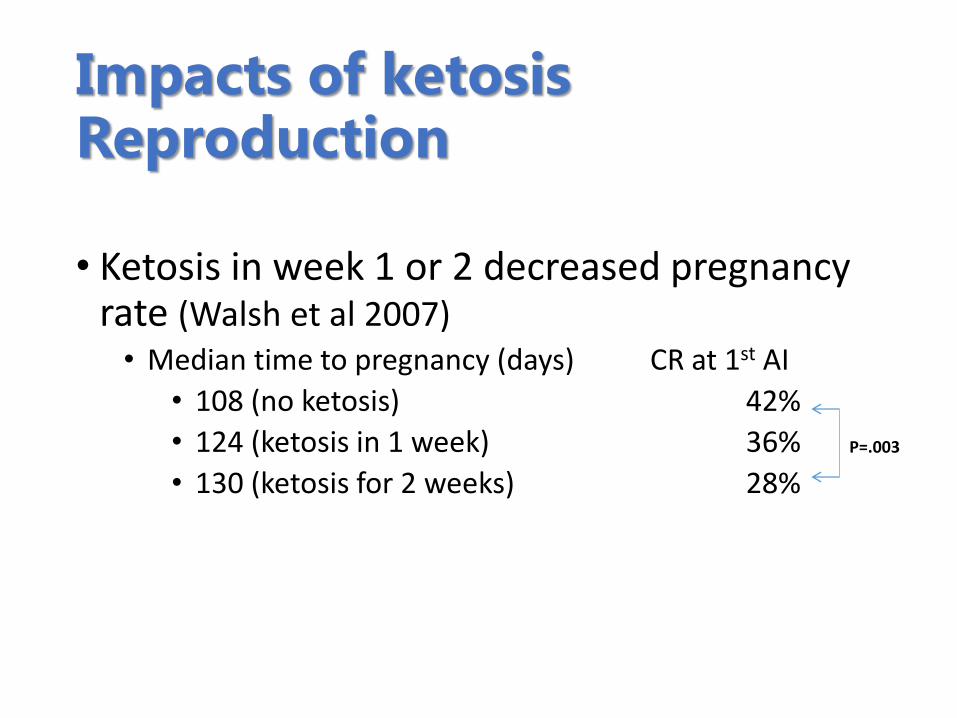
Impacts of ketosisReproduction
• Ketosis in week 1 or 2 decreased pregnancy rate (Walsh et al 2007)
• Median time to pregnancy (days) CR at 1st AI
• 108 (no ketosis) 42%
• 124 (ketosis in 1 week) 36%
• 130 (ketosis for 2 weeks) 28%
P=.003
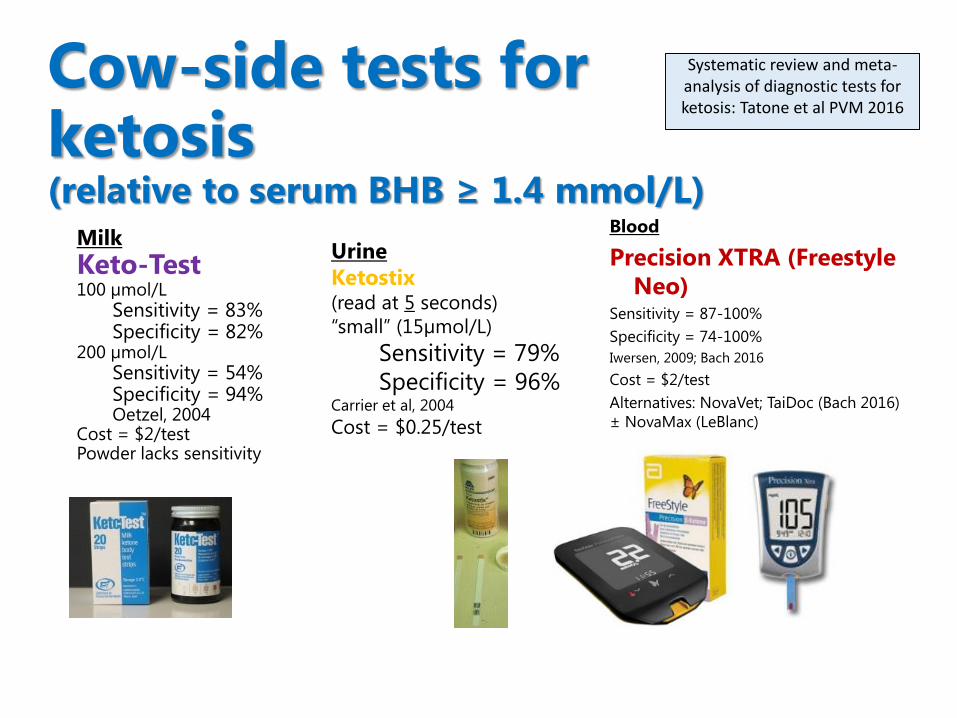
Cow-side tests for ketosis(relative to serum BHB ≥ 1.4 mmol/L)
Milk
Keto-Test100 µmol/L
Sensitivity = 83%Specificity = 82%
200 µmol/LSensitivity = 54%Specificity = 94%Oetzel, 2004
Cost = $2/testPowder lacks sensitivity
Urine
Ketostix(read at 5 seconds)
“small” (15µmol/L)
Sensitivity = 79%
Specificity = 96%Carrier et al, 2004
Cost = $0.25/test
Blood
Precision XTRA (Freestyle
Neo)Sensitivity = 87-100%
Specificity = 74-100%
Iwersen, 2009; Bach 2016
Cost = $2/test
Alternatives: NovaVet; TaiDoc (Bach 2016)
± NovaMax (LeBlanc)
Systematic review and meta-analysis of diagnostic tests for ketosis: Tatone et al PVM 2016
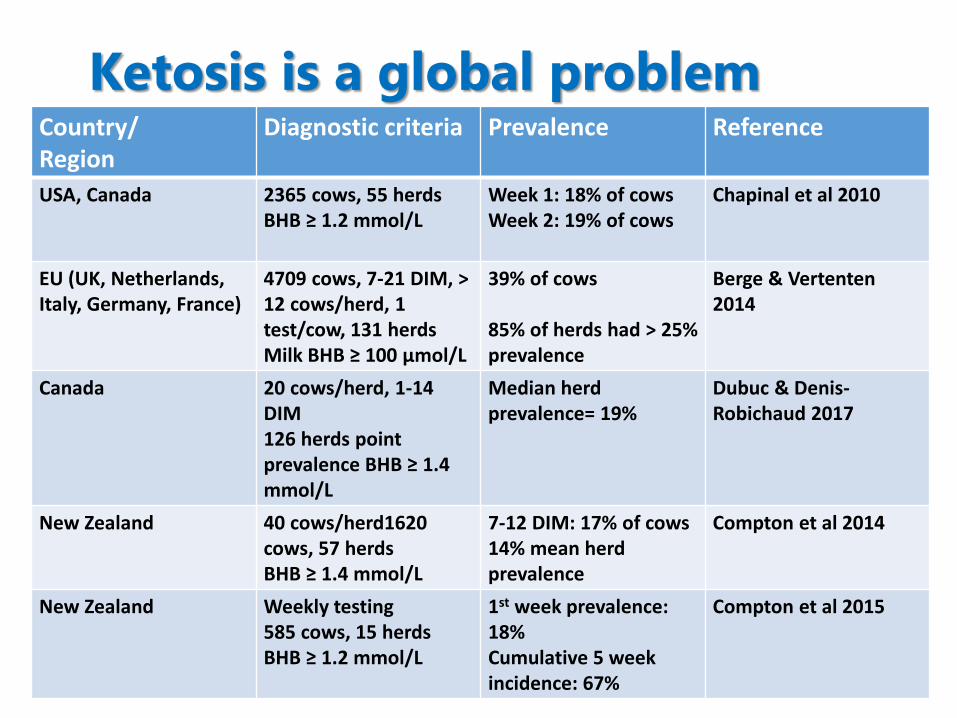
Country/Region
Diagnostic criteria Prevalence Reference
USA, Canada 2365 cows, 55 herdsBHB ≥ 1.2 mmol/L
Week 1: 18% of cowsWeek 2: 19% of cows
Chapinal et al 2010
EU (UK, Netherlands,Italy, Germany, France)
4709 cows, 7-21 DIM, > 12 cows/herd, 1 test/cow, 131 herdsMilk BHB ≥ 100 µmol/L
39% of cows
85% of herds had > 25% prevalence
Berge & Vertenten2014
Canada 20 cows/herd, 1-14 DIM126 herds pointprevalence BHB ≥ 1.4 mmol/L
Median herd prevalence= 19%
Dubuc & Denis-Robichaud 2017
New Zealand 40 cows/herd1620 cows, 57 herdsBHB ≥ 1.4 mmol/L
7-12 DIM: 17% of cows14% mean herd prevalence
Compton et al 2014
New Zealand Weekly testing585 cows, 15 herdsBHB ≥ 1.2 mmol/L
1st week prevalence: 18% Cumulative 5 week incidence: 67%
Compton et al 2015
Ketosis is a global problem
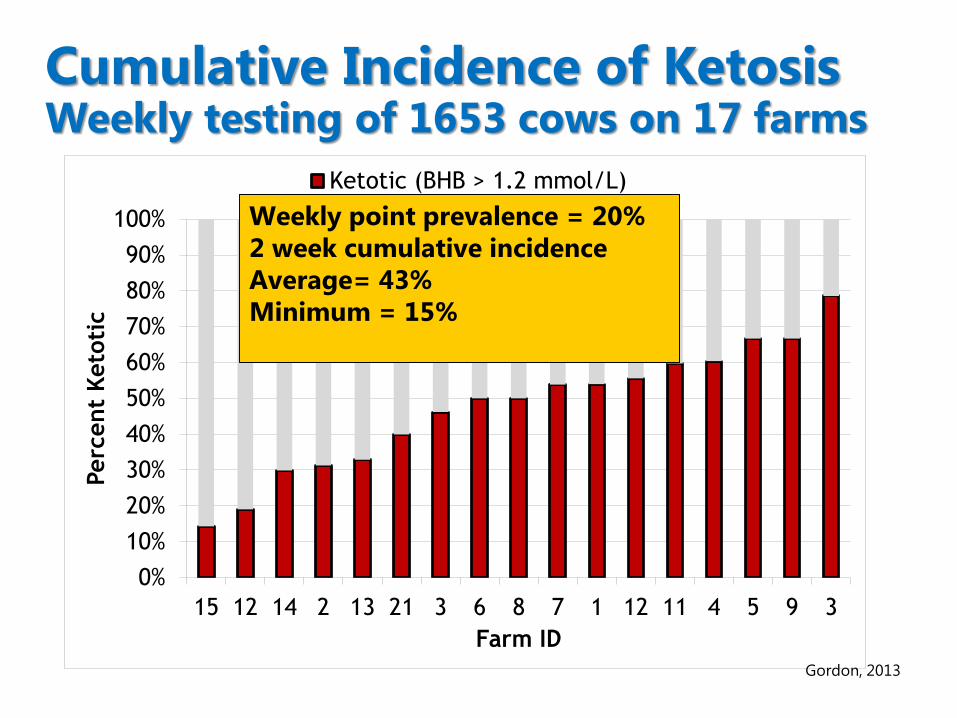
Cumulative Incidence of Ketosis Weekly testing of 1653 cows on 17 farms
0%
10%
20%
30%
40%
50%
60%
70%
80%
90%
100%
15 12 14 2 13 21 3 6 8 7 1 12 11 4 5 9 3
Perc
ent
Keto
tic
Farm ID
Ketotic (BHB > 1.2 mmol/L)
Weekly point prevalence = 20%
2 week cumulative incidence
Average= 43%
Minimum = 15%
Gordon, 2013
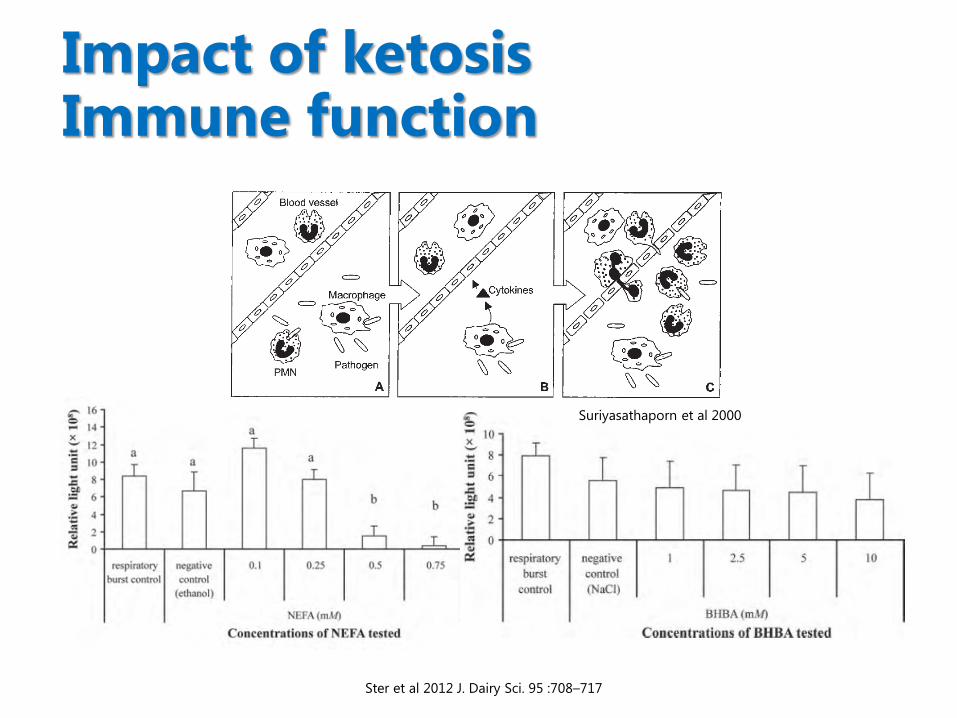
Impact of ketosisImmune function
Ster et al 2012 J. Dairy Sci. 95 :708–717
Suriyasathaporn et al 2000
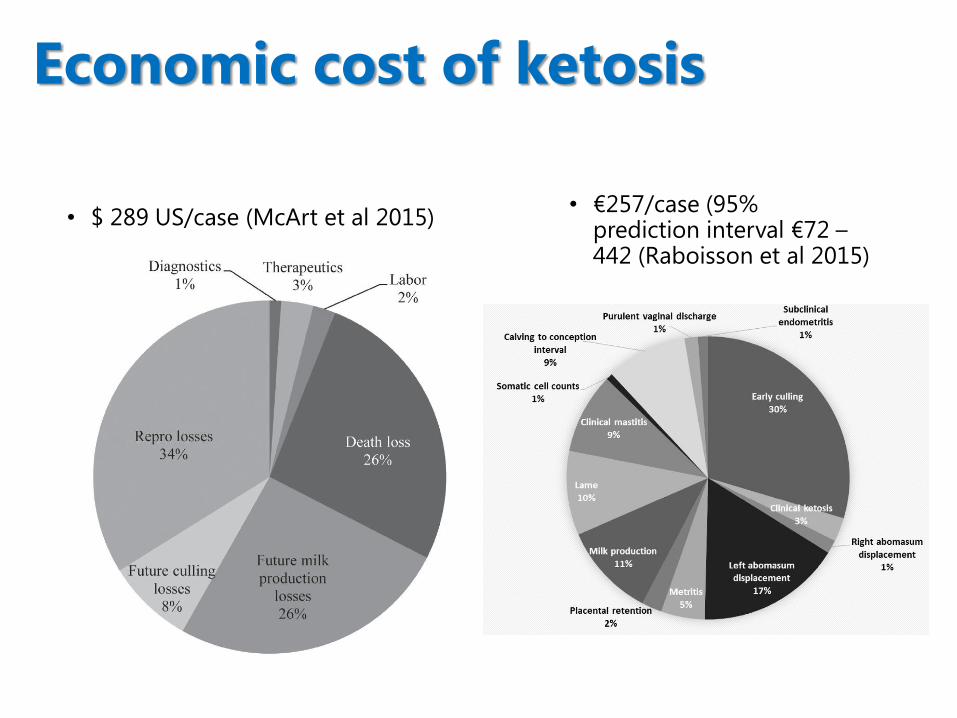
• $ 289 US/case (McArt et al 2015)
Economic cost of ketosis
• €257/case (95% prediction interval €72 –442 (Raboisson et al 2015)
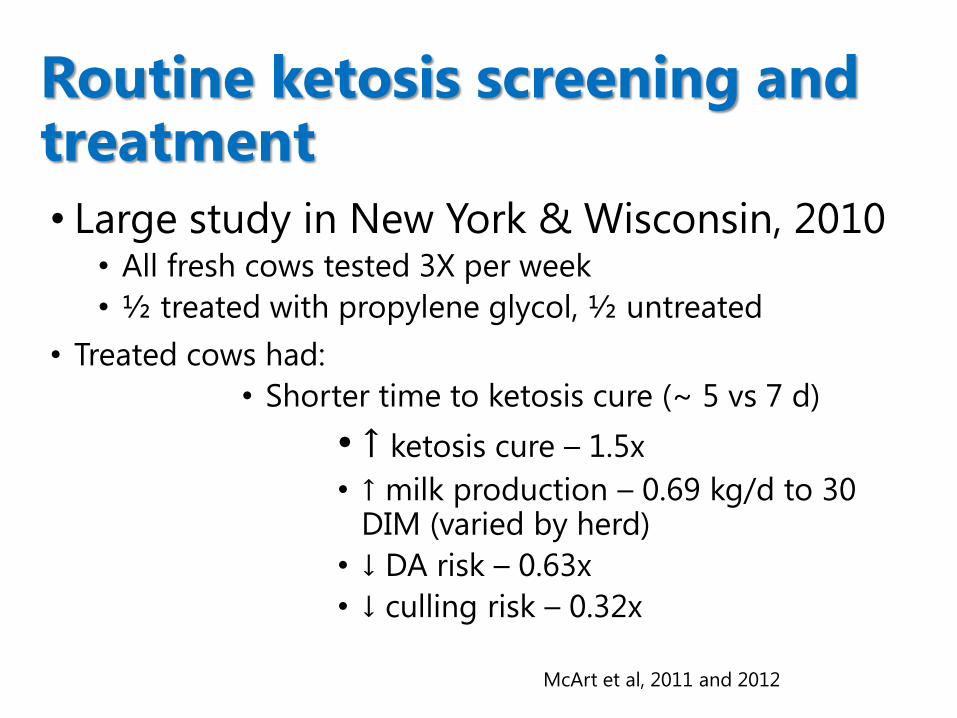
• Large study in New York & Wisconsin, 2010• All fresh cows tested 3X per week
• ½ treated with propylene glycol, ½ untreated
• Treated cows had:
• Shorter time to ketosis cure (~ 5 vs 7 d)
• ↑ ketosis cure – 1.5x
• ↑ milk production – 0.69 kg/d to 30 DIM (varied by herd)
• ↓ DA risk – 0.63x
• ↓ culling risk – 0.32x
Routine ketosis screening and treatment
McArt et al, 2011 and 2012
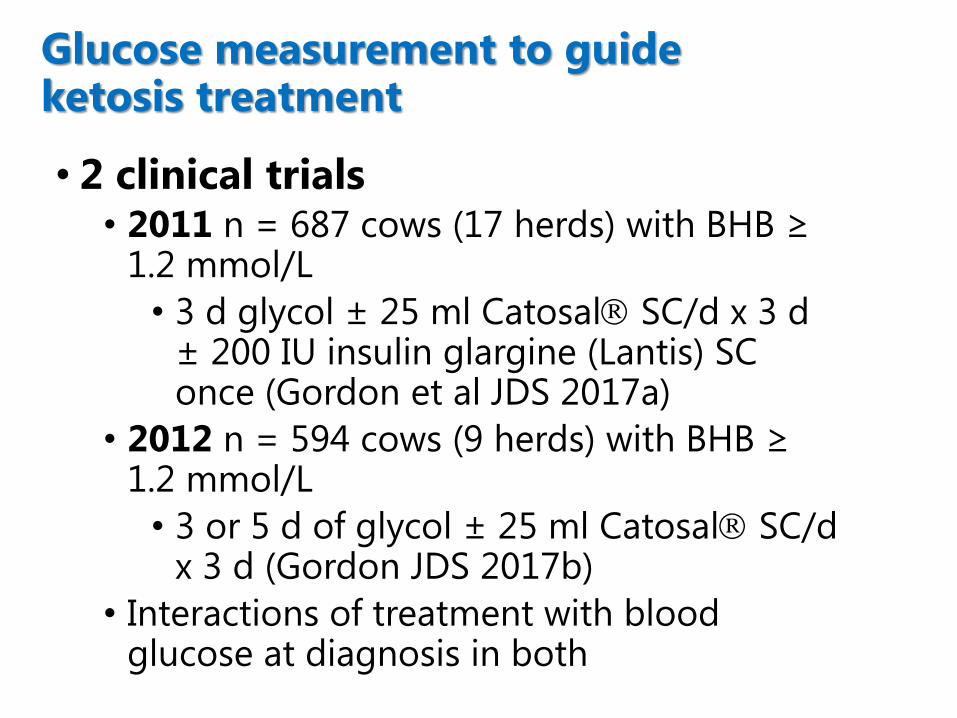
• 2 clinical trials • 2011 n = 687 cows (17 herds) with BHB ≥
1.2 mmol/L
• 3 d glycol ± 25 ml Catosal SC/d x 3 d ± 200 IU insulin glargine (Lantis) SC once (Gordon et al JDS 2017a)
• 2012 n = 594 cows (9 herds) with BHB ≥ 1.2 mmol/L
• 3 or 5 d of glycol ± 25 ml Catosal SC/d x 3 d (Gordon JDS 2017b)
• Interactions of treatment with blood glucose at diagnosis in both
Glucose measurement to guide ketosis treatment
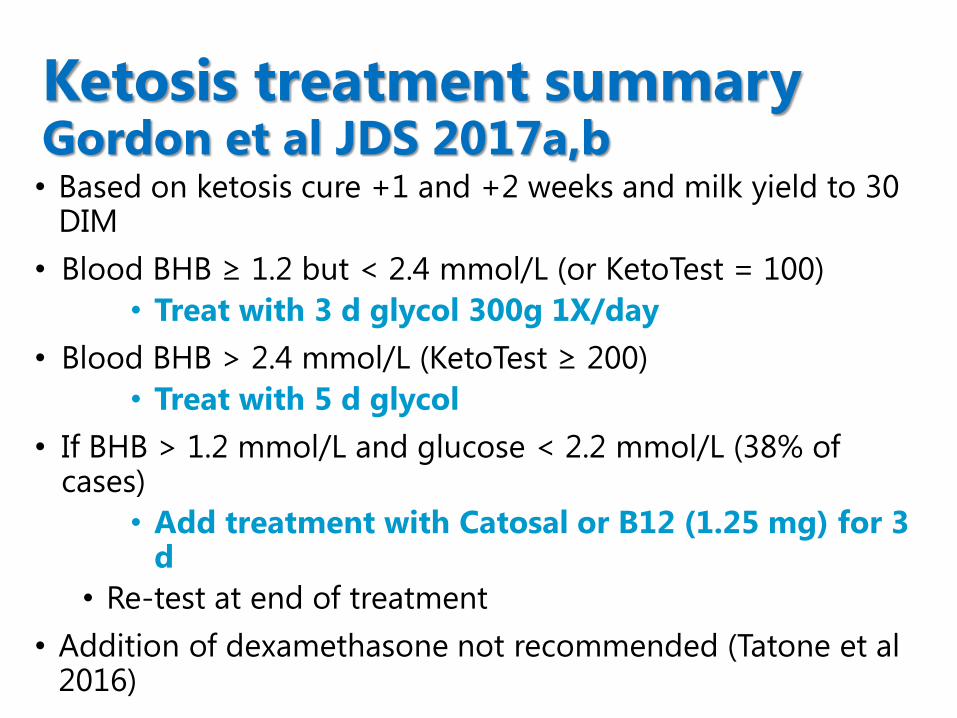
• Based on ketosis cure +1 and +2 weeks and milk yield to 30 DIM
• Blood BHB ≥ 1.2 but < 2.4 mmol/L (or KetoTest = 100)
• Treat with 3 d glycol 300g 1X/day
• Blood BHB > 2.4 mmol/L (KetoTest ≥ 200)
• Treat with 5 d glycol
• If BHB > 1.2 mmol/L and glucose < 2.2 mmol/L (38% of cases)
• Add treatment with Catosal or B12 (1.25 mg) for 3 d
• Re-test at end of treatment
• Addition of dexamethasone not recommended (Tatone et al 2016)
Ketosis treatment summaryGordon et al JDS 2017a,b
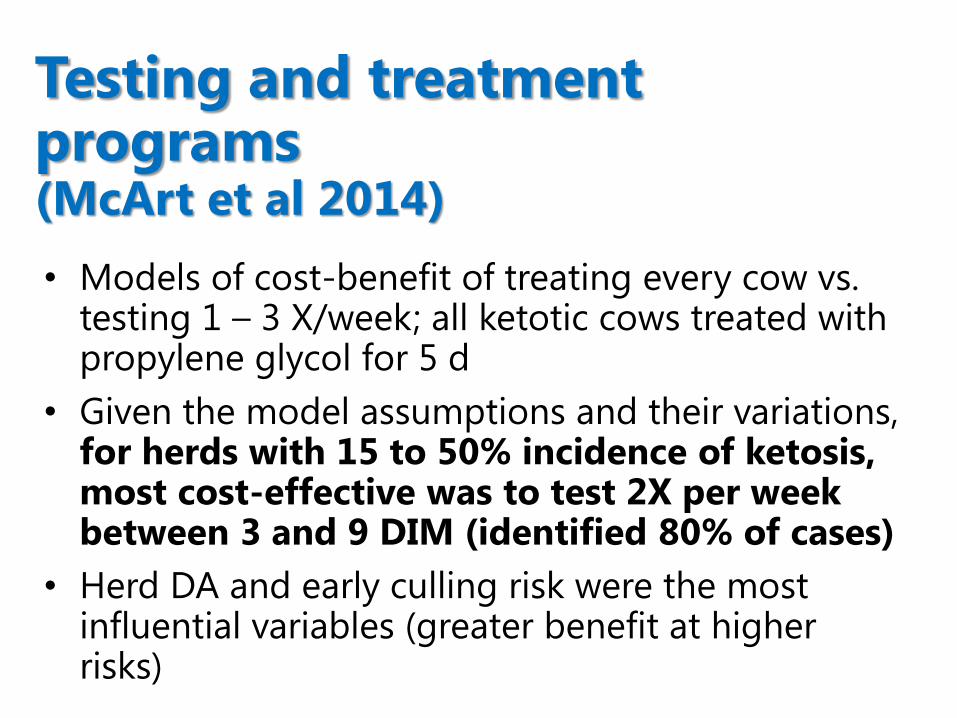
• Models of cost-benefit of treating every cow vs. testing 1 – 3 X/week; all ketotic cows treated with propylene glycol for 5 d
• Given the model assumptions and their variations, for herds with 15 to 50% incidence of ketosis, most cost-effective was to test 2X per week between 3 and 9 DIM (identified 80% of cases)
• Herd DA and early culling risk were the most influential variables (greater benefit at higher risks)
Testing and treatment programs(McArt et al 2014)
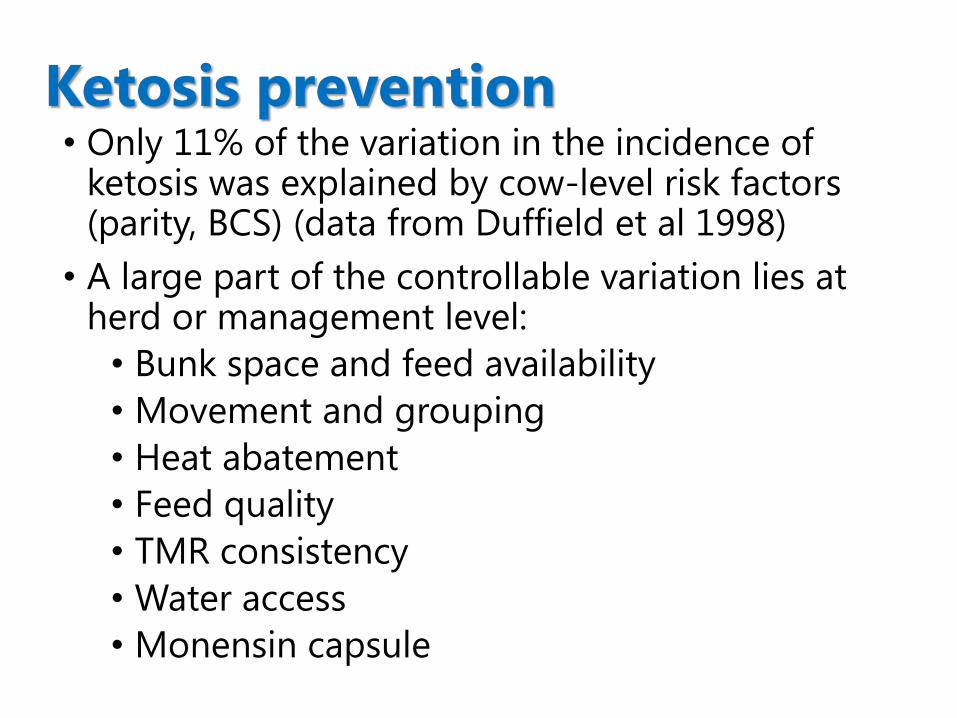
• Only 11% of the variation in the incidence of ketosis was explained by cow-level risk factors (parity, BCS) (data from Duffield et al 1998)
• A large part of the controllable variation lies at herd or management level:
• Bunk space and feed availability
• Movement and grouping
• Heat abatement
• Feed quality
• TMR consistency
• Water access
• Monensin capsule
Ketosis prevention
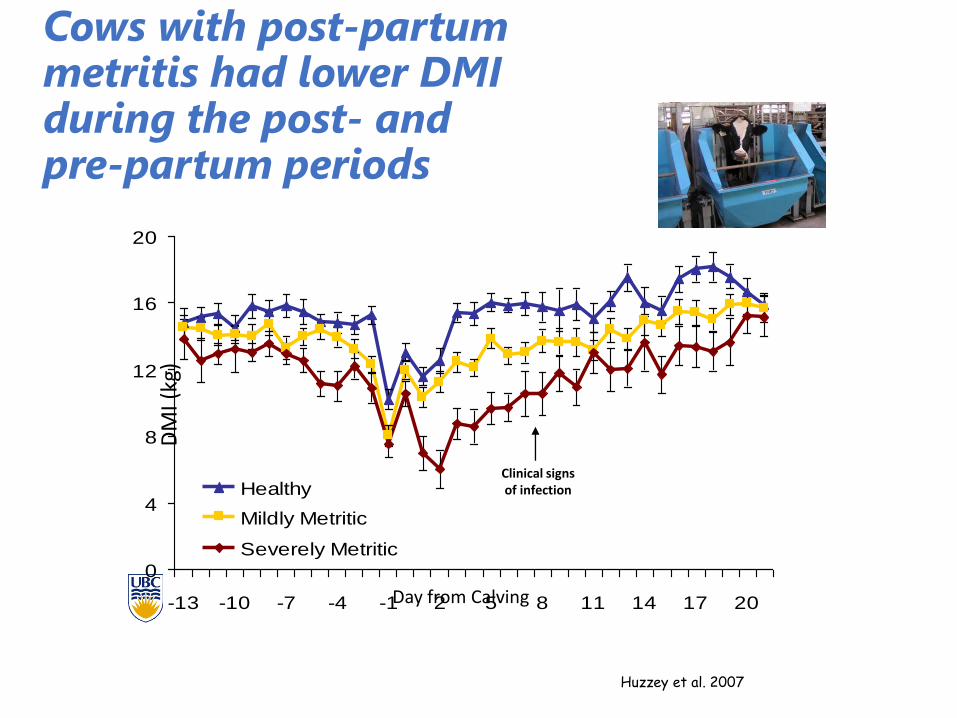
Cows with post-partum metritis had lower DMI during the post- and pre-partum periods
0
4
8
12
16
20
-13 -10 -7 -4 -1 2 5 8 11 14 17 20
Healthy
Mildly Metritic
Severely Metritic
DM
I (kg
)
Day from Calving
Clinical signs of infection
Huzzey et al. 2007
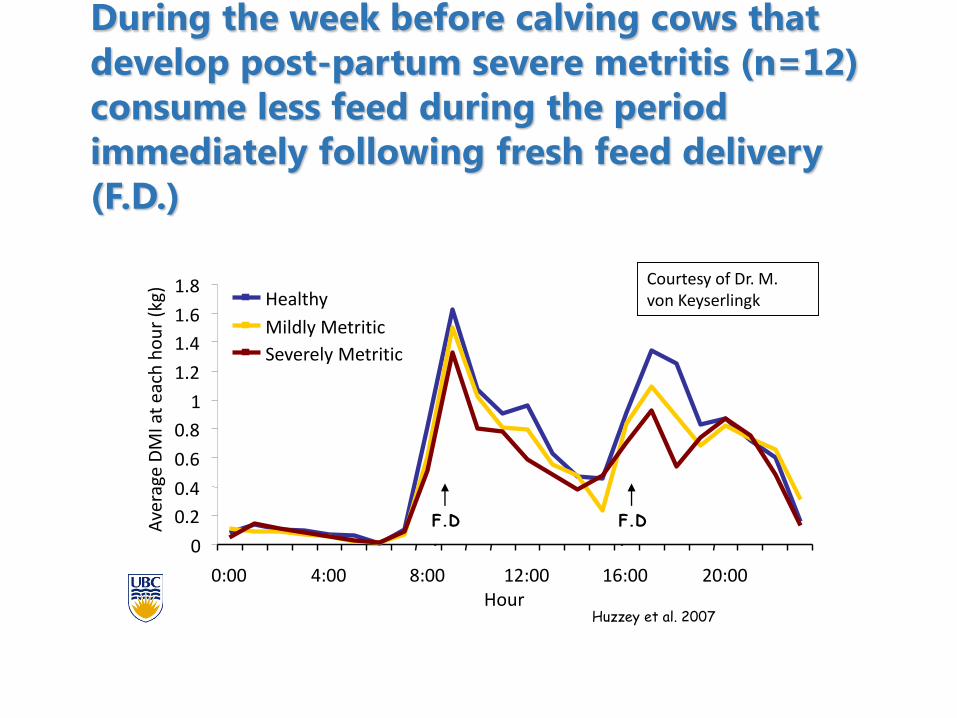
Hour
Ave
rage
DM
I at
each
ho
ur
(kg)
During the week before calving cows that
develop post-partum severe metritis (n=12)
consume less feed during the period
immediately following fresh feed delivery
(F.D.)
F.D.
F.D.
Huzzey et al. 2007
0
0.2
0.4
0.6
0.8
1
1.2
1.4
1.6
1.8
0:00 4:00 8:00 12:00 16:00 20:00
Healthy
Mildly Metritic
Severely Metritic
Courtesy of Dr. M. von Keyserlingk
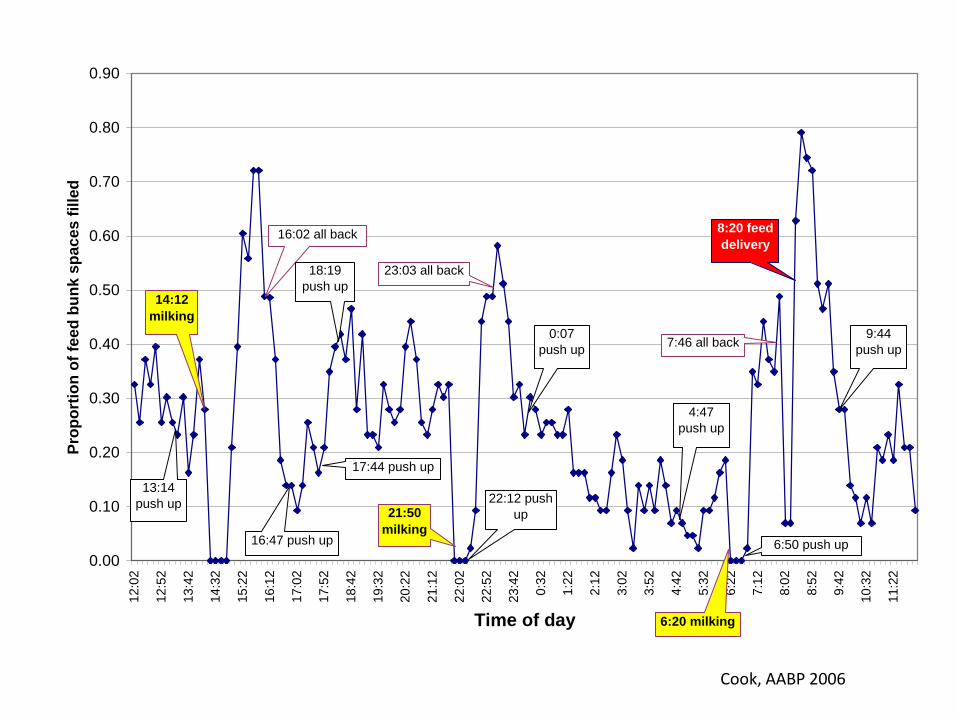
0.00
0.10
0.20
0.30
0.40
0.50
0.60
0.70
0.80
0.90
12:0
2
12:5
2
13:4
2
14:3
2
15:2
2
16:1
2
17:0
2
17:5
2
18:4
2
19:3
2
20:2
2
21:1
2
22:0
2
22:5
2
23:4
2
0:3
2
1:2
2
2:1
2
3:0
2
3:5
2
4:4
2
5:3
2
6:2
2
7:1
2
8:0
2
8:5
2
9:4
2
10:3
2
11:2
2
Time of day
Pro
po
rtio
n o
f fe
ed
bu
nk s
pa
ce
s f
ille
d
13:14
push up
14:12
milking
16:02 all back
16:47 push up
17:44 push up
18:19
push up
21:50
milking
22:12 push
up
23:03 all back
0:07
push up
4:47
push up
6:20 milking
6:50 push up
7:46 all back
8:20 feed
delivery
9:44
push up
Cook, AABP 2006
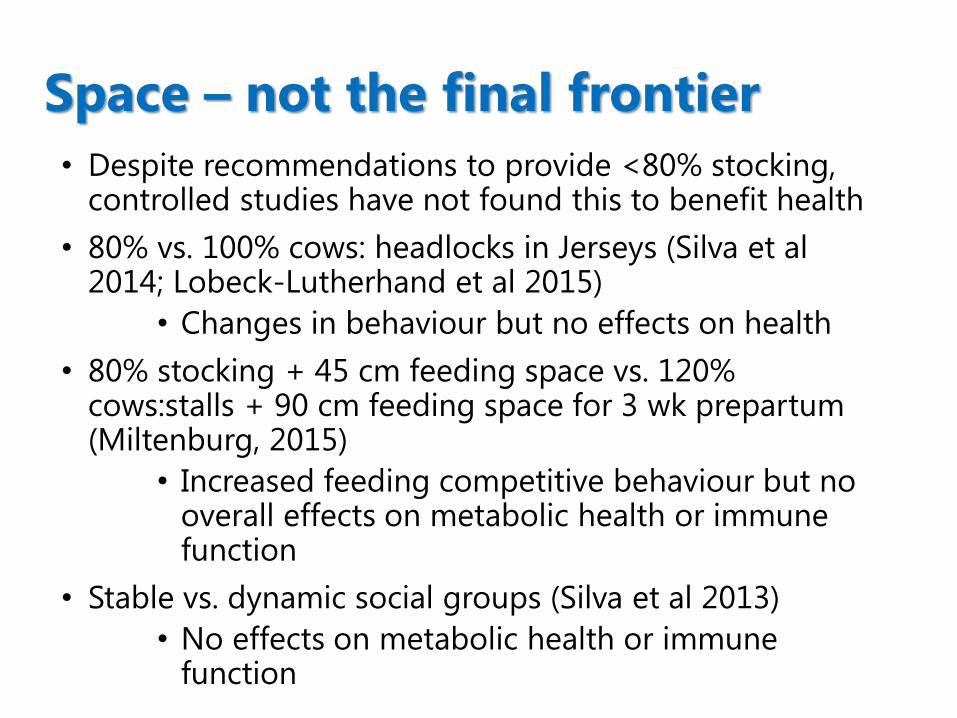
• Despite recommendations to provide <80% stocking, controlled studies have not found this to benefit health
• 80% vs. 100% cows: headlocks in Jerseys (Silva et al 2014; Lobeck-Lutherhand et al 2015)
• Changes in behaviour but no effects on health
• 80% stocking + 45 cm feeding space vs. 120% cows:stalls + 90 cm feeding space for 3 wk prepartum(Miltenburg, 2015)
• Increased feeding competitive behaviour but no overall effects on metabolic health or immune function
• Stable vs. dynamic social groups (Silva et al 2013)
• No effects on metabolic health or immune function
Space – not the final frontier
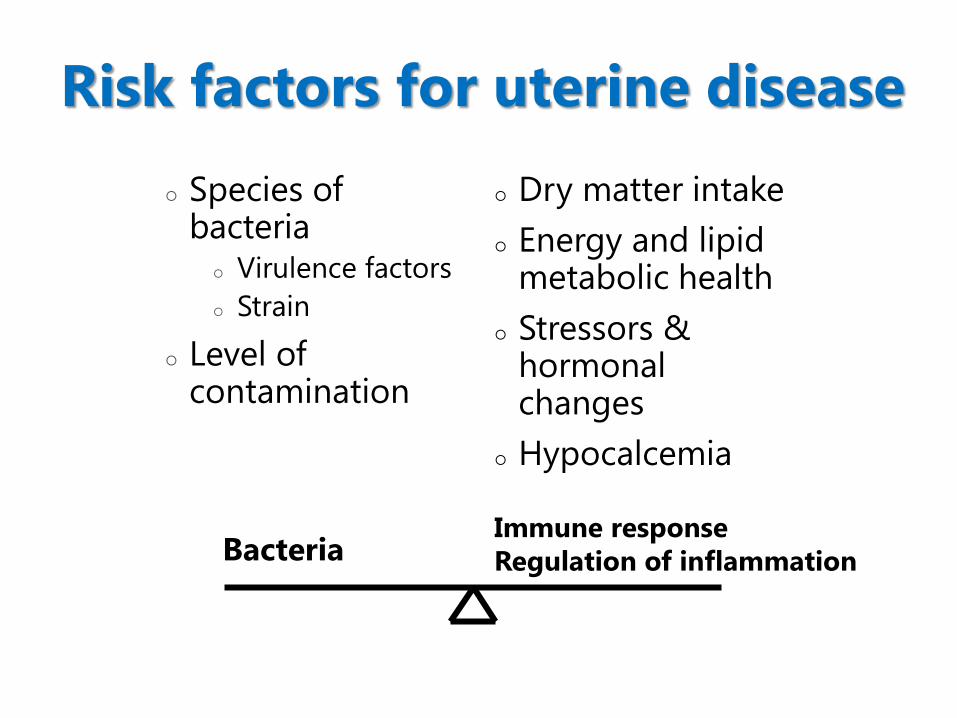
Risk factors for uterine disease
Species of bacteria
Virulence factors
Strain
Level of contamination
Dry matter intake
Energy and lipid metabolic health
Stressors & hormonal changes
Hypocalcemia
BacteriaImmune response
Regulation of inflammation
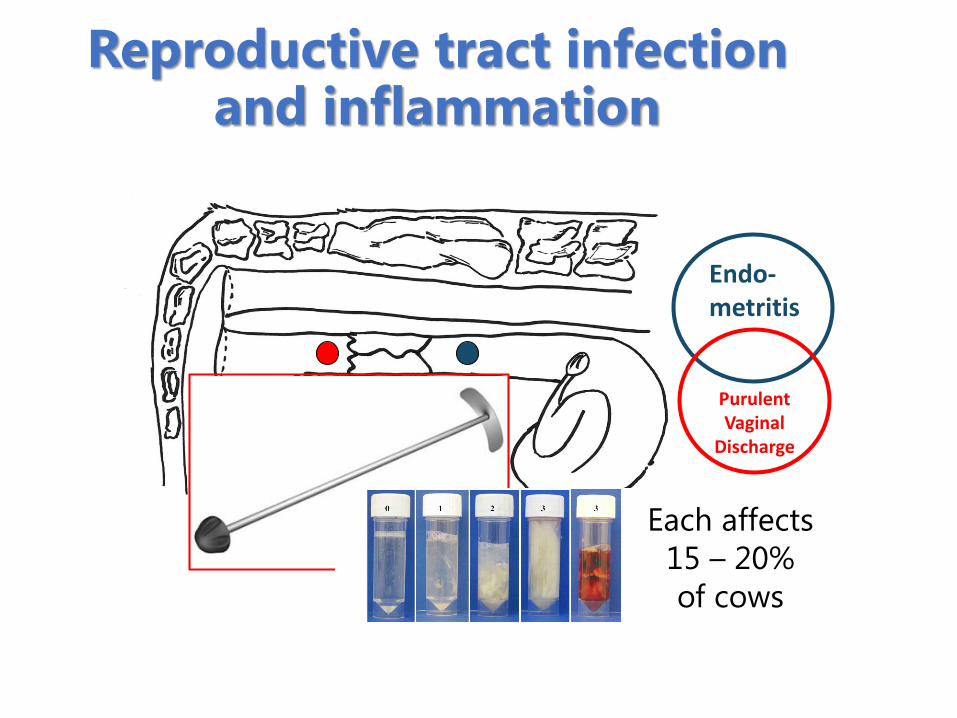
Reproductive tract infection and inflammation
Endo-metritis
Purulent Vaginal
Discharge
Each affects
15 – 20%
of cows
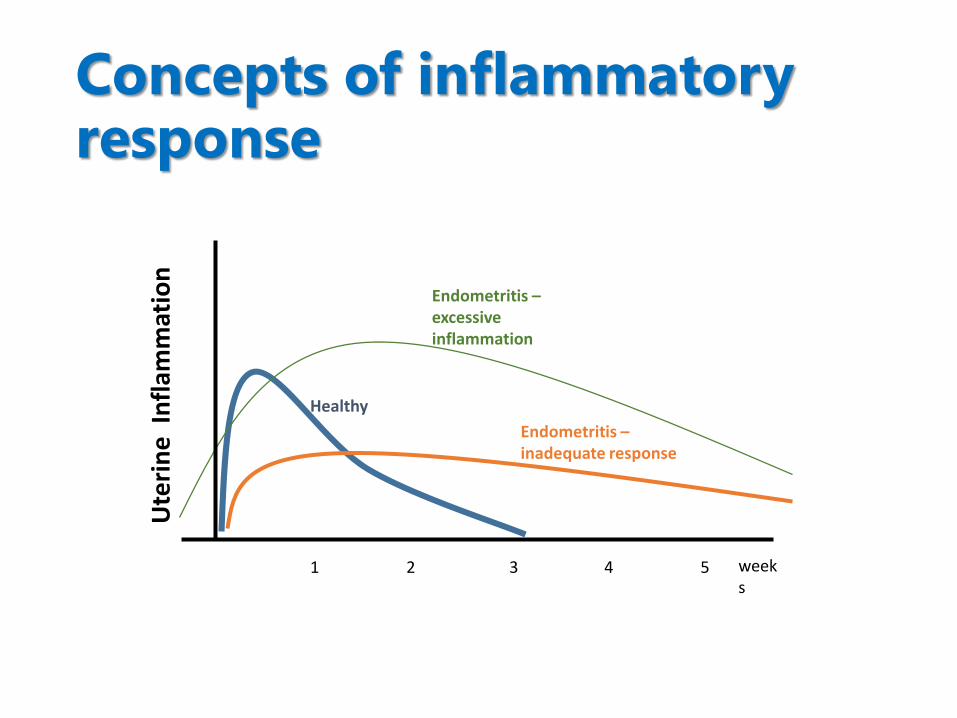
Concepts of inflammatory response
1 42 3 5
Ute
rin
e I
nfl
amm
atio
n
weeks
Healthy
Endometritis –excessive inflammation
Endometritis –inadequate response
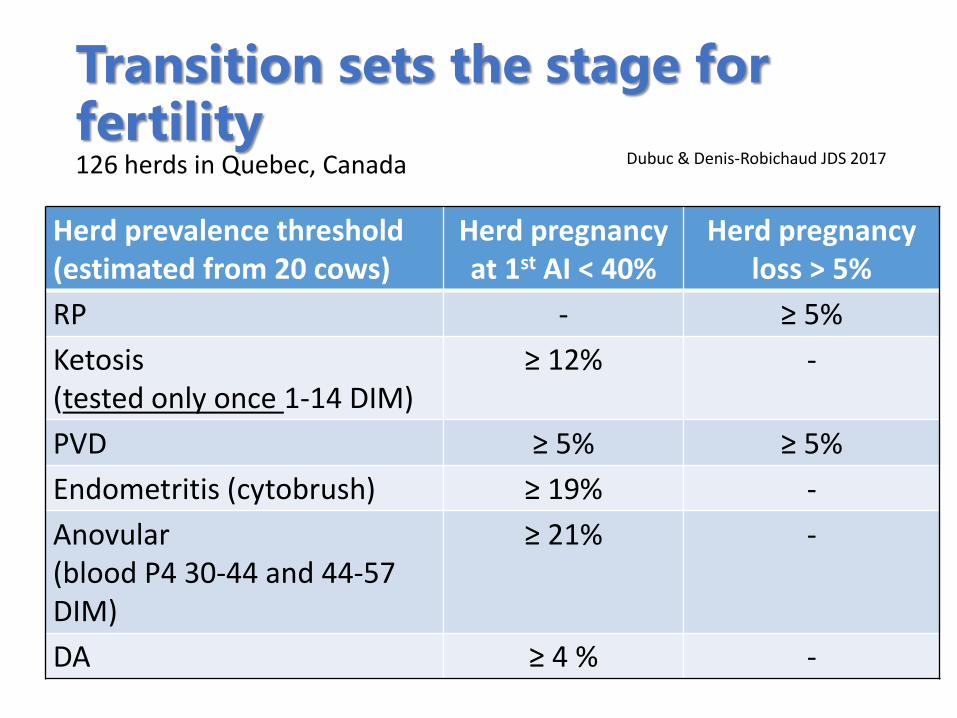
Transition sets the stage for fertility
Herd prevalence threshold(estimated from 20 cows)
Herd pregnancy at 1st AI < 40%
Herd pregnancyloss > 5%
RP - ≥ 5%
Ketosis (tested only once 1-14 DIM)
≥ 12% -
PVD ≥ 5% ≥ 5%
Endometritis (cytobrush) ≥ 19% -
Anovular(blood P4 30-44 and 44-57 DIM)
≥ 21% -
DA ≥ 4 % -
126 herds in Quebec, Canada Dubuc & Denis-Robichaud JDS 2017
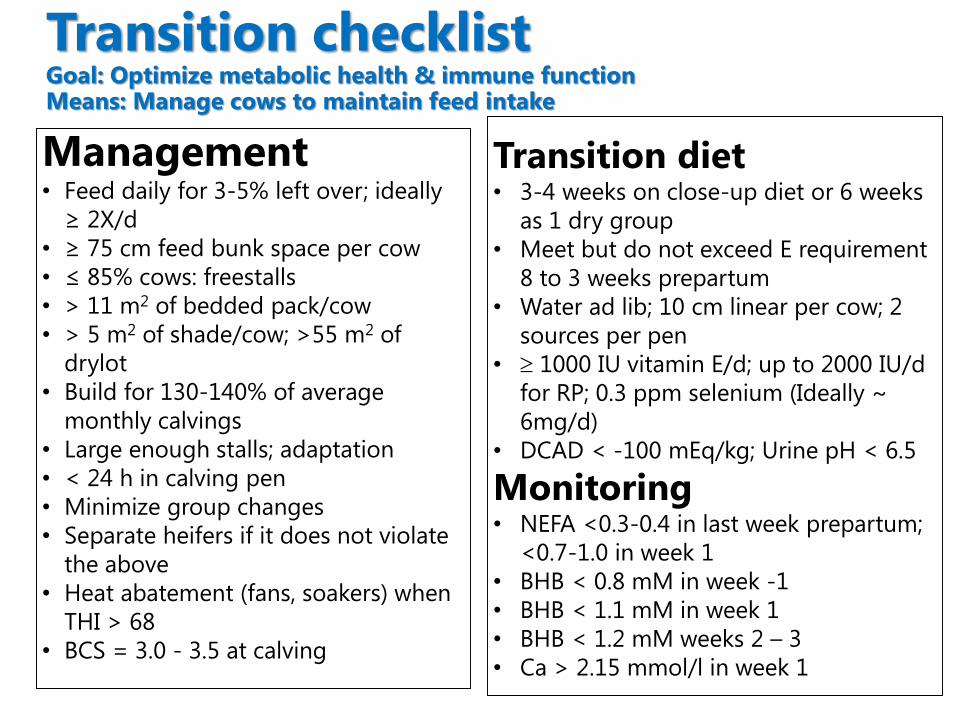
Transition checklist Goal: Optimize metabolic health & immune function Means: Manage cows to maintain feed intake
Management• Feed daily for 3-5% left over; ideally
≥ 2X/d
• ≥ 75 cm feed bunk space per cow
• ≤ 85% cows: freestalls
• > 11 m2 of bedded pack/cow
• > 5 m2 of shade/cow; >55 m2 of
drylot
• Build for 130-140% of average
monthly calvings
• Large enough stalls; adaptation
• < 24 h in calving pen
• Minimize group changes
• Separate heifers if it does not violate
the above
• Heat abatement (fans, soakers) when
THI > 68
• BCS = 3.0 - 3.5 at calving
Transition diet • 3-4 weeks on close-up diet or 6 weeks
as 1 dry group
• Meet but do not exceed E requirement
8 to 3 weeks prepartum
• Water ad lib; 10 cm linear per cow; 2
sources per pen
• 1000 IU vitamin E/d; up to 2000 IU/d
for RP; 0.3 ppm selenium (Ideally ~
6mg/d)
• DCAD < -100 mEq/kg; Urine pH < 6.5
Monitoring• NEFA <0.3-0.4 in last week prepartum;
<0.7-1.0 in week 1
• BHB < 0.8 mM in week -1
• BHB < 1.1 mM in week 1
• BHB < 1.2 mM weeks 2 – 3
• Ca > 2.15 mmol/l in week 1