DAFF. (2013). Trends in the agricultural sector. JUNE 2013..... 1 Volume of agricultural...
73
2013 agriculture, forestry & fisheries Department: Agriculture, Forestry and Fisheries REPUBLIC OF SOUTH AFRICA
Transcript of DAFF. (2013). Trends in the agricultural sector. JUNE 2013..... 1 Volume of agricultural...
2013
agriculture,forestry & fisheriesDepartment: Agriculture, Forestry and FisheriesREPUBLIC OF SOUTH AFRICA
Contents
ECONOMIC REVIEW FOR THE 12 MONTHS THAT ENDED 30 JUNE 2013 ......................................................................................... 1
Volume of agricultural production ............................................................. 1Producer prices of agricultural products ................................................... 1 Gross value of agricultural production ...................................................... 2Farming income ........................................................................................ 2Expenditure on intermediate goods and services..................................... 4Prices of farming requisites ...................................................................... 4Domestic terms of trade in agriculture (2005 = 1) .................................... 6 Contribution of agriculture to value added at basic prices ........................ 6Capital assets and investment in agriculture ............................................ 6Farming debt ............................................................................................ 7Cash flow of farmers................................................................................. 7Consumption expenditure on food............................................................ 8Consumer prices ...................................................................................... 8Imports and exports of agricultural products ............................................ 8
BRANCHES OF THE INDUSTRY ............................................................ 9Field crop husbandry ............................................................................. 9Maize ........................................................................................................ 9Sorghum ................................................................................................... 13Wheat ....................................................................................................... 17Malting barley ........................................................................................... 20Sunflower seed ......................................................................................... 22Soya beans............................................................................................... 24Groundnuts ............................................................................................... 27Canola ...................................................................................................... 30Cotton ....................................................................................................... 32Dry beans ................................................................................................. 34Sugar ........................................................................................................ 36
Horticulture ............................................................................................. 38Deciduous fruit.......................................................................................... 38Dried fruit .................................................................................................. 41Viticulture .................................................................................................. 42Subtropical fruit......................................................................................... 44Citrus fruit ................................................................................................. 47Vegetables (excluding potatoes) .............................................................. 48Tomatoes.................................................................................................. 51Onions ...................................................................................................... 52Potatoes ................................................................................................... 54
Animal production .................................................................................. 56Livestock numbers.................................................................................... 56Red meat .................................................................................................. 59Poultry ...................................................................................................... 61Ostriches .................................................................................................. 63Milk ........................................................................................................... 65Wool ......................................................................................................... 66Mohair....................................................................................................... 68
Trends in the
Agricultural Sector2013
2014
All rights reserved
Printed and published by the Department of Agriculture, Forestry and Fisheries Pretoria
Obtainable from the Department of Agriculture, Forestry and Fisheries Resource Centre Directorate: Knowledge and Information Management Private Bag X144 Pretoria 0001
ISSN 1025-5028

1Department of Agriculture, Forestry and Fisheries
Economic review for the 12 months that ended 30 June 2013
Volume of agricultural production
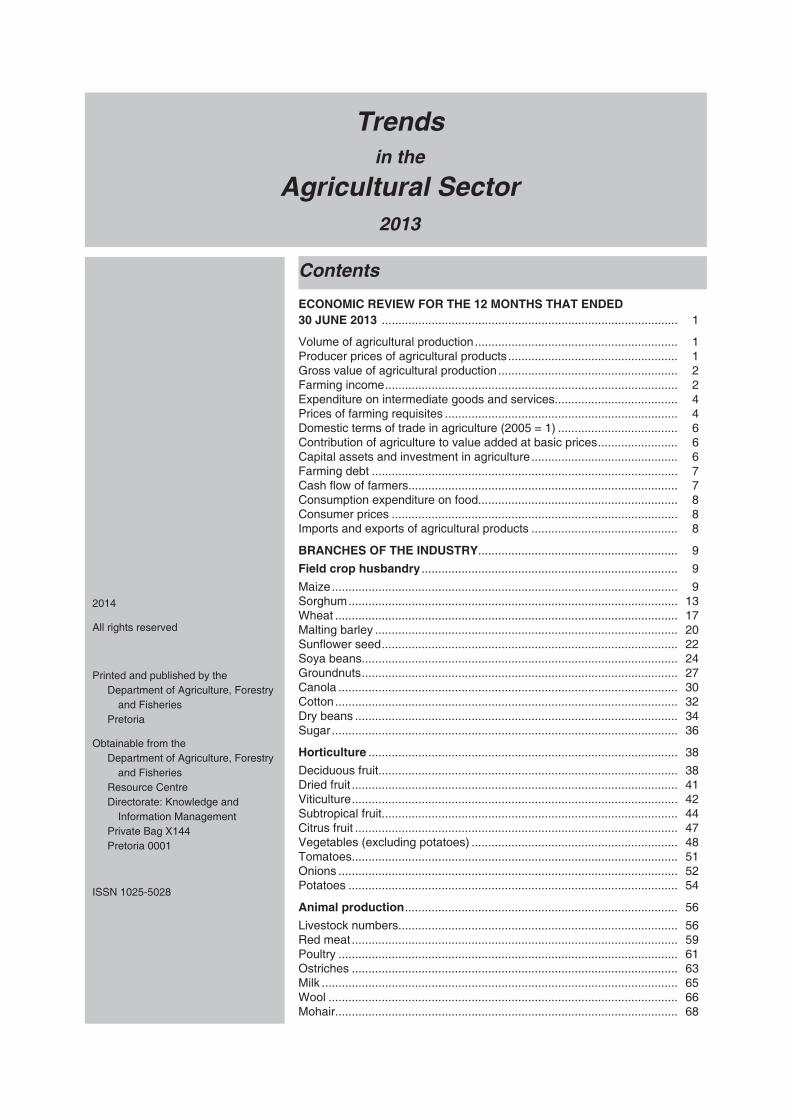
The volume of field-crop production decreased slightly by 0,2%, mainly as a result of decreases in the production of maize and all winter crops, except for canola. Maize production decreased by 658 000 tons or 5,2% from the previous season. Wheat and barley production decreased by 135 599 tons (6,7%) and 14 000 tons (4,5%) respectively from 2011/12.
Horticultural production showed a decrease of 0,7%, which can mainly be attributed to decreases in the production of deciduous fruit and vegetables. Production of wine grapes and table grapes decreased by 84 482 tons (4,6%) and 19 345 tons (7%) respectively. With reference to vegetables, onions and tomatoes showed the largest decreases, with 27 053 tons (4,3%) and 24 975 tons (4,6%) respectively, from 2011/12.
Animal production increased by 3,6% as a result of increases in fresh milk (229 229 litres or 7,2%), num-ber of stock slaughtered (550 227 carcasses or 6,2%), as well as poultry meat (46 051 tons or 3,1%) from 2011/12.
90
100
110
120
130
140
2008/09 2009/10 2010/11 2011/12 2012/13
2005
= 1
00
Year
Volume index of agricultural production2008/09–2012/13 (July to June)
Field crops Horticulture Aimal products
100
140
180
220
260
300
2008/09 2009/10 2010/11 2011/12 2012/13
2005
= 1
00
Year
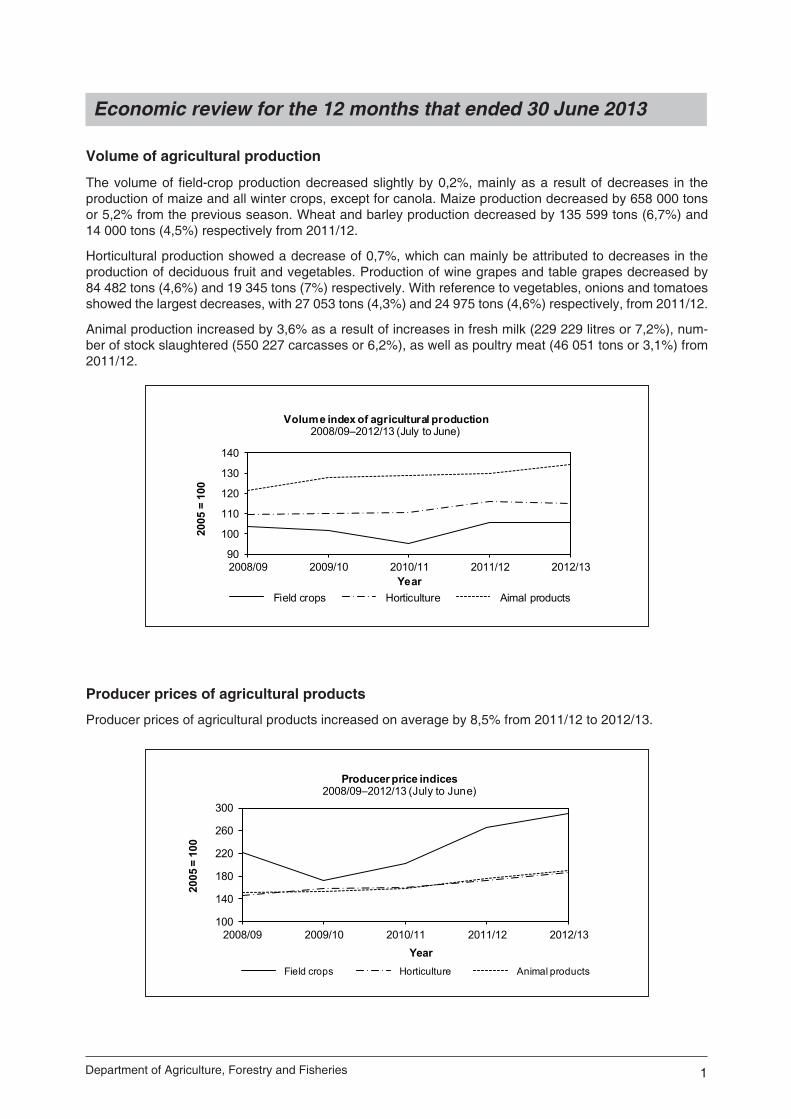
Producer price indices2008/09–2012/13 (July to June)
Field crops Horticulture Animal products
Producer prices of agricultural products
Producer prices of agricultural products increased on average by 8,5% from 2011/12 to 2012/13.

2 Trends in the Agricultural Sector 2013
The weighted average price of field crops increased by 9,7%. The prices of oilseeds increased by 36,5%, dry beans by 33,4%, winter grain by 18,3%, hay by 11,3%, cotton by 7,4%, tobacco by 7,3%, sugar cane by 6,3% and summer grain by 3,7%.
Producer prices of horticultural products increased by 9,0% from 2011/12 to 2012/13. Prices of vegetables, fruit and viticultural products increased by 11,9%, 7,4% and 5,3% respectively.
Prices of animal products increased by 7,4%. The average prices of poultry meat, dairy products and pas-toral products increased by 13,3%, 10,9% and 3,8% respectively, while the average price of slaughtered stock decreased slightly by 0,7%.
Gross value of agricultural production
The total gross value of agricultural production (total production during the production season valued at the average basic prices received by producers) for 2012/13 is estimated at R180 360 million, compared to R163 672 million the previous year—an increase of 10,2%. This increase can be attributed mainly to an increase in the value of animal products.
The gross value of animal products, field crops and horticultural products contributed 46,4%, 28,6% and 25,0% respectively to the total gross value of agricultural production. The poultry meat industry made the largest contribution with 17,4%, followed by maize with 13,2% and cattle and calves slaughtered with 10,1%.
Farming income
The gross income of producers (the value of sales and production for other uses, plus the value of changes in inventories) for the year ended 30 June 2013 amounted to R178 050 million, compared to R161 704 million the previous year—an increase of 10,1%. The increase can be ascribed mainly to increases in prices that farmers received for their products, in particular those for oilseeds, milk and poultry products. Quantities of horticultural and animal products produced, showed moderate increases, while quantities of field crops produced were slightly down on the previous season, with the exception of dry beans and soya beans, which were higher.
The gross income from field crops increased by 7,3% to R49 287 million for the year ended 30 June 2013. Income from maize amounted to R26 554 million, only 3,7% higher than the R25 615 million of the previous 12 months. Income from soya beans increased by 48,9% to R3 544 million and that from sunflower seed showed an increase of 13,1% to R2 857 million. Income from sugar cane at R6 142 million was only R19 million or 0,3% higher than that of the previous 12 months. Income from groundnuts, however, decreased by 22,7% to R437 million and than from cotton by 49,2% to R86 million.
The gross income from horticultural products increased by 11,3%, from R40 538 million in 2011/12 to R45 126 million in 2012/13. Income from deciduous and citrus fruit increased by 13,4% and 6,2% and amounted to R11 586 million and R8 094 million respectively. Income from subtropical fruit increased by 3,7% to R2 622 million. Income from viticulture increased by 8,4% to R4 277 million. Income from vegetable production rose by 12,0% to R15 853 million.
20 00030 00040 00050 00060 00070 00080 00090 000
2008/09 2009/10 2010/11 2011/12 2012/13
R'm
illio
n
Year
Gross value of agricultural production2008/09–2012/13 (July to June)
Field crops Horticulture Animal products

3Department of Agriculture, Forestry and Fisheries
20 00030 00040 00050 00060 00070 00080 00090 000
2008/09 2009/10 2010/11 2011/12 2012/13
R'm
illio
n
Year
Gross farm sector income (GFI)2008/09–2012/13 (July to June)
Field crops Horticulture Animal products
0 4 000 8 000 12 000 16 000 20 000 24 000 28 000 32 000
Sugar cane (+0,3%)
Milk (+18,6%)
Vegetables (+12,0%)
Fruit (+9,5%)
Maize (+3,7%)
Red meat (+3,7%)
Poultry meat (+18,3%)
R'million
Gross income from major products2012/13 compared to 2011/12 (July to June)
2012/13 2011/12
The gross income from animal products was 11,2% higher in 2012/13 and amounted to R83 637 million, compared to R75 246 million in 2011/12. Producers earned R18 290 million from slaughtered cattle and calves, as against the previous R17 693 million—an increase of 3,4%. Income from slaughtered sheep in-creased by 5,4% to R4 130 million. Income from poultry meat production rose by 18,3% to R31 464 million and income from egg production, at R8 410 million, was 8,7% higher than in the previous year. Producers earned R11 617 million from milk production, which is 18,6% more than in the previous year. Income from wool and ostrich products decreased by 13,5% to R1 805 million and by 6,5% to R276 million respectively.
The net farm income (after the deduction of all production expenditure, excluding expenditure on fixed as-sets and capital goods) amounted to R56 565 million for the 12 months that ended on 30 June 2013, which is 7,6% more than in the previous 12 months. Payments for salaries and wages, which represented 10,7% of the total farming costs, amounted to R13 507 million. Interest paid by farmers to banks and other financi-ers during the 12 months up to 30 June 2013 is estimated at R5 935 million, or 4,7% of the total farming cost.
4 Trends in the Agricultural Sector 2013
3 000
6 000
9 000
12 000
15 000
2008/09 2009/10 2010/11 2011/12 2012/13
R'm
illio
n
Year
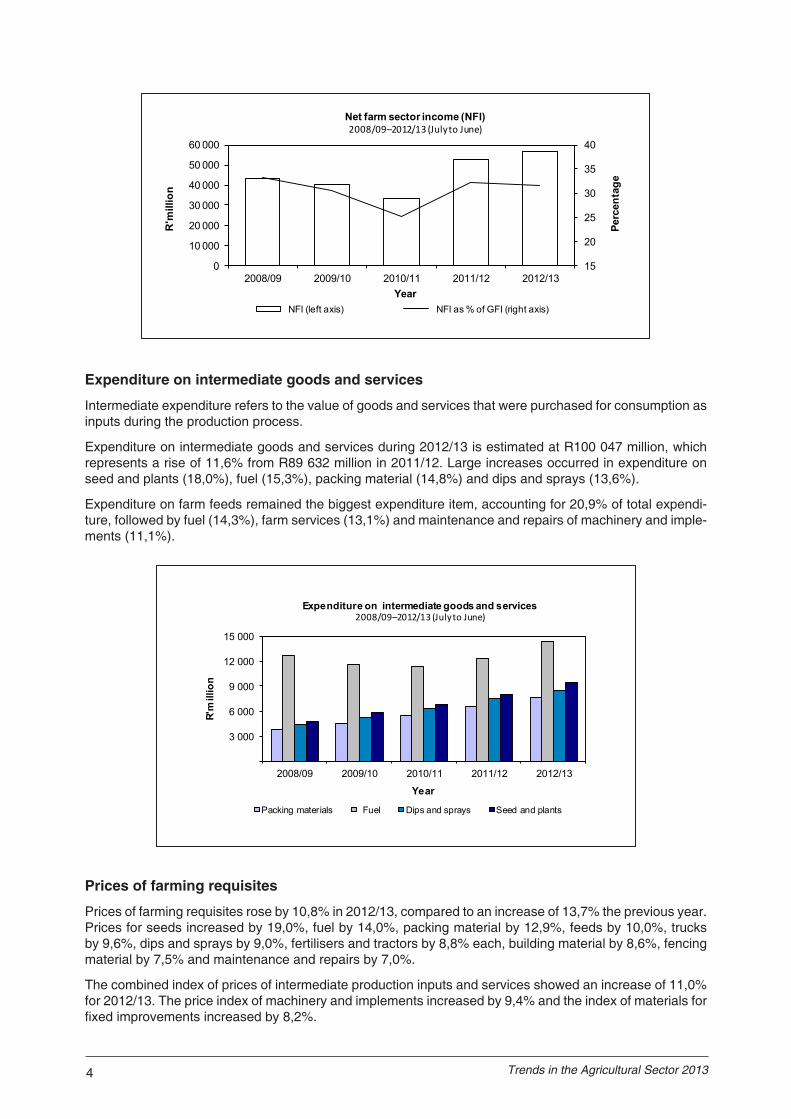
Expenditure on intermediate goods and services2008/09–2012/13 (July to June)
Packing materials Fuel Dips and sprays Seed and plants
Expenditure on intermediate goods and services
Intermediate expenditure refers to the value of goods and services that were purchased for consumption as inputs during the production process.
Expenditure on intermediate goods and services during 2012/13 is estimated at R100 047 million, which represents a rise of 11,6% from R89 632 million in 2011/12. Large increases occurred in expenditure on seed and plants (18,0%), fuel (15,3%), packing material (14,8%) and dips and sprays (13,6%).
Expenditure on farm feeds remained the biggest expenditure item, accounting for 20,9% of total expendi-ture, followed by fuel (14,3%), farm services (13,1%) and maintenance and repairs of machinery and imple-ments (11,1%).
Prices of farming requisites
Prices of farming requisites rose by 10,8% in 2012/13, compared to an increase of 13,7% the previous year. Prices for seeds increased by 19,0%, fuel by 14,0%, packing material by 12,9%, feeds by 10,0%, trucks by 9,6%, dips and sprays by 9,0%, fertilisers and tractors by 8,8% each, building material by 8,6%, fencing material by 7,5% and maintenance and repairs by 7,0%.
The combined index of prices of intermediate production inputs and services showed an increase of 11,0% for 2012/13. The price index of machinery and implements increased by 9,4% and the index of materials for fixed improvements increased by 8,2%.
15
20
25
30
35
40
0
10 000
20 000
30 000
40 000
50 000
60 000
2008/09 2009/10 2010/11 2011/12 2012/13
Perc
enta
ge
R'm
illio
n
Year
Net farm sector income (NFI)2008/09–2012/13 (July to June)
NFI (left axis) NFI as % of GFI (right axis)
5Department of Agriculture, Forestry and Fisheries
100
125
150
175
200
225
250
275
2008/09 2009/10 2010/11 2011/12 2012/13
2005
= 1
00
Year
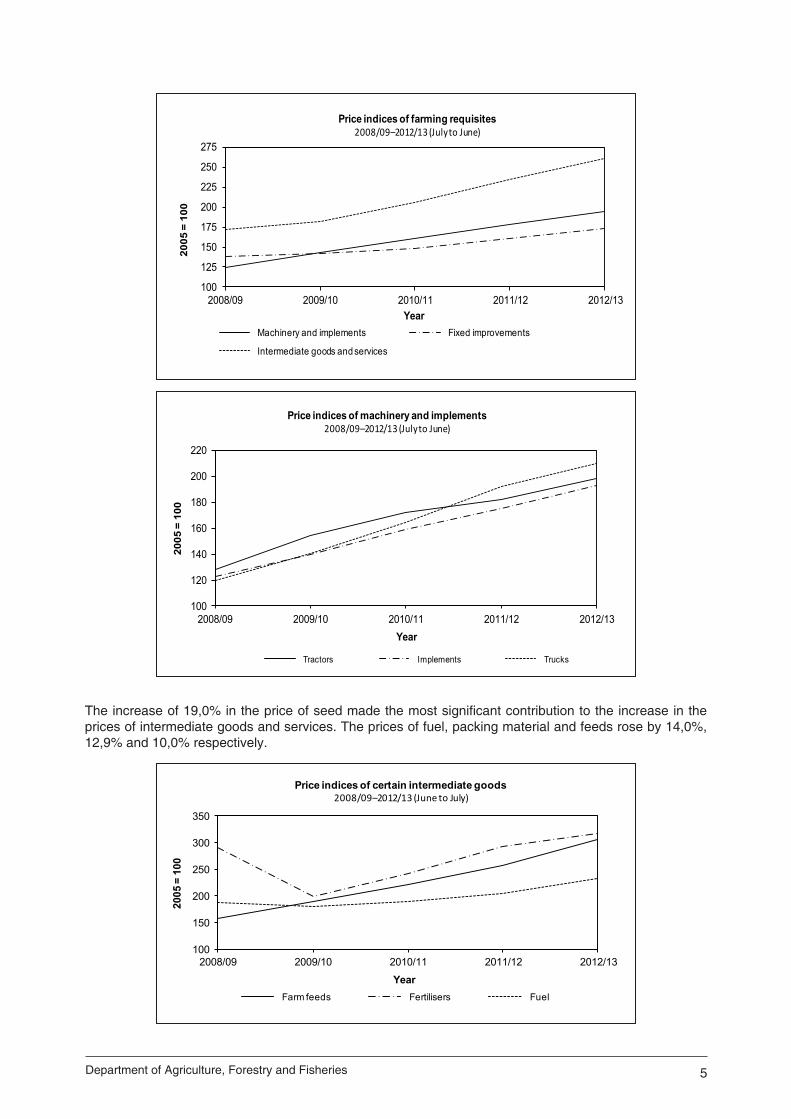
Price indices of farming requisites2008/09–2012/13 (July to June)
Machinery and implements Fixed improvements
Intermediate goods and services
100
120
140
160
180
200
220
2008/09 2009/10 2010/11 2011/12 2012/13
2005
= 1
00
Year
Price indices of machinery and implements2008/09–2012/13 (July to June)
Tractors Implements Trucks
The increase of 19,0% in the price of seed made the most significant contribution to the increase in the prices of intermediate goods and services. The prices of fuel, packing material and feeds rose by 14,0%, 12,9% and 10,0% respectively.
100
150
200
250
300
350
2008/09 2009/10 2010/11 2011/12 2012/13
2005
= 1
00
Year
Price indices of certain intermediate goods2008/09–2012/13 (June to July)
Farm feeds Fertilisers Fuel

6 Trends in the Agricultural Sector 2013
Domestic terms of trade in agriculture (2005 = 1)
The terms of trade indicate the extent to which producer prices received by farmers kept pace with the prices paid for farming requisites.
The terms of trade in agriculture decreased by 1,1%, from 0,87 in 2011/12 to 0,86 in 2012/13.
The terms of trade for field crops remained unchanged at 1,2 between 2011/12 and 2012/13. In the case of the horticultural industry, the terms of trade decreased by 1,3%, from 0,76 to 0,75. The terms of trade for the animal production industry dropped by 2,6%, from 0,78 to 0,76.
0,70
0,90
1,10
1,30
1,50
2008/09 2009/10 2010/11 2011/12 2012/13
2005
= 1
Year
Terms of trade in agriculture2008/09–2012/13 (July to June)
Field crops Horticulture Animal production
Contribution of agriculture to value added at basic pricesValue added is the value of total output less the value of intermediate consumption during the production period.
The contribution of agriculture to value added for the year ended 31 December 2012 is estimated at R72 731 million. This represents 2,6% of the total value added to the economy.
Year
Total value added Contribution of agriculture to value added
Contribution of agriculture as percentage of total value added
R’million R’million %
2005
2006
2007
2008
2009
2010
2011
2012*
1 401 067
1 572 319
1 792 075
2 027 751
2 178 321
2 407 264
2 621 379
2 835 087
30 213
37 475
45 152
50 263
52 903
48 909
49 799
72 731
2,2
2,4
2,5
2,5
2,4
2,0
1,9
2,6
*Note: Figures are for agriculture, forestry and fisheries.
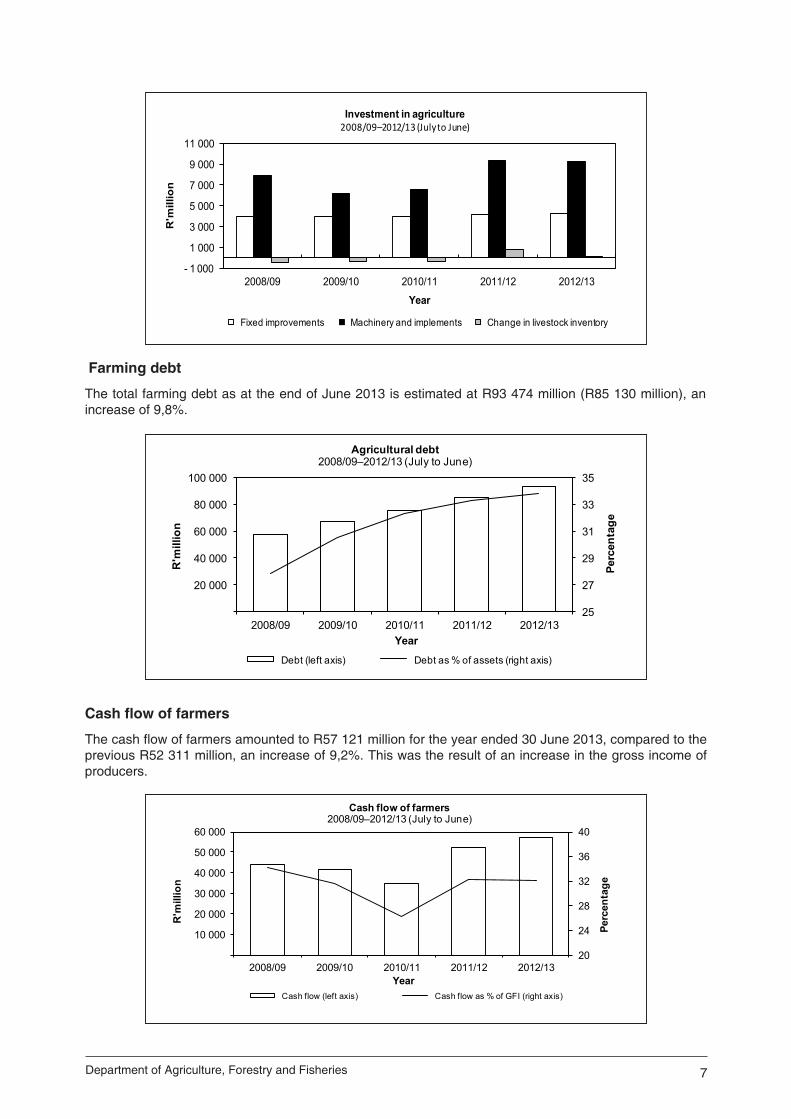
Capital assets and investment in agriculture The value of capital assets in agriculture as at 30 June 2013 is estimated at R276 507 million, as against R255 639 million at the end of June 2012—an increase of 8,2%. Land and fixed improvements constituted R167 367 million (60,5%), livestock R57 641 million (20,8%) and machinery and implements R51 499 mil-lion (18,6%) of the total value of capital assets. The gross investment in respect of fixed improvements for the year ended 30 June 2013 increased by 3,0% to R4 283 million. In the case of machinery, implements and vehicles, investment decreased by 0,6% and amounted to R9 248 million. The change in livestock inventory was R749,5 million lower than in the previous year.
7Department of Agriculture, Forestry and Fisheries
- 1 000
1 000
3 000
5 000
7 000
9 000
11 000
2008/09 2009/10 2010/11 2011/12 2012/13
R'm
illio
n
Year
Investment in agriculture2008/09–2012/13 (July to June)
Fixed improvements Machinery and implements Change in livestock inventory
25
27
29
31
33
35
20 000
40 000
60 000
80 000
100 000
2008/09 2009/10 2010/11 2011/12 2012/13Pe
rcen
tage
R'm
illio
n
Year
Agricultural debt2008/09–2012/13 (July to June)
Debt (left axis) Debt as % of assets (right axis)
Farming debt
The total farming debt as at the end of June 2013 is estimated at R93 474 million (R85 130 million), an increase of 9,8%.
20
24
28
32
36
40
10 000
20 000
30 000
40 000
50 000
60 000
2008/09 2009/10 2010/11 2011/12 2012/13
Perc
enta
ge
R'm
illio
n
Year
Cash flow of farmers 2008/09–2012/13 (July to June)
Cash flow (left axis) Cash flow as % of GFI (right axis)
Cash flow of farmers
The cash flow of farmers amounted to R57 121 million for the year ended 30 June 2013, compared to the previous R52 311 million, an increase of 9,2%. This was the result of an increase in the gross income of producers.
8 Trends in the Agricultural Sector 2013
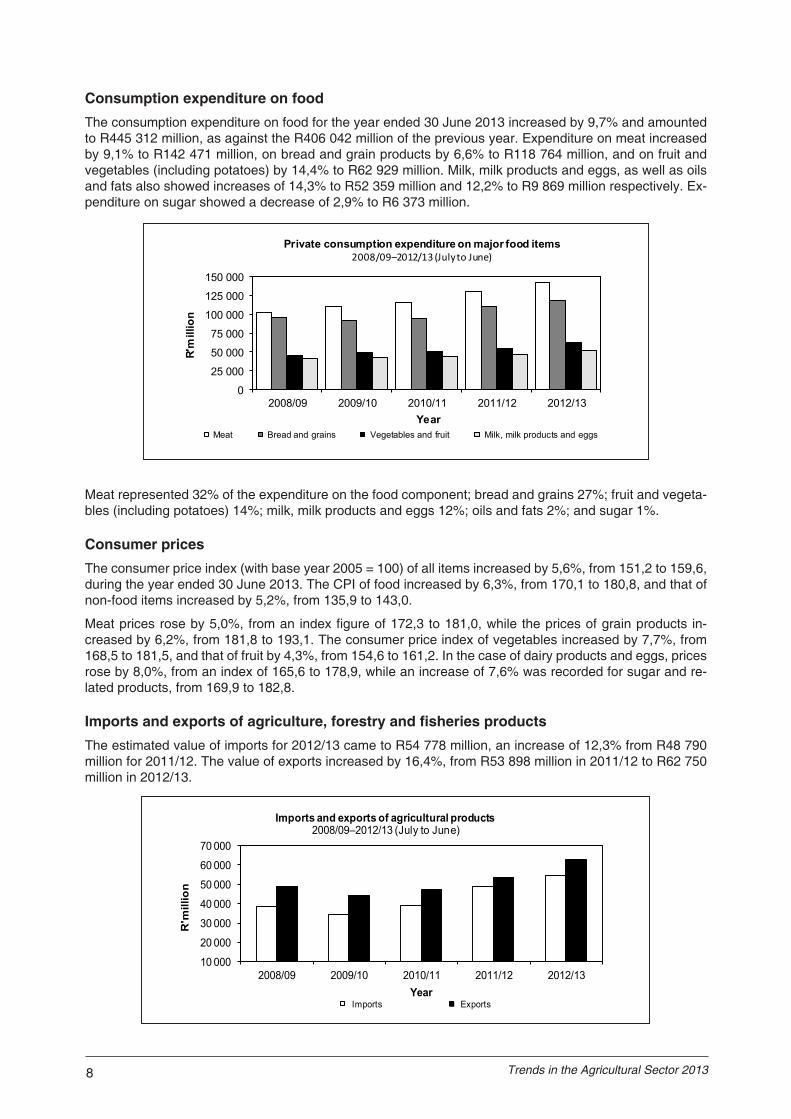
Consumption expenditure on foodThe consumption expenditure on food for the year ended 30 June 2013 increased by 9,7% and amounted to R445 312 million, as against the R406 042 million of the previous year. Expenditure on meat increased by 9,1% to R142 471 million, on bread and grain products by 6,6% to R118 764 million, and on fruit and vegetables (including potatoes) by 14,4% to R62 929 million. Milk, milk products and eggs, as well as oils and fats also showed increases of 14,3% to R52 359 million and 12,2% to R9 869 million respectively. Ex-penditure on sugar showed a decrease of 2,9% to R6 373 million.
0
25 000
50 000
75 000
100 000
125 000
150 000
2008/09 2009/10 2010/11 2011/12 2012/13
R'm
illio
n
Year
Private consumption expenditure on major food items 2008/09–2012/13 (July to June)
Meat Bread and grains Vegetables and fruit Milk, milk products and eggs
10 000
20 000
30 000
40 000
50 000
60 000
70 000
2008/09 2009/10 2010/11 2011/12 2012/13
R'm
illio
n
Year
Imports and exports of agricultural products2008/09–2012/13 (July to June)
Imports Exports
Meat represented 32% of the expenditure on the food component; bread and grains 27%; fruit and vegeta-bles (including potatoes) 14%; milk, milk products and eggs 12%; oils and fats 2%; and sugar 1%.
Consumer pricesThe consumer price index (with base year 2005 = 100) of all items increased by 5,6%, from 151,2 to 159,6, during the year ended 30 June 2013. The CPI of food increased by 6,3%, from 170,1 to 180,8, and that of non-food items increased by 5,2%, from 135,9 to 143,0.
Meat prices rose by 5,0%, from an index figure of 172,3 to 181,0, while the prices of grain products in-creased by 6,2%, from 181,8 to 193,1. The consumer price index of vegetables increased by 7,7%, from 168,5 to 181,5, and that of fruit by 4,3%, from 154,6 to 161,2. In the case of dairy products and eggs, prices rose by 8,0%, from an index of 165,6 to 178,9, while an increase of 7,6% was recorded for sugar and re-lated products, from 169,9 to 182,8.
Imports and exports of agriculture, forestry and fisheries products The estimated value of imports for 2012/13 came to R54 778 million, an increase of 12,3% from R48 790 million for 2011/12. The value of exports increased by 16,4%, from R53 898 million in 2011/12 to R62 750 million in 2012/13.
9Department of Agriculture, Forestry and Fisheries
According to the 2012/13 export values, citrus fruit (R7 981 million), wine (R6 965 million), maize (R5 294 million), apples, pears and quinces (R5 172 million) and grapes (R4 576 million) were the most important agricultural export products.
Rice (R6 200 million), wheat and meslin (R4 201 million), poultry (R3 781 million), undenatured ethyl alco-hol (R3 225 million) and oilcake (R3 153 million) accounted for the highest imports in terms of value.
During 2012/13, the Netherlands, with exports to the value of R6 862 million, the United Kingdom (R5 588 million), Zimbabwe (R5 011 million), Mozambique (R3 309 million) and China (R2 589 million) were the country’s five largest trading partners in terms of export destinations for agricultural products. About 19,8% of the total value of agricultural exports from South Africa for the period July 2012 to June 2013 went to the Netherlands and the United Kingdom combined.
The five largest trading partners for South Africa’s imported agricultural products during 2012/13 were Argentina (R6 331 million), China (R5 105 million), Brazil (R4 435 million), the United Kingdom (R3 464 mil-lion) and the Netherlands (R3 045 million). About 20,9% of the total value of agricultural imports by South Africa during the period July 2012 to June 2013 were from Argentina and China combined.
Branches of the industry
FIELD CROP HUSBANDRY
Maize
Maize is the most important grain crop in South Africa, being both the major feed grain and the staple food of the majority of the South African population. About 48% of maize produced in South Africa is white and the remaining 52% is yellow maize (2013). White maize is primarily used for human consumption, while yellow maize is mostly for animal feed production.
The gross value of agricultural production is determined by the quantity produced and prices received by producers.
The largest contributor towards the gross value of field crops for the past five seasons is maize (46,1%), followed by sugar cane (14,2%), wheat (10,6%), hay (8,7%) and soya beans (7,1%). The gross value of maize for 2012/13 amounts to R23 814 million.
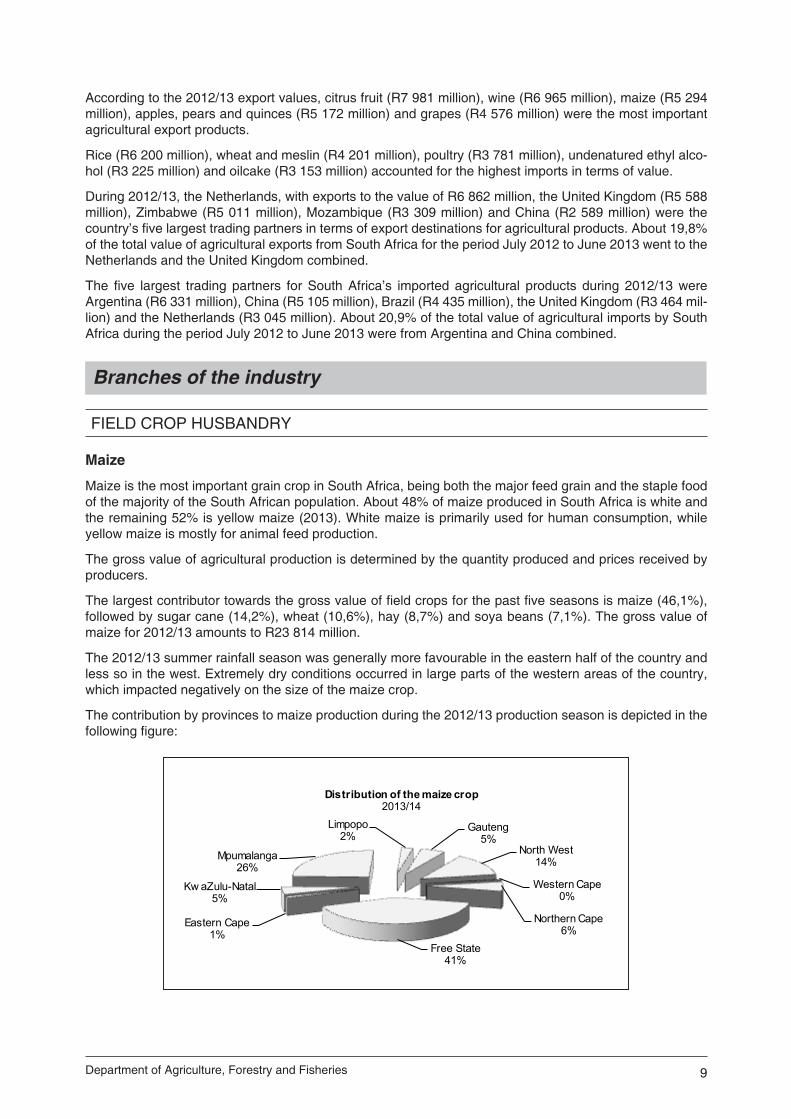
The 2012/13 summer rainfall season was generally more favourable in the eastern half of the country and less so in the west. Extremely dry conditions occurred in large parts of the western areas of the country, which impacted negatively on the size of the maize crop.
The contribution by provinces to maize production during the 2012/13 production season is depicted in the following figure:
Western Cape0%
Northern Cape6%
Free State41%
Eastern Cape1%
Kw aZulu-Natal5%
Mpumalanga26%
Limpopo2%
Gauteng5%
North West14%
Distribution of the maize crop2013/14
10 Trends in the Agricultural Sector 2013
White maize is generally produced in the western parts of the maize belt, while yellow maize is planted towards the eastern parts.
Maize is planted during late spring/early summer, with optimal planting times in November and December. However, planting can start as early as October and extend to January. In a particular season, the rainfall pattern and other weather conditions determine the planting period as well as the length of the growing season. Most of the maize is harvested from late May up to the end of August.
The present ratio of areas planted is 58% white maize to 42% yellow maize. An estimated 5,1% of the area planted to white maize is under irrigation and 94,9% is dryland, while the estimate for yellow maize is 13,8% under irrigation and 86,2% dryland.
Area planted and production
The estimated area that South African commercial producers planted to maize during the 2012/13 season is 2,781 million ha. This is 3,0% or 82 000 ha more than the 2,699 million ha planted the previous season and 6,6% or 173 120 ha more than the five-year average of 2,608 million ha planted up to 2011/12.
Commercial white and yellow maize plantings for 2012/13 were 1 617 200 ha and 1 164 000 ha respec-tively. This represents a decrease of 1,2% for white maize and an increase of 9,5% for yellow maize. The relatively favourable average real gross income per ha of yellow maize in 2012 resulted in producers fa-vouring an increase in yellow maize plantings in 2013, with white maize plantings at a slightly lower level compared to 2012.
The commercial maize crop for the 2012/13 production season is estimated to be 11,722 million tons, with an estimated yield of 4,21 t/ha. The production represents a decrease of 3,3% from the 2011/12 crop, which was estimated at 12,121 million tons.
The production estimate for white maize is 5,580 million tons, which is 19,2% or 1,323 million tons less than the 6,904 million tons of 2012 and 1,428 million tons less than the average of the five years (7,008 million tons) up to 2012. The estimated yield for white maize is 3,45 t/ha, as against 4,22 t/ha the previous season. During 2013, the white maize crop has severely been affected by drought conditions in the western production regions.
In the case of yellow maize, the production estimate for 2013 is 6,142 million tons, which is 17,7% or 925 250 tons more than the 5,217 million tons the previous season and 1,141 million tons higher than the five-year average (5,001 million tons) up to 2012. The yield for yellow maize is estimated to be 5,28 t/ha, as against 4,91 t/ha in 2012.
For the 2012/13 season, 97% of the deliveries of white maize was grade WM1, compared to 98% of the 2011/12 crop, and approximately 97% of the yellow maize deliveries was grade YM1, compared to 96% of the 2011/12 crop.
Plantings, production and yields of commercial maize from 2008/09 to 2012/13 were as follows:
Season 2008/09 2009/10 2010/11 2011/12 2012/13
Plantings (ha)
Production (t)
Yield (t/ha)
2 427 500
12 050 000
4,96
2 742 400
12 815 000
4,67
2 372 300
10 360 000
4,37
2 699 200
12 120 656
4,49
2 781 200
11 722 550
4,21
The estimated yield of 4,21 t/ha for 2012/13 is 15,1% below the record yield of 4,96 t/ha realised in 2008/09. It is also 6,2% lower than the yield of 4,49 t/ha estimated for 2011/12, mainly because of the drought condi-tions that occurred during the growing season, which impacted negatively on the yields.
The area planted to and production and producer prices of maize are depicted in the graph on p. 11:

11Department of Agriculture, Forestry and Fisheries
In South Africa, the breadbasket of the southern African region, the maize sector comprises both com-mercial and non-commercial farmers, the latter mostly in the Eastern Cape, Limpopo, Mpumalanga and northern KwaZulu-Natal provinces.
The area planted to maize by the non-commercial sector during 2012/13 is estimated at 456 900 ha, which comprises 320 105 ha of white maize and 136 795 ha of yellow maize. Production by the non-commercial sector is estimated at 675 090 tons—459 995 tons of white and 215 095 tons of yellow maize. Maize grown by this sector is mainly for own use and contributes only approximately 5% to total production.
Prices
Since the deregulation of the South African agricultural market in 1996, the maize market has essentially been an open one in which a number of basic factors play a role in determining prices. These factors in-clude:
• International maize prices• Exchange rates• Local production (influenced by weather conditions and area planted)• Local consumption• Production levels in the Southern African Development Community region (South Africa is usually the
main source of white maize for these countries in times of shortage)• Stock levels (both domestic and international)
Based on domestic stock levels, the domestic prices of maize fluctuate within a band that is determined by world prices, the exchange rate and local maize production. Because of the erratic weather conditions in the country, substantial variations in local production occur.
During periods of shortages, the rand price of maize tends to increase towards import parity, which is the international maize price plus transport and other costs, multiplied by the exchange rate. During surplus periods, the rand price tends to move towards export parity, which is the price of maize on the international market minus transport and other costs, multiplied by the exchange rate.
Currently, the prices of maize differ from one area to the other and can fluctuate daily. Producers can man-age their price risk by negotiating spot, contract or futures prices, based on market conditions, on SAFEX.
The average producer price of maize increased slightly by 0,3%, from R1 970,20/ton in 2011/12 to R1 976,45/ton in 2012/13.
The average producer prices of maize from 2008/09 to 2012/13 are as follows:
Season 2008/09 2009/10 2010/11 2011/12 2012/13
R/ton
Producer price 1 304,94 1 004,84 1 531,06 1 970,20 1 976,45
5007501 0001 2501 5001 7502 0002 250
02 0004 0006 0008 000
10 00012 00014 000
2008/09 2009/10 2010/11 2011/12 2012/13
R/to
n
'000
ha/
tons
Maize: Area planted, production and producer prices2008/09–2012/13
Area planted Production Producer price
12 Trends in the Agricultural Sector 2013
The South African maize market has matured considerably since the deregulation of marketing. Producers, traders and other intermediaries interact freely in the marketing of maize. Most of the maize produced in South Africa is consumed locally; as a result, the domestic market is very important to the industry.
Considering the 2013 commercial maize crop of 11,722 million tons (5,580 million tons white and 6,142 million tons yellow), together with carry-over stocks of 1,417 million tons (757 000 tons white and 660 000 tons yellow) from the previous season and a small quantity of imports (100 000 tons), the domestic supply of maize for the 2013/14 marketing season (May to April) is estimated at 13,239 million tons (6,337 million tons white and 6,902 million tons yellow maize).
The domestic demand for commercial maize is estimated at 10,427 million tons—5,077 million tons of white and 5,350 million tons of yellow maize. Projected exports amount to 2,120 million tons (890 000 tons of white and 1,230 million tons of yellow maize). Carry-out stocks on 30 April 2014 are expected to be ap-proximately 692 000 tons—370 000 tons white and 322 000 tons yellow maize. Pipeline requirements (45 days of commercial consumption) are projected at 1,155 million tons.
Trade balance
In the case of a product such as maize, millers (who are the main buyers of the maize crop) have the option of importing maize rather than buying locally produced maize. In a deregulated market, the decision wheth-er to buy from domestic or foreign sources is influenced by, among other factors, transport costs, price and quality. When the product is imported, the exchange rate plays an important role in the actual rand price.
Depreciation in the value of the rand against relevant foreign currencies makes import products such as maize, wheat and oilseeds more expensive in rand terms, thereby providing some protection for South Afri-can farmers and an incentive to increase production in the longer term. However, if South African producers are unable to meet the needs of the processors, or if processors are uncertain about local supplies, foreign sources can be considered.
South African producers, on the other hand, will consider the export market if local processors are unwilling to pay the prevailing local market price. In this manner, the market sets “natural” floor and ceiling prices, i.e. a price band within which such products trade. The price-setting mechanism for these crops is the Agricul-tural Products Division of the JSE Security Exchange of South Africa.
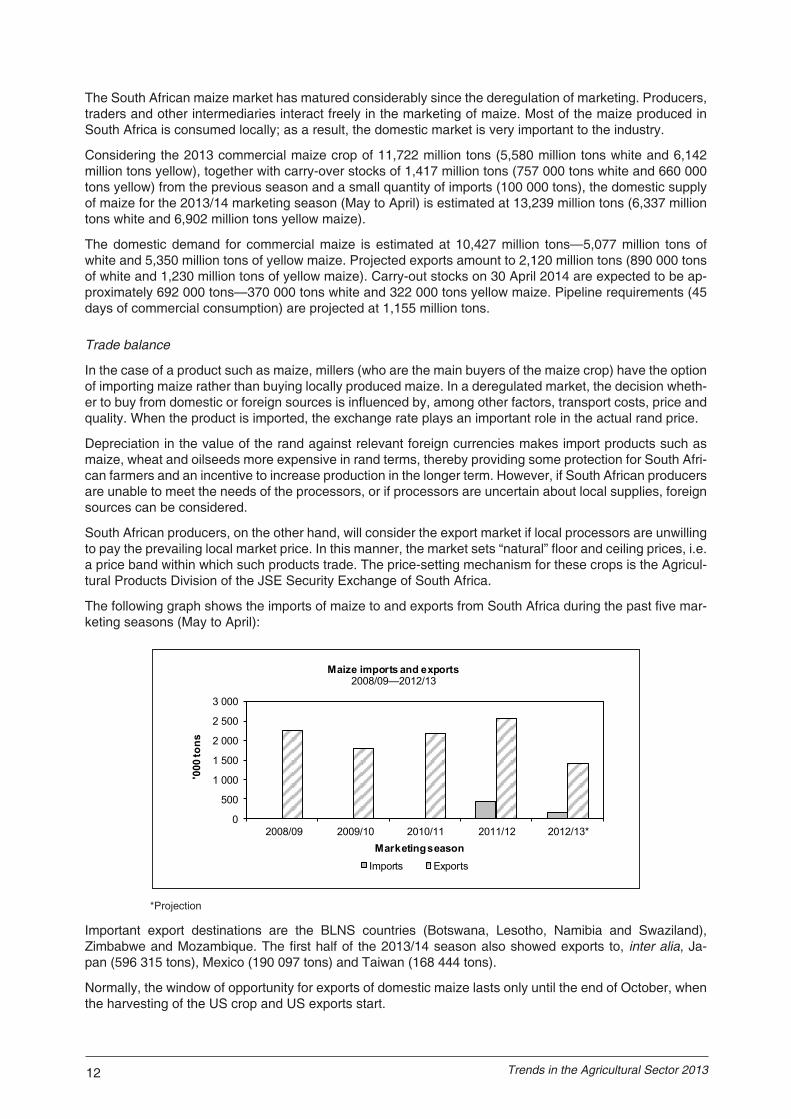
The following graph shows the imports of maize to and exports from South Africa during the past five mar-keting seasons (May to April):
*Projection
Important export destinations are the BLNS countries (Botswana, Lesotho, Namibia and Swaziland), Zim babwe and Mozambique. The first half of the 2013/14 season also showed exports to, inter alia, Ja-pan (596 315 tons), Mexico (190 097 tons) and Taiwan (168 444 tons).
Normally, the window of opportunity for exports of domestic maize lasts only until the end of October, when the harvesting of the US crop and US exports start.
0
500
1 000
1 500
2 000
2 500
3 000
2008/09 2009/10 2010/11 2011/12 2012/13*
'000
tons
Marketing season
Maize imports and exports2008/09—2012/13
Imports Exports
13Department of Agriculture, Forestry and Fisheries
The vulnerability assessments for 2013, conducted by the region’s national vulnerability assessment com-mittees (NVACs) and released in August 2013 by the Famine Early Warning Systems Network (FEWS NET) of USAID, indicated that about 7,70 million people in the SADC region (excluding the DRC) are at risk of food insecurity during the 2013/14 consumption period. The number of food insecure households has risen dramatically, from 5,48 million people in 2012 to 7,70 million people in 2013, mainly as a result of an increase in mid-season dry spells and/or flooding from 2012.
In 2013, five countries (Lesotho, Malawi, Namibia, Swaziland and Zimbabwe) had 10% or more of their rural population identified by the NVACs as food insecure for periods ranging from three to eight months. Namibia was facing one of the highest levels of acute food insecurity (48% of the rural population) on ac-count of a severe drought in the northern cropping regions. The NVAC findings have highlighted concerns over the erosion of household coping capacities in the region, possibly because of the adverse impact of economic underperformance on formal and informal employment opportunities, limiting the ability of house-holds to cope with multi-year hazards.
South Africa normally has the capacity to meet the maize import needs of neighbouring countries experi-encing shortages.
Prospects
In October 2013, the intended maize plantings of South African farmers were 2,68 million ha for the 2013/14 production season, which is 3,5% less than the 2,78 million ha planted during 2012/13.
Producers indicated that, although rains occurred over most of the eastern parts of the country, the drought in the western parts has still not been broken. Farmers were expected to plant more oilseeds such as sun-flower seed at the expense of maize.
Using an average yield of 4,40 t/ha, the potential maize crop for the 2013/14 season is 11,81 million tons.
Maize tariff
The import tariff on maize is another domestic factor that has an impact on the local price of maize. The import tariff for maize, as published in the Government Gazette of 8 December 2006, is zero.
World maize situation
According to the September 2013 report of the United States Foreign Agricultural Services, world maize production in 2013/14 (September to August) is forecast at 956,7 million tons, which is 11,2% or 96,6 mil-lion tons more than the 860,1 million tons produced during 2012/13. The US contributed 37% (351,6 million tons), China 22% (211,0 million tons), Brazil 8% (72,0 million tons) and the EU-27 7% (65,0 million tons) to world production. The remaining 26% is made up by, inter alia, the Ukraine, Southeast Asia, Argentina and South Africa.
Global consumption in 2013/14 is expected to be 927,8 million tons—58,5 million tons more than in the previous year. Global ending stocks at the end of September 2014 are expected to increase to 151,4 million tons, which is 28,8 million tons or 23,5% more than in the previous year.
Marketing, information and research
No statutory levies are applicable and the marketing of maize is free from statutory intervention.
The information function is performed by the Department of Agriculture, Forestry and Fisheries, through the Directorate Statistics and Economic Analysis; Grain South Africa, which promotes the interests of maize producers, and the South African Grain Information Services, a section 21 company funded by, among others, the maize industry.
Research is financed with income from the Maize Trust and performed by the Agricultural Research Coun-cil, the Council for Scientific and Industrial Research and other organisations.
SorghumPlantings and production
Sorghum is indigenous to Africa. There are two types of sorghum, namely bitter and sweet sorghum culti-vars. Preference is given to the sweet cultivars. Bitter sorghum is planted in areas where birds are a problem, because it contains tannin, which gives it a bitter taste and consequently birds tend to avoid feeding on it.
14 Trends in the Agricultural Sector 2013
Sorghum is cultivated mainly on low-potential, shallow soils with a high clay content that are not suitable for maize cultivation. Sorghum is planted mainly between mid-October and mid-December. The rainfall pattern and other weather conditions of a particular season to a large extent determine the planting period as well as the length of the growing season.
During the 2013 season (April to March), sorghum for commercial purposes was produced mainly in the Free State (51,1%), followed by Limpopo (19,2%), Mpumalanga (18,4%) and the North West (10,1%) prov-inces. An estimated 62 620 ha were planted to sorghum for commercial use, representing an increase of 29,0% from the 48 550 ha planted during 2012.
For the past five seasons, South Africa produced on average 203 700 tons of sorghum per annum, which is relatively small compared to the average domestic maize and wheat production.
During the 2013 production season, sorghum contributed approximately only 1,0% to the gross value of field crops. The estimated average annual gross value of sorghum for the five years up to 2012/13 amounts to R401 million.
The commercial sorghum crop for the 2013 season is estimated at 151 064 tons, which is 11,5% more than the 135 500 tons of the previous season and 25,8% lower than the five-year average production of 203 700 tons up to 2012. The yield for 2013 is 2,41 t/ha, which is 10,7% lower than the five-year average yield of 2,70 t/ha up to 2012.
Plantings, production and the yields of sorghum from 2009 to 2013 were as follows:
Season 2009 2010 2011 2012 2013
Plantings (ha)Production (t)Yield (t/ha)
85 500
276 500
3,23
86 675
196 500
2,27
69 200
155 000
2,24
48 550
135 500
2,79
62 620
151 064
2,41
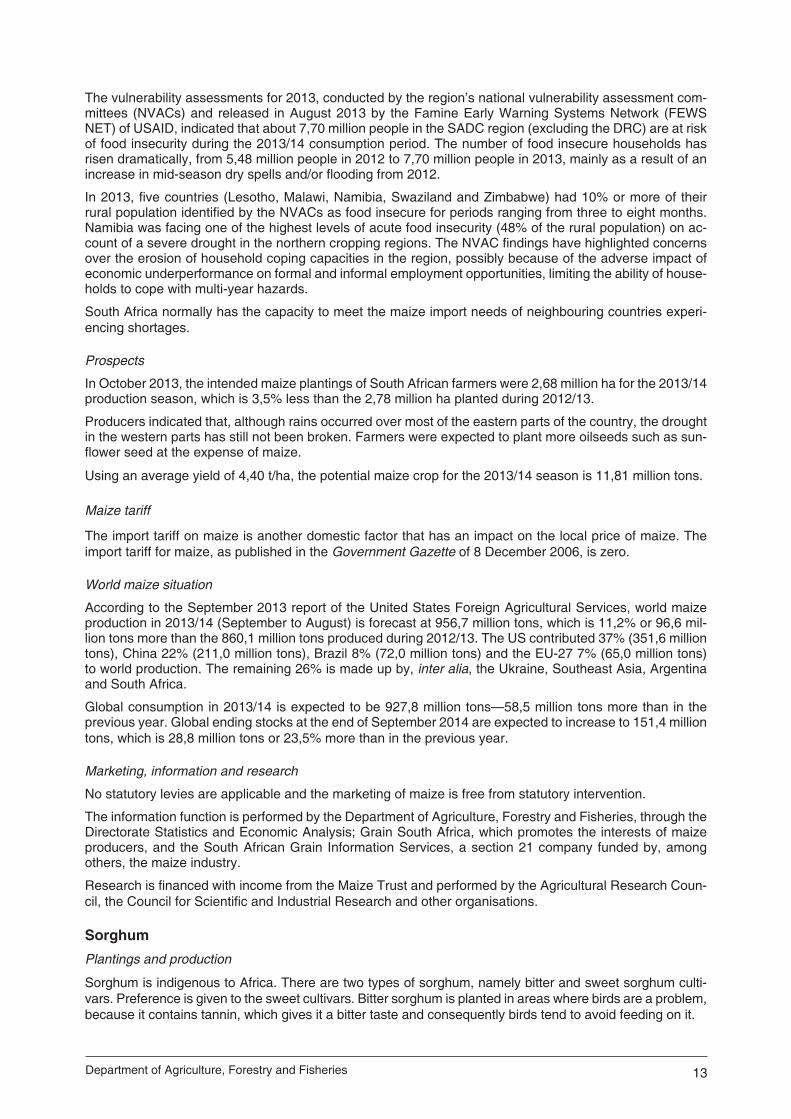
The following graph shows the area planted to and the production of sorghum in South Africa:
Area planted to and production of sorghum2009–2013
50 000
100 000
150 000
200 000
250 000
300 000
2009 2010 2011 2012 2013
Tons
20 000
40 000
60 000
80 000
100 000H
ecta
res
Production Area planted
The five-year average, up to 2013, of sorghum produced by the non-commercial agricultural sector for its own use is assumed to be approximately 27 900 tons, which is about 13,0% of the total sorghum produc-tion in South Africa.
Consumption
Sorghum, like other grains, serves two basic markets, namely the human component and the animal feed component. Sorghum is consumed mainly in the human food market and, as in the case of maize, consum-ers tend to replace sorghum-based products with preferred products as the household income increases.
Expectations are that a total of 289 000 tons of sorghum will be available for local consumption during the 2013/14 marketing season (April to March), compared to 264 100 tons the previous season. This comprises carry-over stocks as at 1 April 2013 amounting to 48 300 tons, domestic production of 180 700 tons and imports of 60 000 tons.

15Department of Agriculture, Forestry and Fisheries
Utilisation of sorghum for the local market 2009/10–2013/14
0
20
40
60
80
100
120
2009/10 2010/11 2011/12 2012/13 2013/14*Season
'00
0 to
ns
Feed Malt Meal
The projected commercial utilisation (for human and animal consumption) of sorghum for the 2013/14 marketing season is approximately 224 100 tons, of which 171 000 tons (76,3%) are for human consump-tion (malt, meal and other uses) and 5 500 tons (2,5%) are for animal feed (poultry, pet, pigeon and ostrich feeds). The uses of the remaining 47 600 tons (21,2%) (released to end-consumers, withdrawn by produc-ers, etc.) are not specified. Projected exports during the 2013/14 marketing season are 15 000 tons.
Considering the above, carry-out stocks at 31 March 2014 are expected to be about 49 900 tons.
The following graph depicts the utilisation of sorghum in South Africa (marketing seasons):
*Projection
Producer prices
Local producer prices of sorghum decreased by 1,0%, from R2 675,01/t in 2012 to R2 649,02/t, for the 2013 season.
Season 2009 2010 2011 2012 2013
R/t
Producer price 1 494,65 1 383,50 1 671,61 2 675,01 2 649,02
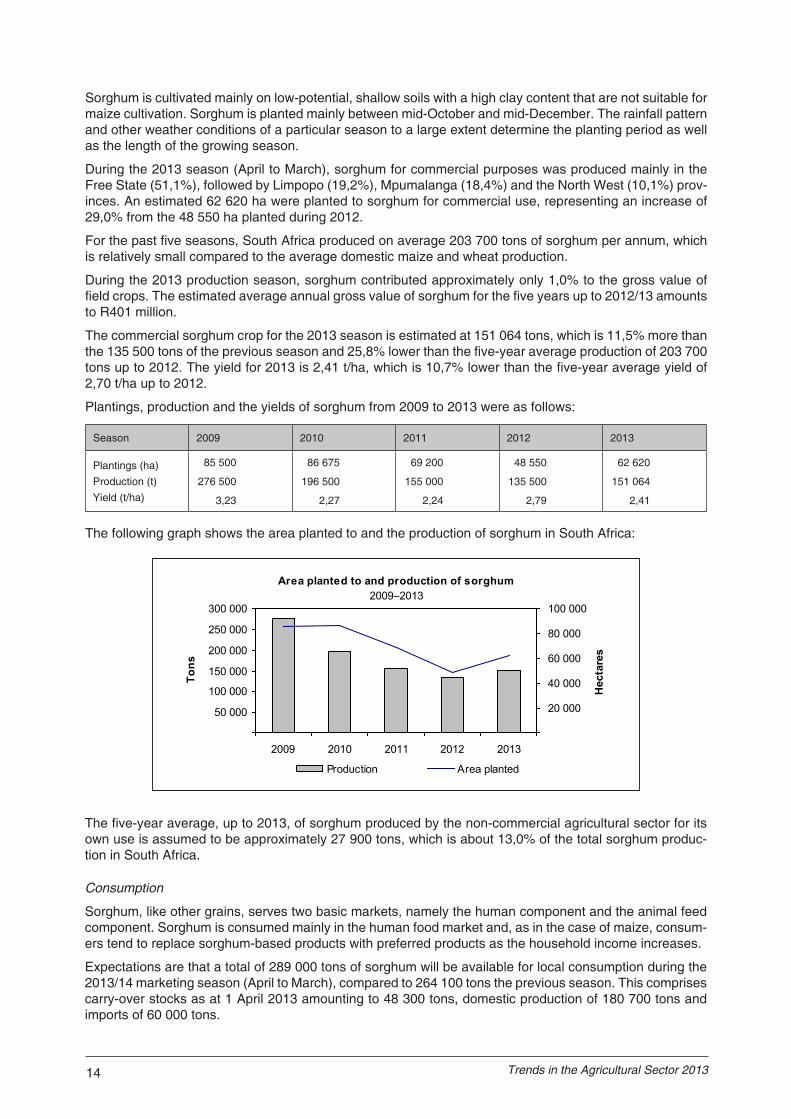
Imports and exports
Imports and exports of sorghum from 2009 to 2013 were as follows:
Season 2009 2010 2011 2012 2013*
Tons
Imports
Exports
4 000
52 000
0
24 200
57 800
25 200
55 000
19 000
60 000
15 000
*Projection
The exports of 15 000 tons for the 2013/14 marketing season are 21,1% less than the 19 000 tons of the previous season. The price of sorghum is required to trade at a premium above the local maize price to act as an incentive for larger plantings. It is evident that South Africa has moved from being a net exporter of sorghum to a net importer in recent years.
16 Trends in the Agricultural Sector 2013
Outlook
According to the Government Gazette of 30 September 2013, biofuels must comprise at least 5% of diesel and 2% to 10% of gasoline, starting 1 October 2015.
According to Grain SA, an additional volume of 620 000 tons of sorghum is required to produce enough bioethanol to meet the 2% inclusion rate. One ton of sorghum produces about 400 to 440 litres of bioethanol.
The biofuel industry will be able to offer competitive prices for sorghum, which will encourage producers to increase the production of sorghum.
The only available starch crop for bioethanol is sorghum, while for biodiesel soya beans, sunflower seed and canola can be used. Maize, considered as the country’s staple food, has been excluded from bioetha-nol production.
The average real gross income per hectare of sorghum improved in 2013 compared to that of maize, be-cause drought impacts more negatively on maize yields and sorghum traded at import parity levels.
In October 2013, the intended sorghum plantings of South African farmers were 70 000 ha for the 2014 season, which is 11,8% more than the 62 620 ha planted during 2013.
The introduction of sorghum in South Africa as feedstock for bioethanol production could literally double the size of the current sorghum market, but yields of new varieties will have to be much higher than the current average to attract larger plantings. Furthermore, the sweat sorghum varieties are currently the most suit-able varieties for bioethanol production and provide the highest yields per hectare, yet these varieties are subjected to excessive bird damage.
New varieties that produce greater quantities of feed, better quality feed and characteristics meeting the specific system requirements are constantly being developed by seed companies, e.g. the Silage King, Highveld and Rooiberg varieties of Pannar.
World sorghum situation
According to the World Agricultural Supply and Demand Estimate (WASDE) Report released in September 2013, the projected world production of sorghum increased by 9,9%, from 56,8 million tons in 2012/13 to 62,4 million tons in 2013/14. The contribution to world production by selected countries is as follows: the United States contributed 16,1% (10,1 million tons), Mexico contributed 10,9% (6,8 million tons), Nigeria 10,4% (6,5 million tons and India 9,3% (5,8 million tons).
The world total production in 2014 is forecast at 62,4 million tons, which is 5,6 million tons or 9,9% more than the 56,8 million tons produced in 2013.
A larger sorghum crop of 10,1 million tons for 2014 is projected for the United States, mainly as a result of an expected increase in yields in the larger producing states, namely Kansas and Texas. Mexico also ex-pects an increase in the sorghum crop, from 5,9 million tons to 6,8 million tons. Nigeria, which is the largest producer in Africa, expects to produce a sorghum crop of 6,5 million tons, while India expects a crop of 5,8 million tons for 2014.
Imports and exports of sorghum2009–2013
0
15 000
30 000
45 000
60 000
75 000
2009 2010 2011 2012 2013Season
Tons
Imports Exports

17Department of Agriculture, Forestry and Fisheries
Cooperation
The Sorghum Forum, consisting of all the participating parties in the sorghum industry (producers, trad-ers, silo-owners, processors, labour, consumers and the ARC), meets regularly to discuss various issues relevant to the industry.
The Sorghum Trust provides funding for research on sorghum, the maintenance and improvement of qual-ity standards, and the storing and updating of information required by the sorghum industry.
SAGIS, an independent section 21 company, collects, collates and publishes market information on sor-ghum.
The Southern African Grain Laboratory, incorporated under section 21 (association not for gain), analyses the quality of grain.
The Crop Estimates Committee plays an important role in providing up-to-date market information on which important decisions and actions can be based.
On a national basis, the ARC is responsible for research and development in the agricultural sector.
WheatIn terms of value of production, wheat is the third most important field crop produced in South Africa. In the 2012/13 season, this crop contributed approximately 11% to the gross value of field crops. The average annual gross value of wheat for the past five years up to 2012/13 amounts to R4 334 million, compared to R19 092 million for maize, which is the most important field crop.
Wheat is planted mainly between mid-April and mid-June in the winter rainfall area, and between mid-May and the end of July in the summer rainfall area. The crop is harvested from November to January. Most of the wheat produced in South Africa is bread wheat, with small quantities of durum wheat being produced in certain areas.
Wheat is generally classed as “hard” or “soft”. Hard wheat tends to have a higher protein content than softer wheat and is used mainly for bread. Soft wheat, on the other hand, is more suitable for confectionery.
Areas planted and production
The estimated area planted to wheat for the 2013 season is 505 500 ha, which is 1,1% less than the 511 200 ha of the previous season. This is the smallest area planted to wheat since the early 1900s. Of this area, 310 000 ha (61%) are in the Western Cape and 90 000 ha (18%) are in the Free State provinces. The Free State wheat area was at a record low level as a result of an expansion of summer grain plantings, as well as the lack of soil moisture following a dry summer.
Rainfall for planting wheat was above average in the Western Cape Province from May to August 2013. According to reports, wheat conditions were average to above average in the Western Cape Province but not as favourable as the previous year when record crop yields were achieved. The Free State Province has not received much rain during the planting season and potential yields were average to below average because of late plantings in some parts of the production area.
The areas planted to and production of wheat are depicted in the following graph:
Wheat: area planted and production2009–2013
0
500
1 000
1 500
2 000
2 500
2009 2010 2011 2012 2013
'000
tons
0
200
400
600
800
1 000
'000
ha
Production Area planted
18 Trends in the Agricultural Sector 2013
Based on conditions prevailing towards the end of October 2013, the expected commercial wheat crop for 2013 was 1,791 million tons, of which 883 500 tons (49%) were from the Western Cape, 294 000 tons (16%) from the Northern Cape and 270 000 tons (15%) from the Free State provinces. The expected aver-age yield was 3,54 t/ha. This is the second highest yield ever recorded.
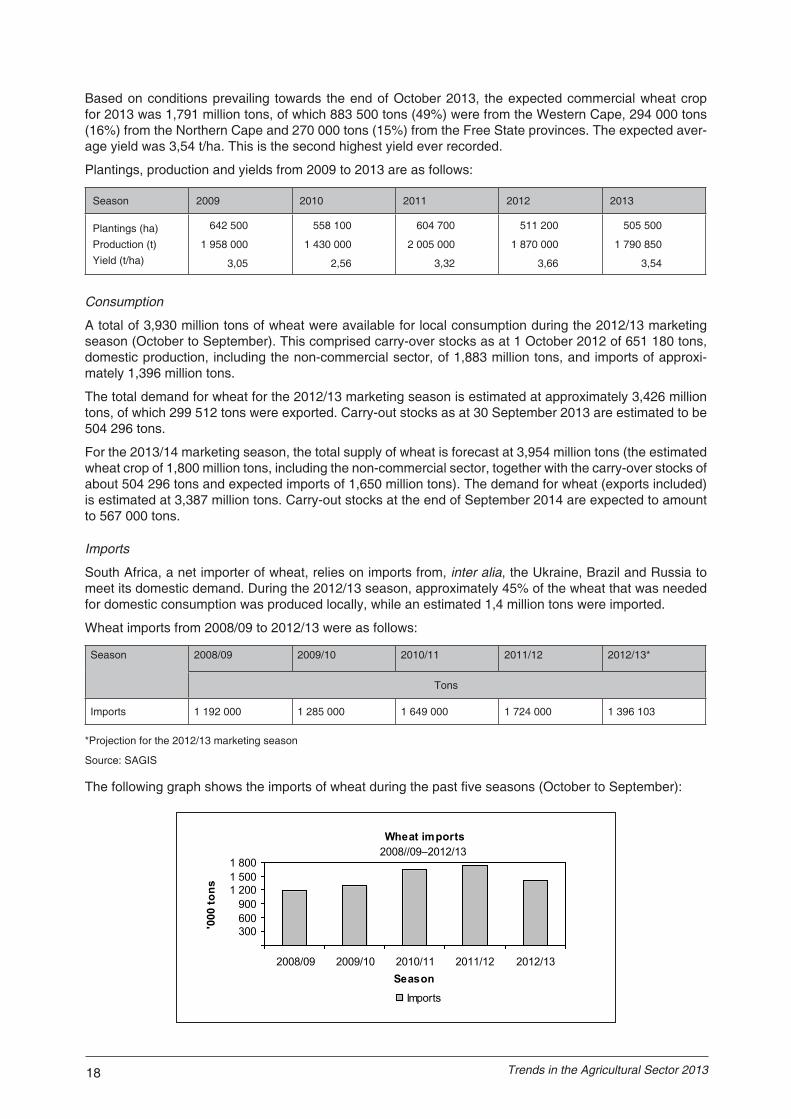
Plantings, production and yields from 2009 to 2013 are as follows:
Season 2009 2010 2011 2012 2013
Plantings (ha)Production (t)Yield (t/ha)
642 500
1 958 000
3,05
558 100
1 430 000
2,56
604 700
2 005 000
3,32
511 200
1 870 000
3,66
505 500
1 790 850
3,54
Consumption
A total of 3,930 million tons of wheat were available for local consumption during the 2012/13 marketing season (October to September). This comprised carry-over stocks as at 1 October 2012 of 651 180 tons, domestic production, including the non-commercial sector, of 1,883 million tons, and imports of approxi-mately 1,396 million tons.
The total demand for wheat for the 2012/13 marketing season is estimated at approximately 3,426 million tons, of which 299 512 tons were exported. Carry-out stocks as at 30 September 2013 are estimated to be 504 296 tons.
For the 2013/14 marketing season, the total supply of wheat is forecast at 3,954 million tons (the estimated wheat crop of 1,800 million tons, including the non-commercial sector, together with the carry-over stocks of about 504 296 tons and expected imports of 1,650 million tons). The demand for wheat (exports included) is estimated at 3,387 million tons. Carry-out stocks at the end of September 2014 are expected to amount to 567 000 tons.
Imports
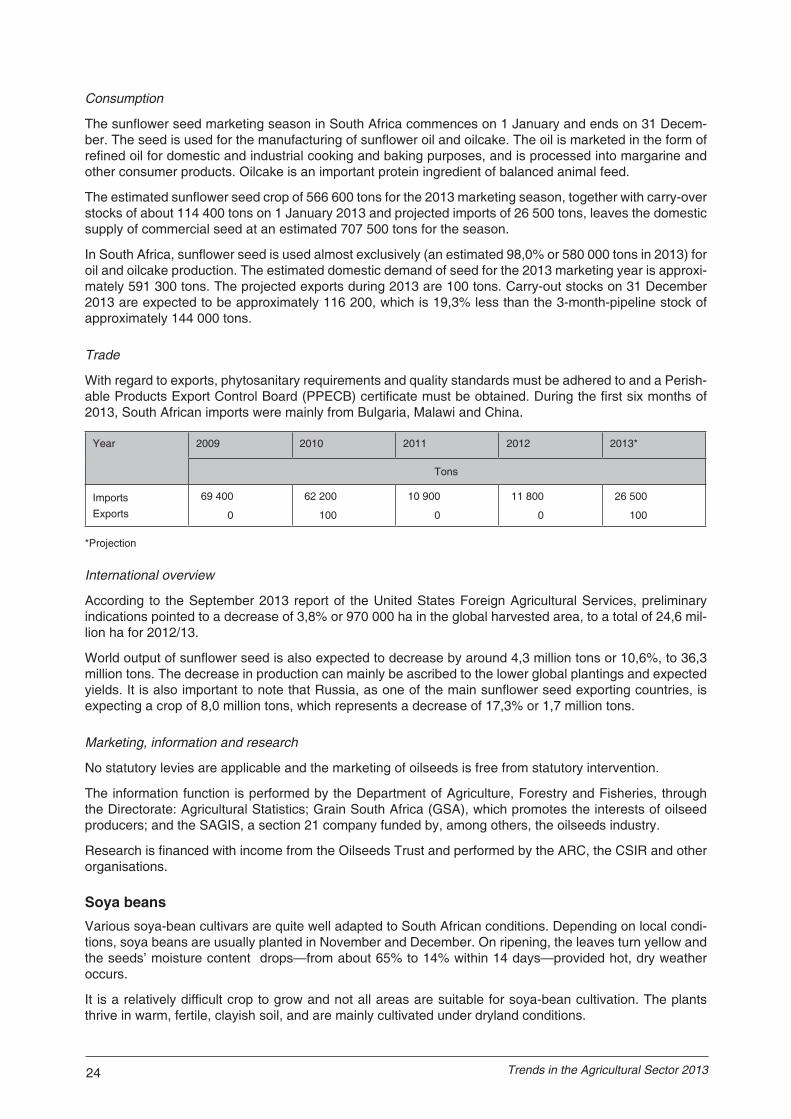
South Africa, a net importer of wheat, relies on imports from, inter alia, the Ukraine, Brazil and Russia to meet its domestic demand. During the 2012/13 season, approximately 45% of the wheat that was needed for domestic consumption was produced locally, while an estimated 1,4 million tons were imported.
Wheat imports from 2008/09 to 2012/13 were as follows:
Season 2008/09 2009/10 2010/11 2011/12 2012/13*
Tons
Imports 1 192 000 1 285 000 1 649 000 1 724 000 1 396 103
*Projection for the 2012/13 marketing season
Source: SAGIS
The following graph shows the imports of wheat during the past five seasons (October to September):
Wheat imports2008//09–2012/13
300 600 900
1 200 1 500 1 800
2008/09 2009/10 2010/11 2011/12 2012/13Season
'000
tons
Imports

19Department of Agriculture, Forestry and Fisheries
Prices
The International Trade Administration Commission (ITAC) of South Africa recommended a new reference price level for wheat at $294/ton, which is an increase of $79 from the previous level of $215/ton, as from 25 April 2013. This decision was approved to encourage a more competitive wheat industry in South Africa.
Low international wheat prices, caused by tariffs and subsidies in developed countries, have been blamed for causing financial difficulties for South African wheat producers. This could be one of the reasons why the area planted to wheat has decreased over the past decade. Producers regard wheat production as be-ing uncompetitive at the current low wheat price and they have gradually switched to growing more profit-able crops such as maize, soya beans, canola and oats. This has opened the door to a heavy reliance on imported wheat.
The exchange rate and world price will remain the key drivers in determining the wheat price.
The average producer price of wheat increased by 21,4%, from R2 370,36/ton in 2011/12 to R2 878,22/ton in 2012/13.
The average producer prices of wheat (grade 1) from 2008/09 to 2012/13 were as follows:
Season 2008/09 2009/10 2010/11 2011/12 2012/13
R/ton
Producer price 2 307,46 1 607,67 2 303,68 2 370,36 2 878,22
Marketing
The South African wheat market was deregulated on 1 November 1997 and wheat can therefore be traded freely. The only government intervention in the market is the tariff on wheat imports.
The Winter Grains Trust is responsible for the allocation of funding and appraisal of relevant research pro-jects in the winter grains industry. Since 1998, statutory levies on sales of winter cereals have been used to finance the Winter Grains Trust.
World wheat situation
Following the severe drought of 2012, a much better crop is expected out of US in the current season and world commodity prices are expected to trade significantly lower as stocks levels are being replenished. Apart from cold weather in some northern hemisphere countries that delayed the planting of spring wheat in 2013, growing conditions in the most important wheat-producing countries were relatively favourable.
According to the September 2013 report of the United States Foreign Agricultural Services, world wheat production in 2013/14 (July to June) is forecast at 708,9 million tons, which is 8,2% or 53,7 million tons more than the 655,2 million tons produced during 2012/13. According to expectations, the European Union will contribute 20% (142,9 million tons), China 17% (121,0 million tons), India 13% (92,5 million tons) and the United States 8% (57,5 million tons) to world production during 2013/14. The balance of 42% is made up by, inter alia, the Russian Federation, Canada, Australia and Pakistan.
Global consumption is expected to be 706,5 million tons during 2013/14—26 million tons more than the previous year. Global ending stocks are expected to increase to 176,3 million tons by the end of June 2014, which is 2,4 million tons or 1,4% more than the previous year.
Research and information
The ARC-Small Grain Institute in Bethlehem conducts the research on wheat and other winter grains.
The South African Grain Information Service (SAGIS), a section 21 company funded by, among others, the wheat industry, administers the information function for the wheat industry.
Accurate crop forecasts and estimates also play an important role by providing up-to-date information upon which important decisions and measures can be based. The crop estimates are a result of the collated inputs of and consensus reached by the various members of the Crop Estimates Committee.
20 Trends in the Agricultural Sector 2013
Malting barley
Plantings and production
Barley is one of the most important grain crops in South Africa, surpassed only by wheat and maize, and is, after wheat, the most important small grain type.
The cultivation area for malting barley under dryland conditions is at present restricted to a very specific region, namely the Southern Cape, which stretches from Bot River in the west to Heidelberg in the east. It would not be economically viable to cultivate malting barley on dryland in an area that does not receive 350 mm of well-distributed rainfall during the growing season (March to October). At present, four varieties are recommended for malting barley production in the Southern Cape, viz. SSG 564, SabbiErica, SabbiNem-esia and S5.
The concentration of the production of a relatively minor commodity, such as malting barley, in a specific area has various advantages, e.g. it facilitates transport, storage, control, extension and research, which also implies cost advantages.
However, because of the risk of unpredictable weather conditions in the Southern Cape, barley production has also been introduced to the cooler central irrigation areas of the Northern Cape Province. There are also farmers in other areas of South Africa, such as the North West and Limpopo provinces, who plant small quantities of malting barley under irrigation.
Malting barley under irrigation has a higher yield and is more stable than in the Southern Cape, where the crop is dependent on rainfall.
Barley is planted over a relatively short period of time (from three weeks in certain areas to five weeks in others). The earlier plantings generally have a higher yield potential. This results in greater yield increases with disease and pest control programmes in earlier plantings. Barley planted later than the optimum plant-ing date is therefore at greater risk in terms of both yield and quality.
Barley is mainly used for the production of malt (for brewing beer), animal feed and pearl barley. However, the Crop Estimates Committee’s barley estimates only involve malting barley, therefore excluding barley for animal feed.
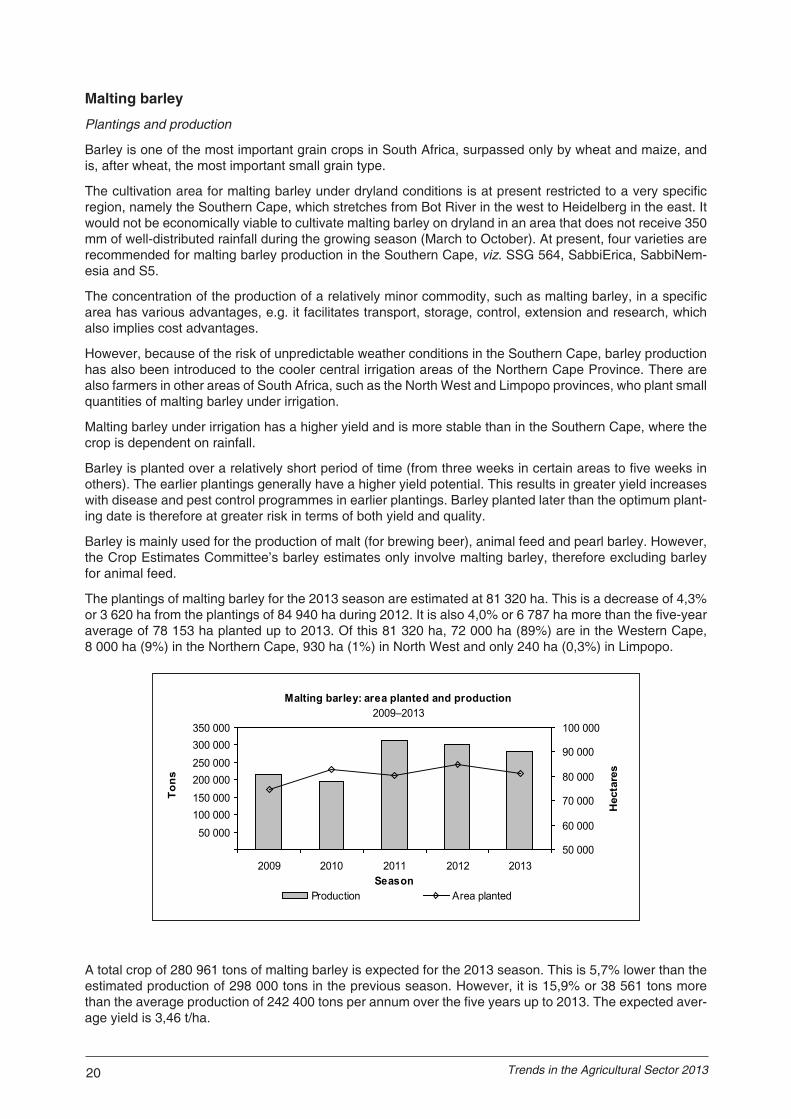
The plantings of malting barley for the 2013 season are estimated at 81 320 ha. This is a decrease of 4,3% or 3 620 ha from the plantings of 84 940 ha during 2012. It is also 4,0% or 6 787 ha more than the five-year average of 78 153 ha planted up to 2013. Of this 81 320 ha, 72 000 ha (89%) are in the Western Cape, 8 000 ha (9%) in the Northern Cape, 930 ha (1%) in North West and only 240 ha (0,3%) in Limpopo.
Malting barley: area planted and production2009–2013
50 000 100 000 150 000 200 000 250 000 300 000 350 000
2009 2010 2011 2012 2013Season
Ton
s
50 000
60 000
70 000
80 000
90 000
100 000
Hec
tare
s
Production Area planted
A total crop of 280 961 tons of malting barley is expected for the 2013 season. This is 5,7% lower than the estimated production of 298 000 tons in the previous season. However, it is 15,9% or 38 561 tons more than the average production of 242 400 tons per annum over the five years up to 2013. The expected aver-age yield is 3,46 t/ha.

21Department of Agriculture, Forestry and Fisheries
Plantings, production and yield of malting barley from 2009 to 2013 were as follows:
Season 2009 2010 2011 2012 2013
Plantings (ha)Production (t)Yield (t/ha)
74 760
216 000
2,89
82 670
194 000
2,35
80 150
312 000
3,89
84 940
298 000
3,51
81 320
280 968
3,46
Consumption
The processing of barley into malt is done mainly in Caledon in the Southern Cape, but also in Alrode near Johannesburg. Taste is important in malting barley, which is mainly used for flavouring beer. It is also used around the world in many foods.
The total supply of malting barley for the 2012/13 marketing season (October to September) was estimated at 467 300 tons (imports included). Carry-over stocks as at 1 October 2012 amounted to 142 900 tons. Production for the 2012/13 season was 298 400 tons, while 26 000 tons were imported.
For the 2012/13 marketing season, the total demand for malting barley is estimated at 333 700 tons, includ-ing 100 tons of exports. Carry-out stocks at 30 September 2013 were 133 600 tons. This is more than three times the required 3-month-pipeline stock of 38 800 tons.
For the 2013/14 marketing season, the total supply of malting barley is expected to be 454 600 tons, comprising the expected crop of 281 000 tons, carry-over stocks of 133 600 tons and expected imports of 40 000 tons. The domestic demand is estimated at 305 600 tons, including 100 tons of exports. Carry-out stocks at the end of September 2014 are expected to amount to 149 000 tons.
Producer prices and value of the crop
The average producer prices of malting barley from 2008 to 2012 were estimated to be as follows:
Season 2008 2009 2010 2011 2012
R/ton
Producer price 2 300,31 2 125,90 2 006,34 2 277,23 2 502,30
The average annual gross value of malting barley for the past five years up to 2012/13 amounts to R564 million, compared to the R4 334 million of wheat and R18 714 million of maize.
Marketing
Malting barley is different from most, if not all, other agricultural commodities, as there is only one major buyer in South Africa, namely South African Breweries Maltings (SABM), which supplies its major share-holder, South African Breweries Limited (SAB) with malted barley. Barley producers have a guaranteed market (there is a written commitment to source locally) and fixed-price forward contracts. The barley-malting industry is significant in South Africa’s national economy, with barley playing a crucial role in the crop rotation systems used by farmers.
Imports
Variability in rainfall can cause wide fluctuations in barley quality and yields in South Africa. Whenever the local crop has fallen short of requirements, SABM imported barley (mainly from Canada, the United States, Australia and Argentina) and malt (mainly from Canada, the US, Sweden and France).
Barley and malt imports from 2008/09 to 2012/13 were as follows:
Season 2008/09 2009/10 2010/11 2011/12 2012/13
Tons
Imports – Barley
– Malt
98 700
61 900
53 500
82 400
70 300
80 900
59 900
69 600
36 655
109 208
Source: SAGIS
22 Trends in the Agricultural Sector 2013
World barley situation
According to the September 2013 report of the United States Foreign Agricultural Services, world barley production is estimated at 141,7 million tons for the 2013/14 marketing year, while global consumption is expected to be 139,0 million tons. Global ending stocks at the end of September 2014 are expected to be 22,4 million tons.
Research and information
The ARC-Small Grain Institute (SGI) in Bethlehem and the South African Barley Breeders’ Institute (Sabbi) near Caledon conduct research on and breeding of barley in South Africa, which is financed by statutory levies on barley sales.
The ARC-SGI is one of the crop institutes of the ARC which has, under the Agricultural Research Act of 1990 (Act No. 86 of 1990), the mandate to perform research, development and transfer of technology within the RSA, to the advantage of all agricultural and agriculture-related industries, and therefore to improve the quality of life of all South Africans.
On the other hand, Sabbi’s Research and Development mission is to ensure sustainable barley production for the benefit of the SAB, SABM and the producer through innovative research and development. Produc-ers need better quality, higher yielding and more resistant varieties, as well as increased knowledge of enhanced agricultural production practices in order to be more competitive with global competitors.
The SAGIS, a section 21 company funded by, among others, the barley industry, administers the informa-tion function for the barley industry.
Sunflower seedSunflower seed can be planted from the beginning of November to the end of December in the eastern part of the production areas, and up to the middle of January in the western part. Sunflowers grow best when planted in midsummer to ensure that less moisture is lost from the soil during the crucial growing phases. Compared to other crops, sunflower performs well under dry conditions. This is probably the main reason for the crop’s popularity in the marginal production areas of South Africa. A close link exists between the area planted to maize and the area planted to sunflower seed, because farmers can easily switch to sun-flower if the optimum date for maize planting has passed.
During the 2013 production season, the bulk of the crop was produced in the Free State (44%), North West (35%) and Limpopo (20%) provinces. The contribution of sunflower seed to the gross value of field crops during the season is approximately 5,6%, compared to the 46,1% of maize, the largest contributor. The av-erage annual estimated gross value of sunflower seed for the five years up to 2012/13 amounts to R2 503 million, compared to the R19 092 million of maize.
Plantings and production
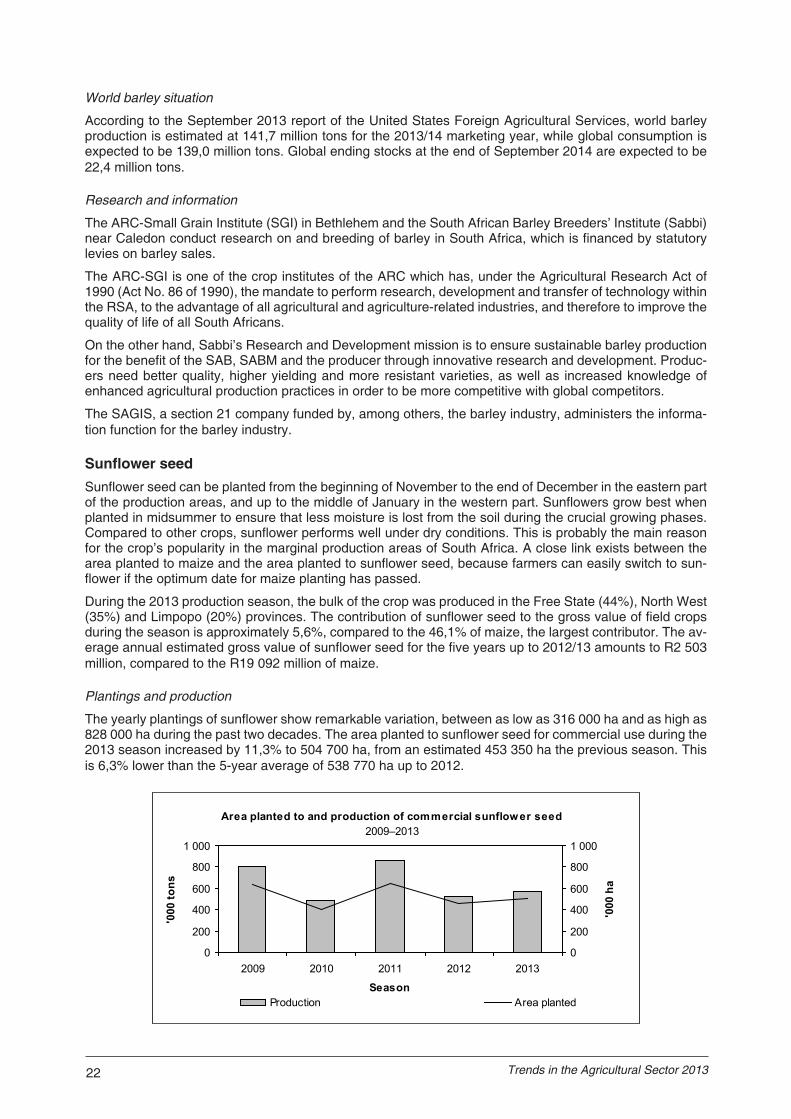
The yearly plantings of sunflower show remarkable variation, between as low as 316 000 ha and as high as 828 000 ha during the past two decades. The area planted to sunflower seed for commercial use during the 2013 season increased by 11,3% to 504 700 ha, from an estimated 453 350 ha the previous season. This is 6,3% lower than the 5-year average of 538 770 ha up to 2012.
Area planted to and production of commercial sunflower seed2009–2013
0
200
400
600
800
1 000
2009 2010 2011 2012 2013
Season
'000
tons
0
200
400
600
800
1 000
'000
ha
Production Area planted

23Department of Agriculture, Forestry and Fisheries
Commercial production and producer prices of sunflower seed2009–2013
0
200
400
600
800
1 000
2009 2010 2011 2012 2013Season
'000
tons
500
1 500
2 500
3 500
4 500
5 500
R/t
Production Producer price
Commercial seed production during 2013 was approximately 566 600 tons, which is 8,5% higher than the previous season and 20,1% lower than the average of 709 000 tons for the previous five years. The increase in production can be attributed mainly to the increase in the area planted to sunflower seed. The average yield for 2013 is approximately 1,12 t/ha, which is 2,6% lower than the 1,15 t/ha during the previous season and 15,2% less than the 5-year average of 1,32 t/ha up to 2012. The decreased yield can mainly be attributed to the drought conditions experienced by summer grain producers in the western parts of the summer rainfall areas in 2013.
Non-commercial agriculture contributed an estimated 22 889 tons (3,8%) to the total sunflower seed pro-duction in South Africa during 2013.
According to the Baseline 2013 report by the Bureau for Food and Agricultural Policy (BFAP) of the Univer-sity of Pretoria, following the midsummer drought in 2013, producers are expected to increase sunflower plantings in 2014 because of the crop’s drought resistance characteristics, despite the lower average real gross income per hectare achieved in 2013. Contrary to soya-bean oilcake consumption that has tripled in the past decade, the demand for sunflower oilcake has remained stagnant and is projected to remain rela-tively constant. The projected demand of 700 000 tons to 800 000 tons will most likely be met by increasing yield trends. Even with a slight decline in the area under production, the local demand for sunflower will be met, which could dampen the potential increase in prices.
Commercial plantings, production and yields of sunflower seed from 2009 to 2013 were as follows:
Season 2009 2010 2011 2012 2013
Plantings (ha)Production (t)Yield (t/ha)
635 800
801 000
1,26
397 700
490 000
1,23
642 700
860 000
1,34
453 350
522 000
1,15
504 700
566 600
1,12
Producer prices
The average producer prices of sunflower seed from 2009 to 2013 are as follows:
Season 2009 2010 2011 2012 2013
R/ton
Producer price 2 855 2 953 3 736 4 397 4 850
The average producer price increased by 10,3%, from R4 397/ton in 2012 to R4 850/ton in 2013. The renewed surge in international prices mainly reflects a progressive tightening in global supplies, caused mainly by the reduced availability of sunflower seed and sunflower oilcake from Russia and the Ukraine, during 2013. These international factors also impacted positively on the local sunflower seed price for 2013.
24 Trends in the Agricultural Sector 2013
Consumption
The sunflower seed marketing season in South Africa commences on 1 January and ends on 31 Decem-ber. The seed is used for the manufacturing of sunflower oil and oilcake. The oil is marketed in the form of refined oil for domestic and industrial cooking and baking purposes, and is processed into margarine and other consumer products. Oilcake is an important protein ingredient of balanced animal feed.
The estimated sunflower seed crop of 566 600 tons for the 2013 marketing season, together with carry-over stocks of about 114 400 tons on 1 January 2013 and projected imports of 26 500 tons, leaves the domestic supply of commercial seed at an estimated 707 500 tons for the season.
In South Africa, sunflower seed is used almost exclusively (an estimated 98,0% or 580 000 tons in 2013) for oil and oilcake production. The estimated domestic demand of seed for the 2013 marketing year is approxi-mately 591 300 tons. The projected exports during 2013 are 100 tons. Carry-out stocks on 31 December 2013 are expected to be approximately 116 200, which is 19,3% less than the 3-month-pipeline stock of approximately 144 000 tons.
Trade
With regard to exports, phytosanitary requirements and quality standards must be adhered to and a Perish-able Products Export Control Board (PPECB) certificate must be obtained. During the first six months of 2013, South African imports were mainly from Bulgaria, Malawi and China.
Year 2009 2010 2011 2012 2013*
Tons
ImportsExports
69 400
0
62 200
100
10 900
0
11 800
0
26 500
100
*Projection
International overview
According to the September 2013 report of the United States Foreign Agricultural Services, preliminary indications pointed to a decrease of 3,8% or 970 000 ha in the global harvested area, to a total of 24,6 mil-lion ha for 2012/13.
World output of sunflower seed is also expected to decrease by around 4,3 million tons or 10,6%, to 36,3 million tons. The decrease in production can mainly be ascribed to the lower global plantings and expected yields. It is also important to note that Russia, as one of the main sunflower seed exporting countries, is expecting a crop of 8,0 million tons, which represents a decrease of 17,3% or 1,7 million tons.
Marketing, information and research
No statutory levies are applicable and the marketing of oilseeds is free from statutory intervention.
The information function is performed by the Department of Agriculture, Forestry and Fisheries, through the Directorate: Agricultural Statistics; Grain South Africa (GSA), which promotes the interests of oilseed producers; and the SAGIS, a section 21 company funded by, among others, the oilseeds industry.
Research is financed with income from the Oilseeds Trust and performed by the ARC, the CSIR and other organisations.
Soya beans Various soya-bean cultivars are quite well adapted to South African conditions. Depending on local condi-tions, soya beans are usually planted in November and December. On ripening, the leaves turn yellow and the seeds’ moisture content drops—from about 65% to 14% within 14 days—provided hot, dry weather occurs.
It is a relatively difficult crop to grow and not all areas are suitable for soya-bean cultivation. The plants thrive in warm, fertile, clayish soil, and are mainly cultivated under dryland conditions.
25Department of Agriculture, Forestry and Fisheries
Soya beans contributed approximately 7,1% to the gross value of field crops during 2012/13. The estimated average annual gross value of soya beans for the past five seasons up to 2012/13 amounts to R2 281 million.
Plantings and production
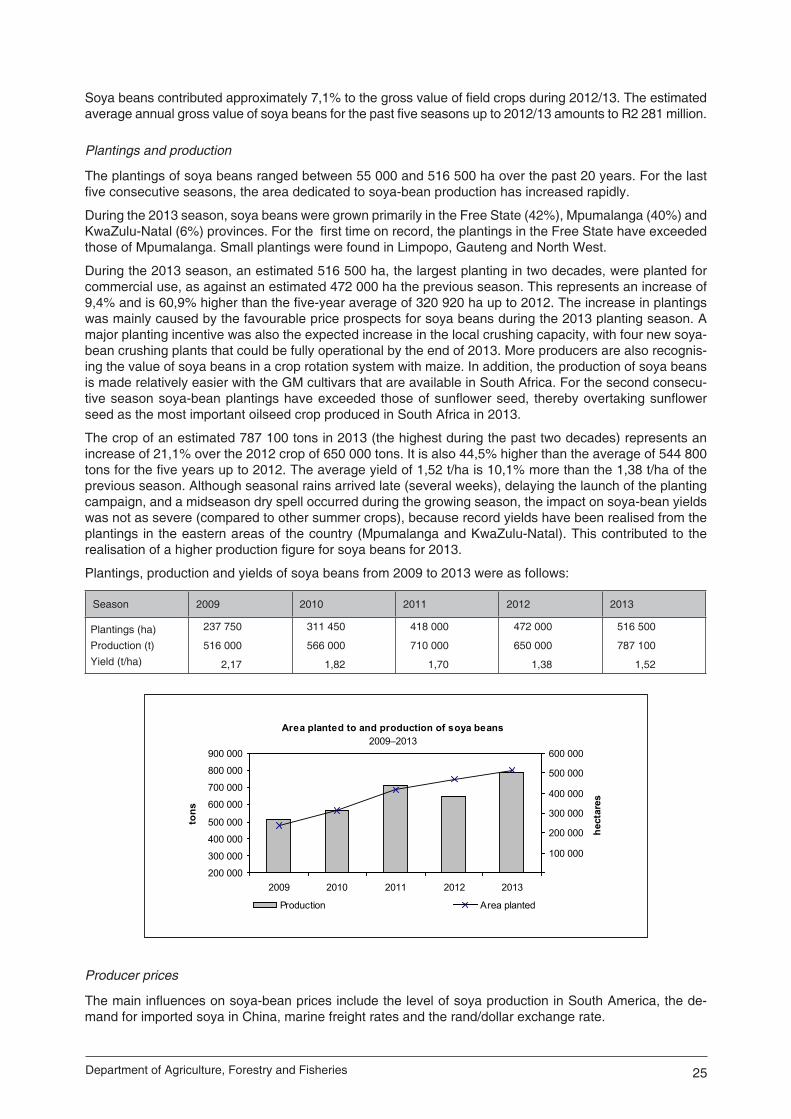
The plantings of soya beans ranged between 55 000 and 516 500 ha over the past 20 years. For the last five consecutive seasons, the area dedicated to soya-bean production has increased rapidly.
During the 2013 season, soya beans were grown primarily in the Free State (42%), Mpumalanga (40%) and KwaZulu-Natal (6%) provinces. For the first time on record, the plantings in the Free State have exceeded those of Mpumalanga. Small plantings were found in Limpopo, Gauteng and North West.
During the 2013 season, an estimated 516 500 ha, the largest planting in two decades, were planted for commercial use, as against an estimated 472 000 ha the previous season. This represents an increase of 9,4% and is 60,9% higher than the five-year average of 320 920 ha up to 2012. The increase in plantings was mainly caused by the favourable price prospects for soya beans during the 2013 planting season. A major planting incentive was also the expected increase in the local crushing capacity, with four new soya-bean crushing plants that could be fully operational by the end of 2013. More producers are also recognis-ing the value of soya beans in a crop rotation system with maize. In addition, the production of soya beans is made relatively easier with the GM cultivars that are available in South Africa. For the second consecu-tive season soya-bean plantings have exceeded those of sunflower seed, thereby overtaking sunflower seed as the most important oilseed crop produced in South Africa in 2013.
The crop of an estimated 787 100 tons in 2013 (the highest during the past two decades) represents an increase of 21,1% over the 2012 crop of 650 000 tons. It is also 44,5% higher than the average of 544 800 tons for the five years up to 2012. The average yield of 1,52 t/ha is 10,1% more than the 1,38 t/ha of the previous season. Although seasonal rains arrived late (several weeks), delaying the launch of the planting campaign, and a midseason dry spell occurred during the growing season, the impact on soya-bean yields was not as severe (compared to other summer crops), because record yields have been realised from the plantings in the eastern areas of the country (Mpumalanga and KwaZulu-Natal). This contributed to the realisation of a higher production figure for soya beans for 2013.
Plantings, production and yields of soya beans from 2009 to 2013 were as follows:
Season 2009 2010 2011 2012 2013
Plantings (ha)Production (t)Yield (t/ha)
237 750
516 000
2,17
311 450
566 000
1,82
418 000
710 000
1,70
472 000
650 000
1,38
516 500
787 100
1,52
Area planted to and production of soya beans2009–2013
200 000
300 000
400 000
500 000
600 000
700 000
800 000
900 000
2009 2010 2011 2012 2013
tons
100 000
200 000
300 000
400 000
500 000
600 000
hect
ares
Production Area planted
Producer prices
The main influences on soya-bean prices include the level of soya production in South America, the de-mand for imported soya in China, marine freight rates and the rand/dollar exchange rate.

26 Trends in the Agricultural Sector 2013
Commercial consumption of soya beans2009–2013
100200300400500600700800900
2009 2010 2011 2012 2013
'000
tons
Human consumption Full-fat soya Crushed for oil and oilcake
The average local producer price of soya beans for 2013 is approximately R4 672/ton, which is 26,8% higher than the price for 2012. The increase can be attributed to a rise in international prices, directed mainly by the drought conditions prevailing in the United States that impacted negatively on soya-bean yields, combined with a steady growth in imports, by especially China.
The average producer prices of soya beans from 2009 to 2013 are as follows:
Year 2009 2010 2011 2012 2013
R/ton
Producer price 3 187 2 528 3 177 3 684 4 672
Consumption
An estimated total of 964 000 tons of soya beans are available for utilisation during the 2013 marketing season (January to December). It comprises carry-over stocks on 1 January 2013 amounting to 175 900 tons, the estimated production of 787 100 tons and projected imports of 1 000 tons.
In South Africa, soya beans are mainly used for animal feed. The local commercial consumption of soya beans for 2013 is projected at 834 000 tons—165 000 tons for feed (full-fat soya), 600 000 tons for oil and oilcake and 28 000 tons for human consumption. Onfarm consumption is estimated at 41 000 tons.
The projected exports during 2013 are 30 000 tons. Carry-over stocks on 31 December 2013 are expected to be approximately 100 000 tons.
The following graph illustrates the commercial consumption of soya beans:
Trade
During the first six months of 2013, South African exports of soya beans were mainly to Malaysia, followed by Angola and the Democratic Republic of Congo.
The imports and exports of soya beans from 2009 to 2013 are as follows:
Year 2009 2010 2011 2012 2013*
Tons
ImportsExports
1 400
155 600
2 300
121 300
300
42 800
300
157 500
1 000
30 000
*Projected
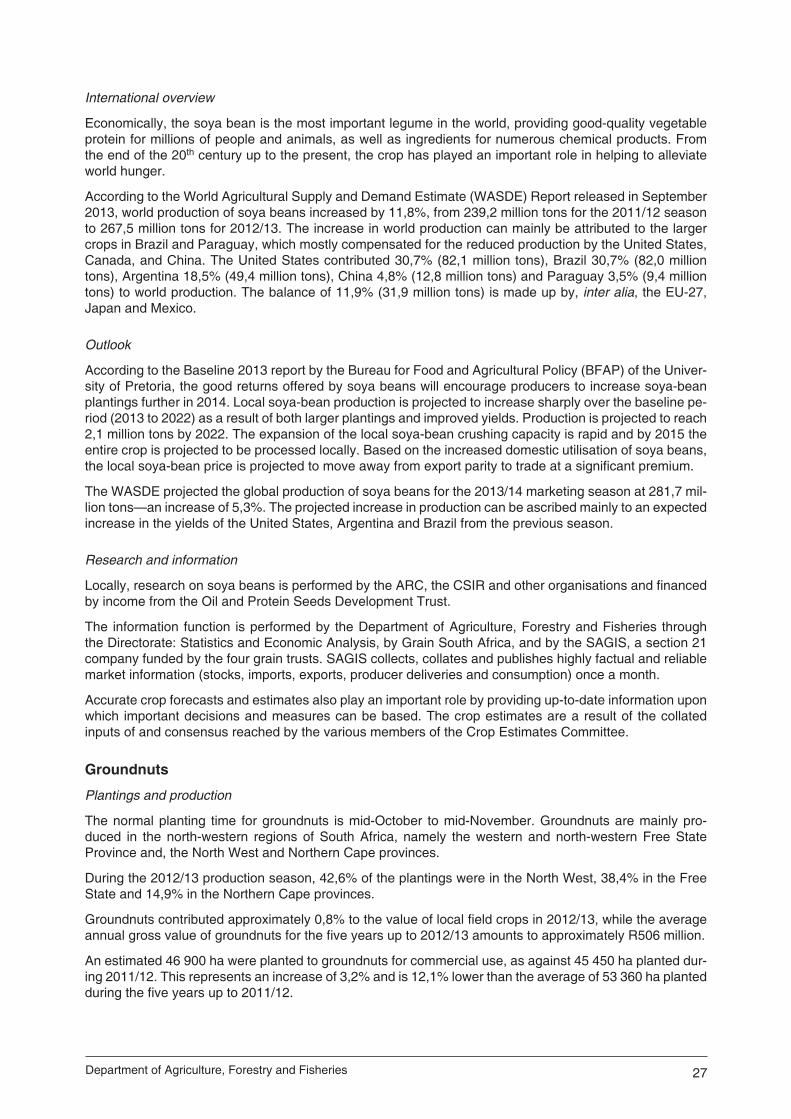
27Department of Agriculture, Forestry and Fisheries
International overview
Economically, the soya bean is the most important legume in the world, providing good-quality vegetable protein for millions of people and animals, as well as ingredients for numerous chemical products. From the end of the 20th century up to the present, the crop has played an important role in helping to alleviate world hunger.
According to the World Agricultural Supply and Demand Estimate (WASDE) Report released in September 2013, world production of soya beans increased by 11,8%, from 239,2 million tons for the 2011/12 season to 267,5 million tons for 2012/13. The increase in world production can mainly be attributed to the larger crops in Brazil and Paraguay, which mostly compensated for the reduced production by the United States, Canada, and China. The United States contributed 30,7% (82,1 million tons), Brazil 30,7% (82,0 million tons), Argentina 18,5% (49,4 million tons), China 4,8% (12,8 million tons) and Paraguay 3,5% (9,4 million tons) to world production. The balance of 11,9% (31,9 million tons) is made up by, inter alia, the EU-27, Japan and Mexico.
Outlook
According to the Baseline 2013 report by the Bureau for Food and Agricultural Policy (BFAP) of the Univer-sity of Pretoria, the good returns offered by soya beans will encourage producers to increase soya-bean plantings further in 2014. Local soya-bean production is projected to increase sharply over the baseline pe-riod (2013 to 2022) as a result of both larger plantings and improved yields. Production is projected to reach 2,1 million tons by 2022. The expansion of the local soya-bean crushing capacity is rapid and by 2015 the entire crop is projected to be processed locally. Based on the increased domestic utilisation of soya beans, the local soya-bean price is projected to move away from export parity to trade at a significant premium.
The WASDE projected the global production of soya beans for the 2013/14 marketing season at 281,7 mil-lion tons—an increase of 5,3%. The projected increase in production can be ascribed mainly to an expected increase in the yields of the United States, Argentina and Brazil from the previous season.
Research and information
Locally, research on soya beans is performed by the ARC, the CSIR and other organisations and financed by income from the Oil and Protein Seeds Development Trust.
The information function is performed by the Department of Agriculture, Forestry and Fisheries through the Directorate: Statistics and Economic Analysis, by Grain South Africa, and by the SAGIS, a section 21 company funded by the four grain trusts. SAGIS collects, collates and publishes highly factual and reliable market information (stocks, imports, exports, producer deliveries and consumption) once a month.
Accurate crop forecasts and estimates also play an important role by providing up-to-date information upon which important decisions and measures can be based. The crop estimates are a result of the collated inputs of and consensus reached by the various members of the Crop Estimates Committee.
Groundnuts
Plantings and production
The normal planting time for groundnuts is mid-October to mid-November. Groundnuts are mainly pro-duced in the north-western regions of South Africa, namely the western and north-western Free State Province and, the North West and Northern Cape provinces.
During the 2012/13 production season, 42,6% of the plantings were in the North West, 38,4% in the Free State and 14,9% in the Northern Cape provinces.
Groundnuts contributed approximately 0,8% to the value of local field crops in 2012/13, while the average annual gross value of groundnuts for the five years up to 2012/13 amounts to approximately R506 million.
An estimated 46 900 ha were planted to groundnuts for commercial use, as against 45 450 ha planted dur-ing 2011/12. This represents an increase of 3,2% and is 12,1% lower than the average of 53 360 ha planted during the five years up to 2011/12.

28 Trends in the Agricultural Sector 2013
Groundnut production in South Africa is in constant decline, because the industry is regarded as highly labour intensive and the high labour costs have forced many producers to change to the production of other crops.
An estimated commercial crop of 41 500 tons of groundnuts was produced during 2012/13. This represents a decrease of 29,7% from the 2011/12 crop of 59 000 tons. The 2012/13 crop is 48,1% lower than the five-year average of 79 910 tons up to 2011/12. The average yield for 2012/13 was 0,88 t/ha, which is 32,3% less than the 1,30 t/ha of the previous season and 40,9% less than the five-year average of 1,50 t/ha up to 2011/12.
Plantings, production and the yield of groundnuts from 2008/09 to 2012/13 were as follows:
Season 2008/09 2009/10 2010/11 2011/12 2012/13
Plantings (ha)
Production (t)
Yield (t/ha)
54 550
99 500
1,82
57 450
88 000
1,53
55 150
64 250
1,17
45 450
59 000
1,30
46 900
41 500
0,88
Producer prices
Groundnuts are traditionally an export commodity and local prices are determined mainly by export parity. Major export destinations for South African groundnuts are Germany, the Netherlands, Japan and Mexico.
The average producer prices of groundnuts from 2008/09 to 2012/13 were as follows:
Season 2008/09 2009/10 2010/11 2011/12 2012/13*
R/ton
Producer price 6 361 4 660 5 201 8 287 8 764
*Preliminary
The average producer price for groundnuts shows an increase of 5,8%, from R8 287/ton in 2011/12 to R8 764/ton in 2012/13. The increase can mainly be attributed to an increase in international prices, directed mainly by the progressive tightening in global supplies.
Trade balance
The SA Groundnut Forum has requested all role players to comply with legally prescribed standards for permissible levels of chemical residue on groundnuts destined for export in order to maintain the market share of South African groundnuts, especially in the European Union and Japan. These regulations are based on the principle of critical good agricultural practices (CGAP).
20 000
40 000
60 000
80 000
100 000
120 000
20 000
40 000
60 000
80 000
100 000
120 000
2008/09 2009/10 2010/11 2011/12 2012/13
Hect
ares
Tons
Season
Area planted to and production of groundnuts2008/09–2012/13
Production Area planted
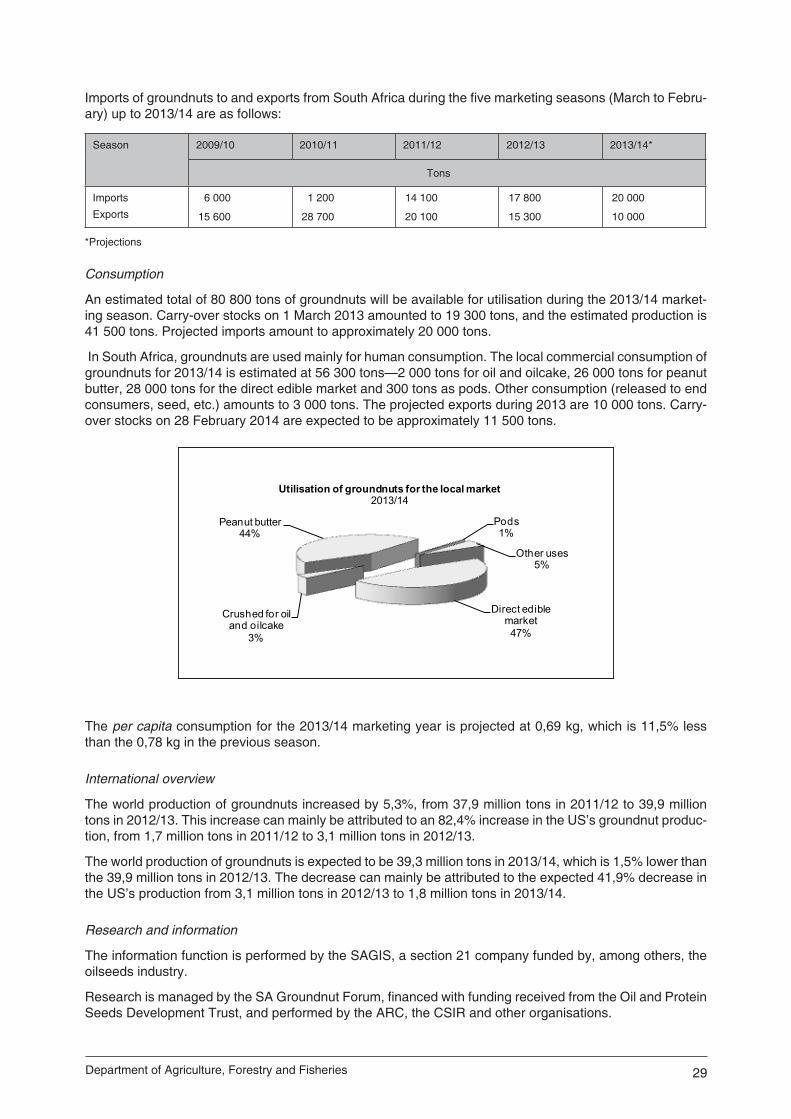
29Department of Agriculture, Forestry and Fisheries
Direct edible market47%
Crushed for oil and oilcake
3%
Peanut butter44%
Pods1%
Other uses5%
Utilisation of groundnuts for the local market2013/14
Imports of groundnuts to and exports from South Africa during the five marketing seasons (March to Febru-ary) up to 2013/14 are as follows:
Season 2009/10 2010/11 2011/12 2012/13 2013/14*
Tons
Imports
Exports
6 000
15 600
1 200
28 700
14 100
20 100
17 800
15 300
20 000
10 000
*Projections
Consumption
An estimated total of 80 800 tons of groundnuts will be available for utilisation during the 2013/14 market-ing season. Carry-over stocks on 1 March 2013 amounted to 19 300 tons, and the estimated production is 41 500 tons. Projected imports amount to approximately 20 000 tons.
In South Africa, groundnuts are used mainly for human consumption. The local commercial consumption of groundnuts for 2013/14 is estimated at 56 300 tons—2 000 tons for oil and oilcake, 26 000 tons for peanut butter, 28 000 tons for the direct edible market and 300 tons as pods. Other consumption (released to end consumers, seed, etc.) amounts to 3 000 tons. The projected exports during 2013 are 10 000 tons. Carry-over stocks on 28 February 2014 are expected to be approximately 11 500 tons.
The per capita consumption for the 2013/14 marketing year is projected at 0,69 kg, which is 11,5% less than the 0,78 kg in the previous season.
International overview
The world production of groundnuts increased by 5,3%, from 37,9 million tons in 2011/12 to 39,9 million tons in 2012/13. This increase can mainly be attributed to an 82,4% increase in the US’s groundnut produc-tion, from 1,7 million tons in 2011/12 to 3,1 million tons in 2012/13.
The world production of groundnuts is expected to be 39,3 million tons in 2013/14, which is 1,5% lower than the 39,9 million tons in 2012/13. The decrease can mainly be attributed to the expected 41,9% decrease in the US’s production from 3,1 million tons in 2012/13 to 1,8 million tons in 2013/14.
Research and information
The information function is performed by the SAGIS, a section 21 company funded by, among others, the oilseeds industry.
Research is managed by the SA Groundnut Forum, financed with funding received from the Oil and Protein Seeds Development Trust, and performed by the ARC, the CSIR and other organisations.

30 Trends in the Agricultural Sector 2013
Canola: Area planted and production2009–2013
0
20 000
40 000
60 000
80 000
100 000
120 000
2009 2010 2011 2012 2013
Tons
0
20 000
40 000
60 000
80 000
100 000H
ecta
res
Production Area planted
Canola
Canola, which is an oilseed crop, is a relatively new one in South Africa. During 1992, 30 producers started growing canola on a commercial scale and a total of approximately 500 tons of canola were produced on 400 ha. Today, the area planted to canola is approximately 72 000 ha. With biofuel blending regulations coming into effect in 2015, it is expected that by 2020, canola could be grown on between 125 000 ha and 200 000 ha in the Western Cape Province alone.
About 99% of the canola crop in South Africa is produced in the Western Cape Province, particularly in the Southern Cape. Over time, there were also farmers in other areas of South Africa, such as the Northern Cape, Free State, Eastern Cape, KwaZulu-Natal, Limpopo and North West provinces, who started to plant small quantities of canola.
Plantings and production
While the estimated area planted to canola increased by 63,6%, from 44 100 ha in 2012 to 72 165 ha in 2013, production was expected (November 2013) to increase by 33,3%, from 79 541 tons to 108 441 tons. The crop’s rapid growth can be attributed to favourable prices as well as higher yields obtained during the past two seasons.
The expected average yield of 1,50 t/ha was the second highest ever recorded for the Western Cape.
Estimated plantings, production and yields of canola from 2009 to 2013 were as follows:
Season 2009 2010 2011 2012 2013
Plantings (ha)Production (t)Yield (t/ha)
35 060
40 350
1,15
34 820
36 900
1,06
43 510
58 800
1,35
44 100
79 541
1,80
72 165
108 441
1,50
The areas planted to and production of canola are depicted in the following graph:
The planting of canola as an alternative to small grain crops has become an important part of crop rota-tion practices in the Western Cape Province. It is particularly the herbicide-resistant cultivars that make it possible for canola to be included in crop rotation systems with wheat in many regions. In such crop rota-tion systems, canola usually causes an increase in the yields of the subsequent crops. Where wheat was planted after canola, increases of up to 25% in yields have been observed. One of the reasons for this is the deep taproot system of canola, which acts as a ‘’biological plough’’ to facilitate root penetration for the crop planted after canola. This then improves infiltration of rain water and reduces water runoff and surface erosion. In addition, canola has a bio-fumigation effect on the soil, which reduces the manifestation of pests and diseases in the soil. Just prior to harvest time, the canola plants drop a large volume of plant material that assists with the bio-fumigation but also returns a considerable quantity of nutrients and organic mate-rial to the soil.

31Department of Agriculture, Forestry and Fisheries
Consumption
Canola is primarily used for the manufacturing of canola oil and oilcake. On the local market, canola com-petes with other oilseeds such as sunflower seed and soya beans. The market for soft oils (oils that are liquid at room temperature), including canola oil, is a huge one and applications for this market are typically bottled oil for household use, soft margarine, mayonnaise, salad oil and various industrial uses.
Canola refers to a cultivar of either rapeseed or field mustard. The unique fatty acid composition of canola oil makes it a healthy choice for human nutrition. Canola oil contains less saturated fat than the other fre-quently used plant oils, which makes it effective in lowering cholesterol levels. It also has a higher omega-3 fatty acid content than do the other oils. Omega-3 fatty acids are important for general health and have been proven to inhibit the development of cancer. It is therefore expected that the household consumption of canola will continue to increase. Canola, especially the oilcake part, is also a good source of protein in animal feed.
Altogether 86 440 tons of canola were available for local consumption during the 2012/13 marketing sea-son (October to September). This comprised carry-over stocks as at 1 October 2012 amounting to 6 900 tons and domestic production of 79 540 tons. There were no canola imports or exports. The total demand for canola for the 2012/13 marketing season was approximately 73 940 tons, while carry-out stocks on 30 September 2013 were expected to be approximately 12 500 tons.
For the 2013/14 marketing season, the total supply of canola is estimated at 121 000 tons (the estimated canola crop of 108 441 tons, together with carry-over stocks of 12 500 tons). The domestic demand for canola was expected to be 74 160 tons, therefore carry-out stocks at the end of September 2014 were expected to come to 46 781 tons. No exports or imports were expected during the season.
Prices
As a large percentage of the local demand for vegetable oil is imported, the international oilseed prices large-ly determine the local prices of oilseeds, and therefore the price of soya-bean oilcake. The price of canola, again, is based on the local price of sunflower oil and soya-bean oilcake. Prices paid to producers vary, de-pending on the protein content and whether it is delivered for the feed market or meant to be crushed for oil.
The average producer prices of canola from 2008/09 to 2012/13 were as follows:
Season 2008/09 2009/10 2010/11 2011/12 2012/13
R/ton
Producer price 3 100,00 2 800,00 3 182,04 3 449,94 4 579,50
The average producer price of canola increased by 32,7%, from R3 449,94/ton in 2011/12 to R4 579,50/ton in 2012/13. It is evident that the canola industry has been experiencing an upward trend in producer prices for the past couple of years.
International overview
Global canola production has grown rapidly over the past 40+ years, rising from the sixth largest oil crop to the second largest. It is expected that canola production will contribute 13,4% of world oil crop production during 2013/14, as against the 56,9% of soya-bean production, the largest oil crop.
According to the USDA-Foreign Agricultural Service in September 2013, world production of canola in-creased by 5,7%, from 62,9 million tons for the 2012/13 marketing season to 66,5 million tons for 2013/14. The European Union (EU) contributed 31,1% (20,7 million tons), Canada 22,8% (15,2 million tons), China 21,4% (14,2 million tons) and India 10,5% (7,0 million tons) to world production.
Unlike the United States of America, the majority of European cars and trucks run on diesel. As a result, the EU biofuels initiatives are primarily aimed at the production of biodiesel. Higher greenhouse gas reductions from biodiesel production, as against ethanol production, also favour this approach.
The EU, China and Japan are the primary importers (67,7%) of canola seed, while Canada accounts for more than half of canola seed exports (59,2%). Canadian producers continue to expand their canola plant-ings and production. Demand prospects for canola seed look promising because of an increase in the use of vegetable oils in China and India, as well as canola-oil-based biodiesel use in the EU.
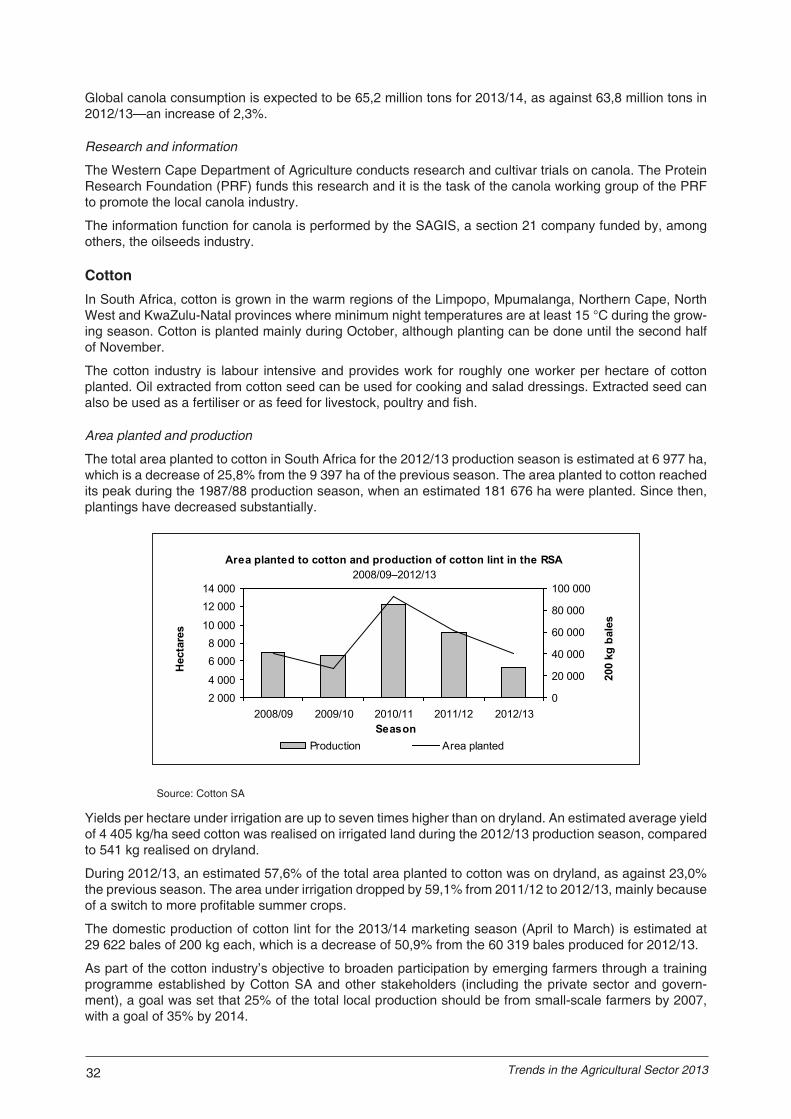
32 Trends in the Agricultural Sector 2013
Global canola consumption is expected to be 65,2 million tons for 2013/14, as against 63,8 million tons in 2012/13—an increase of 2,3%.
Research and information
The Western Cape Department of Agriculture conducts research and cultivar trials on canola. The Protein Research Foundation (PRF) funds this research and it is the task of the canola working group of the PRF to promote the local canola industry.
The information function for canola is performed by the SAGIS, a section 21 company funded by, among others, the oilseeds industry.
CottonIn South Africa, cotton is grown in the warm regions of the Limpopo, Mpumalanga, Northern Cape, North West and KwaZulu-Natal provinces where minimum night temperatures are at least 15 °C during the grow-ing season. Cotton is planted mainly during October, although planting can be done until the second half of November.
The cotton industry is labour intensive and provides work for roughly one worker per hectare of cotton planted. Oil extracted from cotton seed can be used for cooking and salad dressings. Extracted seed can also be used as a fertiliser or as feed for livestock, poultry and fish.
Area planted and production
The total area planted to cotton in South Africa for the 2012/13 production season is estimated at 6 977 ha, which is a decrease of 25,8% from the 9 397 ha of the previous season. The area planted to cotton reached its peak during the 1987/88 production season, when an estimated 181 676 ha were planted. Since then, plantings have decreased substantially.
Area planted to cotton and production of cotton lint in the RSA2008/09–2012/13
2 0004 000
6 0008 000
10 000
12 00014 000
2008/09 2009/10 2010/11 2011/12 2012/13Season
Hec
tare
s
0
20 000
40 000
60 000
80 000
100 000
200
kg b
ales
Production Area planted
Source: Cotton SA
Yields per hectare under irrigation are up to seven times higher than on dryland. An estimated average yield of 4 405 kg/ha seed cotton was realised on irrigated land during the 2012/13 production season, compared to 541 kg realised on dryland.
During 2012/13, an estimated 57,6% of the total area planted to cotton was on dryland, as against 23,0% the previous season. The area under irrigation dropped by 59,1% from 2011/12 to 2012/13, mainly because of a switch to more profitable summer crops.
The domestic production of cotton lint for the 2013/14 marketing season (April to March) is estimated at 29 622 bales of 200 kg each, which is a decrease of 50,9% from the 60 319 bales produced for 2012/13.
As part of the cotton industry’s objective to broaden participation by emerging farmers through a training programme established by Cotton SA and other stakeholders (including the private sector and govern-ment), a goal was set that 25% of the total local production should be from small-scale farmers by 2007, with a goal of 35% by 2014.

33Department of Agriculture, Forestry and Fisheries
Areas planted to cotton and the production of cotton lint for the 2008/09 to 2012/13 production seasons by the RSA and Swaziland compare as follows:
RSA
Production season 2008/09 2009/10 2010/11 2011/12 2012/13*
Total RSA plantings (ha)
Dryland (ha)
Irrigation (ha)Production of cotton lint (200 kg bales) from RSA-grown cotton
6 814
1 965
4 849
45 385
5 111
960
4 151
38 470
13 145
1 505
11 640
85 746
9 397
2 166
7 231
60 319
6 977
4 021
2 956
29 622
SwAzilAnd
Production season 2008/09 2009/10 2010/11 2011/12 2012/13*
Total Swaziland plantings (ha)
Dryland (ha)
Irrigation (ha)Production of cotton lint (200 kg bales) from RSA-grown cotton
3 000
3 000
0
2 850
3 900
3 900
0
3 150
4 000
4 000
0
4 000
3 600
3 600
0
4 000
3 600
3 600
0
3 500
* Estimates (August 2013)
Source: Cotton SA
World cotton production for 2013/14 is forecast by the International Cotton Advisory Committee (ICAC) to reach 25,6 million tons, down 3,5% from the previous season and 2,3 million tons below the record produc-tion of 2011/12. The ICAC expects production in China and Uzbekistan to remain more or less unchanged from the previous season, with small increases expected in India, Pakistan and Brazil. The US is respon-sible for most of the decline in world production in 2013/14, with production expected to drop by 25% or 900 000 tons, mainly because of competition from maize and soya beans. The ICAC only expects a moder-ate increase of about 1% in world cotton mill use in 2013/14.
Prices
The average producer price for seed cotton (lint and seed derived from the boll of the cotton plant before it is ginned) for the 2012/13 marketing season (April to March) was 509 c/kg, while the price for 2013/14 is estimated at 480 c/kg—a decrease of 5,7%. In South Africa, the price of cotton normally emulates global price trends.
The average South African producer prices for seed cotton and cotton lint compare as follows:
Marketing year 2009/10 2010/11 2011/12 2012/13 2013/14*
c/kg
Seed cottonCotton lint
350
1 120
435
1 204
453
1 364
509
1 508
480
1 500
*Estimates
Consumption
Consumption of cotton lint by RSA and Swaziland spinners for the 2013/14 marketing year is estimated at 105 000 bales of 200 kg, compared to the 94 855 bales of the 2012/13 year—an increase of 10,7%.
During the 2012/123 marketing year, about 43,3% of the consumed cotton lint was imported from the SADC countries, which represented 87,5% of all the cotton imported. The two major suppliers were Zambia and Zimbabwe. Cotton lint exports for the 2012/13 season amounted to 11 176 tons.
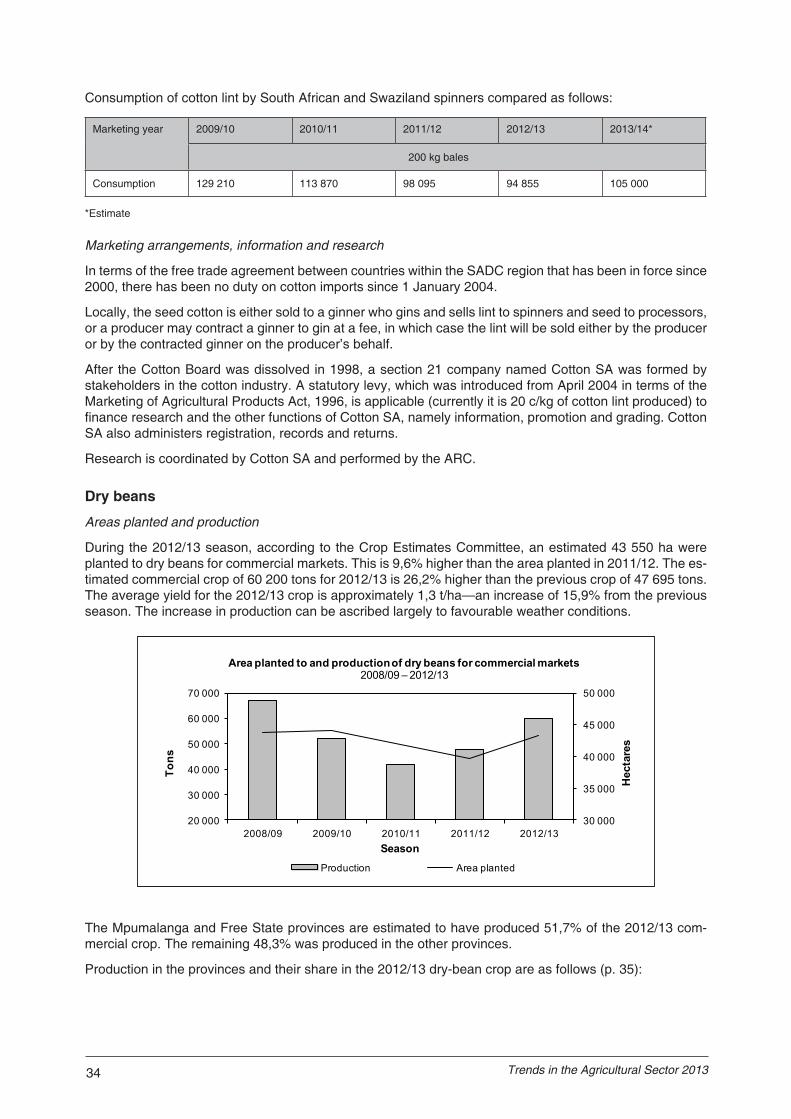
34 Trends in the Agricultural Sector 2013
Consumption of cotton lint by South African and Swaziland spinners compared as follows:
Marketing year 2009/10 2010/11 2011/12 2012/13 2013/14*
200 kg bales
Consumption 129 210 113 870 98 095 94 855 105 000
*Estimate
Marketing arrangements, information and research
In terms of the free trade agreement between countries within the SADC region that has been in force since 2000, there has been no duty on cotton imports since 1 January 2004.
Locally, the seed cotton is either sold to a ginner who gins and sells lint to spinners and seed to processors, or a producer may contract a ginner to gin at a fee, in which case the lint will be sold either by the producer or by the contracted ginner on the producer’s behalf.
After the Cotton Board was dissolved in 1998, a section 21 company named Cotton SA was formed by stakeholders in the cotton industry. A statutory levy, which was introduced from April 2004 in terms of the Marketing of Agricultural Products Act, 1996, is applicable (currently it is 20 c/kg of cotton lint produced) to finance research and the other functions of Cotton SA, namely information, promotion and grading. Cotton SA also administers registration, records and returns.
Research is coordinated by Cotton SA and performed by the ARC.
Dry beans
Areas planted and production
During the 2012/13 season, according to the Crop Estimates Committee, an estimated 43 550 ha were planted to dry beans for commercial markets. This is 9,6% higher than the area planted in 2011/12. The es-timated commercial crop of 60 200 tons for 2012/13 is 26,2% higher than the previous crop of 47 695 tons. The average yield for the 2012/13 crop is approximately 1,3 t/ha—an increase of 15,9% from the previous season. The increase in production can be ascribed largely to favourable weather conditions.
30 000
35 000
40 000
45 000
50 000
20 000
30 000
40 000
50 000
60 000
70 000
2008/09 2009/10 2010/11 2011/12 2012/13
Hec
tare
s
Tons
Season
Area planted to and production of dry beans for commercial markets2008/09 – 2012/13
Production Area planted
The Mpumalanga and Free State provinces are estimated to have produced 51,7% of the 2012/13 com-mercial crop. The remaining 48,3% was produced in the other provinces.
Production in the provinces and their share in the 2012/13 dry-bean crop are as follows (p. 35):

35Department of Agriculture, Forestry and Fisheries
20 000
60 000
100 000
140 000
180 000
2009/10 2010/11 2011/12 2012/13 2013/14
Tons
Marketing season
Production, imports and consumption of dry beans2009/10—2013/14
Production Imports Consumption
Province Production (t) Share in crop (%)
Mpumalanga
Free State
Gauteng
North West
KwaZulu-Natal
Limpopo
Western Cape
Eastern Cape
Northern Cape
11 900
19 200
3 400
4 800
7 800
10 800
400
200
1 700
19,8
31,9
5,6
8,0
13,0
17,9
0,7
0,3
2,8
Total 60 200 100,0
The estimated gross value of dry beans for the 2012/13 season amounts to R735 million, 41,5% higher than the previous season.
The contribution of different types of dry beans to total production in 2012/13 is estimated to be as follows: red speckled 77,3%, small white canning 21,0%, large white kidney 1,2% and the remainder other dry beans, mainly cariocas.
The most extensive seed production takes place in the Lowveld area of Mpumalanga, followed by the Lim-popo and Northern Cape provinces.
In an attempt to improve profitability for producers and to meet the increase in protein demand, cultivars that can yield up to 1,4 t/ha, as against 0,6 t/ha some 25 years ago, have been developed by the Dry Bean Producers’ Organisation in partnership with the ARC. These cultivars are suited to most soil types, have greater resistance to diseases and can be grown successfully in different areas. The average yield for dry-land production during the five years up to 2012/13 is 1,3 t/ha.
Consumption
An estimated 146 600 tons of dry beans were consumed locally during the 2013/14 marketing season (April to March). This represents a decrease of 4,3% from 2012/13. The estimated per capita consumption for 2013/14 is 2, 7 kg, which is 3,9% less than in 2012/13.
Because the local demand is substantially higher than local production, large quantities of dry beans are imported each year, mainly from China.
According to the Dry Bean Producers’ Organisation, the quantities of dry beans produced, imported and consumed from 2009/10 to 2013/14 were as follows (p. 36):
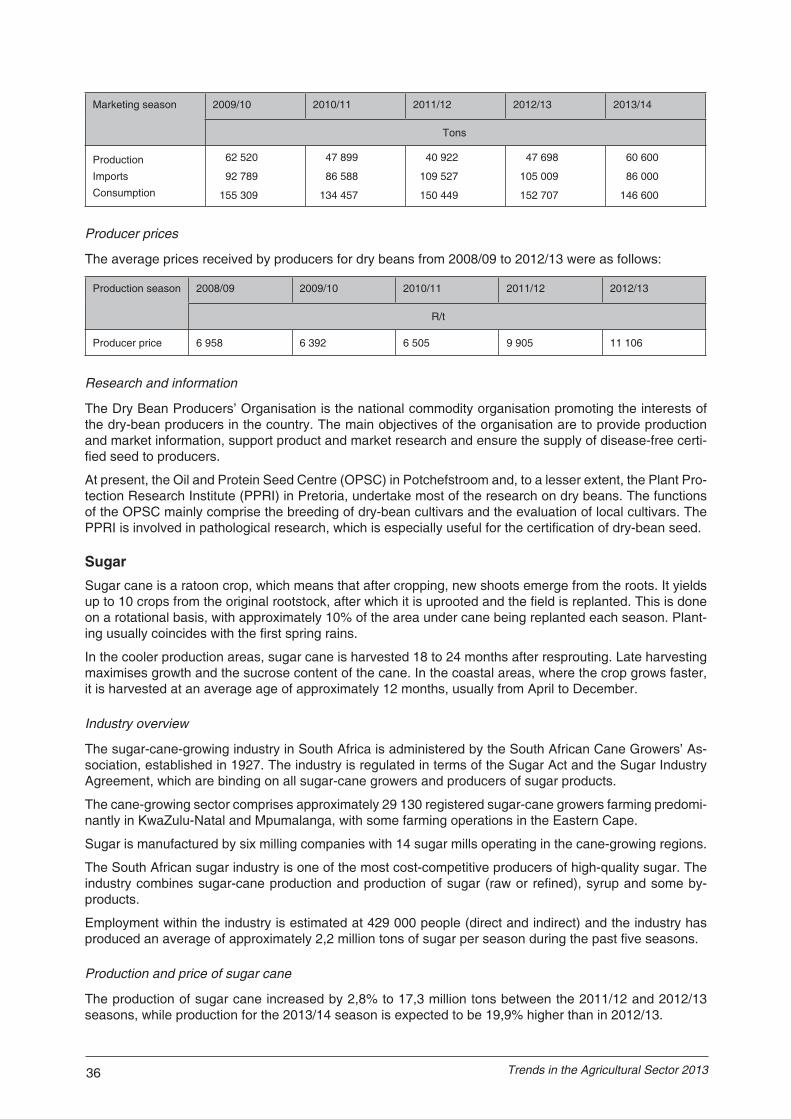
36 Trends in the Agricultural Sector 2013
Marketing season 2009/10 2010/11 2011/12 2012/13 2013/14
Tons
Production
Imports
Consumption
62 520
92 789
155 309
47 899
86 588
134 457
40 922
109 527
150 449
47 698
105 009
152 707
60 600
86 000
146 600
Producer prices
The average prices received by producers for dry beans from 2008/09 to 2012/13 were as follows:
Production season 2008/09 2009/10 2010/11 2011/12 2012/13
R/t
Producer price 6 958 6 392 6 505 9 905 11 106
Research and information
The Dry Bean Producers’ Organisation is the national commodity organisation promoting the interests of the dry-bean producers in the country. The main objectives of the organisation are to provide production and market information, support product and market research and ensure the supply of disease-free certi-fied seed to producers.
At present, the Oil and Protein Seed Centre (OPSC) in Potchefstroom and, to a lesser extent, the Plant Pro-tection Research Institute (PPRI) in Pretoria, undertake most of the research on dry beans. The functions of the OPSC mainly comprise the breeding of dry-bean cultivars and the evaluation of local cultivars. The PPRI is involved in pathological research, which is especially useful for the certification of dry-bean seed.
Sugar Sugar cane is a ratoon crop, which means that after cropping, new shoots emerge from the roots. It yields up to 10 crops from the original rootstock, after which it is uprooted and the field is replanted. This is done on a rotational basis, with approximately 10% of the area under cane being replanted each season. Plant-ing usually coincides with the first spring rains.
In the cooler production areas, sugar cane is harvested 18 to 24 months after resprouting. Late harvesting maximises growth and the sucrose content of the cane. In the coastal areas, where the crop grows faster, it is harvested at an average age of approximately 12 months, usually from April to December.
Industry overview
The sugar-cane-growing industry in South Africa is administered by the South African Cane Growers’ As-sociation, established in 1927. The industry is regulated in terms of the Sugar Act and the Sugar Industry Agreement, which are binding on all sugar-cane growers and producers of sugar products.
The cane-growing sector comprises approximately 29 130 registered sugar-cane growers farming predomi-nantly in KwaZulu-Natal and Mpumalanga, with some farming operations in the Eastern Cape.
Sugar is manufactured by six milling companies with 14 sugar mills operating in the cane-growing regions.
The South African sugar industry is one of the most cost-competitive producers of high-quality sugar. The industry combines sugar-cane production and production of sugar (raw or refined), syrup and some by-products.
Employment within the industry is estimated at 429 000 people (direct and indirect) and the industry has produced an average of approximately 2,2 million tons of sugar per season during the past five seasons.
Production and price of sugar cane
The production of sugar cane increased by 2,8% to 17,3 million tons between the 2011/12 and 2012/13 seasons, while production for the 2013/14 season is expected to be 19,9% higher than in 2012/13.
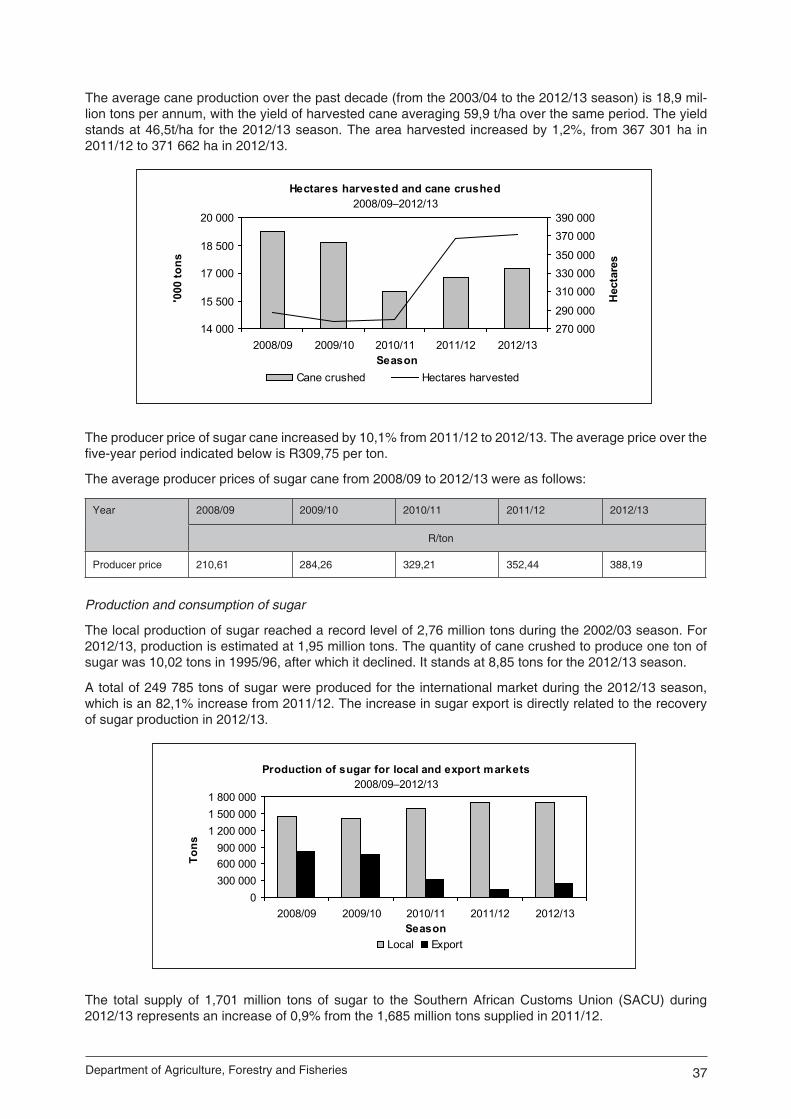
37Department of Agriculture, Forestry and Fisheries
The average cane production over the past decade (from the 2003/04 to the 2012/13 season) is 18,9 mil-lion tons per annum, with the yield of harvested cane averaging 59,9 t/ha over the same period. The yield stands at 46,5t/ha for the 2012/13 season. The area harvested increased by 1,2%, from 367 301 ha in 2011/12 to 371 662 ha in 2012/13.
Production of sugar for local and export markets2008/09–2012/13
0300 000600 000900 000
1 200 0001 500 0001 800 000
2008/09 2009/10 2010/11 2011/12 2012/13Season
Tons
Local Export
Hectares harvested and cane crushed2008/09–2012/13
14 000
15 500
17 000
18 500
20 000
2008/09 2009/10 2010/11 2011/12 2012/13Season
'000
tons
270 000290 000
310 000330 000350 000
370 000390 000
Hec
tare
s
Cane crushed Hectares harvested
The producer price of sugar cane increased by 10,1% from 2011/12 to 2012/13. The average price over the five-year period indicated below is R309,75 per ton.
The average producer prices of sugar cane from 2008/09 to 2012/13 were as follows:
Year 2008/09 2009/10 2010/11 2011/12 2012/13
R/ton
Producer price 210,61 284,26 329,21 352,44 388,19
Production and consumption of sugar
The local production of sugar reached a record level of 2,76 million tons during the 2002/03 season. For 2012/13, production is estimated at 1,95 million tons. The quantity of cane crushed to produce one ton of sugar was 10,02 tons in 1995/96, after which it declined. It stands at 8,85 tons for the 2012/13 season.
A total of 249 785 tons of sugar were produced for the international market during the 2012/13 season, which is an 82,1% increase from 2011/12. The increase in sugar export is directly related to the recovery of sugar production in 2012/13.
The total supply of 1,701 million tons of sugar to the Southern African Customs Union (SACU) during 2012/13 represents an increase of 0,9% from the 1,685 million tons supplied in 2011/12.
38 Trends in the Agricultural Sector 2013
The local production and sales of sugar to the SACU from 2008/09 to 2012/13 were as follows:
Year 2008/09 2009/10 2010/11 2011/12 2012/13
‘000 tons
ProductionSales to SACU
2 260
1 427
2 178
1 498
1 909
1 550
1 822
1 685
1 951
1 701
Marketing
Approximately 17% of the locally produced sugar is for the world market and is sold at prices below the domestic sugar price because of subsidy-induced production in some major sugar-producing countries. However, government supports the industry through interventions such as tariff protection and the Sugar Cooperation Agreement among SADC members. The raw sugar exports are handled at the Sugar Terminal in Durban.
The revenue from sugar sales during 2012/13 is estimated at approximately R5,1 billion, including foreign income estimated at R1 173 million.
Land reform
Inkezo, a land reform company initiated and developed by the cane growers and milling companies in the South African sugar industry, was established in 2004. Although Inkezo was initially funded by the indus-try, it operates as an independent land reform entity. The primary objective of the company is to promote sustainable agricultural land reform in support of the national transformation goals of effecting 30% black ownership of sugar-cane land by 2014. The initiative is aligned with the government objectives and initia-tives relating to land reform, also adding to numerous projects and initiatives being undertaken by individual milling companies as well as the Cane Growers’ Association.
Research, training and other information
In order to improve the quality of the cane produced and the profitability of cane production, the South African Sugar-cane Research Institute is tasked with developing new sugar-cane varieties and the im-provement of crop management and farming systems, which are then made available to cane farmers. The information includes improving soil quality, minimising the occurrence of pests and diseases, and research on the optimal choice in the use of fertilisers, water and ripening and weed control agents.
The quality of cane deliveries to the mills is determined by the Cane Testing Services, while Umthombo Agricultural Finance provides assistance for small-scale cane farmers with regard to credit and savings facilities.
HORTICULTURE
Deciduous fruit
Production areas
The main deciduous-fruit-producing areas of South Africa are situated in the Western and Eastern Cape provinces, mainly in areas where warm, dry summers and cold winters prevail. According to the HORT-GRO Tree Census of 2012, the area under deciduous fruit production during the 2012 season is estimated at 77 805 ha.
Production
There are approximately 1 786 pome and stone-fruit and dry and table-grape producers in South Africa. Fruit produced by them are utilised for fresh consumption as well as processing. Over the last decade, de-ciduous fruit experienced consolidation and integration into the value chain where producers not only grow fruit, but are also more involved in value adding (packaging) and marketing endeavours.
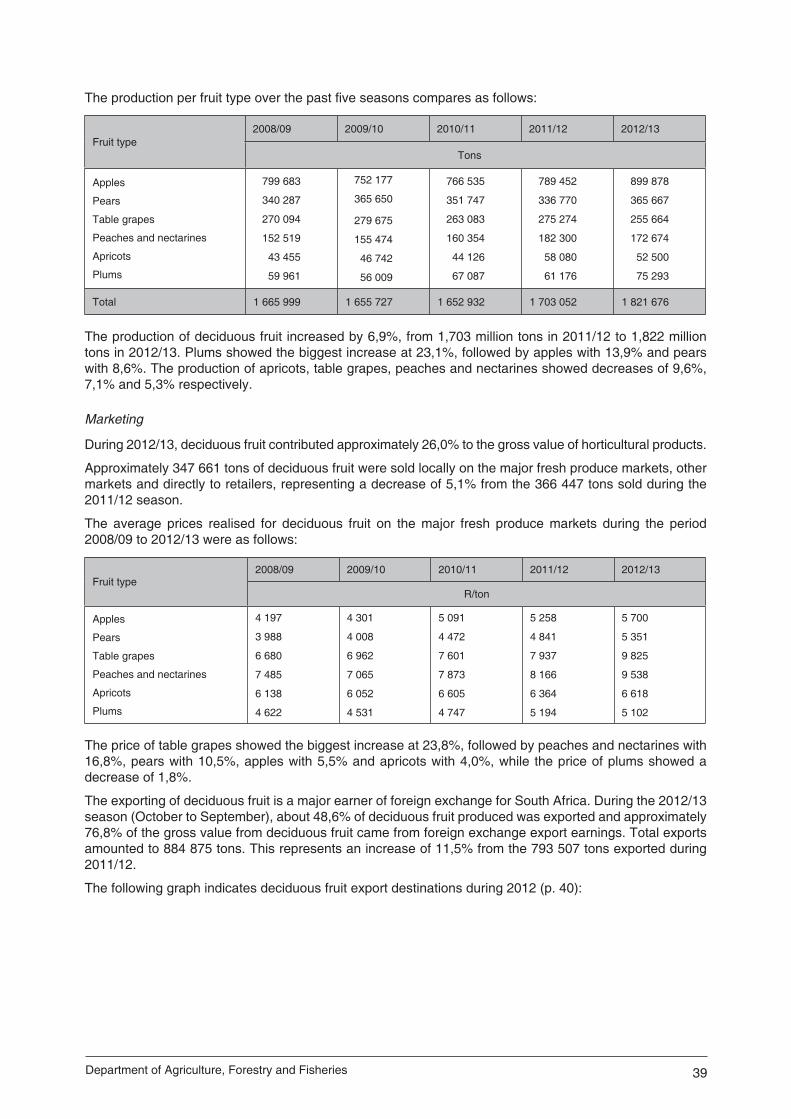
39Department of Agriculture, Forestry and Fisheries
The production per fruit type over the past five seasons compares as follows:
Fruit type2008/09 2009/10 2010/11 2011/12 2012/13
Tons
Apples
Pears
Table grapes
Peaches and nectarines
Apricots
Plums
799 683
340 287
270 094
152 519
43 455
59 961
752 177
365 650
279 675
155 474
46 742
56 009
766 535
351 747
263 083
160 354
44 126
67 087
789 452
336 770
275 274
182 300
58 080
61 176
899 878
365 667
255 664
172 674
52 500
75 293
Total 1 665 999 1 655 727 1 652 932 1 703 052 1 821 676
The production of deciduous fruit increased by 6,9%, from 1,703 million tons in 2011/12 to 1,822 million tons in 2012/13. Plums showed the biggest increase at 23,1%, followed by apples with 13,9% and pears with 8,6%. The production of apricots, table grapes, peaches and nectarines showed decreases of 9,6%, 7,1% and 5,3% respectively.
Marketing
During 2012/13, deciduous fruit contributed approximately 26,0% to the gross value of horticultural products.
Approximately 347 661 tons of deciduous fruit were sold locally on the major fresh produce markets, other markets and directly to retailers, representing a decrease of 5,1% from the 366 447 tons sold during the 2011/12 season.
The average prices realised for deciduous fruit on the major fresh produce markets during the period 2008/09 to 2012/13 were as follows:
Fruit type2008/09 2009/10 2010/11 2011/12 2012/13
R/ton
Apples
Pears
Table grapes
Peaches and nectarines
Apricots
Plums
4 197
3 988
6 680
7 485
6 138
4 622
4 301
4 008
6 962
7 065
6 052
4 531
5 091
4 472
7 601
7 873
6 605
4 747
5 258
4 841
7 937
8 166
6 364
5 194
5 700
5 351
9 825
9 538
6 618
5 102
The price of table grapes showed the biggest increase at 23,8%, followed by peaches and nectarines with 16,8%, pears with 10,5%, apples with 5,5% and apricots with 4,0%, while the price of plums showed a decrease of 1,8%.
The exporting of deciduous fruit is a major earner of foreign exchange for South Africa. During the 2012/13 season (October to September), about 48,6% of deciduous fruit produced was exported and approximately 76,8% of the gross value from deciduous fruit came from foreign exchange export earnings. Total exports amounted to 884 875 tons. This represents an increase of 11,5% from the 793 507 tons exported during 2011/12.
The following graph indicates deciduous fruit export destinations during 2012 (p. 40):
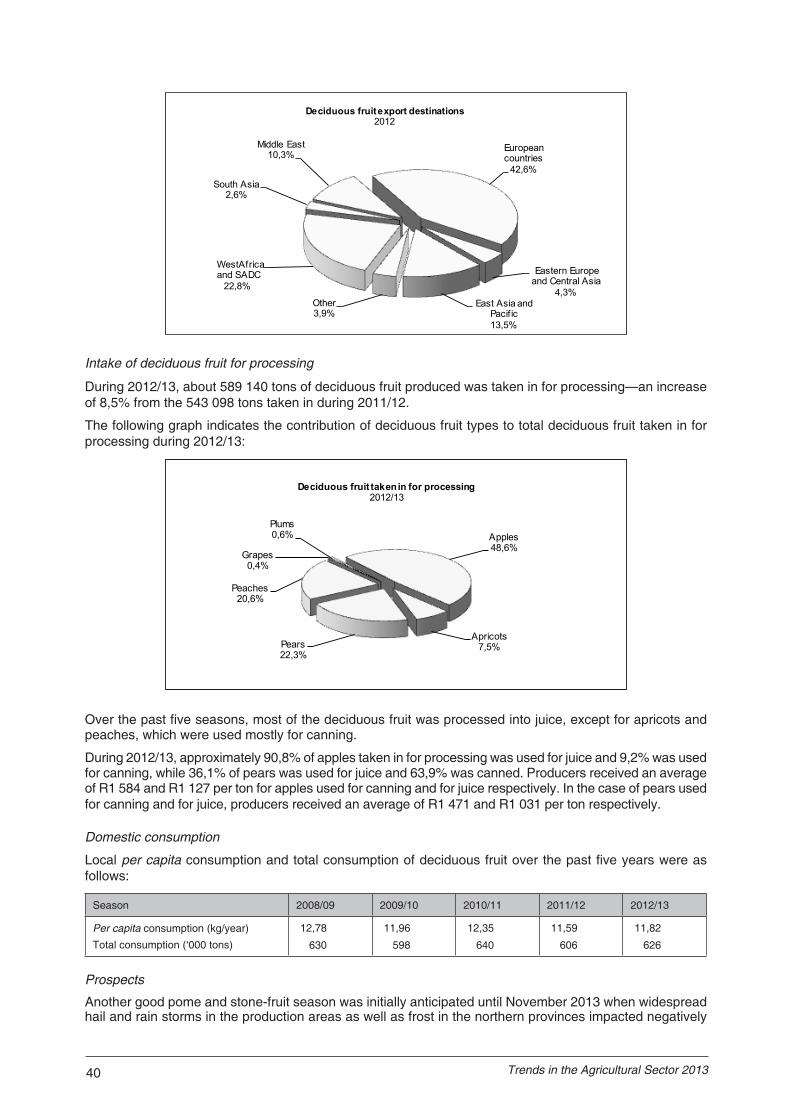
40 Trends in the Agricultural Sector 2013
Intake of deciduous fruit for processing
During 2012/13, about 589 140 tons of deciduous fruit produced was taken in for processing—an increase of 8,5% from the 543 098 tons taken in during 2011/12.
The following graph indicates the contribution of deciduous fruit types to total deciduous fruit taken in for processing during 2012/13:
European countries
42,6%
Eastern Europe and Central Asia
4,3%East Asia and
Pacif ic13,5%
Other3,9%
WestAfricaand SADC
22,8%
South Asia2,6%
Middle East10,3%
Deciduous fruit export destinations2012
Apples48,6%
Apricots7,5%Pears
22,3%
Peaches20,6%
Grapes 0,4%
Plums0,6%
Deciduous fruit taken in for processing2012/13
Over the past five seasons, most of the deciduous fruit was processed into juice, except for apricots and peaches, which were used mostly for canning.
During 2012/13, approximately 90,8% of apples taken in for processing was used for juice and 9,2% was used for canning, while 36,1% of pears was used for juice and 63,9% was canned. Producers received an average of R1 584 and R1 127 per ton for apples used for canning and for juice respectively. In the case of pears used for canning and for juice, producers received an average of R1 471 and R1 031 per ton respectively.
Domestic consumption
Local per capita consumption and total consumption of deciduous fruit over the past five years were as follows:
Season 2008/09 2009/10 2010/11 2011/12 2012/13
Per capita consumption (kg/year)
Total consumption (‘000 tons)
12,78
630
11,96
598
12,35
640
11,59
606
11,82
626
Prospects
Another good pome and stone-fruit season was initially anticipated until November 2013 when widespread hail and rain storms in the production areas as well as frost in the northern provinces impacted negatively
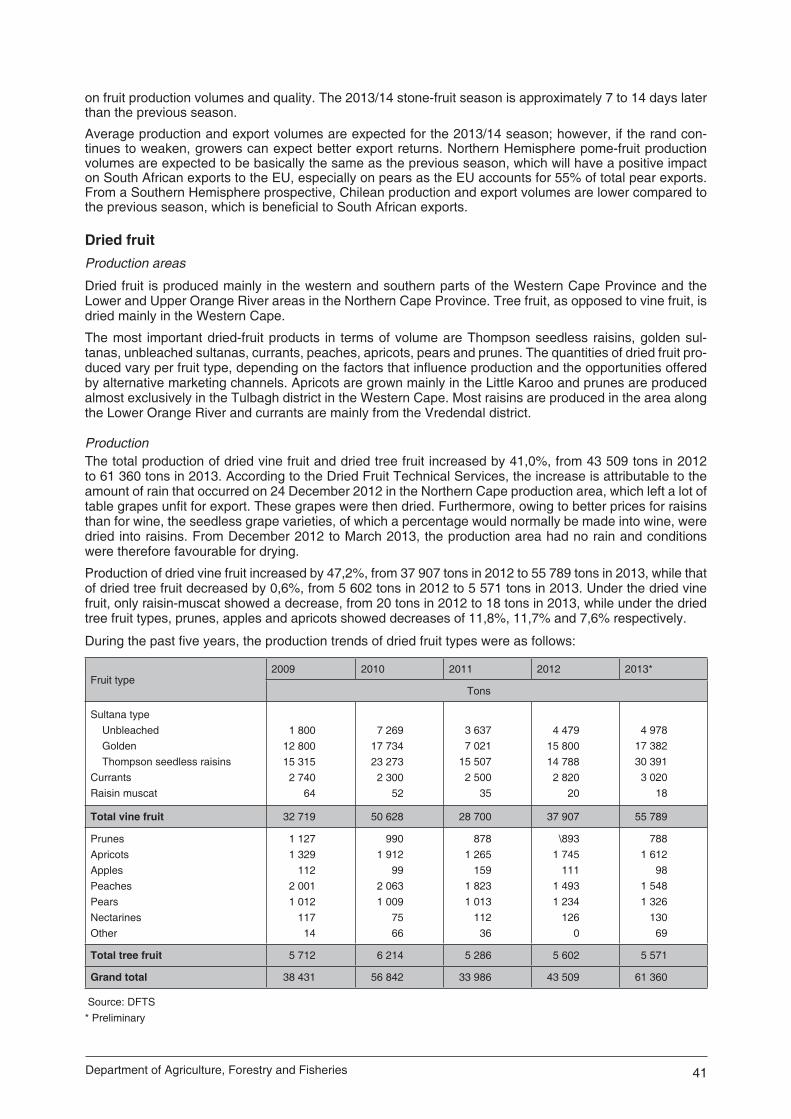
41Department of Agriculture, Forestry and Fisheries
on fruit production volumes and quality. The 2013/14 stone-fruit season is approximately 7 to 14 days later than the previous season.
Average production and export volumes are expected for the 2013/14 season; however, if the rand con-tinues to weaken, growers can expect better export returns. Northern Hemisphere pome-fruit production volumes are expected to be basically the same as the previous season, which will have a positive impact on South African exports to the EU, especially on pears as the EU accounts for 55% of total pear exports. From a Southern Hemisphere prospective, Chilean production and export volumes are lower compared to the previous season, which is beneficial to South African exports.
Dried fruitProduction areas
Dried fruit is produced mainly in the western and southern parts of the Western Cape Province and the Lower and Upper Orange River areas in the Northern Cape Province. Tree fruit, as opposed to vine fruit, is dried mainly in the Western Cape.
The most important dried-fruit products in terms of volume are Thompson seedless raisins, golden sul-tanas, unbleached sultanas, currants, peaches, apricots, pears and prunes. The quantities of dried fruit pro-duced vary per fruit type, depending on the factors that influence production and the opportunities offered by alternative marketing channels. Apricots are grown mainly in the Little Karoo and prunes are produced almost exclusively in the Tulbagh district in the Western Cape. Most raisins are produced in the area along the Lower Orange River and currants are mainly from the Vredendal district.
ProductionThe total production of dried vine fruit and dried tree fruit increased by 41,0%, from 43 509 tons in 2012 to 61 360 tons in 2013. According to the Dried Fruit Technical Services, the increase is attributable to the amount of rain that occurred on 24 December 2012 in the Northern Cape production area, which left a lot of table grapes unfit for export. These grapes were then dried. Furthermore, owing to better prices for raisins than for wine, the seedless grape varieties, of which a percentage would normally be made into wine, were dried into raisins. From December 2012 to March 2013, the production area had no rain and conditions were therefore favourable for drying.
Production of dried vine fruit increased by 47,2%, from 37 907 tons in 2012 to 55 789 tons in 2013, while that of dried tree fruit decreased by 0,6%, from 5 602 tons in 2012 to 5 571 tons in 2013. Under the dried vine fruit, only raisin-muscat showed a decrease, from 20 tons in 2012 to 18 tons in 2013, while under the dried tree fruit types, prunes, apples and apricots showed decreases of 11,8%, 11,7% and 7,6% respectively.
During the past five years, the production trends of dried fruit types were as follows:
Fruit type2009 2010 2011 2012 2013*
Tons
Sultana typeUnbleachedGolden Thompson seedless raisins
CurrantsRaisin muscat
1 80012 80015 3152 740
64
7 26917 73423 2732 300
52
3 6377 021
15 5072 500
35
4 47915 80014 7882 820
20
4 97817 38230 3913 020
18
Total vine fruit 32 719 50 628 28 700 37 907 55 789
PrunesApricotsApplesPeachesPearsNectarinesOther
1 1271 329
1122 0011 012
11714
9901 912
992 0631 009
7566
8781 265
1591 8231 013
11236
\8931 745
1111 4931 234
1260
7881 612
981 5481 326
13069
Total tree fruit 5 712 6 214 5 286 5 602 5 571
Grand total 38 431 56 842 33 986 43 509 61 360
Source: DFTS* Preliminary
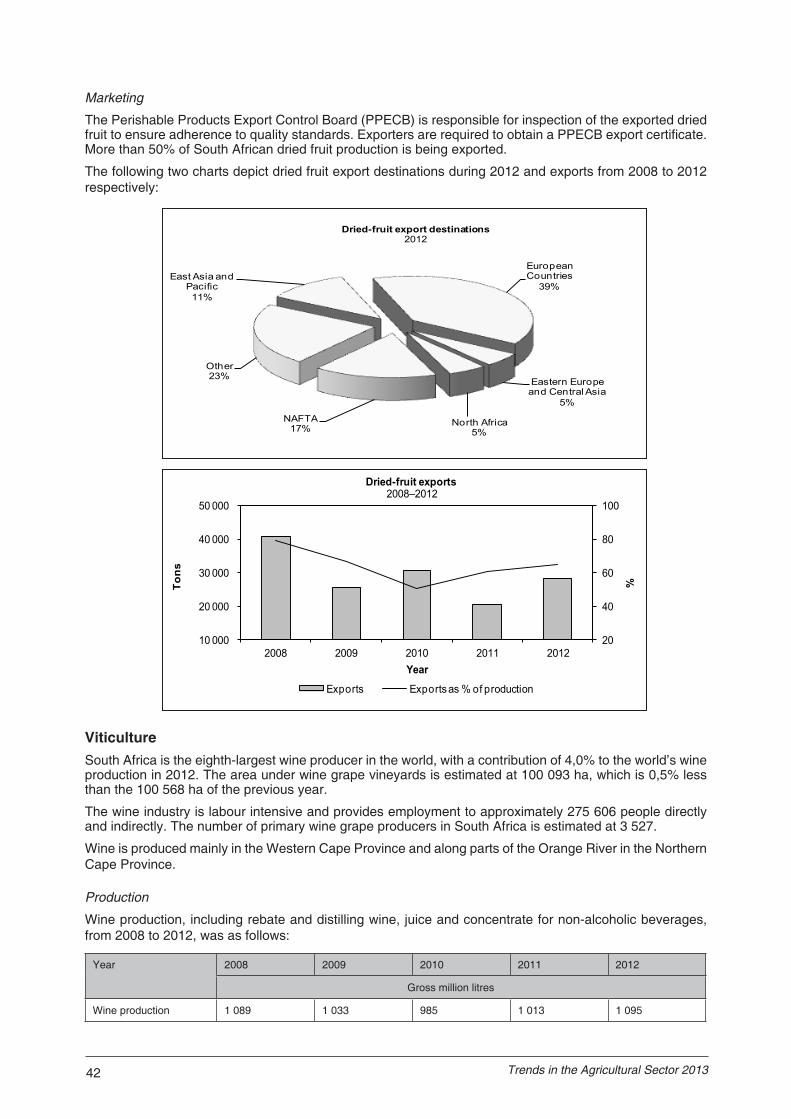
42 Trends in the Agricultural Sector 2013
Marketing
The Perishable Products Export Control Board (PPECB) is responsible for inspection of the exported dried fruit to ensure adherence to quality standards. Exporters are required to obtain a PPECB export certificate. More than 50% of South African dried fruit production is being exported.
The following two charts depict dried fruit export destinations during 2012 and exports from 2008 to 2012 respectively:
ViticultureSouth Africa is the eighth-largest wine producer in the world, with a contribution of 4,0% to the world’s wine production in 2012. The area under wine grape vineyards is estimated at 100 093 ha, which is 0,5% less than the 100 568 ha of the previous year.
The wine industry is labour intensive and provides employment to approximately 275 606 people directly and indirectly. The number of primary wine grape producers in South Africa is estimated at 3 527.
Wine is produced mainly in the Western Cape Province and along parts of the Orange River in the Northern Cape Province.
Production
Wine production, including rebate and distilling wine, juice and concentrate for non-alcoholic beverages, from 2008 to 2012, was as follows:
Year 2008 2009 2010 2011 2012
Gross million litres
Wine production 1 089 1 033 985 1 013 1 095
East Asia and Pacific11%
European Countries
39%
Eastern Europe and Central Asia
5%
North Africa5%
NAFTA17%
Other23%
Dried-fruit export destinations2012
20
40
60
80
100
10 000
20 000
30 000
40 000
50 000
2008 2009 2010 2011 2012
%Tons
Year
Dried-fruit exports 2008–2012
Exports Exports as % of production
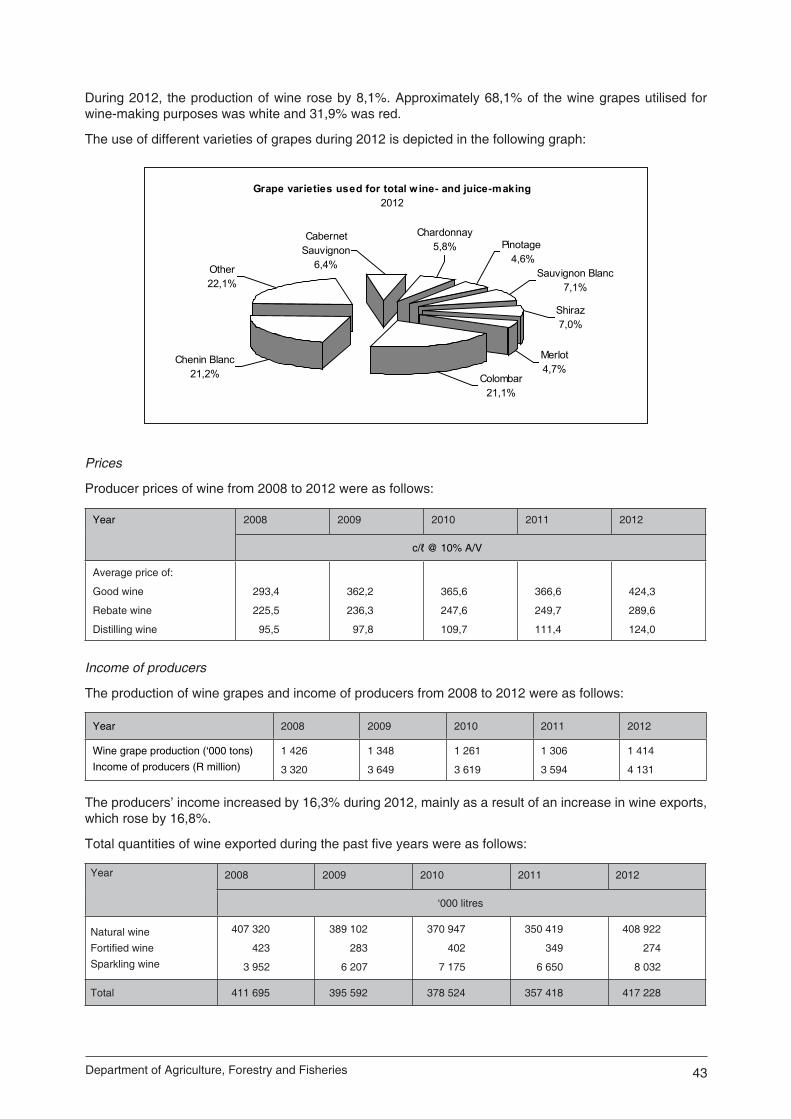
43Department of Agriculture, Forestry and Fisheries
Grape varieties used for total w ine- and juice-making2012
Pinotage 4,6%
Merlot4,7%
Shiraz7,0%
Colombar21,1%
Sauvignon Blanc7,1%
Chardonnay5,8%
Cabernet Sauvignon
6,4%Other22,1%
Chenin Blanc21,2%
During 2012, the production of wine rose by 8,1%. Approximately 68,1% of the wine grapes utilised for wine-making purposes was white and 31,9% was red.
The use of different varieties of grapes during 2012 is depicted in the following graph:
Prices
Producer prices of wine from 2008 to 2012 were as follows:
Year 2008 2009 2010 2011 2012
c/ℓ @ 10% A/V
Average price of:
Good wine
Rebate wine
Distilling wine
293,4
225,5
95,5
362,2
236,3
97,8
365,6
247,6
109,7
366,6
249,7
111,4
424,3
289,6
124,0
Income of producers
The production of wine grapes and income of producers from 2008 to 2012 were as follows:
Year 2008 2009 2010 2011 2012
Wine grape production (‘000 tons)Income of producers (R million)
1 426
3 320
1 348
3 649
1 261
3 619
1 306
3 594
1 414
4 131
The producers’ income increased by 16,3% during 2012, mainly as a result of an increase in wine exports, which rose by 16,8%.
Total quantities of wine exported during the past five years were as follows:
Year 2008 2009 2010 2011 2012
‘000 litres
Natural wineFortified wineSparkling wine
407 320
423
3 952
389 102
283
6 207
370 947
402
7 175
350 419
349
6 650
408 922
274
8 032
Total 411 695 395 592 378 524 357 418 417 228

44 Trends in the Agricultural Sector 2013
During 2012, 47,9% of the total wine produced was exported, compared with 43,0% during 2011.
The following graph depicts wine export destinations during 2012:
Consumption
The per capita consumption of wine on the domestic market from 2008 to 2012 was as follows:
Year 2008 2009 2010 2011 2012
ℓ per capita
Natural wineFortified wineSparkling wine
6,42
0,69
0,20
6,01
0,68
0,17
6,09
0,66
0,18
6,14
0,65
0,17
6,18
0,64
0,16
Total 7,31 6,86 6,93 6,96 6,98
Prospects
It is expected that the 2013 wine production, including rebate and distilling wine, juice and concentrate for non-alcoholic beverages, will be around 1 150 million litres, which represents a 5,0% increase on the 2012 production.
Subtropical fruit
Measured in terms of value of production, the subtropical fruit industry earned R2 739 million in 2012/13—an increase of 8,3% on the 2011/12 figure of R2 530 million.
Production and production areas
The cultivation of some types of subtropical fruit is only possible in certain specific areas of the country because of particular climatic requirements. In general, subtropical fruit types need warmer conditions and are sensitive to large temperature fluctuations and frost. The best areas for the production of these types of fruit in South Africa are in the Limpopo, Mpumalanga and KwaZulu-Natal provinces. Fruit types such as granadillas and guavas are also grown in the Western Cape, while pineapples are cultivated in the Eastern Cape and KwaZulu-Natal.
The total production area of avocados in 2012/13 is estimated at approximately 15 388 ha, pineapples at 12 195 ha, bananas at 5 800 ha, mangoes at 7 003 ha and litchis at 1 731 ha.
Wine (bottled and packaged) export destinations2012
EU and the rest of Europe69%
Other countries5%
Far East and Australia
11%
USA and Canada11%
Africa and Middle East4%
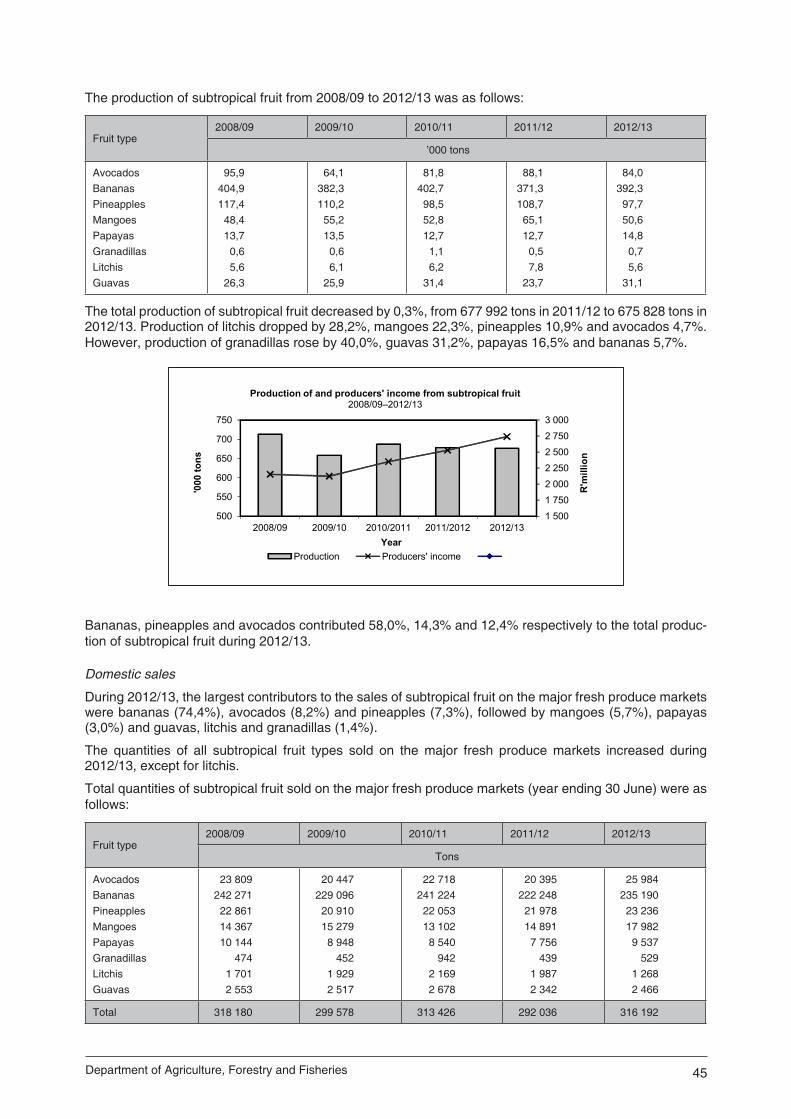
45Department of Agriculture, Forestry and Fisheries
The production of subtropical fruit from 2008/09 to 2012/13 was as follows:
Fruit type2008/09 2009/10 2010/11 2011/12 2012/13
’000 tons
AvocadosBananasPineapplesMangoesPapayasGranadillasLitchisGuavas
95,9404,9117,448,413,70,65,6
26,3
64,1382,3110,255,213,50,66,1
25,9
81,8402,798,552,812,71,16,2
31,4
88,1371,3108,765,112,70,57,8
23,7
84,0392,397,750,614,80,75,6
31,1
The total production of subtropical fruit decreased by 0,3%, from 677 992 tons in 2011/12 to 675 828 tons in 2012/13. Production of litchis dropped by 28,2%, mangoes 22,3%, pineapples 10,9% and avocados 4,7%. However, production of granadillas rose by 40,0%, guavas 31,2%, papayas 16,5% and bananas 5,7%.
1 500
1 750
2 000
2 250
2 500
2 750
3 000
500
550
600
650
700
750
2008/09 2009/10 2010/2011 2011/2012 2012/13
R'm
illio
n
'000
tons
Year
Production of and producers' income from subtropical fruit2008/09–2012/13
Production Producers' income
Bananas, pineapples and avocados contributed 58,0%, 14,3% and 12,4% respectively to the total produc-tion of subtropical fruit during 2012/13.
Domestic sales
During 2012/13, the largest contributors to the sales of subtropical fruit on the major fresh produce markets were bananas (74,4%), avocados (8,2%) and pineapples (7,3%), followed by mangoes (5,7%), papayas (3,0%) and guavas, litchis and granadillas (1,4%).
The quantities of all subtropical fruit types sold on the major fresh produce markets increased during 2012/13, except for litchis.
Total quantities of subtropical fruit sold on the major fresh produce markets (year ending 30 June) were as follows:
Fruit type2008/09 2009/10 2010/11 2011/12 2012/13
Tons
AvocadosBananasPineapples MangoesPapayasGranadillasLitchisGuavas
23 809242 27122 86114 36710 144
4741 7012 553
20 447229 09620 91015 2798 948
4521 9292 517
22 718241 22422 05313 1028 540
9422 1692 678
20 395222 24821 97814 8917 756
4391 9872 342
25 984235 19023 23617 9829 537
5291 2682 466
Total 318 180 299 578 313 426 292 036 316 192
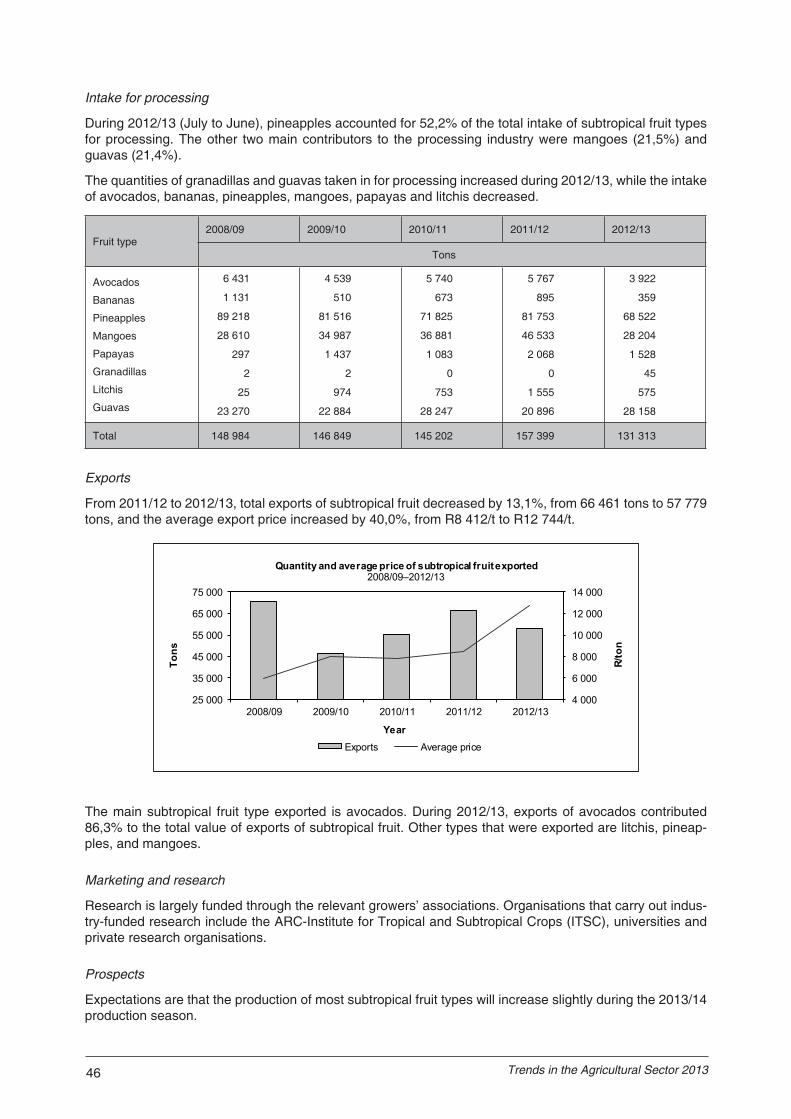
46 Trends in the Agricultural Sector 2013
Intake for processing
During 2012/13 (July to June), pineapples accounted for 52,2% of the total intake of subtropical fruit types for processing. The other two main contributors to the processing industry were mangoes (21,5%) and guavas (21,4%).
The quantities of granadillas and guavas taken in for processing increased during 2012/13, while the intake of avocados, bananas, pineapples, mangoes, papayas and litchis decreased.
Fruit type2008/09 2009/10 2010/11 2011/12 2012/13
Tons
Avocados
Bananas
Pineapples
Mangoes
Papayas
Granadillas
Litchis
Guavas
6 431
1 131
89 218
28 610
297
2
25
23 270
4 539
510
81 516
34 987
1 437
2
974
22 884
5 740
673
71 825
36 881
1 083
0
753
28 247
5 767
895
81 753
46 533
2 068
0
1 555
20 896
3 922
359
68 522
28 204
1 528
45
575
28 158
Total 148 984 146 849 145 202 157 399 131 313
Exports
From 2011/12 to 2012/13, total exports of subtropical fruit decreased by 13,1%, from 66 461 tons to 57 779 tons, and the average export price increased by 40,0%, from R8 412/t to R12 744/t.
The main subtropical fruit type exported is avocados. During 2012/13, exports of avocados contributed 86,3% to the total value of exports of subtropical fruit. Other types that were exported are litchis, pineap-ples, and mangoes.
Marketing and research
Research is largely funded through the relevant growers’ associations. Organisations that carry out indus-try-funded research include the ARC-Institute for Tropical and Subtropical Crops (ITSC), universities and private research organisations.
Prospects
Expectations are that the production of most subtropical fruit types will increase slightly during the 2013/14 production season.
4 000
6 000
8 000
10 000
12 000
14 000
25 000
35 000
45 000
55 000
65 000
75 000
2008/09 2009/10 2010/11 2011/12 2012/13
R/to
n
Tons
Year
Quantity and average price of subtropical fruit exported2008/09–2012/13
Exports Average price

47Department of Agriculture, Forestry and Fisheries
Citrus fruit
Production areas
Citrus fruit is grown in the Limpopo, Eastern Cape, Mpumalanga, Western Cape and KwaZulu-Natal prov-inces in areas where subtropical conditions (warm to hot summers and mild winters) prevail. The area under citrus production is estimated at 62 238 ha.
Production
Oranges contributed about 68,9% to the total production of citrus fruit in South Africa during 2012/13. Citrus fruit production increased marginally by 0,1%, from 2 340 401 tons in 2011/12 to 2 343 016 tons in 2012/13. There has been an annual average increase of 1,3% over the past five years in citrus production.
Citrus fruit production for the past five production seasons (1 February to 31 January) is as follows:
Fruit type2008/09 2009/10 2010/11 2011/12 2012/13
Tons
Oranges
Grapefruit
Lemons
Naartjes
Soft citrus
1 523 203
340 787
230 757
30 289
158 726
1 367 706
406 694
203 080
32 625
141 297
1 415 447
343 028
216 202
30 909
145 755
1 496 167
415 572
260 382
28 855
139 425
1 614 810
304 558
235 764
34 942
152 942
Total 2 283 762 2 151 402 2 151 341 2 340 401 2 343 016
Exports
The citrus industry in South Africa is primarily export-orientated, with very small quantities being imported. South Africa is one of the major citrus fruit exporters in the world. Exports increased from 1 379 383 tons during 2011/12 to 1 445 111 tons during 2012/13—an increase of 4,8%. During 2012/13, the Netherlands was South Africa’s largest trading partner in terms of citrus fruit exports. About 1 005 368 tons of oranges (approximately 42,9% of the citrus crop) were exported.
0
1 000
2 000
3 000
4 000
5 000
6 000
0
300
600
900
1 200
1 500
2008/09 2009/10 2010/11 2011/12 2012/13
R/t
'000
tons
Year
Citrus exports and average export prices2008/09–2012/13
Volume Price
Domestic sales
Citrus fruit sales on the major fresh produce markets in South Africa decreased by 3,7%, from 176 106 tons during 2011/12 to 169 580 tons during 2012/13, and comprised about 7,2% of total citrus fruit production. Approximately 35,2% of the naartje production, 8,0% of oranges and 7,3% of soft citrus was sold on the fresh produce markets.

48 Trends in the Agricultural Sector 2013
The average prices realised on the major fresh produce markets during the period 2008/09 to 2012/13 were as follows:
Fruit type2008/09 2009/10 2010/11 2011/12 2012/13
R/ton
Oranges
Grapefruit
Lemons
Naartjes
Soft citrus
1 435
2 269
3 143
4 053
3 043
1 479
1 855
3 432
4 183
3 044
1 608
1 472
4 055
4 719
3 811
1 763
2 082
3 244
4 681
4 099
1 912
2 306
4 754
4 966
3 751
Processing
Approximately 23,9% of the total citrus fruit production was taken in for processing during 2012/13. Citrus fruit taken in for processing showed a decrease of 8,3%, from 610 905 tons in 2011/12 to 560 456 tons in 2012/13.
Consumption
Per capita consumption of citrus fruit from 2009 to 2013 was as follows:
Year 2009 2010 2011 2012 2013
kg/year
Per capita consumption 12,51 11,73 12,88 14,66 17,47
Research
Citrus Research International (CRI) is mandated by the Citrus Growers’ Association of Southern Africa (CGA) to maximise the long-term global competitiveness of the Southern African citrus growers through the development, support, coordination and provision of research and technical services. The CRI is a division of the CGA and research funding is primarily derived from levies on citrus exports.
Vegetables (excluding potatoes)
General
Vegetables are produced in most parts of the country. However, in certain areas farmers tend to con-centrate on specific crops; for example, green beans are grown mainly in Kaapmuiden, Marble Hall and Tzaneen, green peas mainly in George and Vaalharts, onions mainly in Caledon, Pretoria and Brits, and asparagus mainly in Krugersdorp and Ficksburg.
Production
From 2011/12 to 2012/13 (July–June), the total production of vegetables (excluding potatoes) decreased by 1,4%, from 2 673 617 tons to 2 635 132 tons. Concerning the major vegetable types in terms of volumes produced, the production of green mealies rose by 13 180 tons or 3,7% and that of carrots by 4 236 tons or 2,2%. The production of tomatoes decreased by 28 515 tons or 5,2%.
The production of vegetables (excluding potatoes) in South Africa for the period 2008/09 to 2012/13 com-pares as follows (p.49):
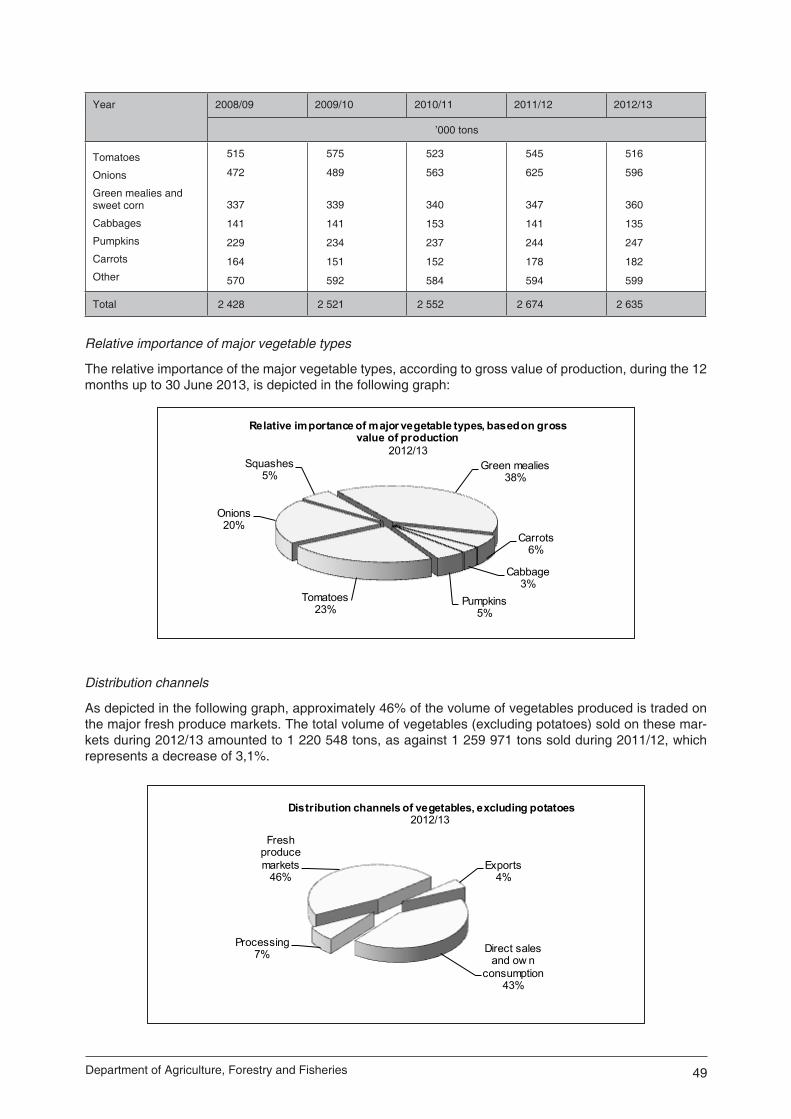
49Department of Agriculture, Forestry and Fisheries
Exports4%
Direct sales and ow n
consumption43%
Processing7%
Fresh produce markets
46%
Distribution channels of vegetables, excluding potatoes 2012/13
Year 2008/09 2009/10 2010/11 2011/12 2012/13
’000 tons
Tomatoes
Onions
Green mealies and sweet corn
Cabbages
Pumpkins
Carrots
Other
515
472
337
141
229
164
570
575
489
339
141
234
151
592
523
563
340
153
237
152
584
545
625
347
141
244
178
594
516
596
360
135
247
182
599
Total 2 428 2 521 2 552 2 674 2 635
Relative importance of major vegetable types
The relative importance of the major vegetable types, according to gross value of production, during the 12 months up to 30 June 2013, is depicted in the following graph:
Squashes5%
Green mealies38%
Carrots6%
Cabbage3%
Pumpkins5%
Tomatoes23%
Onions20%
Relative importance of major vegetable types, based on gross value of production
2012/13
Distribution channels
As depicted in the following graph, approximately 46% of the volume of vegetables produced is traded on the major fresh produce markets. The total volume of vegetables (excluding potatoes) sold on these mar-kets during 2012/13 amounted to 1 220 548 tons, as against 1 259 971 tons sold during 2011/12, which represents a decrease of 3,1%.
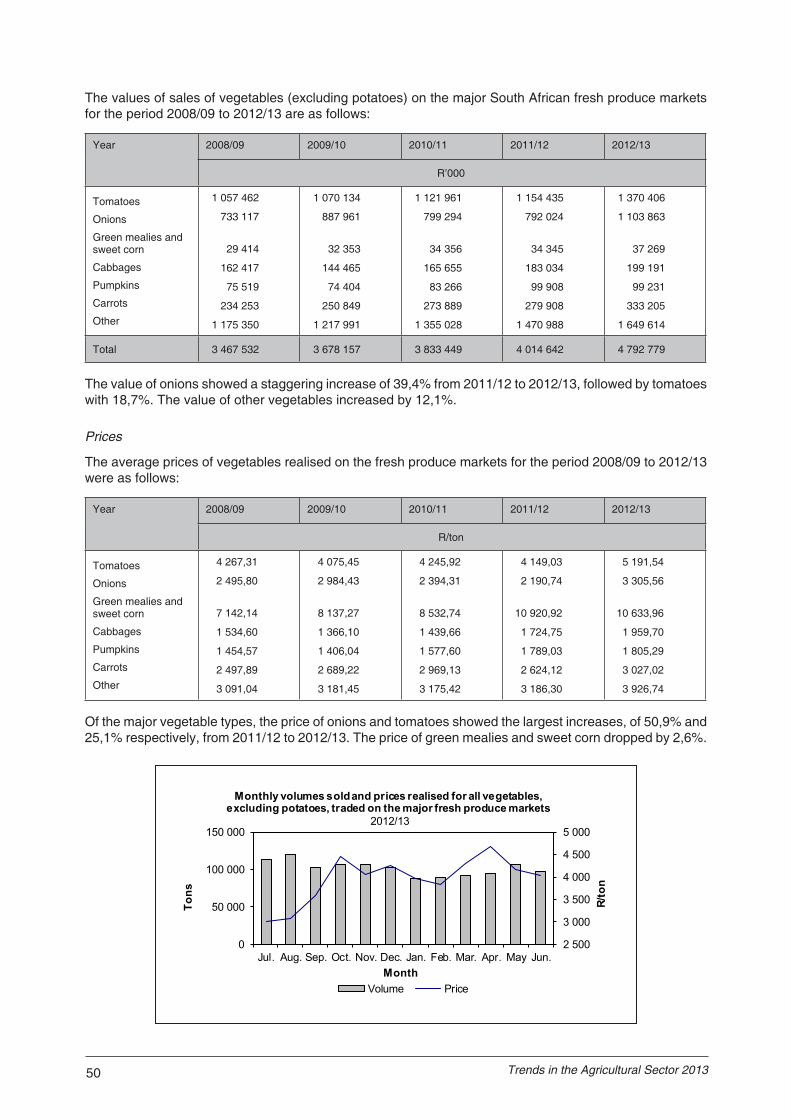
50 Trends in the Agricultural Sector 2013
The values of sales of vegetables (excluding potatoes) on the major South African fresh produce markets for the period 2008/09 to 2012/13 are as follows:
Year 2008/09 2009/10 2010/11 2011/12 2012/13
R’000
Tomatoes
Onions
Green mealies and sweet corn
Cabbages
Pumpkins
Carrots
Other
1 057 462
733 117
29 414
162 417
75 519
234 253
1 175 350
1 070 134
887 961
32 353
144 465
74 404
250 849
1 217 991
1 121 961
799 294
34 356
165 655
83 266
273 889
1 355 028
1 154 435
792 024
34 345
183 034
99 908
279 908
1 470 988
1 370 406
1 103 863
37 269
199 191
99 231
333 205
1 649 614
Total 3 467 532 3 678 157 3 833 449 4 014 642 4 792 779
The value of onions showed a staggering increase of 39,4% from 2011/12 to 2012/13, followed by tomatoes with 18,7%. The value of other vegetables increased by 12,1%.
Prices
The average prices of vegetables realised on the fresh produce markets for the period 2008/09 to 2012/13 were as follows:
Year 2008/09 2009/10 2010/11 2011/12 2012/13
R/ton
Tomatoes
Onions
Green mealies and sweet corn
Cabbages
Pumpkins
Carrots
Other
4 267,31
2 495,80
7 142,14
1 534,60
1 454,57
2 497,89
3 091,04
4 075,45
2 984,43
8 137,27
1 366,10
1 406,04
2 689,22
3 181,45
4 245,92
2 394,31
8 532,74
1 439,66
1 577,60
2 969,13
3 175,42
4 149,03
2 190,74
10 920,92
1 724,75
1 789,03
2 624,12
3 186,30
5 191,54
3 305,56
10 633,96
1 959,70
1 805,29
3 027,02
3 926,74
Of the major vegetable types, the price of onions and tomatoes showed the largest increases, of 50,9% and 25,1% respectively, from 2011/12 to 2012/13. The price of green mealies and sweet corn dropped by 2,6%.
2 500
3 000
3 500
4 000
4 500
5 000
0
50 000
100 000
150 000
Jul. Aug. Sep. Oct. Nov. Dec. Jan. Feb. Mar. Apr. May Jun.
R/to
n
Tons
Month
Monthly volumes sold and prices realised for all vegetables, excluding potatoes, traded on the major fresh produce markets
2012/13
Volume Price

51Department of Agriculture, Forestry and Fisheries
1 000
1 200
1 400
1 600
1 800
2 000
100
200
300
400
500
600
2008/09 2009/10 2010/11 2011/12 2012/13
R'm
illio
n
'000
tons
Year
Production and value of tomatoes2008/09–2012/13
Production Gross value
Consumption
The importance of vegetables in a healthy diet is being strongly promoted by all the stakeholders in the fresh produce marketing chain. The per capita consumption of fresh vegetables was 40,91 kg during 2012/13, approximately 8,6% lower than the 44,78 kg of 2011/12.
Tomatoes
Production
Approximately 516 133 tons of tomatoes were produced during 2012/13, which is a decrease of 5,2% from the 544 648 tons of the previous season. The gross value of production increased by 17,4% from R1 589 million in 2011/12 to R1 866 million in 2012/13.
Sales
Sales on fresh produce markets and direct sales constitute approximately 69,2% of the total volume of tomato sales. Tomatoes are mainly produced for the local market, with limited exports to the Seychelles, Zimbabwe, Zambia and Mozambique. Owing to the geographic distribution and production of tomatoes, a sufficient volume of good-quality tomatoes is normally being produced almost throughout the year to meet the daily demand.
The quantity of tomatoes sold on the 19 major fresh produce markets decreased by 4,6%, from 278 242 tons in 2011/12 to 263 969 tons in 2012/13.
Tshw ane17%
Johannesburg49%
Cape Tow n11%
Durban7%
Other markets16%
Tomato sales on the major fresh produce markets2012/13

52 Trends in the Agricultural Sector 2013
Prices
The average price of tomatoes sold on the major fresh produce markets increased by 20,3%, from R4 208,31 per ton during 2011/12 to R5 063,16 per ton in 2012/13. The increase was mainly the result of lower vol-umes being offered. Tomatoes are subject to large seasonal price fluctuations, and consequently there is a high price risk involved.
Exports*
The quantity of tomatoes exported decreased by 18,3%, from 18 561 tons in 2011/12 to 15 161 tons in 2012/13. Approximately 99,1% of total tomato exports during 2012/13 were to Mozambique, Zimbabwe, Angola, Zambia and the Seychelles.
*Source: Customs and Excise
Onions
Production
Onions are produced in almost all the provinces of South Africa.
Approximately 596 126 tons of onions were produced during the 2012/13 season (July to June). This is 4,6% less than the 624 567 tons of the previous season. The industry experienced an average annual in-crease of 7,2% in production from 2008/09 to 2012/13.
Production and value of onions2008/09–2012/13
100
200
300
400
500
600
700
2008/09 2009/10 2010/11 2011/12 2012/13Year
'000
tons
250
500
750
1 000
1 250
1 500
1 750
R'm
illio
n
Production Gross value
3 000
4 000
5 000
6 000
7 000
8 000
0
5 000
10 000
15 000
20 000
25 000
30 000
Jul. Aug. Sep. Oct. Nov. Dec. Jan. Feb. Mar. Apr. May June
R/to
n
Tons
Month
Monthly sales and prices of tomatoes on major fresh produce markets2012/13
Quantity Price

53Department of Agriculture, Forestry and Fisheries
Sales of onions on the fresh produce markets2008/09–2012/13
100 000
150 000
200 000
250 000
300 000
350 000
400 000
2008/09 2009/10 2010/11 2011/12 2012/13Year
Tons
1 000
1 500
2 000
2 500
3 000
3 500
R/to
n
Volume Average price
Distribution of the onion crop2012/13
Processing0,4%
Exports13,3%Sales on fresh
produce markets56,0%
Production for ow n use and direct sales
30,3%
Sales
The fresh produce markets remain an important marketing channel for onions. Approximately 56% of the total production during the 2012/13 season was sold on the major fresh produce markets, while 13% was exported. The remainder comprises producers’ own consumption and direct sales to supermarkets and chain stores (30%), and a small quantity (less than 1%) sold to processing factories.
During the period 2008/09 to 2012/13, the sales of onions on the fresh produce markets increased by an average annual rate of 5,6%, from 293 740 tons to 333 957 tons, with a decrease of 8,3%, from 361 532 tons to 333 957 tons, between 2011/12 and 2012/13.
Prices
The average price of onions sold on the fresh produce markets increased by 8,5%, from R2 191 per ton in 2011/12 to R3 305 per ton in 2012/13. This was mainly the result of a decrease in the volumes of onions supplied on the markets.
Processing
Only 0,4% of the total production of onions was taken in for processing during the 2012/13 season. There has been a decrease in the total processing of onions since the 2008/09 season, when 3 937 tons were taken in for processing, to 2 121 tons in the 2012/13 season. During 2012/13, about 94,9% was canned and the remaining 5,1% was frozen.

54 Trends in the Agricultural Sector 2013
Fresh produce markets
63%
Processed17% Direct trade
9%
Seed8%
Exports4%
Utilisation of the potato crop2012
Exports*
During the 2012/13 season, the volume of onions exported represented approximately 13,4% of the total onion crop. The volume of exports increased by 23,2%, from 64 685 tons in 2011/12 to 79 712 tons during 2012/13.
* Source: Customs and Excise
PotatoesThere are 16 distinct potato-production regions in South Africa, which are spread throughout the country. The main regions are situated in the Free State, Western Cape, Limpopo and Mpumalanga provinces. Potatoes are planted at different times because of climate differences in the production areas, resulting in fresh potatoes being available throughout the year. In the early 1990s there was a major shift in production from dryland to irrigation and currently almost 80% of plantings are under irrigation.
Area planted
Plantings for 2012 are estimated at around 48 879 ha, which is 10,0% lower than the previous year.
Production
Potatoes constituted approximately 45,2% of the total gross value of vegetables produced during 2012. In 2012, the average yield was approximately 4 159 x 10-kg pockets per hectare, compared to 4 179 x 10-kg pockets per hectare in 2011, which is a decrease of 0,5%. A total crop of about 214,7 million x 10-kg bags was expected for 2013.
1 800
1 900
2 000
2 100
2 200
2 300
40
45
50
55
60
2009 2010 2011 2012 *2013
'000
tons
'000
ha
Year
Production of and area planted to potatoes2009–2013
Area planted Production
* Forecast
Sales
The major fresh produce markets remain an important channel for the sale of potatoes.
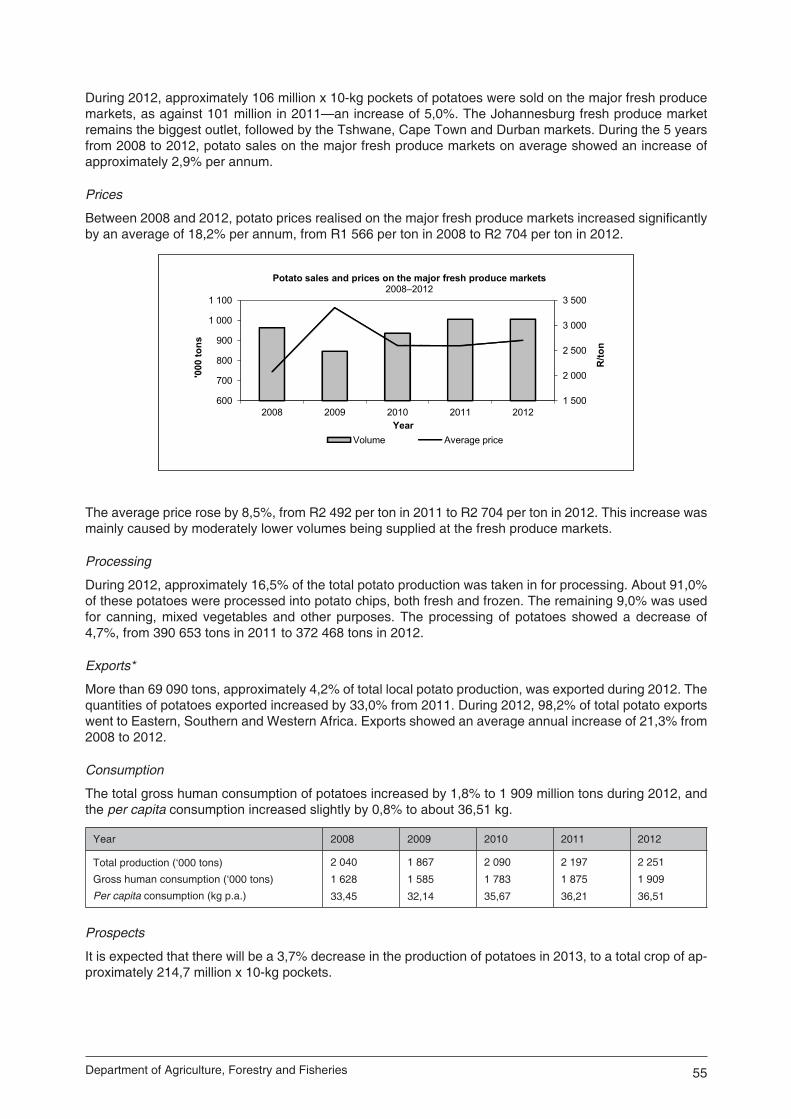
55Department of Agriculture, Forestry and Fisheries
1 500
2 000
2 500
3 000
3 500
600
700
800
900
1 000
1 100
2008 2009 2010 2011 2012
R/to
n
'000
tons
Year
Potato sales and prices on the major fresh produce markets2008–2012
Volume Average price
During 2012, approximately 106 million x 10-kg pockets of potatoes were sold on the major fresh produce markets, as against 101 million in 2011—an increase of 5,0%. The Johannesburg fresh produce market remains the biggest outlet, followed by the Tshwane, Cape Town and Durban markets. During the 5 years from 2008 to 2012, potato sales on the major fresh produce markets on average showed an increase of approximately 2,9% per annum.
Prices
Between 2008 and 2012, potato prices realised on the major fresh produce markets increased significantly by an average of 18,2% per annum, from R1 566 per ton in 2008 to R2 704 per ton in 2012.
The average price rose by 8,5%, from R2 492 per ton in 2011 to R2 704 per ton in 2012. This increase was mainly caused by moderately lower volumes being supplied at the fresh produce markets.
Processing
During 2012, approximately 16,5% of the total potato production was taken in for processing. About 91,0% of these potatoes were processed into potato chips, both fresh and frozen. The remaining 9,0% was used for canning, mixed vegetables and other purposes. The processing of potatoes showed a decrease of 4,7%, from 390 653 tons in 2011 to 372 468 tons in 2012.
Exports*
More than 69 090 tons, approximately 4,2% of total local potato production, was exported during 2012. The quantities of potatoes exported increased by 33,0% from 2011. During 2012, 98,2% of total potato exports went to Eastern, Southern and Western Africa. Exports showed an average annual increase of 21,3% from 2008 to 2012.
Consumption
The total gross human consumption of potatoes increased by 1,8% to 1 909 million tons during 2012, and the per capita consumption increased slightly by 0,8% to about 36,51 kg.
Year 2008 2009 2010 2011 2012
Total production (‘000 tons)
Gross human consumption (‘000 tons)
Per capita consumption (kg p.a.)
2 040
1 628
33,45
1 867
1 585
32,14
2 090
1 783
35,67
2 197
1 875
36,21
2 251
1 909
36,51
Prospects
It is expected that there will be a 3,7% decrease in the production of potatoes in 2013, to a total crop of ap-proximately 214,7 million x 10-kg pockets.
56 Trends in the Agricultural Sector 2013
ANIMAL PRODUCTION
Livestock numbers
Approximately 80% of the agricultural land in South Africa is suitable mainly for extensive livestock farming. However, livestock are also found in areas where the animals are kept in combination with other farming enterprises.
In South Africa, the area involved in cattle, sheep and goat farming is approximately 590 000 km2. This represents 53% of all agricultural land in the country and includes the vast Karoo areas of the Northern and Western Cape provinces, as well as the mixed-veld areas of the Eastern Cape and southern Free State provinces. Commercial sheep farms also occur in other areas such as the Kgalagadi, the winter rainfall area and the grasslands of Mpumalanga, the eastern Free State and KwaZulu-Natal, where other farming enterprises such as cattle farming are also found.
As rainfall plays a major role in the availability of fodder and grazing, it is logical that a good correlation would exist between rainfall and the size of the national herd, particularly cattle.
Cattle
Cattle are found throughout the country, but mainly in the Eastern Cape, KwaZulu-Natal, Free State and North West provinces. Herd sizes vary according to type of cattle. In the case of dairy cattle, it varies be-tween less than 50 and 300 (average approximately 110). Beef cattle herds range from fairly small (less than 20 head of cattle) to large farms and feedlots (more than 1 000 head). Vryburg, which is in the North West Province, has been found to have some of the largest cattle herds in South Africa. The production of weaners for the feedlot industry is the most frequent form of cattle farming in South Africa, such that feed-lots account for approximately 75% of all beef produced in the country.
The total number of cattle in South Africa at the end of August 2013 was estimated at 13,94 million, com-prising various international dairy and beef cattle breeds as well as indigenous breeds such as the Afrikaner and the Nguni. The number is approximately 0,4% higher than the estimate of 13,89 million as at the end of August 2012. Beef cattle contribute approximately 80% of the total number of cattle in the country, while dairy cattle make up the remaining 20%. Holstein, Jersey, Guernsey and Ayrshire are the four major dairy breeds found in South Africa.
Cattle numbers per province since 2009 were estimated to be as follows:
Province2009 2010 2011 2012 2013*
’000 (August)
Western Cape
Northern Cape
Free State
Eastern Cape
KwaZulu-Natal
Mpumalanga
Limpopo
Gauteng
North West
576
509
2 306
3 078
2 773
1 457
1 064
266
1 731
572
509
2 292
3 056
2 726
1 473
1 056
259
1 788
560
509
2 294
3 152
2 736
1 405
1 086
261
1 784
567
507
2 306
3 267
2 729
1 462
1 055
258
1 737
564
502
2 313
3 311
2 781
1 439
1 050
250
1 733
Total 13 760 13 731 13 787 13 888 13 943
*Projection

57Department of Agriculture, Forestry and Fisheries
Distribution of cattle by provinceAugust 2013 (%)
North West12%Gauteng
2%Limpopo8%
Mpumalanga10%
Kw aZulu-Natal20%
Western Cape4%
Eastern Cape23%
Northern Cape4%
Free State17%
Distribution of sheep by provinceAugust 2013 (%)
Limpopo1%
Gauteng0%
North West3%
Eastern Cape30%
Mpumalanga7%
Kw aZulu-Natal3%
Western Cape12%
Free State19%
Northern Cape25%
There are various breeders’ organisations representing most international and indigenous cattle breeds. Most of the organisations are affiliated to the South African Studbook and Animal Improvement Associa-tion. The Milk Producers’ Organisation (MPO) is the most prominent producer organisation in the South African dairy sector. The Red Meat Producers’ Organisation (RPO) and the National Emergent Red Meat Producers’ Organisation (Nerpo) represent producers in the commercial and emerging agricultural sectors, respectively.
Sheep
Although sheep farms are found in all provinces, they are mostly concentrated in the more arid parts of the country. The total number of sheep in South Africa at the end of August 2013 is estimated at 24,20 million, 0,5% lower than the estimated 24,30 million as at the end of August 2012. For August 2013, the largest numbers of sheep were estimated to be in the Eastern Cape (30%), Northern Cape (25%), Free State (19%) and Western Cape (12%) provinces.
Flock sizes vary between less than 50 and 1 800 animals. Sheep flocks in the Eastern, Western and North-ern Cape provinces tend to be much larger than those in the other provinces.
The animals are kept mainly for wool and mutton production and the industry is therefore represented by organisations from the mutton as well as the wool industry. The sheep industry also has various breed-ers’ associations, with the Dorper Sheep Breeders’ Society of South Africa and Merino SA being the most prominent.

58 Trends in the Agricultural Sector 2013
In the Western Cape, the inland Karoo and the Overberg produce wool and mutton, plus the pedigree Me-rino breeding stock.
The number of sheep in the various provinces since 2009 was estimated to be as follows:
Province2009 2010 2011 2012 2013*
’000 (August)
Western Cape
Northern Cape
Free State
Eastern Cape
KwaZulu-Natal
Mpumalanga
Limpopo
Gauteng
North West
2 814
6 295
4 876
7 354
781
1 778
266
105
720
2 790
6 210
4 860
7 281
7 281
1 760
262
102
713
2 806
6 045
4 753
7 084
772
1 748
263
104
728
2 861
6 083
4 768
7 085
764
1 782
262
102
685
2 863
6 103
4 692
6 974
743
1 794
257
96
680
Total 24 989 24 750 24 303 24 392 24 202
*Projection
Goats
Goats are found mainly in the Eastern Cape, Limpopo, KwaZulu-Natal and North West provinces. Esti-mates indicate that there was an increase of 0,6% in the number of goats, from 6,141 million in August 2012 to 6,180 million in August 2013.
*Projection
Flocks of goats intended for meat production are usually smaller than sheep flocks, averaging approximate-ly 300 goats per farm. Angora goats are kept primarily for mohair production, while Boer goats are mainly for meat production. According to the SA Milch Goat Breeders’ Society, there are also farmers who have adopted a market differentiating strategy by producing goat’s milk and these are increasing in numbers.
Pigs
Pigs are found predominantly in the Limpopo, North West, Gauteng and Western Cape provinces. There are approximately 400 commercial pork producers and 19 stud breeders in South Africa. It is estimated that pig numbers will decrease by 0,3%, from 1,579 million in August 2012 to 1,575 million in August 2013.
Distribution of goats by provinceAugust 2013*
Kw aZulu-Natal827 855
Mpumalanga89 811
Limpopo1 193 505
Gauteng41 472
North West708 476
Western Cape225 036 Northern Cape
514 830
Free State241 966
Eastern Cape2 336 996

59Department of Agriculture, Forestry and Fisheries
*Projection
The South African Pork Producers’ Organisation (SAPPO) is the official mouthpiece of pork producers in South Africa. The organisation is primarily concerned with administration, liaison with government, the pro-motion of pork and pork products and matters of national interest such as health and research.
The total number of employees in the formal pork production industry in South Africa is estimated to be ap-proximately 10 000, comprising about 4 000 farm workers and 6 000 workers in the processing and abattoir sectors.
Red meat
The red meat industry is one of the most important growing industries in the South African agricultural sector. It contributed approximately 14,6% to the gross value of agricultural production in the RSA during 2012/13. While sheep farming is mainly extensive, a large percentage of beef animals are supplied by feedlots.
Slaughterings
It is estimated that the total number of cattle slaughtered increased by 0,7%, pigs slaughtered by 1,9% and sheep (including lambs) slaughtered by 11,8% from 2011/12 to 2012/13.
Commercial slaughterings of red-meat-producing livestock types over the past five years were as follows:
Year 2008/09 2009/10 2010/11 2011/12 2012/13
Cattle
Sheep and lambs
Pigs
2 142 608
4 804 711
2 204 113
2 195 316
4 946 202
2 296 934
2 185 078
4 281 870
2 422 701
2 205 659
4 111 421
2 474 009
2 221 029
4 597 978
2 521 573
Auction prices
The prices for red meat are mainly determined by the interaction between demand and supply (the latter two are affected by the level of the consumers’ disposable income, the prices of substitute products and import parity prices, etc). In the case of mutton, for example, the level of wool prices also influences the domestic supply of mutton.
The average producer price of beef for 2012/13 amounted to R28,80/kg (average for all classes on all auction markets), which represents an increase of 1,3% from the average price of R28,43/kg for 2011/12.
Distribution of pigs by provinceAugust 2013*
Kw aZulu-Natal157 733Mpumalanga
125 325
Limpopo368 640
Gauteng179 789
North West317 458
Western Cape175 133
Northern Cape27 477
Free State127 369
Eastern Cape96 330

60 Trends in the Agricultural Sector 2013
In view of the ever-strong influence of international trade on the local mutton industry, both the cyclical and seasonal price patterns for mutton were influenced by imports. The average producer price for mutton and lamb decreased by 10,1%, from R46,24/kg in 2011/12 to R41,59/kg in 2012/13.
The average producer price for pork decreased slightly by 0,8%, from R18,22/kg in 2011/12 to R18,07/kg in 2012/13.
Imports
Imports of red meat decreased by 15,3%, from 50 883 tons in 2011/12 to 43 120 tons in 2012/13 (6,8% lower than the average of approximately 46 264 tons for the five years up to 2012/13).
Beef imports amounted to 4 082 tons, which is a decrease of 59,2% from the 10 014 tons imported during 2011/12, and 30,1% lower than the five-year average of 5 841 tons up to 2012/13.
Imports of pork amounted to 34 431 tons, an increase of 3,1% on the 33 395 tons imported during 2011/12 and 17,5% more than the five-year average of 29 312 tons up to 2012/13.
Imports of mutton during 2012/13 amounted to 4 606 tons—a decrease of 38,4% from the 7 473 tons im-ported the previous year and 52,0% lower than the average of 9 597 tons for the five years up to 2012/13.
0
1 000
2 000
3 000
4 000
5 000
2008/09 2009/10 2010/11 2011/12 2012/13
c/kg
Year
Average producer prices of beef, mutton and pork2008/09–2012/13 (July to June)
Beef Mutton and lamb Pork
0
10 000
20 000
30 000
40 000
2008/09 2009/10 2010/11 2011/12 2012/13
Tons
Year
Imports of red meat2008/09–2012/13
Beef Mutton and lamb Pork
Consumption
Consumption of beef and veal showed an increase of 2,4%, from 867 720 tons in 2011/12 to 888 740 tons in 2012/13, that of mutton increased by 9,6%, from 145 100 tons to 159 000 tons, and that of pork increased by 2,2%, from 240 920 tons to 246 340 tons.
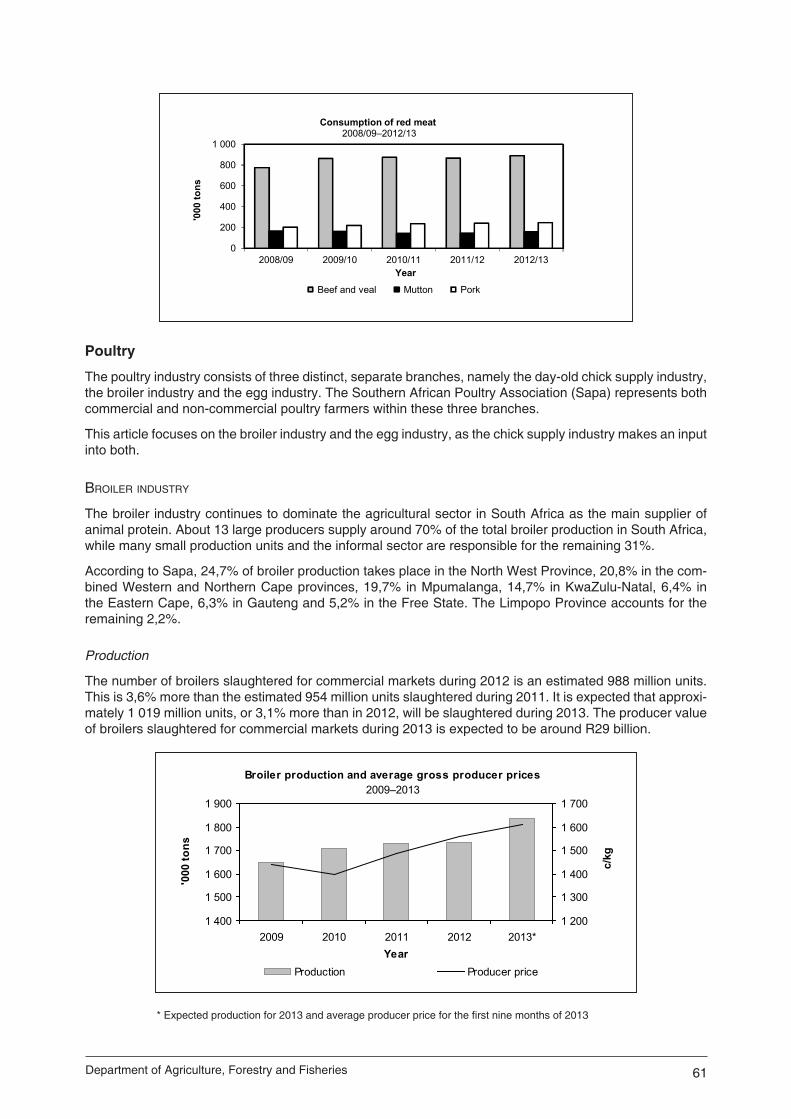
61Department of Agriculture, Forestry and Fisheries
Poultry
The poultry industry consists of three distinct, separate branches, namely the day-old chick supply industry, the broiler industry and the egg industry. The Southern African Poultry Association (Sapa) represents both commercial and non-commercial poultry farmers within these three branches.
This article focuses on the broiler industry and the egg industry, as the chick supply industry makes an input into both.
BRoileR induStRy
The broiler industry continues to dominate the agricultural sector in South Africa as the main supplier of animal protein. About 13 large producers supply around 70% of the total broiler production in South Africa, while many small production units and the informal sector are responsible for the remaining 31%.
According to Sapa, 24,7% of broiler production takes place in the North West Province, 20,8% in the com-bined Western and Northern Cape provinces, 19,7% in Mpumalanga, 14,7% in KwaZulu-Natal, 6,4% in the Eastern Cape, 6,3% in Gauteng and 5,2% in the Free State. The Limpopo Province accounts for the remaining 2,2%.
Production
The number of broilers slaughtered for commercial markets during 2012 is an estimated 988 million units. This is 3,6% more than the estimated 954 million units slaughtered during 2011. It is expected that approxi-mately 1 019 million units, or 3,1% more than in 2012, will be slaughtered during 2013. The producer value of broilers slaughtered for commercial markets during 2013 is expected to be around R29 billion.
0
200
400
600
800
1 000
2008/09 2009/10 2010/11 2011/12 2012/13
'000
tons
Year
Consumption of red meat2008/09–2012/13
Beef and veal Mutton Pork
Broiler production and average gross producer prices2009–2013
1 400
1 500
1 600
1 700
1 800
1 900
2009 2010 2011 2012 2013*Year
'000
tons
1 200
1 300
1 400
1 500
1 600
1 700
c/kg
Production Producer price
* Expected production for 2013 and average producer price for the first nine months of 2013
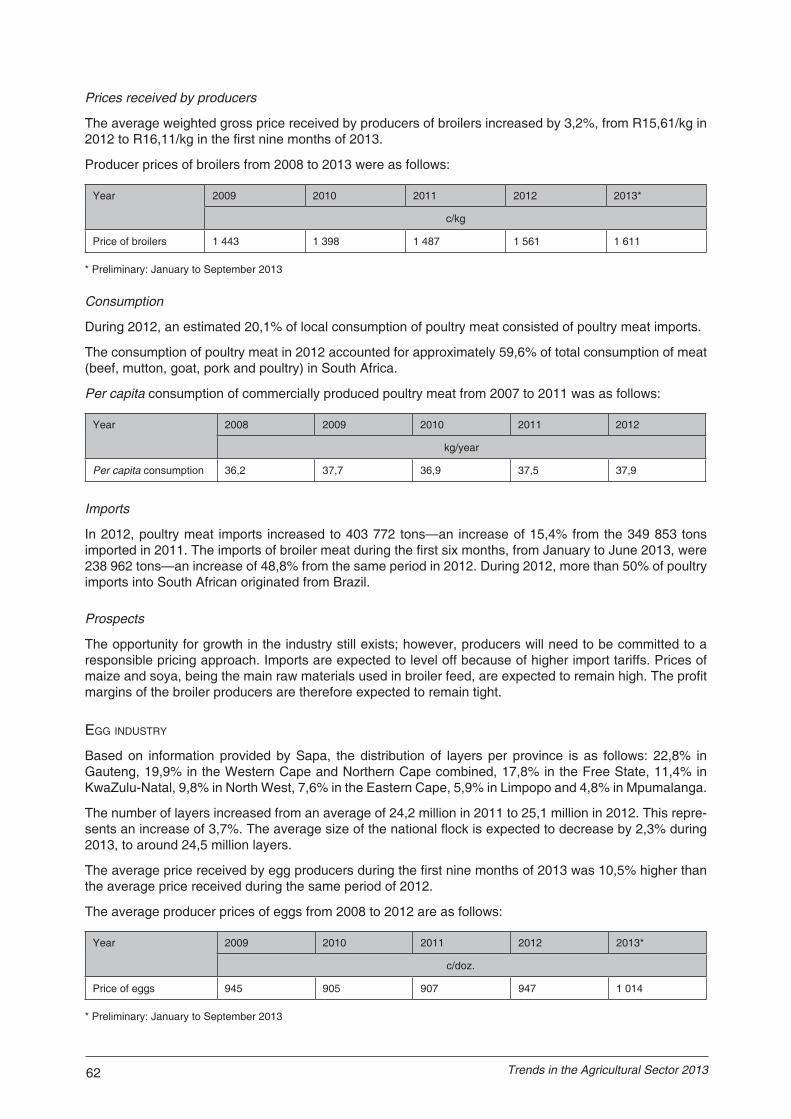
62 Trends in the Agricultural Sector 2013
Prices received by producers
The average weighted gross price received by producers of broilers increased by 3,2%, from R15,61/kg in 2012 to R16,11/kg in the first nine months of 2013.
Producer prices of broilers from 2008 to 2013 were as follows:
Year 2009 2010 2011 2012 2013*
c/kg
Price of broilers 1 443 1 398 1 487 1 561 1 611
* Preliminary: January to September 2013
Consumption
During 2012, an estimated 20,1% of local consumption of poultry meat consisted of poultry meat imports.
The consumption of poultry meat in 2012 accounted for approximately 59,6% of total consumption of meat (beef, mutton, goat, pork and poultry) in South Africa.
Per capita consumption of commercially produced poultry meat from 2007 to 2011 was as follows:
Year 2008 2009 2010 2011 2012
kg/year
Per capita consumption 36,2 37,7 36,9 37,5 37,9
Imports
In 2012, poultry meat imports increased to 403 772 tons—an increase of 15,4% from the 349 853 tons imported in 2011. The imports of broiler meat during the first six months, from January to June 2013, were 238 962 tons—an increase of 48,8% from the same period in 2012. During 2012, more than 50% of poultry imports into South African originated from Brazil.
Prospects
The opportunity for growth in the industry still exists; however, producers will need to be committed to a responsible pricing approach. Imports are expected to level off because of higher import tariffs. Prices of maize and soya, being the main raw materials used in broiler feed, are expected to remain high. The profit margins of the broiler producers are therefore expected to remain tight.
egg induStRy
Based on information provided by Sapa, the distribution of layers per province is as follows: 22,8% in Gauteng, 19,9% in the Western Cape and Northern Cape combined, 17,8% in the Free State, 11,4% in KwaZulu-Natal, 9,8% in North West, 7,6% in the Eastern Cape, 5,9% in Limpopo and 4,8% in Mpumalanga.
The number of layers increased from an average of 24,2 million in 2011 to 25,1 million in 2012. This repre-sents an increase of 3,7%. The average size of the national flock is expected to decrease by 2,3% during 2013, to around 24,5 million layers.
The average price received by egg producers during the first nine months of 2013 was 10,5% higher than the average price received during the same period of 2012.
The average producer prices of eggs from 2008 to 2012 are as follows:
Year 2009 2010 2011 2012 2013*
c/doz.
Price of eggs 945 905 907 947 1 014
* Preliminary: January to September 2013

63Department of Agriculture, Forestry and Fisheries
Production of eggs and prices received by producers2009–2013
400 000450 000500 000550 000600 000650 000700 000
2009 2010 2011 2012 2013*Year
'000
doz
.
800
850
900
950
1 000
1 050
c/do
z.
Production Producer price
The production of eggs is expected to decrease by 1,4%, from 642,8 million dozen in 2012 to 633,5 million dozen in 2013.
* Expected production for 2013 and average producer price for the first nine months of 2013
Consumption
The per capita consumption for 2012 was 153 eggs, an increase of 4,1% from 2011. Considerable scope exists for the per capita consumption to increase, particularly in view of the competitive price of eggs as a protein source compared to other animal proteins.
Prospects
The biggest challenge for the egg industry is to continue producing a competitive product in an environ-ment of increasing costs. Higher egg prices at retail level depressed demand during 2013 and it is therefore expected that production will level off in the next year. The limited disposable income of especially poorer communities is expected to have a negative effect on consumption growth.
Ostriches
Commercial ostrich farming in the country started in 1864 with large-scale exports of feathers to Europe. The industry flourished during what was referred to as the second ostrich feather boom between 1900 and 1914. At this stage, ostriches were only farmed for their feathers and a handful of feathers were enough to buy a farm.
Soon afterwards, the industry virtually collapsed as a result of changes in world fashion trends, the introduc-tion of the motor car as a means of transport (ladies struggled to get into the cars while wearing their hats with long ostrich feathers) and the First World War.
During the 1960s, the industry was transformed into an intensively managed farming activity. The emphasis shifted from feather to leather production.
More recently, ostrich meat became popular because of health benefits—it has almost no fat or cholesterol and is rich in protein and iron. The greater focus on a healthy lifestyle is causing a growing demand for ostrich meat worldwide and South Africa is normally the main supplier.
Since the deregulation of the marketing of agricultural products in South Africa during the 1990s, farming with ostriches has spread from the Little Karoo region to other parts of the country, as well as to several other countries. However, the industries in most other countries did not last longer than 10 years and South Africa has regained its position as world market leader, with a share of more than 70% of the world market.
Today, all major stakeholders in the industry are affiliated to either the National Ostrich Processors of South Africa (NOPSA) or the South African Ostrich Producers’ Organisation (SAOPO). Both these organisations are key members of the South African Ostrich Business Chamber (SAOBC). The objective of the SAOBC is to facilitate the sustainability and profitability of the ostrich industry in South Africa.
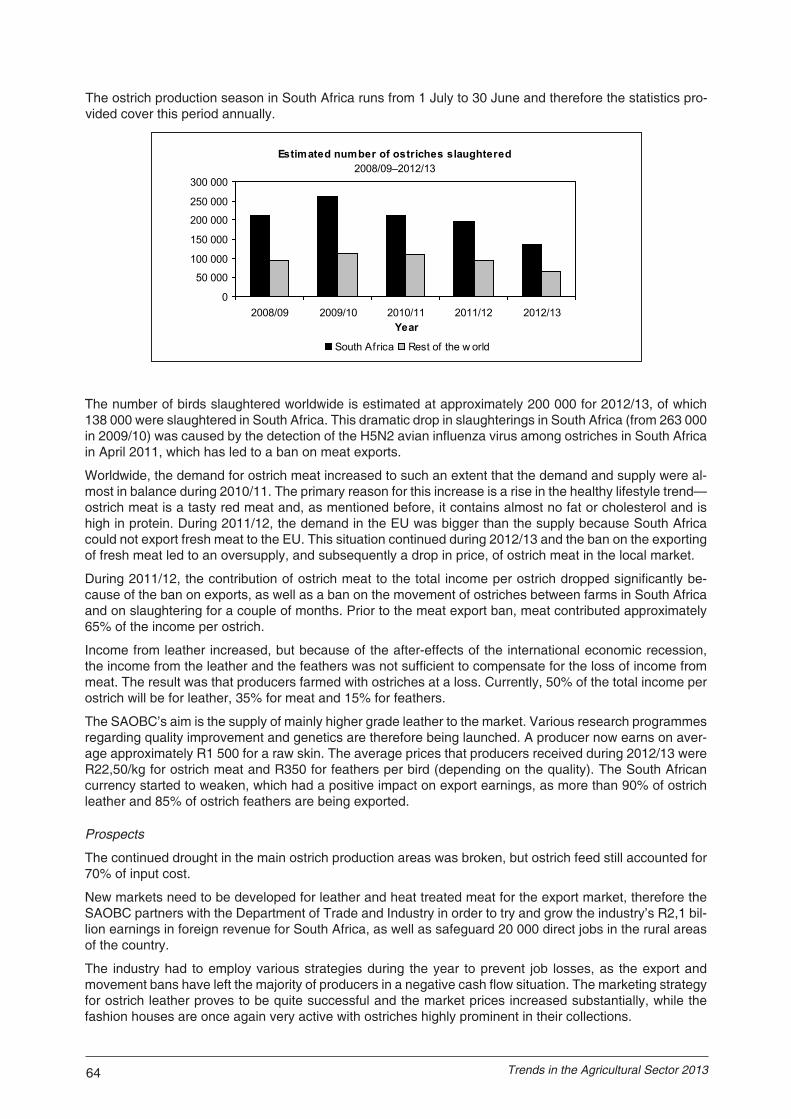
64 Trends in the Agricultural Sector 2013
The ostrich production season in South Africa runs from 1 July to 30 June and therefore the statistics pro-vided cover this period annually.
The number of birds slaughtered worldwide is estimated at approximately 200 000 for 2012/13, of which 138 000 were slaughtered in South Africa. This dramatic drop in slaughterings in South Africa (from 263 000 in 2009/10) was caused by the detection of the H5N2 avian influenza virus among ostriches in South Africa in April 2011, which has led to a ban on meat exports.
Worldwide, the demand for ostrich meat increased to such an extent that the demand and supply were al-most in balance during 2010/11. The primary reason for this increase is a rise in the healthy lifestyle trend—ostrich meat is a tasty red meat and, as mentioned before, it contains almost no fat or cholesterol and is high in protein. During 2011/12, the demand in the EU was bigger than the supply because South Africa could not export fresh meat to the EU. This situation continued during 2012/13 and the ban on the exporting of fresh meat led to an oversupply, and subsequently a drop in price, of ostrich meat in the local market.
During 2011/12, the contribution of ostrich meat to the total income per ostrich dropped significantly be-cause of the ban on exports, as well as a ban on the movement of ostriches between farms in South Africa and on slaughtering for a couple of months. Prior to the meat export ban, meat contributed approximately 65% of the income per ostrich.
Income from leather increased, but because of the after-effects of the international economic recession, the income from the leather and the feathers was not sufficient to compensate for the loss of income from meat. The result was that producers farmed with ostriches at a loss. Currently, 50% of the total income per ostrich will be for leather, 35% for meat and 15% for feathers.
The SAOBC’s aim is the supply of mainly higher grade leather to the market. Various research programmes regarding quality improvement and genetics are therefore being launched. A producer now earns on aver-age approximately R1 500 for a raw skin. The average prices that producers received during 2012/13 were R22,50/kg for ostrich meat and R350 for feathers per bird (depending on the quality). The South African currency started to weaken, which had a positive impact on export earnings, as more than 90% of ostrich leather and 85% of ostrich feathers are being exported.
Prospects
The continued drought in the main ostrich production areas was broken, but ostrich feed still accounted for 70% of input cost.
New markets need to be developed for leather and heat treated meat for the export market, therefore the SAOBC partners with the Department of Trade and Industry in order to try and grow the industry’s R2,1 bil-lion earnings in foreign revenue for South Africa, as well as safeguard 20 000 direct jobs in the rural areas of the country.
The industry had to employ various strategies during the year to prevent job losses, as the export and movement bans have left the majority of producers in a negative cash flow situation. The marketing strategy for ostrich leather proves to be quite successful and the market prices increased substantially, while the fashion houses are once again very active with ostriches highly prominent in their collections.
Estimated number of ostriches slaughtered2008/09–2012/13
0
50 000
100 000
150 000
200 000
250 000
300 000
2008/09 2009/10 2010/11 2011/12 2012/13Year
South Africa Rest of the w orld
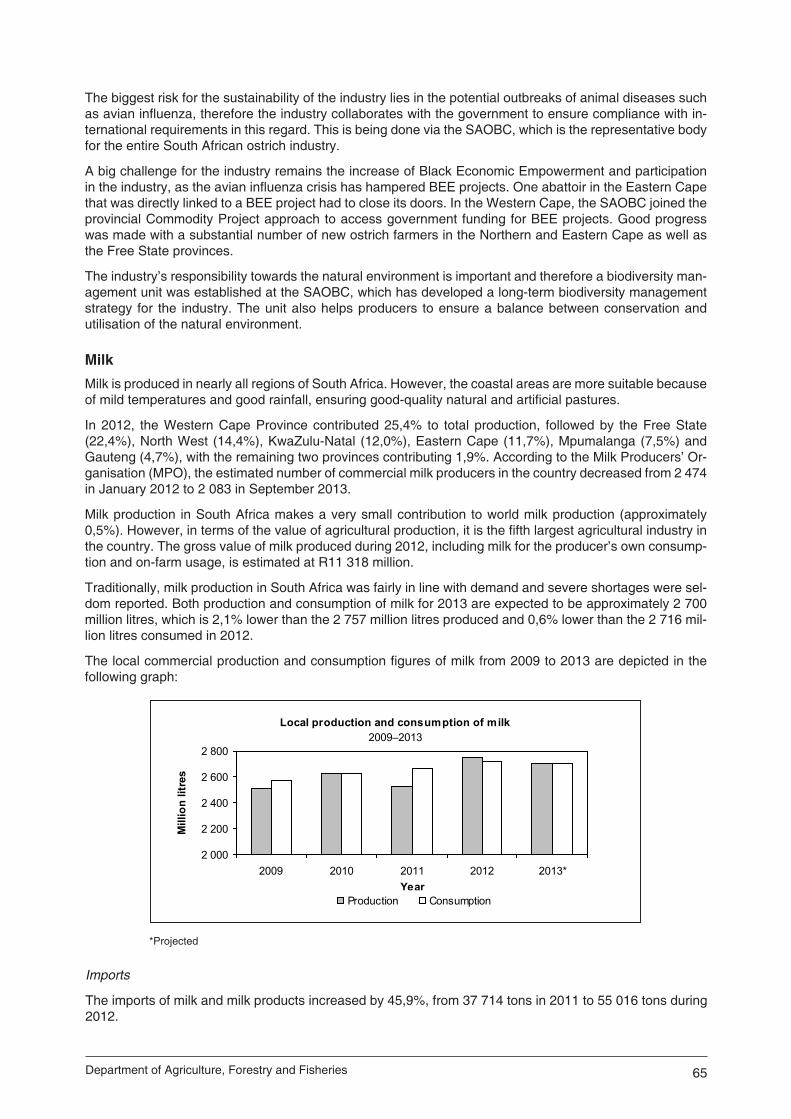
65Department of Agriculture, Forestry and Fisheries
Local production and consumption of milk2009–2013
2 000
2 200
2 400
2 600
2 800
2009 2010 2011 2012 2013*Year
Mill
ion
litre
s
Production Consumption
The biggest risk for the sustainability of the industry lies in the potential outbreaks of animal diseases such as avian influenza, therefore the industry collaborates with the government to ensure compliance with in-ternational requirements in this regard. This is being done via the SAOBC, which is the representative body for the entire South African ostrich industry.
A big challenge for the industry remains the increase of Black Economic Empowerment and participation in the industry, as the avian influenza crisis has hampered BEE projects. One abattoir in the Eastern Cape that was directly linked to a BEE project had to close its doors. In the Western Cape, the SAOBC joined the provincial Commodity Project approach to access government funding for BEE projects. Good progress was made with a substantial number of new ostrich farmers in the Northern and Eastern Cape as well as the Free State provinces.
The industry’s responsibility towards the natural environment is important and therefore a biodiversity man-agement unit was established at the SAOBC, which has developed a long-term biodiversity management strategy for the industry. The unit also helps producers to ensure a balance between conservation and utilisation of the natural environment.
MilkMilk is produced in nearly all regions of South Africa. However, the coastal areas are more suitable because of mild temperatures and good rainfall, ensuring good-quality natural and artificial pastures.
In 2012, the Western Cape Province contributed 25,4% to total production, followed by the Free State (22,4%), North West (14,4%), KwaZulu-Natal (12,0%), Eastern Cape (11,7%), Mpumalanga (7,5%) and Gauteng (4,7%), with the remaining two provinces contributing 1,9%. According to the Milk Producers’ Or-ganisation (MPO), the estimated number of commercial milk producers in the country decreased from 2 474 in January 2012 to 2 083 in September 2013.
Milk production in South Africa makes a very small contribution to world milk production (approximately 0,5%). However, in terms of the value of agricultural production, it is the fifth largest agricultural industry in the country. The gross value of milk produced during 2012, including milk for the producer’s own consump-tion and on-farm usage, is estimated at R11 318 million.
Traditionally, milk production in South Africa was fairly in line with demand and severe shortages were sel-dom reported. Both production and consumption of milk for 2013 are expected to be approximately 2 700 million litres, which is 2,1% lower than the 2 757 million litres produced and 0,6% lower than the 2 716 mil-lion litres consumed in 2012.
The local commercial production and consumption figures of milk from 2009 to 2013 are depicted in the following graph:
*Projected
Imports
The imports of milk and milk products increased by 45,9%, from 37 714 tons in 2011 to 55 016 tons during 2012.

66 Trends in the Agricultural Sector 2013
RSA wool production (including Lesotho and Namibia) and average price
2008/09–2012/13
40
42
44
46
48
50
2008/09 2009/10 2010/11 2011/12 2012/13Season
Mill
ion
kg
20
30
40
50
60
R/k
g
Production Average price for greasy w ool
Prices
The average producer price of milk for the first half of 2013 is R3,70/l, which is 6,3% higher than the R3,48/ℓ for the corresponding period the previous year. The increase in price resulted in a decrease in demand for milk, which dropped by 0,6% during the first half of 2013.
Production season 2009 2010 2011 2012 2013*
c/ℓ
Average producer price 302 298 291 348 370
* Preliminary: January to June 2013
Prospects
Total milk production is expected to decrease by 2,1% in 2013, while demand is expected to drop by ap-proximately 0,6% as a result of an increase in price.
Wool
Areas of production
Wool is produced throughout South Africa; however, the main production areas are in the drier regions of the country. The Eastern Cape was the largest wool-producing province during 2012/13 with 15 million kg, followed by the Free State with 10 million kg, the Western Cape with 8,7 million kg, the Northern Cape with 5,6 million kg, and Mpumalanga with 2,5 million kg, while 2,5 million kg were produced in the remaining four provinces.
South Africa’s neighbour, Lesotho, which markets its wool in South Africa, produced 4,4 million kg.
Production
South Africa, like Australia, produces mainly apparel wool, while the bulk of the wool of the other major pro-ducers, such as New Zealand, China, Uruguay and Argentina, is the coarse type used in the manufacturing of carpets and interior textiles. The main fibres competing with wool are cotton and man-made fibres such as polyester, nylon and acrylic.
Wool production in South Africa, Lesotho and Namibia increased by 9%, from 44,8 million kg in 2011/12 to 48,9 million kg in 2012/13, mainly because of the passing of Rift Valley fever. The passing of the fever re-sulted in an increase in flock numbers to normal levels, as the disease has not affected lambing for the past 12 months. Predation and stock theft are other problems small-stock farmers face. Production is, however, expected to increase further in 2013/14.

67Department of Agriculture, Forestry and Fisheries
Marketing
In excess of 90% of all greasy wool sold in South Africa is traded by means of weekly auctions taking place from August to June. Normally there is considerable volatility in prices during and between auctions. The price of wool is determined by a complex set of variables, including the level of the market in Australia on a specific day, exchange rate fluctuations, quantities offered for sale at auctions, the specific demand for different wool types at various times, the extent and timing of contract commitments by local buyers for delivery to clients, and the prevailing economic conditions in wool-consuming countries.
South Africa produces mainly a Merino clip, which comprises more than 80% of all lots offered for sale. Mean fibre diameter is the major price determinant for Merino wool, with finer micron categories normally commanding a premium over medium and strong wool. The trend for fine wools was in line with the upward trend of overall prices, with no significant premium being paid for fine wools.
Marketing arrangements
The marketing of wool in South Africa is free from statutory intervention. Wool is traded primarily via the open-cry auction system. Alternative selling mechanisms, such as contract growing, forward deliveries and futures, have not been established in the South African wool industry.
The global price for apparel wool is determined in Australia, where the largest volumes of wool are traded. South Africa, with its small clip, is therefore a market follower or price-taker.
Typical of wool auctions are numerous sellers and few buyers. Buyers normally have to compete for wool over a number of auctions to make up processing batches to meet their clients’ contract specifications in terms of price, quantity and delivery date. Contracts in foreign currencies, such as the euro or the US dollar, have to be converted into buying limits in rand and the buyer carries the risk.
Cape Wools of South Africa promotes the interests of the South African wool industry. It is a non-profit com-pany established and owned by farmers and other directly affected industry groups registered with the Wool Forum, which represents all role players in the industry. The Board of Directors proportionately represents these groups. Cape Wools started operating on 1 September 1997.
The Minister of Agriculture, Forestry and Fisheries has granted approval for the introduction of statutory measures for the collection of information, including statistics for the wool industry, enabling Cape Wools to create a wool statistics databank from which a national market indicator and other information regarding the industry can be made available locally as well as internationally.
Cape Wools’ service portfolio comprises market information and statistics; research and development; transfer of wool production and promotion. Cape Wools is funded by the Wool Trust from funds transferred from the former Wool Board.
Exports
Wool is an export product with approximately 98% of total production being shipped overseas in either greasy or semiprocessed form (scoured and wool top). Main export destinations for the year under review were China, the Czech Republic, India, Italy and Germany.
During 2012/13, the major export destinations for South African wool were as follows:
CountryVolume Value
’000 kg (clean) % of total R’000 % of total
China
Czech Republic
India
Italy
Germany
UK
Egypt
France
Mauritius
Others
17 212
4 175
2 463
2 117
754
592
346
342
180
288
60,5
14,7
8,7
7,4
2,7
2,0
1,2
1,2
0,6
1,0
1 575 549
409 684
220 573
211 565
71 877
65 837
41 521
35 940
19 346
32 085
58,7
15,3
8,2
7,9
2,7
2,5
1,5
1,3
0,7
1,2
Total 28 469 100,0 2 683 977 100,0

68 Trends in the Agricultural Sector 2013
Market movement
The 2012/13 season has been an exceptionally good one for wool producers despite the global economic woes, and the Cape Wools market indicator reached an all-time high of R115,65/kg (clean) in January 2013, after which it remained around the R100/kg level for weeks.
Low global wool supply and a strong demand from China, particularly for mid-microns Merino wool, helped support prices and contributed to the production increases seen in South Africa. Raw wool purchases from China for the 2012/13 season were up 30% on the previous season, which can be attributed to the lifting of the ban on exports of wool to China after the passing of the Rift Valley fever.
Although exports to most European destinations for the same period were down, there were signs of increased interest from this region. Demand from China remained subdued following reports that the eco-nomic crisis in Europe had influenced China to cut government spending, including cutting back on buying woollen uniforms for the millions of government workers in order to save money. The season closed with the indicator at R110,31/kg, which was 26,3% up on the opening level and higher than the season average.
The average indicator was R102,65/kg (clean), which was up 4% on the previous season.
The recorded gross value of wool sold at first point of sale for the season amounted to R2 671,4 million, an increase of 17% from 2011/12.
Prospects
Global economic conditions, the availability of apparel wool and exchange rates will, to a large extent, determine prices in the new season. After strong activity in 2010, the pace of global economic growth moderated during 2011 and further declined in 2012. Emerging economies, particularly in Asia, contin-ued to underpin world economic growth, while weak private demand and renewed concerns over public debt levels weakened activity in major Organisation for Economic Cooperation and Development (OECD) economies and caused a subsequent decrease in demand for clothing and other consumer products in the major markets for wool.
The general expectation, after the market has been performing well despite difficult trading conditions, is that the Cape Wools Merino price indicator should remain at around the R110/kg level for the remainder of the 2013/14 season. Good demand from Europe and China pushed up the prices, and it is expected that the market will maintain this momentum over both the medium and longer term. Limited supplies and the expected improvement in demand from China, the world’s largest wool consumer, should help to support current price levels and lead to an improvement in the market.
Mohair
Production
Mohair production in South Africa mainly occurs in the Eastern Cape Province as well as the adjacent part of the Western Cape Province.
South Africa produces approximately 50% of the world mohair clip. In realising the responsibility involved in being the most reliable source of mohair, Mohair South Africa was established to perform functions aimed at the advancement of the entire mohair industry. Through selective breeding and farming techniques, the Angora goat farmer plays a crucial role in promoting the constant availability of quality natural fibres.
South Africa’s mohair production showed a downward trend up to 2011, when production was 2,2 million kg. For the first time in 23 years, production showed an increase during the 2012 calendar year. This was mainly attributable to producers keeping their old animals longer because of good mohair prices, and also better grazing conditions.
Production of mohair by South Africa during the period 2008 to 2012 was as follows:
Year 2008 2009 2010 2011 2012
Million kg
Production 2,9 2,6 2,3 2,2 2,3
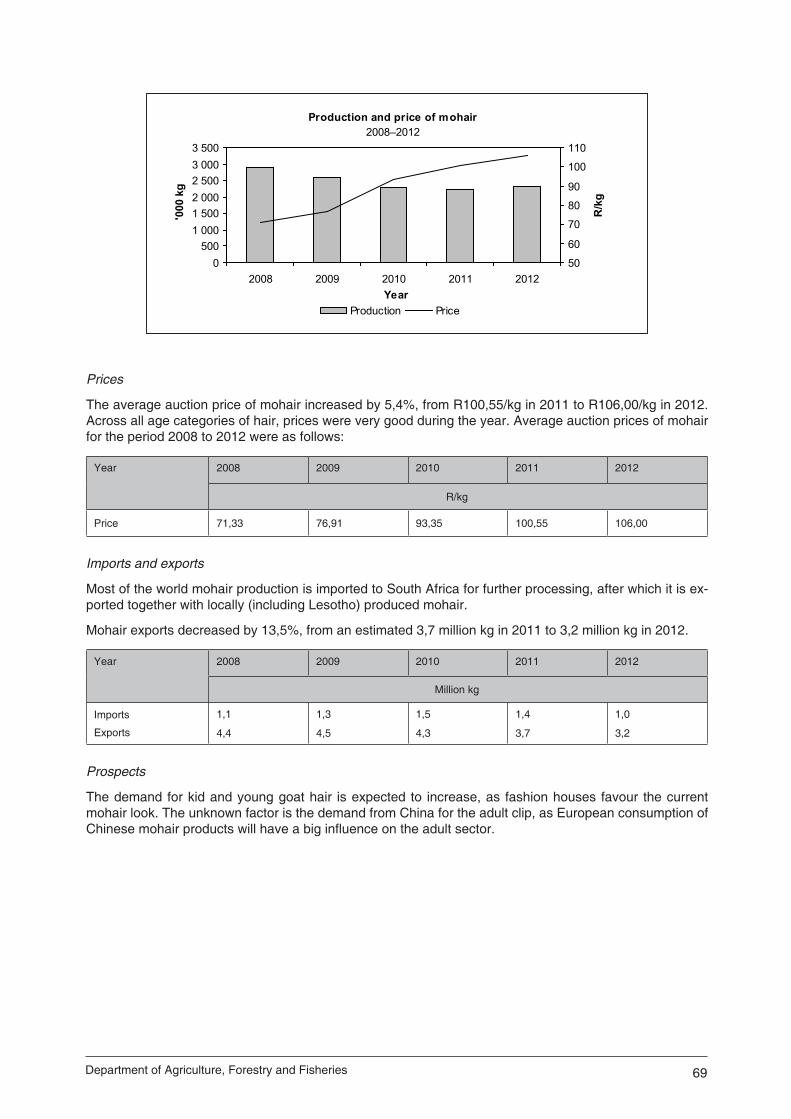
69Department of Agriculture, Forestry and Fisheries
Prices
The average auction price of mohair increased by 5,4%, from R100,55/kg in 2011 to R106,00/kg in 2012. Across all age categories of hair, prices were very good during the year. Average auction prices of mohair for the period 2008 to 2012 were as follows:
Year 2008 2009 2010 2011 2012
R/kg
Price 71,33 76,91 93,35 100,55 106,00
Imports and exports
Most of the world mohair production is imported to South Africa for further processing, after which it is ex-ported together with locally (including Lesotho) produced mohair.
Mohair exports decreased by 13,5%, from an estimated 3,7 million kg in 2011 to 3,2 million kg in 2012.
Year 2008 2009 2010 2011 2012
Million kg
Imports
Exports
1,1
4,4
1,3
4,5
1,5
4,3
1,4
3,7
1,0
3,2
Prospects
The demand for kid and young goat hair is expected to increase, as fashion houses favour the current mohair look. The unknown factor is the demand from China for the adult clip, as European consumption of Chinese mohair products will have a big influence on the adult sector.
Production and price of mohair2008–2012
0 500
1 0001 5002 0002 5003 0003 500
2008 2009 2010 2011 2012Year
'000
kg
50
60
70
80
90
100
110
R/k
g
Production Price

Notes
........................................................................................................................................................................
........................................................................................................................................................................
........................................................................................................................................................................
........................................................................................................................................................................
........................................................................................................................................................................
........................................................................................................................................................................
........................................................................................................................................................................
........................................................................................................................................................................
........................................................................................................................................................................
........................................................................................................................................................................
........................................................................................................................................................................
........................................................................................................................................................................
........................................................................................................................................................................
........................................................................................................................................................................
........................................................................................................................................................................
........................................................................................................................................................................
........................................................................................................................................................................
........................................................................................................................................................................
........................................................................................................................................................................
........................................................................................................................................................................
........................................................................................................................................................................
........................................................................................................................................................................
........................................................................................................................................................................
........................................................................................................................................................................
........................................................................................................................................................................
........................................................................................................................................................................
........................................................................................................................................................................
........................................................................................................................................................................
........................................................................................................................................................................
........................................................................................................................................................................
........................................................................................................................................................................
........................................................................................................................................................................
........................................................................................................................................................................
........................................................................................................................................................................
........................................................................................................................................................................