Daerah tangkapan hujan
39
EMP Report of Dibang Multipurpose Project National Productivity Council, Guwahati 03-1 CHAPTER 3 CATCHMENT AREA TREATMENT 3.1 INTRODUCTION The developmental activities, including hydroelectric projects, often have some impacts on natural resources. The environmental impacts of such projects together with faulty management practices, etc., ultimately lead to environmental degradation and consequently to rapid sedimentation of reservoirs. Accelerated soil erosion in the catchment areas of reservoirs and transport of detached material through the drainage network gives rise to a series of problems, notably siltation, depletion of flow capacity, steady loss of storage capacity, consistent drop in hydro-electric power generation and frequent floods. Therefore for sustainable hydropower development with least negative impact on the environment watershed management plays a pivotal role. In order to minimise the damage to the project as well as the immediate environment, the watershed management programmes involving extensive soil conservation measures in the catchment have assumed tremendous importance. Watershed management primarily involves collection of information on a wide range of parameters of static and dynamic nature related to geology, hydrology, soil, geomorphology, topography, drainage conditions, land use / land cover, climate, etc. required for formulation of detailed and comprehensive Catchment Area Treatment (CAT) Plan. A comprehensively detailed Catchment Area Treatment Plan (CAT) should focus on: • Mitigation measures for the erosion and landslide hazards resulting from the hydropower project activities i.e., activities in the direct impact zone (DIZ). • The problem of silt and debris load to river from the susceptible areas of the catchment. • Checking the sediment load from the tributaries directly discharging into the reservoir. • Protecting the directly draining catchment from scouring / sloughing and slips.
-
Upload
victor-maruli -
Category
Documents
-
view
30 -
download
1
description
untuk nampung air
Transcript of Daerah tangkapan hujan

EMP Report of Dibang Multipurpose Project
National Productivity Council, Guwahati 03-1
CHAPTER 3
CATCHMENT AREA TREATMENT
3.1 INTRODUCTION
The developmental activities, including hydroelectric projects, often have
some impacts on natural resources. The environmental impacts of such
projects together with faulty management practices, etc., ultimately lead to
environmental degradation and consequently to rapid sedimentation of
reservoirs. Accelerated soil erosion in the catchment areas of reservoirs and
transport of detached material through the drainage network gives rise to a
series of problems, notably siltation, depletion of flow capacity, steady loss of
storage capacity, consistent drop in hydro-electric power generation and
frequent floods. Therefore for sustainable hydropower development with least
negative impact on the environment watershed management plays a pivotal
role. In order to minimise the damage to the project as well as the immediate
environment, the watershed management programmes involving extensive
soil conservation measures in the catchment have assumed tremendous
importance.
Watershed management primarily involves collection of information on a wide
range of parameters of static and dynamic nature related to geology,
hydrology, soil, geomorphology, topography, drainage conditions, land use /
land cover, climate, etc. required for formulation of detailed and
comprehensive Catchment Area Treatment (CAT) Plan. A comprehensively
detailed Catchment Area Treatment Plan (CAT) should focus on:
• Mitigation measures for the erosion and landslide hazards resulting
from the hydropower project activities i.e., activities in the direct impact
zone (DIZ).
• The problem of silt and debris load to river from the susceptible areas
of the catchment.
• Checking the sediment load from the tributaries directly discharging
into the reservoir.
• Protecting the directly draining catchment from scouring / sloughing
and slips.
EMP Report of Dibang Multipurpose Project
National Productivity Council, Guwahati 03-2
Although the proposed Dibang Multipurpose Project is not expected to have
any significant negative impacts on the environment, in the following pages
measures to minimize the entry of silt in to its reservoir and enhance its life as
well as for conservation of the ecosystem, are described.
3.2 CATCHMENT AREA TREATMENT The proposed Dibang Multipurpose Project will be located on the river Dibang
about 1.5 km upstream of confluence of river Dibang with river Ashu Pani in
Lower Dibang Valley district of Arunachal Pradesh. The project is a storage
scheme and involves construction of a 288 m high concrete gravity dam. Six
Head Race Tunnels are proposed from the dam block to divert the water to
power house. After generation of electricity in the underground powerhouse
on the right bank of the river, the discharge will be directly led to the river
through six Tail Race Tunnels. The construction of the dam will create a
storage of 3748.21 Mcum corresponding to FRL of El. 545 m and will occupy
4009 ha area in 43 km reservoir length.
The Dibang catchment receives a major portion of precipitation in the form of
rainfall in addition to snow at the higher reaches. Generally the factors
responsible for siltation are slope, together with the surface run-off, underlying
rock/soil characteristics, vegetation aspects, etc. There is dense vegetation in
the immediate catchment area of the present project. The natural soil erosion
activity may take place in and around the areas. A catchment area treatment
plan has been formulated with the main objective of arresting soil erosion in
the catchment.
The Catchment Area Treatment is extremely crucial in the context of
hydropower development as the life of the reservoir depends on the nature of
the catchment, underlying rock/soil type, vegetation type, drainage pattern
etc. Keeping in mind the topography, soil type, climate, land use and
vegetation cover in the catchment area various measures, both
engineering/bio-engineering and biological, are proposed to check the soil
erosion, prevent/check siltation of reservoir and to maintain its storage
capacity. The engineering measures comprise construction of check dams,

EMP Report of Dibang Multipurpose Project
National Productivity Council, Guwahati 03-3
wire crates, DRSM works, contour bunding, etc., while biological measures
include mainly plantation of economically and environmentally important local
and exotic taxa of trees.
3.3 ESTIMATION OF SOIL EROSION In order to formulate the treatment plan it is essential to identify areas
prone/vulnerable to erosion and estimate the extent of soil erosion that is
taking place in the catchment area. Various factors that are responsible for
soil erosion are the drainage pattern in the area, slope, soil type and the land
use/land cover, etc. which have been studied for the formulation of the
catchment area treatment plan.
3.3.1 Drainage The drainage system is the prime transport channel for the sediments as well
as an important natural factor for causing land degradation. In order to
prepare CAT Plan, one must understand the drainage pattern of that
catchment. The river originates from the snow covered southern flank of the
Himalayas close to the Tibet border at an elevation of more than 5000 m. The
river Dibang cuts through deep gorges and difficult terrains in its upper reach
through the mountains of the Dibang Valley and Lower Dibang Valley districts
of Arunachal Pradesh. The total length of Dibang from its source to its
confluence with Lohit river at Sadia in Assam is 195 km. The major tributaries
of Dibang river are Mathun, Tangon, Dri, Ithun & Emra. A number of small
tributaries i.e. Ahi, Airi Pani, Ilu Pani, Ashu Pani, Ephi Pani, Deo Pani etc also
join the river. The important feature is that all the tributaries barring Ephi Pani
& Deo Pani join Dibang in its hilly catchment. The three major tributaries viz
Tangon, Dri and Mathun are almost equal in size because of which the shape
of the Dibang catchment is comparatively wide in its upper reach. Drainage
map of directly draining catchment is placed as Map 3.1.
3.3.2 Delineation of Watersheds and Sub-watersheds The total catchment area of the Dibang River up to the proposed Dam site
11276 sq km. The directly draining catchment is 59811.88 ha, which
constitutes the study area for CAT. The directly draining catchment
EMP Report of Dibang Multipurpose Project
National Productivity Council, Guwahati 03-4
comprises of nine sub-watersheds around the proposed reservoir area from
the confluence of river Tangon with river Dibang up to the Dam site. The
hierarchical delineation system developed by AISLUS (AISLUS Technical
Bulletin - 9) was followed for the demarcation of sub-watersheds within the
study area. The codification system as given in Watershed Atlas of India
(AISLUS) was followed for Dibang catchment on 1:50,000 Survey of India
topographical sheets. Directly draining catchment of river Dibang divides
into nine sub watersheds viz., 3A2C4, 3A2C7, 3A2D1, 3A2D2, 3A2F5,
3A2G3, 3A2G4, 3A2H2 and 3A2H3. Out of these, five viz., 3A2C4, 3A2C7,
3A2D1, 3A2D2 and 3A2F5 are on the right bank and four viz., 3A2G3,
3A2G4, 3A2H2 and 3A2H3 are on left bank. An index map of nine
subwatersheds of directly draining catchment is given in Map 3.2. From the
thematic maps of slope, drainage, soil, and land use, a Composite Erosion
Intensity Unit (CEIU) map was prepared for each sub watershed for
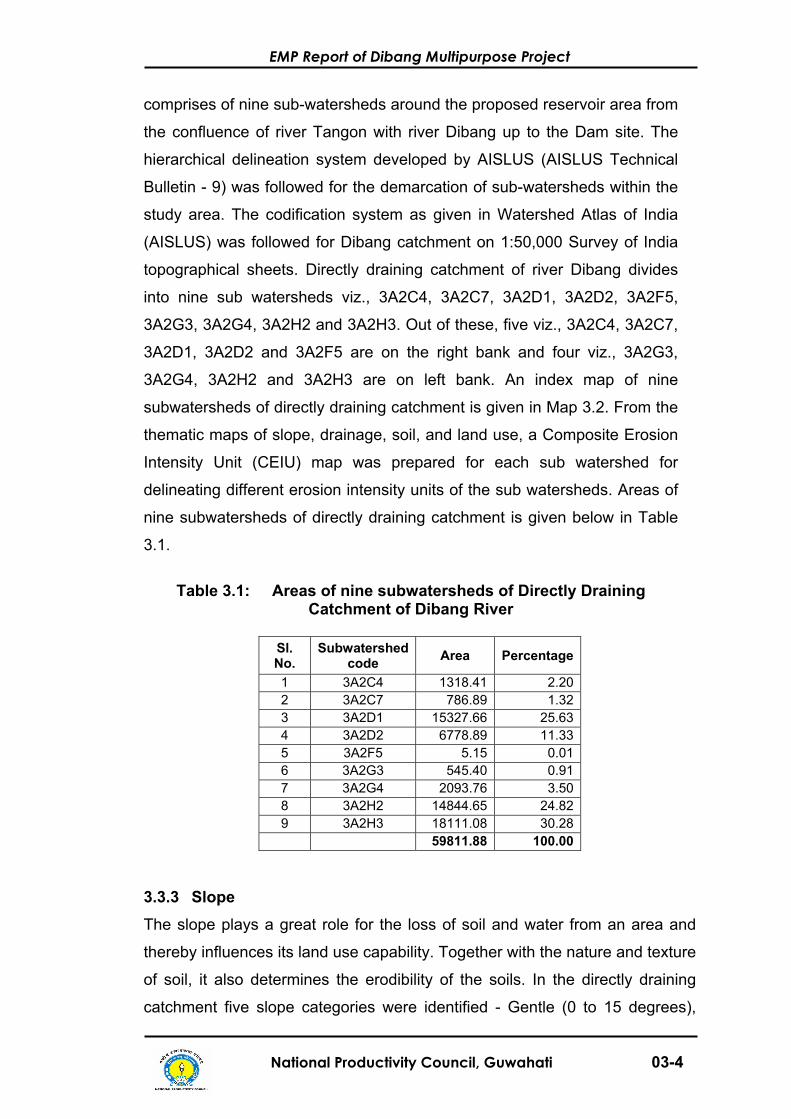
delineating different erosion intensity units of the sub watersheds. Areas of
nine subwatersheds of directly draining catchment is given below in Table
3.1.
Table 3.1: Areas of nine subwatersheds of Directly Draining Catchment of Dibang River
Sl. No.
Subwatershed code Area Percentage
1 3A2C4 1318.41 2.20 2 3A2C7 786.89 1.32 3 3A2D1 15327.66 25.63 4 3A2D2 6778.89 11.33 5 3A2F5 5.15 0.01 6 3A2G3 545.40 0.91 7 3A2G4 2093.76 3.50 8 3A2H2 14844.65 24.82 9 3A2H3 18111.08 30.28 59811.88 100.00
3.3.3 Slope The slope plays a great role for the loss of soil and water from an area and
thereby influences its land use capability. Together with the nature and texture
of soil, it also determines the erodibility of the soils. In the directly draining
catchment five slope categories were identified - Gentle (0 to 15 degrees),
EMP Report of Dibang Multipurpose Project
National Productivity Council, Guwahati 03-5
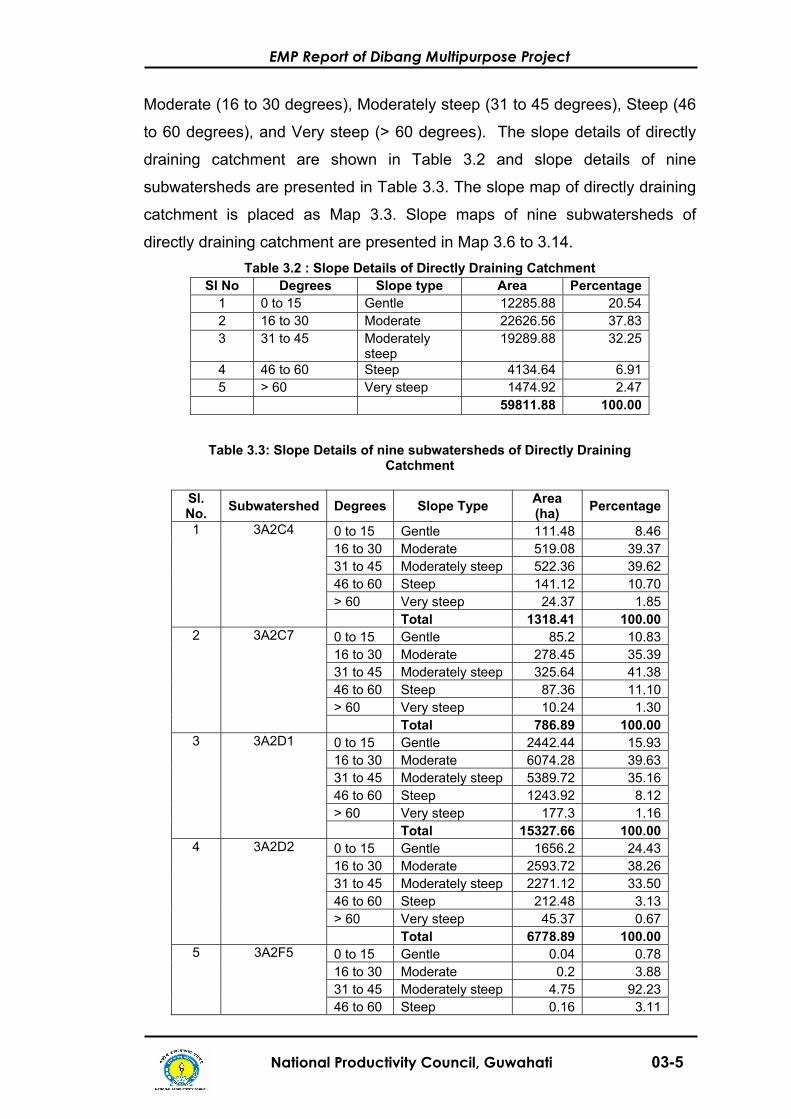
Moderate (16 to 30 degrees), Moderately steep (31 to 45 degrees), Steep (46
to 60 degrees), and Very steep (> 60 degrees). The slope details of directly
draining catchment are shown in Table 3.2 and slope details of nine
subwatersheds are presented in Table 3.3. The slope map of directly draining
catchment is placed as Map 3.3. Slope maps of nine subwatersheds of
directly draining catchment are presented in Map 3.6 to 3.14. Table 3.2 : Slope Details of Directly Draining Catchment
Sl No Degrees Slope type Area Percentage 1 0 to 15 Gentle 12285.88 20.54 2 16 to 30 Moderate 22626.56 37.83 3 31 to 45 Moderately
steep 19289.88 32.25
4 46 to 60 Steep 4134.64 6.91 5 > 60 Very steep 1474.92 2.47 59811.88 100.00
Table 3.3: Slope Details of nine subwatersheds of Directly Draining
Catchment
Sl. No. Subwatershed Degrees Slope Type Area
(ha) Percentage
0 to 15 Gentle 111.48 8.4616 to 30 Moderate 519.08 39.3731 to 45 Moderately steep 522.36 39.6246 to 60 Steep 141.12 10.70> 60 Very steep 24.37 1.85
1 3A2C4
Total 1318.41 100.000 to 15 Gentle 85.2 10.8316 to 30 Moderate 278.45 35.3931 to 45 Moderately steep 325.64 41.3846 to 60 Steep 87.36 11.10> 60 Very steep 10.24 1.30
2
3A2C7
Total 786.89 100.000 to 15 Gentle 2442.44 15.9316 to 30 Moderate 6074.28 39.6331 to 45 Moderately steep 5389.72 35.1646 to 60 Steep 1243.92 8.12> 60 Very steep 177.3 1.16
3
3A2D1
Total 15327.66 100.000 to 15 Gentle 1656.2 24.4316 to 30 Moderate 2593.72 38.2631 to 45 Moderately steep 2271.12 33.5046 to 60 Steep 212.48 3.13> 60 Very steep 45.37 0.67
4
3A2D2
Total 6778.89 100.000 to 15 Gentle 0.04 0.7816 to 30 Moderate 0.2 3.8831 to 45 Moderately steep 4.75 92.23
5 3A2F5 46 to 60 Steep 0.16 3.11

EMP Report of Dibang Multipurpose Project
National Productivity Council, Guwahati 03-6
> 60 Very steep 0 0.00 Total 5.15 100.00
0 to 15 Gentle 187.36 34.3516 to 30 Moderate 89.52 16.4131 to 45 Moderately steep 222.36 40.7746 to 60 Steep 38.92 7.14> 60 Very steep 7.24 1.33
6 3A2G3
Total 545.4 100.000 to 15 Gentle 167.6 8.0016 to 30 Moderate 721.36 34.4531 to 45 Moderately steep 814.6 38.9146 to 60 Steep 270.68 12.93> 60 Very steep 119.52 5.71
7 3A2G4
Total 2093.76 100.000 to 15 Gentle 2168.04 14.6016 to 30 Moderate 4663.68 31.4231 to 45 Moderately steep 5335.05 35.9446 to 60 Steep 1678.16 11.30> 60 Very steep 999.72 6.73
8 3A2H2
Total 14844.65 100.000 to 15 Gentle 5467.52 30.1916 to 30 Moderate 7686.27 42.4431 to 45 Moderately steep 4404.28 24.3246 to 60 Steep 461.84 2.55> 60 Very steep 91.16 0.50
9 3A2H3
Total 18111.07 100.00 Grand Total 59811.88
3.3.4 Land Use/ Land Cover Mapping Land use and land cover mapping of the study area was carried out by
standard methods of analysis of data through remote sensing technique
coupled with GIS, followed by ground truthing. Geo-coded LISS-III data on CD
ROMs and hard copies on the scale 1: 50,000 (available for the year 2003)
were procured for digital image processing and preparation of thematic maps.
Survey of India topographic sheets 82P/5, 82P/6, 82P/9, 82P/10, 82P/11,
82P/13, 82P/14, 82P/15, 82P/16, 82O/16, 91D/1, 91D/2, 91D/3, 91D/4, 91D/6,
91D/7, 91D/8 on 1:50,000 scale were used for the preparation of the base
maps. These topo sheets were also used for the delineation of sub-
watersheds of the immediate catchment of the project area. The sub-
watersheds were then overlaid on the drainage map and land use map for
determining drainage and land use details. All the thematic maps of
catchment, viz., base map, drainage map and land use / land cover map, etc.,

EMP Report of Dibang Multipurpose Project
National Productivity Council, Guwahati 03-7
were then transferred to Geographic Information System (GIS) for further
overlay analysis. The landuse landcover map is prepared using GIS mapping
where inputs of toposheets of the catchments area and satellite imageries are
used to come out with the land use / land cover pattern. The map is shown as
Map 3.4.
Forest
Dibang catchment is covered by trees and other vegetation types, which are
capable of producing timber and other forest produce. The vegetation are
mostly of Northern Tropical Semi Evergreen and North Indian Moist
Deciduous Forests. Varying degree of biotic disturbances, mainly due to
traditional practice of jhuming has been experienced by few patches of
forests. About 48.76 % (29163.44 ha) is dense forest whereas 12.41 %
(7419.88 ha) is open forest of total directly draining catchment. In the
proposed submergence area the dense mixed forest is limited along the bank
of the river.
Settlement and Agriculture
The catchment is lived by rural based settlement only, except few urban
areas. Mostly in these areas shifting cultivation is practiced, baring a few
patches like Hunli, reach between Ambolin to Anini etc., where terracing is
done.
Areas under agriculture / current jhum / habitation works out to be 6.44 %
(3851.64 ha) while degraded forest / abandoned jhum works out to be 17.19
% (10281.64 ha) of total area of directly draining catchment.
Snow Covered Area Snow covered areas constitute about 0.23 % (139.52 ha) of directly draining
catchment.
Barren / Rocky Area
Rock exposures of varying lithology, often barren and devoid of soil cover and
vegetation or covered with sparse vegetation, are noticed in the directly

EMP Report of Dibang Multipurpose Project
National Productivity Council, Guwahati 03-8
draining catchment. They occur generally as isolated exposure. The area
under this category works out to be 13.13 % (7852.32 ha).
Water Body
Water bodies, mainly comprising of river Dibang and its tributaries, constitute
about 1.84 % (1103.44 ha) of total directly draining catchment.
Landuse / landcover details of directly draining catchment is shown in Table
3.4 while land use / land cover maps of different subwatersheds of directly
draining catchment are presented in Map 3.6 to 3.14.
Table 3.4: Landuse Details of Directly Draining Catchment
Sl. No. Class Area (ha) Percentage
1 Dense Forest 29163.44 48.76
2 Open Forest 7419.88 12.41
3 Degraded forest / Abondoned Jhum
10281.64 17.19
4 Agriculture / Current Jhum / Habitation
3851.64 6.44
5 Barren / Rocky 7852.32 13.13
6 Water Body 1103.44 1.84
7 Snow 139.52 0.23
Total 59811.88 100.00
Table 3.5: Subwatershed wise Land use/Land cover Details
Sl. No.
Subwatershed code EIMU Area
Dense Forest 509.12 Open Forest 372.38 Degraded forest / Abondoned Jhum
185.16
Agriculture / Current Jhum / Habitation
49.6
Barren / Rocky 174.16 Water Body 27.99 Snow 0
1
3A2C4
Total 1318.41 Dense Forest 199.16 Open Forest 325.49
2
3A2C7
Degraded forest / Abondoned Jhum
78.28

EMP Report of Dibang Multipurpose Project
National Productivity Council, Guwahati 03-9
Agriculture / Current Jhum / Habitation
35.36
Barren / Rocky 82.36 Water Body 65.32 Snow 0.92
Total 786.89 Dense Forest 6748.4 Open Forest 1992.92 Degraded forest / Abondoned Jhum
2916.51
Agriculture / Current Jhum / Habitation
1143.64
Barren / Rocky 2199.48 Water Body 311.07 Snow 15.64
3
3A2D1
Total 15327.66 Dense Forest 3194.62 Open Forest 1012.92 Degraded forest / Abondoned Jhum
1134.64
Agriculture / Current Jhum / Habitation
394.92
Barren / Rocky 917.68 Water Body 102.91 Snow 21.2
4
3A2D2
Total 6778.89 Dense Forest 0.68 Open Forest 0 Degraded forest / Abondoned Jhum
0.68
Agriculture / Current Jhum / Habitation
1.16
Barren / Rocky 1.6 Water Body 1.03 Snow 0
5
3A2F5
Total 5.15 Dense Forest 130.08 Open Forest 173.37 Degraded forest / Abondoned Jhum
88.84
Agriculture / Current Jhum / Habitation
27.4
Barren / Rocky 78.2 Water Body 47.51 Snow 0
6
3A2G3
Total 545.4 Dense Forest 1390.04 Open Forest 107.76 Degraded forest / Abondoned Jhum
280.6
Agriculture / Current Jhum / Habitation
109.13
7
3A2G4
Barren / Rocky 187.72

EMP Report of Dibang Multipurpose Project
National Productivity Council, Guwahati 03-10
Water Body 18.51 Snow 0
Total 2093.76 Dense Forest 6860.2 Open Forest 1932.84 Degraded forest / Abondoned Jhum
2746.24
Agriculture / Current Jhum / Habitation
954.32
Barren / Rocky 2147.7 Water Body 199.87 Snow 3.48
8
3A2H2
Total 14844.65 Dense Forest 10131.14 Open Forest 1502.2 Degraded forest / Abondoned Jhum
2850.69
Agriculture / Current Jhum / Habitation
1136.11
Barren / Rocky 2063.42 Water Body 329.23 Snow 98.28
9
3A2H3
Total 18111.07 Grand Total 59811.88
Landuse details of submergence area are presented under Table 3.6 and Map 3.4A.
Table 3.6: Landuse of Submergence Area
Landuse class Area (ha) Percentage
Abondoned Jhum / Degraded forest 755.26 18.84 Current Jhum / Habitation / Settled cultivation 286.98 7.16 Dense Mixed Forest 1551.76 38.71 Open Forest 619.52 15.45 Rocky 560.42 13.98 Water Bodies 235.06 5.86 Total 4009.00 100.00
3.3.5 Soils Soil details of directly draining area are shown in Table 3.7 whereas soil map
of directly draining catchment is placed as Map 3.5.

EMP Report of Dibang Multipurpose Project
National Productivity Council, Guwahati 03-11
Table 3.7: Soil Details of Directly Draining Catchment
Sl. No.
Mapping Unit (As
per NBSS & LUP)
Soil Description Association with Erositivity Area (ha)
1 1 Shallow, excessively drained, loamy-skeletal
Moderately deep, excessively drained on moderately steep slope
Very severe
11151.52
2 2 Deep, loamy-skeletal
Deep, somewhat excessively drained loamy skeletal on moderately steep slope
Severe 1211.68
3 3 Shallow, loamy-skeletal
Moderately deep, somewhat excessively drained on moderately steep slope
Severe 11254.12
4 4 Shallow, loamy-skeletal
Moderately deep, somewhat excessively drained on very steep slope
Severe 21553.76
5 7 Very deep, fine soils
Moderately shallow, excessively drained clayey soils on steep slope
Severe 184.64
6 9 Deep, well drained fine soils
Very deep, well-drained, fine loamy soils on moderate slope
Moderate 7371.44
7 11 Very deep, well drained, fine loamy soils
On moderate slope, very deep well drained fine soils
Moderate 3389.12
8 46 Rocky mountains covered with perpetual snow and glaciers
- - 3695.6
Total 59811.88
3.3.6 Sediment Yield Index Model The Silt Yield Index Model developed by All India Soil & Land Use Survey
(Dept of Agriculture, Govt. of India) was followed for calculating sediment yield
index. The SYI model considering sedimentation as product of erosivity,

EMP Report of Dibang Multipurpose Project
National Productivity Council, Guwahati 03-12
erodibility and areal extent was conceptualized in the All India Soil & Land
Use Survey as early as 1969 and has been in operational use since then to
meet the requirements of prioritization of smaller hydrologic units within River
Valley Projects catchment areas.
The model conceptualizes sediment delivery from a hydrologic unit into a
reservoir as a multiplicative function of the potential soil detachment
representing the erosivity factor; the transportability of the detached material
(delivery ratio) and the area of the hydrologic entity. This can be expressed
as:
Sediment yield = f (Erosivity of soil x delivery ratio x area of hydrologic unit)
The erosivity is simulated with the sediment yield weightage value which is
based on assessment of the composite effect of assemblage of erosivity
determinants whereas, the delivery ratio is adjudged by the likely delivery of
the eroded material into the reservoir.
3.3.7 Sediment Yield Weightage Value
The erosivity determinants are the soil and land attributes that have direct or
reciprocal bearing on the unit of the detached soil material. The relationship
can be expressed as:
Soil erosivity = f (slope, soil parameters, land use / land cover)
The functional behaviour of each of the attributes is discussed in the following
paras:
(a) Slope: As the slope becomes steeper, the runoff coefficient increases,
the kinetic energy and carrying capacity of the surface flow becomes
greater, soil stability and as well the slope stability decreases and
splash erosion increases.
(b) Land use / land cover: Covers including plant canopy, plant residues,
mulches or dense growing plants greatly modify the effect of rainfall
and thus affect soil erosion. The plant canopy intercepts raindrops and
the water dripping of the leaves is less erosive than unhindered
EMP Report of Dibang Multipurpose Project
National Productivity Council, Guwahati 03-13
raindrops. Moreover, the detachment of sediments does not occur on
the portion of the covered soil surface because the drops are
intercepted and there is no fall distance for drops to regain energy. The
surface cover also slows down the run-off thus increasing flow depth
which further decreases detachment by cushioning the impact of
raindrops and reducing their hydrodynamic impact forces (Mutchler
and Young, 1975).
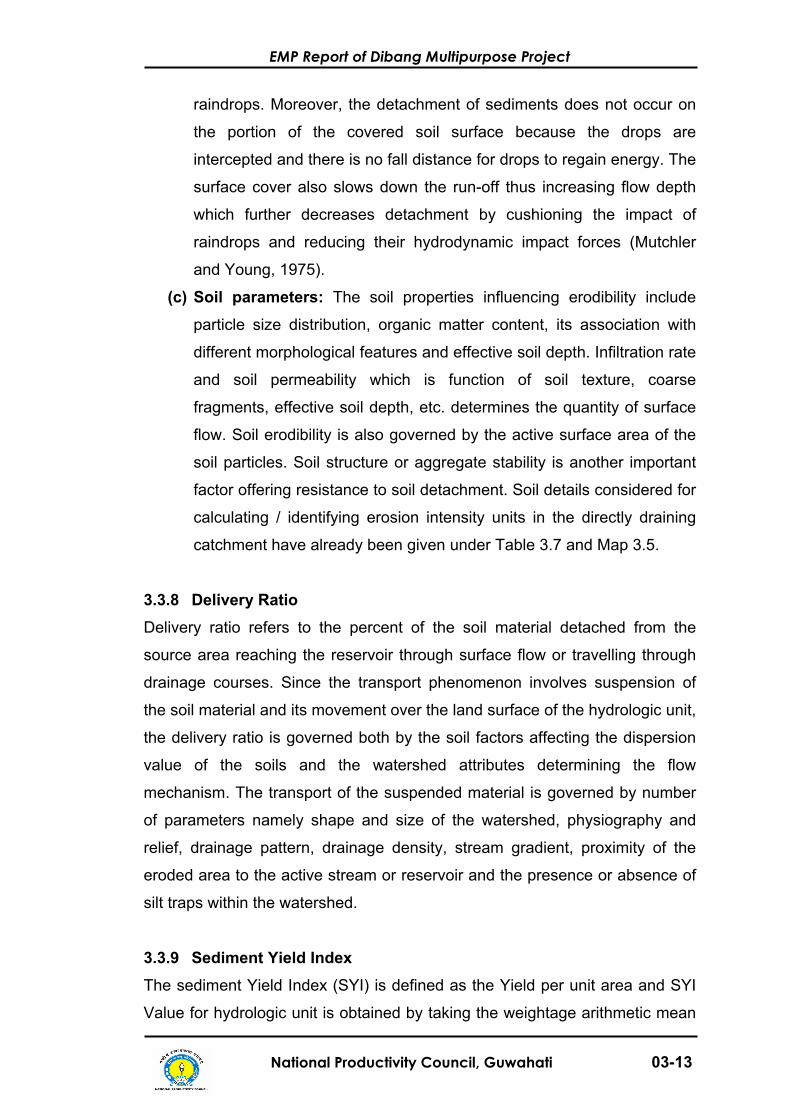
(c) Soil parameters: The soil properties influencing erodibility include
particle size distribution, organic matter content, its association with
different morphological features and effective soil depth. Infiltration rate
and soil permeability which is function of soil texture, coarse
fragments, effective soil depth, etc. determines the quantity of surface
flow. Soil erodibility is also governed by the active surface area of the
soil particles. Soil structure or aggregate stability is another important
factor offering resistance to soil detachment. Soil details considered for
calculating / identifying erosion intensity units in the directly draining
catchment have already been given under Table 3.7 and Map 3.5.
3.3.8 Delivery Ratio Delivery ratio refers to the percent of the soil material detached from the
source area reaching the reservoir through surface flow or travelling through
drainage courses. Since the transport phenomenon involves suspension of
the soil material and its movement over the land surface of the hydrologic unit,
the delivery ratio is governed both by the soil factors affecting the dispersion
value of the soils and the watershed attributes determining the flow
mechanism. The transport of the suspended material is governed by number
of parameters namely shape and size of the watershed, physiography and
relief, drainage pattern, drainage density, stream gradient, proximity of the
eroded area to the active stream or reservoir and the presence or absence of
silt traps within the watershed.
3.3.9 Sediment Yield Index The sediment Yield Index (SYI) is defined as the Yield per unit area and SYI
Value for hydrologic unit is obtained by taking the weightage arithmetic mean

EMP Report of Dibang Multipurpose Project
National Productivity Council, Guwahati 03-14
of the products of the weightage value and delivery ratio over the entire area
of the hydrologic unit by using suitable empirical equation.
3.3.10 Prioritization of Subwatersheds
The prioritization of the hydrologic units within the vast catchments is based
on the Sediment Yield Indices (SYI) of the smaller units. The subwatersheds
are subsequently rated into various categories corresponding to their
respective values.
3.4 METHODOLOGY FOR PRIORITIZATION
The various steps involved in the application of model are:
- Preparation of a framework of subwatersheds through systematic
delineation and codification.
- Rapid reconnaissance surveys leading to the generation of a map
indicating erosion-intensity mapping units (EIMUs).
- Assignment of weightage values to various mapping units based on
relative silt-yield.
- Assignment of maximum delivery ratios to various erosion intensity
mapping units and assessment of adjusted delivery ratios for different
subwatersheds.
- Computing Silt-Yield Index for individual subwatersheds.
- Grading of subwatersheds into very severe, severe, moderate, slight
and very slight priority categories.
3.5 ASSIGNMENT OF EROSIVITY WEIGHTAGE VALUE
The composite erosion-intensity mapping units were assigned relative
erosivity values adjudged to be indicative of the combined effect of dynamic
inter-relationship of the factors in terms of active erosivity of the units. The
erosivity values were assessed as resultant of combined and reciprocal
influence of a set of the factors viz., slope, land use and cover conditions, and
soil characteristics.
For comparing different erosivity determinant attributed of various mapping
units a statement on differentiating characteristics of the units was prepared

EMP Report of Dibang Multipurpose Project
National Productivity Council, Guwahati 03-15
and the relative values assigned to different units in a rational manner. A
factor k, rated as an inertia factor signifying equilibrium between erosion and
sedimentation was assigned erosivity value of 10 and was taken as a
standard reference for comparison and proportional additions or subtractions
from this basic value in discrete numbers were made assessing the collective
effect of different attributes corresponding to potential sediment yield. Any
addition to this factor is indicative of erosion roughly in proportion to the added
factor whereas the subtraction is suggestive of the deposition possibilities.
The erosivity values ranging from 8 (k-2) to 30 (k+20) have so far been
assigned to various subwatersheds.
The details of areas falling in different Erosion Intensity Mapping Units
(EIMUs) in the directly draining catchment is given in Table 3.8. The erosion
intensity map of directly draining catchment is placed as Map 3.15. Erosion
intensity maps of different subwatersheds of directly draining catchment are
presented in Map 3.6 to 3.14.
Table 3.8: EIMU Details
Sl. No. EIMU Category Area (ha) Percentage
1 Very severe 419.6 0.70 2 Severe 10119.96 16.92 3 Moderate 12598.84 21.06 4 Slight 22627.94 37.83 5 Very slight 12802.58 21.40 6 Water body 1103.44 1.84 7 Snow 139.52 0.23 59811.88 100.00
3.6 ASSIGNMENT OF DELIVERY RATIOS (DRS) The delivery ratios were adjusted suitably for individual subwatersheds to
account for the deposition of the detached material enroute the reservoir site.
The distance of subwatershed from the reservoir site was considered as the
major factor for adjusting the DR values. The criteria adopted for assigning
EMP Report of Dibang Multipurpose Project
National Productivity Council, Guwahati 03-16
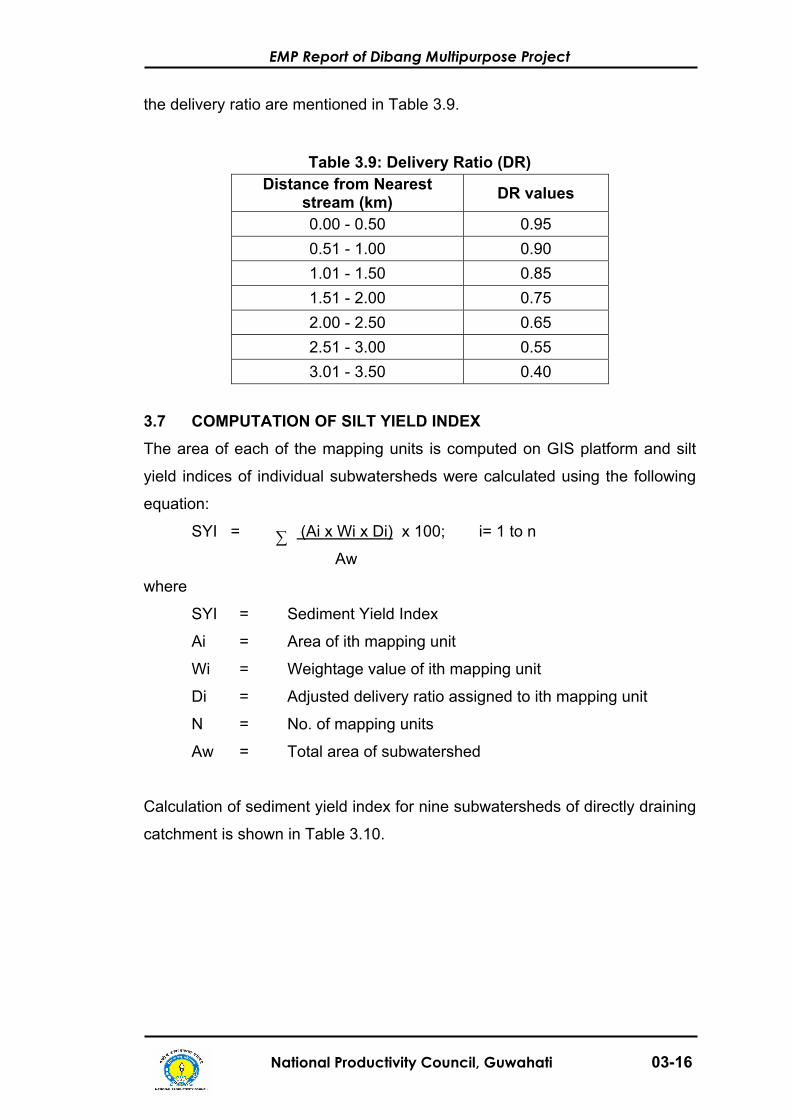
the delivery ratio are mentioned in Table 3.9.
Table 3.9: Delivery Ratio (DR) Distance from Nearest
stream (km) DR values
0.00 - 0.50 0.95 0.51 - 1.00 0.90 1.01 - 1.50 0.85 1.51 - 2.00 0.75 2.00 - 2.50 0.65 2.51 - 3.00 0.55 3.01 - 3.50 0.40
3.7 COMPUTATION OF SILT YIELD INDEX
The area of each of the mapping units is computed on GIS platform and silt
yield indices of individual subwatersheds were calculated using the following
equation:
SYI = (Ai x Wi x Di) x 100; i= 1 to n
Aw
where
SYI = Sediment Yield Index
Ai = Area of ith mapping unit
Wi = Weightage value of ith mapping unit
Di = Adjusted delivery ratio assigned to ith mapping unit
N = No. of mapping units
Aw = Total area of subwatershed
Calculation of sediment yield index for nine subwatersheds of directly draining
catchment is shown in Table 3.10.
∑

EMP
Repo
rt of
Dib
ang
Mul
tipur
pose
Pro
ject
N
atio
nal P
rodu
ctiv
ity C
ounc
il, G
uwah
ati
0
3-17
Tabl
e 3.
10: C
alcu
latio
n of
Sed
imen
t Yie
ld In
dex
Sl. N
o.
Subw
ater
shed
co
de
EIM
U
Are
a W
eigh
tage
A
rea
x
Wei
ghta
ge
Del
iver
y R
atio
G
ross
se
dim
ent y
ield
Sedi
men
t yi
eld
inde
x
1 3A
2C4
Ver
y se
vere
2.00
2550
.00
0.95
47.5
0-
Sev
ere
15
3.84
2132
30.6
40.
9029
07.5
8-
Mod
erat
e
259.
4418
4669
.92
0.80
3735
.94
-
S
light
641.
6015
9624
.00
0.70
6736
.80
-
V
ery
slig
ht
23
3.54
1228
02.4
80.
6016
81.4
9-
Wat
er b
ody
27.9
90
0.00
0.00
0.00
-
S
now
0.00
00.
000.
000.
00-
13
18.4
1
1510
9.30
1146
.02
2
3A2C
7 V
ery
seve
re
2.
1625
54.0
00.
9551
.30
-
S
ever
e
78.9
621
1658
.16
0.90
1492
.34
-
M
oder
ate
11
9.88
1821
57.8
40.
8017
26.2
7-
Slig
ht
46
4.09
1569
61.3
50.
7048
72.9
5-
Ver
y sl
ight
55.5
612
666.
720.
6040
0.03
-
W
ater
bod
y
65
.32
00.
000.
000.
00-
Sno
w
0.
920
0.00
0.00
0.00
-
786.
89
8542
.89
1085
.65
- 3
3A2D
1 V
ery
seve
re
94
.12
2523
53.0
00.
9522
35.3
5-
Sev
ere
32
35.7
221
6795
0.12
0.90
6115
5.11
-
M
oder
ate
32
55.6
418
5860
1.52
0.80
4688
1.22
-
S
light
5988
.55
1589
828.
250.
7062
879.
78-

EMP
Repo
rt of
Dib
ang
Mul
tipur
pose
Pro
ject
N
atio
nal P
rodu
ctiv
ity C
ounc
il, G
uwah
ati
0
3-18
Ver
y sl
ight
2426
.92
1229
123.
040.
6017
473.
82-
Wat
er b
ody
311.
070
0.00
0.00
0.00
-
S
now
15.6
40
0.00
0.00
0.00
-
1532
7.66
19
0625
.27
1243
.67
- 4
3A2D
2 V
ery
seve
re
1.
2425
31.0
00.
9529
.45
-
S
ever
e
987.
5621
2073
8.76
0.90
1866
4.88
-
M
oder
ate
14
58.8
818
2625
9.84
0.80
2100
7.87
-
S
light
1693
.68
1525
405.
200.
7017
783.
64-
Ver
y sl
ight
2513
.42
1230
161.
040.
6018
096.
62-
Wat
er b
ody
102.
910
0.00
0.00
0.00
-
S
now
21.2
00
0.00
0.00
0.00
-
6778
.89
75
582.
4711
14.9
7
-
5 3A
2F5
Ver
y se
vere
0.00
250.
000.
950.
00-
Sev
ere
1.
0821
22.6
80.
9020
.41
-
M
oder
ate
2.
3618
42.4
80.
8033
.98
-
S
light
0.68
1510
.20
0.70
7.14
-
V
ery
slig
ht
0.
0012
0.00
0.60
0.00
-
W
ater
bod
y
1.
030
0.00
0.00
0.00
-
S
now
0.00
00.
000.
000.
00-
5.
15
61.5
411
94.8
7
-
6 3A
2G3
Ver
y se
vere
1.24
2531
.00
0.95
29.4
5-
Sev
ere
72
.80
2115
28.8
00.
9013
75.9
2-
Mod
erat
e
125.
0818
2251
.44
0.80
1801
.15
-
S
light
173.
2115
2598
.15
0.70
1818
.71
-

EMP
Repo
rt of
Dib
ang
Mul
tipur
pose
Pro
ject
N
atio
nal P
rodu
ctiv
ity C
ounc
il, G
uwah
ati
0
3-19
Ver
y sl
ight
125.
5612
1506
.72
0.60
904.
03-
Wat
er b
ody
47.5
10
0.00
0.00
0.00
-
S
now
0.00
00.
000.
000.
00-
54
5.40
59
29.2
610
87.1
4
-
7 3A
2G4
Ver
y se
vere
42.2
425
1056
.00
0.95
1003
.20
-
S
ever
e
329.
4021
6917
.40
0.90
6225
.66
-
M
oder
ate
32
1.84
1857
93.1
20.
8046
34.5
0-
Slig
ht
11
88.2
915
1782
4.35
0.70
1247
7.05
-
V
ery
slig
ht
19
3.48
1223
21.7
60.
6013
93.0
6-
Wat
er b
ody
18.5
10
0.00
0.00
0.00
-
S
now
0.00
00.
000.
000.
00-
20
93.7
6
2573
3.46
1229
.05
- 8
3A2H
2 V
ery
seve
re
27
0.88
2567
72.0
00.
9564
33.4
0-
Sev
ere
29
21.3
221
6134
7.72
0.90
5521
2.95
-
M
oder
ate
34
77.8
418
6260
1.12
0.80
5008
0.90
-
S
light
6388
.20
1595
823.
000.
7067
076.
10-
Ver
y sl
ight
1583
.06
1218
996.
720.
6011
398.
03-
Wat
er b
ody
199.
870
0.00
0.00
0.00
-
S
now
3.48
00.
000.
000.
00-
14
844.
65
1902
01.3
812
81.2
8
-
9 3A
2H3
Ver
y se
vere
5.72
2514
3.00
0.95
135.
85-
Sev
ere
23
39.2
821
4912
4.88
0.90
4421
2.39
-
M
oder
ate
35
77.8
818
6440
1.84
0.80
5152
1.47
-
S
light
6089
.64
1591
344.
600.
7063
941.
22-
EMP
Repo
rt of
Dib
ang
Mul
tipur
pose
Pro
ject
N
atio
nal P
rodu
ctiv
ity C
ounc
il, G
uwah
ati
0
3-20
Ver
y sl
ight
5671
.04
1268
052.
480.
6040
831.
49-
Wat
er b
ody
329.
230
0.00
0.00
0.00
-
S
now
98.2
80
0.00
0.00
0.00
-
1811
1.07
20
0642
.42
1107
.84

EMP Report of Dibang Multipurpose Project
National Productivity Council, Guwahati 03-21
3.8 PRIORITIZATION OF SUBWATERSHEDS
The gradation and assignment of priority ratings to the subwatersheds are
based on the descending values of SYI values. As per the methodology of
priority delineation of AISLUS the priority categories that have been classified
based on the SYI values, are given in Table 3.11:
Table 3.11: Relation of Priority Categories and SYI Values
S. No. Priority Category SYI values 1 Very high > 1300 2 High 1200 - 1299 3 Medium 1100 - 1199 4 Low 1000 - 1099 5 Very low < 1000
SYI values assigned to nine subwatersheds of directly draining catchment is
given below in Table 3.12
Table 3.12: SYI Values assigned to different subwatersheds
S. No. Subwatershed SYI value 1 3A2C4 1146 2 3A2C7 1086 3 3A2D1 1244 4 3A2D2 1115 5 3A2F5 1195 6 3A2G3 1087 7 3A2G4 1229 8 3A2H2 1281 9 3A2H3 1108
Based on the above criterion of AISLUS following priority categories in Table
3.13 have been assigned to the nine subwatersheds of directly draining
catchment:

EMP Report of Dibang Multipurpose Project
National Productivity Council, Guwahati 03-22
Table 3.13: Priority ranking assigned to different subwatersheds
S. No. Priority ranking SYI value Priority 1 3A2H2 1281 High 2 3A2D1 1244 High 3 3A2G4 1229 High 4 3A2F5 1195 Medium 5 3A2C4 1146 Medium 6 3A2D2 1115 Medium 7 3A2H3 1108 Medium 8 3A2G3 1087 Low 9 3A2C7 1086 Low
3.9 AREA IDENTIFIED FOR CAT For the catchment area treatment areas falling under very severe and severe
erosion intensity categories i.e., 10539.56 ha will be required for treatment.
The subwatersheds to be taken first and thereafter should be as per the
above priority ranking. Various engineering and bioengineering measures like
brushwood check dams, contour bunding, gabion structures, loose boulder
check dams and silt retention dams are suggested for the very severe and
severe erosion intensity areas. In addition, biological measures like plantation
of shrubs and trees are also suggested for these areas.
In the upper catchment of the subwatersheds brushwood check dams are
proposed to control the erosion in the first order basin. The whole length of
the streams are segmented into 50 m interval and depending upon the
gradient a total of 1276 brushwood check dams are proposed. In first order
basin in the lower reaches, where discharge is higher and valley length is
less, at 30 m intervals loose boulder check dams are proposed. Therefore, a
total of 768 loose boulder check dams are proposed. In those areas where
discharge is much higher, 259 gabion structures are proposed. In those areas
where erosion intensity is severe and very severe countour bunding is
proposed. Therefore, a total of 82 contour bunding will be constructed. In third
order and more than third order basin 124 silt retention dams are proposed. It
is seen that about 12 % and 18 % of the area are composed of open forest

EMP Report of Dibang Multipurpose Project
National Productivity Council, Guwahati 03-23
and degraded forest / abandoned jhum, respectively. Therefore, about 12 %
of the total area of subwatershed shall be treated by means of plantation.
3.10 PERIOD AND SCHEDULE OF IMPLEMENTATION The plan needs to be implemented in a phased manner so as to attain the
goals set successfully. Keeping in view the local topography and climate, it is
proposed to complete the CAT programme in five years (Table 3.14). The
year wise break-up of the CAT work in different subwatersheds is given in
Table 3.15 to 3.23 and Maps 3.16 to 3.24.
Table 3.14: Details of the Engineering and biological works to be undertaken under CAT Plan for the Dibang Multipurpose project
S. No
Subwa-tershed
Brushwood check Dam
(Nos.)
Contour bunding
(Nos.)
Gabion Structure
(Nos.)
Loose Bolder Check Dam
(Nos.)
Silt Retention
Dam (Nos.)
Plantation (ha)
1 3A2C4 24 0 0 18 0 10
2 3A2C7 12 0 0 0 0 6
3 3A2D1 402 24 80 242 40 244
4 3A2D2 118 10 28 70 14 72
5 3A2F5 2 2 1 0 0 1
6 3A2G3 8 0 0 0 0 6
7 3A2G4 48 2 16 36 2 26
8 3A2H2 384 26 76 230 38 232
9 3A2H3 278 18 58 172 28 173
Total 1276 82 259 768 124 770

EMP Report of Dibang Multipurpose Project
National Productivity Council, Guwahati 03-24
Table 3.15: Year-wise Treatment of subwatershed 3A2C4 of Dibang Multipurpose Project
Year Brushwood check Dam
(Nos.)
Contour bunding
(Nos.)
Gabion Structure
(Nos.)
Loose Bolder
Check Dam (Nos.)
Silt Retention
Dam (Nos.)
Plantation (ha)
1st 4 0 0 2 0 2
2nd 6 0 0 6 0 2
3rd 6 0 0 4 0 3
4th 4 0 0 6 0 2
5th 4 0 0 0 0 1
Total 24 0 0 18 0 10
Table 3.16: Year-wise Treatment of subwatershed 3A2C7 of Dibang Multipurpose Project
Year Brushwood check Dam
(Nos.)
Contour bunding
(Nos.)
Gabion Structure
(Nos.)
Loose Bolder
Check Dam(Nos.)
Silt Retention
Dam (Nos.)
Plantation (ha)
1st 2 0 0 0 0 1
2nd 2 0 0 0 0 1
3rd 4 0 0 0 0 2
4th 4 0 0 0 0 1
5th 0 0 0 0 0 1
Total 12 0 0 0 0 6
Table 3.17: Year-wise Treatment of subwatershed 3A2D1 of Dibang Multipurpose Project
Year Brushwood check Dam
(Nos.)
Contour bunding
(Nos.)
Gabion Structure
(Nos.)
Loose Bolder
Check Dam(Nos.)
Silt Retention
Dam (Nos.)
Plantation (ha)
1st 80 2 12 40 6 38

EMP Report of Dibang Multipurpose Project
National Productivity Council, Guwahati 03-25
2nd 110 6 20 54 16 48
3rd 120 8 20 60 10 75
4th 62 4 16 52 6 53
5th 30 4 12 36 2 30
Total 402 24 80 242 40 244
Table 3.18: Year-wise Treatment of subwatershed 3A2D2 of Dibang Multipurpose Project
Year Brushwood check Dam
(Nos.)
Contour bunding
(Nos.)
Gabion Structure
(Nos.)
Loose Bolder
Check Dam(Nos.)
Silt Retention
Dam (Nos.)
Plantation (ha)
1st 24 0 4 12 2 11
2nd 32 4 8 16 4 14
3rd 36 4 6 18 4 22
4th 18 2 4 14 4 16
5th 8 0 6 10 0 9
Total 118 10 28 70 14 72
Table 3.19: Year-wise Treatment of subwatershed 3A2F5 of Dibang Multipurpose Project
Year Brushwood check Dam
(Nos.)
Contour bunding
(Nos.)
Gabion Structure
(Nos.)
Loose Bolder
Check Dam(Nos.)
Silt Retention
Dam (Nos.)
Plantation (ha)
1st 0 0 0 0 0 1
2nd 2 0 1 0 2 0
3rd 0 2 0 0 0 0
4th 0 0 0 0 0 0
5th 0 0 0 0 0 0
Total 2 2 1 0 2 1

EMP Report of Dibang Multipurpose Project
National Productivity Council, Guwahati 03-26
Table 3.20: Year-wise Treatment of subwatershed 3A2G3 of Dibang Multipurpose Project
Year Brushwood check Dam
(Nos.)
Contour bunding
(Nos.)
Gabion Structure
(Nos.)
Loose Bolder
Check Dam(Nos.)
Silt Retention
Dam (Nos.)
Plantation (ha)
1st 2 0 0 0 0 1
2nd 2 0 0 0 0 1
3rd 4 0 0 0 0 2
4th 0 0 0 0 0 1
5th 0 0 0 0 0 1
Total 8 0 0 0 0 6
Table 3.21: Year-wise Treatment of subwatershed 3A2G4 of Dibang Multipurpose Project
Year Brushwood check Dam
(Nos.)
Contour bunding
(Nos.)
Gabion Structure
(Nos.)
Loose Bolder
Check Dam(Nos.)
Silt Retention
Dam (Nos.)
Plantation (ha)
1st 8 0 4 6 0 4
2nd 12 0 4 8 0 5
3rd 14 2 4 8 2 8
4th 8 0 4 8 0 6
5th 6 0 0 6 0 3
Total 48 2 16 36 2 26
Table 3.22: Year-wise Treatment of subwatershed 3A2H2 of Dibang Multipurpose Project
Year Brushwood check Dam
(Nos.)
Contour bunding
(Nos.)
Gabion Structure
(Nos.)
Loose Bolder
Check Dam(Nos.)
Silt Retention
Dam (Nos.)
Plantation (ha)
1st 76 4 12 38 4 36
2nd 106 6 20 52 14 46

EMP Report of Dibang Multipurpose Project
National Productivity Council, Guwahati 03-27
3rd 114 8 18 56 10 71
4th 60 4 14 50 6 51
5th 28 4 12 34 4 28
Total 384 26 76 230 38 232
Table 3.23: Year-wise Treatment of subwatershed 3A2H3 of Dibang Multipurpose Project
Year Brushwood check Dam
(Nos.)
Contour bunding
(Nos.)
Gabion Structure
(Nos.)
Loose Bolder
Check Dam(Nos.)
Silt Retention
Dam (Nos.)
Plantation (ha)
1st 54 2 8 28 4 27
2nd 78 4 14 38 10 34
3rd 82 6 14 44 8 53
4th 44 4 12 36 4 38
5th 20 2 10 26 2 21
Total 278 18 58 172 28 173
The prioritization of sub-watersheds for treatment measures has been done
with particular reference to the silt yield index and proximity with the reservoir
rim. The areas showing severe erosion intensity in all subwatersheds,
especially those located in the vicinity of the reservoir must be taken on
priority basis for the treatment programme. Shrubs and trees to be planted
under biological interventions have to be reared in the nursery to be created
for this purpose. No separate nursery is proposed for the CAT Plan as the one
proposed for Compensatory Afforestation Plan will serve the requirements of
the plans. The cost estimates for the creation and maintenance of the plant
nursery are given in the budget estimate for the Biodiversity Conservation
Plan. The year wise break up of the specific work to be undertaken in different
sub-watersheds is given in Table 3.24.
.

EMP Report of Dibang Multipurpose Project
National Productivity Council, Guwahati 03-28
Table 3.24: Year wise break up of the work to be done under CAT Plan
Year Brushwood check Dam
(Nos.)
Contour bunding
(Nos.)
Gabion Structure
(Nos.)
Loose Bolder
Check Dam(Nos.)
Silt Retention
Dam (Nos.)
Plantation (ha)
1st 250 8 40 126 16 121.00
2nd 350 20 67 174 46 151.00
3rd 380 30 62 190 34 236.00
4th 200 14 50 166 20 168.00
5th 96 10 40 112 8 94.00
Total 1276 82 259 768 124 770.00
3.11 DETAILS OF TREATMENT MEASURES WITH UNIT COST ESTIMATE Various engineering and biological measures as proposed above are
elaborated below. The details of cost as well as the type of work along with
rate, quantity, etc are given in Tables 3.24 to 3.25. The unit cost of the
engineering measures is as per the CPWD gazette (reference number S/O/R
1:1 2004-2005). For the biological measures the unit cost for plantation is
based on the Forest Department, Govt. of Arunachal Pradesh’s notification
no. FOR-01-42/Cons/2002/16, 128-188 T dated 30.06.2003.
3.11.1 Silt Retention Dams Silt Retention Dam is a concrete structure which constitutes of spillway in one
side and diversion in the other side. This kind of structure is useful for
retaining the silt where discharge is more and the slope is moderate around
100 to 250. Normally a free board of 0.5 m is provided and the cost estimation
and dimensions of a typical Silt Retention Dam is provided below-
Unit Cost Estimation of Silt Retention Dam
Depth of foundation = 1.5 mtrs
Height of Dam = 3mts from bed level
Top width = 1.5 mtrs
EMP Report of Dibang Multipurpose Project
National Productivity Council, Guwahati 03-29
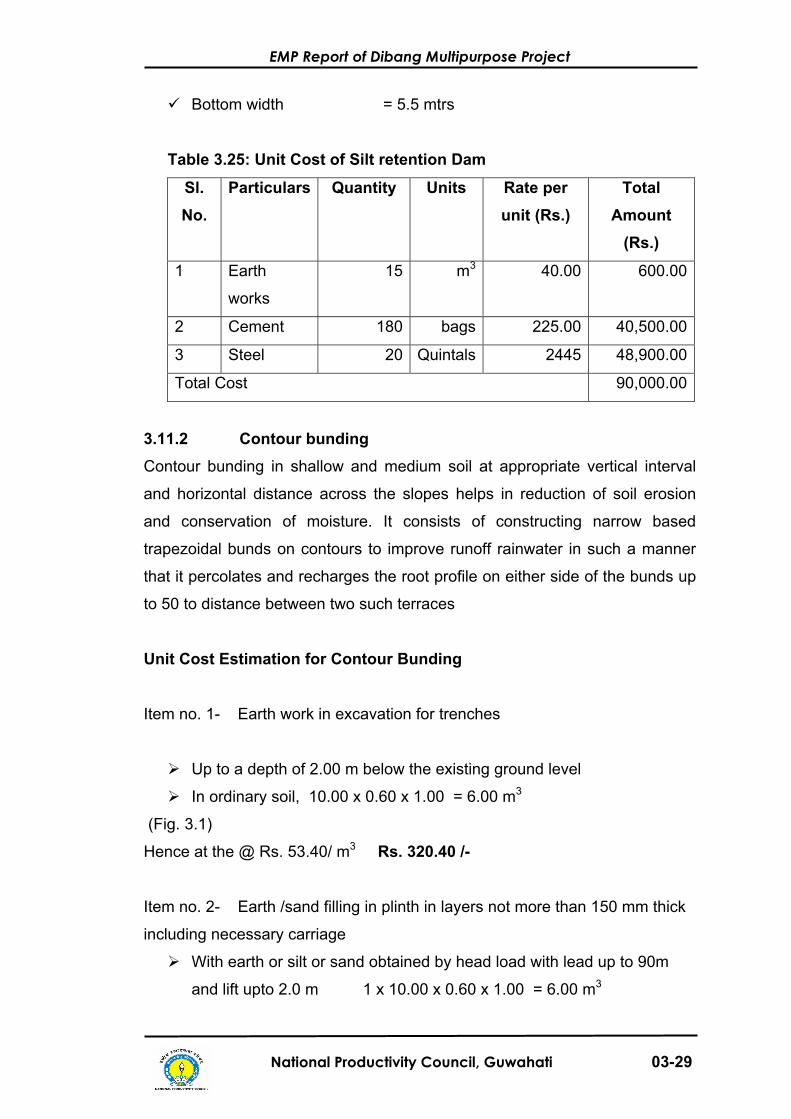
Bottom width = 5.5 mtrs
Table 3.25: Unit Cost of Silt retention Dam
Sl. No.
Particulars Quantity Units Rate per unit (Rs.)
Total Amount
(Rs.)
1 Earth
works
15 m3 40.00 600.00
2 Cement 180 bags 225.00 40,500.00
3 Steel 20 Quintals 2445 48,900.00
Total Cost 90,000.00
3.11.2 Contour bunding
Contour bunding in shallow and medium soil at appropriate vertical interval
and horizontal distance across the slopes helps in reduction of soil erosion
and conservation of moisture. It consists of constructing narrow based
trapezoidal bunds on contours to improve runoff rainwater in such a manner
that it percolates and recharges the root profile on either side of the bunds up
to 50 to distance between two such terraces
Unit Cost Estimation for Contour Bunding
Item no. 1- Earth work in excavation for trenches
Up to a depth of 2.00 m below the existing ground level
In ordinary soil, 10.00 x 0.60 x 1.00 = 6.00 m3
(Fig. 3.1)
Hence at the @ Rs. 53.40/ m3 Rs. 320.40 /-
Item no. 2- Earth /sand filling in plinth in layers not more than 150 mm thick
including necessary carriage
With earth or silt or sand obtained by head load with lead up to 90m
and lift upto 2.0 m 1 x 10.00 x 0.60 x 1.00 = 6.00 m3

EMP Report of Dibang Multipurpose Project
National Productivity Council, Guwahati 03-30
Hence at the @ Rs. 39.60/ m3 Rs. 237.60 /- Total = Rs. 558.00/- (Rupees Five hundred fifty eight only)
Illustration of countour bund is presented as Fig. 3.1.
Fig. 3.1: Schematic representation of Countour Bund
3.11.3 Brush Wood Check Dams Gullies are mainly formed on account of physiography, soil type and heavy
biotic interferences in an area. The scouring of streams at their peak flows
and sediment laden run-off cause gullies. Narrow gully can be treated with
brush wood check dams or plots to control gully erosion. Brushwood will be
available locally in abundance. The construction will be faster and the
catchment can be protected from gulley erosion. Subsequently this will help in
reducing sedimentation in the reservoir.
Before commencing the construction for the check dam, the sides of the gully

EMP Report of Dibang Multipurpose Project
National Productivity Council, Guwahati 03-31
at the selected sites are slopped to 1:1.5 and the gully bottom, for the whole
length of the dam, is lowered by about 15 cm. Also, 15 cm excavations are
carried up into the bank as high as required to give the necessary notch
capacity for discharging the run-off. The country wood stakes, about 10 cm to
13 cm in diameter are driven 0.90 m apart in two rows to go at least 0.90 m to
1.2 metre in to the hard bed of gully. The distance between the rows will be
0.9 m. The tops of the stakes are kept at such a height as to form a distinct
depression in the middle to form a notch of the required waterway to enable
the maximum run-off to discharge. The first layer of straw and brushwood is
laid across the gully between two rows of wood stakes. Over it long branches
of specially selected species are laid lengthwise of the gully and well pressed.
The process is repeated till the required height is obtained. The brush is
anchored on to the stakes by means of galvanised iron wire. Intermediate
stakes of shorter lengths are driven and the brush is anchored on to them to
prevent lifting form bed by water. Drawing of a typical Double Row Brush
wood Dam is presented in fig no- 3.15. Cost estimation for the Brushwood
Check Dam is placed below Table 3.28.
Table 3.26: Unit Cost of Brushwood Check Dam
Particulars Item QuantityRate (Rs.)
Unit Amount
(Rs.)
Survey & Alignment 1 100 Bund 100
Purchase & Transport of Wooden
Pegs (size-5 cm diameter 65 cm
length) 44A 10 16 Nos 160
Construction of Bund by fixing
wood pegs At dist. 20 cm in 2
rows & supporting soil & murum 45 10 16 Nos. 160
Plantation of Bushes at distance
of 0.5 m 2 25 bush 50
Plantation of trees at distance of
2.5 m 1 50 Plants 50

EMP Report of Dibang Multipurpose Project
National Productivity Council, Guwahati 03-32
Intercultivation 3 times 9 5 Plants 45
Total 565.00
Contingencies 2 % 11.30
Grand Total
576.30Say,
580.00
3.11.4 Loose Bolder Check Dam
Like brushwood check dam, loose boulder check dams can be made of
boulder piled up across the gulley if they are locally available. Such structures
for damming a gulley or a stream to refine the flow velocity are called loose
bolder check dams.
The site where the dam is to be erected is cleared and the sides are sloped to
1:1.5. The bed of the gully is excavated to a uniform depth of 0.30 m and the
dry boulders are packed over pressed straw from that level. In the centre of
the dam portion sufficient waterway is allowed to discharge the maximum run-
off from the catchment. The boulder filling should go up to 0.30 m to 0.60 m
into the stable portion of the gully side to prevent end cutting. In the rear
sufficient length (0.90 m) and width of apron has to be in the following table
3.29 cost estimation for loose boulder check dam is presented:
Table 3.27: Unit Cost of Loose Boulder Check Dam
Particulars Quantity Unit Rate (Rs.)
Amount(Rs.)
Survey & Alignment 1 per bund 10 10.00
Excavation on both banks 19.6 cu.m 23.5 460.60
Excavation for foundation 9.18 cu.m 23.5 215.73
Bund construction, collection of dry
rubble 36.25 cu.m. 35.25 1277.81
Foundation for pitching 2.94 cu.m. 23.5 69.09
Pitching on both Banks 10.9 sq.m 41.15 448.53

EMP Report of Dibang Multipurpose Project
National Productivity Council, Guwahati 03-33
Transportation charge for dry rubble 18.12 cu.m. 70.98 1286.16
Galvanized wire mesh 15 X 15 cm
wire mash having 3 mm diameter 150 sq.m 60 9000.00
Transportation of wire mesh up to 50
km 1
Rs. /total
Mesh 150 150.00
Survey during construction 1 Per bund 100 100.00
Total 13017.92
Contingencies 2 % 260.36
Grand Total
13278.28Say,
13278.00
provided to prevent scour. The thickness of apron packing should not be less
than 0.45 m and gully sides above apron have to be protected with stone
pitching to a height of at least 0.30 m above the anticipated maximum water
level to prevent side scouring. The boulders should be properly packed and
may be supported on the downstream side by putting few post.
Fig. 3.2: Schematic and pictorial representation of loose boulder check dam
It may be kept in mind that the stability of these structures is basically due to
the weight of the materials i.e. boulders. As the boulders are easily available
EMP Report of Dibang Multipurpose Project
National Productivity Council, Guwahati 03-34
in the streams/rivulets, such structures can easily be constructed.. Schematic
view of a typical loose boulder dam is presented in Fig. 3.2 & 3.3.
3.11.5 Gabion Structures
If loose boulders are considered not to be stable in a particular reach of the
stream, Gabion structure or stone masonry structures can be installed. This is
not very much encouraged because the terrain is stiff and the cement has to
be carried by human labour. Carrying the cement will be tedious, time
consuming and some times cement itself can set damaged during the
carriage or while it is stocked at site for use. Therefore with proper judgement
about the site conditions these structures may be installed. Cost estimates for
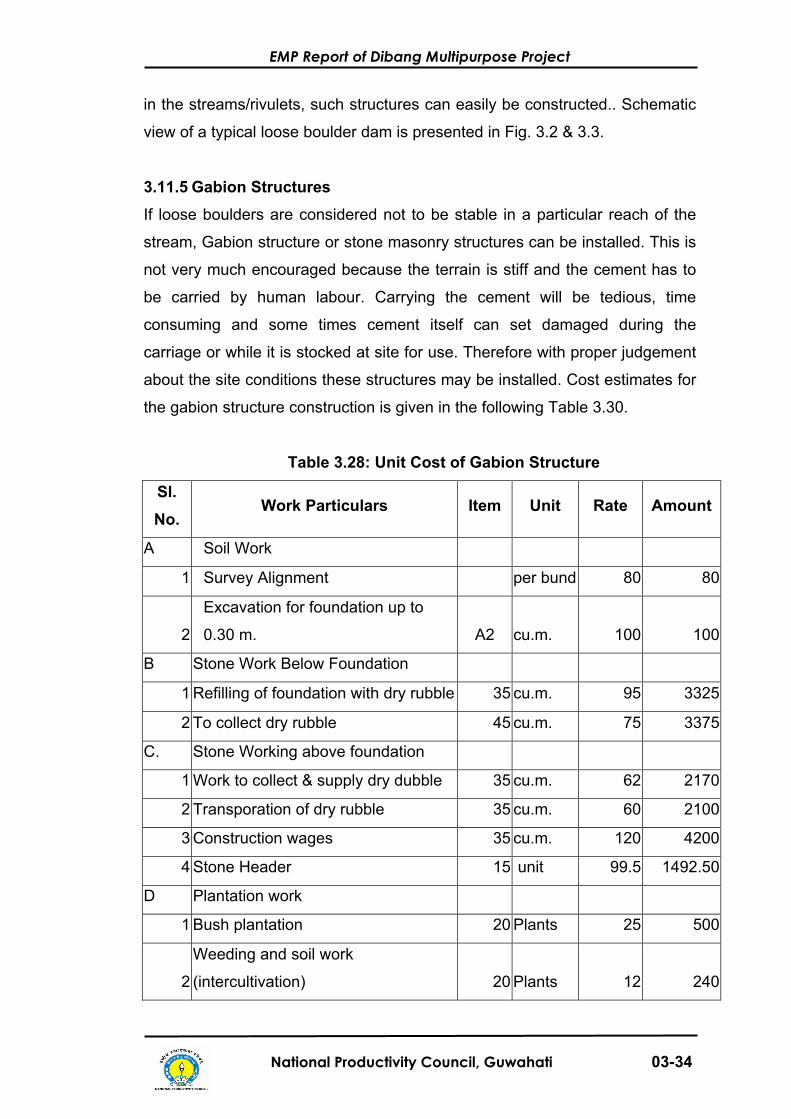
the gabion structure construction is given in the following Table 3.30.
Table 3.28: Unit Cost of Gabion Structure
Sl. No.
Work Particulars Item Unit Rate Amount
A Soil Work
1 Survey Alignment per bund 80 80
2
Excavation for foundation up to
0.30 m. A2 cu.m. 100 100
B Stone Work Below Foundation
1 Refilling of foundation with dry rubble 35 cu.m. 95 3325
2 To collect dry rubble 45 cu.m. 75 3375
C. Stone Working above foundation
1 Work to collect & supply dry dubble 35 cu.m. 62 2170
2 Transporation of dry rubble 35 cu.m. 60 2100
3 Construction wages 35 cu.m. 120 4200
4 Stone Header 15 unit 99.5 1492.50
D Plantation work
1 Bush plantation 20 Plants 25 500
2
Weeding and soil work
(intercultivation) 20 Plants 12 240

EMP Report of Dibang Multipurpose Project
National Productivity Council, Guwahati 03-35
Total 17582.5
Contingencies 2 % 355
Grand Total
17937.50Say,
17937.00
3.11.6 Biological Measures In order to help reduce the erosion of soil and its transport to the reservoir it is
suggested to undertake plantation of shrubs as well as trees, wherever the
soil characteristics permit, in the various subwatersheds. The best policy
would be to use following local shrubs and trees, especially Rosa webbiana,,
Macaranga denticulata, Salix sp., Populus sp., Prunus armenacia, Ailanthus
grandis, Altingia excelsa, Manglietia insignis, Amoora wallichi, Syzygium sp.
Terminalia myriocarpa, Duabanga grandiflora, Toona febrifuga etc. Besides
these species, the rare and endangered species that are found in the project
area like Aconitum ferox Wallich, Actinodaphne lanata Meissn., Coelogyne
mossiae Rolfe, Dendrobium aurantiacum Reichb. f. Paphiopedilum fairieanum
(Lindl.) Stein, P. venustum Pfitz., Syzygium manii (King) N. P. Balakrishnan
and Vanda coerulea Griff. ex Lindl. will be planted under CAT for their ex-situ
conservation and propagation. This would also help overcome the human
interference that might occur during the project construction. In the villages
that will get affected by the acquisition of land for different project activities
provision would also be made for raising horticultural plantation like apricot,
pineapples etc. The activity will be taken up on available suitable land in the
villages to boost the economy of the locals. A total of 770 ha of land are
proposed to be planted by different plant species as mentioned above.
3.12 ADMINISTRATIVE CHARGES An amount of Rs. 80 lakhs will be required to be kept under this head for
salary and related activities like engagement of staff on contractual basis to
perform specialised activities like salary, draftmanship etc.
3.13 ADMINISTRATIVE SETUP The catchment area treatment project involves intensive and highly technical

EMP Report of Dibang Multipurpose Project
National Productivity Council, Guwahati 03-36
operations, which require the expertise of technical personnel. It is therefore
recommended that the existing forest staff of Dibang Forest Division and Anini
Social Forestry Division may look after all the works to be carried out under
the CAT plan including plantation and maintenance as all the area to be
covered under CAT plan falls under both Dibang Forest Division and Anini
Social Forestry Division.
3.14 CONTINGENCY CHARGES This Component will take care of future wage hike, unseen expenses,
overflow of other components and other contingencies during implementation.
An amount of Rs. 64.81 lakhs has been kept for this purpose.
3.15 MONITORING, EVALUATION AND MAINTENANCE Monitoring and evaluation will be done as an inbuilt part of the project
management. It is most important for assessing the works carried out and the
results achieved vis-à-vis eco-restoration, etc. Annual work plan for each
range would be prepared well in advance specifying physical and financial
targets, sites, locations and beneficiaries of each component of the project
activity. Month-wise work schedule of various items of each component for the
financial year would also be prepared in advance and its timely
implementation would be ensured. The monitoring committee proposed in
Chapter-17 (Environmental Monitoring), would monitor the quality and
quantity of works carried out under the CAT program.
A sum of Rs. 100 lakhs will be required to be provided for monitoring and
evaluation. Under this component, independent agencies /consultants will be
engaged to make base line survey, mid-term survey and end of the project
survey to find out effectiveness of CAT plan activities in the catchment area.
Silt load and run-off rate also will be monitored at practically feasible strategic
points.
3.16 COST ESTIMATE
The total expenditure on the catchment area treatment plan to be
implemented over a period of five years is estimated to be Rs. 568.11 lakhs.

EMP Report of Dibang Multipurpose Project
National Productivity Council, Guwahati 03-37
The details are of cost are presented in Tables 3.29 and 3.30
Table 3.29: Sub watershed wise break-up of cost estimate on CAT Plan
(Rs. In lakhs)
S. No
Sub -watershed
Brushwood check Dam
(@ Rs. 580/dam)
Contour bunding (@ Rs.
558/bund)
Gabion Structure
(@ Rs. 17937/
structure)
Loose Bolder
Check Dam (@ Rs.
13278/dam)
Silt Retention Dam (@
Rs. 90000/ dam)
Plantation (@Rs.
38990/ha)
1 3A2C4 0.14 0.00 0.00 2.39 0.00 3.90
2 3A2C7 0.07 0.00 0.00 0.00 0.00 2.34
3 3A2D1 2.33 0.13 14.35 32.13 36.00 95.14
4 3A2D2 0.68 0.06 5.02 9.29 12.60 28.07
5 3A2F5 0.01 0.01 0.18 0.00 0.00 0.39
6 3A2G3 0.05 0.00 0.00 0.00 0.00 2.34
7 3A2G4 0.28 0.01 2.87 4.78 1.80 10.14
8 3A2H2 2.23 0.15 13.63 30.54 34.20 90.46
9 3A2H3 1.61 0.10 10.40 22.84 25.20 67.45
Total 7.40 0.46 46.46 101.98 111.60 300.22Grand Total 568.11

EMP
Repo
rt of
Dib
ang
Mul
tipur
pose
Pro
ject
N
atio
nal P
rodu
ctiv
ity C
ounc
il, G
uwah
ati
0
3-38
Tabl
e 3.
30: Y
ear-
wis
e es
timat
e of
cos
ts o
n di
ffere
nt tr
eatm
ent w
orks
Year
N
o.
Bru
sh
woo
d ch
eck
Dam
(N
os.)
Uni
t R
ate
(Rs.
) C
ost
(Lak
hs)
Con
tour
bu
ndin
g (N
os.)
Uni
t R
ate
(Rs.
) C
ost
(Lak
hs)
Gab
ion
Stru
ctur
e (N
os.)
Uni
t Rat
e (R
s.)
Cos
t (L
akhs
)
Loos
e B
olde
r C
heck
D
am
(Nos
.)
Uni
t Rat
e (R
s.)
Cos
t (L
akhs
)
Silt
Ret
entio
n D
am
(Nos
.)
Uni
t Rat
e (R
s.)
Cos
t (L
akhs
) Pl
anta
tion
(ha)
U
nit R
ate
(Rs.
) C
ost
(Lak
hs)
Tota
l C
ost
(Lak
hs)
1st
250
580.
00
1.45
8
558.
00
0.04
40
17
937.
007.
1712
613
278.
0016
.73
1690
000.
00
14.4
0 12
1 38
990.
0047
.18
86.9
8
2nd
350
580.
00
2.03
20
55
8.00
0.
11
67
1793
7.00
12.0
217
413
278.
0023
.10
4690
000.
00
41.4
0 15
1 38
990.
0058
.87
137.
54
3rd
380
580.
00
2.20
30
55
8.00
0.
17
62
1793
7.00
11.1
219
013
278.
0025
.23
3490
000.
00
30.6
0 23
6 38
990.
0092
.02
161.
34
4th
200
580.
00
1.16
14
55
8.00
0.
08
50
1793
7.00
8.97
166
1327
8.00
22.0
420
9000
0.00
18
.00
168
3899
0.00
65.5
011
5.75
5th
96
580.
00
0.56
10
55
8.00
0.
06
40
1793
7.00
7.17
112
1327
8.00
14.8
78
9000
0.00
7.
20
94
3899
0.00
36.6
566
.51
Tota
l 12
76
580.
00
7.40
82
55
8.00
0.
46
259
1793
7.00
46.4
676
813
278.
0010
1.98
124
9000
0.00
11
1.60
77
0 38
990.
0030
0.22
568.
11

EMP Report of Dibang Multipurpose Project
National Productivity Council, Guwahati 03-39
3.17 TOTAL COST OF CAT
Total cost of CAT is given below in Table 3.31:
Table 3.31: Total cost of Catchment Area Treatment
S. No. Particulars Cost (Rs. in lakhs)
1 CAT Measures 568.11
2 Administrative Charges, salaries etc. for 5
years
80.00
Subtotal 648.11
3 Contingency Charges 10% of above 64.81
4 Monitoring & Evaluation including
maintenance for 3 years
100.00
Total 812.92Say 813 lakhs
Note: The jeeps proposed in the Biodiversity Conservation & Management
Plan shall be used for the implementation of CAT plan also.