DACH Capital Market Study 31 Dec 2017 - value-trust.com · Executive Summary (1/2) 8 Companies...
94
Volume 2, March 2018 DACH Capital Market Study – 31 Dec 2017 Analysis of cost of capital parameters and multiples for the capital markets of Germany, Austria and Switzerland powered by and
-
Upload
hoangtuong -
Category
Documents
-
view
213 -
download
0
Transcript of DACH Capital Market Study 31 Dec 2017 - value-trust.com · Executive Summary (1/2) 8 Companies...

Volume 2, March 2018
DACH Capital Market Study – 31 Dec 2017
Analysis of cost of capital parameters and multiples for the capital markets of Germany, Austria and Switzerland
powered by and
DACH Capital Market Study – 31 December 2017
Table of Contents Page
1. Preface & people 3
2. Executive summary 7
3. Risk-free rate 10
4. Market returns and market risk premium 16
a. Implied returns (ex-ante analysis) 16b. Historical returns (ex-post analysis) 24
5. Sector classification of the DACH region 32
based on sector indices
6. Betas 35
7. Sector returns 38
a. Implied returns (ex-ante analysis) 38b. Historical returns (ex-post analysis) 58
8. Trading multiples 61
Appendix 68
2

Preface & people1

DACH Capital Market StudyPreface
Dear addressee,
We are pleased to release our second edition of the DACH1)
Capital Market Study powered by and . The study waselaborated by ValueTrust Financial Advisors SE (ValueTrust) in cooperationwith and the Institute of Auditing and Sustainability Accountingat the Johannes Kepler University Linz . With this study, we providea data compilation of the capital market parameters that enables anenterprise valuation in Germany, Austria, and Switzerland. It has thepurpose to serve as an assistant and data source as well as to show trendsof the analyzed parameters.
In this study, we analyze the relevant parameters to calculate the costs ofcapital with assistance of the Capital Asset Pricing Model (risk-free rate,market risk premium and beta). Additionally, we determine implied, as wellas historical market and sector returns. Moreover, this study includescapital structure adjusted implied sector returns, which serve as anindicator for the unlevered cost of equity. The relevered cost of equity canbe calculated by adapting the company specific debt situation to theunlevered cost of equity. This procedure serves as an alternative to theCAPM. Lastly, trading multiples frame the end of this study.
We examine the before mentioned parameters for the German, Austrianand Swiss capital market (in form of the CDAX2) , WBI3) , and SPI4) ). Theseindices have been merged into nine sector indices (so-called“super sectors"): FIRE (Finance, Insurance and Real Estate), BasicMaterials, Consumer Goods, Telecommunication, Industrials, ConsumerService, Pharma & Healthcare, Information Technology and Utilities.
The historical data from the reference dates between 2012 and 31December 2017 has been compiled and will be updated semi-annually,with the objective that historical, as well as current data, can be consultedat the same time. Furthermore, we can comprehend changes in time andthis allows to track the performance on all three capital markets.Additionally, further knowledge and information for financial decisionmaking is provided at www.finexpert.info.
The analyzed cost of capital data is accessible online atwww.firmvaluation.center by simply entering the reference date, therelevant sector and country. We would be pleased, if this study arousedyour interest. It would be our pleasure to answer all the questions youmight have and discuss the results of our analysis with you.
1) D (Germany), A (Austria), CH (Switzerland)
2) Composite German Stock Index
3) Vienna Stock Index
4) Swiss Performance Index
4
Prof. Dr. Christian AdersChairman of the Executive BoardValueTrust FinancialAdvisors SE
Prof. Dr. Ewald AschauerChair of Auditing and Sustainability Accounting, University of Linz
Prof. Dr. Bernhard SchwetzlerChair of Financial Management, HHL Leipzig

DACH Capital Market Study People
Prof. Dr. Bernhard Schwetzler, CVA
Chair of Financial Management, HHL Leipzig
Senior Advisor, ValueTrust Co-Founder and board member of the European Association of
Certifies Valuators and Analysts (EACVA e.V.)
Prof. Dr. Christian Aders, CEFA, CVA
Chairman of the Executive Board, ValueTrust
Almost 25 years of experience in corporate valuation and corporate finance consulting
Previously Partner at KPMG and Managing Director at Duff & Phelps
Honorary professor for "Practice of transaction-oriented company valuation and value-oriented management" at LMU Munich
Member of the DVFA Expert Group "Fairness Opinions" and "Best Practice Recommendations Corporate Valuation“
Co-Founder of the European Association of Certifies Valuators and Analysts (EACVA e.V.)
Florian Starck, Steuerberater
Member of the Executive Board, ValueTrust
Almost 20 years of project experience in corporate valuation and corporate finance consulting
Previously employed in leading positions at KPMG and Duff & Phelps
Extensive experience in complex company evaluations for business transactions, financial restructuring, court and arbitration proceedings and value-based management systems
Prof. Dr. Ewald Aschauer
Chair of Auditing and Sustainability Accounting, University of Linz
Senior Advisor, ValueTrust Member of the Working Group on Business Valuation of the
Austrian Chamber of Public Accountants and Tax Advisors Nominated expert in valuation disputes
5

DACH Capital Market StudyDisclaimer
This study presents an empirical analysis, which serves the purpose ofillustrating the cost of capital of Germany’s, Austria’s, and Switzerland’scapital markets. Nevertheless, the available information and thecorresponding exemplifications do not allow a complete exposure of aproper derivation of costs of capital. Furthermore, the market participanthas to take into account that the company specific costs of capital canvary widely due to individual corporate situations.
The listed information is not specified to anyone, and consequently, itcannot be directed to an individual or juristic person. Although we arealways endeavored to present information that is reliable, accurate, andcurrent, we cannot guarantee that the data is applicable to valuation inthe present as well as in the future. The same applies to our underlyingdata from the data provider S&P Capital IQ.
We recommend a self-contained, technical, and detailed analysis of theobserved situation, and we dissuade from taking action based on theprovided information only.
ValueTrust and its co-authors do not assume any liability for the up-to-datedness, completeness or accuracy of this study or its contents.
6

Executive summary2

Executive Summary (1/2)
8
Companies within the Pharma & Healthcare sector showed the highest unlevered sector specific betas as of31 December 2017 with the arithmetic mean standing at 0.93 for the five-year period and at 0.86 for thetwo year period. Companies within the Utilities sector had the lowest unlevered betas at 0.36 (two yearperiod).
The levered sector specific betas were highest again for the Pharma & Healthcare sector for the five-yearperiod (arithmetic mean) as of 31 December 2017. If we consider the two year period, the Basic Materialsand the Pharma & Healthcare sectors showed the same highest levered beta (arithmetic mean) and theUtilities sector was again the lowest.
Beta
The implied yearly market return of the German market remained relatively constant at 8.7% as of31 December 2017 compared to 8.6% as of 30 June 2017 with a market risk premium of 7.4% and 7.3%respectively.
The implied market return of the Austrian market2) decreased slightly from 8.3% as of 30 June 2017 to 8.1%as of 31 December 2017 and was below the German level. The market risk premium amounted to 6.8% asof 31 December 2017 and 6.9% as of 30 June 2017.
The implied market return of the Swiss market was the lowest in the DACH region with 7.2% as of31 December 2017 compared to 6.8% as of 30 June 2017. The market risk premium increased from 6.5% to6.8%.
Market returns and market risk premium
In comparison to 30 June 2017, the German risk-free rate increased from 1.24% to 1.29% as of31 December 2017.
The Austrian risk-free rate remained constant and amounted to 1.33% as of 30 June 2017 and31 December 2017.1)
The Swiss risk-free rate recorded an increase from 0.32% to 0.39% during the time period 30 June 2017 to31 December 2017. Overall, Switzerland has the lowest risk-free rate in comparison to Germany andAustria.
Risk-free rate
Chapter 6
Chapter 4
Chapter 3
1) Based on the respective yield curve, a uniform risk-free rate is derived under the assumption of present value equivalence to an infinite time horizon; this approach differs fromthe methodology in the ValueTrust Austria Capital Market Study. 2) Basis: ATX

Executive Summary (2/2)
9
The development of the implied sector returns shows a range for the levered implied sector returns of6.1% to 8.9% and 4.4% to 6.2% for the unlevered implied sector returns.
The ex-ante analysis of implied sector returns reveals that unlevered implied sector returns were highestfor companies in the Basic Materials sector at 6.2% (levered 7.5%) as of 31 December 2017.
The ex-post analysis of historical sector returns based on total shareholder returns highlights thatespecially companies of the Information Technology sector realized high total shareholder returns at 26.7%in the six- and 30.9% in the three-year average. The lowest historical returns of the sectors were realizedby the Utilities sector at 3.1% in the six- and 5.3% in the three-year average.
Sector returns
(p.a.)
Multiples
Chapter 7
Chapter 8
At the reference date 31 December 2017, the medians of the illustrated multiples EV/Revenue (1yf),EV/EBIT (1yf), P/E (1yf) and EqV/BV reached their highest level compared to the past six years when lookingat all analyzed companies in the DACH region.
The Pharma & Healthcare sector had the highest median EBIT-Multiples compared to all other sectors asof 31 December 2017. The median of the EBIT-Multiples amounted to 27.0x (LTM) and 24.1x (1yf).
The Information Technology sector represented the highest Price-to-Book Value-Multiples with a medianof 3.3x as of 31 December 2017.
The P/E-Multiples (1yf) increased in a constant manner from 13.2x (arithmetic mean) and 12.6x (median)in 2012 to 24.3x (arithmetic mean) and 21.7x (median) in the DACH region as of 31 December 2017.
The high total shareholder returns combined with comparably low implied returns point to the current highvaluation levels and even a possible over-valuation of the market.
Risk-free rate3

Risk-Free RateBackground & approach
The risk-free rate is a return available on a security that the marketgenerally regards as free of risk of default. It serves as an input parameterfor the CAPM and to determine the risk-adequate cost of capital.
The risk-free rate is a yield, which is obtained from long-term governmentbonds of countries with top notch rating. By using interest rate data fromdifferent maturities, a yield curve can be estimated for fictitious zerocoupon bonds (spot rates) for a period of up to 30 years. Therefore, theGerman Central Bank (Deutsche Bundesbank) and the Swiss National Bank(Schweizer Nationalbank) publish – on a daily basis – the parametersneeded to determine the yield curve using the Svensson method. Basedon the respective yield curve, a uniform risk-free rate is derived under theassumption of present value equivalence to an infinite time horizon.
The German bonds are internationally classified as almost risk-freesecurities due to its AAA rating according to S&P. As a result, the AustrianChamber of Public Accountants and Tax Consultants also recommendsderiving the risk-free rate from the yield curve using the parameterspublished by the German Central Bank.1) Likewise, bonds issued bySwitzerland enjoy a AAA rating and are also considered as risk-freeaccording to the Swiss National Bank.2) Hence, a similar approach like forGermany and Austria is in our view also appropriate for Switzerland withSwiss parameters.3)
To compute the risk-free rate for a specific reference date, the Institute ofPublic Auditors (Institut der Wirtschaftsprüfer, IDW) in Germanyrecommends using an average value deduced from the daily yield curvesof the past three months (IDW S 1).
On the contrary, the Austrian Expert Opinion (KFS/BW 1) on companyvaluation recommends that the risk-free rate is to be derived in line withthe evaluated company's cash flow profile from the yield curve that isvalid for the reference date (reference date principle). Thus, the KFS/BW 1and its counterpart, the IDW S 1, differentiate from each other.Consequently, in the following analyses we depict the yield curve forGermany following IDW S 1 and for Austria we adhere to therecommendations of KFS/BW 1.
For Switzerland, there is no generally accepted scheme to determine therisk-free rate. The most widely used risk-free rates in the valuationpractice are the yield of a 10-year Swiss government bond as of thereference date as well as the yield derived from the 3-month average ofthe daily yield curves (in accordance with IDW S 1).
Additionally, we illustrate the monthly development of the risk-free ratessince 2012 for all three capital markets.
1) www.bundesbank.de
2) Swiss National Bank – Zinssätze und Renditen, p.11
3) ibid., p.13
11

Risk-Free Rate – DACHDetermination according to country specific recommendationsInterest rate curve based on long-term bonds (Svensson method)
12
1.29%
1.34%
0.39%
1.24%
1.33%
0.32%
-1.00%
-0.50%
0.00%
0.50%
1.00%
1.50%
1 2 3 4 5 6 7 8 9 10 11 12 13 14 15 16 17 18 19 20 21 22 23 24 25 26 27 28 29 30
Spo
t R
ate
Year
Risk-free rates as of 31 December 2017
Germany 31 December 2017 Austria 31 December 2017 Switzerland 31 December 2017
Germany 30 June 2017 Austria 30 June 2017 Switzerland 30 June 2017

0,0%
1,0%
2,0%
3,0%
4,0%
5,0%
Historical developement of the risk-free rate in % according to IDW S 1
Risk-Free Rate – GermanyDetermination following IDW S 1Historical development of the risk-free rate (Svensson method) since 2012
Note: Interest rate as of reference date using 3-month average yield curves in accordance with IDW S 1
2.77%
2.28%
2.37% 2.37%
2.75%
2.45%
1.87%
1.17%
1.41%
13
0.91%
Risk-free rate January February March April May June July August September October November December
2017 1.10% 1.19% 1.25% 1.23% 1.25% 1.24% 1,32% 1,32% 1,35% 1,33% 1,32% 1,29%
2016 1.41% 1.27% 1.12% 1.00% 1.01% 0.91% 0.74% 0.58% 0.54% 0.61% 0.76% 0.95%
2015 1.66% 1.37% 1.08% 0.87% 0.92% 1.17% 1.49% 1.53% 1.50% 1.41% 1.42% 1.41%
2014 2.75% 2.69% 2.64% 2.57% 2.50% 2.45% 2.35% 2.22% 2.11% 2.00% 1.97% 1.87%
2013 2.37% 2.42% 2.42% 2.37% 2.32% 2.37% 2.44% 2.53% 2.63% 2.72% 2.76% 2.75%
2012 2.65% 2.59% 2.56% 2.55% 2.44% 2.28% 2.20% 2.22% 2.33% 2.38% 2.39% 2.37%
0.95%
1.24%
The German risk-free rate increased from1.24% as of 30 June 2017 to 1.29% as of31 December 2017.
In the time period from 31 December 2011 to31 December 2017 the risk-free rate declinedfrom 2.77% to 1.29%.
The German risk-free rate is the second highestwithin the three DACH markets.
1.29%

0,0%
1,0%
2,0%
3,0%
4,0%
5,0%
Historical developement of the risk-free rate in % according to KFS/BW1
Risk-Free Rate – AustriaDetermination following KFS/BW 1Historical development of the risk-free rate (Svensson method) since 2012
Note: Interest rate calculated using the daily yield curve in accordance with KFS/BW 1 (no 3-month average)
2.42%
2.41%
2.19%
2.53%2.84%
2.30%
1.59%
1.67%
1.57%
14
0.49%
Risk-free rate January February March April May June July August September October November December
2017 1.33% 1.13% 1.24% 1.25% 1.29% 1.33% 1,45% 1,25% 1,38% 1,33% 1,25% 1,33%
2016 1.13% 0.88% 0.91% 1.13% 1.02% 0.49% 0.45% 0.50% 0.48% 0.90% 0.89% 1.04%
2015 1.10% 1.08% 0.71% 0.96% 1.18% 1.67% 1.47% 1.46% 1.39% 1.29% 1.38% 1.57%
2014 2.55% 2.57% 2.55% 2.49% 2.36% 2.30% 2.15% 1.87% 2.00% 1.95% 1.79% 1.59%
2013 2.43% 2.37% 2.27% 2.17% 2.41% 2.53% 2.54% 2.70% 2.65% 2.69% 2.70% 2.84%
2012 2.59% 2.51% 2.55% 2.49% 1.89% 2.41% 2.30% 2.22% 2.32% 2.42% 2.35% 2.19%
1.04%
1.33%
The Austrian risk-free rate amounted to 1.33%as of 31 December 2017 and hence remainedunchanged vs. 30 June 2017.
In the time period from 31 December 2011 to31 December 2017 the risk-free rate declinedfrom 2.42% to 1.33%.
The Austrian risk-free rate is the highest withinthe three DACH markets.
1.33%

-1,0%
0,0%
1,0%
2,0%
3,0%
4,0%
5,0%
Historical development of the risk-free rate in % according to IDW S 1
Risk-Free Rate – SwitzerlandDetermination following IDW S 1Historical development of the risk-free rate (Svensson method) since 2011
Note: Interest rate as of reference date using 3-month average yield curves in accordance with IDW S 1
15
Risk-free rate January February March April May June July August September October November December
2017 0.33% 0.37% 0.37% 0.35% 0.36% 0.32% 0,36% 0,35% 0,37% 0,37% 0,40% 0,39%
2016 0.60% 0.49% 0.36% 0.26% 0.25% 0.19% 0.09% -0.01% -0.04% -0.02% 0.08% 0.23%
2015 0.85% 0.66% 0.54% 0.47% 0.47% 0.57% 0.72% 0.74% 0.73% 0.72% 0.71% 0.66%
2014 1.81% 1.80% 1.75% 1.68% 1.63% 1.61% 1.56% 1.44% 1.33% 1.24% 1.20% 1.08%
2013 1.16% 1.24% 1.31% 1.31% 1.28% 1.33% 1.46% 1.62% 1.72% 1.77% 1.78% 1.79%
2012 1.35% 1.30% 1.30% 1.31% 1.26% 1.16% 1.10% 1.08% 1.10% 1.12% 1.13% 1.12%
1.45%
1.16%
1.12%
1.33%
1.79%
1.61%1.08%
0.57% 0.66%0.19% 0.23% 0.32%
The Swiss risk-free rate increased from 0.32%as of 30 June 2017 to 0.39% as of 31 December2017.
In the time period from 31 December 2011 to31 December 2017 the risk-free rate declinedfrom 1.45% to 0.39%.
The Swiss risk-free rate is the lowest within thethree DACH markets.
0.39%

Market returns and market risk premium
a. Implied returns (ex-ante analysis)
4

For the following analysis, we use – simplified to annually – the formula ofthe Residual Income Valuation Model by Babbel:2)
with:
rt = Cost of equity at period t
NIt+1 = Expected net income in the following period t+1
MCt = Market capitalization at period t
BVt = Book value of equity at period t
g = Projected growth rate
Since Babbel's model does not need any explicit assumptions, except forthe growth rate, it turns out to be robust. We source our data (i.e. theexpected annual net income, the market capitalizations, and thecompany’s book value of equity, etc.) of the analyzed companies from thedata supplier S&P Capital IQ. Additionally, we apply the European CentralBank target inflation rate of 2.0% as a typified growth rate.
Henceforth, we determine the implied market returns for the entire DAX,ATX, and SMI. We consider these indices as a valid approximation for thetotal markets.3) The results build the starting points for the calculations ofthe implied market risk premiums of the German, Austrian, and Swisscapital markets.
Implied Market Returns and Market PremiumBackground & approach
The future-oriented computation of implied market returns and marketrisk premiums is based on profit estimates for public companies andreturn calculations. This approach is called ex-ante analysis and allows tocalculate the “Implied Cost of Capital”. It is to be distinguished from theex-post analysis.
Particularly, the ex-ante method offers an alternative to the ex-postapproach of calculating the costs of capital by means of the regressionanalysis through the CAPM.
The ex-ante analysis method seeks costs of capital which represent thereturn expectations from market participants. Moreover, it is supposedthat the estimates of financial analysts reflect the expectations of thecapital market.
Three basic models can be used for the calculation of implied costs ofcapital:
Dividend Discount Model
Residual Income Valuation Model
Earnings Capitalization Model
Through dissolving the models to achieve the cost of capital, we obtainthe implied return on equity.1) Furthermore, various model specificationswere developed based on the three basic models.
1) cf. Reese, 2007, Estimation of the costs of capital for evaluation purposes.
2) cf. Babbel, Challenging Stock Prices: Stock prices und implied growth expectations, in: Corporate Finance, N. 9, 2015, p. 316-323, in particular p. 319.
3) Approx. 75% of the total market capitalization (CDAX, WBI, SPI) is covered.
17
rt =NIt+1MCt
+ 1 −BVtMCt
∗ g

11.2% 10.0%
9.4%8.6% 8.3%
8.9%8.3% 8.5% 9.0% 8.6% 8.6% 8.7%
Min 7.5%
Max 11.2%
0.0%
2.0%
4.0%
6.0%
8.0%
10.0%
12.0%
14.0%
16.0%
Implied market returns - DAX
Range (10% - 90% quantile) Market-value weighted mean
Implied market returns - DAX
H1 2012 H2 2012 H1 2013 H2 2013 H1 2014 H2 2014 H1 2015 H2 2015 H1 2016 H2 2016 H1 2017 H2 2017
30.06.2012 31.12.2012 30.06.2013 31.12.2013 30.06.2014 31.12.2014 30.06.2015 31.12.2015 30.06.2016 31.12.2016 30.06.2017 31.12.2017
Minimum 3.2% 3.8% 3.2% 4.8% 2.9% 5.1% 5.3% 5.2% 3.3% 3.4% 2.6% 4.2%
Lower quantile 6.5% 5.5% 4.3% 5.3% 5.2% 6.1% 5.6% 5.9% 5.0% 5.4% 5.3% 5.8%
Median 10.0% 9.4% 8.4% 7.7% 7.7% 7.8% 7.0% 7.9% 7.6% 7.6% 7.7% 8.0%
Arithmetic mean 10.5% 9.4% 8.6% 8.1% 7.6% 8.3% 7.9% 8.4% 8.7% 8.3% 8.4% 8.4%
Market-value weighted mean 11.2% 10.0% 9.4% 8.6% 8.3% 8.9% 8.3% 8.5% 9.0% 8.6% 8.6% 8.7%
Upper quantile 15.3% 13.0% 12.3% 10.5% 10.7% 11.4% 11.4% 12.0% 15.2% 12.4% 14.3% 13.0%
Maximum 17.9% 14.6% 16.2% 12.0% 11.9% 14.7% 17.0% 18.3% 24.2% 16.3% 16.7% 15.2%
Market-value weighted debt 323.2% 252.0% 231.6% 162.1% 167.5% 175.2% 154.5% 153.6% 200.8% 150.0% 137.0% 123.9%
Implied Market ReturnsGerman market – DAX
18
The implied market return of theGerman market shows a relativelyconstant market-value weightedmean with 8.6% as of 30 June 2017and 8.7% as of 31 December 2017.
Since 30 June 2012 the impliedmarket return fluctuated between7.5% and 11.2%, overall it follows adeclining trend.
The German market showed thehighest return in comparison to thetwo other markets as of 31December 2017.

9.0%7.6% 7.1%
5.9% 5.8%7.0% 7.1% 7.1%
8.1% 7.6% 7.3% 7.4%
11.2%
10.0%9.4%
8.6% 8.3%8.9%
8.3% 8.5%9.0%
8.6% 8.6% 8.7%
0.0%
2.0%
4.0%
6.0%
8.0%
10.0%
12.0%
Implied market risk premium - DAX
Risk-free rate Implied market risk premium Market-value weighted mean
Implied Market Risk PremiumGerman market – DAX
Knowing the implied market return and the daily measured risk-free rate (cf. slide 12 in this study) of the German capital market, we can determine theimplied market risk premium.
In the years from 2012 to 2017 the implied market returns were within a range of 8.3% to 11.2% (cf. slide 18 in this study). Subtracting the risk-free ratefrom the implied market return, we derive a market risk premium within the range of 5.8% to 9.0%.
The implied market return is at 8.7% as of the reference date 31 December 2017. Taking the risk-free rate of 1.29% (cf. slide 13) into account, we determinea market risk premium of 7.4%.
19
Risk-free rate
Implied market return
MRP
H1 2012 H2 2012 H1 2013 H2 2013 H1 2014 H2 2014 H1 2015 H2 2015 H1 2016 H2 2016 H1 2017 H2 2017Market-value weighted mean 11.2% 10.0% 9.4% 8.6% 8.3% 8.9% 8.3% 8.5% 9.0% 8.6% 8.6% 8.7%Risk-free rate 2.3% 2.4% 2.4% 2.8% 2.5% 1.9% 1.2% 1.4% 0.9% 1.0% 1.2% 1.3%Implied market risk premium - DAX 9.0% 7.6% 7.1% 5.9% 5.8% 7.0% 7.1% 7.1% 8.1% 7.6% 7.3% 7.4%

11.3%
9.5% 9.5% 8.8%
7.1%8.4%
7.3%8.3% 8.1% 8.2% 8.3% 8.1%
Min 6.4%
Max 11.3%
0.0%
4.0%
8.0%
12.0%
16.0%
20.0%
Implied market returns - ATX
Range (10% - 90% quantile) Market-value weighted mean
Implied Market ReturnsAustrian market – ATX
20
The implied market return of theAustrian market declined slightlyfrom 8.3% as of 30 June 2017 to8.1% as of 31 December 2017.
Since 30 June 2012, it fluctuatedbetween 6.4% and 11.3%, overall itfollows a declining trend.
The Austrian market represents thesecond highest implied return incomparison to the two othermarkets as of 31 December 2017.
Implied market returns - ATX
H1 2012 H2 2012 H1 2013 H2 2013 H1 2014 H2 2014 H1 2015 H2 2015 H1 2016 H2 2016 H1 2017 H2 2017
30.06.2012 31.12.2012 30.06.2013 31.12.2013 30.06.2014 31.12.2014 30.06.2015 31.12.2015 30.06.2016 31.12.2016 30.06.2017 31.12.2017
Minimum 3.0% 3.0% 4.3% 0.0% 0.2% 2.0% 2.0% 3.6% 1.6% 2.1% 1.1% 4.0%
Lower quantile 5.2% 4.9% 4.5% 4.6% 1.6% 3.5% 3.9% 4.1% 5.2% 4.7% 5.1% 4.4%
Median 8.9% 8.2% 8.5% 7.4% 6.4% 7.2% 6.9% 7.7% 8.4% 7.7% 7.7% 7.7%
Arithmetic mean 10.1% 8.6% 8.6% 7.8% 6.4% 7.8% 6.9% 8.0% 8.1% 7.9% 7.5% 7.5%
Market-value weighted mean 11.3% 9.5% 9.5% 8.8% 7.1% 8.4% 7.3% 8.3% 8.1% 8.2% 8.3% 8.1%
Upper quantile 16.4% 13.8% 12.9% 11.9% 10.6% 13.2% 12.1% 12.3% 11.7% 10.9% 10.1% 9.5%
Maximum 16.8% 14.5% 13.9% 11.9% 10.7% 14.4% 13.4% 13.6% 12.3% 11.2% 13.0% 10.3%
Market-value weighted debt 215.1% 190.1% 173.4% 161.2% 136.6% 177.3% 141.8% 149.9% 147.7% 122.7% 101.0% 86.7%

H1 2012 H2 2012 H1 2013 H2 2013 H1 2014 H2 2014 H1 2015 H2 2015 H1 2016 H2 2016 H1 2017 H2 2017Market-value weighted mean 11.3% 9.5% 9.5% 8.8% 7.1% 8.4% 7.3% 8.3% 8.1% 8.2% 8.3% 8.1%Risk-free rate 2.4% 2.2% 2.6% 2.9% 2.3% 1.6% 1.7% 1.6% 0.5% 1.0% 1.3% 1.3%Implied market risk premium - ATX 8.9% 7.3% 7.0% 6.0% 4.8% 6.8% 5.6% 6.8% 7.6% 7.2% 6.9% 6.8%
8.9%7.3% 7.0%
6.0%4.8%
6.8%5.6%
6.8%7.6% 7.2% 6.9% 6.8%
11.3%
9.5% 9.5%8.8%
7.1%
8.4%
7.3%
8.3% 8.1% 8.2% 8.3% 8.1%
0.0%
2.0%
4.0%
6.0%
8.0%
10.0%
12.0%
Implied market risk premium - ATX
Risk-free rate Implied market risk premium Market-value weighted mean
Implied Market Risk PremiumAustrian market – ATX
Knowing the implied market return and the daily measured risk-free rate (cf. slide 12 in this study) of the Austrian capital market, we can determine theimplied market risk premium.
In the years from 2012 to 2017 the implied market returns fell within a range of 7.1% to 11.3% (cf. slide 20 in this study). Subtracting the risk-free rate fromthe implied market return, we derive a market risk premium within the range of 4.8% to 8.9%.
The implied market return is at 8.1% as of the reference date 31 December 2017. Taking the risk-free rate of 1.33% (cf. slide 14) into account, we determinea market risk premium of 6.8%.
21
Risk-free rate
Implied market return
MRP

9.4% 8.9% 8.1%
7.9% 7.3% 7.6% 7.2% 7.4% 7.2% 7.4%6.8% 7.2%
Min 6.8%
Max 9.4%
0.0%
2.0%
4.0%
6.0%
8.0%
10.0%
12.0%
14.0%
16.0%
Implied market returns - SMI
Range (10% - 90% quantile) Market-value weighted mean
Implied Market ReturnsSwiss market – SMI
22
The market-value weighted mean ofthe implied market return of theSwiss market increased from 6.8% asof 31 June 2017 to 7.2% as of 31December 2017.
Since 30 June 2012 it fluctuatedbetween 6.8% and 9.4%, overall itfollows a declining trend.
The Swiss market represents thelowest return, compared to theGerman and Austrian market as of31 December 2017.
Implied market returns - SMI
H1 2012 H2 2012 H1 2013 H2 2013 H1 2014 H2 2014 H1 2015 H2 2015 H1 2016 H2 2016 H1 2017 H2 2017
30.06.2012 31.12.2012 30.06.2013 31.12.2013 30.06.2014 31.12.2014 30.06.2015 31.12.2015 30.06.2016 31.12.2016 30.06.2017 31.12.2017
Minimum 6.3% 6.5% 6.0% 6.2% 5.8% 5.7% 6.0% 5.4% 5.2% 4.5% 5.0% 5.4%
Lower quantile 6.4% 6.9% 6.4% 6.2% 5.9% 6.1% 6.2% 5.9% 5.7% 5.3% 5.3% 5.4%
Median 9.2% 8.4% 7.5% 7.7% 7.4% 7.9% 7.3% 7.7% 7.2% 7.4% 6.3% 7.0%
Arithmetic mean 9.4% 8.9% 8.2% 7.9% 7.5% 7.9% 7.6% 7.6% 7.5% 7.2% 6.8% 7.0%
Market-value weighted mean 9.4% 8.9% 8.1% 7.9% 7.3% 7.6% 7.2% 7.4% 7.2% 7.4% 6.8% 7.2%
Upper quantile 12.5% 11.7% 11.6% 10.7% 10.2% 10.6% 10.5% 9.6% 10.6% 9.1% 8.6% 8.7%
Maximum 15.7% 13.6% 12.9% 10.8% 10.4% 11.0% 10.6% 10.1% 11.0% 9.4% 8.7% 9.1%
Market-value weighted debt 193.0% 144.8% 107.7% 87.0% 81.0% 85.7% 78.3% 74.1% 87.7% 79.4% 71.3% 68.7%

8.3% 7.8%6.7% 6.1% 5.6%
6.6% 6.6% 6.7% 7.0% 7.2%6.5% 6.8%
9.4%8.9%
8.1% 7.9%7.3%
7.6%7.2% 7.4% 7.2% 7.4%
6.8% 7.2%
0.0%
1.0%
2.0%
3.0%
4.0%
5.0%
6.0%
7.0%
8.0%
9.0%
10.0%
Implied market risk premium - SMI
Risk-free rate Implied market risk premium Market-value weighted mean
Implied Market Risk PremiumSwiss market – SMI
Knowing the implied market return and the daily measured risk-free rate (cf. slide 12 in this study) of the Swiss capital market, we can determine theimplied market risk premium.
In the years from 2012 to 2017 the implied market returns fell within a range of 6.8% to 9.4% (cf. slide 22 in this study). Subtracting the risk-free rate fromthe implied market return, we derive a market risk premium of 5.6% to 8.3%.
The implied market return is at 7.2% as of the reference date 31 December 2017. Taking the risk-free rate of 0.39% (cf. slide 15) into account, we determinea market risk premium of 6.8%.
23
Risk-free rate
Implied market return
MRP
H1 2012 H2 2012 H1 2013 H2 2013 H1 2014 H2 2014 H1 2015 H2 2015 H1 2016 H2 2016 H1 2017 H2 2017Market-value weighted mean 9.4% 8.9% 8.1% 7.9% 7.3% 7.6% 7.2% 7.4% 7.2% 7.4% 6.8% 7.2%Risk-free rate 1.2% 1.1% 1.3% 1.8% 1.6% 1.1% 0.6% 0.7% 0.2% 0.2% 0.3% 0.4%Implied market risk premium - SMI 8.3% 7.8% 6.7% 6.1% 5.6% 6.6% 6.6% 6.7% 7.0% 7.2% 6.5% 6.8%

Market returns and market risk premium
b. Historical returns (ex-post analysis)
4
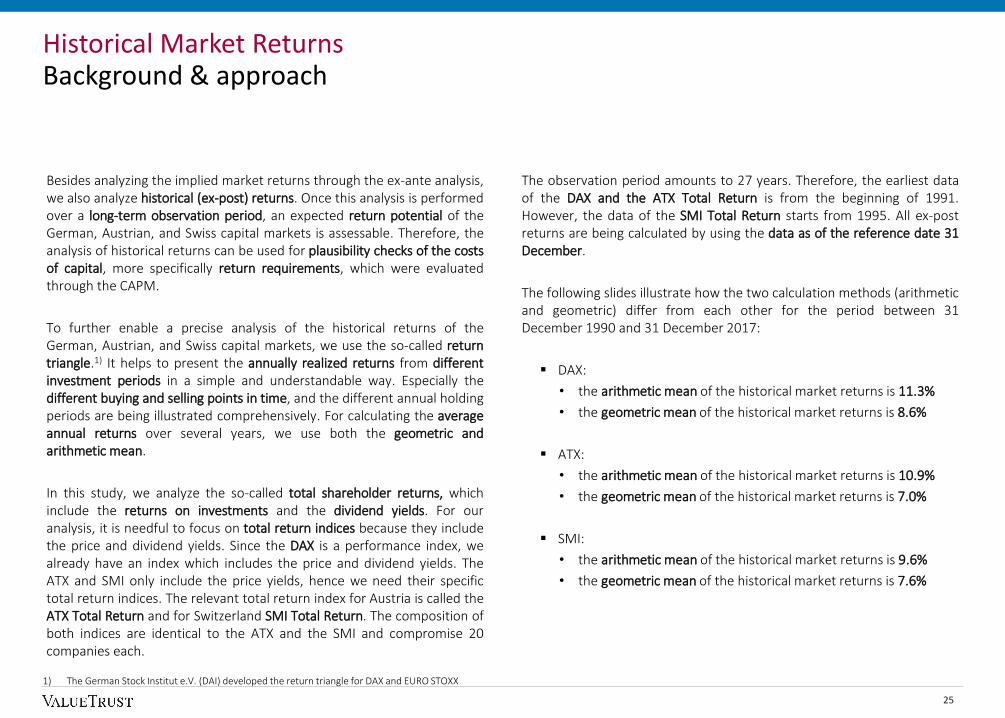
Historical Market ReturnsBackground & approach
Besides analyzing the implied market returns through the ex-ante analysis,we also analyze historical (ex-post) returns. Once this analysis is performedover a long-term observation period, an expected return potential of theGerman, Austrian, and Swiss capital markets is assessable. Therefore, theanalysis of historical returns can be used for plausibility checks of the costsof capital, more specifically return requirements, which were evaluatedthrough the CAPM.
To further enable a precise analysis of the historical returns of theGerman, Austrian, and Swiss capital markets, we use the so-called returntriangle.1) It helps to present the annually realized returns from differentinvestment periods in a simple and understandable way. Especially thedifferent buying and selling points in time, and the different annual holdingperiods are being illustrated comprehensively. For calculating the averageannual returns over several years, we use both the geometric andarithmetic mean.
In this study, we analyze the so-called total shareholder returns, whichinclude the returns on investments and the dividend yields. For ouranalysis, it is needful to focus on total return indices because they includethe price and dividend yields. Since the DAX is a performance index, wealready have an index which includes the price and dividend yields. TheATX and SMI only include the price yields, hence we need their specifictotal return indices. The relevant total return index for Austria is called theATX Total Return and for Switzerland SMI Total Return. The composition ofboth indices are identical to the ATX and the SMI and compromise 20companies each.
The observation period amounts to 27 years. Therefore, the earliest dataof the DAX and the ATX Total Return is from the beginning of 1991.However, the data of the SMI Total Return starts from 1995. All ex-postreturns are being calculated by using the data as of the reference date 31December.
The following slides illustrate how the two calculation methods (arithmeticand geometric) differ from each other for the period between 31December 1990 and 31 December 2017:
DAX:
• the arithmetic mean of the historical market returns is 11.3%
• the geometric mean of the historical market returns is 8.6%
ATX:
• the arithmetic mean of the historical market returns is 10.9%
• the geometric mean of the historical market returns is 7.0%
SMI:
• the arithmetic mean of the historical market returns is 9.6%
• the geometric mean of the historical market returns is 7.6%
1) The German Stock Institut e.V. (DAI) developed the return triangle for DAX and EURO STOXX
25
Buy
12.5% 2017
6.9% 9.7% 2016
9.6% 8.2% 9.6% 2015
2.7% 6.1% 6.4% 7.9% 2014
25.5% 14.1% 12.6% 11.1% 11.4% 2013 5
29.1% 27.3% 19.1% 16.7% 14.7% 14.4% 2012
-14.7% 7.2% 13.3% 10.6% 10.4% 9.8% 10.2% 2011
16.1% 0.7% 10.1% 14.0% 11.7% 11.4% 10.7% 10.9% 2010
23.8% 20.0% 8.4% 13.6% 16.0% 13.7% 13.1% 12.4% 12.4% 2009
-40.4% -8.3% -0.2% -3.8% 2.8% 6.6% 6.0% 6.4% 6.5% 7.1% 2008 10
22.3% -9.0% 1.9% 5.5% 1.4% 6.0% 8.8% 8.0% 8.2% 8.1% 8.5% 2007
22.0% 22.1% 1.3% 6.9% 8.8% 4.9% 8.3% 10.5% 9.6% 9.6% 9.3% 9.6% 2006
27.1% 24.5% 23.8% 7.7% 11.0% 11.8% 8.0% 10.7% 12.3% 11.3% 11.2% 10.8% 10.9% 2005
15.0% Return greater than 13% 7.3% 17.2% 18.8% 19.7% 7.7% 10.4% 11.2% 7.9% 10.3% 11.8% 11.0% 10.9% 10.5% 10.7% 2004
10.0% Return between 8% and 13% 37.1% 22.2% 23.8% 23.4% 23.2% 12.6% 14.2% 14.4% 11.2% 13.0% 14.1% 13.1% 12.9% 12.4% 12.4% 2003 15
5.0% Return between 3% and 8% -43.9% -3.4% 0.2% 6.9% 9.9% 12.0% 4.5% 6.9% 7.9% 5.7% 7.8% 9.3% 8.8% 8.8% 8.7% 8.9% 2002
0.0% Return between -3% and +3% -19.8% -31.9% -8.9% -4.8% 1.5% 5.0% 7.4% 1.5% 3.9% 5.2% 3.4% 5.5% 7.0% 6.7% 6.9% 6.9% 7.2% 2001
-5.0% Return between -3% and -8% -7.5% -13.7% -23.8% -8.5% -5.4% 0.0% 3.2% 5.6% 0.5% 2.8% 4.0% 2.4% 4.5% 6.0% 5.8% 6.0% 6.1% 6.4% 2000
-10.0% Return between -8% and -13% 39.0% 15.7% 3.9% -8.1% 1.0% 2.0% 5.6% 7.6% 9.3% 4.3% 6.1% 6.9% 5.3% 7.0% 8.2% 7.8% 7.9% 7.9% 8.1% 1999
-15.0% Return lower than -13% 18.5% 28.7% 16.7% 7.5% -2.8% 3.9% 4.4% 7.2% 8.9% 10.2% 5.6% 7.1% 7.8% 6.2% 7.7% 8.8% 8.5% 8.5% 8.4% 8.6% 1998 20
46.7% 32.6% 34.7% 24.2% 15.4% 5.5% 10.0% 9.7% 11.6% 12.6% 13.5% 9.0% 10.2% 10.6% 8.9% 10.2% 11.1% 10.6% 10.5% 10.4% 10.5% 1997
27.4% 37.0% 30.9% 32.9% 24.8% 17.4% 8.6% 12.2% 11.6% 13.2% 14.0% 14.7% 10.4% 11.4% 11.7% 10.1% 11.2% 12.0% 11.5% 11.4% 11.2% 11.2% 1996
7.8% 17.6% 27.3% 25.1% 27.9% 22.0% 16.0% 8.5% 11.7% 11.2% 12.7% 13.5% 14.1% 10.2% 11.2% 11.5% 9.9% 11.0% 11.7% 11.3% 11.2% 11.0% 11.1% 1995
-7.5% 0.2% 9.2% 18.6% 18.6% 22.0% 17.8% 13.1% 6.7% 9.8% 9.5% 11.0% 11.9% 12.6% 9.1% 10.0% 10.3% 9.0% 10.0% 10.8% 10.4% 10.4% 10.2% 10.3% 1994
46.7% 19.6% 15.7% 18.6% 24.2% 23.3% 25.5% 21.4% 16.8% 10.7% 13.1% 12.6% 13.8% 14.3% 14.9% 11.4% 12.1% 12.4% 10.9% 11.8% 12.5% 12.1% 11.9% 11.7% 11.8% 1993 25
-2.1% 22.3% 12.4% 11.2% 14.5% 19.8% 19.6% 22.1% 18.8% 14.9% 9.6% 11.9% 11.5% 12.6% 13.2% 13.8% 10.6% 11.4% 11.6% 10.3% 11.2% 11.8% 11.4% 11.4% 11.2% 11.2% 1992
12.9% 5.4% 19.2% 12.5% 11.6% 14.2% 18.8% 18.8% 21.0% 18.2% 14.7% 9.8% 11.9% 11.6% 12.6% 13.2% 13.8% 10.7% 11.4% 11.7% 10.4% 11.3% 11.9% 11.5% 11.4% 11.2% 11.3% 1991
Sell 1992 1993 1994 1995 1996 1997 1998 1999 2000 2001 2002 2003 2004 2005 2006 2007 2008 2009 2010 2011 2012 2013 2014 2015 2016 2017 2018
5 10 15 20 25
Inve
stm
en
t p
eri
od
in y
ea
rs
Investment period in years
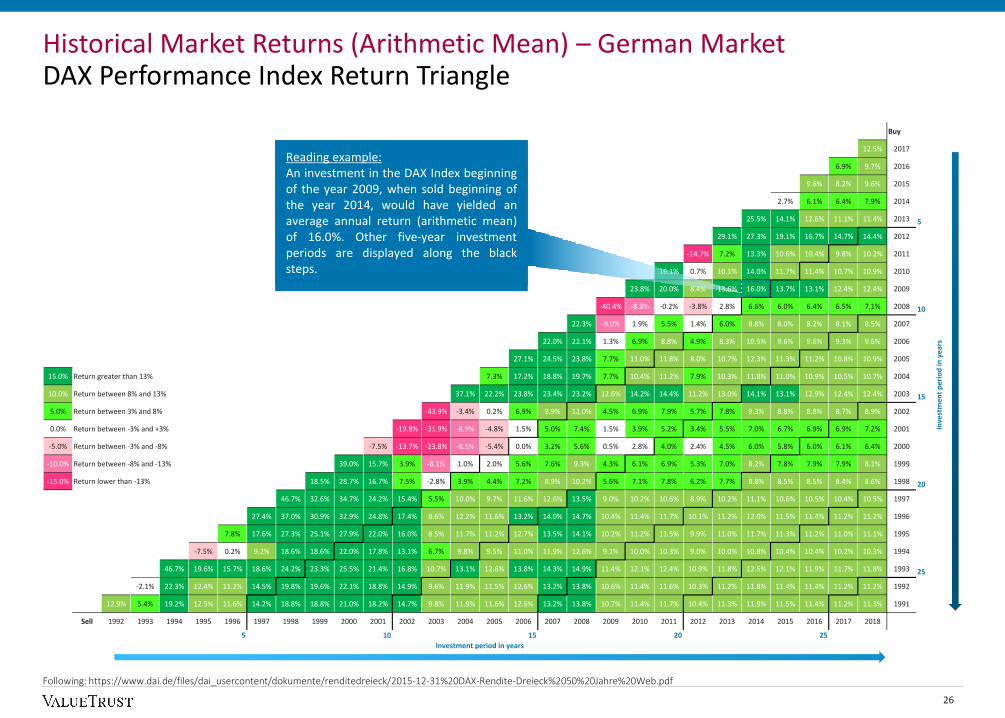
Historical Market Returns (Arithmetic Mean) – German Market DAX Performance Index Return Triangle
26
Following: https://www.dai.de/files/dai_usercontent/dokumente/renditedreieck/2015-12-31%20DAX-Rendite-Dreieck%2050%20Jahre%20Web.pdf
Reading example:An investment in the DAX Index beginningof the year 2009, when sold beginning ofthe year 2014, would have yielded anaverage annual return (arithmetic mean)of 16.0%. Other five-year investmentperiods are displayed along the blacksteps.

Buy
12.5% 2017
6.9% 9.7% 2016
9.6% 8.2% 9.6% 2015
2.7% 6.1% 6.3% 7.8% 2014
25.5% 13.5% 12.2% 10.8% 11.2% 2013 5
29.1% 27.3% 18.5% 16.2% 14.2% 14.0% 2012
-14.7% 4.9% 11.4% 9.1% 9.2% 8.8% 9.3% 2011
16.1% -0.5% 8.5% 12.5% 10.5% 10.3% 9.8% 10.2% 2010
23.8% 19.9% 7.0% 12.2% 14.7% 12.6% 12.2% 11.5% 11.6% 2009
-40.4% -14.1% -5.0% -7.5% -1.2% 2.9% 2.8% 3.6% 4.0% 4.8% 2008 10
22.3% -14.6% -3.3% 1.2% -2.2% 2.4% 5.4% 5.1% 5.6% 5.7% 6.3% 2007
22.0% 22.1% -3.8% 2.4% 5.0% 1.5% 5.0% 7.4% 6.8% 7.1% 7.1% 7.5% 2006
27.1% 24.5% 23.8% 3.1% 7.0% 8.4% 4.8% 7.5% 9.4% 8.7% 8.8% 8.6% 8.9% 2005
15.0% Return greater than 13% 7.3% 16.8% 18.5% 19.4% 3.9% 7.0% 8.3% 5.1% 7.5% 9.2% 8.6% 8.7% 8.5% 8.8% 2004
10.0% Return between 8% and 13% 37.1% 21.3% 23.2% 22.9% 22.8% 8.8% 10.9% 11.5% 8.2% 10.2% 11.5% 10.7% 10.6% 10.3% 10.5% 2003 15
5.0% Return between 3% and 8% -43.9% -12.3% -6.2% 1.2% 5.0% 7.7% -1.0% 1.8% 3.3% 1.3% 3.6% 5.3% 5.1% 5.4% 5.5% 5.9% 2002
0.0% Return between -3% and +3% -19.8% -32.9% -14.9% -9.8% -3.4% 0.4% 3.3% -3.6% -0.9% 0.7% -0.8% 1.4% 3.1% 3.1% 3.5% 3.7% 4.2% 2001
-5.0% Return between -3% and -8% -7.5% -13.9% -25.4% -13.1% -9.4% -4.1% -0.8% 1.9% -4.0% -1.5% -0.1% -1.4% 0.7% 2.3% 2.3% 2.8% 3.0% 3.5% 2000
-10.0% Return between -8% and -13% 39.0% 13.4% 1.0% -12.8% -4.6% -2.7% 1.1% 3.5% 5.4% -0.4% 1.6% 2.7% 1.3% 3.0% 4.4% 4.3% 4.6% 4.7% 5.1% 1999
-15.0% Return lower than -13% 18.5% 28.3% 15.1% 5.1% -7.3% -1.0% 0.1% 3.1% 5.1% 6.7% 1.2% 2.9% 3.9% 2.4% 4.0% 5.2% 5.1% 5.3% 5.4% 5.7% 1998 20
46.7% 31.8% 34.2% 22.3% 12.4% 0.1% 4.7% 5.0% 7.3% 8.6% 9.8% 4.4% 5.8% 6.5% 4.9% 6.3% 7.3% 7.0% 7.2% 7.2% 7.4% 1997
27.4% 36.7% 30.3% 32.5% 23.3% 14.7% 3.6% 7.3% 7.3% 9.1% 10.2% 11.2% 6.0% 7.2% 7.7% 6.2% 7.4% 8.3% 8.0% 8.1% 8.0% 8.2% 1996
7.8% 17.2% 26.3% 24.3% 27.1% 20.5% 13.7% 4.1% 7.3% 7.3% 9.0% 10.0% 10.9% 6.1% 7.2% 7.7% 6.3% 7.4% 8.3% 8.0% 8.1% 8.0% 8.2% 1995
-7.5% -0.1% 8.3% 16.8% 17.2% 20.6% 16.1% 10.8% 2.7% 5.8% 5.9% 7.5% 8.6% 9.5% 5.1% 6.2% 6.8% 5.5% 6.6% 7.5% 7.2% 7.3% 7.3% 7.5% 1994
46.7% 16.5% 13.5% 16.8% 22.3% 21.6% 24.0% 19.5% 14.3% 6.5% 8.9% 8.8% 10.1% 10.9% 11.6% 7.4% 8.3% 8.7% 7.3% 8.3% 9.1% 8.8% 8.8% 8.7% 8.9% 1993 25
-2.1% 19.9% 10.0% 9.4% 12.8% 17.8% 17.9% 20.4% 16.9% 12.6% 5.7% 8.0% 7.9% 9.2% 10.0% 10.7% 6.8% 7.7% 8.1% 6.8% 7.8% 8.5% 8.3% 8.3% 8.3% 8.4% 1992
12.9% 5.1% 17.5% 10.7% 10.1% 12.8% 17.1% 17.3% 19.5% 16.5% 12.6% 6.2% 8.3% 8.3% 9.4% 10.2% 10.9% 7.1% 7.9% 8.3% 7.1% 8.0% 8.7% 8.5% 8.5% 8.4% 8.6% 1991
Sell 1992 1993 1994 1995 1996 1997 1998 1999 2000 2001 2002 2003 2004 2005 2006 2007 2008 2009 2010 2011 2012 2013 2014 2015 2016 2017 2018
5 10 15 20 25
Inve
stm
en
t p
eri
od
in y
ear
s
Investment period in years
Historical Market Returns (Geometric Mean) – German MarketDAX Performance Index Return Triangle
27
Following: https://www.dai.de/files/dai_usercontent/dokumente/renditedreieck/2015-12-31%20DAX-Rendite-Dreieck%2050%20Jahre%20Web.pdf
Reading example:An investment in the DAX Index beginningof the year 2009, when sold beginning ofthe year 2014, would have yielded anaverage annual return (geometric mean)of 14.7%. Other five-year investmentperiods are displayed along the blacksteps.

Buy
34.0% 2017
12.5% 23.2% 2016
11.6% 12.0% 19.4% 2015
-11.4% 0.1% 4.2% 11.7% 2014
5.3% -3.0% 1.9% 4.5% 10.4% 2013 5
31.9% 18.6% 8.6% 9.4% 10.0% 14.0% 2012
-32.3% -0.2% 1.6% -1.6% 1.0% 2.9% 7.4% 2011
19.7% -6.3% 6.4% 6.2% 2.7% 4.1% 5.3% 8.9% 2010
46.0% 32.9% 11.2% 16.3% 14.1% 9.9% 10.1% 10.4% 13.0% 2009
-58.8% -6.4% 2.3% -6.3% 1.3% 2.0% 0.1% 1.5% 2.7% 5.9% 2008 10
0.8% -29.0% -4.0% 1.9% -4.9% 1.2% 1.8% 0.2% 1.4% 2.5% 5.4% 2007
26.0% 13.4% -10.7% 3.5% 6.8% 0.2% 4.8% 4.8% 3.0% 3.9% 4.7% 7.1% 2006
52.6% 39.3% 26.4% 5.1% 13.3% 14.4% 7.7% 10.7% 10.1% 8.0% 8.3% 8.7% 10.6% 2005
15.0% Return greater than 13% 59.0% 55.8% 45.8% 34.6% 15.9% 20.9% 20.8% 14.1% 16.1% 15.0% 12.6% 12.5% 12.5% 14.1% 2004
10.0% Return between 8% and 13% 39.4% 49.2% 50.3% 44.2% 35.5% 19.8% 23.6% 23.1% 16.9% 18.4% 17.2% 14.9% 14.6% 14.5% 15.8% 2003 15
5.0% Return between 3% and 8% 3.7% 21.5% 34.0% 38.7% 36.1% 30.2% 17.5% 21.1% 20.9% 15.6% 17.1% 16.1% 14.0% 13.8% 13.7% 15.0% 2002
0.0% Return between -3% and +3% 9.2% 6.4% 17.4% 27.8% 32.8% 31.6% 27.2% 16.5% 19.8% 19.8% 15.0% 16.4% 15.6% 13.7% 13.5% 13.5% 14.7% 2001
-5.0% Return between -3% and -8% -9.1% 0.1% 1.3% 10.8% 20.4% 25.8% 25.8% 22.7% 13.6% 16.9% 17.1% 13.0% 14.5% 13.8% 12.1% 12.1% 12.1% 13.3% 2000
-10.0% Return between -8% and -13% 8.9% -0.1% 3.0% 3.2% 10.4% 18.5% 23.4% 23.7% 21.2% 13.2% 16.2% 16.5% 12.7% 14.1% 13.5% 11.9% 11.9% 11.9% 13.1% 1999
-15.0% Return lower than -13% -12.3% -1.7% -4.1% -0.8% 0.1% 6.6% 14.1% 18.9% 19.7% 17.8% 10.9% 13.8% 14.2% 10.9% 12.3% 11.9% 10.5% 10.6% 10.7% 11.8% 1998 20
17.7% 2.7% 4.8% 1.3% 2.9% 3.0% 8.2% 14.6% 18.8% 19.5% 17.8% 11.4% 14.1% 14.5% 11.4% 12.7% 12.2% 10.9% 10.9% 11.0% 12.1% 1997
18.8% 18.2% 8.1% 8.3% 4.8% 5.5% 5.3% 9.5% 15.0% 18.8% 19.4% 17.9% 12.0% 14.4% 14.8% 11.8% 13.0% 12.6% 11.3% 11.3% 11.4% 12.4% 1996
-6.2% 6.3% 10.1% 4.5% 5.4% 3.0% 3.9% 3.8% 7.8% 12.9% 16.5% 17.3% 16.0% 10.7% 13.0% 13.5% 10.8% 11.9% 11.6% 10.5% 10.5% 10.6% 11.6% 1995
-7.3% -6.7% 1.8% 5.7% 2.1% 3.3% 1.5% 2.5% 2.6% 6.3% 11.1% 14.5% 15.4% 14.4% 9.5% 11.8% 12.2% 9.8% 10.9% 10.7% 9.6% 9.7% 9.8% 10.8% 1994
61.7% 27.2% 16.1% 16.7% 16.9% 12.1% 11.6% 9.0% 9.0% 8.5% 11.3% 15.3% 18.2% 18.7% 17.5% 12.8% 14.7% 15.0% 12.5% 13.5% 13.1% 12.0% 12.0% 12.0% 12.9% 1993 25
-16.5% 22.6% 12.6% 7.9% 10.1% 11.4% 8.0% 8.1% 6.2% 6.5% 6.2% 9.0% 12.8% 15.7% 16.4% 15.4% 11.0% 13.0% 13.3% 11.0% 12.0% 11.7% 10.7% 10.8% 10.8% 11.7% 1992
-10.8% -13.7% 11.4% 6.8% 4.2% 6.6% 8.2% 5.6% 6.0% 4.5% 4.9% 4.8% 7.5% 11.2% 13.9% 14.7% 13.9% 9.8% 11.7% 12.1% 10.0% 11.0% 10.8% 9.8% 9.9% 10.0% 10.9% 1991
Sell 1992 1993 1994 1995 1996 1997 1998 1999 2000 2001 2002 2003 2004 2005 2006 2007 2008 2009 2010 2011 2012 2013 2014 2015 2016 2017 2018
5 10 15 20 25
Inve
stm
en
t p
eri
od
in y
ea
rs
Investment period in years
Historical Market Returns (Arithmetic Mean) – Austrian Market ATX Total Return Index Return Triangle
28
Following: https://www.dai.de/files/dai_usercontent/dokumente/renditedreieck/2015-12-31%20DAX-Rendite-Dreieck%2050%20Jahre%20Web.pdf
Reading example:An investment in the ATX Total Returnbeginning of the year 2009, whenbeginning mid of the year 2014, wouldhave yielded an average annual return(arithmetic mean) of 14.1%. Other five-year investment periods are displayedalong the black steps.

Buy
34.0% 2017
12.5% 22.8% 2016
11.6% 12.0% 18.9% 2015
-11.4% -0.5% 3.6% 10.5% 2014
5.3% -3.4% 1.4% 4.0% 9.4% 2013 5
31.9% 17.9% 7.2% 8.3% 9.1% 12.9% 2012
-32.3% -5.5% -2.0% -4.4% -1.4% 0.8% 5.0% 2011
19.7% -9.9% 2.3% 3.0% 0.0% 1.8% 3.3% 6.7% 2010
46.0% 32.2% 5.8% 11.8% 10.5% 6.5% 7.2% 7.8% 10.5% 2009
-58.8% -22.4% -10.3% -16.4% -8.4% -6.3% -7.0% -4.9% -3.1% 0.1% 2008 10
0.8% -35.5% -15.3% -7.7% -13.2% -7.0% -5.3% -6.1% -4.3% -2.7% 0.2% 2007
26.0% 12.7% -19.4% -6.5% -1.8% -7.7% -2.8% -1.9% -3.0% -1.6% -0.4% 2.1% 2006
52.6% 38.6% 24.7% -5.5% 3.1% 5.7% -0.8% 2.8% 3.1% 1.5% 2.4% 3.2% 5.3% 2005
15.0% Return greater than 13% 59.0% 55.7% 45.1% 32.5% 4.9% 10.8% 12.1% 5.2% 7.9% 7.6% 5.8% 6.2% 6.7% 8.5% 2004
10.0% Return between 8% and 13% 39.4% 48.9% 50.1% 43.7% 33.8% 10.0% 14.5% 15.2% 8.6% 10.7% 10.2% 8.2% 8.5% 8.8% 10.3% 2003 15
5.0% Return between 3% and 8% 3.7% 20.2% 32.0% 36.8% 34.6% 28.3% 9.1% 13.1% 13.8% 8.1% 10.0% 9.6% 7.9% 8.1% 8.4% 9.9% 2002
0.0% Return between -3% and +3% 9.2% 6.4% 16.4% 25.9% 30.8% 30.0% 25.3% 9.1% 12.7% 13.4% 8.2% 10.0% 9.6% 8.0% 8.2% 8.5% 9.8% 2001
-5.0% Return between -3% and -8% -9.1% -0.4% 1.0% 9.4% 17.9% 23.1% 23.5% 20.4% 6.9% 10.3% 11.1% 6.6% 8.4% 8.2% 6.7% 7.0% 7.3% 8.7% 2000
-10.0% Return between -8% and -13% 8.9% -0.5% 2.6% 2.9% 9.3% 16.4% 21.0% 21.6% 19.1% 7.1% 10.2% 10.9% 6.8% 8.4% 8.2% 6.9% 7.1% 7.4% 8.7% 1999
-15.0% Return lower than -13% -12.3% -2.3% -4.6% -1.3% -0.3% 5.4% 11.8% 16.2% 17.3% 15.5% 5.2% 8.1% 8.9% 5.3% 6.9% 6.8% 5.6% 6.0% 6.3% 7.5% 1998 20
17.7% 1.6% 4.0% 0.6% 2.2% 2.5% 7.1% 12.5% 16.4% 17.3% 15.7% 6.2% 8.8% 9.5% 6.1% 7.5% 7.4% 6.3% 6.5% 6.8% 8.0% 1997
18.8% 18.2% 7.0% 7.5% 4.0% 4.8% 4.7% 8.5% 13.2% 16.6% 17.4% 15.9% 7.1% 9.5% 10.1% 6.8% 8.2% 8.0% 6.9% 7.1% 7.4% 8.5% 1996
-6.2% 5.6% 9.5% 3.6% 4.6% 2.2% 3.2% 3.2% 6.7% 11.1% 14.3% 15.3% 14.1% 6.1% 8.4% 9.0% 6.0% 7.3% 7.2% 6.2% 6.4% 6.7% 7.8% 1995
-7.3% -6.7% 1.1% 5.0% 1.3% 2.5% 0.8% 1.8% 2.0% 5.2% 9.3% 12.3% 13.3% 12.4% 5.1% 7.3% 8.0% 5.2% 6.5% 6.4% 5.5% 5.8% 6.1% 7.1% 1994
61.7% 22.4% 12.0% 13.7% 14.5% 9.5% 9.4% 6.9% 7.2% 6.8% 9.4% 12.9% 15.5% 16.3% 15.2% 8.0% 9.9% 10.4% 7.6% 8.7% 8.6% 7.6% 7.8% 7.9% 8.9% 1993 25
-16.5% 16.2% 7.7% 4.1% 6.9% 8.6% 5.3% 5.8% 4.0% 4.5% 4.4% 7.0% 10.3% 12.9% 13.7% 12.9% 6.4% 8.3% 8.8% 6.3% 7.4% 7.3% 6.4% 6.6% 6.8% 7.8% 1992
-10.8% -13.7% 6.4% 2.8% 0.9% 3.7% 5.6% 3.2% 3.8% 2.4% 3.0% 3.1% 5.5% 8.6% 11.1% 12.0% 11.3% 5.3% 7.2% 7.8% 5.4% 6.5% 6.4% 5.6% 5.9% 6.1% 7.0% 1991
Sell 1992 1993 1994 1995 1996 1997 1998 1999 2000 2001 2002 2003 2004 2005 2006 2007 2008 2009 2010 2011 2012 2013 2014 2015 2016 2017 2018
5 10 15 20 25
Inve
stm
en
t p
eri
od
in y
ear
s
Investment period in years
Historical Market Returns (Geometric Mean) – Austrian MarketATX Total Return Index Return Triangle
29
Following: https://www.dai.de/files/dai_usercontent/dokumente/renditedreieck/2015-12-31%20DAX-Rendite-Dreieck%2050%20Jahre%20Web.pdf
Reading example:An investment in the ATX Total Returnbeginning of the year 2009, when soldbeginning of the year 2014, would haveyielded an average annual return(geometric mean) of 10.5%. Other five-year investment periods are displayedalong the black steps.

Buy
17.9% 2017
-3.4% 7.3% 2016
1.2% -1.1% 5.2% 2015
12.9% 7.0% 3.6% 7.2% 2014
23.9% 18.4% 12.7% 8.7% 10.5% 2013 5
19.1% 21.5% 18.6% 14.3% 10.7% 11.9% 2012
-4.6% 7.2% 12.8% 12.8% 10.5% 8.2% 9.6% 2011
1.2% -1.7% 5.2% 9.9% 10.5% 8.9% 7.2% 8.5% 2010
15.0% Return greater than 13% 22.1% 11.6% 6.2% 9.4% 12.3% 12.4% 10.8% 9.0% 10.0% 2009
10.0% Return between 8% and 13% -32.8% -5.3% -3.2% -3.5% 1.0% 4.8% 6.0% 5.4% 4.4% 5.7% 2008 10
5.0% Return between 3% and 8% -1.4% -17.1% -4.0% -2.7% -3.1% 0.6% 3.9% 5.1% 4.6% 3.8% 5.1% 2007
0.0% Return between -3% and +3% 18.0% 8.3% -5.4% 1.5% 1.4% 0.4% 3.1% 5.7% 6.5% 6.0% 5.1% 6.2% 2006
-5.0% Return between -3% and -8% 36.0% 27.0% 17.5% 5.0% 8.4% 7.2% 5.5% 7.2% 9.1% 9.4% 8.7% 7.7% 8.5% 2005
-10.0% Return between -8% and -13% 5.5% 20.7% 19.8% 14.5% 5.1% 7.9% 6.9% 5.5% 7.0% 8.7% 9.1% 8.4% 7.5% 8.3% 2004
-15.0% Return lower than -13% 20.9% 13.2% 20.8% 20.1% 15.8% 7.7% 9.8% 8.7% 7.2% 8.4% 9.8% 10.1% 9.4% 8.5% 9.1% 2003 15
-26.6% -2.8% -0.1% 9.0% 10.8% 8.7% 2.8% 5.2% 4.8% 3.8% 5.2% 6.8% 7.3% 6.8% 6.1% 6.9% 2002
-20.2% -23.4% -8.6% -5.1% 3.1% 5.6% 4.6% -0.1% 2.4% 2.3% 1.6% 3.1% 4.7% 5.3% 5.0% 4.5% 5.3% 2001
9.3% -5.5% -12.5% -4.2% -2.2% 4.1% 6.1% 5.2% 1.0% 3.1% 2.9% 2.3% 3.6% 5.0% 5.6% 5.3% 4.8% 5.5% 2000
7.2% 8.2% -1.3% -7.6% -1.9% -0.7% 4.6% 6.3% 5.4% 1.6% 3.5% 3.3% 2.7% 3.8% 5.2% 5.7% 5.4% 4.9% 5.6% 1999
15.7% 11.4% 10.7% 3.0% -2.9% 1.0% 1.7% 6.0% 7.3% 6.4% 2.9% 4.5% 4.2% 3.6% 4.6% 5.8% 6.2% 6.0% 5.5% 6.1% 1998 20
60.9% 38.3% 27.9% 23.3% 14.6% 7.7% 9.6% 9.1% 12.1% 12.7% 11.4% 7.7% 8.8% 8.3% 7.4% 8.1% 9.1% 9.3% 8.9% 8.2% 8.7% 1997
28.2% 44.5% 34.9% 28.0% 24.2% 16.8% 10.6% 11.9% 11.2% 13.7% 14.1% 12.8% 9.3% 10.2% 9.6% 8.7% 9.3% 10.1% 10.3% 9.8% 9.2% 9.6% 1996
Sell 1997 1998 1999 2000 2001 2002 2003 2004 2005 2006 2007 2008 2009 2010 2011 2012 2013 2014 2015 2016 2017 2018
5 10 15 20
Inve
stm
en
t p
eri
od
in y
ear
s
Investment period in years
Historical Market Returns (Arithmetic Mean) – Swiss MarketSMI Total Return Index Return Triangle
30
Following: https://www.dai.de/files/dai_usercontent/dokumente/renditedreieck/2015-12-31%20DAX-Rendite-Dreieck%2050%20Jahre%20Web.pdf
Reading example:An investment in the SMI Total Returnbeginning of the year 2009, when soldbeginning of the year 2014, would haveyielded an average annual return(arithmetic mean) of 12.3%. Other five-year investment periods are displayedalong the black steps.
Buy
17.9% 2017
-3.4% 6.7% 2016
1.2% -1.1% 4.8% 2015
12.9% 6.9% 3.3% 6.8% 2014
23.9% 18.3% 12.3% 8.1% 10.0% 2013 5
19.1% 21.5% 18.5% 13.9% 10.2% 11.5% 2012
-4.6% 6.6% 12.1% 12.3% 10.0% 7.6% 9.0% 2011
1.2% -1.8% 4.7% 9.2% 10.0% 8.4% 6.7% 8.0% 2010
15.0% Return greater than 13% 22.1% 11.2% 5.6% 8.8% 11.7% 11.9% 10.3% 8.5% 9.5% 2009
10.0% Return between 8% and 13% -32.8% -9.4% -6.0% -5.7% -1.2% 2.6% 4.0% 3.7% 2.9% 4.3% 2008 10
5.0% Return between 3% and 8% -1.4% -18.6% -6.8% -4.9% -4.8% -1.2% 2.0% 3.3% 3.1% 2.4% 3.8% 2007
0.0% Return between -3% and +3% 18.0% 7.9% -7.9% -1.1% -0.7% -1.3% 1.3% 3.9% 4.9% 4.5% 3.8% 4.9% 2006
-5.0% Return between -3% and -8% 36.0% 26.7% 16.5% 1.6% 5.4% 4.7% 3.3% 5.1% 7.1% 7.6% 7.0% 6.1% 7.0% 2005
-10.0% Return between -8% and -13% 5.5% 19.8% 19.2% 13.7% 2.3% 5.4% 4.8% 3.6% 5.2% 6.9% 7.4% 6.9% 6.1% 6.9% 2004
-15.0% Return lower than -13% 20.9% 12.9% 20.1% 19.6% 15.1% 5.2% 7.5% 6.7% 5.4% 6.7% 8.1% 8.5% 7.9% 7.1% 7.8% 2003 15
-26.6% -5.8% -2.2% 6.2% 8.5% 6.8% 0.0% 2.5% 2.3% 1.6% 3.1% 4.7% 5.3% 5.0% 4.4% 5.2% 2002
-20.2% -23.5% -10.9% -7.0% 0.3% 3.1% 2.4% -2.8% -0.3% -0.2% -0.6% 0.9% 2.5% 3.2% 3.1% 2.7% 3.5% 2001
9.3% -6.6% -13.8% -6.2% -4.0% 1.8% 3.9% 3.3% -1.5% 0.6% 0.6% 0.2% 1.5% 3.0% 3.6% 3.5% 3.1% 3.8% 2000
7.2% 8.2% -2.2% -9.0% -3.7% -2.2% 2.5% 4.3% 3.7% -0.7% 1.2% 1.2% 0.7% 1.9% 3.3% 3.8% 3.7% 3.3% 4.0% 1999
15.7% 11.3% 10.7% 2.0% -4.5% -0.7% 0.2% 4.1% 5.5% 4.8% 0.7% 2.3% 2.2% 1.7% 2.8% 4.0% 4.5% 4.3% 3.9% 4.6% 1998 20
60.9% 36.4% 25.9% 21.5% 11.7% 4.2% 6.4% 6.3% 9.2% 10.1% 9.0% 4.7% 5.9% 5.6% 4.9% 5.7% 6.7% 7.0% 6.7% 6.2% 6.7% 1997
28.2% 43.6% 33.6% 26.5% 22.8% 14.3% 7.3% 8.9% 8.5% 11.0% 11.6% 10.5% 6.3% 7.4% 7.0% 6.2% 6.9% 7.8% 8.1% 7.7% 7.1% 7.6% 1996
Sell 1997 1998 1999 2000 2001 2002 2003 2004 2005 2006 2007 2008 2009 2010 2011 2012 2013 2014 2015 2016 2017 2018
5 15 20 25
Inve
stm
en
t p
eri
od
in y
ear
s
Investment period in years
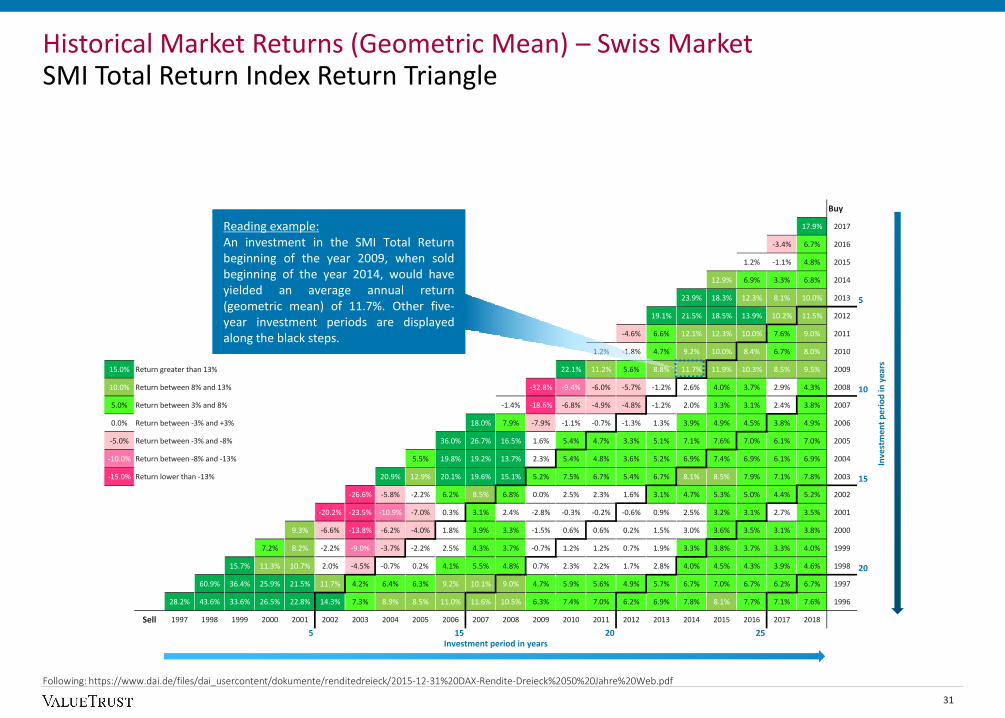
Historical Market Returns (Geometric Mean) – Swiss MarketSMI Total Return Index Return Triangle
31
Following: https://www.dai.de/files/dai_usercontent/dokumente/renditedreieck/2015-12-31%20DAX-Rendite-Dreieck%2050%20Jahre%20Web.pdf
Reading example:An investment in the SMI Total Returnbeginning of the year 2009, when soldbeginning of the year 2014, would haveyielded an average annual return(geometric mean) of 11.7%. Other five-year investment periods are displayedalong the black steps.

Sector classification of the DACH region
based on sector indices
5

CDAX 531
companies in 9
“Deutsche Börse super
sectors”
WBI 60
companies in 5
“ATX sector indices”
SPI194
companies in 10
“SPI sector indices”
Sector Indices of the DACH RegionMethodology & approach
The sector indices aim to cover the whole capital market of the DACH region. Therefore,this capital market study contains all equities of the Composite German Stock Index (CDAX), ViennaStock Exchange Index (WBI), and Swiss Performance Index (SPI). These three indices contain allshares listed on the Official and Semi-Official Market.
The 785 public companies, which are listed in the mentioned indices as of 31 December 2017,build the base of the sector classification and the subsequent analyses:
The German CDAX includes 531 companies listed in the Prime Standard and General Standardand is classified into nine “Deutsche Börse super sectors”.
The Austrian ATX only has five indices, ValueTrust positions the remaining companies of theWBI into the classified indices.
The Swiss SPI contains ten sector indices that comprise 194 companies.
Eventually, merged all three market indices and the respective sector index classificationinto nine sector indices, so-called “super sectors.”
These nine sector indices for this study are defined as follows:
FIRE
Basic Materials
Consumer Goods
Telecommunication
Industrials
Consumer Service
Pharma & Healthcare
Information Technology
Utilities
33
785 listed companies
Complete sector classification of the DACH region in 9 sector indices
sector indices
classifies
Capital market of the DACH region

22%
5%
12%
2%27%
8%
8%
13%
2%
Sector classification of the DACH Region
FIRE ( 178 )
Basic Materials ( 41 )
Consumer Goods ( 94 )
Telecommunication ( 14 )
Industrials ( 210 )
Consumer Service ( 65 )
Pharma & Healthcare ( 63 )
Information Technology ( 107 )
Utilities ( 13 )
34
Sector Indices of the DACH Region as of 31 December 2017Sector distribution and number of companies
The chart shows the percentagedistribution of the 785 listed companies inthe nine “super sectors” (behind thesector names is the numerical amountlisted).
The nine defined sectors can be classifiedin three different dimensions. Five different sectors represent a
proportion of less than 10%, two represent a share between 10%
and 20%, and another two represent a portion of
more than 20%.Companies within the Industrials and FIREsectors represent almost 50% of the entiremarket.

Betas6

BetasBackground & approach
36
Beta is used in the CAPM and is also known as the beta coefficient or betafactor. Beta is a measure of systematic risk of a security of a specificcompany (company beta) or a specific sector (sector beta) in comparisonto the market. A beta of less than 1 means that the security istheoretically less volatile than the market. A beta of greater than 1indicates that the security's price is more volatile than the market.
Beta factors are estimated on the basis of historical returns of securities incomparison to an approximate market portfolio. Since the companyvaluation is forward-looking, it has to be examined whether or whatpotential risk factors prevailing in the past do also apply for the future. Byvaluing non-listed companies or companies without meaningful shareprice performance, it is common to use a beta factor from a group ofcomparable companies (“peer group beta“), a suitable sector (“sectorbeta“) or one single listed company in the capital market with a similarbusiness model and a similar risk profile (“pure play beta“). Within thiscapital market study, we have used sector betas which are computed asarithmetic means of the statistically significant beta factors of allcompanies of a particular sector.
The estimation of beta factors is usually accomplished through a linearregression analysis. We use the CDAX, WBI, and SPI as country specificreference indices.
Furthermore, it is important to set a time period, in which the data iscollected (benchmark period) and whether daily, weekly or monthlyreturns (return interval) are analyzed. In practice, it is common to useobservation periods of two years with the regression of weekly returns or afive-year observation period with the regression of monthly returns.
In the CAPM, company specific risk premiums include besides the businessrisk also the financial risk. The beta factor for levered companies (“leveredbeta”) is usually higher compared to a company with an identical businessmodel but without debt (due to financial risk). Hence, changes in thecapital structure require an adjustment of the betas and therefore of thecompany specific risk premiums.
In order to calculate the unlevered beta, adjustment formulas have beendeveloped. We prefer to use the adjustment formula by Harris/Pringlewhich assumes a value-based financing policy, stock-flow adjustmentswithout time delay, uncertain tax shields, and a so-called debt beta. Wecalculate the debt beta based on the respective company rating or theaverage sector rating (if a company rating is not available) through theapplication of the credit spread derived from the expected cost of debt.The capital market data, in particular historical market prices, is providedby the data supplier S&P Capital IQ.

Beta levered1)
Debt ratio2) Debt Beta Beta unlevered Market Cap (abs.)
Sector
Number of
companies1)
5-y. m. / 2-y. w. Aggregation
5-years
2017-2013
monthly
2-years
2017-2016
weekly
5-years
2017-2013
monthly
2-years
2017-2016
weekly
5-years
2017-2013
monthly
2-years
2017-2016
weekly
5-years
2017-2013
monthly
2-years
2017-2016
weekly
Median 0.71 0.61 n.a. n.a. n.a. n.a. n.a. n.a.
Arithmetic mean 1.01 0.80 n.a. n.a. n.a. n.a. n.a. n.a.
Market-value weighted mean 1.02 1.11 n.a. n.a. n.a. n.a. n.a. n.a.
Median 0.93 0.94 32% 29% 0.32 0.32 0.71 0.75
Arithmetic mean 0.94 0.94 35% 31% 0.32 0.32 0.73 0.76
Market-value weighted mean 0.99 0.99 27% 26% 0.23 0.23 0.79 0.79
Median 0.85 0.80 21% 19% 0.22 0.22 0.66 0.67
Arithmetic mean 0.95 0.81 34% 30% 0.21 0.22 0.69 0.64
Market-value weighted mean 1.08 0.97 38% 39% 0.18 0.18 0.76 0.69
Median 0.67 0.65 30% 29% 0.20 0.20 0.55 0.52
Arithmetic mean 0.69 0.67 38% 35% 0.20 0.20 0.52 0.52
Market-value weighted mean 0.77 0.84 43% 40% 0.19 0.19 0.53 0.59
Median 0.88 0.77 20% 16% 0.30 0.30 0.74 0.68
Arithmetic mean 0.95 0.85 34% 26% 0.29 0.30 0.77 0.73
Market-value weighted mean 0.96 0.92 28% 27% 0.25 0.25 0.79 0.75
Median 0.78 0.72 19% 18% 0.32 0.32 0.72 0.61
Arithmetic mean 0.85 0.74 27% 30% 0.32 0.32 0.72 0.64
Market-value weighted mean 0.83 0.85 21% 31% 0.32 0.32 0.73 0.74
Median 0.97 0.96 13% 8% 0.21 0.21 0.84 0.81
Arithmetic mean 1.08 0.94 20% 14% 0.21 0.21 0.93 0.86
Market-value weighted mean 0.96 1.10 16% 16% 0.16 0.16 0.85 0.96
Median 0.87 0.80 13% 9% 0.19 0.19 0.76 0.73
Arithmetic mean 0.87 0.89 20% 15% 0.19 0.19 0.76 0.76
Market-value weighted mean 0.90 0.93 10% 10% 0.18 0.18 0.82 0.86
Median 0.78 0.51 55% 46% 0.23 0.22 0.44 0.34
Arithmetic mean 0.87 0.50 60% 52% 0.24 0.22 0.49 0.36
Market-value weighted mean 0.95 0.60 65% 55% 0.25 0.24 0.49 0.42
FIRE3) 86 / 93
Basic Materials 29 / 31
Consumer Goods 46 / 45
Telecommunication 7 / 9
Industrials 118 / 128
Consumer Service 24 / 28
Pharma & Healthcare 31 / 32
Information Technology 45 / 59
Utilities 6 / 6
BetasSector specific levered and unlevered betas as of 31 December 2017
37
1) Statistically not significant (t-test, confidence interval: 95%) beta factors are not being considered. As a consequence, the number of the companies decreased.
2) The debt ratio corresponds to the debt-to-total capital ratio.
3) The debt illustration of the companies of the "FIRE" sector only serves an informational purpose. We will not implement an adjustment to the company's specific debt (unlevered) because a bank's indebtedness is part of its operational activities and economic risk. Therefore, a separation of operative and financial obligations is not possible. In addition, bank specific regulations about the minimum capital within financial institutions let us assume that the indebtedness degree is widely comparable. For that reason, it is possible to renounce the adaptation of the beta factors.

Sector returns
a. Implied returns (ex-ante analysis)
7

Implied Sector ReturnsBackground & approach
Besides the future-oriented calculation of implied market returns (cf. slide17 et seq.), we can calculate implied returns for sectors. That offers analternative and simplification to the ex-post analysis of the company'scosts of capital via the CAPM. Using this approach the calculation of sectorbetas via regression analyses is not necessary.
The implied sector returns shown on the following slides, can be used asan indicator for the sector specific levered costs of equity. Those alreadyconsider a sector specific leverage. Because of this, another simplificationis to renounce making adjustments with regards to the capital structurerisk.
Comparable to the calculation of the implied market returns, the followingreturn calculations are based on the Residual Income Valuation Model byBabbel.1) The required data (i.e. net income, market capitalization, andbook values of equity) are sourced from the data provider S&P Capital IQ.Regarding the profit growth, we assume a growth rate of 2.0%.
We unlever the implied returns with the following adjusting equation forthe costs of equity2) to take the specific leverage into account3):
kEL = kE
U + kEU − Rf ∗
D
Ewith:
kEL= Levered cost of equity
kEU= Unlevered cost of equity
Rf= Risk-free rateD
E= Debt 4) -to-equity ratio
The implied unlevered sector returns serve as an indicator for anaggregated and unlevered cost of equity for specific sectors. The processof relevering a company's cost of capital to reflect a company specific debtsituation (cf. calculation example on the next slide) can be worked outwithout using the CAPM.
39
1) cf. Babbel, Challenging Stock Prices: Share prices and implied growth expectations (Corporate Finance, n. 9, 2015, p. 316-323, especially p. 319).
2) In situations in which the debt betas in the market are distorted, we would have to adjust these betas to avoid unsystematic risks. For simplification reasons, we deviate from our typical analysis strategy to
achieve the enterprise value (Debt beta>; 0) and assume that the costs of capital are at the level of the risk-free rate. This process is designed by the so-called Practitioners formula (uncertain tax shields, debt
beta = 0), cf. Pratt/Grabowski, Cost of Capital, 5th ed., 2014, p. 253.
3) We assume that the cash and cash equivalents are used entirely for operative purposes. Consequently, we do not deduct excess cash from the debt.
4) The debt illustration of the companies of the "FIRE" sector only serves an informational purpose. We will not implement an adjustment to the company's specific debt (unlevered) because a bank's indebtedness
is part of its operational activities and economic risk.

Implied Sector ReturnsExemplary calculation to adjust for the company specific capital structure
Calculation example:
As of the reference date 31 December 2017, we observe the sectorspecific, unlevered cost of equity of 6.2% (market-value weighted mean)of the exemplary company X, which operates in the German BasicMaterials sector. The following assumptions have been made:
The debt-to-equity ratio of the exemplary company X: 40%
The risk-free rate: 1.29% (cf. slide 13)
Based on these numbers, we can calculate the relevered costs of equity ofcompany X with the adjustment formula:
𝐤𝐄𝐋 = 6.2% + (6.2% - 1.29%) * 40% = 8.16%
Thus, 8.16% is the company’s relevered cost of equity. In comparison, thelevered cost of equity of the Basic Materials sector is 7.5%.
40

11.6%
10.2% 9.8% 9.3%8.6%
9.3%8.6% 8.6% 8.3% 7.9% 7.7% 7.8%
0.0%
2.0%
4.0%
6.0%
8.0%
10.0%
12.0%
14.0%
16.0%
Implied sector returns - DACH - FIRE
Range (10% - 90% quantile) Market-value weighted mean (levered)
Implied sector returns (levered) - DACH - FIRE
H1 2012 H2 2012 H1 2013 H2 2013 H1 2014 H2 2014 H1 2015 H2 2015 H1 2016 H2 2016 H1 2017 H2 2017
30.06.2012 31.12.2012 30.06.2013 31.12.2013 30.06.2014 31.12.2014 30.06.2015 31.12.2015 30.06.2016 31.12.2016 30.06.2017 31.12.2017
Minimum 2.0% -1.5% 1.5% 3.8% 1.4% 0.4% 1.8% 1.5% 1.6% 1.5% 2.6% 3.1%
Lower quantile 3.8% 3.3% 4.3% 4.8% 4.5% 4.2% 4.1% 4.6% 4.4% 4.3% 4.2% 4.6%
Median 9.0% 8.3% 7.5% 7.9% 7.6% 8.0% 6.8% 7.9% 7.1% 7.2% 6.9% 7.1%
Arithmetic mean 9.8% 8.8% 7.8% 9.2% 8.6% 9.3% 8.7% 8.9% 8.0% 8.1% 7.8% 7.5%
Market-value weighted mean 11.6% 10.2% 9.8% 9.3% 8.6% 9.3% 8.6% 8.6% 8.3% 7.9% 7.7% 7.8%
Upper quantile 14.8% 13.6% 11.6% 10.9% 11.4% 13.1% 11.5% 14.4% 12.0% 11.3% 11.6% 10.3%
Maximum 45.5% 21.4% 18.6% 89.5% 54.1% 60.7% 55.8% 60.1% 24.3% 32.4% 33.6% 21.9%
Market-value weighted debt 1027.2% 756.7% 624.1% 468.9% 466.2% 482.2% 401.2% 376.4% 512.1% 390.8% 340.3% 295.8%
Implied Sector ReturnsFIRE
41
Note: The debt illustration of the companies of the "FIRE" sector only serves an informational purpose. We will not implement an adjustment to the company's specific debt (unlevered)because a bank's indebtedness is part of its operational activities and economic risk (cf. slide 37 and 39).
The implied market return in theFIRE sector slightly increased from7.7% as of 30 June 2017 to 7.8% asof 31 December 2017.
Over the course of time, the market-value weighted mean of the impliedsector return decreased noticeablysince 30 June 2012 (11.6%).

Implied sector returns (unlevered) - DACH - Basic Materials
H1 2012 H2 2012 H1 2013 H2 2013 H1 2014 H2 2014 H1 2015 H2 2015 H1 2016 H2 2016 H1 2017 H2 2017
30.06.2012 31.12.2012 30.06.2013 31.12.2013 30.06.2014 31.12.2014 30.06.2015 31.12.2015 30.06.2016 31.12.2016 30.06.2017 31.12.2017
Minimum 3.0% 2.5% 2.3% 1.3% 0.9% 1.9% 1.2% 2.6% 0.5% 1.9% 0.9% 2.0%
Lower quantile 4.0% 3.4% 4.8% 2.8% 2.7% 3.6% 1.7% 3.3% 2.1% 2.4% 3.1% 3.7%
Median 7.4% 7.2% 6.4% 6.0% 5.4% 5.9% 5.0% 5.7% 5.4% 5.3% 5.2% 5.9%
Arithmetic mean 7.8% 7.8% 7.8% 5.8% 7.4% 5.9% 4.9% 5.7% 5.0% 5.4% 5.3% 6.0%
Market-value weighted mean 7.8% 7.3% 7.0% 6.7% 6.2% 6.2% 5.6% 6.0% 5.6% 5.8% 5.9% 6.2%
Upper quantile 10.3% 10.1% 9.5% 7.6% 7.5% 8.1% 7.1% 7.3% 6.8% 8.1% 7.9% 8.7%
Maximum 27.3% 29.6% 39.1% 12.9% 57.6% 12.6% 8.3% 12.1% 8.9% 15.0% 9.0% 15.3%
Market-value weighted debt 42.3% 36.1% 35.9% 29.7% 33.0% 38.3% 35.2% 34.9% 43.5% 35.0% 31.9% 29.2%
Implied sector returns (levered) - DACH - Basic Materials
H1 2012 H2 2012 H1 2013 H2 2013 H1 2014 H2 2014 H1 2015 H2 2015 H1 2016 H2 2016 H1 2017 H2 2017
30.06.2012 31.12.2012 30.06.2013 31.12.2013 30.06.2014 31.12.2014 30.06.2015 31.12.2015 30.06.2016 31.12.2016 30.06.2017 31.12.2017
Minimum 3.6% 2.6% 2.2% -0.4% -1.8% 0.2% 1.3% 3.6% 0.4% 2.1% 0.6% 1.3%
Lower quantile 4.9% 4.5% 5.7% 2.9% 3.2% 3.8% 1.9% 4.7% 2.6% 4.1% 4.4% 3.3%
Median 8.7% 9.2% 8.3% 7.2% 6.2% 7.6% 6.2% 7.7% 7.6% 6.8% 6.8% 7.0%
Arithmetic mean 10.0% 9.5% 9.4% 8.1% 9.0% 7.8% 6.2% 8.1% 6.7% 7.3% 6.9% 7.6%
Market-value weighted mean 10.0% 8.9% 8.5% 7.8% 7.3% 7.7% 7.0% 7.6% 7.5% 7.4% 7.4% 7.5%
Upper quantile 15.2% 13.1% 11.2% 11.9% 10.1% 11.8% 9.1% 11.1% 9.2% 9.4% 10.6% 9.8%
Maximum 30.0% 32.7% 45.1% 41.7% 73.2% 20.4% 9.9% 20.4% 11.0% 23.3% 13.9% 31.3%
Market-value weighted debt 42.3% 36.1% 35.9% 29.7% 33.0% 38.3% 35.2% 34.9% 43.5% 35.0% 31.9% 29.2%
Implied Sector ReturnsBasic Materials (table)
42

7.8% 7.3% 7.0% 6.7%6.2% 6.2%
5.6% 6.0% 5.6% 5.8% 5.9% 6.2%
10.0%8.9%
8.5%7.8%
7.3%7.7%
7.0%7.6% 7.5% 7.4% 7.4% 7.5%
0.0%
2.0%
4.0%
6.0%
8.0%
10.0%
12.0%
14.0%
16.0%
Implied sector returns - DACH - Basic Materials
Range (10% - 90% quantile) Market-value weighted mean (unlevered) Market-value weighted mean (levered)
Implied Sector ReturnsBasic Materials (chart)
43
Note: The ranges refer to the implied sector returns (unlevered).
The implied sector return (unlevered) of theBasic Materials sector increased from 5.9% asof 30 June 2017 to 6.2% as of 31 December2017.
In comparison to other sectors, the BasicMaterials sector showed the highest unleveredimplied return as of 31 December 2017.
Overall, we could identify a fluctuationbetween 5.6% and 7.8% of the market-valueweighted mean (unlevered) since 30 June2012.

Implied sector returns (unlevered) - DACH - Consumer Goods
H1 2012 H2 2012 H1 2013 H2 2013 H1 2014 H2 2014 H1 2015 H2 2015 H1 2016 H2 2016 H1 2017 H2 2017
30.06.2012 31.12.2012 30.06.2013 31.12.2013 30.06.2014 31.12.2014 30.06.2015 31.12.2015 30.06.2016 31.12.2016 30.06.2017 31.12.2017
Minimum 0.5% 0.7% 0.7% 1.0% 0.6% 0.6% 0.3% 0.4% 0.2% 0.4% 0.5% 1.3%
Lower quantile 4.1% 4.4% 4.8% 4.5% 3.8% 2.3% 2.5% 3.0% 3.0% 2.9% 2.1% 3.0%
Median 6.1% 6.3% 6.4% 6.6% 5.8% 5.7% 5.0% 5.2% 5.2% 5.1% 4.7% 5.5%
Arithmetic mean 8.2% 8.1% 7.5% 7.6% 7.6% 6.5% 5.8% 6.0% 6.1% 5.9% 5.6% 5.7%
Market-value weighted mean 7.3% 7.6% 7.0% 7.0% 6.3% 6.6% 6.6% 6.5% 6.1% 5.2% 5.5% 5.3%
Upper quantile 14.6% 14.5% 11.3% 12.0% 9.9% 10.1% 8.8% 9.0% 9.9% 9.6% 9.3% 8.1%
Maximum 18.2% 19.5% 16.7% 20.2% 44.8% 12.0% 11.1% 10.6% 13.3% 13.3% 14.6% 12.6%
Market-value weighted debt 81.1% 69.4% 68.6% 54.7% 58.0% 60.6% 59.8% 61.4% 79.6% 70.0% 67.9% 67.4%
Implied sector returns (levered) - DACH - Consumer Goods
H1 2012 H2 2012 H1 2013 H2 2013 H1 2014 H2 2014 H1 2015 H2 2015 H1 2016 H2 2016 H1 2017 H2 2017
30.06.2012 31.12.2012 30.06.2013 31.12.2013 30.06.2014 31.12.2014 30.06.2015 31.12.2015 30.06.2016 31.12.2016 30.06.2017 31.12.2017
Minimum 4.6% 5.5% 1.5% 4.8% 1.3% 2.2% 0.5% 2.1% 2.6% 2.5% 2.0% 1.7%
Lower quantile 6.1% 7.1% 6.2% 6.1% 4.8% 4.5% 4.6% 4.4% 4.7% 4.8% 3.4% 4.7%
Median 9.1% 9.5% 9.0% 9.1% 8.0% 7.9% 7.6% 7.9% 7.5% 7.6% 6.9% 7.3%
Arithmetic mean 10.9% 10.8% 9.6% 9.4% 11.2% 8.0% 7.4% 7.8% 8.5% 8.1% 7.4% 7.7%
Market-value weighted mean 11.0% 10.1% 9.6% 8.8% 8.4% 8.8% 8.4% 8.4% 9.1% 8.8% 8.8% 8.9%
Upper quantile 17.9% 16.1% 14.2% 12.6% 11.8% 11.3% 10.2% 11.2% 14.7% 12.8% 12.2% 11.7%
Maximum 26.7% 28.8% 28.2% 31.1% 113.8% 16.6% 15.1% 13.4% 21.3% 16.8% 18.9% 16.7%
Market-value weighted debt 81.1% 69.4% 68.6% 54.7% 58.0% 60.6% 59.8% 61.4% 79.6% 70.0% 67.9% 67.4%
Implied Sector ReturnsConsumer Goods (table)
44

7.3% 7.6%7.0% 7.0%
6.3% 6.6% 6.6% 6.5% 6.1%5.2% 5.5% 5.3%
11.0%
10.1% 9.6%8.8% 8.4%
8.8%8.4% 8.4%
9.1% 8.8% 8.8% 8.9%
0.0%
2.0%
4.0%
6.0%
8.0%
10.0%
12.0%
14.0%
16.0%
Implied sector returns - DACH - Consumer Goods
Range (10% - 90% quantile) Market-value weighted mean (unlevered) Market-value weighted mean (levered)
Implied Sector ReturnsConsumer Goods (chart)
45
Note: The ranges refer to the implied sector returns (unlevered).
The implied sector return (unlevered) of theConsumer Goods sector decreased from 5.5%to 5.3% from 30 June 2017 to 31 December2017.
In comparison to the other sectors, theConsumer Goods sector had the highestlevered implied sector return as of 31December 2017.
Overall, we could identify a fluctuationbetween 5.2% and 7.6% of the market-valueweighted mean (unlevered) since 30 June2012.

Implied sector returns (unlevered) - DACH - Telecommunication
H1 2012 H2 2012 H1 2013 H2 2013 H1 2014 H2 2014 H1 2015 H2 2015 H1 2016 H2 2016 H1 2017 H2 2012
30.06.2012 31.12.2012 30.06.2013 31.12.2013 30.06.2014 31.12.2014 30.06.2015 31.12.2015 30.06.2016 31.12.2016 30.06.2017 31.12.2017
Minimum 3.3% 2.4% 1.9% 1.9% 3.5% 0.5% -0.1% 2.6% 1.6% 2.1% 2.3% 2.6%
Lower quantile 4.0% 3.3% 3.1% 3.3% 3.9% 2.5% 2.1% 3.3% 2.1% 2.4% 2.3% 3.3%
Median 6.1% 6.9% 6.6% 6.4% 5.2% 5.0% 4.5% 4.8% 4.0% 5.3% 4.0% 5.3%
Arithmetic mean 6.3% 6.6% 7.0% 5.8% 5.3% 4.8% 4.3% 4.9% 4.1% 4.7% 4.1% 4.7%
Market-value weighted mean 5.4% 5.3% 5.2% 4.9% 4.7% 4.5% 4.2% 4.4% 4.3% 4.5% 4.3% 4.8%
Upper quantile 8.8% 9.9% 11.8% 8.3% 7.0% 7.1% 6.2% 6.9% 5.4% 6.0% 5.5% 5.5%
Maximum 10.1% 10.2% 15.0% 8.8% 8.0% 8.0% 6.7% 7.1% 6.1% 6.7% 5.7% 5.7%
Market-value weighted debt 119.2% 103.1% 107.8% 84.6% 78.7% 79.0% 68.8% 71.3% 80.5% 75.9% 73.1% 70.8%
Implied sector returns (levered) - DACH - Telecommunication
H1 2012 H2 2012 H1 2013 H2 2013 H1 2014 H2 2014 H1 2015 H2 2015 H1 2016 H2 2016 H1 2017 H2 2017
30.06.2012 31.12.2012 30.06.2013 31.12.2013 30.06.2014 31.12.2014 30.06.2015 31.12.2015 30.06.2016 31.12.2016 30.06.2017 31.12.2017
Minimum 3.4% 2.4% 1.8% 1.7% 5.1% -0.7% -1.8% 4.0% 2.8% 3.9% 3.4% 3.4%
Lower quantile 3.9% 4.9% 2.7% 4.0% 5.3% 2.8% 1.8% 4.3% 3.2% 4.4% 3.7% 4.8%
Median 7.7% 10.0% 8.6% 6.9% 5.8% 6.4% 6.7% 7.3% 5.9% 6.8% 4.6% 7.1%
Arithmetic mean 8.4% 9.2% 8.3% 6.9% 6.5% 5.9% 5.4% 6.8% 5.9% 6.5% 5.5% 6.5%
Market-value weighted mean 8.7% 8.5% 8.2% 6.7% 6.4% 6.6% 6.3% 6.7% 7.3% 7.3% 6.7% 7.5%
Upper quantile 12.1% 13.2% 13.4% 9.7% 8.5% 8.4% 7.6% 8.4% 8.9% 8.5% 7.8% 7.8%
Maximum 15.3% 13.2% 16.4% 10.0% 9.3% 9.2% 7.7% 9.1% 9.3% 8.7% 8.0% 7.8%
Market-value weighted debt 119.2% 103.1% 107.8% 84.6% 78.7% 79.0% 68.8% 71.3% 80.5% 75.9% 73.1% 70.8%
Implied Sector ReturnsTelecommunication (table)
46

5.4% 5.3% 5.2% 4.9% 4.7% 4.5% 4.2% 4.4% 4.3% 4.5% 4.3% 4.8%
8.7% 8.5% 8.2%
6.7% 6.4% 6.6% 6.3% 6.7%7.3% 7.3%
6.7%7.5%
0.0%
2.0%
4.0%
6.0%
8.0%
10.0%
12.0%
14.0%
16.0%
Implied sector returns - DACH - Telecommunication
Range (10% - 90% quantile) Market-value weighted mean (unlevered) Market-value weighted mean (levered)
Implied Sector ReturnsTelecommunication (chart)
47
Note: The ranges refer to the implied sector returns (unlevered).
The implied sector return (unlevered) of theTelecommunication sector increased from4.3% as of 30 June 2017 to 4.8% as of 31December 2017.
In comparison to the other sectors, theTelecommunication sector had the secondlowest unlevered implied sector return as of 31December 2017.
Overall, the fluctuation of the market-valueweighted mean (unlevered) since 30 June 2012is quite small (4.2% to 5.4%).
Implied sector returns (unlevered) - DACH - Industrials
H1 2012 H2 2012 H1 2013 H2 2013 H1 2014 H2 2014 H1 2015 H2 2015 H1 2016 H2 2016 H1 2017 H2 2012
30.06.2012 31.12.2012 30.06.2013 31.12.2013 30.06.2014 31.12.2014 30.06.2015 31.12.2015 30.06.2016 31.12.2016 30.06.2017 31.12.2017
Minimum 1.5% 0.7% 0.1% 0.3% 0.6% 0.6% 0.5% 1.5% 1.5% 1.7% 0.4% 2.4%
Lower quantile 4.2% 4.6% 4.2% 4.6% 3.0% 3.6% 2.4% 3.1% 2.4% 2.4% 2.3% 3.3%
Median 7.1% 7.2% 6.7% 6.9% 6.1% 6.4% 4.3% 5.2% 5.1% 5.2% 5.1% 5.4%
Arithmetic mean 9.8% 7.1% 6.2% 6.2% 5.5% 5.9% 4.5% 5.4% 5.1% 5.3% 4.5% 5.2%
Market-value weighted mean 6.9% 6.4% 6.1% 6.2% 5.8% 6.1% 5.4% 5.6% 5.5% 5.5% 5.3% 5.5%
Upper quantile 10.2% 9.9% 8.2% 8.2% 7.6% 7.7% 6.1% 7.9% 7.3% 7.4% 6.2% 6.9%
Maximum 61.5% 11.4% 9.2% 9.4% 8.4% 9.5% 8.0% 8.0% 7.6% 9.7% 6.8% 7.5%
Market-value weighted debt 54.5% 48.8% 48.2% 37.6% 39.1% 40.3% 41.7% 42.6% 47.4% 39.0% 37.4% 34.1%
Implied sector returns (levered) - DACH - Industrials
H1 2012 H2 2012 H1 2013 H2 2013 H1 2014 H2 2014 H1 2015 H2 2015 H1 2016 H2 2016 H1 2017 H2 2017
30.06.2012 31.12.2012 30.06.2013 31.12.2013 30.06.2014 31.12.2014 30.06.2015 31.12.2015 30.06.2016 31.12.2016 30.06.2017 31.12.2017
Minimum 0.3% 0.1% 0.0% 0.3% 0.6% 0.2% -0.4% 1.6% 1.7% 2.1% 0.5% 2.7%
Lower quantile 3.6% 4.7% 4.6% 4.5% 3.5% 3.3% 2.9% 4.4% 4.3% 4.3% 3.2% 3.5%
Median 9.0% 8.9% 8.0% 7.6% 6.8% 8.0% 6.5% 7.2% 7.4% 7.2% 6.2% 6.7%
Arithmetic mean 10.0% 9.2% 8.0% 7.6% 6.5% 7.9% 6.4% 7.7% 7.8% 7.0% 5.7% 6.3%
Market-value weighted mean 9.5% 8.4% 7.8% 7.6% 7.2% 7.8% 7.0% 7.3% 7.6% 6.9% 6.8% 6.9%
Upper quantile 13.1% 13.2% 10.7% 10.3% 8.7% 10.6% 8.8% 10.3% 9.8% 9.4% 7.6% 8.3%
Maximum 61.6% 27.5% 31.9% 16.0% 12.3% 29.1% 12.8% 40.7% 42.5% 18.1% 9.5% 11.5%
Market-value weighted debt 54.5% 48.8% 48.2% 37.6% 39.1% 40.3% 41.7% 42.6% 47.4% 39.0% 37.4% 34.1%
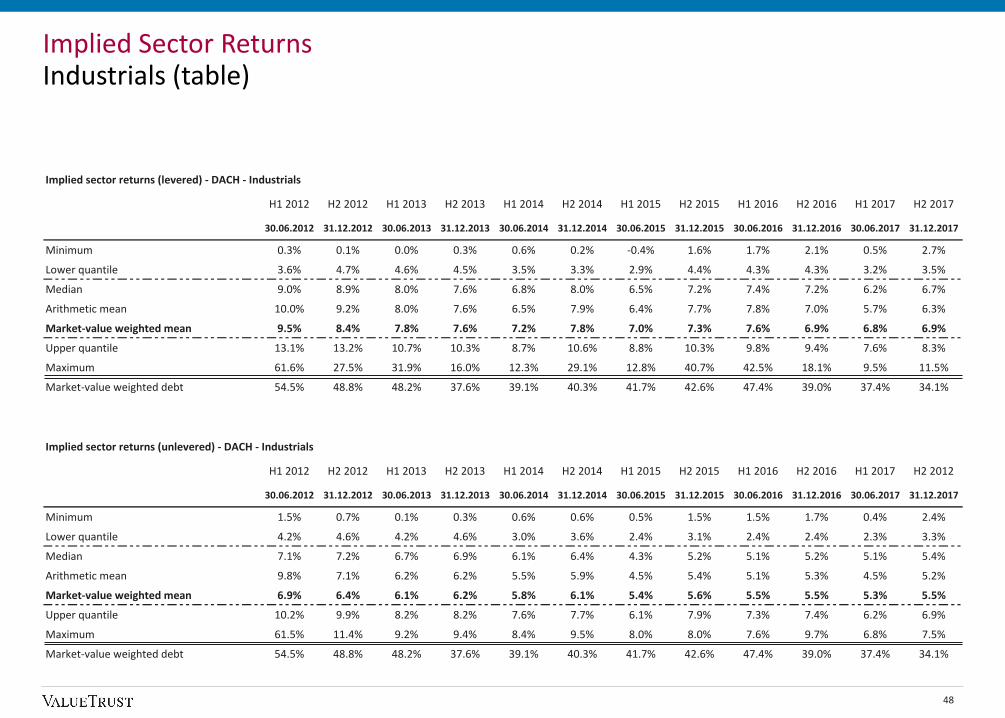
Implied Sector ReturnsIndustrials (table)
48

6.9% 6.4% 6.1% 6.2% 5.8% 6.1%5.4% 5.6% 5.5% 5.5% 5.3% 5.5%
9.5%8.4%
7.8% 7.6% 7.2%7.8%
7.0% 7.3% 7.6%6.9% 6.8% 6.9%
0.0%
2.0%
4.0%
6.0%
8.0%
10.0%
12.0%
14.0%
16.0%
Implied sector returns - DACH - Industrials
Range (10% - 90% quantile) Market-value weighted mean (unlevered) Market-value weighted mean (levered)
Implied Sector ReturnsIndustrials (chart)
49
Note: The ranges refer to the implied sector returns (unlevered).
The implied sector return (unlevered) of theIndustrials sector increased from 5.3% as of 30June 2017 to 5.5% as of 31 December 2017.
Overall, we could identify a fluctuationbetween 5.3% and 6.9% of the market-valueweighted mean (unlevered) since 30 June2012.

Implied sector returns (unlevered) - DACH - Consumer Service
H1 2012 H2 2012 H1 2013 H2 2013 H1 2014 H2 2014 H1 2015 H2 2015 H1 2016 H2 2016 H1 2017 H2 2017
30.06.2012 31.12.2012 30.06.2013 31.12.2013 30.06.2014 31.12.2014 30.06.2015 31.12.2015 30.06.2016 31.12.2016 30.06.2017 31.12.2017
Minimum 2.9% 2.8% 2.3% 2.9% 3.6% 2.7% 2.1% 1.9% 1.3% 1.2% 2.1% 1.9%
Lower quantile 4.8% 5.5% 3.3% 4.8% 4.9% 3.6% 3.0% 3.2% 3.4% 2.5% 2.8% 2.8%
Median 7.6% 7.3% 6.3% 6.1% 5.8% 6.4% 5.2% 5.1% 5.0% 5.0% 5.0% 5.2%
Arithmetic mean 8.1% 7.6% 6.2% 6.6% 7.4% 7.9% 5.2% 5.6% 5.3% 5.1% 4.9% 4.9%
Market-value weighted mean 7.3% 7.3% 6.3% 6.2% 5.8% 6.5% 4.8% 4.9% 5.1% 5.1% 4.7% 5.0%
Upper quantile 10.3% 9.9% 7.9% 9.3% 7.9% 14.6% 7.5% 8.2% 8.4% 7.1% 6.5% 6.5%
Maximum 20.9% 12.4% 10.5% 10.3% 38.9% 34.6% 8.3% 11.4% 8.9% 8.3% 8.8% 7.2%
Market-value weighted debt 35.2% 35.3% 28.4% 23.2% 22.8% 20.3% 17.4% 21.5% 25.0% 26.0% 23.9% 32.9%
Implied sector returns (levered) - DACH - Consumer Service
H1 2012 H2 2012 H1 2013 H2 2013 H1 2014 H2 2014 H1 2015 H2 2015 H1 2016 H2 2016 H1 2017 H2 2017
30.06.2012 31.12.2012 30.06.2013 31.12.2013 30.06.2014 31.12.2014 30.06.2015 31.12.2015 30.06.2016 31.12.2016 30.06.2017 31.12.2017
Minimum 2.2% 2.9% 2.3% 3.2% 3.6% 2.9% 2.7% 1.6% 1.8% 1.3% 2.1% 2.0%
Lower quantile 5.0% 6.7% 4.4% 4.3% 5.5% 4.3% 3.8% 3.0% 3.4% 3.8% 3.3% 2.9%
Median 9.7% 9.1% 7.9% 7.3% 6.6% 7.5% 5.9% 6.2% 6.4% 6.7% 6.0% 6.2%
Arithmetic mean 9.8% 10.1% 8.6% 8.1% 9.0% 9.8% 7.0% 6.7% 6.6% 6.4% 5.9% 6.1%
Market-value weighted mean 9.3% 9.2% 7.6% 7.0% 6.7% 7.7% 5.9% 5.7% 6.2% 6.2% 5.6% 6.1%
Upper quantile 15.0% 13.5% 13.7% 11.3% 11.3% 20.5% 10.5% 10.7% 8.9% 8.8% 8.2% 8.7%
Maximum 21.6% 25.7% 16.3% 23.5% 39.1% 35.1% 19.0% 14.7% 14.1% 9.5% 10.3% 11.0%
Market-value weighted debt 35.2% 35.3% 28.4% 23.2% 22.8% 20.3% 17.4% 21.5% 25.0% 26.0% 23.9% 32.9%
Implied Sector ReturnsConsumer Service (table)
50

7.3% 7.3%6.3% 6.2% 5.8%
6.5%
4.8% 4.9% 5.1% 5.1% 4.7% 5.0%
9.3% 9.2%
7.6%7.0% 6.7%
7.7%
5.9% 5.7%6.2% 6.2%
5.6%6.1%
0.0%
2.0%
4.0%
6.0%
8.0%
10.0%
12.0%
14.0%
16.0%
Implied sector returns - DACH - Consumer Service
Range (10% - 90% quantile) Market-value weighted mean (unlevered) Market-value weighted mean (levered)
Implied Sector ReturnsConsumer Service (chart)
51
Note: The ranges refer to the implied sector returns (unlevered).
The implied sector return (unlevered) of theConsumer Service sector increased from4.7% as of 30 June 2017 to 5.0% as of 31December 2017.
Overall, we can identify a fluctuationbetween 4.7% and 7.3% of the market-value weighted mean (unlevered) since 30June 2012.

Implied sector returns (levered) - DACH - Pharma & Healthcare
H1 2012 H2 2012 H1 2013 H2 2013 H1 2014 H2 2014 H1 2015 H2 2015 H1 2016 H2 2016 H1 2017 H2 2017
30.06.2012 31.12.2012 30.06.2013 31.12.2013 30.06.2014 31.12.2014 30.06.2015 31.12.2015 30.06.2016 31.12.2016 30.06.2017 31.12.2017
Minimum -0.4% 1.5% -0.4% 2.3% 0.8% 2.0% 1.4% 1.1% 1.4% 1.6% 2.0% 1.9%
Lower quantile 3.6% 3.6% 2.5% 5.4% 2.4% 3.5% 2.0% 3.7% 3.7% 2.7% 2.9% 2.4%
Median 7.4% 7.3% 6.5% 6.7% 6.1% 6.3% 5.8% 6.1% 6.0% 5.6% 5.8% 5.0%
Arithmetic mean 9.9% 7.4% 6.5% 7.0% 5.9% 6.9% 5.6% 6.6% 5.9% 7.9% 5.9% 5.5%
Market-value weighted mean 9.7% 9.3% 8.0% 7.9% 7.1% 7.4% 6.8% 7.1% 7.1% 7.7% 7.0% 7.1%
Upper quantile 14.3% 10.4% 9.0% 9.4% 8.3% 9.3% 7.5% 8.6% 7.9% 8.0% 7.3% 7.7%
Maximum 73.9% 12.9% 19.4% 11.0% 11.7% 22.2% 11.5% 24.8% 9.2% 76.3% 27.9% 20.2%
Market-value weighted debt 27.0% 24.3% 18.1% 16.7% 15.7% 18.2% 16.8% 18.5% 20.3% 20.6% 20.2% 19.6%
Implied Sector ReturnsPharma & Healthcare (table)
52
Implied sector returns (unlevered) - DACH - Pharma & Healthcare
H1 2012 H2 2012 H1 2013 H2 2013 H1 2014 H2 2014 H1 2015 H2 2015 H1 2016 H2 2016 H1 2017 H2 2012
30.06.2012 31.12.2012 30.06.2013 31.12.2013 30.06.2014 31.12.2014 30.06.2015 31.12.2015 30.06.2016 31.12.2016 30.06.2017 31.12.2017
Minimum 0.4% 1.8% 0.8% 2.3% 1.3% 2.0% 1.4% 1.2% 1.3% 1.4% 1.5% 1.4%
Lower quantile 3.1% 3.0% 2.4% 4.6% 3.1% 3.8% 1.9% 3.2% 2.8% 2.1% 2.9% 2.2%
Median 6.2% 6.3% 5.7% 6.1% 5.6% 5.8% 5.1% 5.2% 4.9% 5.3% 4.8% 4.5%
Arithmetic mean 8.0% 6.2% 5.9% 6.3% 5.4% 5.7% 4.7% 5.0% 4.9% 5.3% 4.6% 5.1%
Market-value weighted mean 8.1% 7.8% 7.1% 7.1% 6.5% 6.5% 6.0% 6.2% 6.0% 6.6% 6.0% 6.1%
Upper quantile 13.6% 8.9% 7.7% 7.8% 7.3% 7.4% 6.3% 6.6% 6.5% 6.7% 5.9% 6.5%
Maximum 52.3% 9.5% 18.0% 10.6% 10.8% 9.2% 6.6% 7.7% 7.6% 18.6% 7.1% 20.1%
Market-value weighted debt 27.0% 24.3% 18.1% 16.7% 15.7% 18.2% 16.8% 18.5% 20.3% 20.6% 20.2% 19.6%

8.1% 7.8%7.1% 7.1%
6.5% 6.5% 6.0% 6.2% 6.0%6.6%
6.0% 6.1%
9.7% 9.3%
8.0% 7.9%7.1% 7.4%
6.8% 7.1% 7.1%7.7%
7.0% 7.1%
0.0%
2.0%
4.0%
6.0%
8.0%
10.0%
12.0%
14.0%
16.0%
Implied sector returns - DACH - Pharma & Healthcare
Range (10% - 90% quantile) Market-value weighted mean (unlevered) Market-value weighted mean (levered)
Implied Sector ReturnsPharma & Healthcare (chart)
53
Note: The ranges refer to the implied sector returns (unlevered).
The implied sector return (unlevered) of thePharma & Healthcare sector increasedslightly from 6.0% as of 30 June 2017 to 6.1%as of 31 December 2017.
In comparison to other sectors, the Pharma& Healthcare sector had the second highestunlevered implied return as of 31 December2017.
Overall, we could identify a fluctuationbetween 6.0% and 8.1% of the market-valueweighted mean (unlevered) since 30 June2012.

Implied Sector ReturnsInformation Technology (table)
54
Implied sector returns (levered) - DACH - Information Technology
H1 2012 H2 2012 H1 2013 H2 2013 H1 2014 H2 2014 H1 2015 H2 2015 H1 2016 H2 2016 H1 2017 H2 2017
30.06.2012 31.12.2012 30.06.2013 31.12.2013 30.06.2014 31.12.2014 30.06.2015 31.12.2015 30.06.2016 31.12.2016 30.06.2017 31.12.2017
Minimum 0.6% 1.3% 1.4% 1.3% 1.8% 0.9% -1.4% 1.0% 1.7% 0.2% 2.1% 0.5%
Lower quantile 5.0% 4.3% 5.1% 4.3% 4.2% 5.0% 4.6% 4.4% 3.8% 4.6% 3.6% 3.6%
Median 8.7% 8.5% 7.1% 7.3% 6.4% 7.6% 6.2% 6.5% 6.2% 6.6% 5.5% 5.5%
Arithmetic mean 8.8% 8.6% 7.5% 7.2% 6.4% 7.6% 6.4% 6.6% 6.3% 7.5% 5.7% 5.7%
Market-value weighted mean 8.1% 7.3% 7.3% 7.1% 7.0% 7.4% 6.9% 6.7% 7.0% 6.6% 6.0% 6.1%
Upper quantile 13.5% 11.9% 10.3% 9.8% 9.1% 10.8% 9.2% 8.7% 7.9% 10.1% 7.6% 6.9%
Maximum 17.9% 19.1% 17.3% 15.3% 11.9% 14.1% 11.7% 18.6% 16.5% 35.0% 15.8% 28.2%
Market-value weighted debt 8.0% 7.6% 8.0% 6.5% 7.1% 16.3% 14.1% 10.7% 11.0% 8.5% 6.8% 5.5%
Implied sector returns (unlevered) - DACH - Information Technology
H1 2012 H2 2012 H1 2013 H2 2013 H1 2014 H2 2014 H1 2015 H2 2015 H1 2016 H2 2016 H1 2017 H2 2012
30.06.2012 31.12.2012 30.06.2013 31.12.2013 30.06.2014 31.12.2014 30.06.2015 31.12.2015 30.06.2016 31.12.2016 30.06.2017 31.12.2017
Minimum 0.9% 1.8% 1.8% 1.7% 2.7% 2.2% 1.3% 1.0% 1.2% 0.2% 2.0% 0.5%
Lower quantile 4.4% 4.6% 4.9% 3.8% 4.0% 4.8% 3.9% 4.2% 3.0% 3.9% 3.0% 3.3%
Median 7.5% 7.7% 6.5% 6.5% 5.8% 6.6% 5.4% 5.4% 5.3% 6.0% 5.0% 5.1%
Arithmetic mean 7.6% 7.5% 6.6% 6.5% 5.8% 6.7% 5.5% 5.7% 5.4% 6.6% 5.0% 4.9%
Market-value weighted mean 7.6% 6.9% 6.9% 6.9% 6.7% 6.7% 6.2% 6.2% 6.3% 6.1% 5.7% 5.8%
Upper quantile 11.1% 10.1% 8.8% 9.0% 7.7% 9.0% 7.1% 7.4% 7.3% 8.3% 6.3% 6.3%
Maximum 16.3% 13.0% 12.6% 10.9% 9.0% 10.6% 9.5% 17.6% 15.4% 33.4% 11.2% 9.5%
Market-value weighted debt 8.0% 7.6% 8.0% 6.5% 7.1% 16.3% 14.1% 10.7% 11.0% 8.5% 6.8% 5.5%

7.6% 6.9% 6.9% 6.9% 6.7% 6.7% 6.2% 6.2% 6.3% 6.1% 5.7% 5.8%
8.1%7.3% 7.3% 7.1% 7.0% 7.4%
6.9% 6.7% 7.0% 6.6%6.0% 6.1%
0.0%
2.0%
4.0%
6.0%
8.0%
10.0%
12.0%
14.0%
16.0%
Implied sector returns - DACH - Information Technology
Range (10% - 90% quantile) Market-value weighted mean (unlevered) Market-value weighted mean (levered)
Implied Sector ReturnsInformational Technology (chart)
55
Note: The ranges refer to the implied sector returns (unlevered).
The implied sector return (unlevered) of theInformation Technology sector slightlyincreased from 5.7% as of 30 June 2017 to5.8% as of 31 December 2017.
In comparison to other sectors, theInformation Technology sector had thesmallest spread between levered andunlevered market-value weighted mean. This isdue to the lowest market-value weighted debtratio.
Overall, we could identify a fluctuationbetween 5.7% and 7.6% of the market-valueweighted mean (unlevered) since 30 June2012.

Implied Sector ReturnsUtilities (table)
56
Implied sector returns (levered) - DACH - Utilities
H1 2012 H2 2012 H1 2013 H2 2013 H1 2014 H2 2014 H1 2015 H2 2015 H1 2016 H2 2016 H1 2017 H2 2017
30.06.2012 31.12.2012 30.06.2013 31.12.2013 30.06.2014 31.12.2014 30.06.2015 31.12.2015 30.06.2016 31.12.2016 30.06.2017 31.12.2017
Minimum 3.4% 4.6% 5.6% 4.2% 3.7% 3.8% 3.9% 4.9% 5.2% 4.8% 5.5% 4.5%
Lower quantile 6.1% 5.5% 6.3% 5.5% 4.0% 4.9% 5.4% 5.2% 6.8% 5.7% 5.5% 5.2%
Median 8.3% 8.9% 7.4% 7.3% 7.0% 7.1% 6.5% 7.0% 7.5% 7.4% 7.5% 6.2%
Arithmetic mean 8.3% 8.5% 8.6% 7.5% 6.8% 7.0% 7.8% 7.0% 7.6% 7.7% 7.7% 6.8%
Market-value weighted mean 9.7% 10.3% 10.5% 7.9% 6.6% 6.9% 8.3% 7.6% 8.3% 8.2% 8.6% 7.4%
Upper quantile 10.7% 11.1% 11.6% 9.9% 8.9% 9.4% 11.5% 8.7% 8.9% 10.2% 9.7% 8.6%
Maximum 13.0% 13.3% 16.2% 10.1% 9.9% 10.1% 14.6% 9.7% 9.4% 10.5% 11.8% 10.7%
Market-value weighted debt 100.7% 116.7% 108.4% 113.1% 87.8% 118.4% 107.9% 158.5% 124.5% 139.9% 101.6% 89.8%
Implied sector returns (unlevered) - DACH - Utilities
H1 2012 H2 2012 H1 2013 H2 2013 H1 2014 H2 2014 H1 2015 H2 2015 H1 2016 H2 2016 H1 2017 H2 2017
30.06.2012 31.12.2012 30.06.2013 31.12.2013 30.06.2014 31.12.2014 30.06.2015 31.12.2015 30.06.2016 31.12.2016 30.06.2017 31.12.2017
Minimum 2.7% 3.2% 3.9% 3.5% 3.1% 2.8% 3.0% 2.6% 2.9% 2.6% 2.7% 3.0%
Lower quantile 4.0% 3.9% 4.1% 4.0% 3.3% 3.0% 3.0% 3.0% 3.1% 2.7% 3.5% 3.3%
Median 5.3% 5.1% 5.0% 4.8% 4.5% 4.2% 4.0% 3.8% 3.6% 4.1% 4.2% 4.1%
Arithmetic mean 5.3% 5.1% 5.3% 4.9% 4.5% 4.0% 4.2% 3.7% 3.7% 4.1% 4.5% 4.1%
Market-value weighted mean 5.9% 5.9% 6.1% 5.1% 4.6% 4.1% 4.4% 3.8% 4.1% 4.1% 4.8% 4.4%
Upper quantile 6.4% 6.3% 6.4% 5.8% 5.4% 4.7% 5.4% 4.6% 4.5% 5.5% 5.4% 5.0%
Maximum 7.4% 6.9% 8.2% 6.0% 5.6% 4.8% 7.2% 4.7% 4.9% 6.0% 6.9% 5.3%
Market-value weighted debt 100.7% 116.7% 108.4% 113.1% 87.8% 118.4% 107.9% 158.5% 124.5% 139.9% 101.6% 89.8%

5.9% 5.9% 6.1%5.1% 4.6%
4.1% 4.4%3.8% 4.1% 4.1%
4.8% 4.4%
9.7% 10.3% 10.5%
7.9%6.6% 6.9%
8.3%7.6%
8.3% 8.2% 8.6%
7.4%
0.0%
2.0%
4.0%
6.0%
8.0%
10.0%
12.0%
14.0%
16.0%
Implied sector returns - DACH - Utilities
Range (10%-90% quantile) Market-value weighted mean (unlevered) Market-value weighted mean (levered)
Implied Sector ReturnsUtilities (chart)
57
Note: The ranges refer to the implied sector returns (unlevered).
The implied sector return (unlevered) of theUtilities sector decreased from 4.8% as of 30June 2017 to 4.4% as of 31 December 2017.
In comparison to other sectors, the Utilitiessector had the lowest unlevered implied returnas of 31 December 2017.
Overall, we could identify a fluctuationbetween 3.8% and 6.1% of the market-valueweighted mean (unlevered) since 30 June2012.

Sector Returns
b. Historical returns (ex-post analysis)
7

Historical Sector ReturnsBackground & approach
In addition to the determination of historical market returns (cf. slide 25 etseq.), we are able to calculate the historical sector returns. This optioncreates an alternative approach, like the implied sector returns, for the ex-post analysis of the determination of costs of capital based on regressionanalyses following the CAPM.
Our analysis contains so-called total shareholder returns analogous to thereturn triangles for the German, Austrian and Swiss total return indicesThis means, we consider the share price development as well as thedividend yield, whereas the share price development generally representsthe main component of the total shareholder return.
We calculate the annual total shareholder returns as of 31 December forevery CDAX, WBI, and SPI listed company. Afterwards, we aggregate thosereturns market-value weighted to sector returns. Our calculationscomprise the time period between 2012 and 2017. Since annual totalshareholder returns tend to fluctuate to a great extent, their explanatorypower is limited. Therefore, we do not only calculate the 1-year market-value weighted means, we additionally calculated the 3-year (2015-2017)and the 6-year (2012-2017) averages.
59

Historical Sector ReturnsAnnual total shareholder returns as of 31 December 2017
60
27,8%
16,4%
8,6%
20,6%
0,6%
18,3%
33,9%
22,7%
5,6%
10,2%
14,8%
17,6%
32,4%
27,5%
6,3%
10,5%
2,7%
13,7%
7,3%
41,1%
8,5%
22,1%
-0,4%
2,5%
23,4%
26,9%
4,9%
12,1%
19,3%
23,3%
18,3%
48,6%
9,3%
38,5%
-6,0%
10,7%
17,0%
32,2%
25,7%
20,7%
-1,4%
6,0%
42,5%
18,6%
6,3%
36,5%
15,1%
41,1%
0,2%
-2,6%
5,0%
-20,4%
2,0%
34,3%
-30,0%
-20,0%
-10,0%
0,0%
10,0%
20,0%
30,0%
40,0%
50,0%
60,0%
31.12.2012 31.12.2013 31.12.2014 31.12.2015 31.12.2016 31.12.2017
FIRE
Basic Materials
Consumer Goods
Telecommunication
Industrials
Consumer Service
Pharma & Healthcare
InformationTechnology
Utilities
FIREBasic
Materials
Consumer
Goods
Telecom-
municationIndustrials
Consumer
Service
Pharma &
Healthcare
Information
TechnologyUtilities
3-year-average (2015 - 2017) 13,2% 14,2% 9,0% 8,1% 18,2% 14,4% 8,4% 30,9% 5,3%
6-year-average (2012 - 2017) 15,4% 17,5% 15,5% 13,5% 18,3% 19,9% 16,7% 26,7% 3,1%

Trading multiples8

Trading MultiplesBackground & approach
Besides absolute valuation models (earnings value, DCF), the multiplesapproach offers a practical way for an enterprise value estimation. Themultiples method estimates a company’s value relative to anothercompany’s value. Following this approach, the enterprise value resultsfrom the product of a reference value (revenue or earnings values arefrequently used) of the company with the respective multiples of similarcompanies.
Within this capital market study, we analyze multiples for the “super -sectors" as well as multiples for the DACH market consisting of theGerman, Austrian, and Swiss capital markets (CDAX, ATX, and SPI). We willlook at the following multiples:
Revenue-Multiples (“EV1)/Revenue“),
EBIT-Multiples (“EV1)/EBIT“),
Price-to-Earnings-Multiples (“P/E“)
Price-to-Book Value-Multiples (“EqV2)/BV“)
Multiples are presented for two different reference values. Firstly, thereference values are based on a company's realized trailing last 12months, which represent its financial performance for the past 12-monthperiod (so-called trailing-multiples, in the following “LTM”). Secondly, thereference values are based on one-year forecasts of analysts (so-calledforward-multiples, in the following “1yf”). Both approaches are typicallynot limited to the end of the fiscal year. The Price-to-Book Value-Multiplesare calculated with the book values as of reference date (31 December2017).
We present historical multiples since 31 December 2012 in the appendixand we will update the applied multiples semi-annually at the predefinedreference date (as of 30 June and as of 31 December).
We provide a graphical, as well as a tabular illustration of the multiples asof 31 December 2017 on the following slides.
Additional to the arithmetic mean and median as essential average sizes,we show the minimum, the maximum, the standard deviation and thenumber of the companies. For the purposes of simplification, we excludenegative multiples and multiples in the highest quantile (95%). Themultiples in the lowest quantile (5%) build the lower limit.
For calculating the multiples, we source the data (i.e. Market Cap.,Revenue, EBIT, etc.) from the data provider S&P Capital IQ.
1) Enterprise Value
2) Equity Value
62
Multiples Executive summary (1/2)
63
FIRE
Compared to the past six years, the Revenue-Multiples were at their highest level with the median amounting to 1.8x (1yf) as of 31December 2017.
The median of the EBIT-Multiples based on the expected EBIT (1yf) of the Basic Materials sector increased slightly from 16.0x as of30 June 2017 to 16.3x as of 31 December 2017.
Basic Materials
The median of the EBIT-Multiples increased from 16.9x (LTM) as of 31 December 2016 to 18.3x (LTM) as of 31 December 2017.
The sector had the lowest Revenue-Multiples with a median of 1.2x (LTM and 1yf) compared to the other sectors.
Consumer Goods
The sector Telecommunication reached its highest EBIT-Multiples compared to its past six years with a median of 22.0x (LTM) as of31 December 2017. The median of the one-year forward EBIT-Multiples amounted to 17.8x as of 31 December 2017.
Its P/E-Multiples showed a relatively high fluctuation over the past six years with the median varying from 10.4x to 29.8x (LTM) andfrom 10.9x to 24.0x on a 1yf-basis.
Telecom-munication
At the reference date 31 December 2017, the medians of the illustrated multiples EV/Revenue (1yf), EV/EBIT (1yf), P/E (1yf) andEqV/BV reached their highest level compared to the past six years.
The median of the Revenue- and EBIT-Multiples increased in a constant manner from of 1.0x in 2012 to 1.5x in 2017 (LTM) andfrom 13.1x in 2012 to 20.7x in 2017 (LTM).
DACH
For financial institutions no Revenue- and EBIT-Multiples were calculated since revenues and EBIT are not meaningful for thosecompanies as for their operations mainly interest payments/expenses are critical. For that reason, only P/E- and EqV/BV-Multipleswere calculated for the FIRE sector.
The median of the P/E-Multiples (1yf) increased from 16.2x as of 30 June 2017 to 17.3x as of 31 December 2017.

Multiples Executive summary (2/2)
64
Consumer Service
The Pharma & Healthcare sector showed the highest median EBIT-Multiples compared to all other sectors as of 31 December 2017:It had EV/EBIT median multiples of 27.0x (LTM) and 24.8x (1yf).
Its Revenue-Multiples represented the highest values, too, with a median of 3.1x (LTM) and 3.7x (1yf) as of 31 December 2017.
Pharma & Healthcare
The Information Technology sector represented the highest EqV/BV-Multiples with a median of 3.3x as of 31 December 2017.
The sector also showed the highest P/E-Multiples compared to all other sectors. It had P/E median multiples of 27.2x (LTM) and29.4x (1yf).
Information Technology
The Utilities sector multiples showed high volatility in the past six years, compared to the other sectors.
However, the Revenue-Multiples reached their highest median of 1.9x (LTM) and (1yf) as of the reference date compared to 1.8x(LTM) and 0.9x (1yf) as of 31 December 2016.
Utilities
All displayed multiples except the EBIT-Multiples reached their highest value for the past six years.
The median of the Revenue-Multiples increased from 1.2x (LTM) and (1yf) as of 31 December 2016 to 1.4x (LTM) and 1.6x (1yf) asof 31 December 2017.
EBIT-Multiples averaged 18.9x (1yf, median) as of 31 December 2017.
Industrials
The median of the Revenue-Multiples increased from 1.1x (LTM) and 1.4x (1yf) as of 31 December 2016 to 1.3x (LTM) and 1.9x (1yf)as of 31 December 2017.
The median of the EBIT-Multiples increased from 19.8x (LTM) and 15.4x (1yf) as of 31 December 2016 to 20.1x (LTM) and 20.5x(1yf) as of 31 December 2017.
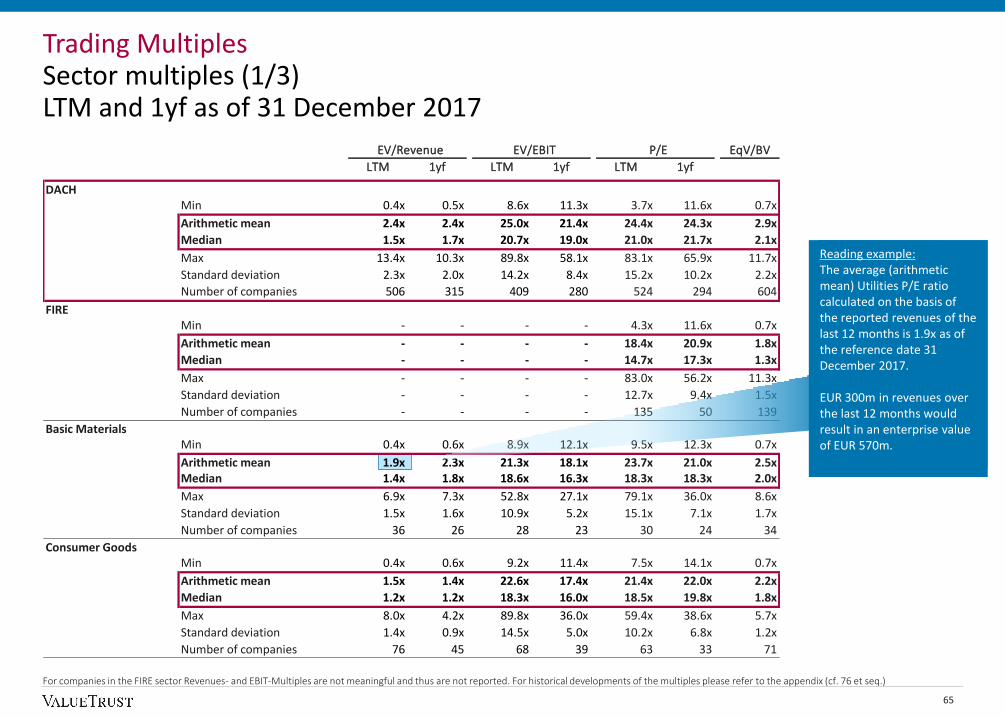
EV/Revenue EV/EBIT P/E EqV/BV
LTM 1yf LTM 1yf LTM 1yf
DACHMin 0.4x 0.5x 8.6x 11.3x 3.7x 11.6x 0.7x
Arithmetic mean 2.4x 2.4x 25.0x 21.4x 24.4x 24.3x 2.9x
Median 1.5x 1.7x 20.7x 19.0x 21.0x 21.7x 2.1x
Max 13.4x 10.3x 89.8x 58.1x 83.1x 65.9x 11.7x
Standard deviation 2.3x 2.0x 14.2x 8.4x 15.2x 10.2x 2.2x
Number of companies 506 315 409 280 524 294 604
FIREMin - - - - 4.3x 11.6x 0.7x
Arithmetic mean - - - - 18.4x 20.9x 1.8x
Median - - - - 14.7x 17.3x 1.3x
Max - - - - 83.0x 56.2x 11.3x
Standard deviation - - - - 12.7x 9.4x 1.5x
Number of companies - - - - 135 50 139
Basic MaterialsMin 0.4x 0.6x 8.9x 12.1x 9.5x 12.3x 0.7x
Arithmetic mean 1.9x 2.3x 21.3x 18.1x 23.7x 21.0x 2.5xMedian 1.4x 1.8x 18.6x 16.3x 18.3x 18.3x 2.0x
Max 6.9x 7.3x 52.8x 27.1x 79.1x 36.0x 8.6x
Standard deviation 1.5x 1.6x 10.9x 5.2x 15.1x 7.1x 1.7x
Number of companies 36 26 28 23 30 24 34
Consumer GoodsMin 0.4x 0.6x 9.2x 11.4x 7.5x 14.1x 0.7x
Arithmetic mean 1.5x 1.4x 22.6x 17.4x 21.4x 22.0x 2.2x
Median 1.2x 1.2x 18.3x 16.0x 18.5x 19.8x 1.8x
Max 8.0x 4.2x 89.8x 36.0x 59.4x 38.6x 5.7x
Standard deviation 1.4x 0.9x 14.5x 5.0x 10.2x 6.8x 1.2x
Number of companies 76 45 68 39 63 33 71
Trading MultiplesSector multiples (1/3)LTM and 1yf as of 31 December 2017
For companies in the FIRE sector Revenues- and EBIT-Multiples are not meaningful and thus are not reported. For historical developments of the multiples please refer to the appendix (cf. 76 et seq.)
65
Reading example:The average (arithmetic mean) Utilities P/E ratio calculated on the basis of the reported revenues of the last 12 months is 1.9x as of the reference date 31 December 2017.
EUR 300m in revenues over the last 12 months would result in an enterprise value of EUR 570m.

EV/Revenue EV/EBIT P/E EqV/BV
LTM 1yf LTM 1yf LTM 1yf
TelecommunicationMin 0.4x 1.7x 14.2x 14.5x 7.4x 15.7x 0.7x
Arithmetic mean 1.8x 2.6x 25.9x 20.9x 23.5x 19.3x 2.5x
Median 1.8x 2.0x 22.0x 17.8x 14.1x 17.3x 1.9x
Max 3.7x 4.4x 56.6x 33.8x 68.6x 29.0x 8.8x
Standard deviation 1.0x 0.9x 13.9x 6.8x 21.0x 5.0x 2.1x
Number of companies 13 7 7 6 6 5 12
IndustrialsMin 0.4x 0.5x 8.7x 12.1x 4.0x 13.3x 0.7x
Arithmetic mean 2.1x 2.1x 24.1x 20.9x 28.4x 24.1x 3.2x
Median 1.4x 1.6x 20.6x 18.9x 24.1x 21.8x 2.4x
Max 12.6x 9.8x 72.4x 56.7x 83.1x 65.9x 11.7x
Standard deviation 2.2x 1.7x 11.6x 7.3x 16.7x 8.5x 2.3x
Number of companies 186 126 155 115 152 103 164
Consumer ServiceMin 0.4x 0.5x 8.7x 11.8x 3.7x 12.3x 0.7x
Arithmetic mean 2.4x 3.1x 26.7x 21.9x 21.3x 25.7x 3.8x
Median 1.3x 1.9x 20.1x 20.5x 19.4x 24.9x 2.4x
Max 9.9x 10.1x 86.3x 53.0x 46.8x 65.8x 10.8x
Standard deviation 2.3x 2.6x 19.0x 10.4x 11.7x 12.1x 3.0x
Number of companies 49 30 40 22 31 17 45
Trading MultiplesSector multiples (2/3)LTM and 1yf as of 31 December 2017
66
For companies in the FIRE sector Revenues- and EBIT-Multiples are not meaningful and thus are not reported. For historical developments of the multiples please refer to the appendix (cf. 76 et seq.)
Reading example:The median Consumer Service EV/EBIT ratio calculated on the basis of the expected EBIT (1-year forward) is 20.5x as of the reference date 31 December 2017.
An expected EBIT of EUR 30m would result in an enterprise value of EUR 615m.

EV/Revenue EV/EBIT P/E EqV/BV
LTM 1yf LTM 1yf LTM 1yf
Pharma & HealthcareMin 0.4x 0.7x 8.9x 11.3x 4.3x 13.8x 0.7x
Arithmetic mean 3.8x 3.9x 29.0x 26.1x 29.7x 27.2x 3.8x
Median 3.1x 3.7x 27.0x 24.1x 27.2x 24.8x 2.9x
Max 11.9x 10.2x 68.0x 58.1x 68.5x 56.9x 10.0x
Standard deviation 2.8x 2.2x 15.8x 12.0x 14.9x 10.8x 2.5x
Number of companies 41 27 29 23 28 18 51
Information TechnologyMin 0.4x 0.7x 8.6x 14.8x 4.9x 16.4x 0.7x
Arithmetic mean 3.0x 3.1x 27.7x 25.8x 31.0x 33.4x 4.0x
Median 2.1x 2.3x 23.5x 23.2x 27.2x 29.4x 3.3x
Max 13.4x 10.3x 82.7x 49.8x 73.4x 62.9x 11.7x
Standard deviation 2.5x 2.3x 14.5x 8.8x 15.9x 13.1x 2.5x
Number of companies 93 49 70 45 67 37 76
UtilitiesMin 0.8x 0.9x 12.8x 11.3x 6.0x 12.0x 0.8x
Arithmetic mean 3.1x 1.9x 27.4x 16.0x 19.6x 17.4x 1.6x
Median 1.9x 1.9x 21.3x 14.5x 18.4x 16.0x 1.3x
Max 10.9x 3.7x 81.1x 24.4x 37.4x 24.8x 4.1x
Standard deviation 3.1x 1.0x 18.3x 4.6x 9.5x 4.3x 0.8x
Number of companies 12 5 12 7 12 7 12
Trading MultiplesSector multiples (3/3)LTM and 1yf as of 31 December 2017
67
For companies in the FIRE sector Revenues- and EBIT-Multiples are not meaningful and thus are not reported. For historical developments of the multiples please refer to the appendix (cf. 76 et seq.)
Reading example:The average (arithmetic mean) Utilities P/E ratio calculated on the basis of expected earnings (1-year forward) is 17.4x as of the reference date 31 December 2017.
An expected revenue of EUR 50m would result in an equity value of EUR 870m.

Appendix
Composition of the sectors of CDAX, WBI and SPI as of 31 December 2017

FIRE
A.A.A. AG GRENKE AG RCM BETEILIGUNGS AG IMMOFINANZ AG INVESTIS HOLDING SA
AAREAL BANK AG GSW IMMOBILIEN AG RINGMETALL AG OBERBANK AG JULIUS BAER EUROPE AG
ACCENTRO REAL ESTATE AG GWB IMMOBILIEN SCHERZER & CO. AG RAIFFEISEN BANK INTERNATIONAL AG LEONTEQ AG
ADCAPITAL AG GXP GERMAN PROEPRTIES AG SHAREHOLDER VALUE BET. AG S IMMO AG LUZERNER KANTONALBANK AG
ADLER REAL ESTATE AG HAEMATO AG SINNER AG UBM DEVELOPMENT AG MOBIMO AG
ALBIS LEASING AG HAMBORNER REIT AG SINO-GERMAN UNITED AG UNIQA INSURANCE GROUP AG ORASCOM DEVELOPMENT HLD AG
ALLIANZ SE HANNOVER RUECK SE SIXT LEASING UNTERNEHMENS INVEST AG PARGESA HOLDING AG
ALSTRIA OFFICE REIT-AG HEIDELBERGER BET. HOLDING AG SM WIRTSCHAFTSBERATUNGS AG VIENNA INSURANCE GROUP AG PARTNERS GROUP HOLDING AG
BASIC RESOURCES AG HELIAD EQUITY PAR. GMBH & CO. KGAA SPARTA AG WARIMPEX FINANZ- UND BETEIL. AG Peach Property GROUP AG
BERLINER EFFEKTENGESELLSCHAFT AG HESSE NEWMAN CAPITAL AG SPOBAG WIENER PRIVATBANK SE PLAZZA AG
COMDIRECT BANK AG HYPOPORT AG TAG IMMOBILIEN AG ALLREAL HOLDING AG PRIVATE EQUITY HOLDING AG
COMMERZBANK AG INCITY IMMOBILIEN AG TALANX AG Arundel AG PSP AG
CR CAPITAL REAL ESTATE AG JDC GROUP AG THE NAGA GROUP AG BALOISE HOLDING AG SCHWEIZERISCHE NATIONALBANK AG
DEMIRE DT.MTS.RE AG KAP BETEILIGUNGS-AG TLG IMMOBILIEN AG BANK CLER AG SPCE PRIVATE EQUITY AG
DEUTCSHE GRUNDSTÜCKSAKTIONEN AG KST BETEILIGUNGS AG TRADEGATE AG BANQUE PROFIL DE GESTION SA ST GALLER KANTONALBANK AG
DEUTSCHE BALATON AG LANG & SCHWARZ AG UNIPROF REAL ESTATE HLD AG BASELLAND. KANTONALBANK AG SWISS FIN & PROP INVESTMENT AG
DEUTSCHE BANK AG LEG IMMOBILIEN AG VALUE MGMT & RESEARCH AG BASLER KANTONALBANK SA SWISS LIFE HOLDING AG
DEUTSCHE BETEILIGUNGS AG L-KONZEPT HOLDING AG VARENGOLD BANK AG BC DE GENEVE SA SWISS PRIME SITE AG
DEUTSCHE BOERSE AG LLOYD FONDS AG VDN AG BC DU JURA SA SWISS RE AG
DEUTSCHE CANNABIS AG MAIER & PARTNER AG VERIANOS REAL ESTATE AG BC VAUDOISE SA SWISSQUOTE GROUP HOLDING LTD
DT. EFF. UND WECH.-BET. AG MARS ONE VENTURES AG VONOVIA SE BELLEVUE GROUP AG THURGAUER KANTONALBANK AG
DEUTSCHE EUROSHOP AG MAX21 AG VPE WERTPAPIERHANDELSBANK AG BERNER KANTONALBANK AG UBS GROUP AG
DEUTSCHE KONSUM REIT-AG MIC AG WALLSTREET ONLINE AG BFW LIEGENSCHAFTEN AG VALARTIS GROUP AG
DEUTSCHE REAL ESTATE AG MLP AG WCM BET. & GRUNDBESITZ AG BK LINTH LLB AG VALIANT BANK AG
DEUTSCHE TECHNISCHE BET. AG MPC CAPITAL AG WEBAC HOLDING AG CEMBRA MONEY BANK AG VARIA US PROPERTIES AG
DEUTSCHE WOHNEN AG MUENCHNER RUECK AG WUESTENROT & WUERTTEMBERG AG CI COM SA VAUDOISE ASSURANCES HLD. SA
DF DEUTSCHE FORFAIT AG MUTARES AG YMOS AG CIE FIN. RICHEMONT AG VONTOBEL EUROPE AG
DIC ASSET AG NORATIS AG ATRIUM EUROPEAN REAL ESTATE LTD CREDIT SUISSE GROUP AG VZ HOLDING AG
DT.PFANDBRIEFBK AG NUERNBERGER BET. AG BANK FUER TIROL UND VBG AG EFG INTERNATIONAL AG WALLISER KANTONALBANK AG
ERNST RUSS AG OVB HOLDING AG BAWAG AG GLARNER KANTONALBANK AG WARTECK INVEST AG
EYEMAXX REAL ESTATE AG PATRIZIA IMMOBILIEN AG BKS BANK AG GLOBAL ASSET MGMT AG ZUEBLIN AG
FAIR VALUE REIT-AG PEARL GOLD AG BURGENLAND HOLDING AG GRAUB KANTONALBANK AG ZUG ESTATES HOLDING AG
FINLAB AG PONGS & ZAHN AG BUWOG AG HELVETIA HOLDING AG ZUGER KANTONALBANK AG
FINTECH GROUP AG PRIMAG AG CA IMMOBILIEN ANLAGEN AG HIAG IMMOBILIEN HOLDING AG ZURICH INSURANCE AG
FORIS AG PROCREDIT HLDG AG C-QUADRAT INVESTMENT AG HYPOTHEKARBANK LENZBURG AG
FRITZ NOLS AG PUBLITY AG ERSTE GROUP BANK AG INTERSHOP HOLDING AG
AppendixComposition of each sector as of 31 December 2017
69
Note: Sorted by DACH.

AppendixComposition of each sector as of 31 December 2017
70
Note: Sorted by DACH.
Basic Materials Consumer Goods
ASIAN BAMBOO AG EMS-CHEMIE AG A.S.CREATION TAPETEN AG LEIFHEIT AG OTTAKRINGER GETRAENKE AG ST
AURUBIS AG GIVAUDAN SA ADIDAS AG LEONI AG PANKL RACING SYSTEMS AG
B.R.A.I.N. AG GURIT HOLDING AG ADLER MODEMAERKTE AG MINERALBR. UEBER. GMBH & CO. KGAA POLYTEC HOLDING AG
BASF SE SCHMOLZ & BICKENBACH AG ADM HAMBURG AG MING LE SPORTS AG STADLAUER MALZFABRIK AG
BAYER AG ZWAHLEN & MAYR SA AGRARIUS AG MONINGER HOLDING AG WOLFORD AG
COVESTRO AG AHLERS AG MUEHL PRODUKT & SERVICE AG AIRESIS SA
DECHENG TECHNOLOGY AG ALNO AG PARK U.BELLHEIMER AG ARYZTA AG
DEUTSCHE ROHSTOFF AG AUDEN AG PFERDEWETTEN.DE AG AUTONEUM AG
EISEN- & HUETTENWERKE AG AUDI AG PORSCHE AUTOMOBIL HLD. SE BARRY CALLEBAUT AG
EVONIK INDUSTRIES AG BAYRISCHE MOTOREN WERKE AG PROGRESS-WERK OBERKIRCH AG BELL AG
FUCHS PETROLUB SE BBS KRAFTFAHRZEUGTECHNIK AG PUMA SE CALIDA HOLDING AG
H & R GMBH & CO KGAA BEIERSDORF AG REGENBOGEN AG EMMI AG
K & S AG BERENTZEN-GROUP AG ROY CERAMICS SE GM SA
KHD HUMBOLDT WEDAG AG BERTRANDT AG SCHAEFFLER AG HOCHDORF HOLDING AG
LANXESS AG BHS TABLETOP AG SCHLOSS WACHENHEIM AG HUEGLI HOLDING AG
LINDE AG BORUSSIA DORTMUND GMBH & CO. KGAA SCHWAELBCHEN MOLKEREI J.B. AG LECLANCHE SA
PETRO WELT TECHNOLOGIE AG CEWE STIFTUNG & CO.KGAA SHW AG LINDT & SPRUENGLI AG
SALZGITTER AG CONTINENTAL AG STEILMANN SE METALL ZUG AG
SGL CARBON SE DAIMLER AG STO SE & CO. KGAA NESTLE SA
SIMONA AG DIERIG HOLDING AG SUEDZUCKER AG ORIOR AG
SKW STAHL-METALLURGIE HOLDING AG EDAG ENGINEERING TC UNTERHALTUNGSELEKTRONIK AG RICHEMONT SA
SURTECO SE EINHELL GERMANY AG TOM TAILOR HOLDING AG SWATCH GROUP SA
SYMRISE AG ELRINGKLINGER AG TONKENS AGRAR AG
WACKER CHEMIE AG FEIKE AG ULTRASONIC AG
YOUBISHENG GREEN PAPER AG FENGHUA SOLETECH AG VAPIANO SE
AMAG AUSTRIA METALL AG FROSTA AG VERALLIA DTLD AG
LENZING AG GERRY WEBER INTERNATIONAL AG VILLEROY & BOCH AG
OMV AG GRAMMER AG VOLKSWAGEN AG
PORR AG HELLA KGAA HUECK & CO. WASGAU PRODUNKTIONS & HANDELS AG
SCHOELLER-BLECKMANN OILFIELD EQUIPMENT AG HELMA EIGENHEIMBAU AG WESTAG & GETALIT AG
STRABAG SE HENKEL AG & CO. KGAA AGRANA BETEILIGUNGS AG
VOESTALPINE AG HUGO BOSS AG DO & CO AG
WIENERBERGER AG HWA AG GURKTALER AG
CHAM PAPER GROUP HOLDING AG IFA HOTEL & TOURISTIK AG JOSEF MANNER & COMP. AG
CLARIANT AG JJ AUTO AG KTM INDUSTRIES AG
CPH CHEMIE & PAPIER HOLDING AG KAMPA AG LINZ TEXTIL HOLDING AG
Industrials
2G ENERGY AG GEA GROUP AG NANOFOCUS AG VERBIO VEREINIGTE BIOENERGIE AG FLUGHAFEN ZUERICH AG
7C SOLARPARKEN AG GESCO AG NANOGATE AG VISCOM AG FORBO HOLDING AG
A.I.S. AG HAMBURGER HAFEN & LOGISTIK AG NESCHEN AG VOLTABOX AG GAVAZZI HOLDING AG
ADINOTEC AG HANSEYACHTS AG NORDEX SE VOSSLOH AG GEBERIT AG
AIR BERLIN PLC & CO. LUFTV. KG HAPAG-LLOYD AG NORDWEST HANDEL AG VTG AG IMPLENIA AG
ALBA SE HEIDELBERG.DRUCKMASCHINEN AG NORMA GROUP SE WACKER NEUSON SE INFICON HOLDING AG
AMADEUS FIRE AG HEIDELBERGCEMENT AG ORBIS AG WALTER BAU-AG INTERROLL HOLDING AG
ASKNET AG HELIOCENTRIS ENERGIE SOL. AG OSRAM LICHT AG WANDERER-WERKE AG KARDEX AG
AUMANN AG HMS BERGBAU AG PFEIFFER VACUUM TECHNOLOGY AG ZHONGDE WASTE TECHNOLOGY AG KOMAX HOLDING AG
AVES ONE AG HOCHTIEF AG PHILIPP HOLZMANN AG ANDRITZ AG KUEHNE & NAGEL INTERNATIONAL AG
BABCOCK-BSH AG HOMAG GROUP AG PHOENIX SOLAR AG CLEEN ENERGY AG LAFARGEHOLCIM AG
BASLER AG IBU-TEC ADVANCED MATERIALS AG PITTLER MA.FABR. AG FACC AG LANDIS+GYR GROUP AG
BAUER AG IFA SYSTEMS AG PLAN OPTIK AG FLUGHAFEN WIEN AG LEM HOLDING AG
BAUMOT GROUP AG INDUS HOLDING AG PNE WIND AG FRAUENTHAL HOLDING AG MCH GROUP AG
BAVARIA INDUSTRIALS GROUP AG INFAS HLDG AG PVA TEPLA AG HTI HIGH TECH INDUSTRIES AG MEYER BURGER AG
BAYWA AG ITN NANOVATION AG R. STAHL AG MAYR-MELNHOF KARTON AG MIKRON SA
BILFINGER SE JENOPTIK AG RATIONAL AG OESTERREICHISCHE POST AG OC OERLIKON CORPORATION AG
BLUE CAP AG JOST WERKE AG RHEINMETALL AG OESTER. STAATSDRUCKEREI HOLDING AG PANALPINA WELTTRANSPORT AG
BOEWE SYSTEC AG JUNGHEINRICH AG S & O AGRAR AG PALFINGER AG PERFECT SA
BRENNTAG AG KHD HUMBOLDT WEDAG AG SCHALTBAU HOLDING ROSENBAUER INTERNATIONAL AG PERROT DUVAL HOLDING SA
CENTROTEC SUSTAINABLE AG KION GROUP AG SCHUMAG AG SEMPERIT AG HOLDING PHOENIX AG
CENTROTHERM PHOTOVOLTAICS AG KLOECKNER & CO: SE SCY BETEILIGUNG AG SW UMWELTTECHNIK AG POENINA HOLDING AG
CHINA SPECIALITY GLASS AG KOENIG & BAUER AG SFC ENERGY AG ZUMTOBEL GROUP AG RIETER MASCHINENFABRIK AG
COREO AG KROMI LOGISTIK SIEMENS AG ABB SCHWEIZ AG SCHAFFNER AG
CROPENERGIES AG KRONES AG SINGULUS ADECCO GROUP AG SCHINDLER AUFZUEGE AG
DALDRUP & SOEHNE AG KSB AG SIXT SE ADVAL TECH HOLDING AG SCHLATTER HOLDING AG
DATRON AG KUKA AG SLM SOLUTIONS GROUP AG ARBONIA AG SCHWEITER TECHNOLOGIES AG
DELIGNIT AG KWS SAAT SE SMA SOLAR TECHNOLOGY AG BELIMO AUTOMATION AG SFS GROUP AG
DEUTSCHE POST AG LPKF LASER & ELECTRONICS AG SMT SCHARF AG BOBST GROUP SA SGS SA
DEUTZ AG LUFTHANSA AG SOFTING AG BOSSARD HOLDING AG SIKA AG
DIEBOLD NIXDORF. MAN SE SOLAR-FABRIK AG BUCHER INDUSTRIES AG STARRAG GROUP HOLDING AG
DISKUS WERKE AG MANZ AG SOLARWORLD AG BURCKHARDT AG SULZER AG
DMG MORI AG MASCHINENFABRIK BERT.HER. AG STEICO SE BURKHALTER HOLDING AG TORNOS HOLDING AG
DR. HOENLE AG MASTERFLEX AG STINAG STUTTGART INVEST AG BVZ HOLDING AG VAT GROUP AG
DUERKOPP ADLER AG MAX AUTOMATION AG TECHNOTRANS AG CICOR MANAGEMENT AG VETROPACK HOLDING AG
DUERR AG MBB SE THYSSENKRUPP AG COMET HOLDING AG VON ROLL HOLDING AG
ELEXXION AG MEDION AG TURBON AG CONZZETA AG WALTER MEIER AG
ENERGIEKONTOR AG MS INDUSTRIE AG UET AG DAETWYLER HOLDING AG ZEHNDER GROUP AG
ENVITEC BIOGAS AG MTU AERO ENGINES AG UTD POWER TECHNOLOGY AG DKSH HOLDING AG
FRANCOTYP-POSTALIA HOLDING AG MUEHLHAN AG UZIN UTZ AG DORMAKABA HOLDING AG
FRAPORT AG MUELLER-DIE LILA LOGISTIK AG VA-Q-TEC AG ELMA ELECTRONIC AG
FRIWO AG M-U-T AG VARTA AG FEINTOOL INTERNATIONAL HOLDING AG
FROEHLICH BAU AG NABALTEC AG VECTRON SYSTEMS AG FISCHER AG
AppendixComposition of each sector as of 31 December 2017
71
Note: Sorted by DACH.

Information Technology Pharma & Healthcare
ADESSO AG INTICA SYSTEMS AG SINNERSCHRADER AG 4 SC AG STRATEC BIOMEDICAL AG
ADVA OPTICAL NETWORKING SE INVISION AG SNP AG AAP IMPLANTATE AG SYGNIS AG
AIXTRON SE ISC BUSINESS TECHNOLOGY SOFTMATIC AG ABWICKLUNGSG. ROESCH AG UMS INTERNATIONAL AG
ALL FOR ONE STEEB AG ISRA VISION SOFTSHIP AG BB BIOTECH AG VITA 34 AG
ALLGEIER SE IVU TRAFFIC TECHNOLOGIE AG SOFTWARE AG BIOFRONTERA AG WILEX AG
AMALPHI AG KONTRON AG SUESS MICROTEC AG BIOTEST AG. VALNEVA SE
AMATECH AG KPS AG SYZYGY AG CARL ZEISS MEDITEC AG ADDEX AG
ARTEC TECHNOLOGIES AG MEDICAL COLUMBUS AG TDMI AG CO.DON AG AEVIS HOLDING SA
ATOSS SOFTWARE AG MENSCH UND MASCHINE SE TELES AG CURASAN AG BACHEM HOLDING AG
B & S BANKSYSTEME AG METRIC MOBILITY SOLUTIONS AG TISCON AG CYTOTOOLS AG BASILEA PHARMACEUTICA AG
BECHTLE AG MEVIS MEDICAL SOLUTIONS AG TTL INFORMATION TECHN. AG DRAEGERWERK AG & CO. KGAA COLTENE HOLDING AG
BETA SYSTEMS SOFTWARE AG MOBOTIX AG UMT UTD MOBILITY TECHN. AG ECKERT & ZIEGLER AG EVOLVA HOLDING SA
CANCOM SE MSG LIFE AG USU SOFTWARE AG EPIGENOMICS AG IDORSIA LTD
CENIT AG MUEHLBAUER HOLDING AG UTD. INTERNET AG EVOTEC AG IVF HARTMANN AG
CEOTRONICS AG MYHAMMER HOLDING AG VIVANCO GRUPPE AG FORMYCON AG KUROS BIOSCIENCES AG
COMPUGROUP MEDICAL SE MYNARIC AG VTION WIRELESS TECHNOLOGY AG FRESEN.MED.CARE AG & CO. KGAA LONZA GROUP AG
DATA MODUL AG NEMETSCHEK SE WIRECARD AG FRESENIUS SE & CO.KGAA MOLECULAR PARTNERS AG
DATAGROUP SE NEXUS AG XING AG GERATHERM MEDICAL AG NOVARTIS AG
DOCCHECK AG NORCOM INFORMATION TECHN. AG AT&S AUSTRIA TECH. & SYSTEMTECH. AG GERRESHEIMER AG RELIEF THERAPEUTICS HOLDING AG
EASY SOFTWARE AG OHB SE KAPSCH TRAFFICCOM AG HUMANOPTICS AG ROCHE AG
ELMOS SEMICONDUCTOR AG OPENLIMIT HOLDING AG MASCHINENFABRIK HEID AG M1 KLINIKEN AG SANTHERA PHARM. HOLDING AG
EQS GROUP AG OTRS AG RATH AG MAGFORCE AG SIEGFRIED HOLDING AG
EUROMICRON AG PA POWER AUTOMATION AG AIROPACK TECHNOLOGY GROUP AG MATERNUS-KLINK AG SONOVA HOLDING AG
FABASOFT AG PANAMAX AG ALSO HOLDING AG MEDICLIN AG STRAUMANN HOLDING AG
FIRST SENSOR AG PARAGON AG AMS AG MEDIGENE AG TECAN GROUP AG
FORTEC ELEKTRONIK AG PSI AG ASCOM HOLDING AG MEDIOS AG VIFOR PHARMA AG
GBS SOFTWARE AG QSC AG CREALOGIX HOLDING AG MERCK AG & CO. KGAA YPSOMED HOLDING AG
GERM. STARTUPS GRP GMBH & CO. KGAA REALTECH AG GOLDBACH GROUP AG MOLOGEN AG
GFT TECHNOLOGIES SE RIB SOFTWARE AG HUBER+SUHNER AG MORPHOSYS AG
GIGASET AG S & T AG KUDELSKI SA MPH HEALTH CARE AG
GK SOFTWARE SAP SE LOGITECH INTERNATIONAL SA NANOREPRO AG
HOLIDAYCHECK GROUP AG SCHWEIZER ELECTRONIC AG MYRIAD GROUP AG PAION AG
INFINEON TECHNIK AG SECUNET SECURITY AG TEMENOS GROUP AG PAUL HARTMANN AG
INIT INNOVATION SE SEVEN PRINCIPLES AG U-BLOX HOLDING AG RHOEN-KLINIKUM AG
INTERCARD AG SHF COMMUNIC. TECHNOLOGIES AG WISEKEY INTERNATIONAL HOLDING AG SANOCHEMIA PHARMAZEUTIKA AG
INTERSHOP COMMUNICATIONS AG SILTRONIC AG STADA ARZNEIMITTEL AG
AppendixComposition of each sector as of 31 December 2017
72
Note: Sorted by DACH.

AppendixComposition of each sector as of 31 December 2017
Consumer Service Telecommunication Utilities
A.SPRINGER SE SLEEPZ AG 11 88 0 SOLUTIONS AG CAPITAL STAGE AG
AD PEPPER MEDIA N.V. SNOWBIRD AG 3U HOLDING AG ENBW ENERGIE B./W. AG
ARCANDOR AG SPL.MEDIEN AG DEUTSCHE TELEKOM AG GELSENWASSER AG
ARTNET AG STARAMBA SE DRILLISCH AG INNOGY SE
BASTEI LUEBBE AG STROEER SE & CO. KGAA ECOTEL COMMUNICATION AG MAINOVA AG
BEATE UHSE AG TAKKT AG FREENET AG MVV ENERGIE AG
BET-AT-HOME.COM AG TELE COLUMBUS AG LS TELCOM AG RWE AG
BIJOU BRIGITTE AG TMC CONTENT GROUP AG MVISE AG UNIPER SE
CECONOMY AG TRAVEL24.COM AG STARDSL AG EVN AG
CONSTANTIN MEDIEN AG UHR.DE AG TELEFONICA DEUTSCHLAND HOLDING AG VERBUND AG
CTS EVENTIM AG & CO. KGAA UNITED LABELS AG YOC AG BKW ENERGIE AG
DEAG DEUTSCHE ENTERTAINMENT AG WIGE MEDIA AG TELEKOM AUSTRIA AG EDISUN POWER EUROPE AG
DELTICOM AG WILD BUNCH AG SUNRISE COMMUNICATIONS AG ROMANDE ENERGIE HOLDING SA
ECOMMERCE ALLIANCE AG WINDELN.DE SE SWISSCOM AG
EDEL AG YOUR FAMILY ENTERTAINMENT AG
ELANIX BIOTECHNIK AG ZALANDO SE
ELUMEO SE ZOOPLUS AG
ENERXY AG APG SGA AG
FD GROUP AG DUFRY AG
FIELMANN AG GALENICA AG
HAWESKO HOLDING AG HIGHLIGHT EVENT & ENTERTAINMENT AG
HIGHLIGHT COMMUNICATIONS AG JUNGFRAUBAHN HOLDING AG
HORNBACH BAUMARKT AG MOBILEZONE HOLDING AG
HORNBACH HOLDING AG & CO. KGAA OREL FUESSLI HOLDING AG
INTERTAINMENT AG TAMEDIA AG
KLASSIK RADIO AG TITL BN BERG AG
LOTTO24 AG VALORA AG
LUDWIG BECK AG VILLARS HOLDING SA
M4E AG ZUR ROSE GROUP AG
METRO AG
MYBET HOLDING SE
PANTALEON ENTERTAIN. AG
PRAKTIKER AG
PROSIEBENSAT.1 MEDIA SE
SCOUT24 AG
SENDR SE
73
Note: Sorted by DACH (No Austrian company represented in the Consumer Service sector).

Appendix
Historical development of trading multiples since 2012

0.0x
0.5x
1.0x
1.5x
2.0x
2.5x
3.0x
EV/Revenue DACH
LTM arithmetic mean LTM median 1yf arithmetic mean 1yf median
Trading MultiplesDACH (1/2) – Revenue- and EBIT-MultiplesLTM and 1yf since 2012
75
2.4x
1.5x1.7x
2.4x
25.0x
20.7x19.0x
21.4x
0.0x
5.0x
10.0x
15.0x
20.0x
25.0x
30.0x
EV/EBIT DACH
LTM arithmetic mean LTM median 1yf arithmetic mean 1yf median

Trading MultiplesDACH (2/2) – P/E- and EqV/BV-MultiplesLTM and 1yf since 2012
76
24.4x
21.0x21.7x24.3x
2.9x
2.1x
0.0x
0.4x
0.8x
1.2x
1.6x
2.0x
2.4x
2.8x
3.2x
EqV/BV DACH
Arithmetic mean Median
0.0x
5.0x
10.0x
15.0x
20.0x
25.0x
30.0x
P/E DACH
LTM arithmetic mean LTM median 1yf arithmetic mean 1yf median

0.0x
0.4x
0.8x
1.2x
1.6x
2.0x
EqV/BV FIRE
Arithmetic mean Median
0.0x
5.0x
10.0x
15.0x
20.0x
25.0x
P/E FIRE
LTM arithmetic mean LTM median 1yf arithmetic mean 1yf median
Trading MultiplesFIRE (1/1) – P/E- and EqV/BV-MultiplesLTM and 1yf since 2012
77
18.4x
14.7x
17.3x
20.9x
1.8x
1.3x

0.0x
5.0x
10.0x
15.0x
20.0x
25.0x
30.0x
EV/EBIT Basic Materials
LTM arithmetic mean LTM median 1yf arithmetic mean 1yf median
0.0x
0.5x
1.0x
1.5x
2.0x
2.5x
3.0x
EV/Revenue Basic Materials
LTM arithmetic mean LTM median 1yf arithmetic mean 1yf median
Trading MultiplesBasic Materials (1/2) – Revenue- and EBIT-MultiplesLTM and 1yf since 2012
78
1.9x
1.4x
1.8x
2.3x
21.3x18.6x
16.3x18.1x

0.0x
0.4x
0.8x
1.2x
1.6x
2.0x
2.4x
2.8x
EqV/BV Basic Materials
Arithmetic mean Median
0.0x
5.0x
10.0x
15.0x
20.0x
25.0x
30.0x
P/E Basic Materials
LTM arithmetic mean LTM median 1yf arithmetic mean 1yf median
Trading MultiplesBasic Materials (2/2) – P/E-Multiples and EqV/BV-MultiplesLTM and 1yf since 2012
79
23.7x
18.3x18.3x
21.0x
2.5x
2.0x

0.0x
5.0x
10.0x
15.0x
20.0x
25.0x
EV/EBIT Consumer Goods
LTM arithmetic mean LTM median 1yf arithmetic mean 1yf median
0.0x0.2x0.4x0.6x0.8x1.0x1.2x1.4x1.6x1.8x
EV/Revenue Consumer Goods
LTM arithmetic mean LTM median 1yf arithmetic mean 1yf median
Trading MultiplesConsumer Goods (1/2) – Revenue- and EBIT-MultiplesLTM and 1yf since 2012
80
1.5x
1.2x1.2x
1.4x
22.6x
18.3x
16.0x
17.4x

0.0x
5.0x
10.0x
15.0x
20.0x
25.0x
30.0x
P/E Consumer Goods
LTM arithmetic mean LTM median 1yf arithmetic mean 1yf median
0.0x
0.4x
0.8x
1.2x
1.6x
2.0x
2.4x
EqV/BV Consumer Goods
Arithmetic mean Median
Trading MultiplesConsumer Goods (2/2) – P/E- and EqV/BV-MultiplesLTM and 1yf since 2012
81
21.4x
18.5x19.8x
22.0x
2.2x
1.8x

0.0x
5.0x
10.0x
15.0x
20.0x
25.0x
30.0x
EV/EBIT Telecommunication
LTM arithmetic mean LTM median 1yf arithmetic mean 1yf median
0.0x
0.5x
1.0x
1.5x
2.0x
2.5x
3.0x
EV/Revenue Telecommunication
LTM arithmetic mean LTM median 1yf arithmetic mean 1yf median
Trading MultiplesTelecommunication (1/2) – Revenue- and EBIT-MultiplesLTM and 1yf since 2012
82
1.8x1.8x2.0x
2.6x
25.9x
22.0x
17.8x
20.9x

0.0x
0.4x
0.8x
1.2x
1.6x
2.0x
2.4x
2.8x
3.2x
EqV/BV Telecommunication
Arithmetic mean Median
0.0x
5.0x
10.0x
15.0x
20.0x
25.0x
30.0x
35.0x
40.0x
P/E Telecommunication
LTM arithmetic mean LTM median 1yf arithmetic mean 1yf median
Trading MultiplesTelecommunication (2/2) – P/E- and EqV/BV-MultiplesLTM and 1yf since 2012
83
23.5x
14.1x17.3x19.3x
2.5x
1.9x

0.0x
5.0x
10.0x
15.0x
20.0x
25.0x
30.0x
EV/EBIT Industrials
LTM arithmetic mean LTM median 1yf arithmetic mean 1yf median
0.0x
0.5x
1.0x
1.5x
2.0x
2.5x
EV/Revenue Industrials
LTM arithmetic mean LTM median 1yf arithmetic mean 1yf median
Trading MultiplesIndustrials (1/2) – Revenue- and EBIT-MultiplesLTM and 1yf since 2012
84
2.1x
1.4x
1.6x
2.1x
24.1x
20.6x18.9x
20.9x

0.0x
5.0x
10.0x
15.0x
20.0x
25.0x
30.0x
P/E Industrials
LTM arithmetic mean LTM median 1yf arithmetic mean 1yf median
0.0x0.4x0.8x1.2x1.6x2.0x2.4x2.8x3.2x3.6x
EqV/BV Industrials
Arithmetic mean Median
Trading MultiplesIndustrials (2/2) – P/E- and EqV/BV-MultiplesLTM and 1yf since 2012
85
28.4x
24.1x
21.8x
24.1x
3.2x
2.4x

0.0x
5.0x
10.0x
15.0x
20.0x
25.0x
30.0x
EV/EBIT Consumer Service
LTM arithmetic mean LTM median 1yf arithmetic mean 1yf median
0.0x
0.5x
1.0x
1.5x
2.0x
2.5x
3.0x
3.5x
EV/Revenue Consumer Service
LTM arithmetic mean LTM median 1yf arithmetic mean 1yf median
Trading MultiplesConsumer Service (1/2) – Revenue- and EBIT-MultiplesLTM and 1yf since 2012
86
2.4x
1.3x
1.9x
3.1x
26.7x
20.1x20.5x21.9x

0.0x
5.0x
10.0x
15.0x
20.0x
25.0x
30.0x
P/E Consumer Service
LTM arithmetic mean LTM median 1yf arithmetic mean 1yf median
0.0x0.4x0.8x1.2x1.6x2.0x2.4x2.8x3.2x3.6x4.0x
EqV/BV Consumer Service
Arithmetic mean Median
Trading MultiplesConsumer Service (2/2) – P/E- and EqV/BV-MultiplesLTM and 1yf since 2012
87
21.3x19.4x
24.9x25.7x
3.8x
2.4x

0.0x
1.0x
2.0x
3.0x
4.0x
5.0x
6.0x
EV/Revenue Pharma & Healthcare
LTM arithmetic mean LTM median 1yf arithmetic mean 1yf median
0.0x
5.0x
10.0x
15.0x
20.0x
25.0x
30.0x
35.0x
EV/EBIT Pharma & Healthcare
LTM arithmetic mean LTM median 1yf arithmetic mean 1yf median
Trading MultiplesPharma & Healthcare (1/2) – Revenue- and EBIT-MultiplesLTM and 1yf since 2012
88
3.8x
3.1x3.7x
3.9x
29.0x27.0x
24.1x26.1x
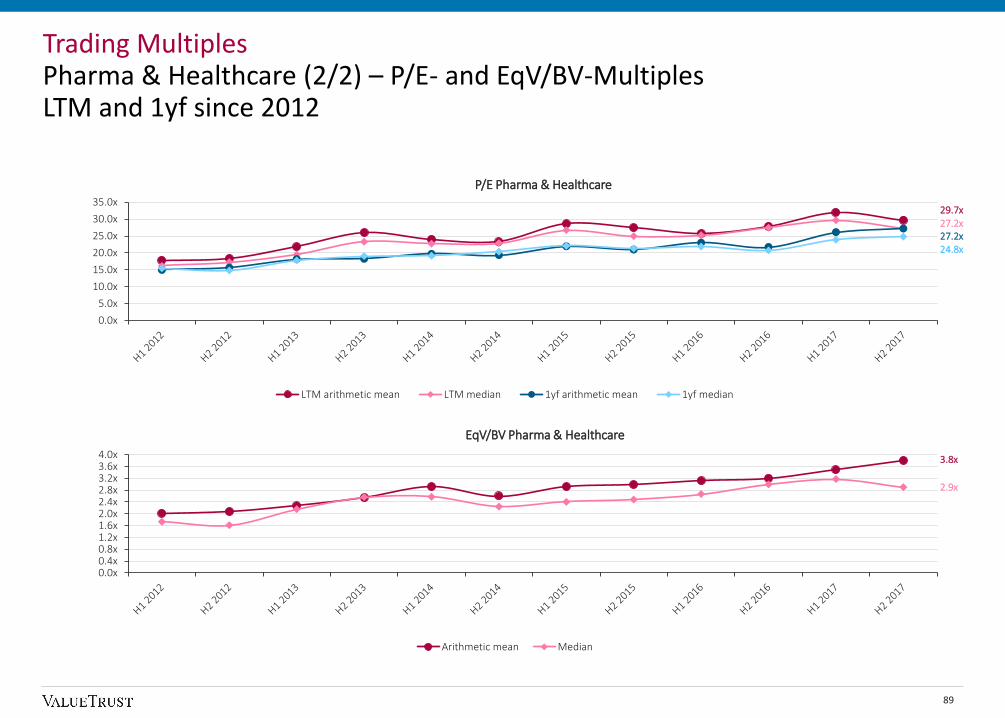
0.0x
5.0x
10.0x
15.0x
20.0x
25.0x
30.0x
35.0x
P/E Pharma & Healthcare
LTM arithmetic mean LTM median 1yf arithmetic mean 1yf median
0.0x0.4x0.8x1.2x1.6x2.0x2.4x2.8x3.2x3.6x4.0x
EqV/BV Pharma & Healthcare
Arithmetic mean Median
Trading MultiplesPharma & Healthcare (2/2) – P/E- and EqV/BV-MultiplesLTM and 1yf since 2012
89
29.7x27.2x
24.8x27.2x
3.8x
2.9x

0.0x
5.0x
10.0x
15.0x
20.0x
25.0x
30.0x
EV/EBIT Information Technology
LTM arithmetic mean LTM median 1yf arithmetic mean 1yf median
0.0x
0.5x
1.0x
1.5x
2.0x
2.5x
3.0x
3.5x
EV/Revenue Information Technology
LTM arithmetic mean LTM median 1yf arithmetic mean 1yf median
Trading MultiplesInformation Technology (1/2) – Revenue- and EBIT-MultiplesLTM and 1yf since 2012
90
3.0x
2.1x2.3x
3.1x
27.7x
23.5x23.2x
25.8x
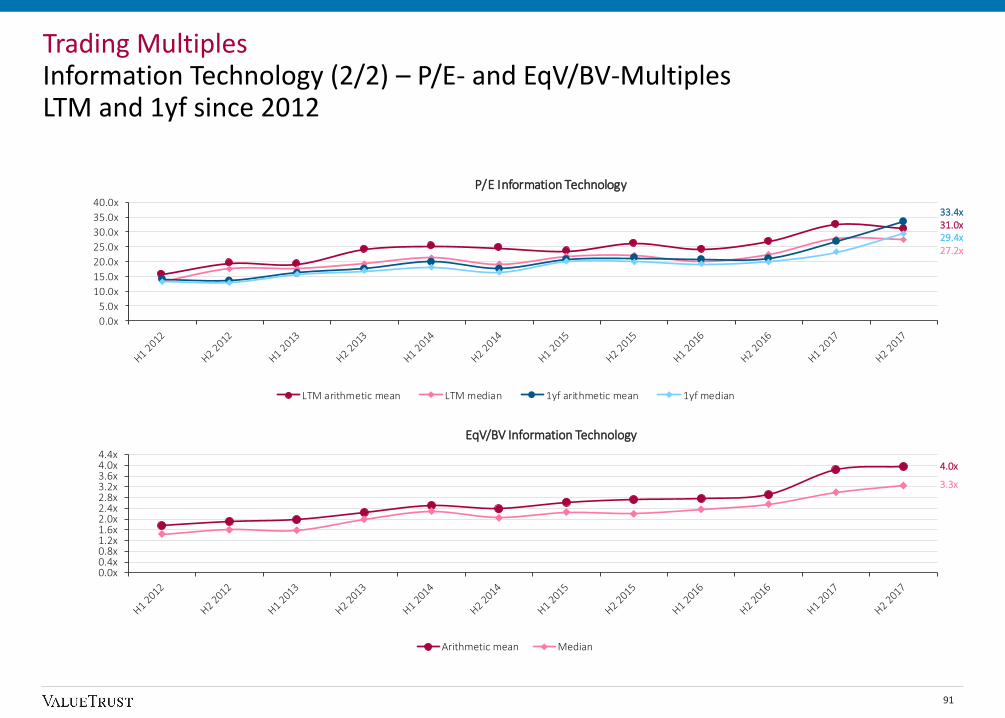
0.0x
5.0x
10.0x
15.0x
20.0x
25.0x
30.0x
35.0x
40.0x
P/E Information Technology
LTM arithmetic mean LTM median 1yf arithmetic mean 1yf median
0.0x0.4x0.8x1.2x1.6x2.0x2.4x2.8x3.2x3.6x4.0x4.4x
EqV/BV Information Technology
Arithmetic mean Median
Trading MultiplesInformation Technology (2/2) – P/E- and EqV/BV-MultiplesLTM and 1yf since 2012
91
31.0x
27.2x29.4x
33.4x
4.0x
3.3x

0.0x
5.0x
10.0x
15.0x
20.0x
25.0x
30.0x
35.0x
EV/EBIT Utilities
LTM arithmetic mean LTM median 1yf arithmetic mean 1yf median
0.0x0.5x1.0x1.5x2.0x2.5x3.0x3.5x4.0x4.5x
EV/Revenue Utilities
LTM arithmetic mean LTM median 1yf arithmetic mean 1yf median
Trading MultiplesUtilities (1/2) – Revenue- and EBIT-MultiplesLTM and 1yf since 2012
92
3.1x
1.9x
1.9x1.9x
27.4x
21.3.x
14.5x16.0x
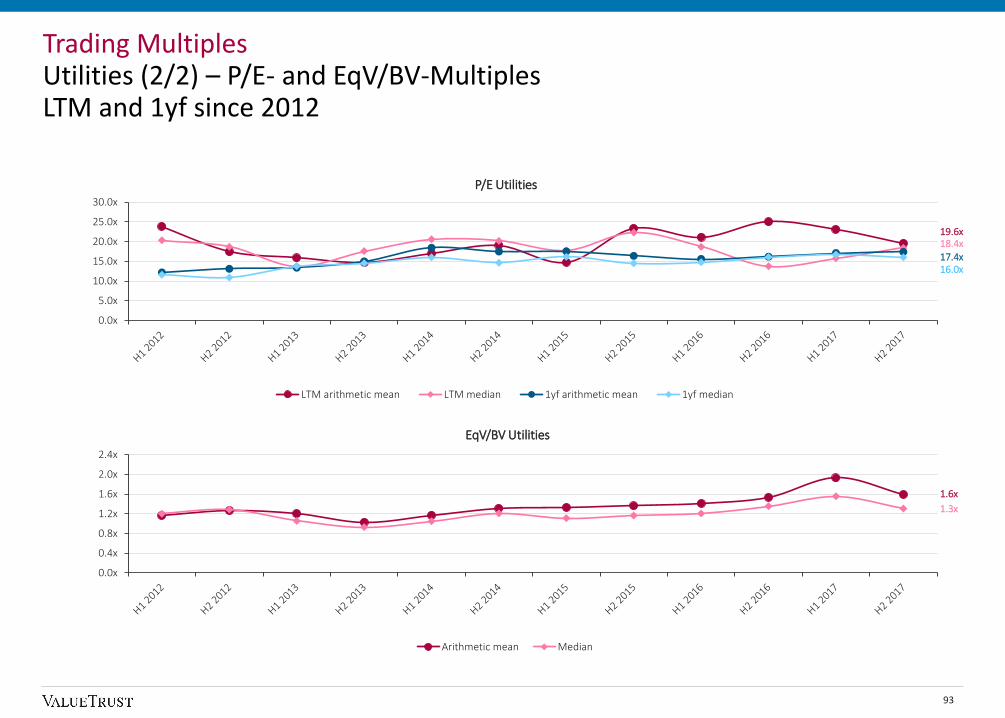
0.0x
5.0x
10.0x
15.0x
20.0x
25.0x
30.0x
P/E Utilities
LTM arithmetic mean LTM median 1yf arithmetic mean 1yf median
0.0x
0.4x
0.8x
1.2x
1.6x
2.0x
2.4x
EqV/BV Utilities
Arithmetic mean Median
Trading MultiplesUtilities (2/2) – P/E- and EqV/BV-MultiplesLTM and 1yf since 2012
93
19.6x18.4x
16.0x17.4x
1.6x
1.3x

ValueTrust Financial Advisors SETheresienstrasse 180333 MunichGermany
www.valuetrust.com
Prof. Dr. Christian AdersChairman of the Executive Board
+49 89 388 790 100+49 172 850 4839christian.aders@valuetrust.com
Florian StarckSteuerberaterMember of the Executive Board+49 89 388 790 200+49 172 896 8989florian.starck@valuetrust.com
ValueTrust is the sole financial advisory firm in the Germanspeaking countries that focuses on the core competencies ofbusiness valuation and corporate finance advisory. ValueTrust advises management, boards and investors in acquisitions,mergers, restructurings, disputes and litigations as well as value management.
ValueTrust offers its clients solutionoriented financial advisory services combining both client focus and independencewith highest standards of quality. ValueTrust’s advisory approach is based on years of project experience, the skills of itsprofessionals, a trustful cooperation with its clients and the support of industry experienced senior advisors.
Corporate Transactions
Buyside advisory and carveout servicesFairness opinionsTakeover and delisting advisoryPurchase price allocation and impairment testsValuation opinions regarding the determination of fair market values for legal valuation purposes
Dispute and Litigation
Damage analysisPartyrelated valuation opinionsFinancial and economic advice in proceedingsExpert determination (as arbitrators) and mediation consultingValuations as court appointed expert
Restructuring
Valuation reports for reorganizations and tax purposesValuation opinions for financial restructuringsValuation of debt and mezzanine capitalCapital structure analysis and optimization
Value Management
Portfolio and value analysisBusiness planning and evaluation of corporate strategiesValuebased controlling systemsCost of capital optimizationCFO and financial expert advice