
D8.2 Final report on evaluation methodology...
26
J130154S Page 1 of 26 2014‐08‐26 Grant agreement no: 608571 Project acronym: SUCCESS Project full title: Industrial steam generation with 100% carbon capture and insignificant efficiency penalty ‐ scale‐up of oxygen carrier for chemical‐looping combustion using environmentally sustainable materials Collaborative project Theme: FP7 – ENERGY.2013.5.1.1 Deliverable 8.2 Final report of assessment methodology Due delivery date: 2014‐08‐31 Actual delivery date: 2014‐08‐26 Lead beneficiary of WP8.1: Partner no. 12 Bertsch Dissemination level: public
Transcript of D8.2 Final report on evaluation methodology...
J130154S Page 1 of 26 2014‐08‐26
Grant agreement no:
608571
Project acronym:
SUCCESS
Project full title:
Industrial steam generation with 100% carbon capture and insignificant efficiency penalty ‐ scale‐up
of oxygen carrier for chemical‐looping combustion using environmentally sustainable materials
Collaborative project
Theme:
FP7 – ENERGY.2013.5.1.1
Deliverable 8.2
Final report of assessment
methodology
Due delivery date: 2014‐08‐31
Actual delivery date: 2014‐08‐26
Lead beneficiary of WP8.1:
Partner no. 12 Bertsch
Dissemination level:
public

J130154S Page 2 of 26 2014‐08‐26
DELIVERABLE 8.2
Final report of assessment methodology
SUCCESS ‐ Industrial steam generation with
100% carbon capture and insignificant efficiency
penalty ‐ scale‐up of oxygen carrier for chemi‐
cal‐looping combustion using Environmentally
sustainable materials
Keywords:
‐ chemical looping
‐ oxygen carrier
‐ environmentally sustainable materials
‐ assessment technology
Work package: 8
Involved partners: IFPEN, Bertsch, EDF, Shell,
TOTAL; BOKU
Dissemination level: PU
Objective
‐ Establish the assessment technology and the reference natural gas steam‐generation units
for benchmarking, also based on existing published work by the EBTF (European Bench‐
marking Task Force).
J130154S Page 3 of 26 2014‐08‐26
TableofContents
1 Introduction ...................................................................................................................................... 5
2 System boundary ‐ Calculation of efficiency ..................................................................................... 5
3 Benchmarking cases for gas‐fired CLC power production ................................................................. 9
4 Assessment of CO2 capture performance .......................................................................................10
5 Parameters .....................................................................................................................................11
3.1 General definitions and conditions ........................................................................................11
3.2 Fuel .........................................................................................................................................12
3.3 Oxygen carrier ........................................................................................................................12
3.4 Flue gases ...............................................................................................................................13
6 Parameters for Gas Turbines ..........................................................................................................13
7 Steam Cycle ....................................................................................................................................14
5.1 Boiler parameters ...................................................................................................................14
5.1.1 Basic steam parameters .................................................................................................14
5.1.2 Temperature loss live steam ..........................................................................................15
5.1.3 Type of circulation ..........................................................................................................15
5.1.4 Pressure losses for direct fired boiler .............................................................................15
5.1.5 Pressure losses for HRSG ................................................................................................15
5.1.6 Temperatur differences for HRSG .................................................................................15
5.1.7 Efficiency direct fired boilers (gas) .................................................................................16
5.1.8 Pressure levels ................................................................................................................16
5.2 Condenser ..............................................................................................................................16
5.3 Steam Turbines .......................................................................................................................16
5.3.1 Isentropic efficiencies .....................................................................................................16
5.3.2 Pressure loss for steam extraction .................................................................................16
5.4 Pumps .....................................................................................................................................17
5.5 Fans ........................................................................................................................................17
J130154S Page 4 of 26 2014‐08‐26
5.6 Compressors ...........................................................................................................................17
5.7 Heat exchangers .....................................................................................................................17
5.7.1 Pinch points ....................................................................................................................17
5.7.2 Pressure drops ................................................................................................................17
5.7.3 Bed material cooler ........................................................................................................18
5.8 Figures for further efficiency calculations .............................................................................18
5.8.1 Mechanical efficiency gear .............................................................................................18
5.8.2 Generator efficiency .......................................................................................................18
5.8.3 Auxiliary power ...............................................................................................................18
5.9 CO2 stream .............................................................................................................................19
6 Economic assessment criteria .........................................................................................................21
6.1 Reference year .......................................................................................................................21
6.2 Cost Indes ...............................................................................................................................22
6.3 Annual allocation of finances .................................................................................................23
6.4 Financial parameters ..............................................................................................................23
6.5 Capital investment ..................................................................................................................23
6.6 Main operational parameters ................................................................................................24
6.7 Main economic performance characteristics .........................................................................24
6.8 Man power .............................................................................................................................24
6.9 Calculation of CO2 price .........................................................................................................24
7 Thermodynamic properties ............................................................................................................25
7.1 Air ...........................................................................................................................................25
7.2 Flue gas ...................................................................................................................................25
7.3 Water/Steam ..........................................................................................................................25
8 Abbreviations ..................................................................................................................................25
9 List of symbols ................................................................................................................................26
J130154S Page 5 of 26 2014‐08‐26
1 Introduction
This document presents a collection of parameters that should serve as basic parameters for
comparison of CLC fired boilers to common fired boilers. Calculations within the SUCCESS pro‐
ject for comparison of efficiency and economy should be based on the parameters of the pa‐
per.
For the assessment of efficiency we propose a calculation according to
EN 12952 – part 15 (water tube boilers and auxiliary installations – acceptance tests) with
adaptions suitable for SUCCESS.
In a first step the collection of parameters from EBTF – especially from deliverable D4.9 Euro‐
pean best practice guidelines for assessment of CO2 capture technologies – CAESAR ‐ FP7 pro‐
ject Nr. 213206 was done.
The second step was the expanding and adjustment of parameters for using in project
SUCCESS
2 System boundary ‐ Calculation of efficiency
The EN 12952 is a standard for water tube boilers.
In part 15 of this standard the calculation formulas for efficiency
are explained.
For the calculation of efficiency the basic boundaries of a system have
to be fixed.
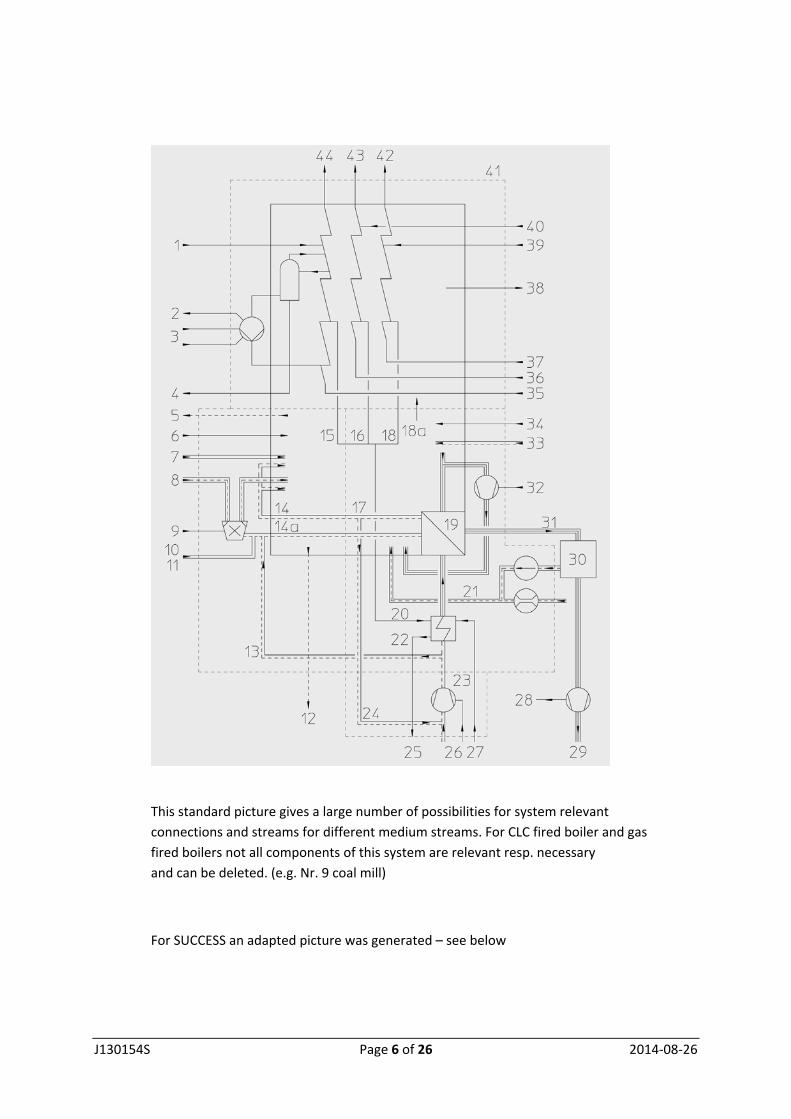
Picture of the system boundaries from EN12952‐15 is presented below.
J130154S Page 6 of 26 2014‐08‐26
This standard picture gives a large number of possibilities for system relevant
connections and streams for different medium streams. For CLC fired boiler and gas
fired boilers not all components of this system are relevant resp. necessary
and can be deleted. (e.g. Nr. 9 coal mill)
For SUCCESS an adapted picture was generated – see below

J130154S Page 7 of 26 2014‐08‐26
In according to EN12952 the numbers in this picture have following meanings resp.
applications. Unspecified numbers are caused to deleted components.

J130154S Page 8 of 26 2014‐08‐26
1 water for temperature control (not relevant – because this
water quantity is taken from 35 (feed water))
4 desalting
6 steam for atomizing – used as steam for loop seals
7 natural gas (for normal operation and start up)
12 ash loss ‐ used for oxygen carrier flow
19 air preheater (flue gas heated)
26 fresh air ‐ power for fan
28 ID fan – used for both fans ‐ CLC has two flue gas streams
29 dust loss – used for loss of unburned
30 dedusting device if necessary
31 loss for CO content and other unburned media
34 other electric consumers
35 feed water
36 intermediate steam entrance
38 radiation loss
40 water for temperature control of intermediate steam
41 system boundary
43 intermediate steam outlet
44 high pressure steam outlet
With this adapted picture it is able to compare not only efficiency, but also other important
streams of the plant.

J130154S Page 9 of 26 2014‐08‐26
Beside the calculation of the thermal efficiency of the boiler (resp. plant) following other effi‐
ciencies could be established.
‐ methane (gas) converson
‐ achievement of CO2 yield
‐ recycling possibilities of oxygen carrier losses (fines; dust)
‐ combustion efficiency based on lower heating value
3 Benchmarking cases for gas‐fired CLC power production
CLC has been discussed mainly to reduce the energy penalty for carbon capture from fossil
fuel power plants. For power production from natural gas, the state of the art technology is
the gas turbine combined cycle (GT‐CC) reaching net electric efficiencies of up to 60 % without
CO2 capture. In GT‐CC concepts, CLC would need to be operated at increased pressure up to
20 bar. This certainly means a critical challenge since the reaction intensity on the solid oxy‐
gen carrier surface increases proportional to pressure. Dual fluidized bed systems have only
been operated at atmospheric pressure so far. Therefore, alternating fixed bed vessel systems
have been proposed for pressurized CLC operation in combination with gas turbines. Howev‐
er, these systems suffer from heat transfer issues as a result of the poor heat transfer perfor‐
mance of fixed beds. Additionally, the common inlet specifications of large scale gas turbines
cannot be met with CLC AR off gas and the relative pressure drop exposed by a CLC AR route is
considerably larger than the pressure drop of current gas turbine combustion chambers. This
will result in an expectable efficiency drop of the GT‐CC arrangement in case that CLC is used.
Therefore, in the comparison performed within the SUCCESS project, the CLC unit operates at
atmospheric pressure and a state of the art steam cycle is used for power generation, the net
electric efficiencies can be expected to reach 46 % without compression and purification of
the CO2. Such a process needs to compete to a GT‐CC in combination with state‐of‐the‐art CO2
capture technologies based on gas separation.
Given the limitation of the SUCCESS project focus on natural gas as fuel, the following bench‐
mark cases will be described and considered in the project:
1. Gas turbine combined cycle power plant with post combustion CO2 capture
2. Atmospheric pressure gas fired steam cycle power plant with post combustion CO2 capture
3. Atmospheric pressure CLC of natural gas with steam cycle power plant
4. Pressurized CLC of natural gas with gas turbine combined cycle power plant
Cases 1 and 3 are technologically most realistic scenarios and thus relevant for the bench‐
marking. Case 2 is of interest in order to distinguish effects of the technological switch and to
assess replacement of common once‐through natural gas steam boilers in use for process
steam generation in industry.

J130154S Page 10 of 26 2014‐08‐26
4 Assessment of CO2 capture performance
Capturing CO2 during or downstream of thermal power plants requires additional energy (ei‐
ther heat, electricity or both) and, thus, inevitably leads to net efficiency penalties for the
power plant. The following terms are used in connection to the phenomena related to CO2 cap‐
ture from power plants:
1. Efficiency penalty [‐]: CC base
expresses the drop of net electric efficiency of the power plant based on fuel power input (lower heating value) due to CO2 capture. Since the efficiency penalty is expressed in percent‐
age points, it needs to be reviewed together with the base plant efficiency (without CO2 cap‐
ture). The same value of is more critical in case of lower base plant efficiencies. Further, it is
important to note that the efficiency penalty depends on the fraction of CO2 captured from the
exhaust gas. If more CO2 is removed the efficiency penalty will be higher.
2. Specific fuel consumption increase Pth [‐]:
baseCCbaseth
CCthth P
PP 1
,
,
Pth relates, for a given net electric output, the necessary additional fuel power to the fuel power input in the base plant without carbon capture. It directly expresses the conversion effi‐
ciency drop caused by CO2 capture and can be calculated from the efficiency penalty and the
base plant efficiency. It is as well a function of the fraction of CO2 captured.
3. CO2 capture rate [‐]: rawFGCOrawFG
cleanFGCOcleanFG
totalCO
cleanFGCO
totalCO
captCO
capt yn
yn
m
m
m
mCO
,,,
,,,
,
,,
,
,
,2
2
2
2
2
2
2 11
The CO2 capture rate relates the mass flow of captured CO2 of the plant with CO2 capture to
the total mass flow of CO2 resulting from all fuel carbon fed to the plant with CO2 capture. In
case of post combustion capture, it is equal to the separation efficiency of the CO2 separation
process and can be calculated from the molar flow rate and mole fraction of CO2 in the flue gas
before and after the separation unit.
4. CO2 avoidance rate [‐]: )1()1(11 ,2
,,
,,
,2
2
2
thcapt
basereleasedCO
CCreleasedCO
avoid PCOm
mCO
The CO2 avoidance rate is the relevant quantity to use if processes with partial CO2 capture are
benchmarked against processes with a different capture rate or without CO2 capture. It relates
the difference between the CO2 released from the CO2 capture plant and the CO2 released
from the base plant without capture to the CO2 released from the base plant. It is a direct ex‐
pression of the amount of CO2 emission avoided by carbon capture when a certain amount of
electricity is produced. During benchmarking of CCS processes, situations of equal CO2 avoid‐
ance rate should be compared.
J130154S Page 11 of 26 2014‐08‐26
5 Parameters
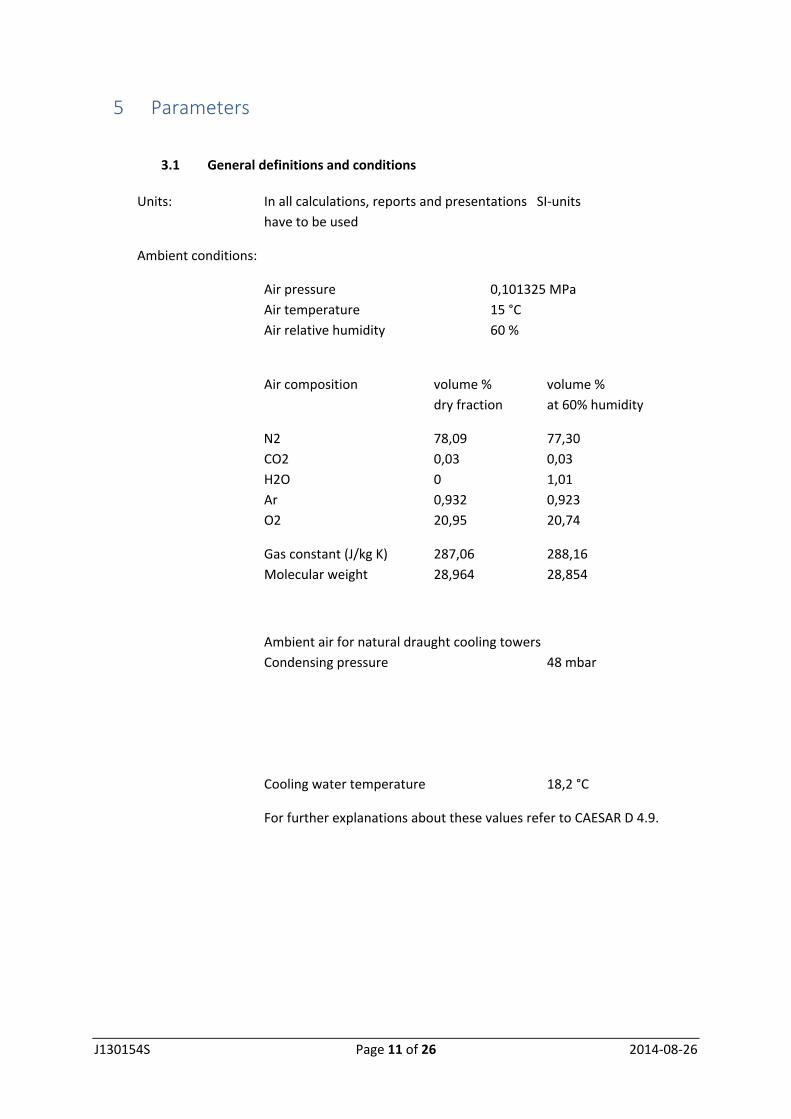
3.1 General definitions and conditions
Units: In all calculations, reports and presentations SI‐units
have to be used
Ambient conditions:
Air pressure 0,101325 MPa
Air temperature 15 °C
Air relative humidity 60 %
Air composition volume % volume %
dry fraction at 60% humidity
N2 78,09 77,30
CO2 0,03 0,03
H2O 0 1,01
Ar 0,932 0,923
O2 20,95 20,74
Gas constant (J/kg K) 287,06 288,16
Molecular weight 28,964 28,854
Ambient air for natural draught cooling towers
Condensing pressure 48 mbar
Cooling water temperature 18,2 °C
For further explanations about these values refer to CAESAR D 4.9.
J130154S Page 12 of 26 2014‐08‐26
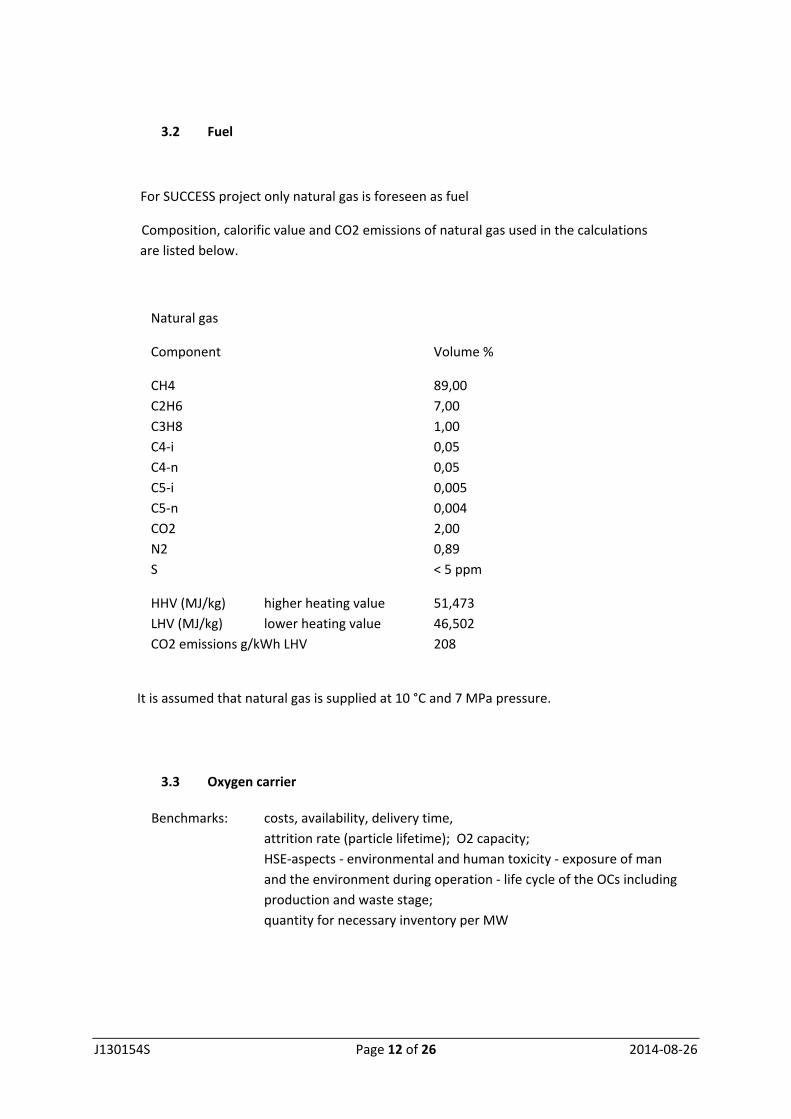
3.2 Fuel
For SUCCESS project only natural gas is foreseen as fuel
Composition, calorific value and CO2 emissions of natural gas used in the calculations
are listed below.
Natural gas
Component Volume %
CH4 89,00
C2H6 7,00
C3H8 1,00
C4‐i 0,05
C4‐n 0,05
C5‐i 0,005
C5‐n 0,004
CO2 2,00
N2 0,89
S < 5 ppm
HHV (MJ/kg) higher heating value 51,473
LHV (MJ/kg) lower heating value 46,502
CO2 emissions g/kWh LHV 208
It is assumed that natural gas is supplied at 10 °C and 7 MPa pressure.
3.3 Oxygen carrier
Benchmarks: costs, availability, delivery time,
attrition rate (particle lifetime); O2 capacity;
HSE‐aspects ‐ environmental and human toxicity ‐ exposure of man
and the environment during operation ‐ life cycle of the OCs including
production and waste stage;
quantity for necessary inventory per MW
J130154S Page 13 of 26 2014‐08‐26
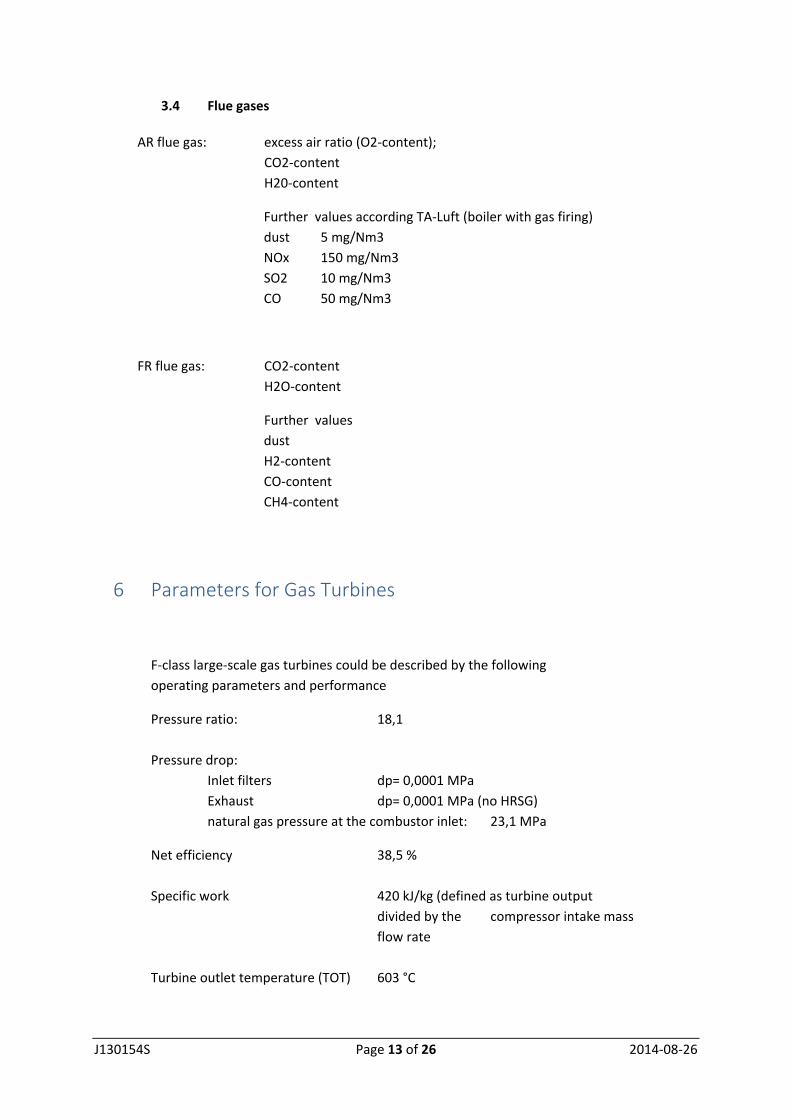
3.4 Flue gases
AR flue gas: excess air ratio (O2‐content);
CO2‐content
H20‐content
Further values according TA‐Luft (boiler with gas firing)
dust 5 mg/Nm3
NOx 150 mg/Nm3
SO2 10 mg/Nm3
CO 50 mg/Nm3
FR flue gas: CO2‐content
H2O‐content
Further values
dust
H2‐content
CO‐content
CH4‐content
6 Parameters for Gas Turbines
F‐class large‐scale gas turbines could be described by the following
operating parameters and performance
Pressure ratio: 18,1
Pressure drop:
Inlet filters dp= 0,0001 MPa
Exhaust dp= 0,0001 MPa (no HRSG)
natural gas pressure at the combustor inlet: 23,1 MPa
Net efficiency 38,5 %
Specific work 420 kJ/kg (defined as turbine output
divided by the compressor intake mass
flow rate
Turbine outlet temperature (TOT) 603 °C
J130154S Page 14 of 26 2014‐08‐26
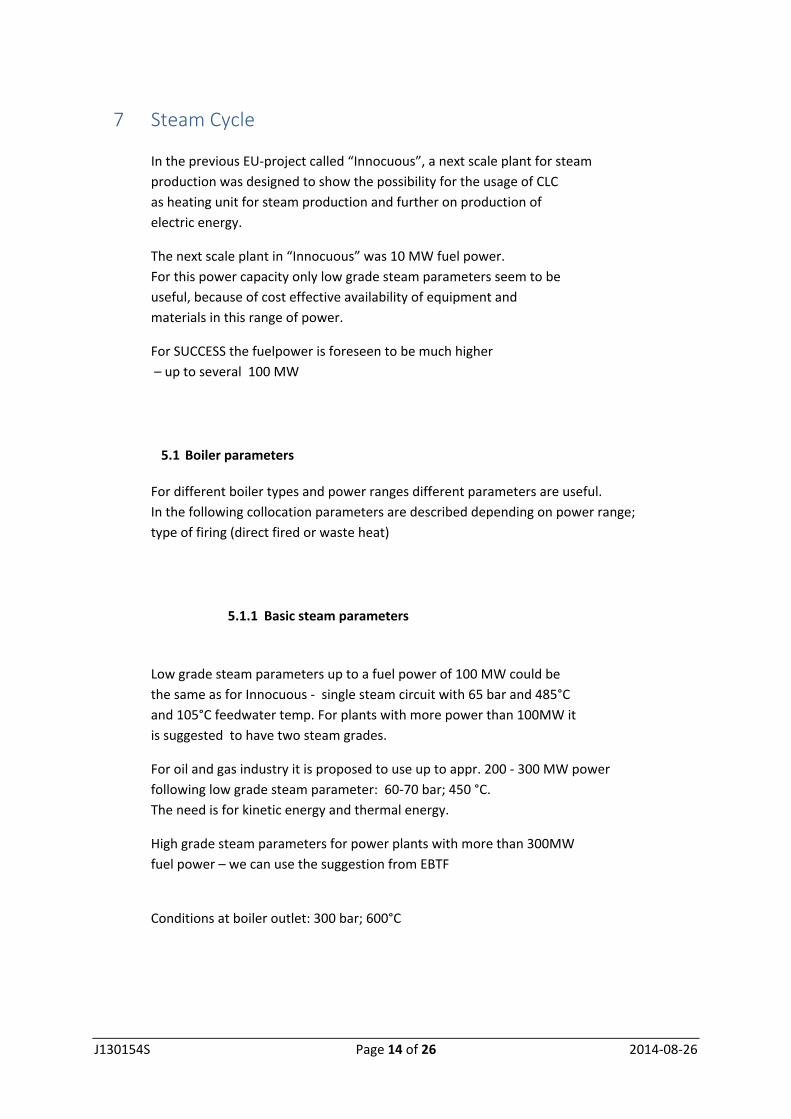
7 Steam Cycle
In the previous EU‐project called “Innocuous”, a next scale plant for steam
production was designed to show the possibility for the usage of CLC
as heating unit for steam production and further on production of
electric energy.
The next scale plant in “Innocuous” was 10 MW fuel power.
For this power capacity only low grade steam parameters seem to be
useful, because of cost effective availability of equipment and
materials in this range of power.
For SUCCESS the fuelpower is foreseen to be much higher
– up to several 100 MW
5.1 Boiler parameters
For different boiler types and power ranges different parameters are useful.
In the following collocation parameters are described depending on power range;
type of firing (direct fired or waste heat)
5.1.1 Basic steam parameters
Low grade steam parameters up to a fuel power of 100 MW could be
the same as for Innocuous ‐ single steam circuit with 65 bar and 485°C
and 105°C feedwater temp. For plants with more power than 100MW it
is suggested to have two steam grades.
For oil and gas industry it is proposed to use up to appr. 200 ‐ 300 MW power
following low grade steam parameter: 60‐70 bar; 450 °C.
The need is for kinetic energy and thermal energy.
High grade steam parameters for power plants with more than 300MW
fuel power – we can use the suggestion from EBTF
Conditions at boiler outlet: 300 bar; 600°C
J130154S Page 15 of 26 2014‐08‐26
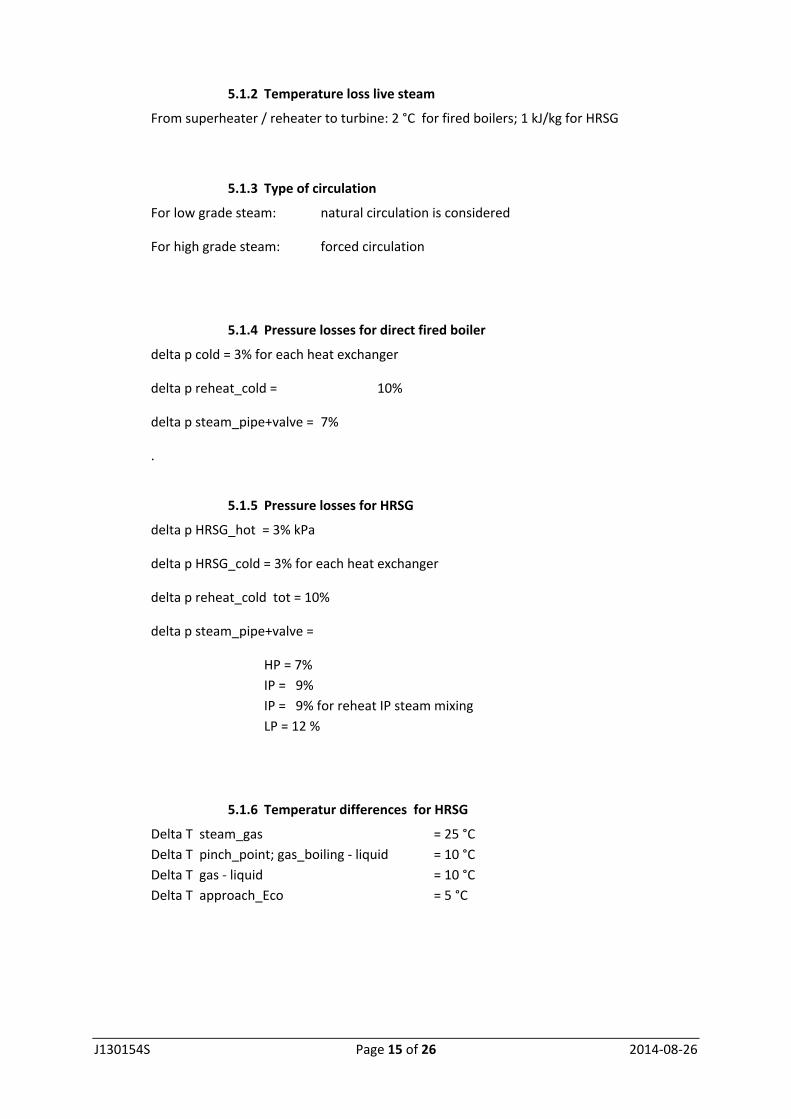
5.1.2 Temperature loss live steam
From superheater / reheater to turbine: 2 °C for fired boilers; 1 kJ/kg for HRSG
5.1.3 Type of circulation
For low grade steam: natural circulation is considered
For high grade steam: forced circulation
5.1.4 Pressure losses for direct fired boiler
delta p cold = 3% for each heat exchanger
delta p reheat_cold = 10%
delta p steam_pipe+valve = 7%
.
5.1.5 Pressure losses for HRSG
delta p HRSG_hot = 3% kPa
delta p HRSG_cold = 3% for each heat exchanger
delta p reheat_cold tot = 10%
delta p steam_pipe+valve =
HP = 7%
IP = 9%
IP = 9% for reheat IP steam mixing
LP = 12 %
5.1.6 Temperatur differences for HRSG
Delta T steam_gas = 25 °C
Delta T pinch_point; gas_boiling ‐ liquid = 10 °C
Delta T gas ‐ liquid = 10 °C
Delta T approach_Eco = 5 °C
J130154S Page 16 of 26 2014‐08‐26
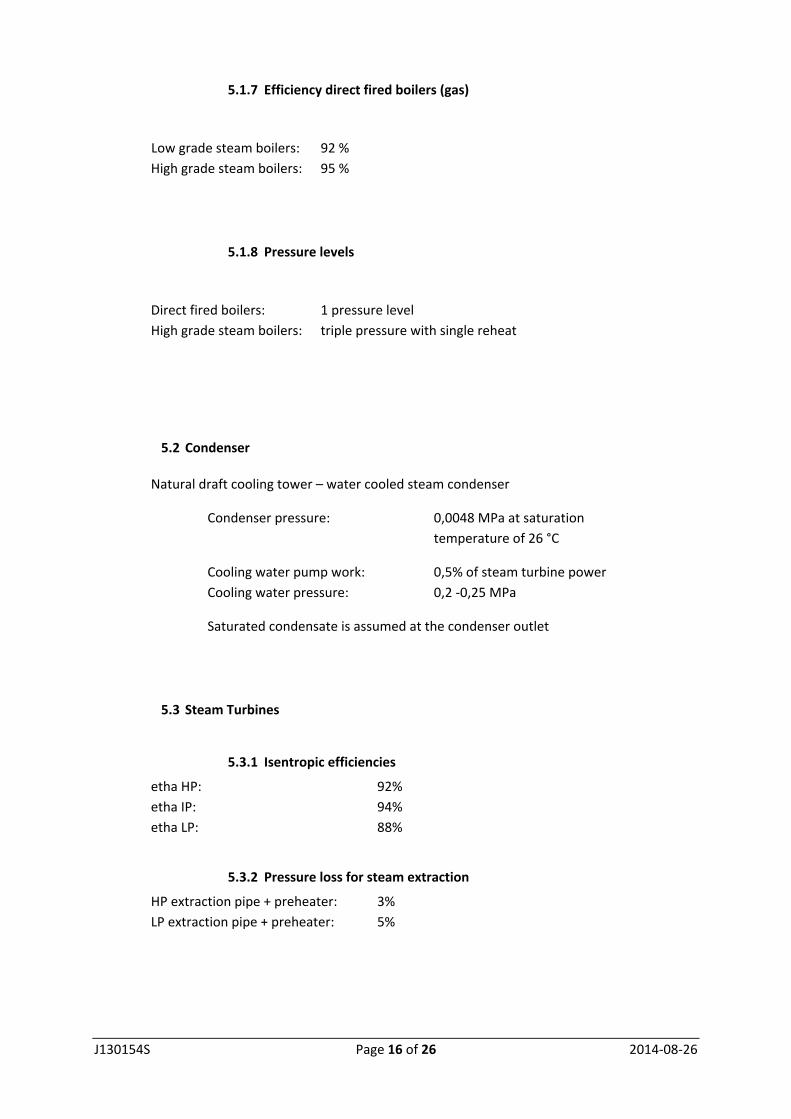
5.1.7 Efficiency direct fired boilers (gas)
Low grade steam boilers: 92 %
High grade steam boilers: 95 %
5.1.8 Pressure levels
Direct fired boilers: 1 pressure level
High grade steam boilers: triple pressure with single reheat
5.2 Condenser
Natural draft cooling tower – water cooled steam condenser
Condenser pressure: 0,0048 MPa at saturation
temperature of 26 °C
Cooling water pump work: 0,5% of steam turbine power
Cooling water pressure: 0,2 ‐0,25 MPa
Saturated condensate is assumed at the condenser outlet
5.3 Steam Turbines
5.3.1 Isentropic efficiencies
etha HP: 92%
etha IP: 94%
etha LP: 88%
5.3.2 Pressure loss for steam extraction
HP extraction pipe + preheater: 3%
LP extraction pipe + preheater: 5%
J130154S Page 17 of 26 2014‐08‐26
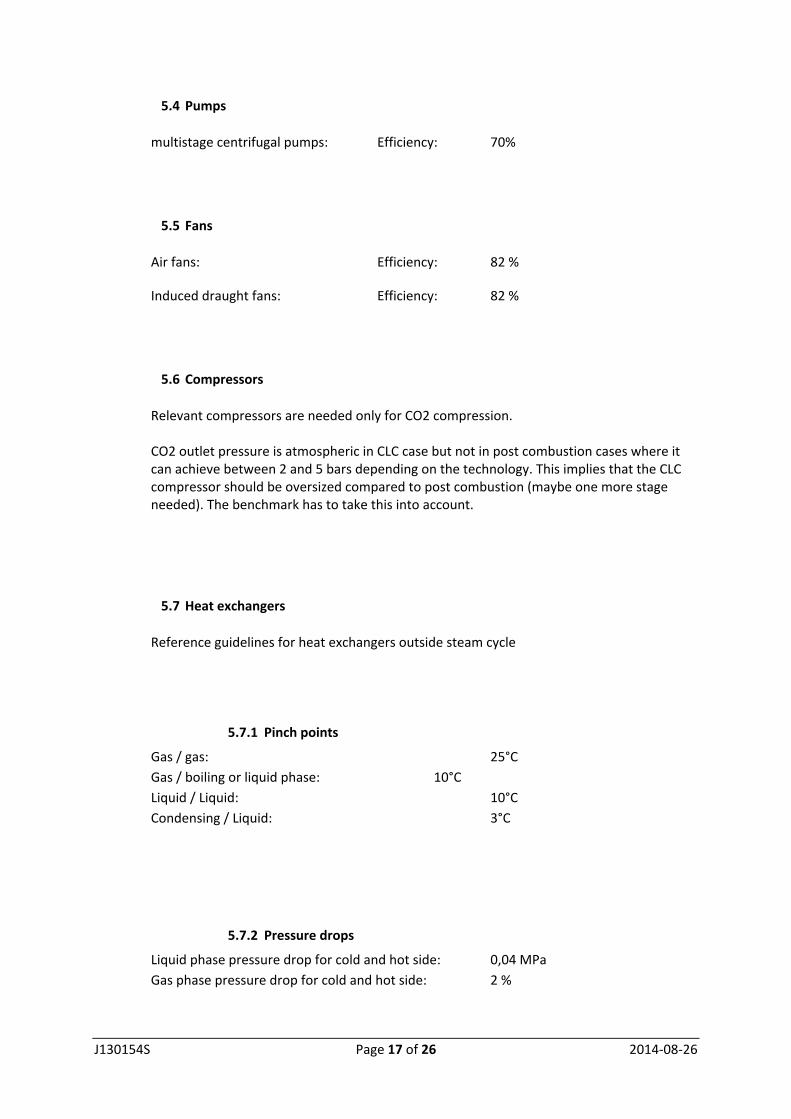
5.4 Pumps
multistage centrifugal pumps: Efficiency: 70%
5.5 Fans
Air fans: Efficiency: 82 %
Induced draught fans: Efficiency: 82 %
5.6 Compressors
Relevant compressors are needed only for CO2 compression. CO2 outlet pressure is atmospheric in CLC case but not in post combustion cases where it can achieve between 2 and 5 bars depending on the technology. This implies that the CLC compressor should be oversized compared to post combustion (maybe one more stage needed). The benchmark has to take this into account.
5.7 Heat exchangers
Reference guidelines for heat exchangers outside steam cycle
5.7.1 Pinch points
Gas / gas: 25°C
Gas / boiling or liquid phase: 10°C
Liquid / Liquid: 10°C
Condensing / Liquid: 3°C
5.7.2 Pressure drops
Liquid phase pressure drop for cold and hot side: 0,04 MPa
Gas phase pressure drop for cold and hot side: 2 %

J130154S Page 18 of 26 2014‐08‐26
5.7.3 Bed material cooler
Inside the reactors of CLC (air reactor and fuel reactor) no heat exchangers for bed cooling
are foreseen. The only cooling device at the reactors are cooled walls. The fuel reactor at
INNOCUOUS (10 MW plant) has no cooling walls. Perhaps in case of SUCCESS cooling walls
for the fuel reactor are necessary depending on different Oxygen carriers (e.g. copper com‐
plexes) .
For bed material cooling a separate heat exchanger outside the reactors is foreseen.
This heat exchanger is necessary because the cooled walls in the air reactor cannot transfer
the whole heat capacity for 100 % evaporation power. Therefore the bed material cooler is
planned as evaporator in the steam cycle. The outlet temperature of flue gas from air reactor
is controlled by the mass flow of oxygen carrier through the bed material cooler.
The design of bed material coolers for CLC operation is a very special item. For easier han‐
dling in SUCCESS It is suggested to take following parameters:
overall heat transfer coefficient: 300 ‐ 450 W/m2K and temperature difference is taken as
difference between bed material outlet temperature and boiling temperature of boiler wa‐
ter.
5.8 Figures for further efficiency calculations
5.8.1 Mechanical efficiency gear
etha m: 99,6%
5.8.2 Generator efficiency
etha G: 98,5%
5.8.3 Auxiliary power
etha Aux: estimated case by case
J130154S Page 19 of 26 2014‐08‐26
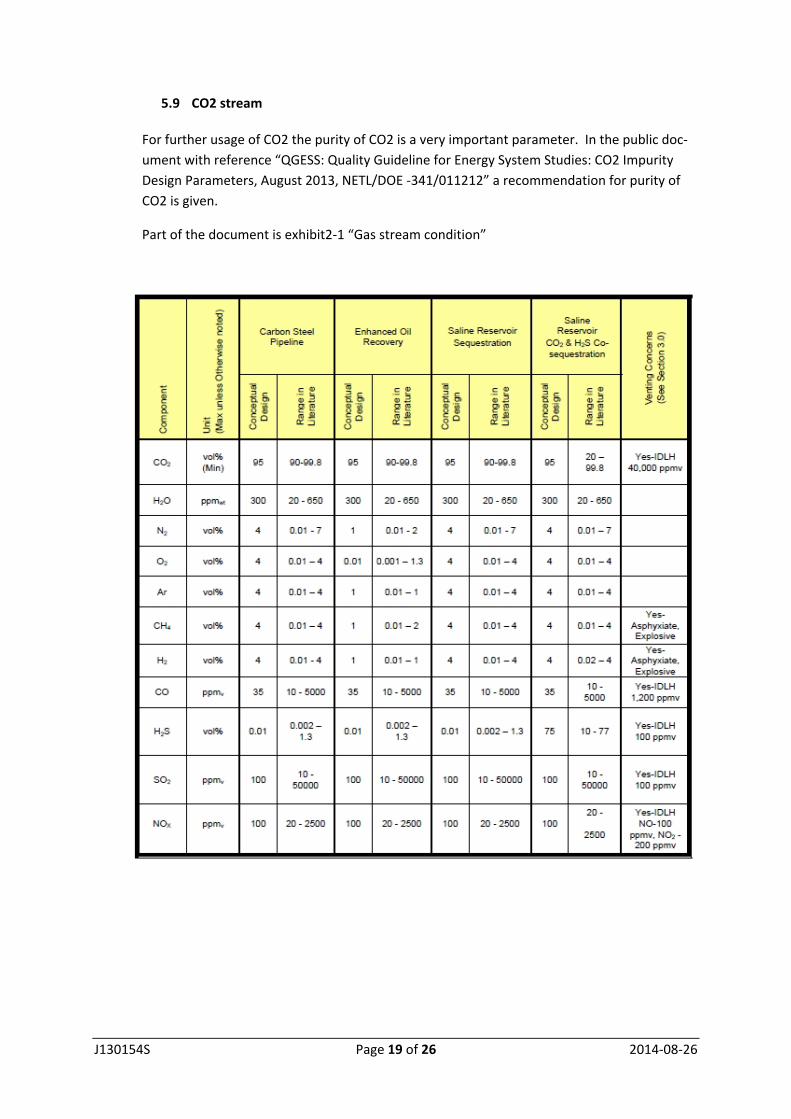
5.9 CO2 stream
For further usage of CO2 the purity of CO2 is a very important parameter. In the public doc‐
ument with reference “QGESS: Quality Guideline for Energy System Studies: CO2 Impurity
Design Parameters, August 2013, NETL/DOE ‐341/011212” a recommendation for purity of
CO2 is given.
Part of the document is exhibit2‐1 “Gas stream condition”
J130154S Page 20 of 26 2014‐08‐26
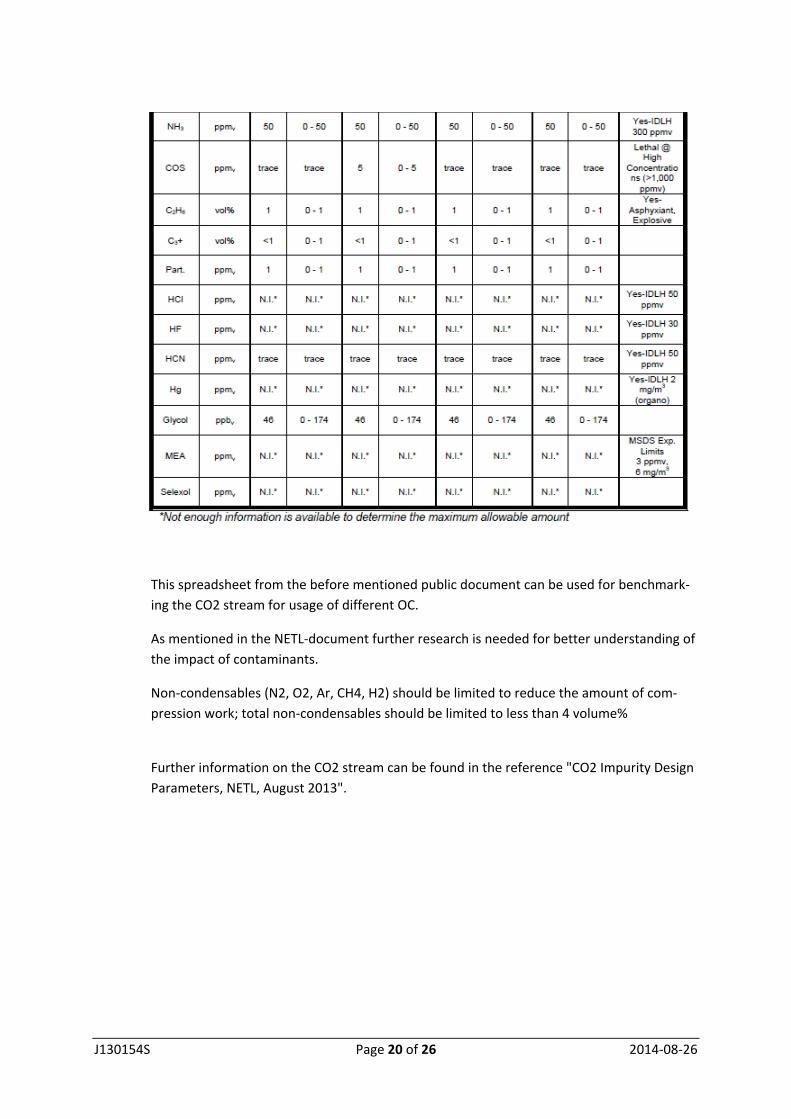
This spreadsheet from the before mentioned public document can be used for benchmark‐
ing the CO2 stream for usage of different OC.
As mentioned in the NETL‐document further research is needed for better understanding of
the impact of contaminants.
Non‐condensables (N2, O2, Ar, CH4, H2) should be limited to reduce the amount of com‐
pression work; total non‐condensables should be limited to less than 4 volume%
Further information on the CO2 stream can be found in the reference "CO2 Impurity Design
Parameters, NETL, August 2013".
J130154S Page 21 of 26 2014‐08‐26
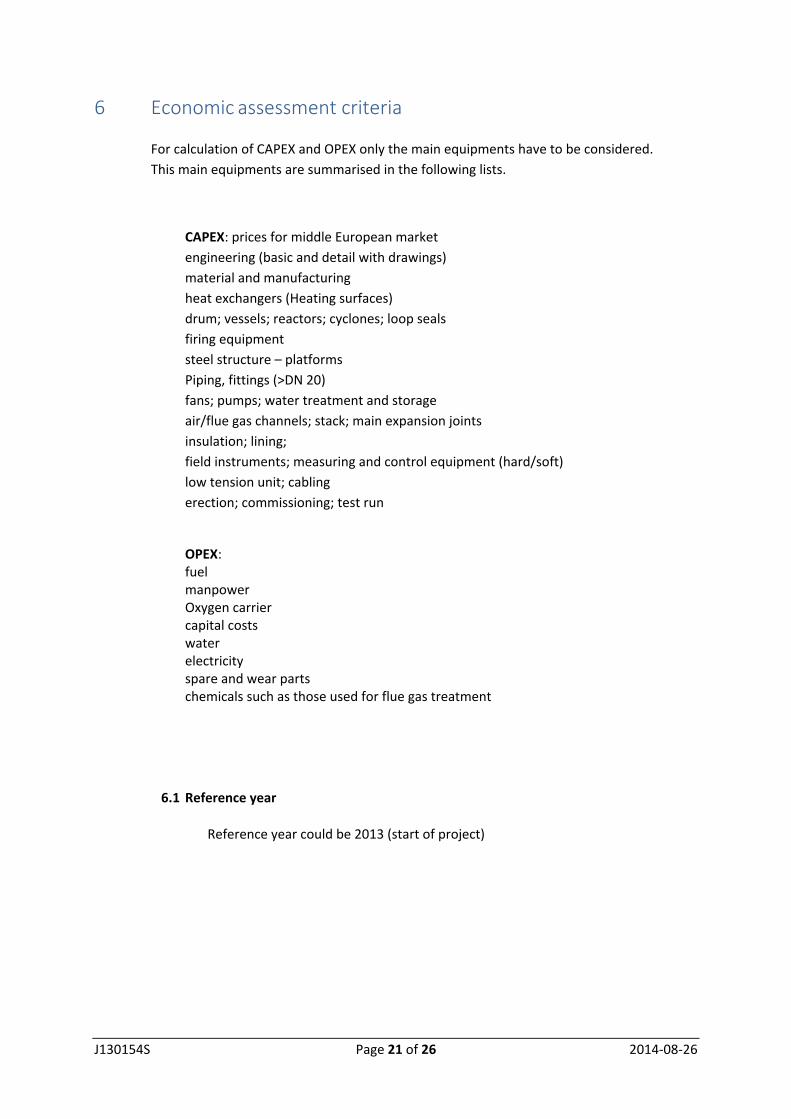
6 Economic assessment criteria
For calculation of CAPEX and OPEX only the main equipments have to be considered.
This main equipments are summarised in the following lists.
CAPEX: prices for middle European market
engineering (basic and detail with drawings)
material and manufacturing
heat exchangers (Heating surfaces)
drum; vessels; reactors; cyclones; loop seals
firing equipment
steel structure – platforms
Piping, fittings (>DN 20)
fans; pumps; water treatment and storage
air/flue gas channels; stack; main expansion joints
insulation; lining;
field instruments; measuring and control equipment (hard/soft)
low tension unit; cabling
erection; commissioning; test run
OPEX: fuel manpower Oxygen carrier capital costs water electricity spare and wear parts chemicals such as those used for flue gas treatment
6.1 Reference year
Reference year could be 2013 (start of project)

J130154S Page 22 of 26 2014‐08‐26
6.2 Cost Indes
It is proposed to use the EPCCI Index
The cost indexes are used to adjust the process plant construction costs from one period to
another. Indeed, historical data can be used in the cost‐estimating methods.
Cost in year A = Cost in year B x Cost index in year A / Cost index in year B Although the cost
indexes are defined in several ways, it consists generally of dimensionless composite indexes
updated regularly and calculated with appropriate weighting factors to get the best estimate
from several sub‐indexes based on different prices of equipments (heat exchangers, tanks,
pumps, compressors, etc.) and structures (construction, building, engineering and supervi‐
sion). They do not usually take into account regional variations and are restricted to a particu‐
lar region, generally including many of the EU countries.
The indexes available for process industries include CEPCI (Chemical Engineering Plant Cost
Index), IC (Intrantec Chemical plant construction cost index), M&S (Marshall & Swift equip‐
ment cost index) and NF (Nelson‐Ferrer refinery construction index). In the specific field of
power generation, the EPCCI (European Power Capital Costs Index) defined by HIS CERA
tracks the costs associated with the construction of a portfolio of power generation plants
(coal, gas and wind) in Europe and indexed to year 2000 (next Figure 3).
Figure 3. European Power Capital Cost Index (EPCCI) from 2000 to 2012
J130154S Page 23 of 26 2014‐08‐26
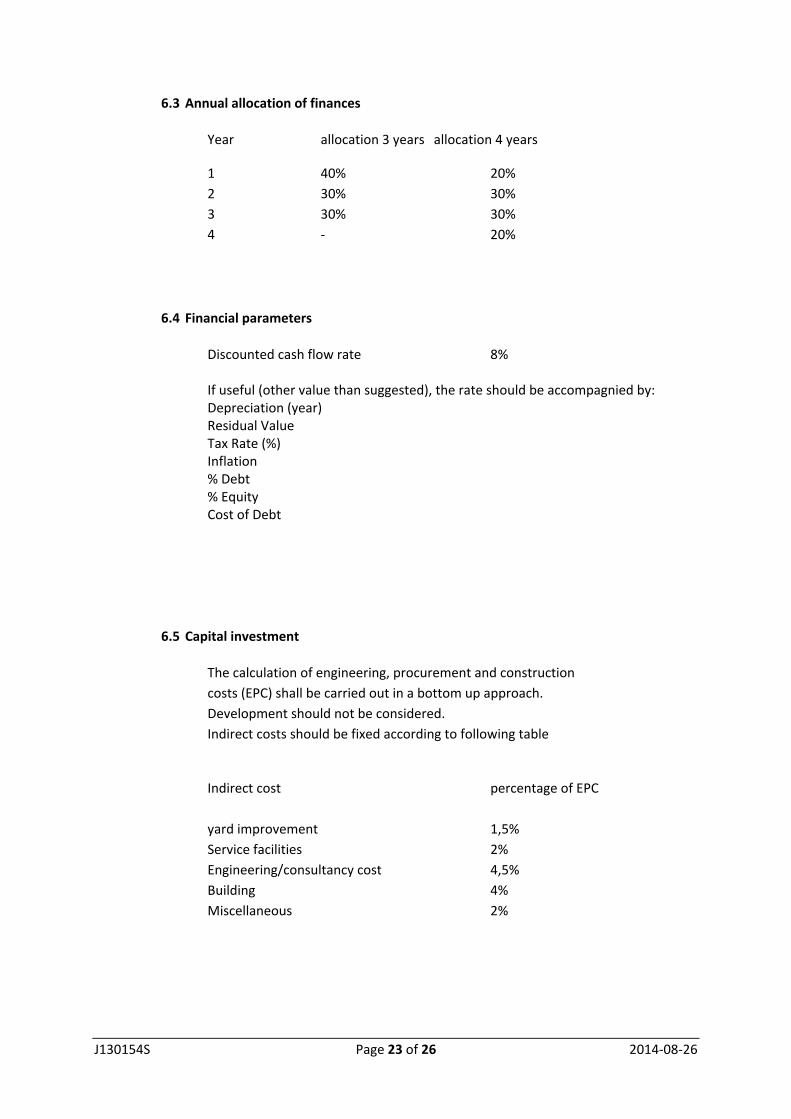
6.3 Annual allocation of finances
Year allocation 3 years allocation 4 years
1 40% 20%
2 30% 30%
3 30% 30%
4 ‐ 20%
6.4 Financial parameters
Discounted cash flow rate 8% If useful (other value than suggested), the rate should be accompagnied by: Depreciation (year) Residual Value Tax Rate (%) Inflation % Debt % Equity Cost of Debt
6.5 Capital investment
The calculation of engineering, procurement and construction
costs (EPC) shall be carried out in a bottom up approach.
Development should not be considered.
Indirect costs should be fixed according to following table
Indirect cost percentage of EPC
yard improvement 1,5%
Service facilities 2%
Engineering/consultancy cost 4,5%
Building 4%
Miscellaneous 2%
J130154S Page 24 of 26 2014‐08‐26
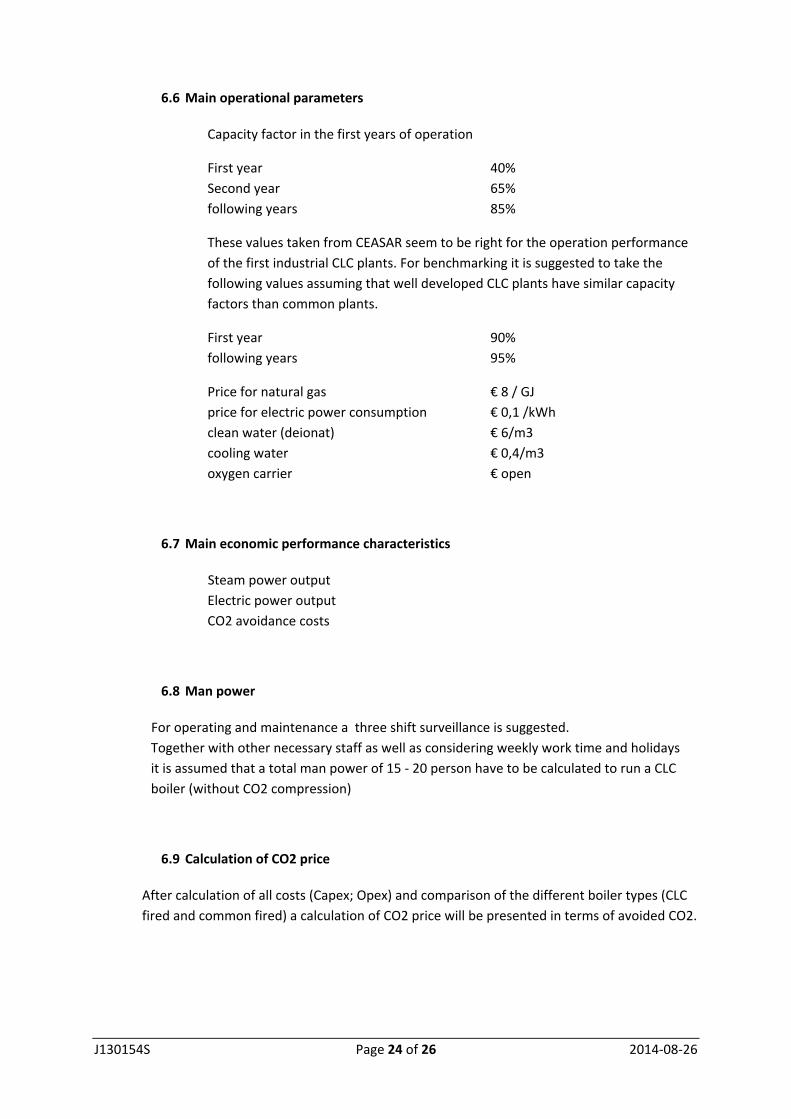
6.6 Main operational parameters
Capacity factor in the first years of operation
First year 40%
Second year 65%
following years 85%
These values taken from CEASAR seem to be right for the operation performance
of the first industrial CLC plants. For benchmarking it is suggested to take the
following values assuming that well developed CLC plants have similar capacity
factors than common plants.
First year 90%
following years 95%
Price for natural gas € 8 / GJ
price for electric power consumption € 0,1 /kWh
clean water (deionat) € 6/m3
cooling water € 0,4/m3
oxygen carrier € open
6.7 Main economic performance characteristics
Steam power output
Electric power output
CO2 avoidance costs
6.8 Man power
For operating and maintenance a three shift surveillance is suggested.
Together with other necessary staff as well as considering weekly work time and holidays
it is assumed that a total man power of 15 ‐ 20 person have to be calculated to run a CLC
boiler (without CO2 compression)
6.9 Calculation of CO2 price
After calculation of all costs (Capex; Opex) and comparison of the different boiler types (CLC
fired and common fired) a calculation of CO2 price will be presented in terms of avoided CO2.
J130154S Page 25 of 26 2014‐08‐26
7 Thermodynamic properties
7.1 Air
Properties according FDBR are recommended to be used.
In case of using other properties a comparison to FDBR should be made.
7.2 Flue gas
Properties according FDBR are recommended to be used.
In case of using other properties a comparison to FDBR should be made.
7.3 Water/Steam
International Association for Properties of water and steam (IAPWS‐ IF97) have to be used.
In case of using other properties a comparison to IAPWS‐IF97 should be made.
8 Abbreviations
CCS Carbon Capture and Storage
EBTF European Benchmarking Task Force
EPC Carbon Capture and Storage
FDBR Fachverband Dampfkessel Behälter und Rohrleitungsbau
GTCC Gas Turbine Combined Cycle
OC Oxygen Carrier
J130154S Page 26 of 26 2014‐08‐26
9 List of symbols
CO2,avoid CO2 avoidance rate [‐]
CO2,capt CO2 capture rate [‐]
2COm Mass flow of CO2 [kg/s]
n Molar flow rate [mol/s]
Pth Thermal fuel power input (basis LHV) [W]
2COy mole fraction of CO2 in flue gas [‐]
Greek symbols:
Pth specific fuel consumption increase [‐]
efficiency penalty [‐]
net electric plant efficiency [‐]
Subscripts:
base plant without carbon capture with equal electric output as plant with carbon capture
capt captured part of CO2
CC plant with carbon capture
clean after CO2 capture unit
FG flue gas
raw before CO2 capture unit
released part of CO2 released to the atmosphere
total total CO2 resulting from all fuel carbon in complete combustion


