D5-6 ACC 36M - Qcity
49
TIP4-CT-2005-516420 Page 1 of 49 QCITY issued: 13-02-08 D5-6_ACC_36M.doc DELIVERABLE D5.6 CONTRACT N° TIP4-CT-2005-516420 PROJECT N° FP6-516420 ACRONYM QCITY TITLE Quiet City Transport Subproject SP5 Design & implementation of solutions at validation sites Work Package 5.6 Augsburg validation site – Town planning Performance report of applied measures - Augsburg Written by Markus Petz Robert Witte ACC Date of issue of this report 13.02.2008 PROJECT CO-ORDINATOR Acoustic Control ACL SE PARTNERS Accon ACC DE Akron AKR BE Amec Spie Rail AMEC FR Alfa Products & Technologies APT BE Banverket BAN SE Composite Damping Material CDM BE Havenbedrijf Oostende HOOS BE Frateur de Pourcq FDP BE Goodyear GOOD LU Head Acoustics HAC SE Heijmans Infra HEIJ BE Royal Institute of Technology KTH SE Vlaamse Vervoersmaatschappij DE LIJN LIJN BE Lucchini Sidermeccanica LUC IT NCC Roads NCC SE Stockholm Environmental & Health Administration SEA SE Société des Transports Intercommunaux de Bruxelles STIB BE Netherlands Organisation for Applied Scientific Research TNO NL Trafikkontoret Göteborg TRAF SE Tram SA TRAM GR TT&E Consultants TTE GR University of Cambridge UCAM UK University of Thessaly UTH GR Voestalpine Schienen VAS AU Zbloc Norden ZBN SE Union of European Railway Industries UNIFE BE PROJECT START DATE February 1, 2005 DURATION 48 months Project funded by the European Community under the SIXTH FRAMEWORK PROGRAMME PRIORITY 6 Sustainable development, global change & ecosystems
Transcript of D5-6 ACC 36M - Qcity

TIP4-CT-2005-516420 Page 1 of 49
QCITY issued: 13-02-08
D5-6_ACC_36M.doc
DELIVERABLE D5.6
CONTRACT N° TIP4-CT-2005-516420
PROJECT N° FP6-516420
ACRONYM QCITY
TITLE Quiet City Transport
Subproject SP5 Design & implementation of solutions at validation sites
Work Package 5.6 Augsburg validation site – Town planning
Performance report of applied measures - Augsburg
Written by Markus Petz
Robert Witte
ACC
Date of issue of this report 13.02.2008
PROJECT CO-ORDINATOR Acoustic Control ACL SE PARTNERS Accon ACC DE
Akron AKR BE Amec Spie Rail AMEC FR Alfa Products & Technologies APT BE Banverket BAN SE Composite Damping Material CDM BE Havenbedrijf Oostende HOOS BE Frateur de Pourcq FDP BE Goodyear GOOD LU Head Acoustics HAC SE Heijmans Infra HEIJ BE Royal Institute of Technology KTH SE Vlaamse Vervoersmaatschappij DE LIJN LIJN BE Lucchini Sidermeccanica LUC IT NCC Roads NCC SE Stockholm Environmental & Health Administration SEA SE Société des Transports Intercommunaux de Bruxelles STIB BE Netherlands Organisation for Applied Scientific Research TNO NL Trafikkontoret Göteborg TRAF SE Tram SA TRAM GR TT&E Consultants TTE GR University of Cambridge UCAM UK University of Thessaly UTH GR Voestalpine Schienen VAS AU Zbloc Norden ZBN SE Union of European Railway Industries UNIFE BE
PROJECT START DATE February 1, 2005
DURATION 48 months
Project funded by the European Community under the
SIXTH FRAMEWORK PROGRAMME
PRIORITY 6
Sustainable development, global change & ecosystems
Nils-Åke
Ny stämpel
TIP4-CT-2005-516420 Page 2 of 49
QCITY issued:13-02-08
D5-6_ACC_36M.doc
T A B L E O F C O N T E N T S
0 EXECUTIVE SUMMARY.................................................................................................................................................4
1 OBJECTIVE OF THE WORKPACKAGE........................................................................................................................5
2 SELECTION OF SITE ......................................................................................................................................................6
3 AREA OF INVESTIGATION...........................................................................................................................................7
3.1 General information For Augsburg ................................................................................................................7 3.2 Traffic situation within Augsburg.....................................................................................................................7 3.3 Noise exposure within Augsburg ....................................................................................................................7
3.3.1 Potential for noise reduction ......................................................................................................................8 3.3.2 Traffic noise situation....................................................................................................................................8
4 THEORETICAL CONSIDERATIONS ........................................................................................................................... 11
4.1 Input data for noise maps and noise analysis .......................................................................................... 11 4.1.1 Digital Terrain Model ................................................................................................................................. 11 4.1.2 Building Model ........................................................................................................................................... 11 4.1.3 Obstacles .................................................................................................................................................... 11 4.1.4 Traffic network............................................................................................................................................ 11
4.2 General approach towards action planning........................................................................................... 12 4.3 general methodology................................................................................................................................... 13
5 CALCULATION AND EVALUATION METHODS ...................................................................................................... 14
5.1 Calculation methods..................................................................................................................................... 14 5.2 Evaluation of noise exposure – population exposure to Noise levels lden ............................................ 14 5.3 Evaluation of noise exposure – Noise Score.............................................................................................. 15 5.4 Evaluation of parks & open space amenity areas .................................................................................. 16
6 TOWN PLANNING MEASURES WITHIN THE SCENARIOS....................................................................................... 18
6.1 Overview of the Maximilianstrasse.............................................................................................................. 18 6.1.1 Insulated glazing and ventilation provisions......................................................................................... 19 6.1.2 Silent road surface..................................................................................................................................... 19 6.1.3 Building layout with noise sensitive rooms on quiet sides ................................................................... 19
6.2 Overview of the redevelopment area No. 8 ............................................................................................ 20 6.2.1 General conditions and potential for development: ......................................................................... 22 6.2.2 Planning concept...................................................................................................................................... 22 6.2.3 Scenario A .................................................................................................................................................. 22 6.2.4 Scenario B ................................................................................................................................................... 23 6.2.5 Scenario C .................................................................................................................................................. 23 6.2.6 Scenario D .................................................................................................................................................. 24 6.2.7 Scenario E ................................................................................................................................................... 25
TIP4-CT-2005-516420 Page 3 of 49
QCITY issued:13-02-08
D5-6_ACC_36M.doc
7 EFFECTS OF TOWN PLANNING INTERVENTION MEASURES ................................................................................. 26
7.1 Insulated glazing and ventilation provisions ............................................................................................. 26 7.1.1 Effects on the number of people exposed........................................................................................... 26 7.1.2 Effects on the Noise Score ....................................................................................................................... 27 7.1.3 Costs of the insulated glazing and ventilation provisions................................................................... 27
7.2 silent road surface.......................................................................................................................................... 28 7.2.1 Effects on the number of people exposed........................................................................................... 28 7.2.2 Effects on the Noise Score ....................................................................................................................... 28 7.2.3 Costs of the silent road surface............................................................................................................... 29
7.3 Building layout with noise sensitive rooms at quiet sides ........................................................................ 29 7.3.1 Effects on the number of people exposed........................................................................................... 29 7.3.2 Effects on the Noise Score ....................................................................................................................... 30
7.4 Reorganisation / reconstruction of entire urban areas........................................................................... 31 7.4.1 Effects on the number of people exposed........................................................................................... 31 7.4.2 Effects on the Noise Score ....................................................................................................................... 34 7.4.3 Recreational quality of parks .................................................................................................................. 38
8 CONCLUSION........................................................................................................................................................... 40
9 ANNEX A ................................................................................................................................................................... 41
9.1 Maximilianstrasse............................................................................................................................................ 41 9.2 Redevelopment area No. 8 ......................................................................................................................... 43
9.2.1 Land utilisation – status quo..................................................................................................................... 44 9.2.2 Land utilisation – scenario A .................................................................................................................... 45 9.2.3 Land utilisation – scenario B..................................................................................................................... 46 9.2.4 Land utilisation – scenario C.................................................................................................................... 47 9.2.5 Land utilisation – scenario D .................................................................................................................... 48 9.2.6 Land utilisation – scenario E..................................................................................................................... 49

TIP4-CT-2005-516420 Page 4 of 49
QCITY issued: 13-02-08
D5-6_ACC_36M.doc
0 E X E C U T I V E S U M M A R Y
Using Augsburg as an example the noise reduction potential of different town-
planning measures has been determined both for short-term, mid-term and long-
term strategies. Accordingly, detailed statistics of the noise effects inside two
different areas of Augsburg were calculated so that the performance of different
measures could be detected and could partially be compared. As a result one can
say that short-term strategies are sensible and effective when there is an acute need
for action. The implementation of mid-term and long-term measures can be very
effective and can at the same time ensure a high quality of life by implementing
green areas for example, but often will be hard to realize. In general all measures do
have advantages and disadvantages alike and often the costs of measures are their
biggest disadvantage. Therefore it is not that easy to choose between one or
another specific measure. Instead the best choice often will be a combination of
different measures. Reasonable cost-benefit ratio with limited costs for cities as well
as the owners of property can be realized if a combination of measures is attributed
to both parties. In the long run a sustainable, positive development can be ensured
through the implementation of mixed utilisation areas.

TIP4-CT-2005-516420 Page 5 of 49
QCITY issued: 13-02-08
D5-6_ACC_36M.doc
1 O B J E C T I V E O F T H E W O R K P A C K A G E
Within this study different town planning measures can be analysed and compared
with respect to their noise effects and costs. The study has been carried out for
specific areas of Augsburg and the town planning measures which have been
analysed can be subdivided in three parts:
• Measures concerning the short-term strategy for actual situations e.g. passive
sound insulation (insulated glazing and ventilation provisions);
• Measures concerning the medium-term strategy for actual situations and
new development such as the orientation of building layouts with noise
sensitive rooms on quiet sides; and
• Measures concerning the long-term strategy of urban areas within the scope
of urban redevelopment.

TIP4-CT-2005-516420 Page 6 of 49
QCITY issued: 13-02-08
D5-6_ACC_36M.doc
2 S E L E C T I O N O F S I T E
The city of Augsburg has been chosen for the study of town planning measure
interventions, because of the availability of noise information as well as its complete
digital city model with all the required 3d-model information including a terrain
model, roads, buildings and other obstacles. From this information accurate noise
maps are available and the number of people exposed to a specific noise level can
be determined for each building. Another reason for choosing Augsburg is that the
Environmental Agency and the agency of urban planning are both willing to support
the Quiet City Project.
For detailed analysis two different areas within Augsburg have been selected:
Measures that can be implemented in the short- or medium term were analysed
within an example situation alongside the “Maximilianstrasse” in Augsburg, because
at this location we have a typical, highly exposed sector with a significant demand
for noise mitigation measures.
Measures concerning the long-term strategy of urban areas have been analysed
within the redevelopment area No. 8 since at this location intensive considerations
for its restructuring have been made and detailed utilisation scenarios were
designed by architects on behalf of the City of Augsburg.

TIP4-CT-2005-516420 Page 7 of 49
QCITY issued: 13-02-08
D5-6_ACC_36M.doc
3 A R E A O F I N V E S T I G A T I O N
3.1 GENERAL INFORMATION FOR AUGSBURG
The city of Augsburg with its 280.000 inhabitants is a central point of Bavaria. In 2000
years of development a townscape has evolved, which is marked by its old town.
From 1800 until 1950 Augsburg was famous for its textile industry which nowadays
leaves large industrial areas to be reintegrated into the general urban fabric. Since
the 19th century large scale industry (mechanical engineering, paper
manufacturing) was established into the inner city area.
3.2 TRAFFIC SITUATION WITHIN AUGSBURG
The transport network of Augsburg contains 625 km of public roads, 73 km of tram rail
tracks and 70 km of heavy railway. There is no existing underground rail network.
3.3 NOISE EXPOSURE WITHIN AUGSBURG
The historical city wall which surrounds Augsburg creates a constrained traffic
situation with very few main roads leading into and out of Augsburg. This results in a
noise exposure from road traffic which is to be seen as problematic. Narrow roads,
highly dense areas and historical roadbeds contribute considerably to the noise
climate in the city.
The contribution of the national railway, tram and industrial noise can be neglected
compared to the noise exposure caused by road traffic. The contribution of aircraft
noise can be classified as insignificant.
In 2000 the city of Augsburg began to develop a noise information system which
enables them to identify the noise exposure in every region. Additionally the local
population are able to access information about the noise climate via the Internet
at any time (www.laermkarten.de).
In 2003 the city of Augsburg started developing noise reduction plans together with
rehabilitation programs and for different parts of the city noise reduction measures
were planned and implemented. In line with this, urbanism and traffic planning noise
reduction and noise prevention methods are being investigated and implemented.
The noise reduction plans are determined and implemented by the urban
management office, the environmental agency and the Civil Engineering Office.

TIP4-CT-2005-516420 Page 8 of 49
QCITY issued: 13-02-08
D5-6_ACC_36M.doc
3.3.1 Potential for noise reduction
There are a range of possibilities and opportunities to reduce the noise exposure in
the inner city such as:
• Planning the building layout with noise sensitive rooms on the quiet side;
• Additional or improved sound insulation glazing and acoustic ventilation
provisions; and
• Land utilisation plans to reduce acoustical conflicts in within living areas.
3.3.2 Traffic noise situation
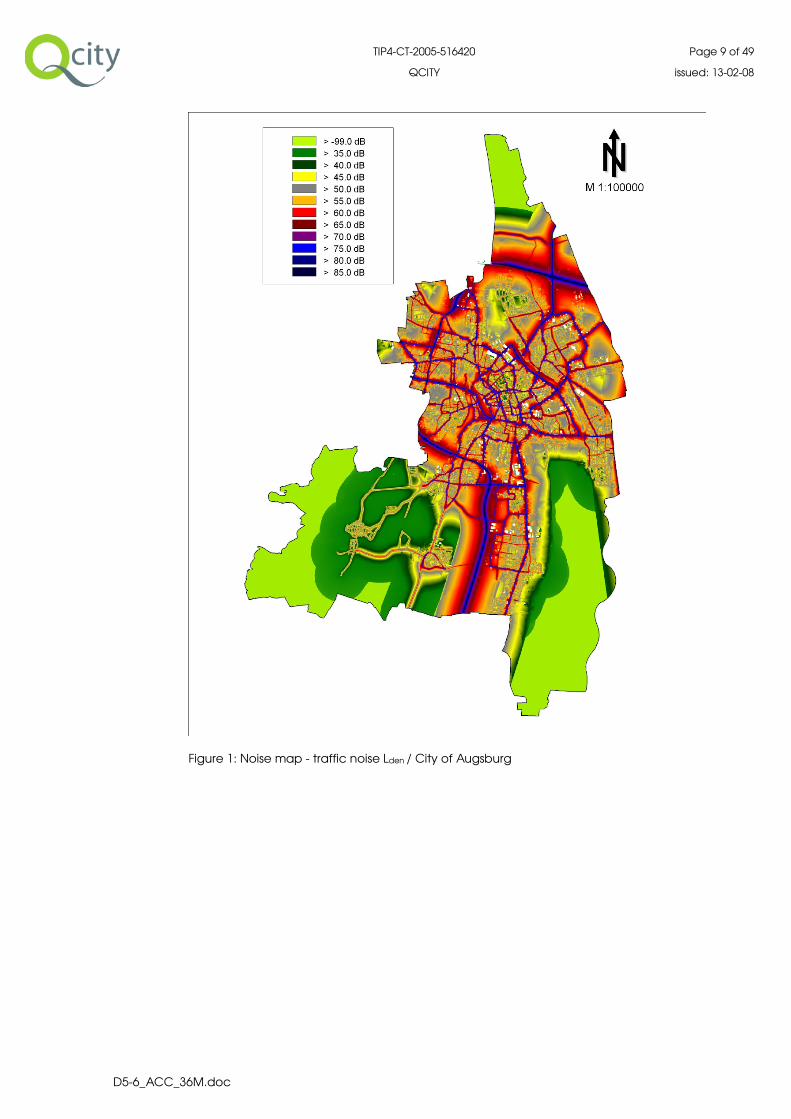
The following two figures present the noise maps of the agglomeration of Augsburg
which have been produced for the noise level- indices of Lden and Lnight. They are
also accessible on http://www.qcity.org/maps with scales of 1:400000 up to 1:25000.
TIP4-CT-2005-516420 Page 9 of 49
QCITY issued: 13-02-08
D5-6_ACC_36M.doc
Figure 1: Noise map - traffic noise Lden / City of Augsburg

TIP4-CT-2005-516420 Page 10 of 49
QCITY issued: 13-02-08
D5-6_ACC_36M.doc
Figure 2: Noise map - traffic noise Lnight / City of Augsburg
Furthermore all residential buildings have been identified where the facade noise
levels exceed the limiting values of Lden and / or Lnight (Lden > 65 dB(A), Lnight >
55 dB(A)).

TIP4-CT-2005-516420 Page 11 of 49
QCITY issued: 13-02-08
D5-6_ACC_36M.doc
4 T H E O R E T I C A L C O N S I D E R A T I O N S
4.1 INPUT DATA FOR NOISE MAPS AND NOISE ANALYSIS
The investigation is based on the following raw data:
4.1.1 Digital Terrain Model
A digital terrain model representing a ground surface topography consisting of
contour lines or Height Points.
4.1.2 Building Model
3-dimensional digital models of buildings with information about their main useage,
acoustical characteristics (absorption) and the number of inhabitants. For areas
without detailed information, the number of inhabitants per building has been
determined by allocating the commune’s total number of inhabitants on each
building’s living space taking into account the base area and the number of floors.
4.1.3 Obstacles
They contain information about noise insulation arrangements and barriers and
reflectors etc, are taken into account.
4.1.4 Traffic network
Whilst traffic networks can be subdivided into a number of road models, train tracks
and flight paths of aircrafts movements within this study only the road networks had
to be modeled and analysed.

TIP4-CT-2005-516420 Page 12 of 49
QCITY issued: 13-02-08
D5-6_ACC_36M.doc
4.2 GENERAL APPROACH TOWARDS ACTION PLANNING
Figure 3 identifies the general approach towards noise mapping and action
planning.
Figure 3: General approach towards noise mapping and action planning

TIP4-CT-2005-516420 Page 13 of 49
QCITY issued: 13-02-08
D5-6_ACC_36M.doc
4.3 GENERAL METHODOLOGY
The following steps have been performed:
• Creating the 3-dimensional noise propagation models of the
Maximilianstrasse and the redevelopment area No. 8 with all relevant input
data, such as the digital terrain model and noise barriers as well as the
emission data of each road within the calculation areas. The data for the
redevelopment area derives from the different town planning models
created by “Baur + Deby, Architekten + Stadtplaner, Munich, September
2007”. The emission data (mean daily traffic data and classification) has
been derived according to the specifications of the city of Augsburg.
• Calculation of the noise levels has been carried out for the area of the
Maximilianstrasse as well as in each scenario of the redevelopment area No.
8 at the facades of residential buildings according to the appropriate
technical rules (European directive 2002/49/EC and its implementation in
national (German) law (34. BImSchV) with the use of the noise indicators Lden
and Lnight).
• Analysis of the effect of sound insulated glazing and acoustic ventilation
provisions as well as the effect of changes in building layout with noise
sensitive rooms on ‘quiet’ facades.
• Noise analysis for the number of people and residential buildings with noise
classes above specified limits.
• Noise Score analysis and hot spot detection.
• Comparison of the exposure of the ‘status quo’ with the planned land-use
within the areas investigated.
• Comparison of the exposure of the planned land-use with other areas and
the average level of exposure within Augsburg.

TIP4-CT-2005-516420 Page 14 of 49
QCITY issued: 13-02-08
D5-6_ACC_36M.doc
5 C A L C U L A T I O N A N D E V A L U A T I O N M E T H O D S
5.1 CALCULATION METHODS
In order to ensure the utility of the results for the upcoming action planning all noise
calculations were executed according to the national calculation methods which
are based on the European directive 2002/49/EC and its implementation in national
(German) law (34.BImSchV) with the use of the noise indicators Lden and Lnight. The
day-evening-night level Lden is the A-weighted long term average sound level for the
period day (06.00 – 18.00), evening (18.00 – 22.00) and night (22.00 – 06.00). The
night-time noise indicator Lnight is the A-weighted long-long term average sound level
as defined in ISO 1996-2: 1987 determined over all the individual night-time periods of
a year.
The national calculation methods VBUS (Vorläufige Berechnungsmethode für den
Umgebungslärm an Straßen) as well as VBEB (Vorläufige Berechnungsmethode zur
Ermittlung der Belastetenzahlen durch Umgebungslärm) have been applied.
Accordingly, all of the noise calculations have been executed by calculating the
noise levels at specific facade points of each residential building with a distance of
three meters from each other and a receiver height of 4.0 meters above local
ground terrain. Ground effects as well as reflections from building facades and
screens have been also taken into account. The effectiveness of different measures
can be displayed and compared against each other and also compared against
the average situation within the urban area of Augsburg.
5.2 EVALUATION OF NOISE EXPOSURE – POPULATION EXPOSURE TO NOISE LEVELS LDEN
In order to quantify the estimated number of people living in dwellings that are
exposed to noise the German calculation method VBEB (Vorläufige
Berechnungsmethode zur Ermittlung der Belastetenzahlen durch Umgebungslärm)
has been applied. This calculation method is based on the VDI 3722, but has been
adjusted to take account of the requirements specified in 34. BImSchV as well as in
the Appendices I, IV and VI of the directive 2002/49/EC.
Since in general the exact position, size and floor plan of dwellings are not known,
the total number of people living inside specific dwellings is equally apportioned
over the immission points placed on the building facades. Thus the value ‘inhabitants
per immission point’ is determined and is specifically attached to the immission level
at that point. Subsequently, the number of people attributed to each facade level
has been summed up within specific noise classes. This procedure has been
performed for each of the scenarios. Since it is most important to reduce the
detrimental effects of noise, special attention has been focused on the number of
people exposed to levels of Lden > 65 dB and how this number changes between the
specific single scenarios. However it is still difficult to compare the scenarios amongst
each other, because the total amount of people living within the redevelopment

TIP4-CT-2005-516420 Page 15 of 49
QCITY issued: 13-02-08
D5-6_ACC_36M.doc
area No. 8 changes within each scenario in dependent of the number of residential
buildings. Therefore the evaluation has also been carried out by use of a single
numerical value called “Noise Score”.
5.3 EVALUATION OF NOISE EXPOSURE – NOISE SCORE
In order to provide another measure to judge the noise effect mentioned in 5.2, the
NERS (Noise Environmental Rating System)1 has been applied. Using NERS it is possible
to provide a summation of the ‘Noise Score’ within an area in one single numerical
value. Accordingly, the benefits of specific different intervention measures can be
compared utilising a single noise evaluation method.
Figure 4 identifies the basic principle of NERS.
Figure 4: Annoyance-exposure relation of an individual person (AE-curve) –scaling assumed
Figure 4 shows that an individual’s annoyance can be judged according to
following experiences:
• most studies show that there is no significant annoyance reaction below
40 dB(A) -> this defines the lower limit of the scale;
• noise levels at and above 80 dB(A) are almost intolerable without a high
level of mitigation;
-> this defines where the slope of the assessment curve should converge at
infinity
1 Probst, Wolfgang: The assessment of noise taking into account noise levels and people annoyed

TIP4-CT-2005-516420 Page 16 of 49
QCITY issued: 13-02-08
D5-6_ACC_36M.doc
• the increase of annoyance with a given increase of noise level is more pre-
dominant at higher noise levels;
-> this derives from the awareness that an increase of ‘x’ at higher noise
levels does have higher effects on annoyance, disturbance and health than
if the same increase would occur at lower noise levels.
The Noise Score (as a single numerical value for the overall annoyance of an area) has
been calculated according to the following formula:
Y Noise Score
ni Number of persons with noise indicator Lden,i at most exposed facade
Lden,j Noise indicator at the most exposed facade of dwelling i
dI Deviation of sound insulation and mean sound insulation of all buildings
dLsource correction for different noise sources (road, railway…)
A detailed description of the Noise Ranking and Scoring Methodology ‘NERS’ has
been presented in Deliverable 1.2 ‘Proposal of a Noise Scoring Methodology’.
5.4 EVALUATION OF PARKS & OPEN SPACE AMENITY AREAS
Analyses show that people living nearby parks feel less annoyed to a certain specific
noise level than those people without open space areas (green corridors) in the
nearby vicinity. From this general hypothesis derives the question to what extent the
quality of life is affected and can be improved due to the creation of parks with
relatively tranquil areas close to residential areas. Of course these effects are difficult
to measure and objectively quantify and cannot necessarily be adequately
expressed in a single numerical value. Therefore in this analysis a method has been
developed which expresses the recreational quality of parks by comparing some
parks and amenity areas with the scenarios of the redevelopment area for three
different parameters described below.
1. Average noise level Lden within the park/amenity area
It is assumed that the recreational quality and therewith the value of parks is
higher, the lower the average noise level within the park.
2. Quiet area per person [m²/inhabitant]
It is assumed that a park has a higher recreational quality the greater the quiet
area with sound levels of Lden < 55 dB that is at each individual person’s disposal.
( )
( )
>⋅
≤⋅= ∑
+−−⋅
+−−⋅
ii,den
dLdI5.57L30.0
i,den
dLdI50L15.0
i
)A(dB65Lfor10n
)A(dB65Lfor10nY
sourcei,den
sourcei,den

TIP4-CT-2005-516420 Page 17 of 49
QCITY issued: 13-02-08
D5-6_ACC_36M.doc
3. Potential number of people entering the park
It is assumed that a park has a higher recreational quality, the greater the
potential number of people that would actually utilise the park.
In this context it is assumed that the number of people entering the park
(potential park-users) can be calculated by identifying a corridor of 250 m2 width
outside the park and counting up the number of people living within this corridor.
Therefore it is irrelevant if the number of people is accurately quantifiable with
this method, since this analysis is meant to generate qualitative results so that
different parks can be compared against each other in a uniform way.
2 comperable with a 5-minutes foot-walk within a city
TIP4-CT-2005-516420 Page 18 of 49
QCITY issued: 13-02-08
D5-6_ACC_36M.doc
6 T O W N P L A N N I N G M E A S U R E S W I T H I N T H E
S C E N A R I O S
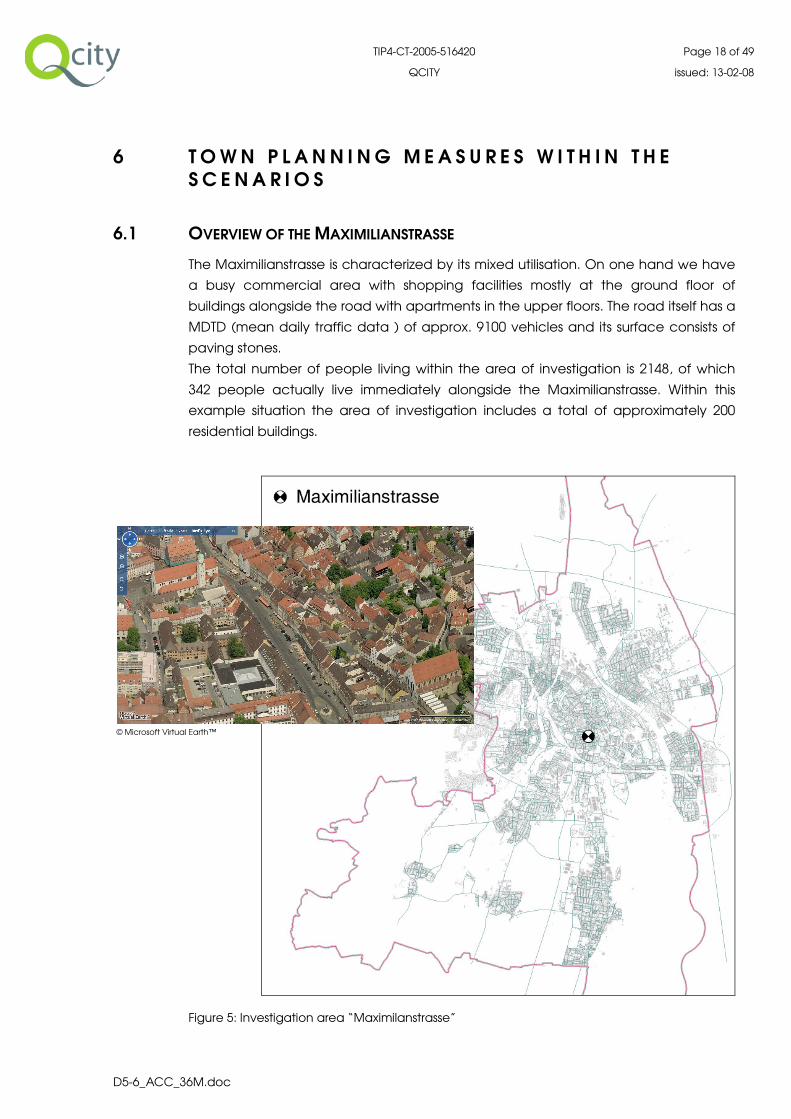
6.1 OVERVIEW OF THE MAXIMILIANSTRASSE
The Maximilianstrasse is characterized by its mixed utilisation. On one hand we have
a busy commercial area with shopping facilities mostly at the ground floor of
buildings alongside the road with apartments in the upper floors. The road itself has a
MDTD (mean daily traffic data ) of approx. 9100 vehicles and its surface consists of
paving stones.
The total number of people living within the area of investigation is 2148, of which
342 people actually live immediately alongside the Maximilianstrasse. Within this
example situation the area of investigation includes a total of approximately 200
residential buildings.
Figure 5: Investigation area “Maximilanstrasse”
© Microsoft Virtual Earth™

TIP4-CT-2005-516420 Page 19 of 49
QCITY issued: 13-02-08
D5-6_ACC_36M.doc
6.1.1 Insulated glazing and ventilation provisions
Within this study it has been assumed that acoustic glazing is only effective during
the night time period as the windows might be open during the day which would
nullify the positive effect of the additional sound insulated glazing. At night the
ventilation provisions would be in use so that the windows would take an additional
insulating effect of 15 dB. Alternatively one could say that only bedrooms would be
equipped with insulated glazing so that there would be an effect at nighttime only
as during the day time people would utilise other rooms. The costs for this measure
can be subsumed as follows:
If only bedrooms are equipped with insulated glazing it generally is assumed that
each person would have a window area of 1.5 m². Each square meter of insulated
glazing costs roughly between 300 € and 500 €. Additionally, there are the costs for
the ventilation. In general one calculates that two persons would need one
ventilator. Each Ventilator costs about 400 €. Therewith in the following we calculate
total costs of 800 € per person.
6.1.2 Silent road surface
Mitigation measures at receiver points cannot be regarded as being equal to those
that are implemented at or near the source. These types of mitigation measures
reduce the noise level on an area wide basis which results in a much wider effect so
that living areas outside of buildings, like balconies, terraces or gardens would also
be less exposed. Accordingly, the general noise climate would be improved both
inside and outside of buildings.
One of these possibilities to reduce noise at source which has been analysed is the
improvement of the acoustical attributes of the road surface so that more noise
energy gets absorbed. When changing parts of the road surface from standard
pavement to smooth mastic asphalt (SMA) a noise reduction of up to 6 dB can be
expected.
The costs of a ‘silent’ road surface differ from those of standard asphalt by a wide
margin. Whilst standard asphalt costs about eight Euros per square meter, the costs
of smooth mastic asphalt are between 30 and 50 Euros per square meter.
6.1.3 Building layout with noise sensitive rooms on quiet sides
This measure can be regarded as a medium-term strategy for actual situations and
new development areas.
In general it is assumed that the total number of inhabitants per building are
homogeneously spread alongside the facade points of a building for which the
noise level Lden can be determined. According to the approach chosen within this
study all inhabitants live alongside “quiet” facades. That means that by definition no
person gets exposed to a level Lden > 65 dB or Lnight > 55 dB. Planning the building
layout with noise sensitive rooms on quiet sides of course is subjected to restrictional
parameters just like any other measure. One of these restrictions for example is the

TIP4-CT-2005-516420 Page 20 of 49
QCITY issued: 13-02-08
D5-6_ACC_36M.doc
geographical orientation of the facades, so that the allocation of inhabitants on the
northwardly orientated facades is generally regarded as critical. However the extent
to which this theoretical approach is realistic is not part of this study as the focus here
remains on the analysis of its potential benefits, regardless of whether it can be
realised.
6.2 OVERVIEW OF THE REDEVELOPMENT AREA NO. 8
The redevelopment area No.8 of the city of Augsburg is presumed to have a special
demand for sustainable development which can be implemented in the long-term.
The different utilisations that can be found are partially in functional conflict. Since
many of the changes within the redevelopment area and surrounding areas were
taking place during the last couple years, a solution for development without
conflicts should be found. The redevelopment area is bounded by surrounding roads
and an existing industrial estate. Alongside the “Donauwörther Straße” and
“Ahornerstrasse” (in the west, respectively the north of the area) the utilisation is
mixed between residential and industrial use. Within some areas we find
undeveloped/derelict areas and a scrap yard, whilst in the middle we find
apartment buildings. In the south-western part there is a large office building. In the
middle of the area there is a supermarket.
The large overall construction level of the redevelopment area is medium or good
with the exception of the factory workshops in the east which are in a poor
condition.
The dominating road connections are located in the south as well as in the west
(road B 2). All other roads within or surrounding the redevelopment area are
restricted to 30 km/h. For the status quo scenario the total number of inhabitants in
the area of investigation is ‘400’.
The following aerial photo shows the actual situation and location of the
investigated redevelopment area. (Further maps of the redevelopment area for its
present state as well as the single scenarios can be found in Annex A.)

TIP4-CT-2005-516420 Page 21 of 49
QCITY issued: 13-02-08
D5-6_ACC_36M.doc
Figure 6: Redevelopment area No. 8
The present state of land utilisation shows the following diagram:
status quo
11%
4%
74%
7%4%
residential ares
mixed ares
industrial area including office buildings
open space
rest
Figure 7: Present state of land utilisation

TIP4-CT-2005-516420 Page 22 of 49
QCITY issued: 13-02-08
D5-6_ACC_36M.doc
6.2.1 General conditions and potential for development:
The distinctive structures (buildings) in the southern area have to be considered and
the apartment buildings with a good construction level have to be maintained in the
long term. Already existing traffic connections should be supplemented with
reasonable, additional connections. A development plan originally developed in the
1960s has not at this time been implemented and thus can be disregarded.
6.2.2 Planning concept
Within all scenarios the area between “Donauwörther Straße” and “Schönbach-
straße” should be modified into an area with mixed utilisation between living
accommodation and commerce in order to have an area which is preferably, free
of conflict. In the south of the “Ahornerstrasse” the public use for a school should
result in conjunction with a residential use.
6.2.3 Scenario A
The eastern properties alongside “Schönbachstraße” will be developed into
residential areas. Alongside the “Äußere Uferstraße” the big workshop in the north will
be maintained, and the existing parking area can further utilised. The halls in the
south can be maintained in line with an industrial park. Residential areas are
separated from industrial areas by green space.
In scenario ‘A’ the total amount of inhabitants in the area of investigation is ‘695’.
Main usage:
• industrial real estate
• apartment buildings
• office buildings
scenario A
18%
4%
60%
13%
5%
residential ares
mixed ares
industrial area including office buildings
open space
rest
TIP4-CT-2005-516420 Page 23 of 49
QCITY issued: 13-02-08
D5-6_ACC_36M.doc
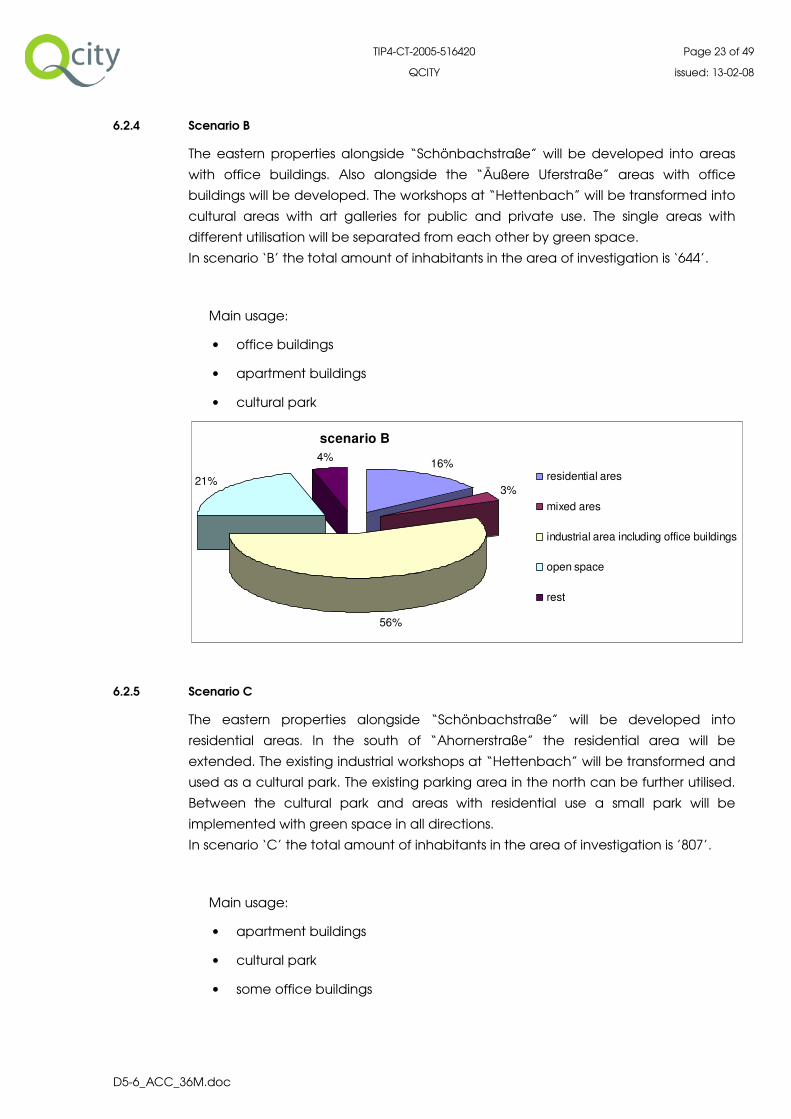
6.2.4 Scenario B
The eastern properties alongside “Schönbachstraße” will be developed into areas
with office buildings. Also alongside the “Äußere Uferstraße” areas with office
buildings will be developed. The workshops at “Hettenbach” will be transformed into
cultural areas with art galleries for public and private use. The single areas with
different utilisation will be separated from each other by green space.
In scenario ‘B’ the total amount of inhabitants in the area of investigation is ‘644’.
Main usage:
• office buildings
• apartment buildings
• cultural park
scenario B
16%
3%
56%
21%
4%
residential ares
mixed ares
industrial area including office buildings
open space
rest
6.2.5 Scenario C
The eastern properties alongside “Schönbachstraße” will be developed into
residential areas. In the south of “Ahornerstraße” the residential area will be
extended. The existing industrial workshops at “Hettenbach” will be transformed and
used as a cultural park. The existing parking area in the north can be further utilised.
Between the cultural park and areas with residential use a small park will be
implemented with green space in all directions.
In scenario ‘C’ the total amount of inhabitants in the area of investigation is ’807’.
Main usage:
• apartment buildings
• cultural park
• some office buildings

TIP4-CT-2005-516420 Page 24 of 49
QCITY issued: 13-02-08
D5-6_ACC_36M.doc
scenario C
23%
4%
50%
19%
4%
residential ares
mixed ares
industrial area including office buildings
open space
rest
6.2.6 Scenario D
The eastern properties alongside “Schönbachstraße” will be developed into
residential areas. Also alongside the “Äußere Uferstraße” residential areas will be
developed. The industrial workshops will give way for a residential area alongside the
“Hettenbach”. In the central area between the apartment buildings a small park
with green space in all directions will be created.
In scenario ‘D’ the total amount of inhabitants in the area of investigation is ‘1387’.
Main usage:
• apartment buildings
• few office buildings
• parks
scenario D
37%
4%37%
18%
4%
residential ares
mixed ares
industrial area including office buildings
open space
rest

TIP4-CT-2005-516420 Page 25 of 49
QCITY issued: 13-02-08
D5-6_ACC_36M.doc
6.2.7 Scenario E
The eastern properties alongside “Schönbachstraße” will be developed into
residential areas. The halls at “Hettenbach” will be transformed into a cultural park
with a focus on public use. Between the cultural park and areas with residential use
there is the “Hettenbachpark” with green space in the direction to the river
“Wertach”.
In scenario ‘E’ the total amount of inhabitants in the area of investigation is ‘940’.
Main usage:
• parks
• residential buildings
• few office buildings
scenario E
25%
37%
3%
4%
31% residential ares
mixed ares
industrial area including office buildings
open space
rest
TIP4-CT-2005-516420 Page 26 of 49
QCITY issued: 13-02-08
D5-6_ACC_36M.doc
7 E F F E C T S O F T O W N P L A N N I N G I N T E R V E N T I O N
M E A S U R E S
Town planning is, unlike heavy vehicle routing for example, a measure that takes
effect only within a locally bounded area. Through this specific, local improvements
can be focused which however in some cases can only be realised with major
financial input for the communes. When considering the cost-value ratio with regard
to the number of people gaining a benefit from such improvements, some of these
measures are relatively expensive but might be necessary in order to obtain and
sustain an acceptable noise climate for everyone.
7.1 INSULATED GLAZING AND VENTILATION PROVISIONS
Insulated glazing and ventilation provisions can be realized relatively easily and
therefore are counted among measures for a short-term strategy.
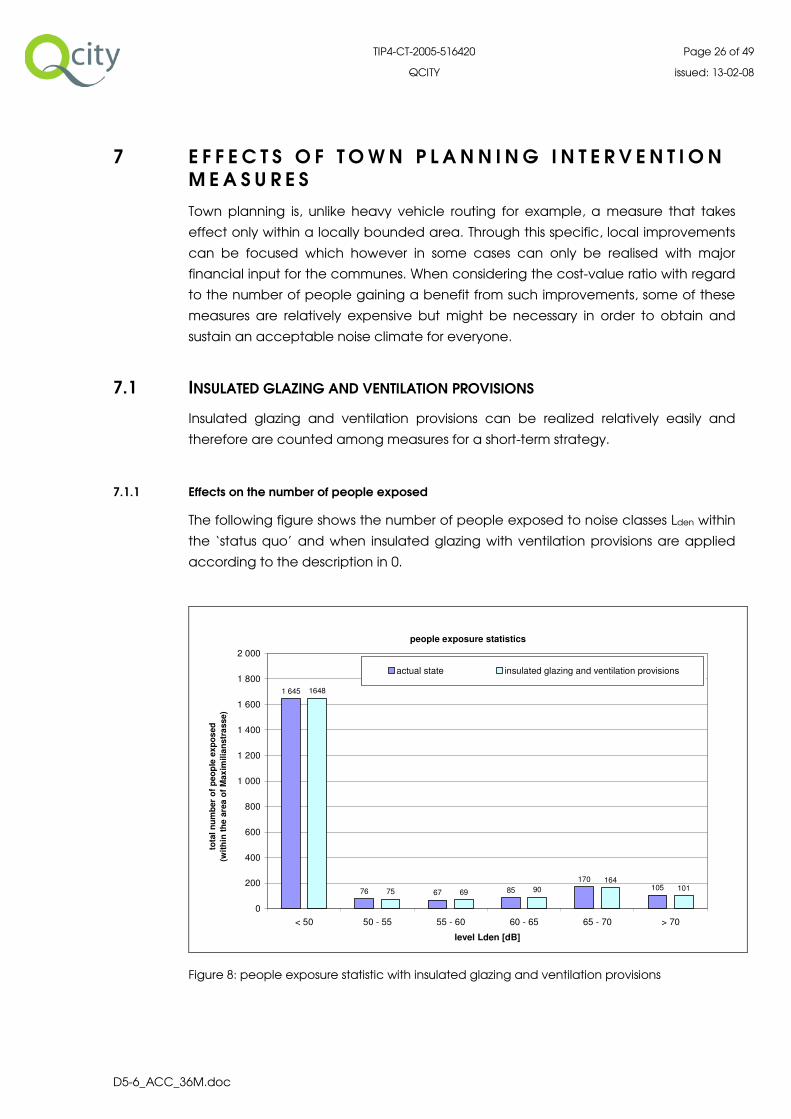
7.1.1 Effects on the number of people exposed
The following figure shows the number of people exposed to noise classes Lden within
the ‘status quo’ and when insulated glazing with ventilation provisions are applied
according to the description in 0.
people exposure statistics
1 645
76 67 85
170105
1648
75 69 90
164101
0
200
400
600
800
1 000
1 200
1 400
1 600
1 800
2 000
< 50 50 - 55 55 - 60 60 - 65 65 - 70 > 70
level Lden [dB]
tota
l n
um
ber
of
peo
ple
exp
os
ed
(wit
hin
th
e a
rea o
f M
ax
imilia
nstr
asse)
actual state insulated glazing and ventilation provisions
Figure 8: people exposure statistic with insulated glazing and ventilation provisions

TIP4-CT-2005-516420 Page 27 of 49
QCITY issued: 13-02-08
D5-6_ACC_36M.doc
As one can see not much is changing within this diagram. This is, because only the
people living close to the street are affected by high levels in the first place (the
status quo) and it is only those people that claim for compensation in the form of
insulated glazing. This however means that only a small number or people gain
benefit from this particular measure. On top of this the effect on the Lden level is
relatively small as the measure only has an effect during the night time period (see.
0). Therefore not much can be identified within an interval of 5 dB (which is the
standard size of noise intervals for noise mapping according to Directive
2002/49/EC). Within the night time period however the effect is that there are no
persons exposed to high levels anymore. For this reason the target achievement
could still be regarded as of high-value as it is the night time that is important for
healthy sleep and a higher quality of life.
7.1.2 Effects on the Noise Score
As Table 1 shows the Noise Score within the example situation at the
Maximilianstrasse could be reduced to 43.7 % of its value, when insulated glazing
and ventilation provisions are applied.
Table 1: Effects on the Noise Score with insulated glazing and ventilation provisions
actual state
insulated glazing and ventilation provisions
absolute percentaged
2.281.191 100 %
Noise Score
996.466 43.7 %
Although the total amount of people in the noise classes does not change much the
Noise Score shows a drastic change. This is because the Noise Score is dominated by
high values of Lden (see 5.3). Therefore even small changes at the higher values can
have a significant effect on the Noise Score (every change of 1 dB doubles the
Noise Score).
7.1.3 Costs of the insulated glazing and ventilation provisions
As described in 0 the costs of insulated glazing and ventilation provisions are about
800 € per person. In this situation 342 people actually live alongside the
Maximilianstrasse and require this measure. Therefore the total costs are 273.600
Euros.
TIP4-CT-2005-516420 Page 28 of 49
QCITY issued: 13-02-08
D5-6_ACC_36M.doc
7.2 SILENT ROAD SURFACE
Changes in road surfacing normally occur when a road is due for maintenance or
complete renewal of the surface. This measure is therefore a medium to long term
strategy.
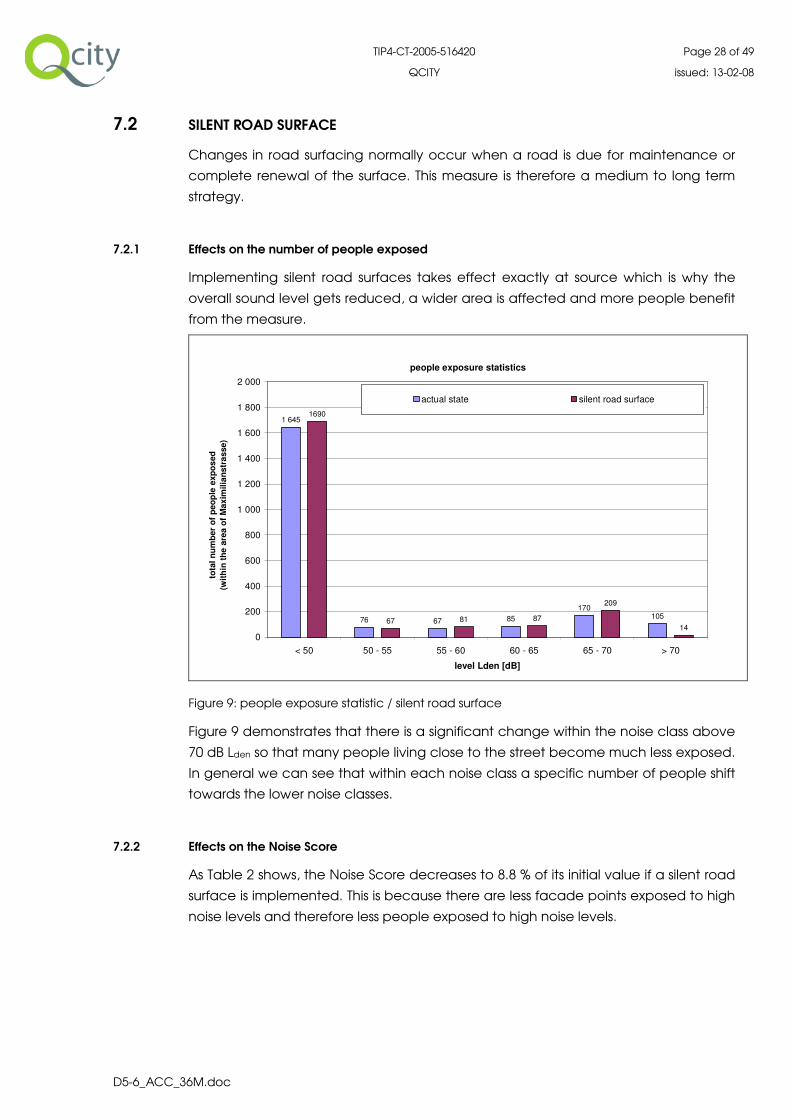
7.2.1 Effects on the number of people exposed
Implementing silent road surfaces takes effect exactly at source which is why the
overall sound level gets reduced, a wider area is affected and more people benefit
from the measure.
people exposure statistics
1 645
76 67 85
170105
1690
67 81 87
209
14
0
200
400
600
800
1 000
1 200
1 400
1 600
1 800
2 000
< 50 50 - 55 55 - 60 60 - 65 65 - 70 > 70
level Lden [dB]
tota
l n
um
ber
of
peo
ple
exp
os
ed
(wit
hin
th
e a
rea o
f M
ax
imilia
nstr
asse)
actual state silent road surface
Figure 9: people exposure statistic / silent road surface
Figure 9 demonstrates that there is a significant change within the noise class above
70 dB Lden so that many people living close to the street become much less exposed.
In general we can see that within each noise class a specific number of people shift
towards the lower noise classes.
7.2.2 Effects on the Noise Score
As Table 2 shows, the Noise Score decreases to 8.8 % of its initial value if a silent road
surface is implemented. This is because there are less facade points exposed to high
noise levels and therefore less people exposed to high noise levels.

TIP4-CT-2005-516420 Page 29 of 49
QCITY issued: 13-02-08
D5-6_ACC_36M.doc
Table 2: Noise Score / silent road surface, actual state
silent road surface
absolute percentaged
2.281.191 100 %
Noise Score
200.439 8.8 %
7.2.3 Costs of the silent road surface
The costs of a silent road surface are dependent on the surface area that needs to
be covered. Within this study the area of investigation has been set relatively small so
that the road length is only 246 meters. When implementing the measure in reality of
course a much longer length of road would have to be covered with special smooth
mastic asphalt as the road is much longer. The width of the road differs between 10
and 15 meters. Accordingly, a width of 13 meters has been chosen. The costs have
been averaged to 40 Euros per square meter. Accordingly the measure in this
example situation would cost 127.920 Euros. Therefore the costs for the
implementation of a silent road surface at the Maximilianstrasse are very high
compared to those of standard asphalt. However, the costs of silent road surface
should not be compared with those of standard asphalt, as the implementation of
silent road surface is much more than building a standard road – it is the
implementation of noise mitigation measures and therefore has to be compared
with the costs of other mitigation measures such as the construction of noise barriers,
tunnels or additional insulated glazing.
7.3 BUILDING LAYOUT WITH NOISE SENSITIVE ROOMS AT QUIET SIDES
Providing a building layout with noise sensitive rooms located on the quiet façade
requires master-planning of new developments and is therefore a medium to long
term strategy.
7.3.1 Effects on the number of people exposed
As mentioned in 6.1.3 it is a theoretical approach to plan all buildings with noise
sensitive rooms on the quiet sides. Nevertheless it is interesting to see what the
maximum potential of this measure is within an example situation.

TIP4-CT-2005-516420 Page 30 of 49
QCITY issued: 13-02-08
D5-6_ACC_36M.doc
people exposure statistics
1 645
76 67 85
170105
1 768
81 80130
6822
0
200
400
600
800
1 000
1 200
1 400
1 600
1 800
2 000
< 50 50 - 55 55 - 60 60 - 65 65 - 70 > 70
level Lden [dB]
tota
l n
um
ber
of
peo
ple
exp
os
ed
(wit
hin
th
e a
rea o
f M
ax
imilia
nstr
asse)
actual state building layout with noise sensitive rooms at quiet side
Figure 10: people exposure statistic / building layout with noise sensitive rooms at quiet sides
Figure 10 shows that there is a significant change within the upper noise classes. The
number of people exposed to levels of Lden > 65 dB decreases from 285 to 90
(-68.4 %). Nevertheless 90 people remain exposed to these high levels because their
buildings do not have any potential for quiet facades and therefore there is no
change for the inhabitants of these buildings.
When comparing this measure in this example situation with the implementation of a
silent road surface, it shows a higher potential for the reduction of noise exposure
(see the diagram in the enclosure).
7.3.2 Effects on the Noise Score
Table 3: Noise Score / building layout with noise sensitive rooms at quiet side, actual state
Building layout with noise sensitive rooms at quiet side
absolute percentaged
2.281.191 100 %
Noise Score 1
1.267.469 55.6 %
1.973.368 100 % Noise Score 2
12.818 0.6 %
1) Noise Score summed up over all buildings
2) Noise Score summed up over all buildings except those without “quiet” facades

TIP4-CT-2005-516420 Page 31 of 49
QCITY issued: 13-02-08
D5-6_ACC_36M.doc
Table 3 shows the Noise Score of the actual state as well as when the measure is
applied. When allocating all inhabitants alongside the quiet facades and scanning
the Noise Score over all buildings, including those that do not have any quiet
facades with levels of Lden <65 dB and Lnight < 55 dB, the Noise Score decreases to
55.6 % of its initial value. This also shows the maximum potential of this measure within
the example situation if no other measures were applied.
When considering the Noise Score, whilst referring to Figure 10, which shows the
number of people exposed, it is noticeable that the Noise Score could still remain
that high. Again this is caused by a few, extremely high noise levels (above 70.0 dB
Lden). However, the most interesting question is how much the Noise Score decreases
if all inhabitants could be allocated to quiet facades so that no person would be
exposed to these extremely high levels? For this reason in a second investigation the
buildings that do not have any quiet facades (seven in total) were blanked out and
the Noise Score of the new ‘status quo’ as well as when the measure is applied was
determined. There was a Noise Score reduction of 99.4 % achieved, see Table 3.
7.4 REORGANISATION / RECONSTRUCTION OF ENTIRE URBAN AREAS
Reconstruction of the entire urban areas can be counted as a measure for a long-
term strategy.
7.4.1 Effects on the number of people exposed
The following diagrams show the effect of the town planning measures on the total
number of people being exposed to an Lden > 65 dB.
Note: The total amount of people within each scenario changes due to the fact that
the amount of residential buildings varies.

TIP4-CT-2005-516420 Page 32 of 49
QCITY issued: 13-02-08
D5-6_ACC_36M.doc
people exposure statistics
9
8
6
8
18
23
10
19
22
11
18
22
10
19
22
10
19
22
0
5
10
15
20
25
30
55 - 60 60 - 65 65 - 70
level Lden [dB]
tota
l n
um
ber
of
peo
ple
exp
os
ed
(wit
hin
red
evelo
pm
en
t are
a)
status quo scenario A scenario B scenario C scenario D scenario E
total inhabitants: 400 695 644 807 1387 940
Figure 11: people exposure statistic within the redevelopment area
Figure 11 shows the upper noise classes between 55 and 70 dB. There are no people
exposed to noise levels above 70 dB. As can be seen each scenario brings a
worsening in the noise classes mentioned, as more people become exposed to
higher noise levels than in the status quo. This is a logical effect when considering the
change of the total number of inhabitants within the entire area which rises from 400
people in the status quo up to 1387 people within scenario D and therefore causes
the area to be more densely populated. However, it is important to consider the
overall effect. Figure 12 shows the effect also for the lower noise classes.

TIP4-CT-2005-516420 Page 33 of 49
QCITY issued: 13-02-08
D5-6_ACC_36M.doc
people exposure statistics
247
13
0
9 8 6
47
2
174
8 18 23
41
3
18
1
10 19
22
557
199
11 18 22
1 0
64
272
10 19
22
698
191
10 19
22
0
100
200
300
400
500
600
700
800
900
1 000
1 100
1 200
1 300
< 50 50 - 55 55 - 60 60 - 65 65 - 70
level Lden [dB]
tota
l n
um
ber
of
peo
ple
exp
ose
d
(wit
hin
red
ev
elo
pm
en
t a
rea
)
status quo scenario A scenario B scenario C scenario D scenario E
total inhabitants: 400 695 644 807 1387 940
Figure 12: people exposure statistic within the redevelopment area
Even though the total amount of people being exposed to high noise levels
increases this should not be overvalued as in each scenario also the number of
people exposed to lower noise levels increases and this change comes about much
stronger. In fact when taking into account the total number of people living within
the area of investigation the overall number of people exposed within scenario D,
for example, rises from 1.4 % to 1.6 % within the high level noise class between 65 and
70 dB. The number of people exposed within the low level noise class below 50 dB
instead rises from 61.8 % to 76.7 %.

TIP4-CT-2005-516420 Page 34 of 49
QCITY issued: 13-02-08
D5-6_ACC_36M.doc
people exposure statistics
61.7
5%
32.6
0%
2.3
3%
1.9
3%
1.4
3%
67
.93
%
25.0
1%
1.2
1%
2.6
0%
3.2
5%
64.0
5%
28
.07
%
1.5
8%
2.9
0%
3.3
9%
68.9
7%
24.6
7%
1.3
5%
2.2
7%
2.7
4%
76. 6
8%
19. 6
1%
0.7
4%
1.3
8%
1.5
9%
74.2
7%
20.2
7%
1.0
9%
2.0
3%
2.3
5%
0.00%
10.00%
20.00%
30.00%
40.00%
50.00%
60.00%
70.00%
80.00%
90.00%
100.00%
< 50 50 - 55 55 - 60 60 - 65 65 - 70
level Lden [dB]
nu
mb
er
of
peo
ple
exp
os
ed
[%
]
(co
mp
are
d t
o t
ota
l am
ou
nt
wit
hin
red
ev
elo
pm
en
t are
a)
status quo scenario A scenario B scenario C scenario D scenario E
Figure 13: people exposure statistic within the redevelopment area
When determining the appropriate level of decision making, additional measures
should also be discussed to take account of those few people being exposed to
high noise levels.
7.4.2 Effects on the Noise Score
As mentioned in 5.3 the Noise Score sums up an overall situation in one single
numerical value. Thus different scenarios become comparable, which is precondi-
tioned on the basis that the calculation is constant. Within the example the total
number of people changes within the different scenarios, which is why the Noise
Score has been scaled on the value “Noise Score per person”.
Figure 14 shows how the Noise Score changes in each scenario. The last bar within
the diagram shows the Noise Score per person within the entire city.

TIP4-CT-2005-516420 Page 35 of 49
QCITY issued: 13-02-08
D5-6_ACC_36M.doc
Noise Score
(summed up within the entire redevelopment area and scaled on
Noise Score per person)
23
63 6653
3146
135
0
20
40
60
80
100
120
140
160
No
ise
Sc
ore
(p
er
pe
rso
n) status quo
scenario A
scenario B
scenario C
scenario D
scenario E
entire city
Figure 14: Noise Score comparison
As one can see in each scenario the Noise Score per person is higher than for the
status quo. Nevertheless, across the board the Noise Score is significantly smaller
than the Noise Score per person within the entire city. Therefore the overall situation
can be regarded as positive as here we have a good concept for an area with
mixed utilisation. On closer examination of the function of the Noise Score we can
see that high levels of Lden can have a dominating effect on the overall value of the
Noise Score. Therefore it is necessary to find out where exactly these high levels
occur so that the situation can be judged more precisely and, if necessary, endemic
measures such as changing the land use, the orientation of sensitive rooms towards
the quiet facades, additional insulation or sound barriers can be implemented. In this
situation the highest noise levels appear alongside the main road B 2.
Figure 15 demonstrates how the Noise Score performs within specific areas (inside
the calculation area):
Noise Score [%]
(aside main road B2)
0%
20%
40%
60%
80%
100%
120%
No
ise S
co
re (
per
pers
on
) status quo
scenario A
scenario B
scenario C
scenario D
scenario E
Figure 15: Noise Score aside road B 2

TIP4-CT-2005-516420 Page 36 of 49
QCITY issued: 13-02-08
D5-6_ACC_36M.doc
It can be seen that alongside the main road B 2, the Noise Score drops in each
scenario compared to the ‘status quo’ although the number of people living in that
area rises from 20 people within the status quo to 80 people in scenarios A to E.
Scenario D performs best of all.
Figure 16 below shows how many people live inside the area of investigation and
how many of them actually live alongside the road B 2. Here we can see that within
scenario D significantly more people live within the area of investigation than in any
other scenario.
number of inhabitants in specific areas within the area of investigation
380
615 564
727
1307
860
80
80
80
80
20
80
0
200
400
600
800
1000
1200
1400
sta
tus q
uo
sce
na
rio
A
sce
na
rio
B
sce
na
rio
C
sce
na
rio
D
sce
na
rio
E
nu
mb
er
of
inh
ab
ita
nts
alongside B2
aside B2
Figure 16: number of inhabitants in specific areas within the area of investigation

TIP4-CT-2005-516420 Page 37 of 49
QCITY issued: 13-02-08
D5-6_ACC_36M.doc
Noise Score [%]
(alongside main road B2)
0%
20%
40%
60%
80%
100%
120%
140%
No
ise S
co
re (
per
pers
on
) status quo
scenario A
scenario B
scenario C
scenario D
scenario E
Figure 17: Noise Score alongside road B 2
The Noise Score per person alongside the main road B 2 in each scenario is higher
than at status quo. This however derives from the fact, that in each of the five
scenarios more people live alongside the road than at status quo (see Figure 16)
and from the fact, that the value of a noise level (especially with high levels) has a
greater weighting than the number of people. Given that any of the five scenarios
would be implemented, additional endemic measures alongside the road B 2 would
be scheduled. Therefore the Noise Score has also been calculated assuming an
additional insulation of 10 dB caused by passive noise reduction measures (insulated
glazing).
Noise Score [%]
(alongside main road B2 - with additional insulation -10dB)
0%
20%
40%
60%
80%
100%
120%
No
ise S
co
re (
per
pers
on
) status quo
scenario A
scenario B
scenario C
scenario D
scenario E
Figure 18: Noise Score alongside road B 2 with sound barrier –10 dB
Figure 18 above demonstrates that in each scenario the newly calculated Noise
Score is up to approx. 30 % lower than in the status quo because of the additional
10 dB reduction caused by insulated glazing.

TIP4-CT-2005-516420 Page 38 of 49
QCITY issued: 13-02-08
D5-6_ACC_36M.doc
The diagram below shows the Noise Score value of the overall situation inside the
redevelopment area when there are additional insulation measures implemented at
buildings alongside the road B 2. Here scenario D performs best, its Noise Score drops
to about 55 % of its initial value.
Noise Score [%] within entire redevelopment area
with additional insulation -10dB alongside road B2
0%
20%
40%
60%
80%
100%
120%
No
ise S
co
re (
per
pers
on
) status quo
scenario A
scenario B
scenario C
scenario D
scenario E
Figure 19: Noise Score with sound barrier / entire redevelopment area
7.4.3 Recreational quality of parks
As expounded in 5.4 the recreational quality of parks is hard to measure. Therefore a
diagram has been created that combines three different parameters which can be
assumed to have a major influence on the recreation quality of parks. In the
diagram the axis of abscissas shows the average area with Lden < 55 dB that is at
each person’s disposal while the axis of ordinates gives the average sound level Lden
within the park. This means that the quality of a park is higher the more the mark is
down to the right. The size of the mark expresses the potential number of people that
could make use of the park. In the diagram the three town planning scenarios of the
redevelopment area No. 8 which actually have green corridors that can be
regarded as parks are compared to three already existing parks within Augsburg. As
one can see in all scenarios of the redevelopment area the average noise level Lden
inside the parks are below 50 dB and therefore very tranquil. The average area with
Lden < 55 dB at each person’s disposal differs from less than 4 m²/person up to about
13 m²/person. Comparing the potential number of people entering the park
scenario E called “Hettenbachpark” brings the biggest effect (compared to
scenario C and D) as here up to approx. 2700 people would make use of the park.
The Gögginger Park of Augsburg is exposed to higher levels of Lden and only very few
people would potentially make use of the park, but the people actually using the
park do have quite a big and quiet area for their availability. The biggest park within
this investigation is the “Wittelsbacher Park” which potentially 4067 people would
make use of and each person would on average have 23 m² of quiet area for

TIP4-CT-2005-516420 Page 39 of 49
QCITY issued: 13-02-08
D5-6_ACC_36M.doc
themselves. However the overall sound level of this park is higher with approx.
58.7 dB (max. 70.2 – see also table 4 in Annex A). Therefore the overall situation within
the scenarios of the redevelopment area can be regarded as very satisfactory.
Scenarios D and E probably are to be preferred before scenario C.
recreation quality of parks
40.0
45.0
50.0
55.0
60.0
65.0
0.0 5.0 10.0 15.0 20.0 25.0 30.0
m²/inhabitant
lev
el L
de
n
(av
era
ge w
ith
in t
he
park
)
Prinz-Karl-Park
Gögginger Park
Wittelsbacher Park
scenario C
scenario D
scenario E "Hettenbachpark"
assumed number
of people entering
the park
3958
1402
4067
1985
2612
2688
Figure 20: Recreation quality of parks

TIP4-CT-2005-516420 Page 40 of 49
QCITY issued: 13-02-08
D5-6_ACC_36M.doc
8 C O N C L U S I O N
All measures investigated do have advantages and disadvantages alike. Often the
costs of the measures are their biggest disadvantage. Therefore it is not that easy to
choose between one or another measure. Instead the best choice will often be a
combination of different measures.
When hot spots are determined and there is an acute need for action, short-term
strategies are sensible and effective.
If new residential areas are developed or the reconstruction of an area is addressed
in the context of city beautification, measures like the planning of buildings with
noise sensitive rooms at quiet sides and the redevelopment of entire blocks with the
construction of parks etc. should be considered in order to avoid or reduce the
effects of noise exposure. The present study shows that there are quite some
attractive and efficient possibilities to do so.
Within this investigation about the construction of the redevelopment area No. 8
scenario D especially distinguishes itself from the other scenarios, since here factual
the number of people exposed to high levels does not increase, compared to the
other scenarios however the total number of people living within the redevelopment
area is by far the highest. At the same time a large number of people (above the
total number of inhabitants within the redevelopment area) gain access to a green
area with a quite large area for each person’s disposal and low noise levels.
Nevertheless alongside the main road B 2 additional endemic measures such as
silent road surface, noise barriers or insulated glazing are necessary in order to
protect the few people highly exposed. The question as to whether such a big
number of apartments is necessary would of course have to be clarified in the first
place. The fundamental question is ‘Are cities without conflicts realisable?’ and this
cannot be readily answered. In general it is possible but costly, using extensive
measures or measures with a strong impact on the traffic. A reasonable cost-benefit
ratio can be reached with the combination of different measures and limited effort
for the city as well as owners of property, if the costs of the measures accrue to both
parties.
In the long run a sustainable, positive development can be realised through the
implementation of a mixed utilisation.

TIP4-CT-2005-516420 Page 41 of 49
QCITY issued: 13-02-08
D5-6_ACC_36M.doc
9 A N N E X A
9.1 MAXIMILIANSTRASSE
Following diagram gives an overview of the effect of the investigated noise
mitigation measures, in comparison to each other, on the number of people
exposed within the area of “Maximilianstrasse”
people exposure statistics
1 645
76 67 85
170105
1648
75 69 90
164101
1690
67 81 87
209
14
1 768
81 80130
6822
0
200
400
600
800
1 000
1 200
1 400
1 600
1 800
2 000
< 50 50 - 55 55 - 60 60 - 65 65 - 70 > 70
level Lden [dB]
tota
l n
um
ber
of
peo
ple
exp
os
ed
(wit
hin
th
e a
rea o
f M
ax
imilia
nstr
asse)
actual state
insulated glazing and ventilation provisions
silent road surface
building layout with noise sensitive rooms at quiet side
Figure 21: Effect of the investigated noise mitigation measures

TIP4-CT-2005-516420 Page 42 of 49
QCITY issued: 13-02-08
D5-6_ACC_36M.doc
The diagram below demonstrates the cost-benefit ratio of the two investigated
measures, whose costs could be determined. The axis of abscissa shows the
reduction of the initial Noise Score of the status quo when the corresponding
measure is applied, the axis of ordinates give the corresponding costs. The diameter
of the mark shows the cost-benefit ratio.
cost-benefit ratio of measures within examplary situation at
Maximilianstrasse
4.70 [∆ NS/€]
16.27 [∆ NS/€]
0
50000
100000
150000
200000
250000
300000
0 500000 1000000 1500000 2000000 2500000
∆ Noise Score
co
sts
[€]
insulated glazing and ventilation provisions silent road surface
Figure 22: Cost-benefit ratio of the two investigated measures

TIP4-CT-2005-516420 Page 43 of 49
QCITY issued: 13-02-08
D5-6_ACC_36M.doc
9.2 REDEVELOPMENT AREA NO. 8
Quality of parks within the redevelopment area No. 8:
Table 4: Comparison of existing and planned parks in Augsburg
name total area number of area < 55 dB ("Quiet Area") noise level Lden
inhabitants min average max
[ha] [%] [ha] [m²/inhabitant] [dB] [dB] [dB]
status quo 0 - - - - - - -
scenario A 0 - - - - - - -
scenario B 0 - - - - - - -
scenario C 0.8 1 985 100 % 0.8 4.0 46.6 48.0 51.4
scenario D 0.7 2 612 100 % 0.7 2.7 46.1 47.6 53.0
scenario E "Hettenbachpark"
3.4 2 688 100 % 3.4 12.6 42.4 49.2 53.6
Prinz-Karl-Park 1.7 3 958 100 % 1.7 4.3 45.6 48.3 52.9
Gögginger Park 4.5 1 402 60 % 2.7 19.1 45.7 56.7 68.1
Wittelsbacher Park
15.0 4 067 63 % 9.4 23.1 47.7 58.7 70.2
In the following there are the original maps of the different town planning scenarios
of Augsburg created by “Baur & Deby, Architekten & Stadtplaner” presented. The
original maps are in German which is why there is a translation into English at first.

TIP4-CT-2005-516420 Page 44 of 49
QCITY issued: 13-02-08
D5-6_ACC_36M.doc
9.2.1 Land utilisation – status quo
Figure 23: Widely spread industrial area with extensive soil sealing

TIP4-CT-2005-516420 Page 45 of 49
QCITY issued: 13-02-08
D5-6_ACC_36M.doc
9.2.2 Land utilisation – scenario A
Figure 24: Mixed area with industrial real estate and residential areas

TIP4-CT-2005-516420 Page 46 of 49
QCITY issued: 13-02-08
D5-6_ACC_36M.doc
9.2.3 Land utilisation – scenario B
Figure 25: Mixed Old industrial areas are transformed into cultural areas with art galleries
Maximum on industrial (offices) land-use

TIP4-CT-2005-516420 Page 47 of 49
QCITY issued: 13-02-08
D5-6_ACC_36M.doc
9.2.4 Land utilisation – scenario C
Figure 26: Old industrial areas are transformed into cultural areas with art galleries and
residential areas Similar to scenario B with compressed living areas

TIP4-CT-2005-516420 Page 48 of 49
QCITY issued: 13-02-08
D5-6_ACC_36M.doc
9.2.5 Land utilisation – scenario D
Figure 27: Old industrial areas are mainly transformed into residential areas Maximum on
residential land-use

TIP4-CT-2005-516420 Page 49 of 49
QCITY issued: 13-02-08
D5-6_ACC_36M.doc
9.2.6 Land utilisation – scenario E
Figure 28: Old industrial areas are mainly transformed into parks and residential areas,
Maximum on green area