D. J. OSTI B. C. Azevedo February 22,1996
19
F Wall Surveyor Project Report D. J. Mullenhoff B. C. Johnston S. G. Azevedo February 22,1996 ECEIVEB MAY 3 0 1996 OSTI .-
Transcript of D. J. OSTI B. C. Azevedo February 22,1996
F
Wall Surveyor Project Report
D. J. Mullenhoff B. C. Johnston S. G. Azevedo
February 22,1996
ECEIVEB MAY 3 0 1996 O S T I
. -
DISCLAIMER
This document was prepared as an account of work sponsored by an agency of the United States Government. Neither the United States Government nor the University of California nor any of their employees,makesany warranty, express or implied, or assumes any legal liability or responsibility for the accuracy, completeness, or usefulness of any information, apparatus, producf or process disclosed, or represents that its use would not infringe privately owned rights. Reference herein to any specific commerdal produds, process, or service by trade name, trademark, manufacturer, or otherwise, does not necessarily constitute or imply its endorsement, recommendation,or favoring by theUnitedStatesGovernment or theUniversityofCalifornia. The viewsand opinions of authors expressed herein do not necessarily state or reflect thoseof the United States Government or the University of California, and shall not be used for advertising or product endorsement purposes.
This report has been reproduced directly from the best available copy.
Available to DOE and DOE contractors from the Office of Scientific and Technical Information
P.O. Box 62, Oak Ridge, TN 37831 Prices available from (615) 576-8401, FlS 626-8401
Available to the public from the National Technical Information Service
US. Department of Commerce 5285 Port Royal Rd.,
Springfield, VA 22161
d
,
a
Wall Surveyor Project Report
Donald J. Mullenhoff Brooks C . Johnston Stephen G. Azevedo
University of California Lawrence Livermore National Laboratory
Livermore, CA 94550 P.O. BOX 808, L-495
I 22 February 1996 I
Introduction
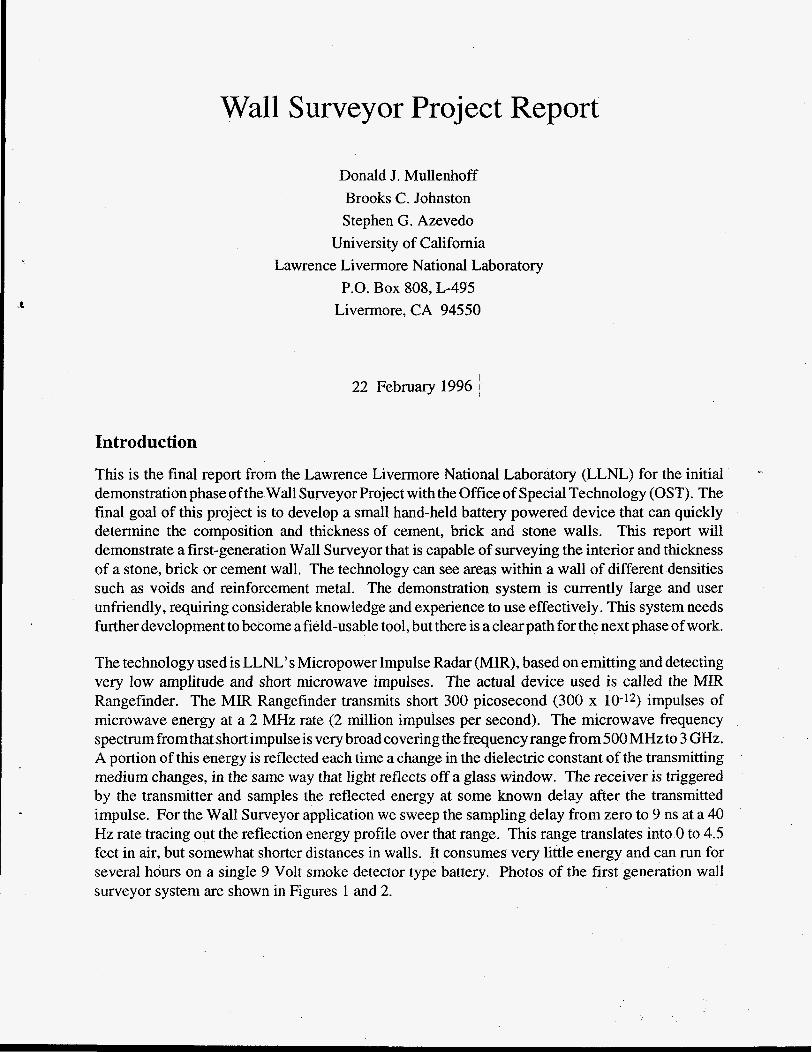
This is the final report from the Lawrence Livermore National Laboratory (LLNL) for the initial demonstration phase of the Wall Surveyor Project with the Office of Special Technology (OST). The final goal of this project is to develop a small hand-held battery powered device that can quickly determine the composition and thickness of cement, brick and stone walls. This report will demonstrate a first-generation Wall Surveyor that is capable of surveying the interior and thickness of a stone, brick or cement wall. The technology can see areas within a wall of different densities such as voids and reinforcement metal. The demonstration system is currently large and user unfriendly, requiring considerable knowledge and experience to use effectively. This system needs further development to become a field-usable tool, but there is a clear path for the next phase of work.
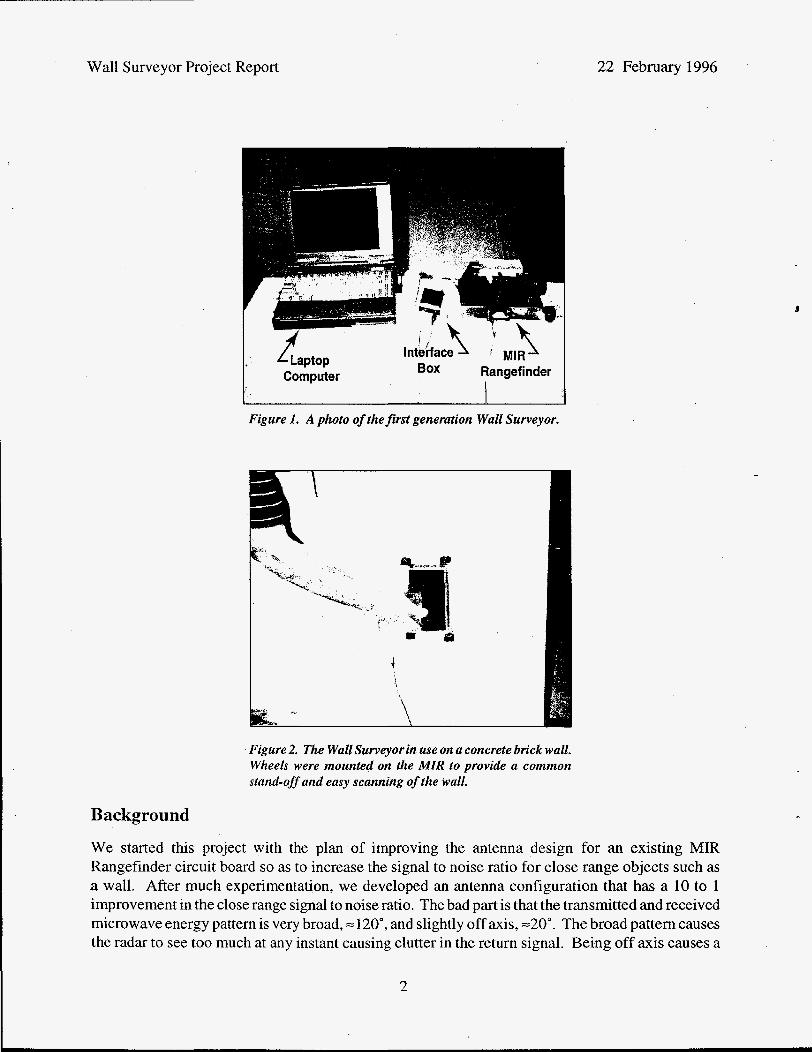
The technology used is LLNL’s Micropower Impulse Radar (MIR), based on emitting and detecting very low amplitude and short microwave impulses. The actual device used is called the MIR Rangefinder. The MIR Rangefinder transmits short 300 picosecond (300 x 10-12) impulses of microwave energy at a 2 MHz rate (2 million impulses per second). The microwave frequency spectrum from that short impulse is very broad covering the frequency range from 500 MHz to 3 GHz. A portion of this energy is reflected each time a change in the dielectric constant of the transmitting medium changes, in the same way that light reflects off a glass window. The receiver is triggered by the transmitter and samples the reflected energy at some known delay after the transmitted impulse. For the Wall Surveyor application we sweep the sampling delay from zero to 9 ns at a 40 Hz rate tracing out the reflection energy profile over that range. This range translates into 0 to 4.5 feet in air, but somewhat shorter distances in walls. It consumes very little energy and can run for several hours on a single 9 Volt smoke detector type battery. Photos of the first generation wall surveyor system are shown in Figures 1 and 2.
Wall Surveyor Project Report 22 February 1996
Box Rangef inder i
L a p t o p Computer
Figure I . A photo of thefirst generation Wall Surveyor.
Figure 2. The Wall Surveyor in use on a concrete brick wall. Wheels were mounted on the MIR to provide a common stand-off and easy scanning of the wall.
Background
We started this project with the plan of improving the antenna design for an existing MIR Rangefinder circuit board so as to increase the signal to noise ratio for close range objects such as a wall. After much experimentation, we developed an antenna configuration that has a 10 to 1 improvement in the close range signal to noise ratio. The bad part is that the transmitted and received microwave energy pattern is very broad, =120", and slightly off axis, =20". The broad pattern causes the radar to see too much at any instant causing clutter in the return signal. Being off axis causes a
2
Wall Surveyor Project Report 22 February 1996
reduction in amplitude of the return signal. New printed circuit boards with the transmitter and receiver physically separated are required to make the antennas to narrow that pattern and bring them on axis. Some experimentation was done with dielectrics and microwave lensing, which could be continued with new circuit boards in the nest phase of this project.
Originally we decided the display would be a small Liquid Crystal Display (LCD) attached to the radar with a scope-like trace of the radar return sweep. After a review with Robert Wieting it was decided that the raw scope-like trace would be too hard for the untrained eye to interpret and that some form of data processing on the return signal is needed. A Twinhead Slimnote 5100s notebook computer was then purchased. It has two PCMCIA slots, an internal hard drive and a color LCD display. A National Instruments DAQ-700 PCMCIA data acquisition card was also purchased and installed into one of the PCMCIA slots. An adapter cable was constructed to interface the DAC-700 card to the radar. The computer runs a Unix operating system called Linux, and has a graphical user interface built on the X-window standards. The software that runs the radar and display data is called RTD, the real-time display. This software operates the National Instruments DAQ-700 PCMCIA card and displays data in real time on the LCD screen.
RTD works in two distinct modes: oscilloscope and waterfall. In oscilloscope mode, the most current range line is displayed in the same fashion as an oscilloscope. In waterfall mode (as in Figures 9 through 1 3 , many range lines are presented side by side to form a 'two dimensional image. The vertical direction represents range (into the wall) and the horizontal direction represents the time of the sweep (location on the wall). The intensities of each point are represented by colors corresponding to the selected colormap. (The display continuously cycles through the screen image, wrapping back to the origin when the image is full.) As a new range line is acquired by the computer it replaces the oldest range line on the display. The new and old data are separated by a white vertical line with the most recent data on the left and the old data to the right. Waterfall mode has a background subtract option which removes the unwanted background signals, creating a display with only the desired features. The background subtraction option has a second option called wall alignment. The alignment option is an effort to compensate for the changes in radar distance back from the first surface of the wall. (See the Computer Operation Section below for more details.)
1
Test Results
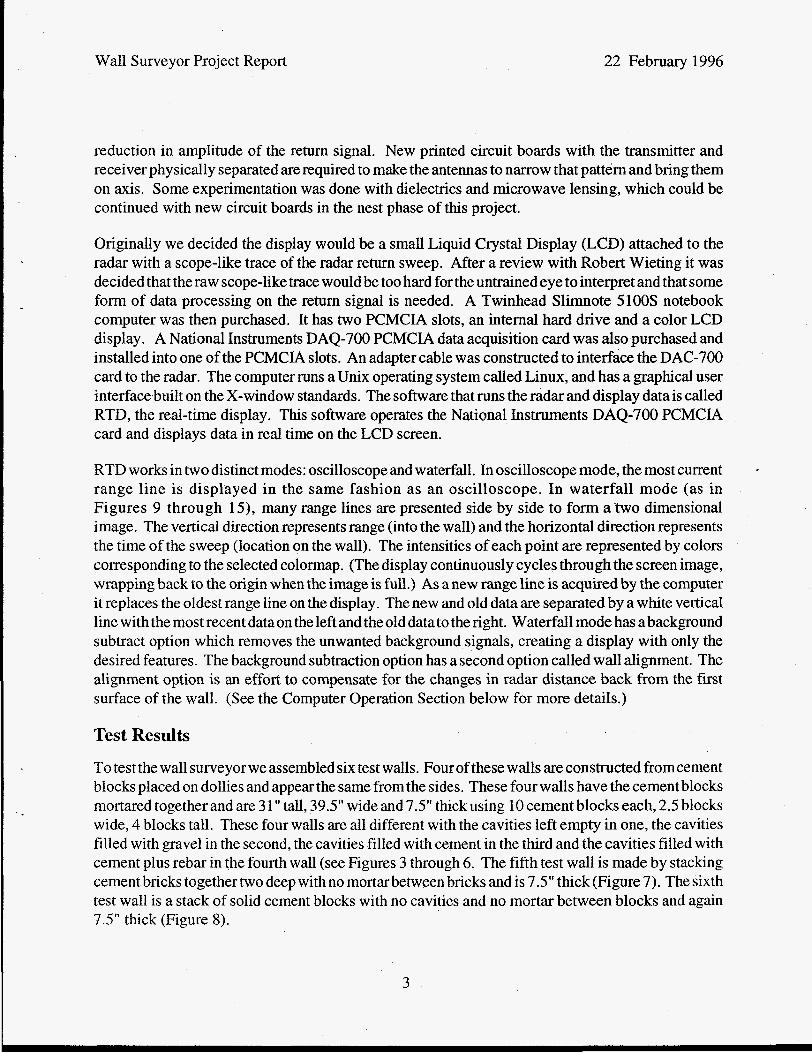
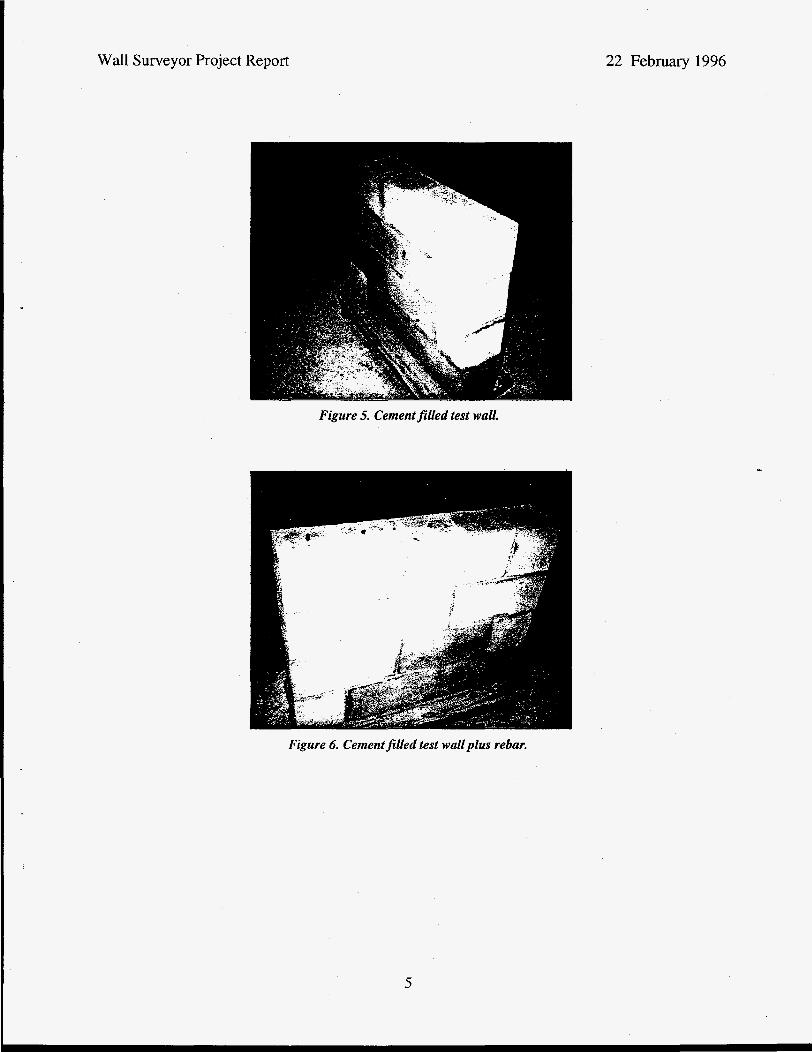
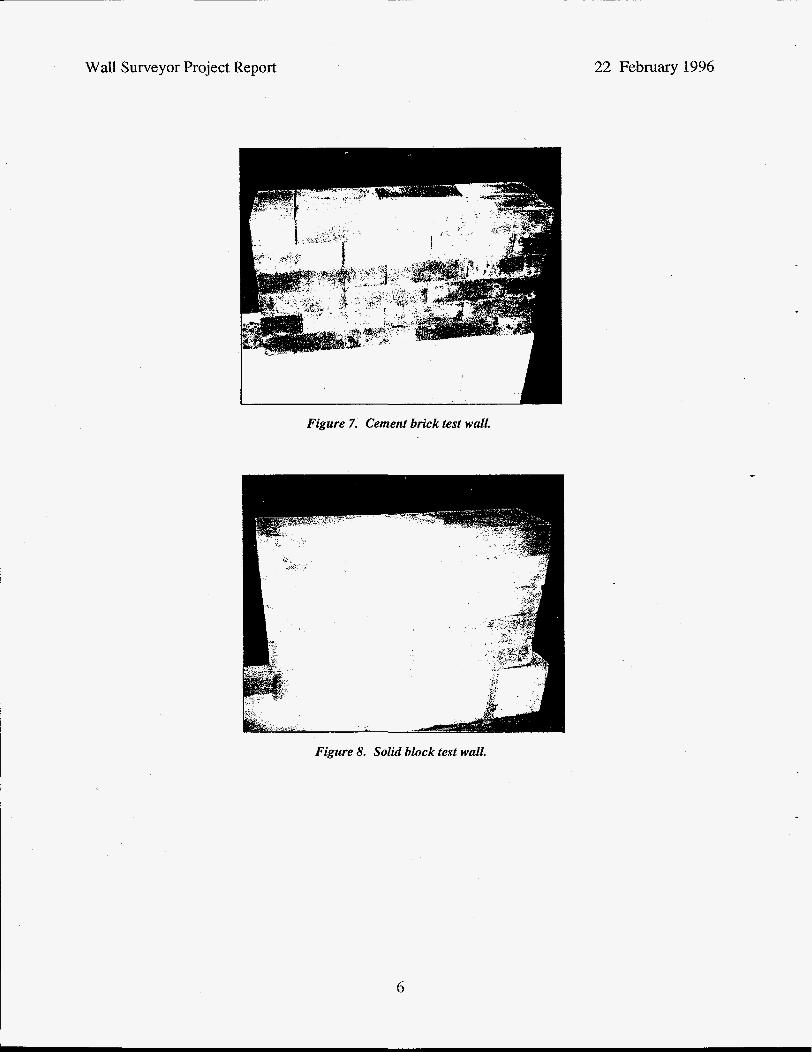
To test the wall surveyor we assembled six test walls. Four of these walls are constructed fromcement blocks placed on dollies and appear the same from the sides. These four walls have the cement blocks mortared together and are 3 1" tall, 39.5" wide and 7.5" thick using 10 cement blocks each, 2.5 blocks wide, 4 blocks tall. These four walls are all different with the cavities left empty in one, the cavities filled with gravel in the second, the cavities filled with cement in the third and the cavities filled with cement plus rebar in the fourth wall (see Figures 3 through 6. The fifth test wall is made by stacking cement bricks together two deep with no mortar between bricks and is 7.5" thick (Figure 7). The sixth test wall is a stack of solid cement blocks with no cavities and no mortar between blocks and again 7.5" thick (Figure 8).
3

Wall Surveyor Project Report 22 February 1996
Figure 3. Empty cement block test wall.
Figure 4. Gravel filled test wall.
4
Wall Surveyor Project Report
Figure 5. Cement filled test wall.
1 I
22 February 1996
...
Figure 6. Cement filled test wall plus rebar.
5
22 February1996 Wall Surveyor Project Report
I
Figure 7. Cement brick test wall.
Figure 8. Solid block test wall.
6
Wall Surveyor Project Report 22 February 1996
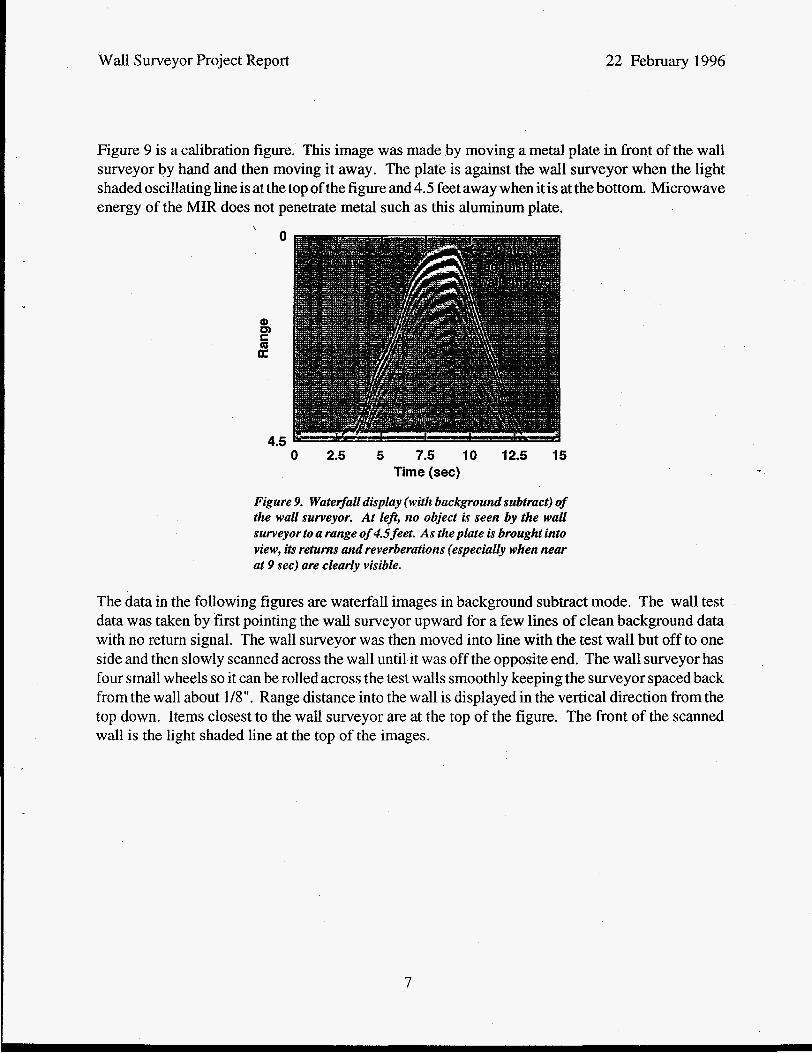
Figure 9 is a calibration figure. This image was made by moving a metal plate in front of the wall surveyor by hand and then moving it away. The plate is against the wall surveyor when the light shaded oscillating line is at the top of the figure and 4.5 feet away when it is at the bottom. Microwave energy of the MIR does not penetrate metal such as this aluminum plate.
0
4 .5 0 2.5 5 7.5 10 12.5 15
Time (sec)
Figure 9. Waterfalr display (with background subtract) of the wall surveyor. At le$, no object i y seen by the wall surveyorto a range of 4.5 feet. As the plate is brought into view, its returns and reverberations (especially when near at 9 sec) are clear& visible.
The data in the following figures are waterfall images in background subtract mode. The wall test data was taken by first pointing the wall surveyor upward for a few lines of clean background data with no return signal. The wall surveyor was then moved into line with the test wall but off to one side and then slowly scanned across the wall until it was off the opposite end. The wall surveyor has four small wheels so it can be rolled across the test walls smoothly keeping the surveyor spaced back from the wall about 1/8". Range distance into the wall is displayed in the vertical direction from the top down. Items closest to the wall surveyor are at the top of the figure. The front of the scanned wall is the light shaded line at the top of the images.
7
Wall Surveyor Project Report 22 February1996
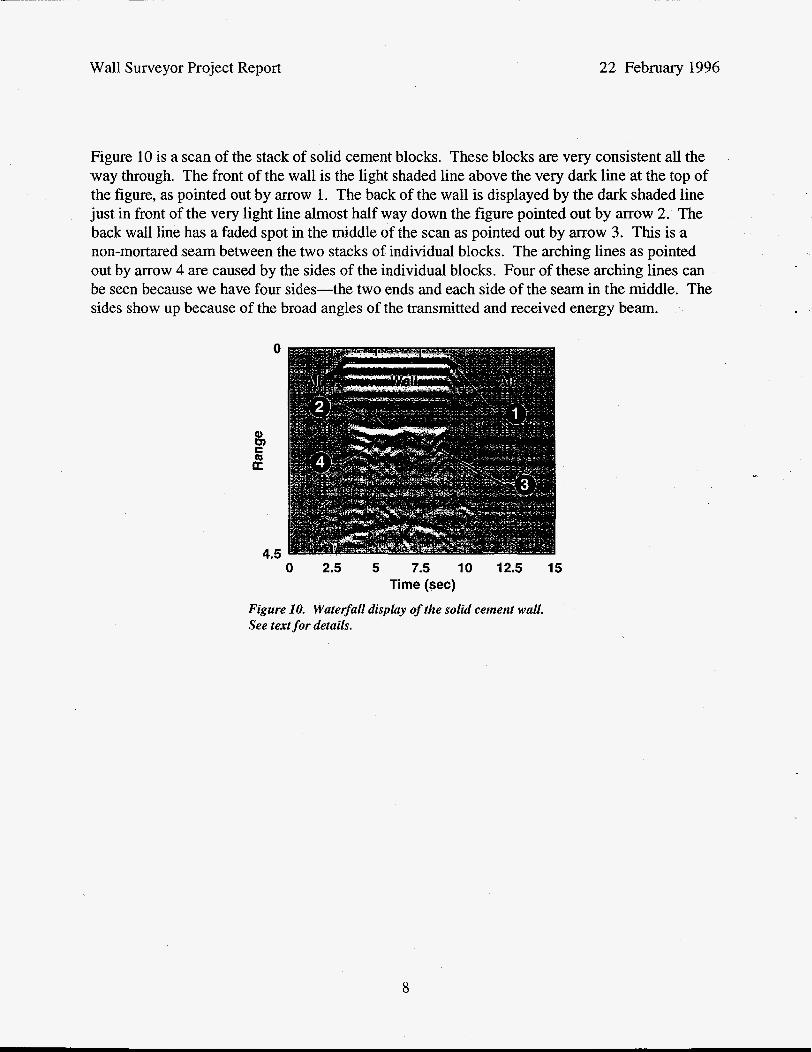
Figure 10 is a scan of the stack of solid cement blocks. These blocks are very consistent all the way through. The front of the wall is the light shaded line above the very dark line at the top of the figure, as pointed out by arrow 1. The back of the wall is displayed by the dark shaded line just in front of the very light line almost half way down the figure pointed out by arrow 2. The back wall line has a faded spot in the middle of the scan as pointed out by arrow 3. This is a non-mortared seam between the two stacks of individual blocks. The arching lines as pointed out by arrow 4 are caused by the sides of the individual blocks. Four of these arching lines can be seen because we have four sides-the two ends and each side of the seam in the middle. The sides show up because of the broad angles of the transmitted and received energy beam.
0
4.5 ’ 0 2.5 5 7.5 10 12.5
Time fsec) Figure 10. Wategall display of the solid cement wall. See text for detuils.
8
Wall Surveyor Project Report 22 February 1996
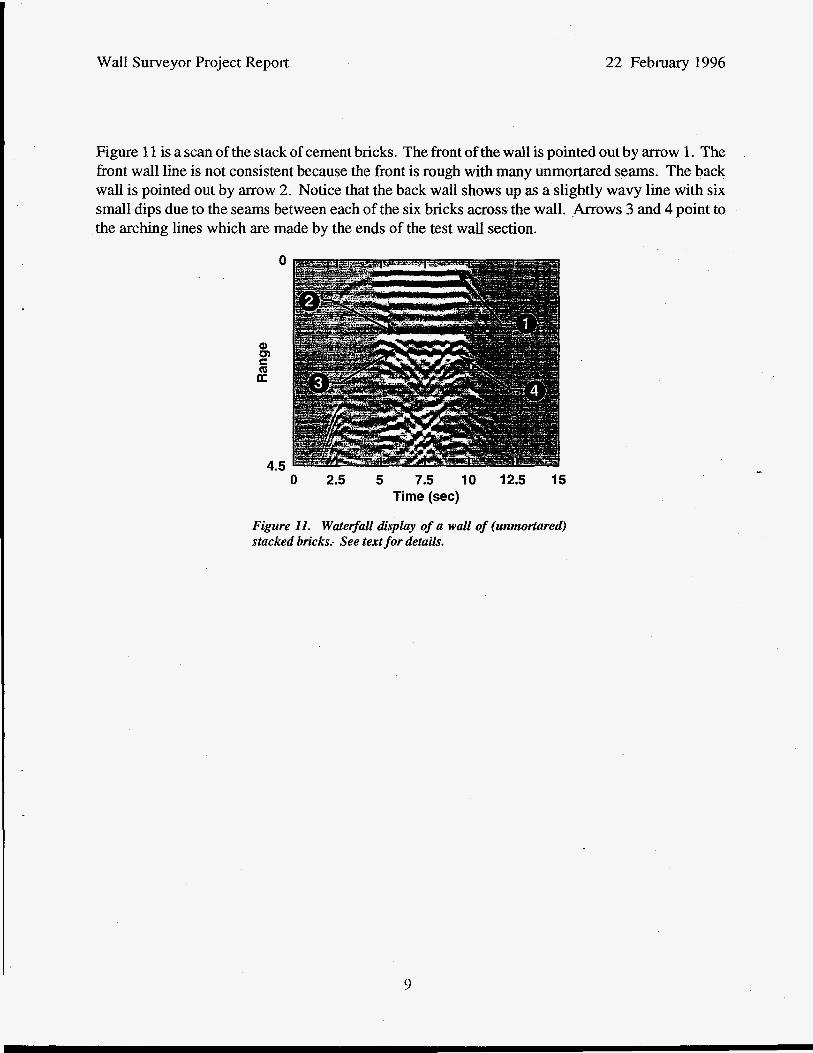
Figure 1 1 is a scan of the stack of cement bricks. The front of the wall is pointed out by arrow 1. The front wall line is not consistent because the front is rough with many unmortared seams. The back wall is pointed out by arrow 2. Notice that the back wall shows up as a slightly wavy line with six small dips due to the seams between each of the six bricks across the wall, Arrows 3 and 4 point to the arching lines which are made by the ends of the test wall section.
0 2.5 5 7.5 10 12.5 15 Time (sec)
Figure 11. Wate$all display of a wall of (unmortared) stacked bricks.. See text for details.
9
Wall Surveyor Project Report 22 February 1996
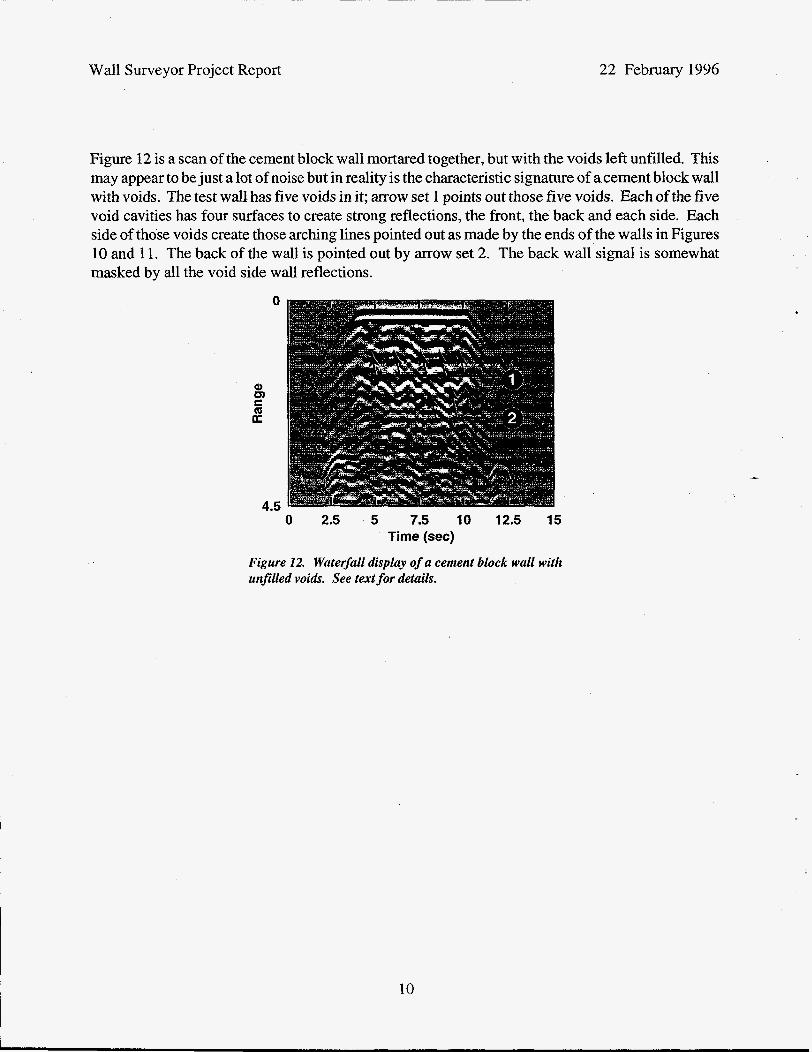
Figure 12 is a scan of the cement block wall mortared together, but with the voids left unfilled. This may appear to be just a lot of noise but in reality is the characteristic signature of acement block wall with voids. The test wall has five voids in it; m o w set 1 points out those five voids. Each of the five void cavities has four surfaces to create strong reflections, the front, the back and each side. Each side of those voids create those arching lines pointed out as made by the ends of the walls in Figures 10 and 11. The back of the wall is pointed out by arrow set 2. The back wall signal is somewhat masked by all the void side wall reflections.
0
7.5 10 12.5 15 Time (sec)
Figure 12. Waterfall display of a cement block wall with unfilled voids. See text for details.
10
Wall Surveyor Project Report 22 February 1996
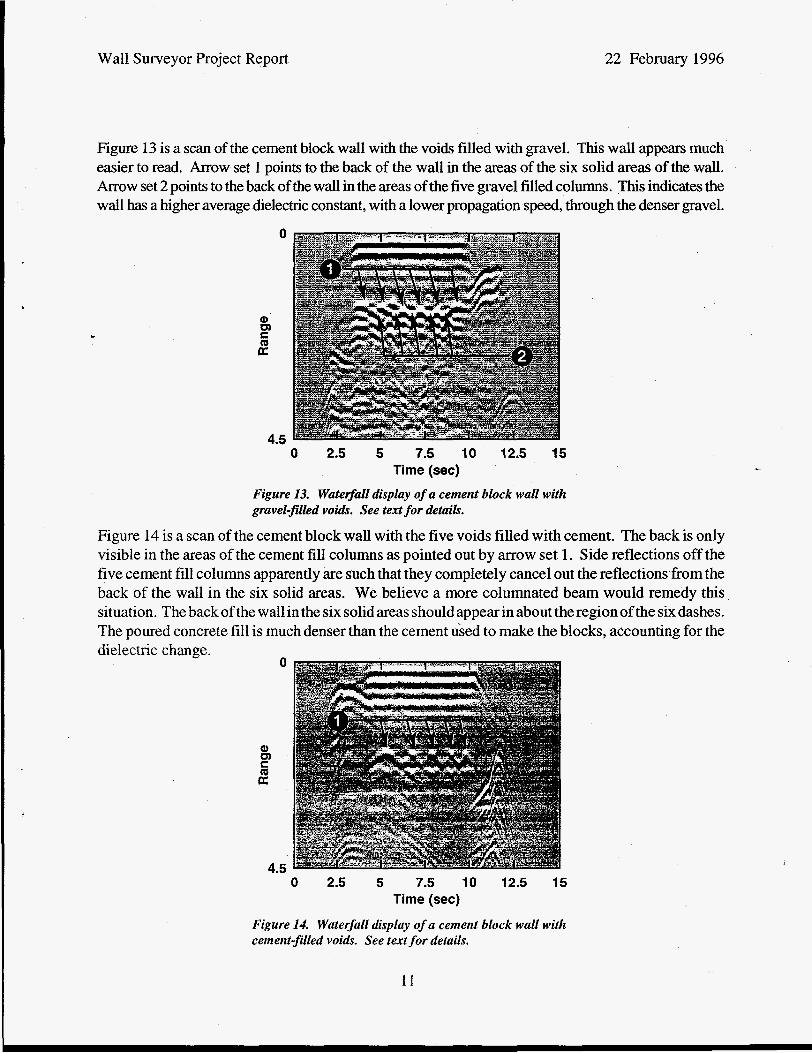
Figure 13 is a scan of the cement block wall with the voids filled with gravel. This wall appears much easier to read. Arrow set 1 points to the back of the wall in the areas of the six solid areas of the wall. Arrow set 2 points to the back of the wall in the areas of the five gravel filled columns. This indicates the wall has a higher average dielectric constant, with a lower propagation speed, through the denser gravel.
Q) m C
d
0 2.5 5 7.5 10 12.5 15 Time (sec)
Figure 13. Wateflall display of a cement block wall with gravel-filed voids. See text for &tuik.
Figure 14 is a scan of the cement block wall with the five voids filled with cement. The back is only visible in the areas of the cement fill columns as pointed out by arrow set 1. Side reflections off the five cement fill columns apparently are such that they completely cancel out the reflections from the back of the wall in the six solid areas. We believe a more columnated beam would remedy this situation. The back of the wall in the six solid areas should appear in about the region of the six dashes. The poured concrete fill is much denser than the cement used to make the blocks, accounting for the dielectric change.
0
Q) m C
I?
4.5 0 2.5 5 7.5 10 12.5 15
Time (sec)
Figure 14. Wategall display of a cement block wall with cement-filed voids. See text for details.
11
Wall Surveyor Project Report 22 February 1996
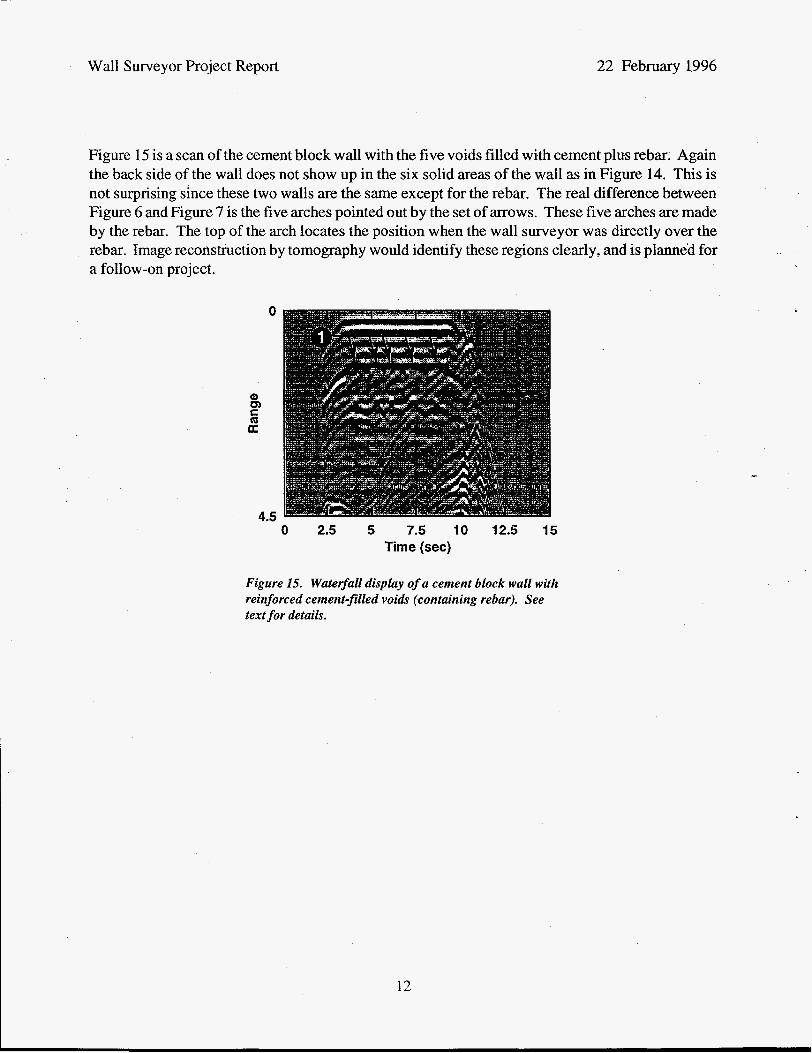
Figure 15 is a scan of the cement block wall with the five voids filled with cement plus rebar. Again the back side of the wall does not show up in the six solid areas of the wall as in Figure 14. This is not surprising since these two walls are the same except for the rebar. The real difference between Figure 6 and Figure 7 is the five arches pointed out by the set of arrows. These five arches are made by the rebar. The top of the arch locates the position when the wall surveyor was directly over the rebar. Image reconstruction by tomography would identify these regions clearly, and is planned for a follow-on project.
0 2.5 5 7.5 10 12.5 15 Time (sec)
Figure 15. Watefall display of a cement block wall with reinforced cement-filed voids (containing rebar). See text for details.
Wall Surveyor Project Report 22 February 1996
System Operation This section is a short tutorial on operating the MIR Wall Surveyor and computer.
Open the laptop computer by sliding the latches on each side of the lid (display) towards you while hinging the display open. Tilt the display back for easy visibility. To complete the setup, plug the DAQ-700 card into one of the PCMCIA slots on the right hand side of the computer. Make sure the MIR Rangefinder is plugged into the DAC-700 card. A ribbon cable plugs into the DAQ-700 card, which goes to a black adapter box. The ribbon cable adapter box has two RCA stereo-type phone jacks on it labeled “Range” and “SYNC”. The MIR Rangefinder has matching RCA jacks. Using the twin jack RCA cable plug SYNC to SYNC and Range to Range. We use the red RCA cable jacks for Range and the white RCA cable jacks for SYNC. Make sure the switch on the side of the MIR Rangefinder labeled “Sync” is in the “IN’ position. The MIR Rangefinder range sweep is triggered by the computer with the Sync switch in the IN position. The MIR Rangefinder range sweep is self- triggered with the Sync switch in the OUT position and the SYNC RCA jack becomes an output for triggering an oscilloscope. This is a way to test the Rangefinder operations without the computer. The computer keyboard operates in the typical fashion with a mouse pad (no detached mouse). Cursor movement is controlled with the index finger in contact with the touch-pad. Turn the computer power on by pressing the gray key on the left hand side and above the keyboard. If the computer is plugged into the wall through its transformer cable, an electrical plug icon will appear in the small LCD window in the center and above the keyboard. Otherwise, if the computer is running on battery power, a battery with a lightning bolt icon will be displayed on the LCD. The computer will perform some self tests and then begin to ‘boot up’, during which the computer loads the Linux operating system. As the computer boots, a number of messages will be displayed on the screen. These messages detail the status of the operating system as it interacts with various portions of the computer. In some cases, there may be error messages which indicate that some hardware is broken or non-existent but these messages do not indicate failure of the system. For instance, if there is no network PCMCIA card plugged into a slot, a message saying “Connection refused” may appear on the screen, but does not indicate any sort of system failure.
At the end of the boot up process, a message:
Welcome to Linux 1.2.1 1
jasmin login:
will appear on the console (display). At this point, type in the login account name “demo<enter>”, where <enter> means to press the “Enter” or “Return” key. The prompt:
Password :
will appear on the console. Type in the password “rtdemol<enter>”. The login name and
13
Wall Surveyor Project Report 22 February 1996
password respectively will log you on to this particular system. The system prompt will look something like:
jasmin:-$
and is waiting for a command to be typed in. Start the graphical user interface (GUI) by typing the command “startx<enter>”. The windowing software places a colored background on the screen and a white rectangle with a blue border. The rectangle is called an “xterm” window and is labeled as such in the “title bar”, i.e., the wide portion of the blue section. The mouse can be used at this point and is controlled by moving one finger over the surface of the touch pad. The mouse also reacts differently according to which of the two mouse buttons are pressed, but for our limited application only the left key is used.
The xterm window has the prompt:
jasmin(l>
and is waiting for a command that it can execute. We want to run RTD and examine the contents of the directory where we save data. To see the files in the current directory, type ‘‘Is<enter>” for a brief listing or “1s - l<enter>” to get a more detailed description of the files. To run the real timedisplay (RTD), type“rtd<enter>”attheprompt. ThisistheRTDcommandline withdefault arguments.
-
I
RTD comes up in the oscilloscope mode ready to display range lines in real time as an oscilloscope. To begin an acquisition, press the “space” key. The range line can be biased, moving the line up or down on the display using the <T> and <\1> arrow keys. The gain can be increased or decreased by using the <+> and <e-> arrow keys respectively. The gain can be “auto scaled” to fit the current axis by pressing the <a> key. To toggle the acquisition off and on press the <space> bar again. The oscilloscope mode displays the raw unprocessed data sweeps from the MIR Rangefinder. This is a diagnostics mode to determine that the computer and MIR are working properly.
To switch to the waterfall mode press the <w> key. To begin an acquisition, press the <space> bar as in oscilloscope mode. The display will fill from left to right then start over. The data can be scaled with the e+> and <t> arrow keys and auto scaled by pressing the <a> key similar to the oscilloscope data mode.
The waterfall background subtract option is initiated by pressing the <s> key on an active waterfall display while a known background signal is being acquired, such as pointing the radar to the sky. The radar must be generating a featureless display before the <s> key is pressed because 20 range lines are acquired and averaged to create the background subtract vector. The background subtraction option can be turned off by pressing the <s> key again.
Wall Surveyor Project Report 22 February 1996
The background subtraction option has a second option called wall alignment. The wall alignment threshold is set by the first argument in the RTD command line. The alignment threshold is used in background subtract mode in an effort to compensate for the changes in radar distance back from the first surface of the wall. In general, a large threshold decreases the sensitivity of the alignment algorithm and a small threshold increases the sensitivity. Anomalies in the display may occur if the alignment threshold is not set correctly. If the threshold is set marginally for a particular distance, the alignment algorithm may work for that distance but not for a slightly greater spacing. The result in the display will be blocks of aligned data next to blocks of non-aligned data.
RTD must first be stopped to change the alignment threshold in the RTD command line. To stop RTD press the < e s o key in the upper left corner of the keyboard. The RTD window will close and you will return to the xterm window. At the prompt in the xterm window type the new command line. Examples are “rtd O<enter>” foravery low threshold and “rtd 4 0 0 0 < e n t e r > ” fora very highthreshold. The “r td 4000~en te r~”command l ine inessence turns the alignment threshold option off. The default command line is “rtd lO<enter>” which is the same as typing “rtd<enter>”. Entering the new RTD command line restarts RTD bringing the RTD window back up in the oscilloscope mode.
The images in waterfall mode are made from 17 shades of gray from black to white or 3 1 shades of red from black through red and yellow to white. The computer has in memory a lookup table which it uses to convert a signal ievel to a color shade level. When first starting the waterfall mode the images may seem clear with high contrast but with alot of background noise. To turn on background subtraction and remove the noise we press the <s> key. Now the display contrast is low and very little image is seen. This is because the we are displaying the image with only a few color shades and may have subtracted a dc level, shifting the signal color shades. To enhance the image we can shift and compress the lookup table to give a full range of color shades that better matches the reduced signal range. We compress the lookup table around the signal level we want to display. Pressing the < I > key compresses the lookup table from the white end toward the black. Pressing the < [ > key compresses the lookup table from the black end toward the white. Pressing the <>> key ( < s h i f t > , < I >) decompresses the white end back. Pressing the < { > key ( < s h i f t > , < [ >) decompresses the black end back.
-,
Data can be streamed to disk or an entire waterfall display can be saved as-is. To stream the data, start the acquisition by pressing the <space> key, then press the <T> key to begin the streaming transcription process. The default filename is ‘testdat.out’, but can be specified by the second argument on the RTD command line. For example “rtd 15 w a l l d a t a . out<enter>” starts the real time display with a ground alignment threshold of 15 and the filename walldata.out. To save a stopped waterfall plot, press the <1> key. The filename is automatically generated as waterfall.datX where X is an integer from 0-100. .
15
Wall Surveyor Project Report 22 February 1996
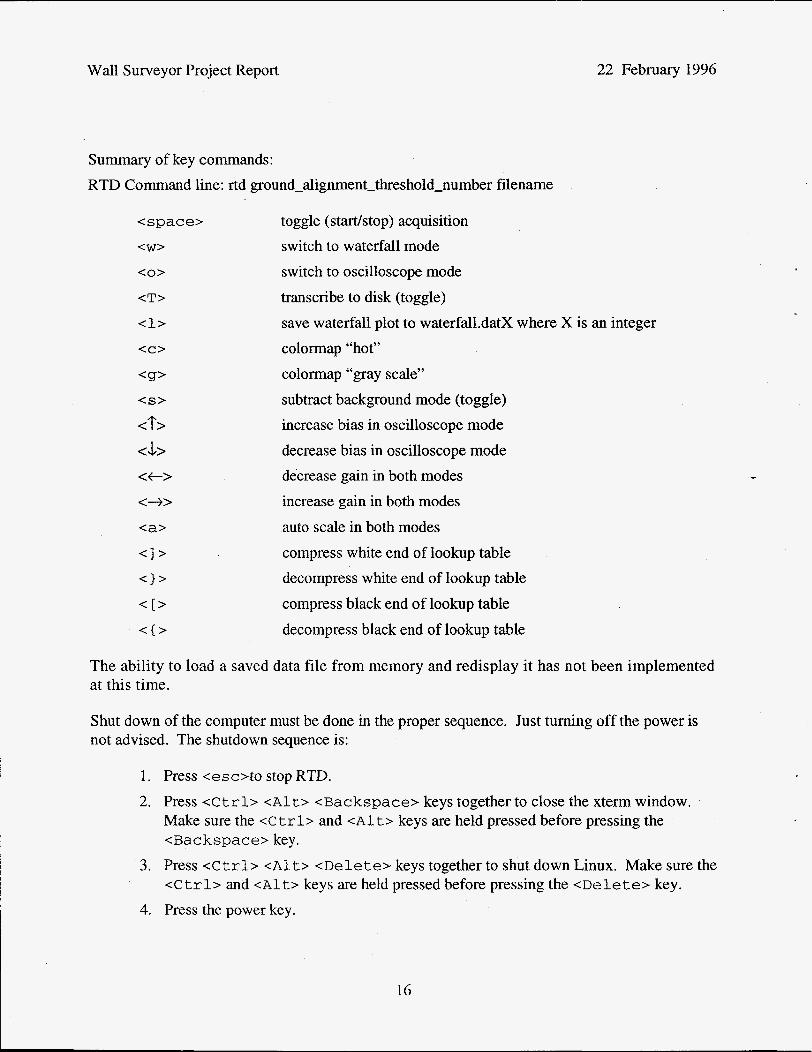
Summary of key commands: RTD Command line: rtd ground-alignment-threshold-number filename
toggle (stadstop) acquisition switch to waterfall mode switch to oscilloscope mode transcribe to disk (toggle) save waterfall plot to waterfall.datX where X is an integer colormap “hot” colormap ‘bgray scale” subtract background mode (toggle) increase bias in oscilloscope mode decrease bias in oscilloscope mode decrease gain in both modes increase gain in both modes auto scale in both modes compress white end of lookup table decompress white end of lookup table compress black end of lookup table decompress black end of lookup table
The ability to load a saved data file from memory and redisplay it has not been implemented at this time.
Shut down of the computer must be done in the proper sequence. Just turning off the power is not advised. The shutdown sequence is:
1. Press < e s o t o stop RTD. 2. Press <C trl> <A1 t> <Backspace> keys together to close the xterm window.
Make sure the <Ctrl> and <Alt> keys are held pressed before pressing the <Backspace> key.
3. Press <Ctrl> <Alt> <Delete> keys together to shut down Linux. Make sure the <Ctrl> and <~lt> keys are held pressed before pressing the <Delete> key.
4. Press the power key.
16

Wall Surveyor Project Report 22 February 1996
Equipment The following equipment was purchased or built for this project:
1. Special Modified MIR Rangefinder. 2. Twinhead Slimnote 5 100s notebook computer. 3. National Instruments DAQ-700 PCMCIA data acquisition card. 4. Ribbon cable from DAQ-700 card to MIR adapter box. 5. RCA cable pair from adapter box to Rangefinder. 6 . Four sections of cement block test walls on dollies.
Summary and Future Improvements While the demonstrator MIR Wall Surveyor is clearly not fieldable as yet, it has proven to be a useful prototype for frrst-generation tests. It has successfully scanned several test walls of known construction and produced real-time images identifying the walls. It is expected to be used by OST personnel to gather dataand gain experience in the field. A follow-on project is planned for studying various ways to improve the performance and fieldability of the device.
In the following project, LLNL will optimize and package the evaluation wall surveyor into a hand held unit. New MIR electronic circuit boards will be designed and fabricated to improve signal to noise, remove packaging and antenna constraints and provide the required level of ruggedness. Further antenna designs and experimentation will be done to both enhance the signal return and further reduce the size for this application. These antenna systems will have narrower beam patterns, co-axial transmitter and receiver feeds, and potentially use dielectric coupling to the walls. A smaller display and processor will replace the laptop computer for signal processing, image processing and the display. The computer may be belt mounted or small enough to integrate the whole system into one small handheld package. Software development will continue to optimize the displays and user interface using feedback from OST once they have experience using the evaluation system. Signal analysis and pattern recognition software will be incorporated to attempt to determine wall composition and thickness.
17