Cycle Turn Indicator Direction and Swing Summary of Select ...
16
Cycle Turn Indicator Direction and Swing Summary of Select Markets as of the close on October 14,2021 *Since this fund is quoted at the end of the day it is impossible for the concept of swing highs and lows to apply on a daily level. The primary interests here are the weekly developments. The daily is representative of the short-term and the weekly is representative of the intermediate-term Market Daily CTI Daily Swing Weekly CTI Weekly Swing Industrial Positive Low Positive Low Transports Positive Low Positive Low NDX Neutral Low Negative High S&P Inverse Fund Negative N/A Negative High CRB Index Positive Low Positive Low Gold Positive Low Positive Low XAU Positive Low Positive Low Dollar Negative High Positive Low Bonds Positive Low Negative High Crude Oil Positive Low Positive Low Unleaded Positive Low Positive Low Natural Gas Positive Low Negative High © Copyright 2021 by Tim Wood 3
Transcript of Cycle Turn Indicator Direction and Swing Summary of Select ...

Cycle Turn Indicator Direction and Swing Summary
of Select Markets as of the close on
October 14,2021
*Since this fund is quoted at the end of the day it is impossible for the concept of swing highs and lows to apply on a daily level. The primary interests here are the weekly developments. The daily is representative of the short-term and the weekly is representative of the intermediate-term
Market Daily CTI
Daily Swing
Weekly CTI
Weekly Swing
Industrial Positive Low Positive LowTransports Positive Low Positive Low
NDX Neutral Low Negative HighS&P Inverse Fund Negative N/A Negative High
CRB Index Positive Low Positive LowGold Positive Low Positive LowXAU Positive Low Positive Low
Dollar Negative High Positive LowBonds Positive Low Negative High
Crude Oil Positive Low Positive LowUnleaded Positive Low Positive Low
Natural Gas Positive Low Negative High
© Copyright 2021 by Tim Wood �3

Short-term Updates
Note on the Cycle Turn Indicator
The most important indicator we have is the Cycle Turn Indicator and the most important timeframe, at least in my mind, is the intermediate-term. This indicator has proven itself time and time again. In reality, this is all we really need to know. Everything else is secondary. That being said, please be sure to monitor the "Cycle Turn Indicator Direction and Swing Summary" above. Red indicates that a swing high and down turn of the Cycle Turn Indicator has occurred and lower prices should follow. The only exception here is that on the daily stock market signals we also want to see both the slow cycle Turn Indicator and the New High/New Low Differential in agreement with the original Cycle Turn Indicator, which is what is covered in this summary above. Yellow, is cautionary meaning that the Cycle Turn Indicator and the swing are not in agreement, which is typically indicative of a trend change. Green, means that a swing low has occurred and that the Cycle Turn Indicator is positive, which should be followed by higher prices. Again, the only exception here is the daily stock market signals in that we want to see both the slow Cycle Turn Indicator and the New High/New Low Differential in agreement with the original Cycle Turn Indicator, which is what is covered in this summary above. For everything else, all that matters is the formation of a swing and the direction of the Cycle Turn Indicator.
All subscribers who do not understand cyclical translation should click here "Notes for New Subscribers." It is important that you read and understand the content found in both of the PDF files that you will find at this link.
© Copyright 2021 by Tim Wood �4

October 14,2021
Stocks
My plan was to work on the October Research Letter this week and put it out this weekend. But, there have been no new developments with the current structure, so rather than put the letter out with little to add to the setup discussed in the September Letter and the recent updates, I thought it may be better to wait another week to see if there were any additional developments.
The price action this week has been increasingly reflective of the September 20th low having marked the trading cycle low. Because of the evidence with regard to the higher degree cycle top/s, the advance out of this trading cycle low is expected to be a counter-trend/structural test of those higher degree cycle top/s. It is the conclusion of that test and the resulting structural verdict that we continue to await. Since the September 20th trading cycle low we have had two daily swing highs and now two daily swing lows. Because of the higher degree cyclical structure and this choppy action, I have to continue to take a neutral stance. That said, another short-term buy signal was re-triggered on Thursday and higher prices will remain
End of Week Intermediate-Term Indicator Summary Intermediate-Term Buy/NeutralPrimary Indicators Formation of a Weekly Swing Low BullishCycle Turn Indicator (CTI) BullishCTI on Rydex Tempest Fund * BearishConfirming IndicatorsTrend Indicator (TI) BearishAdvance/Decline Issues Diff BearishNew High New Low Diff BearishSecondary Indicators
5 3 3 Stochastic BullishCycle Momentum Indicator Bearish*When this indicator is Bullish it is negative for the market and visa versa.
Daily Indicator Summary Short-Term Buy/NeutralPrimary Indicators Formation of a Daily Swing Low BullishCycle Turn Indicator (CTI) BullishSlow Cycle Turn Indicator (CTI) BullishNew High/New Low Differential BullishConfirming IndicatorsTrend Indicator (TI) BullishMcClellan Intermediate Term Breadth Momentum Oscillator (ITBM)
Bullish
McClellan Intermediate Term Volume Momentum Oscillator (ITVM)
Bullish
McClellan Summation Index BullishMcClellan Volume Summation Index Bullish
Secondary Short Term Indicators5 3 3 Stochastic BullishCycle Momentum Indicator BullishTrading Cycle Oscillator BearishMomentum Indicator BullishRatio Adjusted McClellan Oscillator Crossover
Bullish
Accumulation/Distribution Index Bullish
© Copyright 2021 by Tim Wood �5

possible until this signal is reversed. If the advance out of this low does in fact prove to be a counter-trend/retest of the higher degree cyclical top/s, then upon the conclusion of this trading cycle top, it is going to leave Equities positioned for greater weakness in association with a continuation of the downturn out of the higher degree cycle tops. If not, per the discussion in the weekend update, it will prove the September low as also having marked an intermediate-term cycle low. This remains an extremely important cyclical juncture and the risk here remains High! The Reverse Repo Operations for Wednesday were $1.364 Trillion and Thursday were $1.445 Trillion, which brings the monthly total to $12.591 Trillion.
The buy signal on Crude Oil remains intact while the oscillator picture also continues to be increasingly suggestive of the trading cycle top. Once a daily swing high and downturn of the daily CTI are seen, a short-term sell signal will be triggered and the trading cycle top should then be in place. The short-term buy signal on the CRB Index also remains intact. As with Crude Oil, this advance should also be in association with an ending push into the higher degree cycle top/s, but until short-term sell signals are followed by weekly swing highs and intermediate-term sell signals, higher prices will remain possible. The trading cycle low on Gold and the XAU were seen on September 29th and the short-term buy signal in association with these trading cycle advances remains intact. The price/oscillator picture continues to be suggestive of the trading cycle tops, which should ideally be in place once a short-term sell signal is triggered. The Dollar re-triggered a short-term sell signal on Wednesday and until proven otherwise, the Dollar is now at risk of a left-translated trading cycle top. Tuesday’s short-term buy signal on Bonds remains intact. The advance out of this trading cycle low is the last chance for Bonds to prove this to have been a slightly long intermediate-term cycle. Failure to see a right-translated trading cycle advance will leave Bonds positioned for continued weakness in association with a series of higher degree cycle tops. I tend to think the odds favor the series of left-translated cycles to prove applicable, but whatever the case, this buy signal will remain intact until it is reversed. In the meantime, the test with this trading cycle advance is at hand.
© Copyright 2021 by Tim Wood �6

The red intermediate-term Advancing issues line is tied to the intermediate-term cycle, which has turned back up. The Green MA remains below its Black MA. This downturn of the Green MA below the Black is reflective of the intermediate-term cycle top, but structurally, with the weekly swing low in place, we must see the completion of another weekly swing high in conjunction with the downturn of the Green MA below the Black.
© Copyright 2021 by Tim Wood �7

The Trading Cycle Oscillator in the upper window remains marginally below its trigger line. The Momentum indicator remains marginally above its zero line. The 5 3 3 stochastic in the middle window has turned back up. The oscillator picture at this juncture tends to be suggestive of higher prices. The first of our Primary Short-Term Indicators is the New High/New Low Differential, plotted with price, which has ticked back up as well. The Trend Indicator remains above its trigger line and has turned back up.
© Copyright 2021 by Tim Wood �8

The Three Primary Short-Term Indicators are the Original and the Slow Cycle Turn Indicators, both plotted below, and the NYSE New High/New Low Differential, plotted with price above.
Monday the Industrials completed the formation of a daily swing high and more weakness followed on Tuesday and Wednesday. On Wednesday the Primary Short-Term Indicators turned down, but because of the reversal off of the low, a marginal short-term sell signal was triggered. In order to confirm this signal we would have had to have seen a close below Wednesday’s low, which we did not see and on Thursday a short-term buy signal was re-triggered. As a result, the advance out of the September 20th trading cycle low continues to be the structural test with regard to the higher degree cyclical top/s. Once a daily swing high is confirmed by a downturn of the Primary Short-Term Indicators, a short-term sell signal will be triggered and the evidence will be suggestive of this advance having run its course. The underlying structure of this trading cycle remains key with respect to the higher degree cycle top/s and it is the results of this test that we await.
© Copyright 2021 by Tim Wood �9

Both the Intermediate Term Volume Momentum Oscillator and the Intermediate Term Breadth Momentum Oscillator remain above their trigger lines in association with the overall advance out of the trading cycle low.
© Copyright 2021 by Tim Wood �10

Both the McClellan Volume Summation Index and the McClellan Summation Index also remain positive in association with the upturn out of the trading cycle low. The Ratio Adjusted McClellan Oscillator in the upper window remains positive. The re-triggering of a short-term sell signal, in conjunction with a downturn below the trigger and zero line will be suggestive of the trading cycle top. Until such time, the price/oscillator picture will continue to be reflective of the ongoing advance out of the trading cycle low.
© Copyright 2021 by Tim Wood �11

Here too, the upturn of the smoothed McClellan oscillator continues to be reflective of the ongoing advance out of the trading cycle low. Once the triggering of another short-term sell signal and crossing below the trigger line are seen, the trading cycle top should be in place.
© Copyright 2021 by Tim Wood �12

The Accumulation/Distribution Index has once again turned back up. Once a short-term sell signal is triggered and confirmed by the oscillators, this trading cycle advance should have run its course. In the meantime, the test of the intermediate-term cycle top continues and it is the structure of this trading cycle that remains key with respect to the higher degree setup and cyclical turn. More on that once a short-term sell signal is re-triggered.
© Copyright 2021 by Tim Wood �13
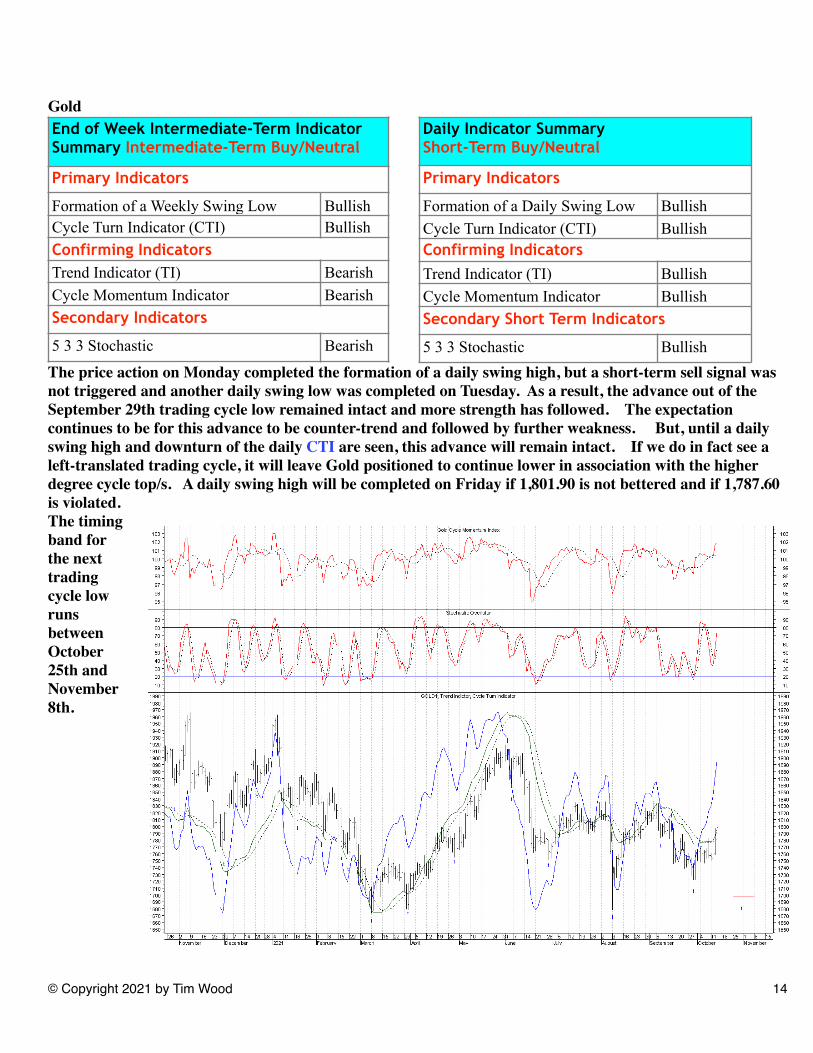
Gold
The price action on Monday completed the formation of a daily swing high, but a short-term sell signal was not triggered and another daily swing low was completed on Tuesday. As a result, the advance out of the September 29th trading cycle low remained intact and more strength has followed. The expectation continues to be for this advance to be counter-trend and followed by further weakness. But, until a daily swing high and downturn of the daily CTI are seen, this advance will remain intact. If we do in fact see a left-translated trading cycle, it will leave Gold positioned to continue lower in association with the higher degree cycle top/s. A daily swing high will be completed on Friday if 1,801.90 is not bettered and if 1,787.60 is violated. The timing band for the next trading cycle low runs between October 25th and November 8th.
End of Week Intermediate-Term Indicator Summary Intermediate-Term Buy/Neutral
Primary Indicators
Formation of a Weekly Swing Low BullishCycle Turn Indicator (CTI) BullishConfirming IndicatorsTrend Indicator (TI) BearishCycle Momentum Indicator BearishSecondary Indicators
5 3 3 Stochastic Bearish
Daily Indicator SummaryShort-Term Buy/Neutral
Primary Indicators
Formation of a Daily Swing Low BullishCycle Turn Indicator (CTI) BullishConfirming IndicatorsTrend Indicator (TI) BullishCycle Momentum Indicator BullishSecondary Short Term Indicators
5 3 3 Stochastic Bullish
© Copyright 2021 by Tim Wood �14

Our daily XAU chart is next and here too, the trading cycle low was seen in conjunction with the September 29th daily swing low. This advance has carried price to overbought levels, and as with Gold, because of the higher degree cyclical structure, this advance is expected to be counter-trend. However, also as with Gold, this buy signal in association with the advance out of the trading cycle low will remain intact until another daily swing high and downturn of the daily CTI are seen. A daily swing high will be completed on Friday if 133.10 is not bettered and if 131.26 is violated.
© Copyright 2021 by Tim Wood �15
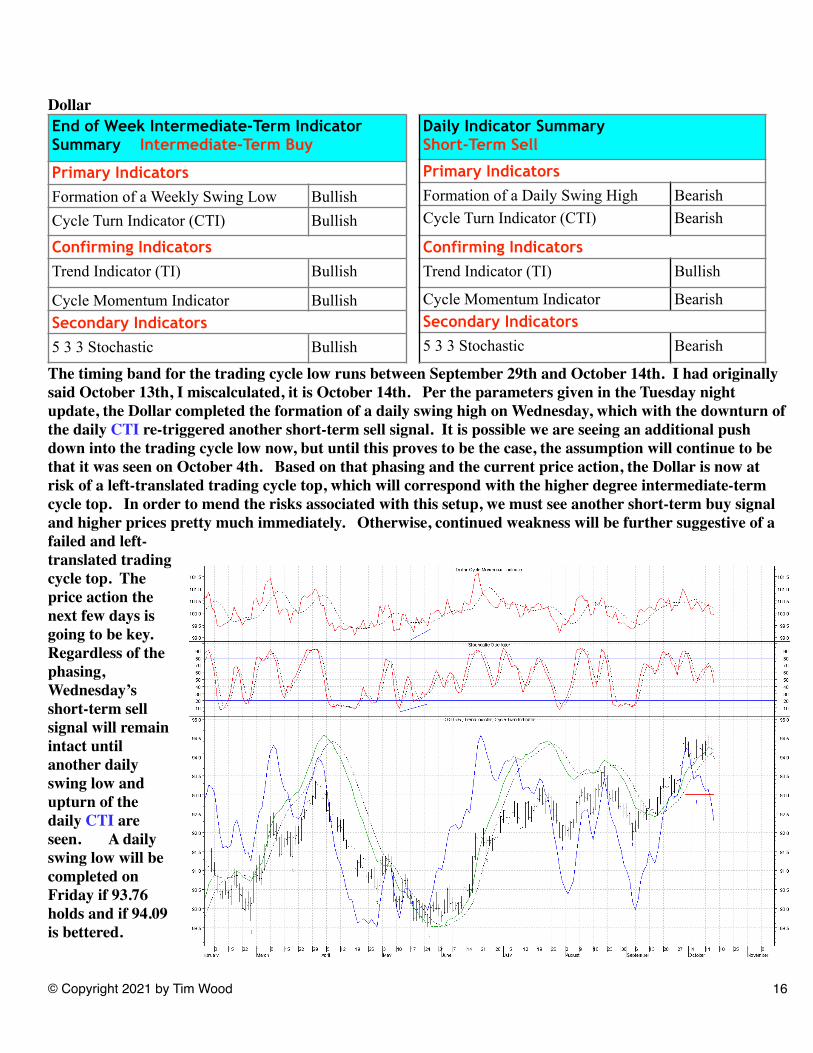
Dollar
The timing band for the trading cycle low runs between September 29th and October 14th. I had originally said October 13th, I miscalculated, it is October 14th. Per the parameters given in the Tuesday night update, the Dollar completed the formation of a daily swing high on Wednesday, which with the downturn of the daily CTI re-triggered another short-term sell signal. It is possible we are seeing an additional push down into the trading cycle low now, but until this proves to be the case, the assumption will continue to be that it was seen on October 4th. Based on that phasing and the current price action, the Dollar is now at risk of a left-translated trading cycle top, which will correspond with the higher degree intermediate-term cycle top. In order to mend the risks associated with this setup, we must see another short-term buy signal and higher prices pretty much immediately. Otherwise, continued weakness will be further suggestive of a failed and left-translated trading cycle top. The price action the next few days is going to be key. Regardless of the phasing, Wednesday’s short-term sell signal will remain intact until another daily swing low and upturn of the daily CTI are seen. A daily swing low will be completed on Friday if 93.76 holds and if 94.09 is bettered.
End of Week Intermediate-Term Indicator Summary Intermediate-Term Buy
Primary Indicators Formation of a Weekly Swing Low BullishCycle Turn Indicator (CTI) Bullish
Confirming IndicatorsTrend Indicator (TI) Bullish
Cycle Momentum Indicator BullishSecondary Indicators5 3 3 Stochastic Bullish
Daily Indicator SummaryShort-Term Sell
Primary Indicators Formation of a Daily Swing High BearishCycle Turn Indicator (CTI) Bearish
Confirming IndicatorsTrend Indicator (TI) Bullish
Cycle Momentum Indicator BearishSecondary Indicators5 3 3 Stochastic Bearish
© Copyright 2021 by Tim Wood �16

Bonds
The timing band for the current trading cycle low runs between September 28th and October 19th. Per the weekend update, we knew that this low was ideally due this week and as a result of Tuesday’s buy signal that has proven to have been the case. It is now the test of the intermediate-term cycle that is at hand. In order for this to prove to have been a slightly long intermediate-term cycle low, the advance out of this trading cycle low must now unfold with a right-translated structure. Failure to do so will serve as structural confirmation of the setup with the series of higher degree left-translated cycles. It is this latter scenario that is our preferred count and which I tend to suspect will prove applicable. Whichever the case, that test is at hand with this trading cycle advance, which is now approaching overbought levels, per the 5 3 3 stochastic.
End of Week Intermediate-Term Indicator Summary Intermediate-Term SellPrimary Indicators Formation of a Weekly Swing High BearishCycle Turn Indicator (CTI) BearishConfirming IndicatorsTrend Indicator (TI) BearishCycle Momentum Indicator BearishSecondary Indicators5 3 3 Stochastic Bearish
Daily Indicator SummaryShort-Term BuyPrimary Indicators Formation of a Daily Swing Low BullishCycle Turn Indicator (CTI) BullishConfirming IndicatorsTrend Indicator (TI) BearishCycle Momentum Indicator BullishSecondary Short Term Indicators5 3 3 Stochastic Bullish
© Copyright 2021 by Tim Wood �17

Crude Oil
Monday’s swing high continues to hold and the trading cycle top should be near. The divergent 5 3 3 stochastic is also very much suggestive of the trading cycle top as well. But, with the CTI remaining positive, a short-term sell signal was not triggered and until this occurs, we cannot say the top has been seen. As Crude Oil currently stands, any weakness that yields a close below Wednesday’s low, in conjunction with a downturn of the daily CTI, will trigger a short-term sell signal, which should mark the trading cycle top. Once a short-term sell signal is triggered and followed by a weekly swing high, such development will be suggestive of the advance out of the August low having run its course. The expectation that Crude Oil is pressing into a higher degree cycle top has not changed, but until sell signals are re-triggered, this advance will remain intact. Another daily swing high will be completed on Friday if 81.68 is not bettered and if 80.38 is violated.
�
©2021 Cycles News & Views; All Rights Reserved
© Copyright 2021 by Tim Wood �18