Cyberstates 2015 v slideshare
14
© 2015 CompTIA Properties, LLC CYBERSTATES 2015 REVIEW Tim Herbert VP, Research & Market Intelligence Computing Technology Industry Association (CompTIA) @timjherbert
-
Upload
comptia -
Category
Technology
-
view
436 -
download
1
Transcript of Cyberstates 2015 v slideshare
© 2015 CompTIA Properties, LLC
CYBERSTATES 2015 REVIEW
Tim HerbertVP, Research & Market IntelligenceComputing Technology Industry Association (CompTIA)@timjherbert

© 2015 CompTIA Properties, LLC
http://www.comptia.org/resources/cyberstates-2015
Access the Full Report:

© 2015 CompTIA Properties, LLC
Key Distinction When Discussing the Tech Space
Tech Industry
Tech Occupations
Within the tech
industry, there are
many tech occupations
6.5 million employed
6.8 million jobs
Sources: BLS | EMSI | CompTIA
© 2015 CompTIA Properties, LLC
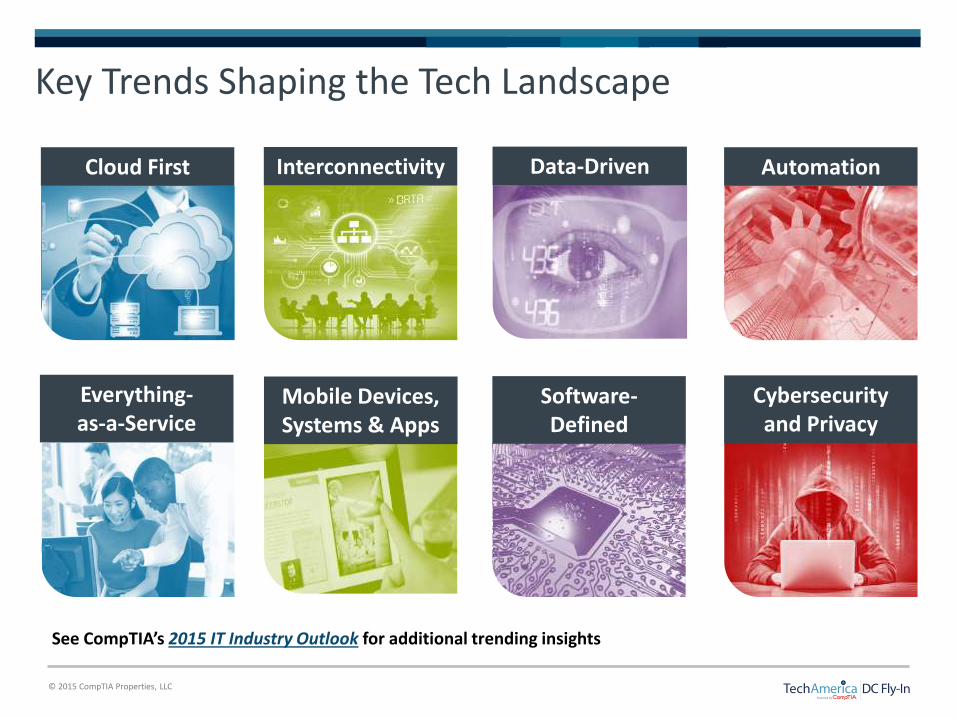
Key Trends Shaping the Tech Landscape
Cloud First Automation
Cybersecurity and Privacy
Software-Defined
Mobile Devices, Systems & Apps
Everything-as-a-Service
Data-DrivenInterconnectivity
See CompTIA’s 2015 IT Industry Outlook for additional trending insights

© 2015 CompTIA Properties, LLC
Tech Industry Hits 6.5 Million in Employment
0
2,000,000
4,000,000
6,000,000
2008 2009 2010 2011 2012 2013 2014
Telecommunications & Internet Services sector
Software [packaged] sector
IT Services sector
R&D, Testing, & Engineering Services sector
Tech Manufacturing sector
4.7%
17.5%
19.6%
25.9%
32.3%
Percent of Tech Sector
Tech Industry grows 2.0% in 2014, adding 130,000 workers
Emp
loym
ent
Sources: BLS | EMSI | CompTIA
© 2015 CompTIA Properties, LLC
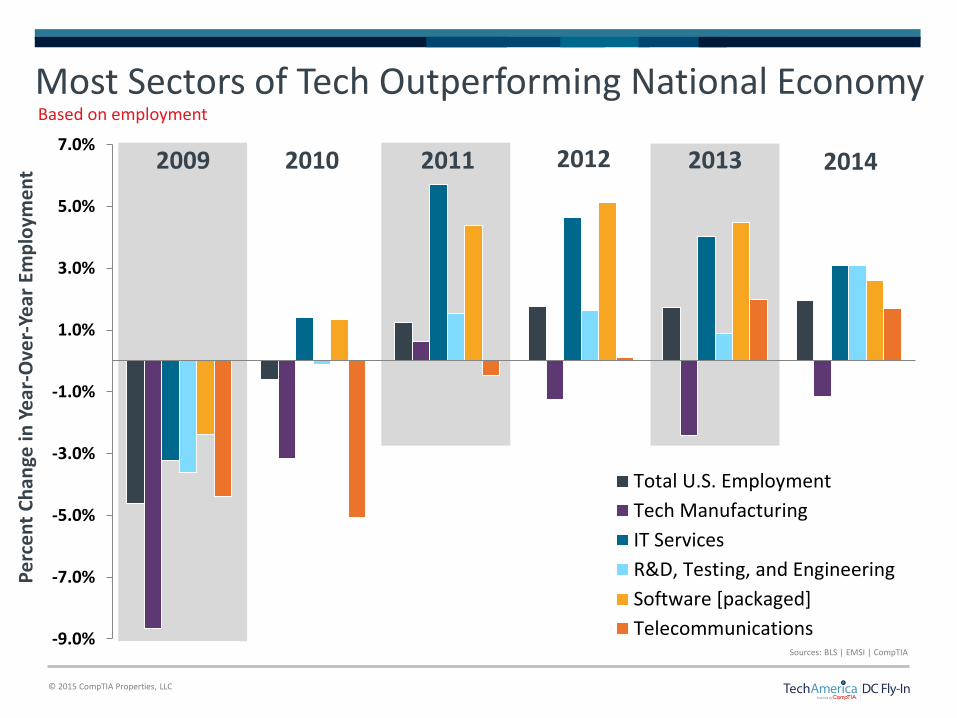
Most Sectors of Tech Outperforming National Economy
Pe
rce
nt
Ch
ange
in Y
ear
-Ove
r-Ye
ar E
mp
loym
en
t 2009 2010 2011 2012 2013 2014
-9.0%
-7.0%
-5.0%
-3.0%
-1.0%
1.0%
3.0%
5.0%
7.0%
Total U.S. Employment
Tech Manufacturing
IT Services
R&D, Testing, and Engineering
Software [packaged]
Telecommunications
Based on employment
Sources: BLS | EMSI | CompTIA
© 2015 CompTIA Properties, LLC
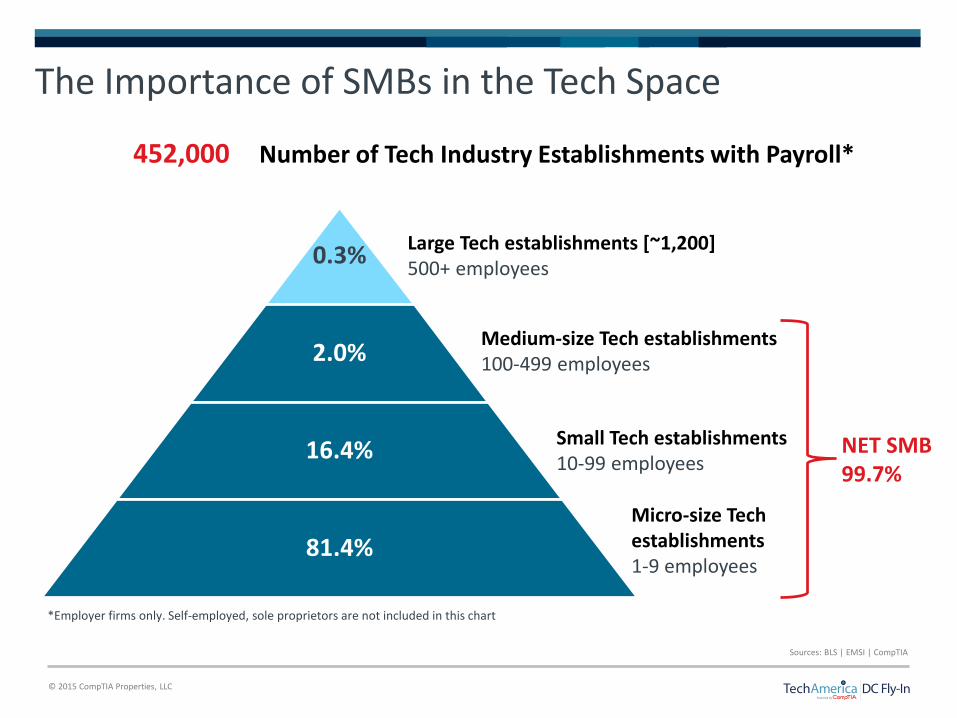
The Importance of SMBs in the Tech Space
0.3%
2.0%
16.4%
81.4%
Large Tech establishments [~1,200]500+ employees
Medium-size Tech establishments100-499 employees
Small Tech establishments10-99 employees
Micro-size Tech establishments1-9 employees
452,000 Number of Tech Industry Establishments with Payroll*
*Employer firms only. Self-employed, sole proprietors are not included in this chart
NET SMB99.7%
Sources: BLS | EMSI | CompTIA
© 2015 CompTIA Properties, LLC
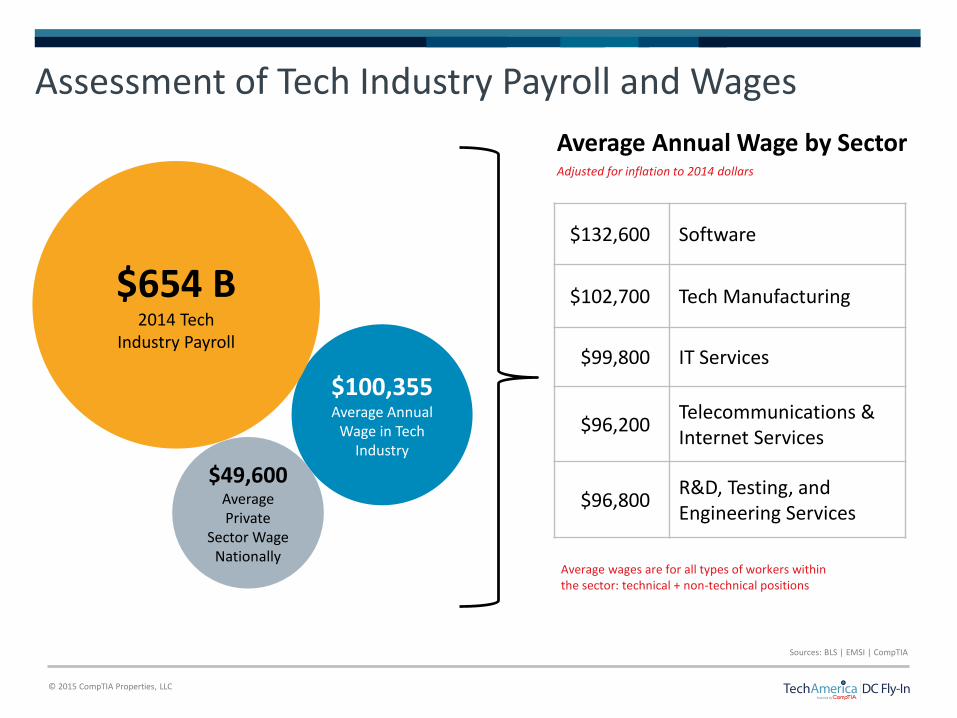
Assessment of Tech Industry Payroll and Wages
$100,355Average Annual
Wage in Tech Industry
$654 B2014 Tech
Industry Payroll
$49,600Average Private
Sector Wage Nationally
$132,600 Software
$102,700 Tech Manufacturing
$99,800 IT Services
$96,200Telecommunications & Internet Services
$96,800R&D, Testing, and Engineering Services
Average Annual Wage by Sector Adjusted for inflation to 2014 dollars
Average wages are for all types of workers within the sector: technical + non-technical positions
Sources: BLS | EMSI | CompTIA

© 2015 CompTIA Properties, LLC
Tech Occupations: Half a Million New Jobs Since 2010
4,000,000
5,000,000
6,000,000
7,000,000
2008 2009 2010 2011 2012 2013 2014
-5.1%
-0.5% 2.2%2.2%
1.9% 1.8%
Additionally, there were about 1.1 million self employed or sole proprietors working in technology in 2014. Custom computer programming services was the largest category within the self employed segment.
Sources: BLS | EMSI | CompTIA
© 2015 CompTIA Properties, LLC
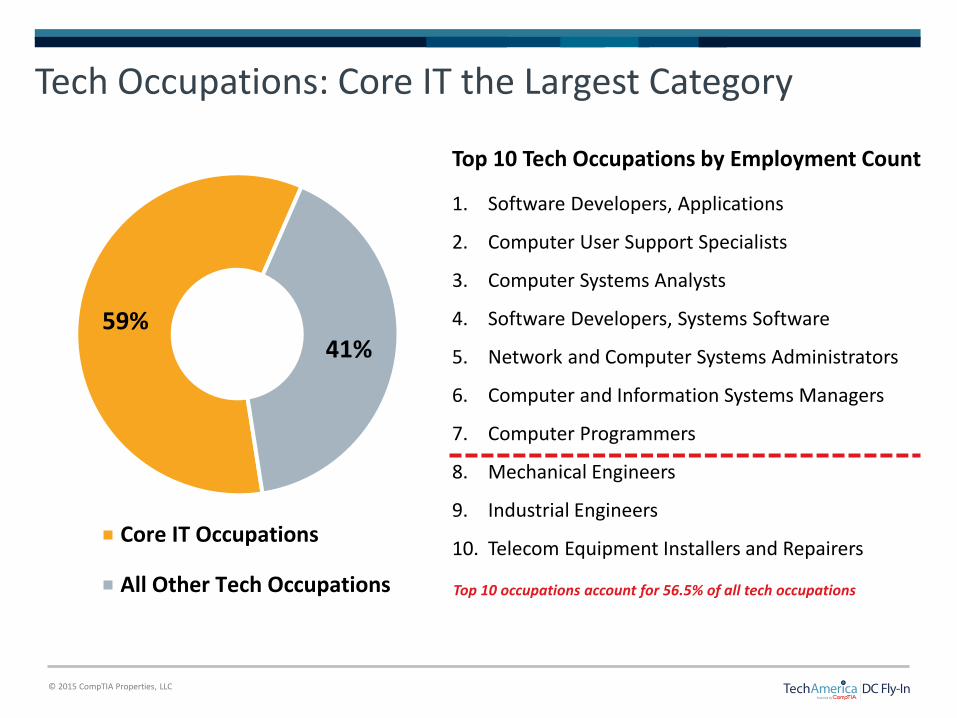
Tech Occupations: Core IT the Largest Category
59%41%
Core IT Occupations
All Other Tech Occupations
1. Software Developers, Applications
2. Computer User Support Specialists
3. Computer Systems Analysts
4. Software Developers, Systems Software
5. Network and Computer Systems Administrators
6. Computer and Information Systems Managers
7. Computer Programmers
8. Mechanical Engineers
9. Industrial Engineers
10. Telecom Equipment Installers and Repairers
Top 10 occupations account for 56.5% of all tech occupations
Top 10 Tech Occupations by Employment Count

© 2015 CompTIA Properties, LLC
450,000
550,000
650,000
Q32013
Q42013
Q12014
Q22014
Q32014
Q42014
Postings for IT Job Openings Trending
1. Accenture2. Deloitte Development LLC3. Oracle4. General Dynamics5. Amazon.com6. IBM7. JP Morgan Chase Company8. UnitedHealth Group9. Best Buy10. Computer Sciences Corporation11. Hewlett-Packard12. Northrop Grumman13. Dell14. Pricewaterhousecoopers15. Microsoft Corporation
581K Postings in Q4, up 4.2% vs. Q3
Companies with the Most Postings for IT Job Openings in 2014
Sources: Burning Glass Technologies Labor Insights
© 2015 CompTIA Properties, LLC
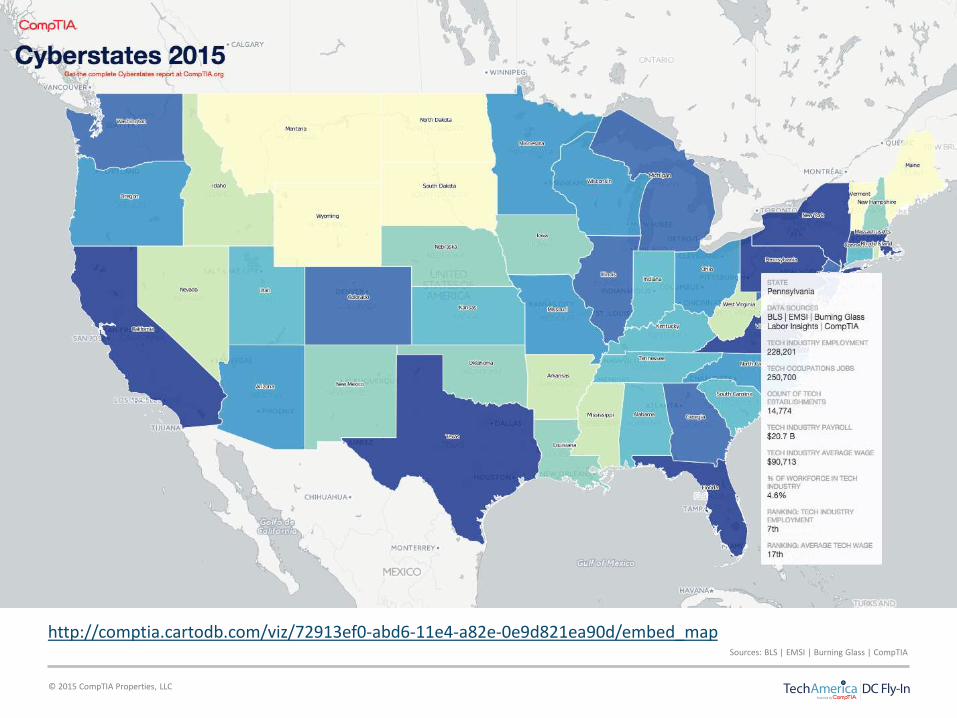
State 1
http://comptia.cartodb.com/viz/72913ef0-abd6-11e4-a82e-0e9d821ea90d/embed_mapSources: BLS | EMSI | Burning Glass | CompTIA

© 2015 CompTIA Properties, LLC
State Summary Page Overview
Copyright(c)2015CompTIAProper es,LLC.|CompTIA.org|CyberstatesPage18
TECHINDUSTRYJOBS 79,185
TECHCOMPANYESTABLISHMENTS 5,431
TECHCOMPANYPAYROLL $6.2B
AVERAGEWAGEINTECHINDUSTRY $77,771
%OFPRIVATESECTORWORKERSINTECH 5.3%
STATERANKINGS:TECHEMPLOYMENT 23rd
STATERANKINGS:AVERAGETECHWAGE 30th
4,200
7,200
10,400
20,100
22,900
4,200
7,200
10,400
19,700
23,200
2014 2013
COMPUTERSYSTEMSDESIGN(ITSERVICES)
ENGINEERINGSERVICES
TELECOMMUNICATIONS
R&DANDTESTINGLABS
SPACEANDDEFENSESYSTEMS
STATEOFTECHNOLOGYINALABAMAALABAMA
0
45,000
90,000
2008200920102011201220132014
TECHINDUSTRY
JOBS
79,200
TECHOCCUPATION
JOBS
92,300
TECHINDUSTRYEMPLOYMENTTRENDS
[
-12JOBS0%
LEADINGOCCUPATIONALJOBCATEGORIES
TECHINDUSTRYWAGES
$41,200
$77,800
$0
$45,000
$90,000
PRIVATESECTORWAGES
TECHINDUSTRYWAGES
5,3005,900
0
3,500
7,000
Q42013 Q42014
4.0%OF
ALABAMA’S
ECONOMYIS
FROMTHETECH
INDUSTRY
50%ofTechIndustryJobsAreinTechOccupa ons
+10.4%[
LEADINGTECHINDUSTRYSECTORS(BYEMPLOYMENT)
POSTINGSFORTECHOCCUPATIONSJOBOPENINGS(NET)
TECHWAGES
ARE89%MORE
ComputerUserSupportSpecialists 7,200 1.8%
ComputerSystemsAnalysts 6,100 2.6%
ComputerProgrammers 5,100 -0.6%
ElectricalEngineers 5,100 -0.9%
NetworkandComputerSystemsAdministrators 4,900 0.8%
YoY%Change2014
Sources:U.S.BureauofLaborSta s cs|EMSI|BurningGlassTechnologiesLaborInsights Alldatacoversthe2014 meperiod,exceptwherespecifiedas2013
Leading Tech Industry Sectors
Tech Industry vs. Tech
Occupations Overview
Tech Industry Employment
Trending
Leading Tech Occupation Job
Categories
Postings for Tech Occupation Job
Openings
Tech Industry Wages
State of Technology Summary
State Rankings
Sources: BLS | EMSI | Burning Glass | CompTIA

© 2015 CompTIA Properties, LLC
http://www.comptia.org/resources/cyberstates-2015
Access the Full Report:


![[Slideshare] tadzkirah-february-2013-be-grateful-as-muslims(aali'imran-3-v-164]](https://static.fdocuments.in/doc/165x107/54c183c84a79595c6b8b456b/slideshare-tadzkirah-february-2013-be-grateful-as-muslimsaaliimran-3-v-164.jpg)