CVEEN 4410 Hydrology Homework 5 - University of Utahco2.coe.utah.edu/CVEEN4410b/pdf/HW5_SOLN.pdf ·...
19
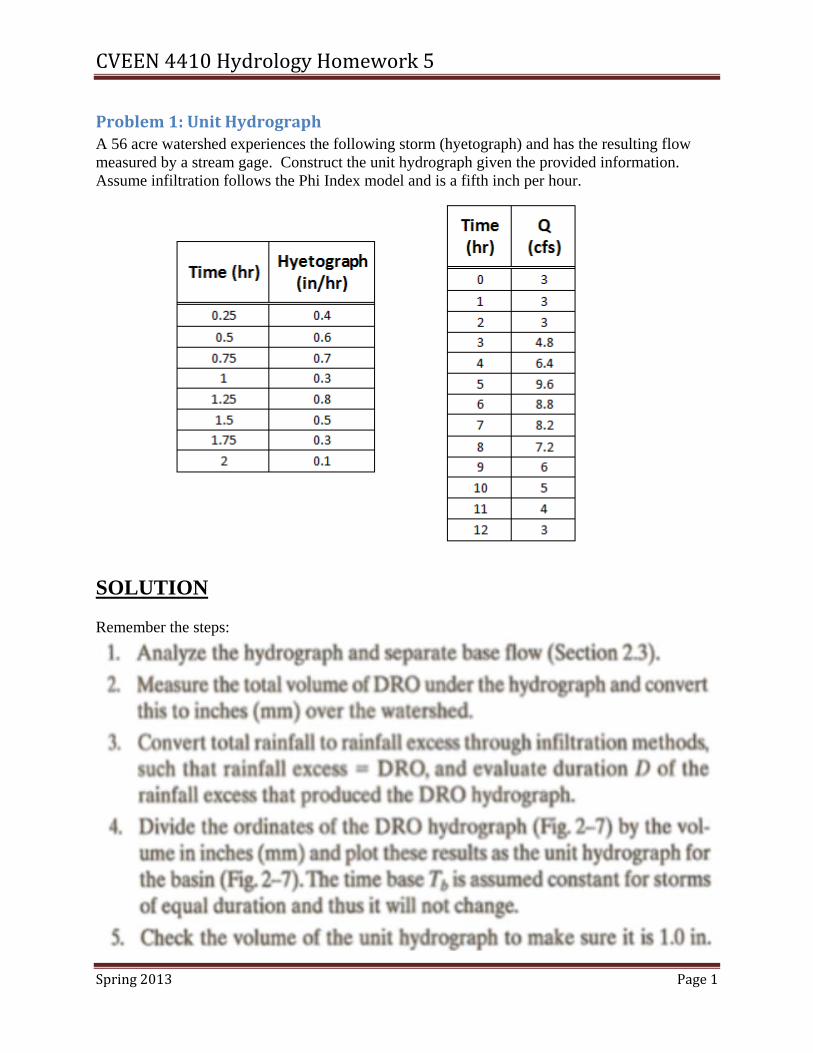
CVEEN 4410 Hydrology Homework 5 Spring 2013 Page 1 Problem 1: Unit Hydrograph A 56 acre watershed experiences the following storm (hyetograph) and has the resulting flow measured by a stream gage. Construct the unit hydrograph given the provided information. Assume infiltration follows the Phi Index model and is a fifth inch per hour. SOLUTION Remember the steps:
Transcript of CVEEN 4410 Hydrology Homework 5 - University of Utahco2.coe.utah.edu/CVEEN4410b/pdf/HW5_SOLN.pdf ·...
CVEEN4410HydrologyHomework5
Spring2013 Page1
Problem1:UnitHydrographA 56 acre watershed experiences the following storm (hyetograph) and has the resulting flow measured by a stream gage. Construct the unit hydrograph given the provided information. Assume infiltration follows the Phi Index model and is a fifth inch per hour.
SOLUTION Remember the steps:
CVEEN4410HydrologyHomework5
Spring2013 Page2
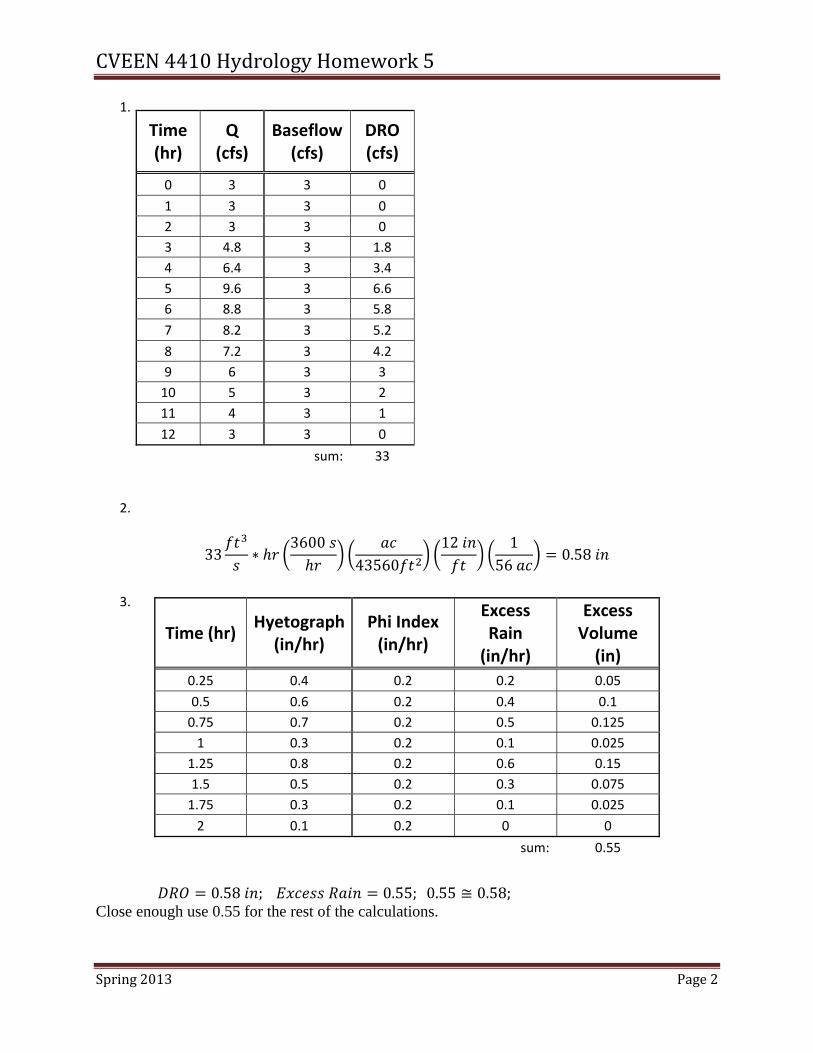
1.
2.
33 ∗3600
4356012 1
560.58
3.
0.58 ; 0.55; 0.55 ≅ 0.58; Close enough use 0.55 for the rest of the calculations.
Time (hr)
Q (cfs)
Baseflow (cfs)
DRO (cfs)
0 3 3 0
1 3 3 0
2 3 3 0
3 4.8 3 1.8
4 6.4 3 3.4
5 9.6 3 6.6
6 8.8 3 5.8
7 8.2 3 5.2
8 7.2 3 4.2
9 6 3 3
10 5 3 2
11 4 3 1
12 3 3 0
sum: 33
Time (hr) Hyetograph
(in/hr) Phi Index (in/hr)
Excess Rain (in/hr)
Excess Volume (in)
0.25 0.4 0.2 0.2 0.05
0.5 0.6 0.2 0.4 0.1
0.75 0.7 0.2 0.5 0.125
1 0.3 0.2 0.1 0.025
1.25 0.8 0.2 0.6 0.15
1.5 0.5 0.2 0.3 0.075
1.75 0.3 0.2 0.1 0.025
2 0.1 0.2 0 0
sum: 0.55
CVEEN4410HydrologyHomework5
Spring2013 Page3
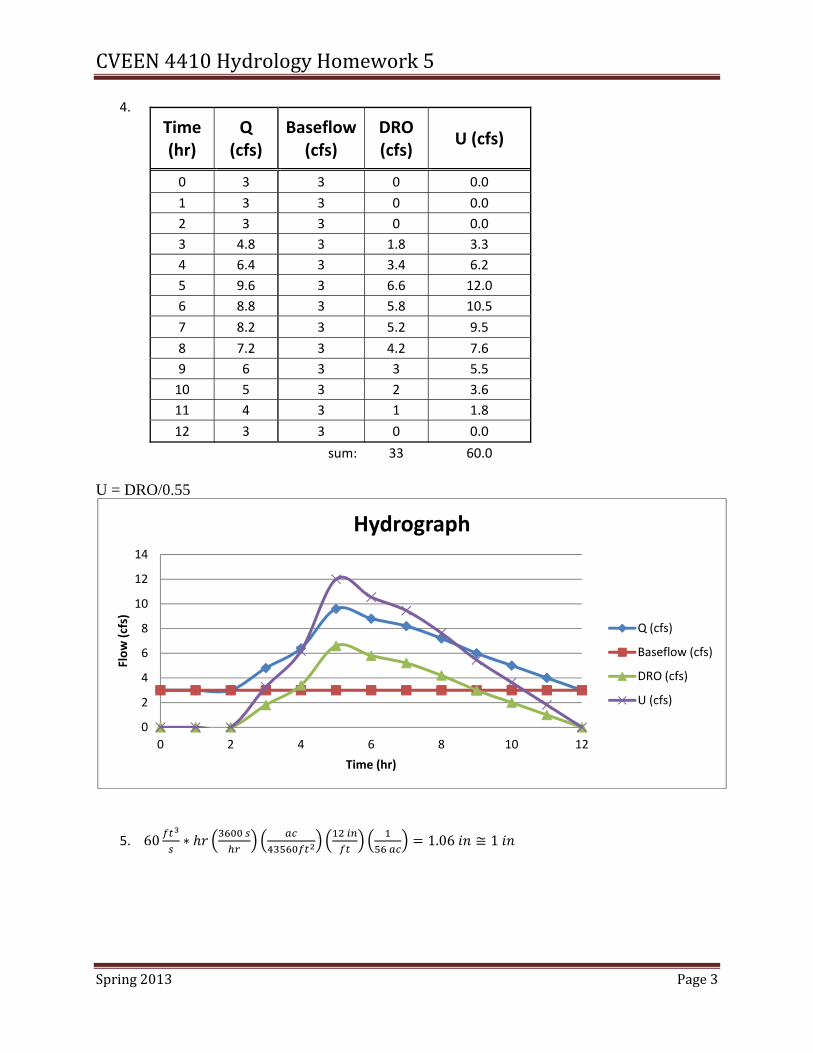
4.
U = DRO/0.55
5. 60 ∗
1.06 ≅ 1
0
2
4
6
8
10
12
14
0 2 4 6 8 10 12
Flow (cfs)
Time (hr)
Hydrograph
Q (cfs)
Baseflow (cfs)
DRO (cfs)
U (cfs)
Time (hr)
Q (cfs)
Baseflow (cfs)
DRO (cfs)
U (cfs)
0 3 3 0 0.0
1 3 3 0 0.0
2 3 3 0 0.0
3 4.8 3 1.8 3.3
4 6.4 3 3.4 6.2
5 9.6 3 6.6 12.0
6 8.8 3 5.8 10.5
7 8.2 3 5.2 9.5
8 7.2 3 4.2 7.6
9 6 3 3 5.5
10 5 3 2 3.6
11 4 3 1 1.8
12 3 3 0 0.0
sum: 33 60.0
CVEEN4410HydrologyHomework5
Spring2013 Page4
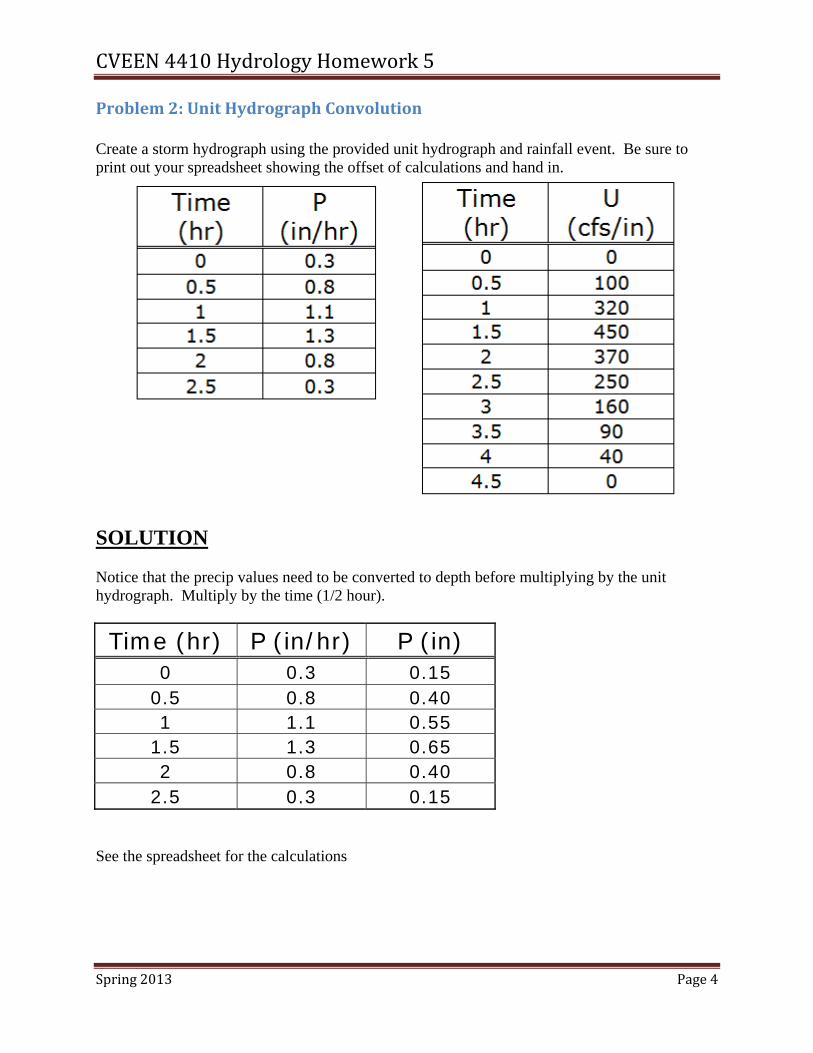
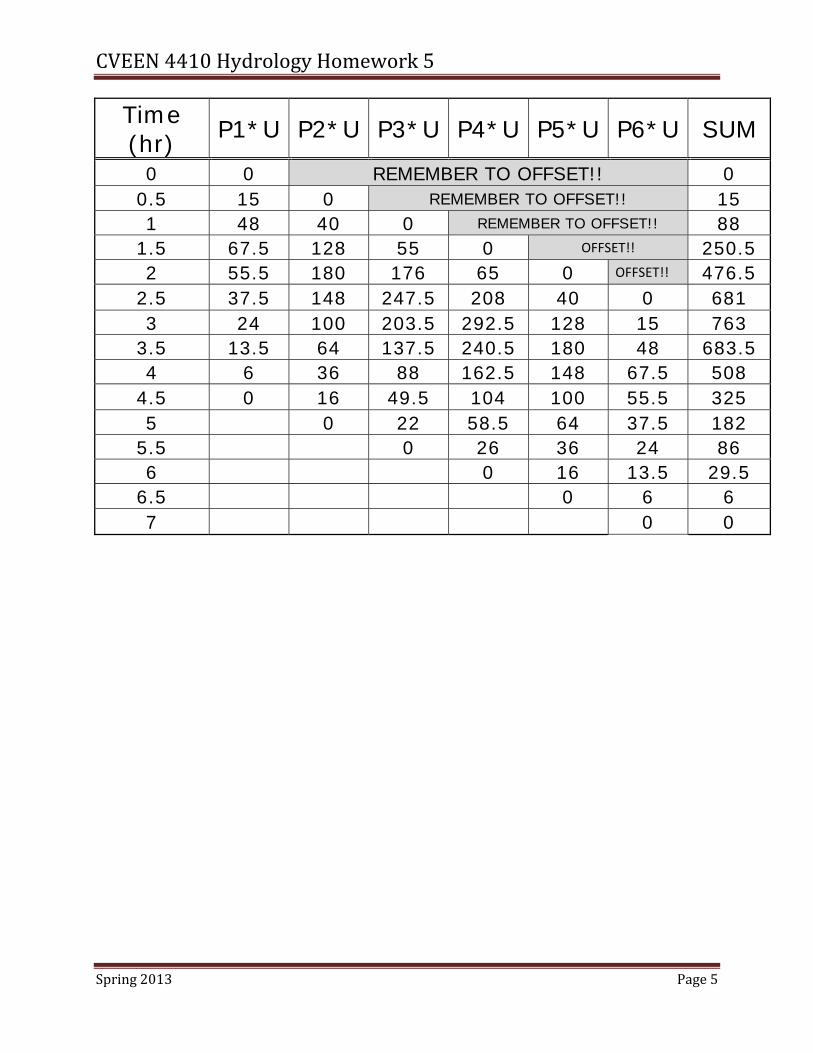
Problem2:UnitHydrographConvolution Create a storm hydrograph using the provided unit hydrograph and rainfall event. Be sure to print out your spreadsheet showing the offset of calculations and hand in.
SOLUTION Notice that the precip values need to be converted to depth before multiplying by the unit hydrograph. Multiply by the time (1/2 hour).
Time (hr) P (in/hr) P (in) 0 0.3 0.15
0.5 0.8 0.40 1 1.1 0.55
1.5 1.3 0.65 2 0.8 0.40
2.5 0.3 0.15 See the spreadsheet for the calculations
CVEEN4410HydrologyHomework5
Spring2013 Page5
Time (hr) P1*U P2*U P3*U P4*U P5*U P6*U SUM
0 0 REMEMBER TO OFFSET!! 0 0.5 15 0 REMEMBER TO OFFSET!! 15 1 48 40 0 REMEMBER TO OFFSET!! 88
1.5 67.5 128 55 0 OFFSET!! 250.5 2 55.5 180 176 65 0 OFFSET!! 476.5
2.5 37.5 148 247.5 208 40 0 681 3 24 100 203.5 292.5 128 15 763
3.5 13.5 64 137.5 240.5 180 48 683.5 4 6 36 88 162.5 148 67.5 508
4.5 0 16 49.5 104 100 55.5 325 5 0 22 58.5 64 37.5 182
5.5 0 26 36 24 86 6 0 16 13.5 29.5
6.5 0 6 6 7 0 0
CVEEN4410HydrologyHomework5
Spring2013 Page6
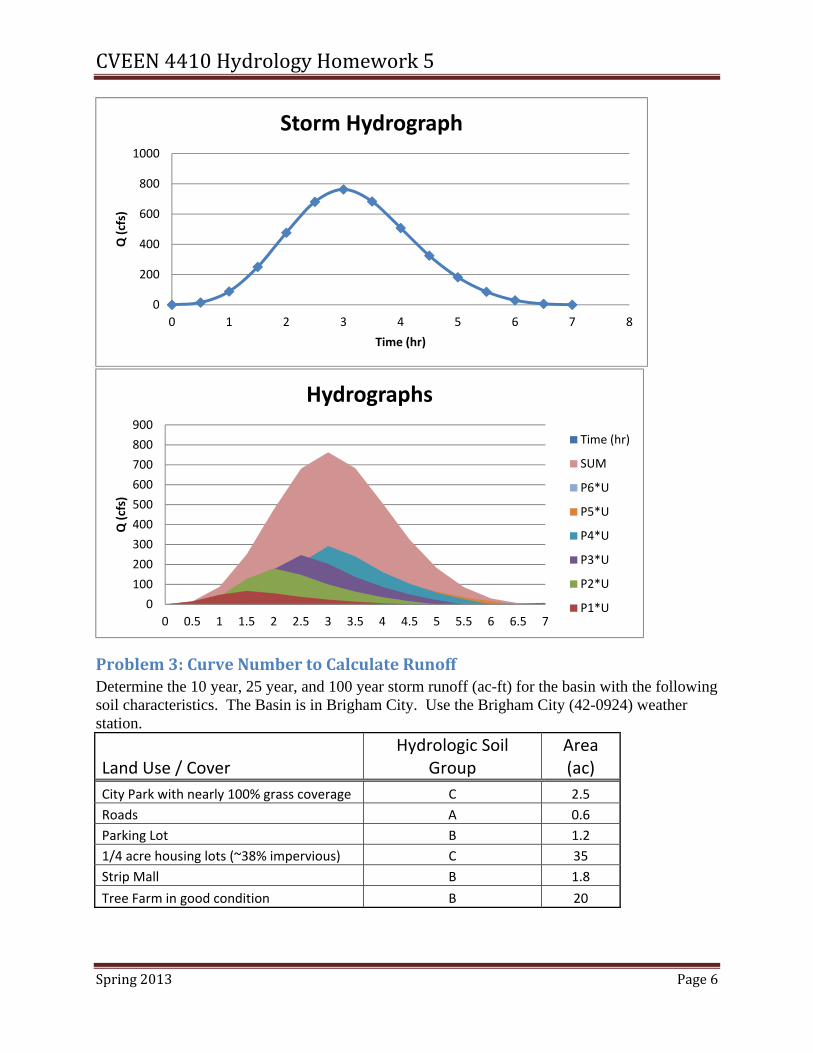
Problem3:CurveNumbertoCalculateRunoffDetermine the 10 year, 25 year, and 100 year storm runoff (ac-ft) for the basin with the following soil characteristics. The Basin is in Brigham City. Use the Brigham City (42-0924) weather station.
Land Use / Cover Hydrologic Soil
Group Area (ac)
City Park with nearly 100% grass coverage C 2.5
Roads A 0.6
Parking Lot B 1.2
1/4 acre housing lots (~38% impervious) C 35
Strip Mall B 1.8
Tree Farm in good condition B 20
0
200
400
600
800
1000
0 1 2 3 4 5 6 7 8
Q (cfs)
Time (hr)
Storm Hydrograph
0
100
200
300
400
500
600
700
800
900
0 0.5 1 1.5 2 2.5 3 3.5 4 4.5 5 5.5 6 6.5 7
Q (cfs)
Hydrographs
Time (hr)
SUM
P6*U
P5*U
P4*U
P3*U
P2*U
P1*U
CVEEN4410HydrologyHomework5
Spring2013 Page7
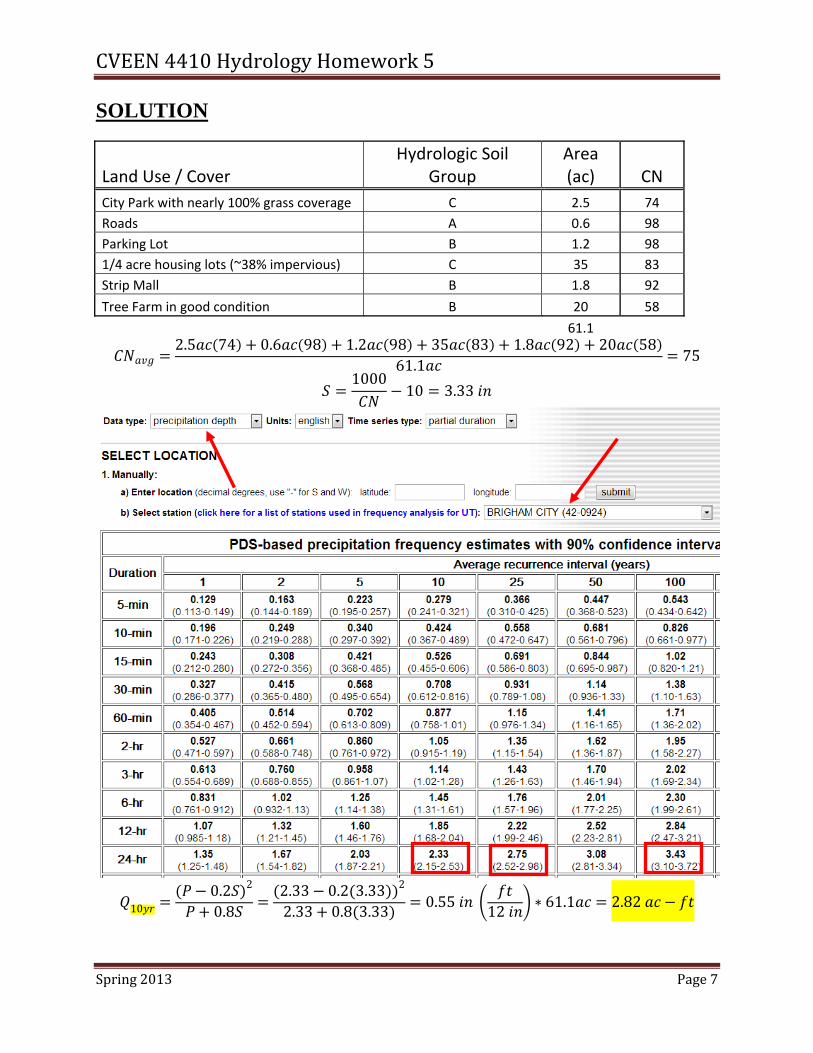
SOLUTION
Land Use / Cover Hydrologic Soil
Group Area (ac) CN
City Park with nearly 100% grass coverage C 2.5 74
Roads A 0.6 98
Parking Lot B 1.2 98
1/4 acre housing lots (~38% impervious) C 35 83
Strip Mall B 1.8 92
Tree Farm in good condition B 20 58
61.1 2.5 74 0.6 98 1.2 98 35 83 1.8 92 20 58
61.175
100010 3.33
100.2 2
0.82.33 0.2 3.33 2
2.33 0.8 3.330.55
12∗ 61.1 2.82
CVEEN4410HydrologyHomework5
Spring2013 Page8
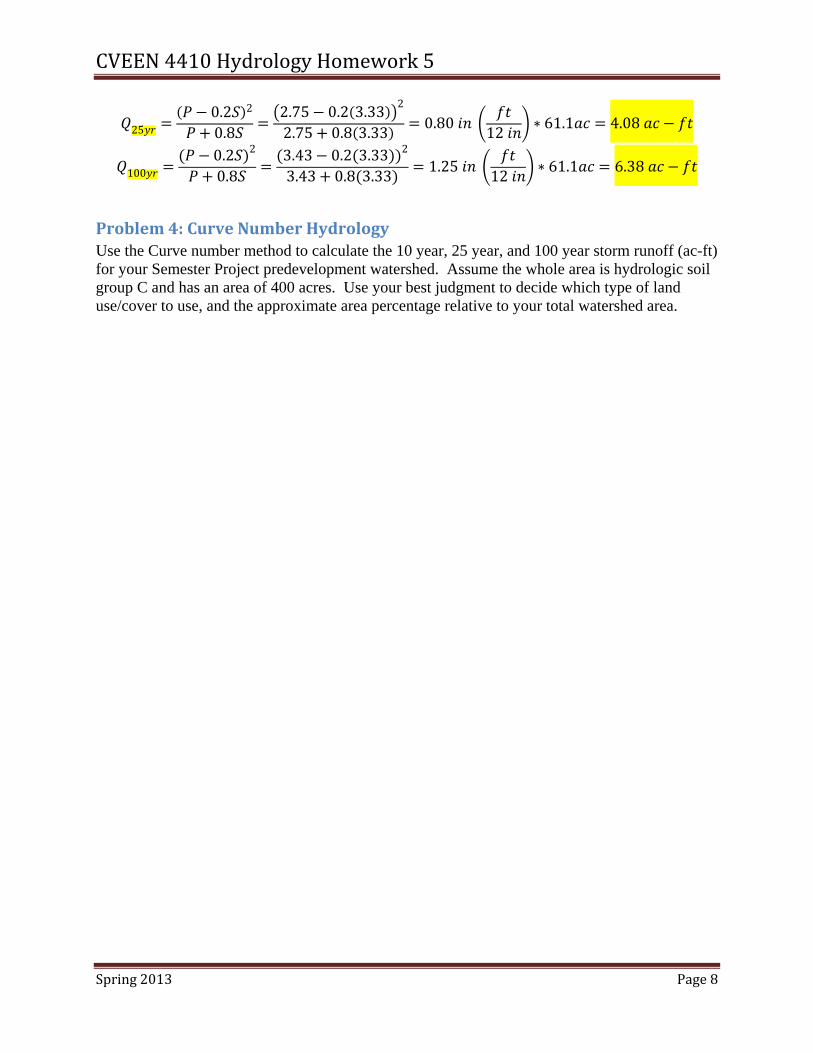
250.2 2
0.82.75 0.2 3.33
2
2.75 0.8 3.330.80
12∗ 61.1 4.08
1000.2 2
0.83.43 0.2 3.33 2
3.43 0.8 3.331.25
12∗ 61.1 6.38
Problem4:CurveNumberHydrologyUse the Curve number method to calculate the 10 year, 25 year, and 100 year storm runoff (ac-ft) for your Semester Project predevelopment watershed. Assume the whole area is hydrologic soil group C and has an area of 400 acres. Use your best judgment to decide which type of land use/cover to use, and the approximate area percentage relative to your total watershed area.
CVEEN4410HydrologyHomework5
Spring2013 Page9
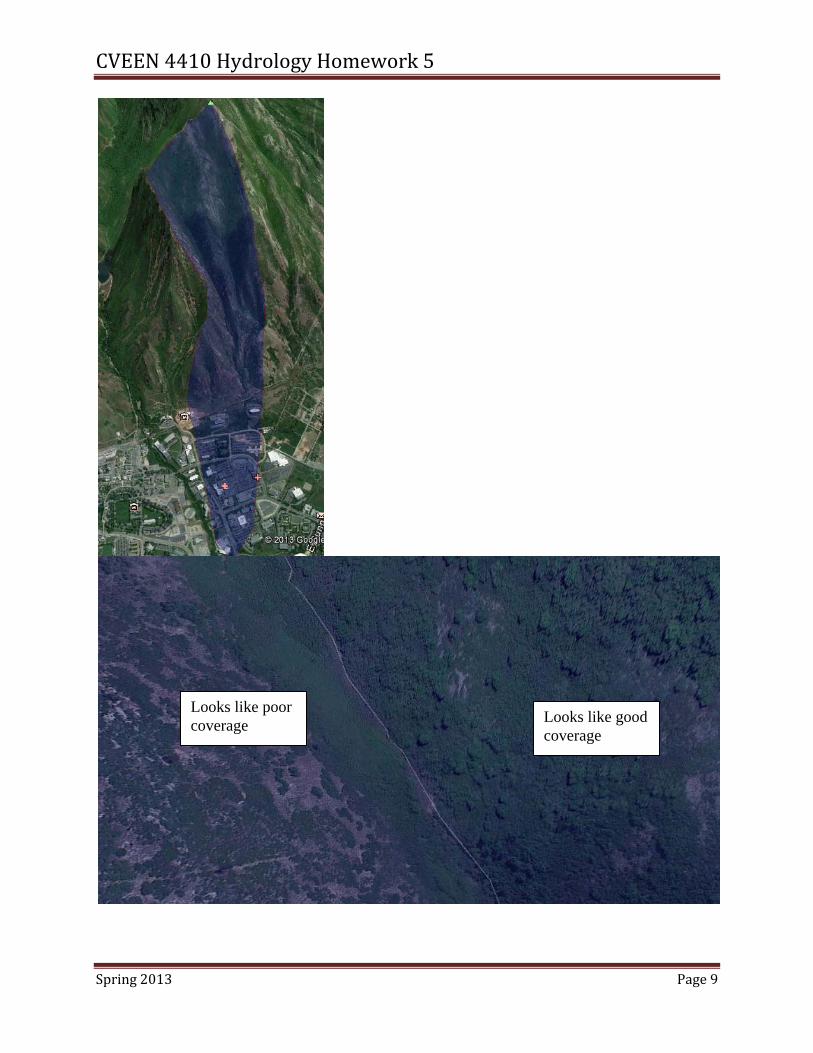
Looks like good coverage
Looks like poor coverage
CVEEN4410HydrologyHomework5
Spring2013 Page10
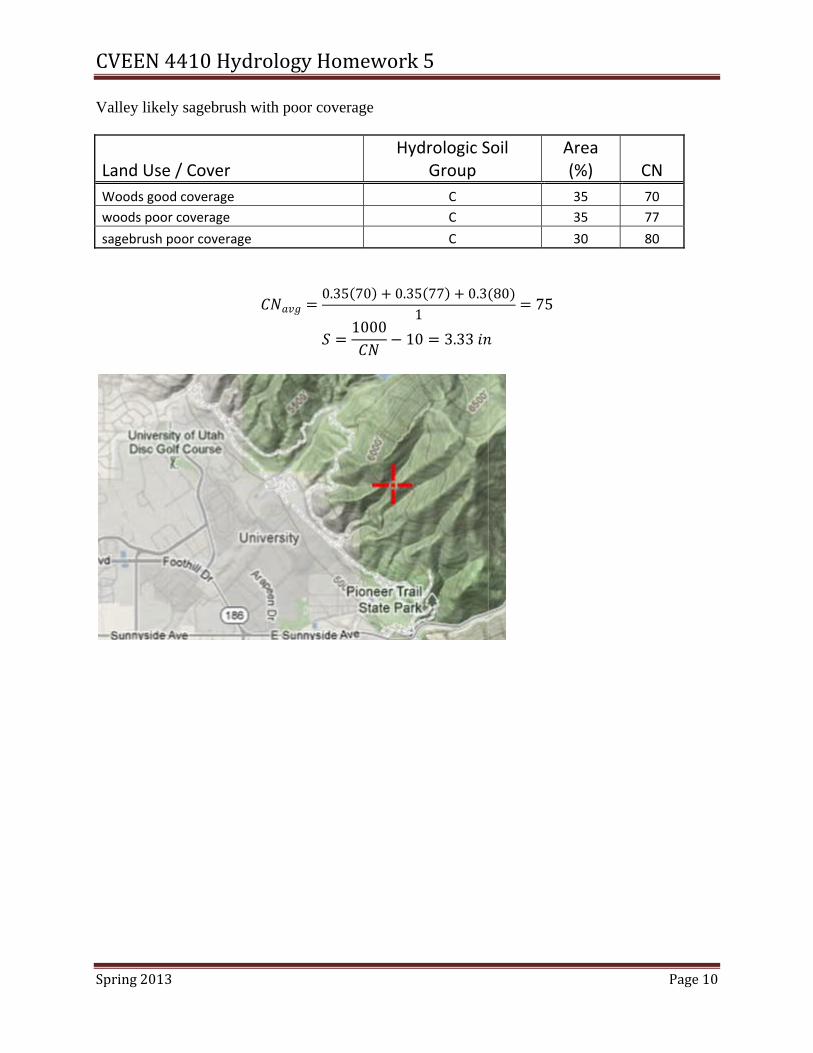
Valley likely sagebrush with poor coverage
Land Use / Cover Hydrologic Soil
Group Area (%) CN
Woods good coverage C 35 70
woods poor coverage C 35 77
sagebrush poor coverage C 30 80
0.35 70 0.35 77 0.3 801
75
100010 3.33
CVEEN4410HydrologyHomework5
Spring2013 Page11
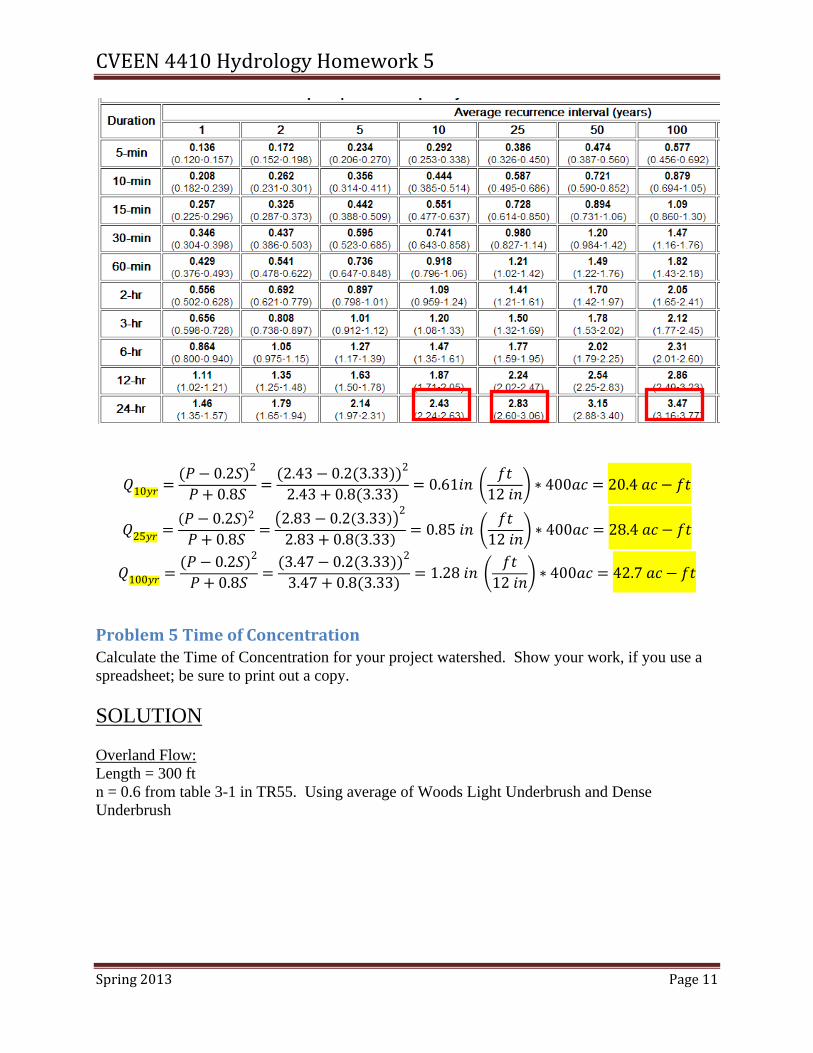
100.2 2
0.82.43 0.2 3.33 2
2.43 0.8 3.330.61
12∗ 400 20.4
250.2 2
0.82.83 0.2 3.33
2
2.83 0.8 3.330.85
12∗ 400 28.4
1000.2 2
0.83.47 0.2 3.33 2
3.47 0.8 3.331.28
12∗ 400 42.7
Problem5TimeofConcentrationCalculate the Time of Concentration for your project watershed. Show your work, if you use a spreadsheet; be sure to print out a copy.
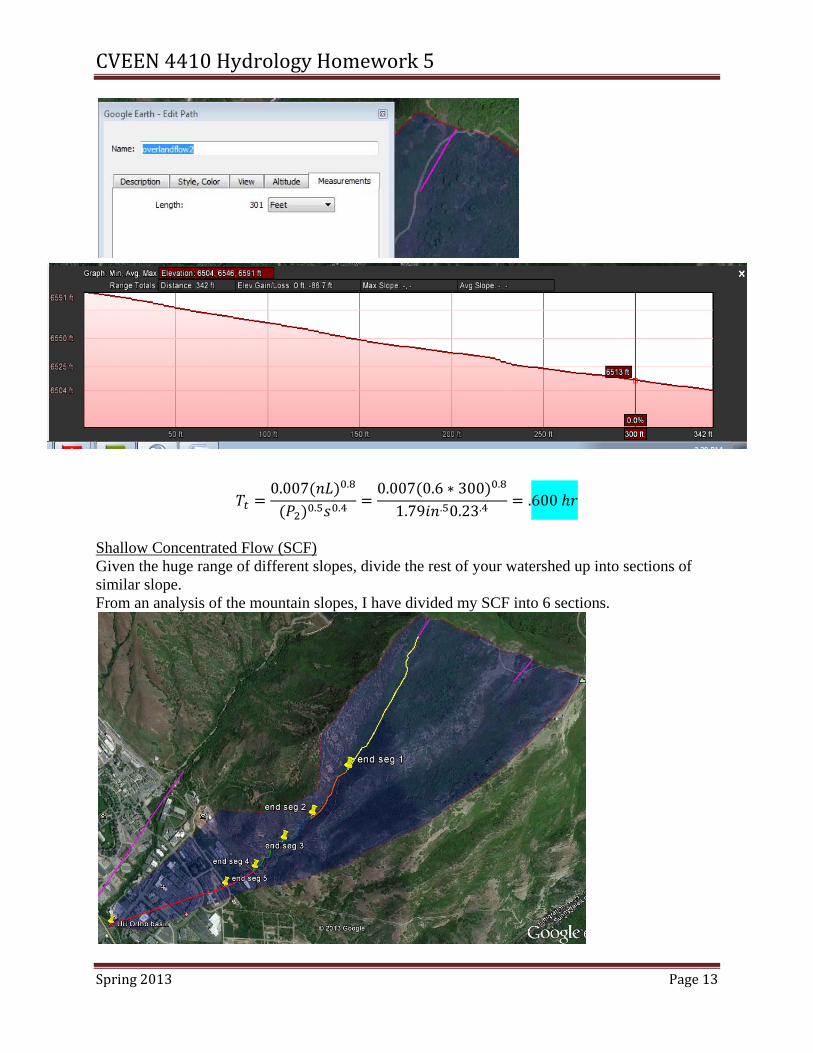
SOLUTION Overland Flow: Length = 300 ft n = 0.6 from table 3-1 in TR55. Using average of Woods Light Underbrush and Dense Underbrush
CVEEN4410HydrologyHomework5
Spring2013 Page12
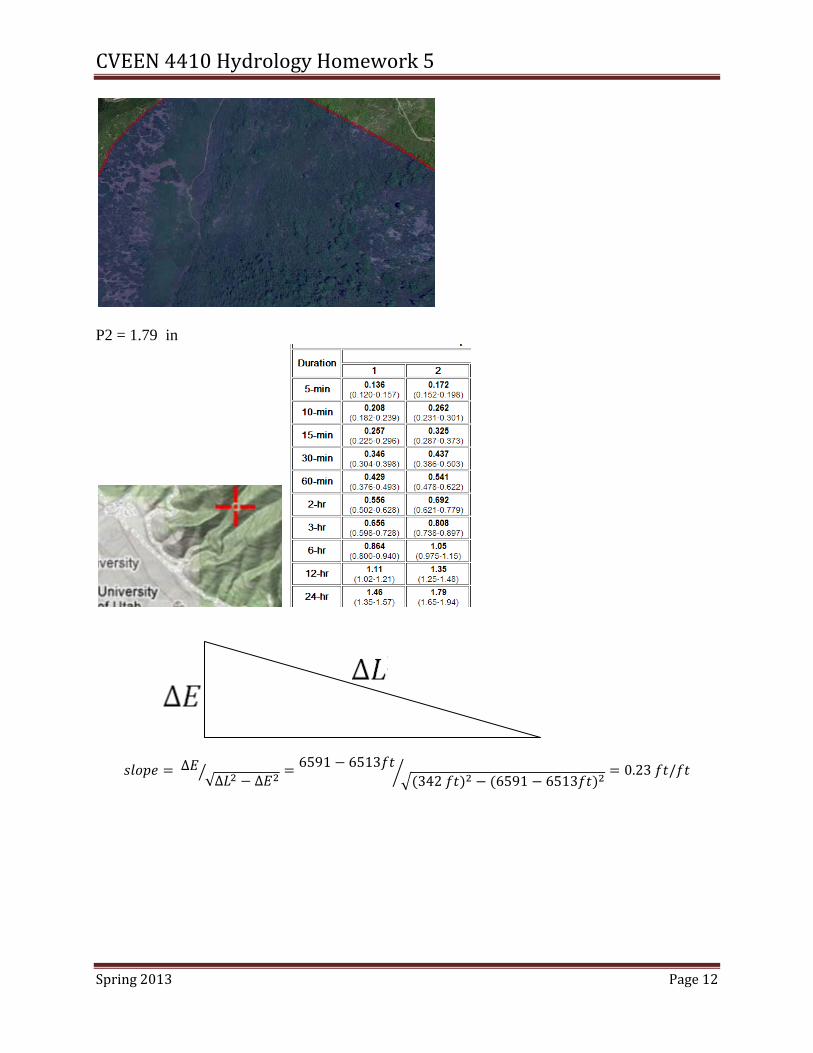
P2 = 1.79 in
∆√∆ ∆
6591 6513342 6591 6513
0.23 /
CVEEN4410HydrologyHomework5
Spring2013 Page13
0.007 .
. .
0.007 0.6 ∗ 300 .
1.79 . 0.23..600
Shallow Concentrated Flow (SCF) Given the huge range of different slopes, divide the rest of your watershed up into sections of similar slope. From an analysis of the mountain slopes, I have divided my SCF into 6 sections.
CVEEN4410HydrologyHomework5
Spring2013 Page14
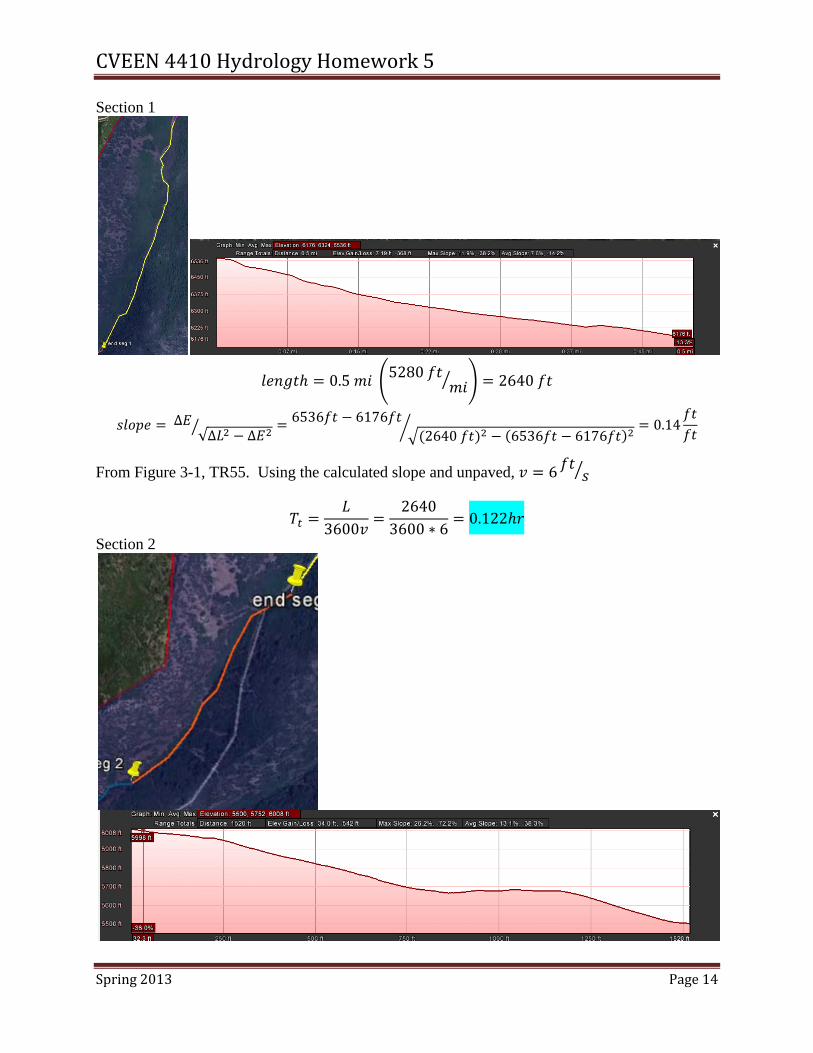
Section 1
0.5 5280 2640
∆√∆ ∆
6536 61762640 6536 6176
0.14
From Figure 3-1, TR55. Using the calculated slope and unpaved, 6
36002640
3600 ∗ 60.122
Section 2
CVEEN4410HydrologyHomework5
Spring2013 Page15
∆√∆ ∆
6008 55001520 6008 5500
0.35
From Figure 3-1, TR55. Using the calculated slope and unpaved, 9.5
36001520
3600 ∗ 9.50.044
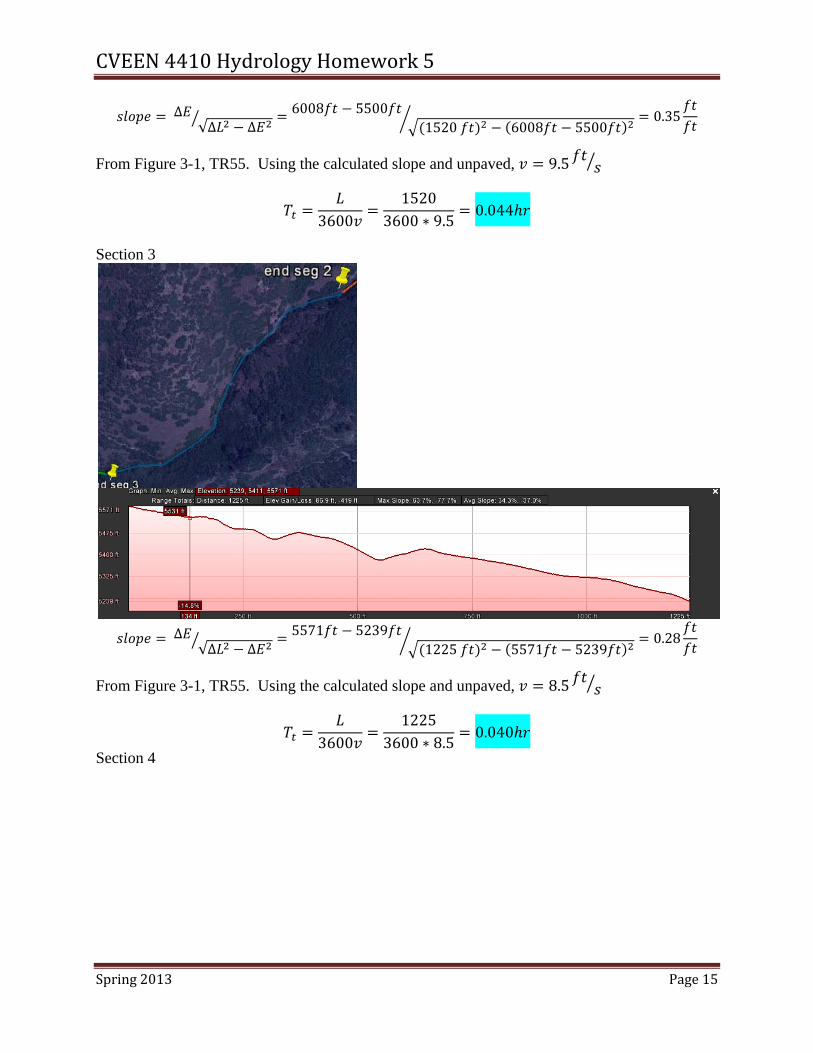
Section 3
∆√∆ ∆
5571 52391225 5571 5239
0.28
From Figure 3-1, TR55. Using the calculated slope and unpaved, 8.5
36001225
3600 ∗ 8.50.040
Section 4
CVEEN4410HydrologyHomework5
Spring2013 Page16
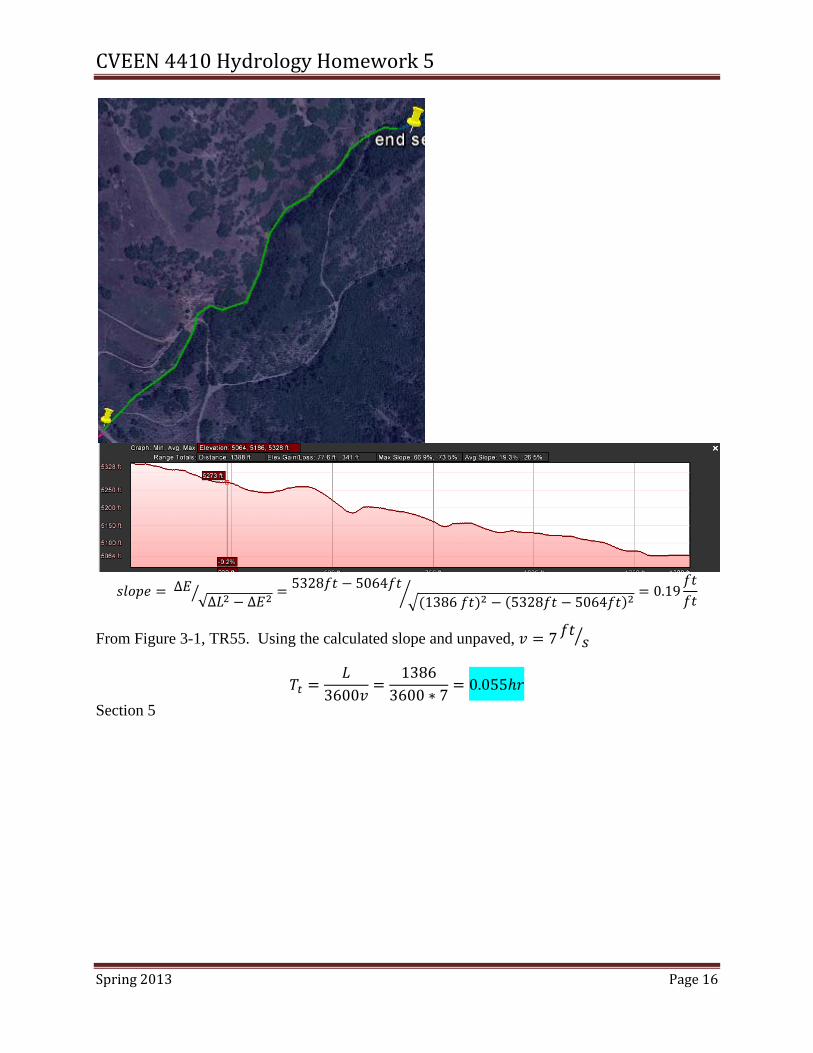
∆√∆ ∆
5328 50641386 5328 5064
0.19
From Figure 3-1, TR55. Using the calculated slope and unpaved, 7
36001386
3600 ∗ 70.055
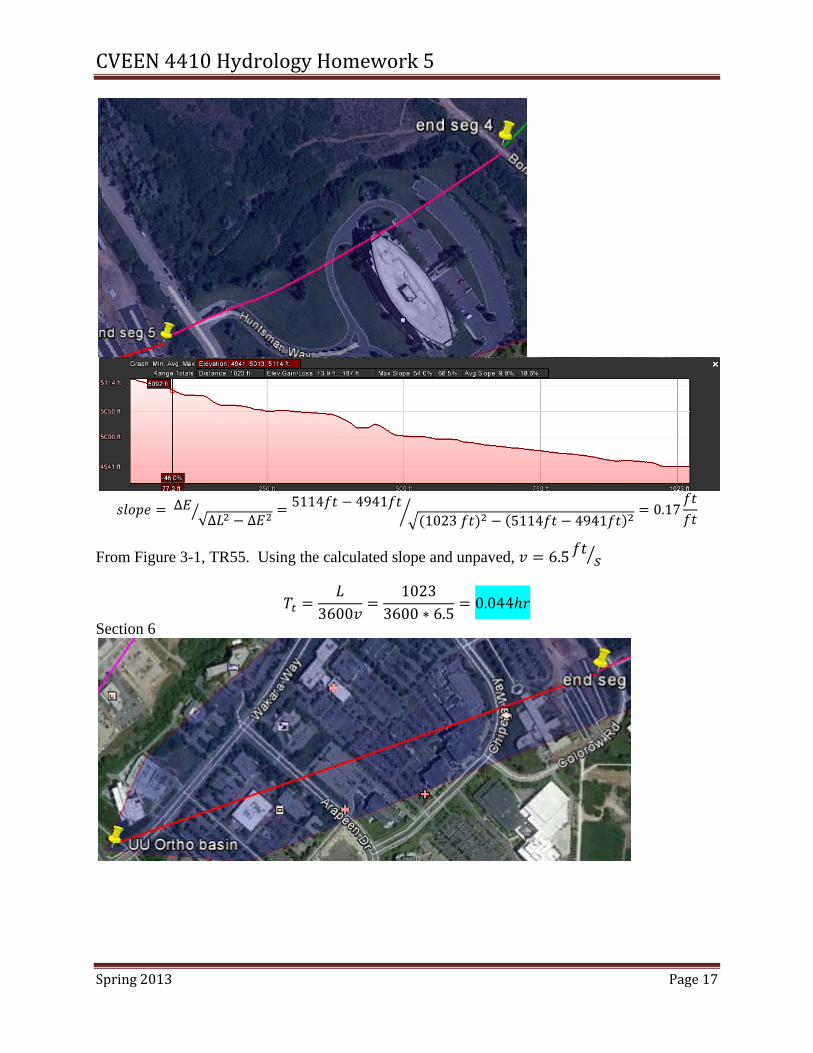
Section 5
CVEEN4410HydrologyHomework5
Spring2013 Page17
∆√∆ ∆
5114 49411023 5114 4941
0.17
From Figure 3-1, TR55. Using the calculated slope and unpaved, 6.5
36001023
3600 ∗ 6.50.044
Section 6

CVEEN4410HydrologyHomework5
Spring2013 Page18
0.68 5280 3590
∆√∆ ∆
4987 47363590 4987 4736
0.07
From Figure 3-1, TR55. Using the calculated slope and unpaved, 4.2
36003590
3600 ∗ 4.20.237
0.600 0.122 0.044 0.040 0.055 0.044 0.2371.142 68.5
Problem6:Cowan’sMethodYou survey a section of stream with the following characteristics:
Earthen bottom of fine sand
Minor irregularities in the reach
Occasional section changes
Minor woody debris from beaver activity
Moderate vegetation with some seedlings
No meandering
Calculate the Manning’s roughness coefficient.
CVEEN4410HydrologyHomework5
Spring2013 Page19
SOURCE: http://www.ntc.blm.gov/krc/uploads/398/CowanMethod.pdf