CUSTOMER SATISFACTION SURVEY REPORT … · 2 1. BACKGROUND A customer satisfaction survey needs to...
41
DMS 412664 CUSTOMER SATISFACTION SURVEY REPORT 2005 / 2006
Transcript of CUSTOMER SATISFACTION SURVEY REPORT … · 2 1. BACKGROUND A customer satisfaction survey needs to...

DMS 412664
CUSTOMER SATISFACTION SURVEY
REPORT
2005 / 2006

1
Table of Content
1. BACKGROUND .......................................................................................................... 2
2. SURVEY RESPONSE................................................................................................. 2
WATER SUPPLY SERVICE........................................................................................ 4 House connection water supply............................................................................... 5 Yard Connection...................................................................................................... 6 Communal Water Supply within 200metres ............................................................. 7 Communal water supply further than >200metres ................................................... 8
SANITATION SERVICE .............................................................................................. 8 Flushing toilet service .............................................................................................. 9 VIPs (Concrete)..................................................................................................... 10 Sandpit Latrine (Own)............................................................................................ 10
HEALTH CARE SERVICE......................................................................................... 11 TB Treatment ........................................................................................................ 12 Cholera Treatment ................................................................................................ 13 HIV/AIDS Counselling ........................................................................................... 14 Health Education (other than HIV/AIDS)................................................................ 15 Inoculations ........................................................................................................... 16
PROVINCIAL ROADS............................................................................................... 17 MUNICIPAL ROADS................................................................................................. 17 DOMESTIC REFUSE REMOVAL.............................................................................. 19
240 litre Bin service ............................................................................................... 19 Black bag service .................................................................................................. 19 Communal bin service ........................................................................................... 20 No Service............................................................................................................. 20
COMMUNICATION WITH THE COMMUNITY .......................................................... 21 uMhlathuze newsletter........................................................................................... 21 Ward committees .................................................................................................. 22 Telephonic Communication ................................................................................... 23 Personal Contact................................................................................................... 23 No communication with the municipality ................................................................ 23 Suitability of information in the Newsletter ............................................................. 24
ELECTRICITY SUPPLY............................................................................................ 25 IDP / BUDGET PROCESS ............................................................................................. 26 MUNICIPAL PAYPOINTS ......................................................................................... 27 SPORTS FACILITIES ............................................................................................... 29
Usage of sports facilities........................................................................................ 29 Satisfaction with sport facilities .............................................................................. 30
COMMUNITY FACILITES ......................................................................................... 31 Usage of facilities ................................................................................................. 31 Satisfaction with municipal facilities ....................................................................... 32
VEHICLE LICENSING SERVICE .............................................................................. 33 LAW ENFORCEMENT VISIBILITY ........................................................................... 34 AFTER-HOUR EMERGENCY SERVICES ................................................................ 35
Satisfaction with after-hours emergency services .................................................. 36
4. CONCLUSION .......................................................................................................... 37
5. COMMENTS RECEIVED .......................................................................................... 37

2
1. BACKGROUND A customer satisfaction survey needs to be conducted annually to obtain statistical data for the quality indicators developed within the Performance Management Framework of the Municipality. The customer satisfaction index is further required to review annual performance targets for services delivered by the municipality.
The total number of households in the uMhlathuze area of jurisdiction used for national indicators according to the uMhlathuze Water Services Development Plan was used as the basis. The Geographical distribution and the following population sample size survey, as reflected in the number of questionnaires, were utilized to ensure the statistical accuracy of the survey:
Urban Areas % of total
population
Required Number
of questionnaires per area
Actual
Number of questionnaires
per area Richards Bay 16.0% 480 482
Empangeni 9.0% 270 304 Nseleni 5.0% 150 155
Esikhawini 20% 600 604 Ngwelezane 6.0% 180 180
Vulindlela 1.0% 30 30
57% 1710 1755 Tribal Areas % of total
population
Number of
questionnaires per area
Actual
Number of questionnaires
per area
Bhejane Khoza 10.0% 300 307 Dube 4.0% 120 139
Madlebe 16.0% 520 523 Mkhwanazi North 13.0% 175 183
Mkhwanazi South 175 180
43% 1290 1332 Total 100% 3000 3087
For the purpose of this report the results will be illustrated for the total area of jurisdiction as well as separate responses for the urban areas and for the Tribal areas. Information on all the questions is available on all the different areas, with a further breakdown per suburb in Richards Bay. This information is available upon request.
2. SURVEY RESPONSE A total of 3087 households responded to the twenty five survey questions. The satisfaction level of these households with regard to the services is illustrated throughout this report. The following services were regarded as high priority: water supply, health care, sanitation/sewerage, electricity supply, domestic refuse removal, condition of roads, communication with the community, municipal pay points, sports facilities, licensing services, law enforcement visibility and after-hours emergency services. Most of these services are also identified to be National Key Performance Indicators.

3
The following figures illustrate the number of responses to the survey’s thirteen questions concerning satisfaction with particular services:
Respondents Distribution for Service Used
30743087
17662848
12152985
28871996
17922828
29533068
1977308730873074
2765
0 500 1000 1500 2000 2500 3000 3500
Municipal paypoint hoursSports facilities used
Use of after-hours servicesLaw enforcement visibility
Motorvehicle licensingHealth care services
Electrical supply serviceIDP / Budget process
Domestic refuse serviceCondition of roads
Condition of provincial roadsCommunication by uMhlathuze
Suitability of new lsetter informationSanitation/sew age service
Water supply serviceMuncipal facilites
Position of municipal paypoint
The above figure illustrates the number of respondents for each of the services as well as the percentage contributed towards the total number of the 38 023 population data.
Respondents Distribution for Service Used
Sanitation/sewage service
3087
4%
Water supply service
3087
7% M uncipal facilites
3074
7%
Position of municipal
paypoint
2765
6%
Condition of roads
2828
7%
Condition o f provincial
roads
2953
7%
Suitability o f newlsetter
info rmation
1977
4%
Communication by
uM hlathuze muncipality
3068
7%
Domestic refuse service
1792
4%
Electrical supply service
2877
7%IDP / Budget process
1986
5%
Health care services
2985
7%
M otorvehicle licensing
1215
5%
Law enforcement visibility
2848
6%
Use of after-hours
services
1766
4%
Sports facilities used
3074
7%M unicipal paypoint hours
3074
6%
The levels of customer satisfaction with the above services are discussed and illustrated individually below.

4
WATER SUPPLY SERVICE
The water supply service currently delivered to the community by the City of uMhlathuze is categorized in terms of National regulations. The categories are divided and measured as follows: house connections, yard connections, communal supply within 200 metres distance (RDP level); communal supply further than 200 metres distance, boreholes. The aim is to improve and upgrade the standard of water supply services level. The survey recorded customer satisfaction with the current service delivered to the community. The following figure illustrates the type of water supply service rendered to the 3087 households that were approached during the survey.
Water Supply Service (All)
(Total of 3087 respondents)
communal
supply >200m
4%yard tap
32%
communal
supply <200m
5%
no supply
6%
borehole
2%
house
connection
51%
The following figure illustrates the type of water supply service rendered to the households that were approached during the survey in the urban areas. The responses from the 1755 households currently served with water, are expressed as a percentage. 10 respondents do not have water supply.
Water Supply Service (Urban)
(Total of 1755 respondents)
borehole
0%
yard tap
7%
no supply
1%
communal
supply <200m
1%
communal
supply >200m
1%
house
connection
90% The following figure illustrates the type of water supply service rendered to the households that were approached during the survey in the tribal areas. The responses from the 1332 households currently served with water, are expressed as a percentage. 167 of the respondents do not have water supply.
Water Supply Service (Tribal)
(Total of 1332 respondents)
borehole
4%
communal
supply <200m
10%
house
connection
2%communal
supply >200m
8%
no supply
13%yard tap
63%

5
House connection water supply The number of households in the survey with this type of connection was 1611. The following figure illustrates a high satisfaction level among the respondents currently receiving this service. 4 respondents gave no response.
Satisfaction w tih house connection w ater supply (All)
(Total of 1611 respondents)
Totally
Unsatisfactory
1%Satisfactory
37%
Not
Completely
Satisfactory
8%
Excellent
54%
The following figure illustrates the satisfaction level among the 1579 respondents currently receiving this service in the urban areas:-
Satisfaction w ith house connection w ater supply (Urban)
(Total of 1579 respondents)
Totally
Unsatisfactory
1%Satisfactory
37%
Not
Completely
Satisfactory
8%
Excellent
54%
The following figure illustrates the satisfaction level among the 32 respondents currently receiving this service in the tribal areas:-
Satisfaction w ith house connection w ater supply (Tribal)
(Total of 32 respondents)
Satisfactory
59%
Not
Completely
Satisfactory
17%
Excellent
21%Totally
Unsatisfactory
3%

6
Yard Connection The number of households in the survey with yard connection was 911. The satisfaction level of the households currently receiving yard connection water supply is illustrated as follows: 56 respondents gave no response.
Satisfaction w ith Yard Connection Water Supply (All)
(Total of 911 respondents)
Totally
Unsatisfactory
6%
Satisfactory
55%
Excellent
13%
Not
Completely
Satisfactory
26%
The following figure illustrates the satisfaction level among the 131 respondents currently receiving this service in the urban areas:-
Satisfaction w ith Yard Connection Water Supply (Urban)
(Total of 131 respondents)
Totally
Unsatisfactory
2%
Excellent
17%
Satisfactory
65%
Not
Completely
Satisfactory
16%
The following figure illustrates the satisfaction level among the 780 respondents currently receiving this service in the tribal areas:-
Satisfaction w ith Yard Connection Supply (Tribal)
(Total of 780 respondents)
Satisfactory
53%
Not
Completely
Satisfactory
28%
Excellent
12%
Totally
Unsatisfactory
7%

7
Communal Water Supply within 200metres This level of service is as per RDP standard where running water is supplied via a communal water supply of a distance of no more than 200 metres from the residence. The satisfaction level of the 140 respondents currently receiving this service is illustrated as follows.
Satisfaction w ith communal w ater supply <200m (All)
(Total of 140 respondents)
Satisfactory
43%
Totally
Unsatisfactory
10%
Excellent
8%
Not
Completely
Satisfactory
39%
The following figure illustrates the satisfaction level among the 12 respondents currently receiving this service in the urban areas:-
Satisfaction w ith communal w ater supply <200m (Urban)
(Total of 12 respondents)
Excellent
8%
Totally Unsatisfactory
0%
Satisfactory
42%
Not
Completely
Satisfactory
50%
The following figure illustrates the satisfaction level among the 128 respondents currently receiving this service in the tribal areas:-
Satisfaction w ith communal w ater supply <200m (Tribal)
(Total of 128 respondents)
Totally
Unsatisfactory11%
Satisfactory
44%
Excellent
7%
Not
Completely
Satisfactory
38%

8
Communal water supply further than >200metres
The number of households in the survey with communal water supply was 121. There are 19 househoulds in the urban area with a water supply further than 200 metres. 2 respondents did not respond.
Satisfaction w ith communal w ater >200m (Urban)
(Total of 19 respondents)
Totally
Unsatisfactory0%
Satisfactory
53%
Not
Completely
Satisfactory
21%
Excellent
26%
The following figure illustrates the satisfaction level among the 128 respondents currently receiving this service:
Satisfaction w ith communal w ater supply >200m (Tribal)
(Total of 128 respondents)
Totally Unsatisfactory
11%
Excellent
7%
Satisfactory
44%
Not
Completely
Satisfactory
38%
SANITATION SERVICE
The following figure illustrates the distribution of the type of sanitation service delivered to the households surveyed. The total number of respondents was 3087. The 20% of households with no sanitation service are from the tribal areas and comprise 605 respondents.
Types of Sew erage/Sanitation Service
(Total of 3087 respondents)
Ow n
sandpit/toilet
2%
VIPS
(Concrete)
15%
Sandpit latrine
9%
No toilet
20%Flushing toilet
54%

9
Flushing toilet service A flushing toilet service is delivered to households in the urban and developed areas. The following figure illustrates the satisfaction rating of the 1667 respondents currently receiving this service. The satisfaction level for this service is exceptionally good.
Satisfaction w ith f lushing toilet (All)
(Total of 1667 respondents)
Totally Unsatisfactory
2%
Satisfactory
49%Not
Completely
Satisfactory
7%
Excellent
42%
The following figure illustrates the satisfaction level among the 1633 respondents currently receiving this service in the urban areas:
Satisfaction w ithflushing toilet (Urban)
(Total of 1633 respondents)
Totally
unsatisfactory
2%
Satisfactory
48% No completely
satisfactory
7%
Excellent
43%
The following figure illustrates the satisfaction level among the 34 respondents currently receiving this service in the tribal areas:
Satisfaction w ith flushing toilet service (Tribal)
(Total of 34 respondents)
Excellent
12%Totally
unsatisfactory
0%
Satisfactory
76%
No completely
satisfactory
12%

10
VIPs (Concrete) The VIPs (Concrete) service is predominantly delivered in the tribal areas. The number of respondents with this facility is 317.
Satisfaction w ith VIPS (Concrete) (All)
(Total of 317 respondents)
Excellent
5%Totally
Unsatisfactory
29%
Satisfactory
29%
Not
Completely
Satisfactory
37%
The following figure illustrates the satisfaction level among the 24 respondents currently receiving this service in the urban areas:
Satisfaction w ith VIPS (Concrete) (Urban)
(Total of 24 respondents)
Excellent
0%
Totally
Unsatisfactory
17%
Satisfactory
50%
Not
Completely
Satisfactory
33%
The following figure illustrates the satisfaction level among the 293 respondents currently receiving this service in the tribal areas:
Satisfaction w tih VIPS (Concrete) (Tribal)
(Total of 293 respondents)
Excellent
5%Totally
Unsatisfactory
30%
Satisfactory
27%
Not
Completely
Satisfactory
38%
Sandpit Latrine (Own) The VIPs (Concrete) service is not delivered to the whole community in the tribal and informal developed areas. Consequently, 47 respondents reported having sandpits or having constructed their own sandpit latrines.

11
HEALTH CARE SERVICE
2985 households from the total number of 3087 households approached during the survey reported having made use in the previous 12 months of the health care services provided by the uMhlathuze municipality. 1498 respondents did not make use of any health care services provided by the uMhlathuze municipality. The following figure illustrates the distribution of services used by the 2985 respondents. The services reported on in the survey are TB treatment, HIV/AIDS counselling, cholera treatment, health education (other than HIV/AIDS) and inoculations. Usage of, and satisfaction levels with, these services are illustrated in the next 18 charts.
Health Care Services (All)
(Total of 2985 respondents)
HIV/AIDS
6%
Health educ
11%
Cholera
4%TB
13%
None
51%
Inoculatons
15%
The following figure illustrates the distribution of health care services used by the 1685 respondents in the urban areas.
Health Care Services (Urban)
(Total of 1685 respondents)
HIV/AIDS
7%
Health educ
11%
Cholera
3%TB
10%
None
55%
Inoculatons
14%
The following figure illustrates the distribution of health care services used by the 1300 respondents in the tribal areas.
Health Care Services (Tribal)
(Total of 1300 respondents)
Health educ
11%HIV/AIDS
6%
Cholera
6%TB
18%
None
43%
Inoculatons
16%

12
TB Treatment The satisfaction levels of the 374 households which reported having made use of the TB treatment service is as follows:
Satisfaction w ith TB treatment (All)
(Total of 374 respondents)
Totally
Unsatisfactory
5%
Satisfactory
58%
Excellent
20%
Not
Completely
Satisfactory
17%
The following figure illustrates the satisfaction level among the 161 respondents who made use of the TB treatment service in the urban areas:
Satisfaction w ith TB treatment (Urban)
(Total of 161 respondents)
Totally
Unsatisfactory
4%
Satisfactory
54%
Not
Completely
Satisfactory
15%
Excellent
27%
The following figure illustrates the satisfaction level among the 213 respondents who made use of the TB treatment service in the tribal areas:
Satisfaction w ith TB treatment (Tribal)
(Total of 213 respondents)
Totally
Unsatisfactory
5%
Satisfactory
62%
Not
Completely
Satisfactory
19%
Excellent
14%

13
Cholera Treatment The number of households who reported having used this service was 121. Satisfaction levels are illustrated below:
Satisfaction w tih Cholera Treatment (All)
(Total of 121 respondents)
Totally
Unsatisfactory
5%
Satisfactory
47%
Not Completely
Satisfactory
17%
Excellent
31%
The following figure illustrates the satisfaction level among the 54 respondents who made use of the cholera treatment service in the urban areas:
Satisfaction w ith Cholera Treatment (Urban)
(Total of 54 respondents)
Totally
Unsatisfactory
6%
Satisfactory
48%
Not
Completely
Satisfactory
11%
Excellent
35%
The following figure illustrates the satisfaction level among the 67 respondents who made use of the Cholera treatment service in the tribal areas:
Satisfaction w ith Cholera Treatment (Tribal)
(Total of 67 respondents)
Totally
Unsatisfactory
4%
Satisfactory
47%
Not
Completely
Satisfactory
22%
Excellent
27%

14
HIV/AIDS Counselling The number of households who reported having used this service was 179. Satisfaction levels are illustrated below:
Satisfaction w ith HIV/AIDS Counselling (All)
(Total of 179 respondents)
Totally
Unsatisfactory
1%
Satisfactory
46%Not
Completely
Satisfactory
11%
Excellent
42%
The following figure illustrates the satisfaction level among the 112 respondents who made use of the HIV/AIDS counselling service in the urban areas:
Satisfaction w ith HIV/AIDS Counselling (Urban)
(Total of 112 respondents)
Satisfactory
44%
Not Completely
Satisfactory
9%
Excellent
47%
Totally
Unsatisfactory
0%
The following figure illustrates the satisfaction level among the 67 respondents who made use of the HIV/AIDS counselling service in the tribal areas:
Satisfaction w ith HIV/AIDS Counselling (Tribal)
(Total of 67 respondents)
Totally
Unsatisfactory
3%
Satisfactory
49%
Not Completely
Satisfactory
15%
Excellent
33%

15
Health Education (other than HIV/AIDS) The number of households responding to this question was 316. Satisfaction levels are illustrated below:
Satisfaction w ith Health Education (other than HIV/AIDS) (All)
(Total of 316 respondents)
Totally
Unsatisfactory
2%
Satisfactory
67%
Not Completely
Satisfactory
10%
Excellent
21%
The following figure illustrates the satisfaction levels among the 181 respondents who made use of the health education service in the urban areas:
Satisfaction w ith Health Education (other than HIV/AIDS) (Urban)
(Total of 181 respondents)
Satisfactory
61%Not Completely
Satisfactory
6%
Excellent
30%Totally
Unsatisfactory
3%
The following figure illustrates the satisfaction level among the 135 respondents who made use of the health education service in the tribal areas:
Satisfact ion with Health Educat ion (other than HIVAIDS) (Tribal)
(Total of 135 responndents)
Sat isfactory
77%
Not Completely
Sat isfactory
16%
Excellent
7%Totally
Unsat isfactory
0%

16
Inoculations The number of households who responded to this question was 439. Satisfaction levels are illustrated below:
Satisfaction w ith Inoculation (All)
(Total of 439 respondents)
Satisfactory
54%Not Completely
Satisfactory
16%
Excellent
27%
Totally
Unsatisfactory
3%
The following figure illustrates the satisfaction level among the 241 respondents who made use of the inoculations service in the urban areas:
Satisfaction w ith Inoculations (Urban)
(Total of 241 respondents)
Satisfactory
52%
Not Completely
Satisfactory
9%
Excellent
37%
Totally
Unsatisfactory
2%
The following figure illustrates the satisfaction level among the 198 respondents who made use of the inoculations service in the tribal areas:
Satisfaction w ith Inoculations (Tribal)
(Total of 198 respondents)
Totally
Unsatisfactory
3%
Satisfactory
57%
Not Completely
Satisfactory
24%
Excellent
16%

17
PROVINCIAL ROADS
The perception of the community with regard to their satisfaction with the provincial road infrastructure was measured in general. The number of households which responded to this question in the survey was 2953. The following figure illustrates the satisfaction response received.
Satisfaction w ith conditon of provincial roads (All)
(Total of 2953 respondents)
Totally
Unsatisfactory
19%
Satisfactory
37%
Not Completely
Satisfactory
24%
Excellent
20%
The following figure illustrates the satisfaction level among the 1736 respondents in the urban areas:
Satisfaction w ith conditions of provincial roads (Urban)
(Total of 1736 respondents)
Satisfactory
46%
Not Completely
Satisfactory
20%
Excellent
30%
Totally
Unsatisfactory
4%
The following figure illustrates the satisfaction level among the 1217 respondents in the tribal areas:
Satisfaction w ith condition of provincial roads (Tribal)
(Total of 1217 respoondents)
Totally
Unsatisfactory
39%
Satisfactory
25%
Not Completely
Satisfactory
29%
Excellent
7%
MUNICIPAL ROADS

18
The perception of the community with regard to their satisfaction with the roads infrastructure and condition of roads in their immediate vicinity was measured in general. This included tarred as well as gravel roads and streets. The number of households which responded to this question in the survey was 2828. The following figure illustrates the satisfaction response received.
Satisfaction w ith conditon of roads (All)
(Total of 2828 respondents)
Totally
Unsatisfactory
26%
Satisfactory
33%
Not Completely
Satisfactory
24%
Excellent
17%
The following figure illustrates the satisfaction level among the 1719 respondents in the urban areas:
Satisfaction w tih condition of raods (Urban)
(Total of 1719 respondents)
Totally
Unsatisfactory
6%
Satisfactory
45%Not Completely
Satisfactory
22%
Excellent
27%
The following figure illustrates the satisfaction level among the 1109 respondents in the tribal areas:
Satisfaction w ith conditon of rads (Tribal)
(Total of 1109 respondents)
Excellent
1%
Totally
Unsatisfactory
58%Satisfactory
13%
Not Completely
Satisfactory
28%

19
DOMESTIC REFUSE REMOVAL
The domestic refuse removal service currently delivered by the City of uMhlathuze to households in urban area is either 240 litre bins, black bags or communal bins. The total number of respondents to this question was 3087, of whom 1792 receive a domestic refuse removal service. Distribution of the type of refuse removal service received by these respondents is illustrated below:
Type of Domestic Refuse Removal Service
(Total of 1792 respondents)
240L bin
23%
Communal bin
6%Black bags
71%
240 litre Bin service This service is delivered predominantly in the Richards Bay area once per week. The service satisfaction level as experienced by the 401 of the 1792 respondents receiving this service is illustrated below:
Satisfaction w ith domestic refuse removal - 240L bin
(Total of 401 respondents)
Satisfactory
45%
Not Completely
Satisfactory
5%
Totally
Unsatisfactory
3%Excellent
47%
Black bag service This service is delivered in Empangeni and other municipal areas once per week. The satisfaction level with this service as experienced by 1255 of the 1792 respondents receiving a domestic refuse service is as follows:
Satisfaction w ith domestic refuse removal - Black Bags
(Total of 1255 respondents)
Satisfactory
56%Not Completely
Satisfactory
12%
Excellent
29%
Totally
Unsatisfactory
3%

20
Communal bin service This service is delivered in some of the tribal municipal areas once per week. The satisfaction level with service delivery as experienced by the 52 of the 1792 respondents receiving a domestic refuse service is as follows:
Satisfaction w ith domestic refuse removal - Communal Bin
(Total of 52 respondents)
Totally
Unsatisfactory
10%
Satisfactory
29%
Not Completely
Satisfactory
46%
Excellent
15%
No Service 1386 of the households who participated in the survey receive no domestic refuse removal service. These households are in the tribal areas.

21
COMMUNICATION WITH THE COMMUNITY
Communication between the City of uMhlathuze and the community is very important for public participation. The public need to be informed regularly on all issues and their inputs and participation must be obtained to make informed decisions for the future. Communication between the Municipality and its inhabitants was classified in the survey as follows: personal contact; telephonic contact; ward committees; the uMhlathuze newsletter; no contact. The following chart illustrates the response distribution per category from the 3087 households which responded to the question:
Communication w ith the community
(Total of 3068 respondents)
Ward
committees
18%
uMhlathuze
New sletter
46%
Personal
contact
5%
Telephonic
contact
3%
No contact
28%
uMhlathuze newsletter The newsletter seems to be very popular and is generally well accepted. Of the 3087 respondents who signalled that they receive communication from the Municipality, 1402, receive it via the newsletter. However, 1304 of these are from the urban areas, and only 98 are from the tribal areas. The satisfaction level of the 1402 respondents receiving the newsletter in all areas is as follows:
Satisfaction w ith communication via uMhlathuze New letter
(Total of 1402 respondents)
Totally
Unsatisfactory
2%
Satisfactory
61%
Not Completely
Satisfactory
15%
Excellent
22%

22
Ward committees 536, of those who responded to the question on communication receive information from the Municipality via the ward committee system. Of these, 63 live in urban areas and 473 live in tribal areas. Satisfaction levels with this system are as follows:
Satisfaction with communication via Ward Committees (All)
(Total of 536 respondents)
Satisfactory
50%
Totally
Unsatisfactory
7%
Excellent
4%
Not
Completely
Satisfactory
39%
Satisfaction w ith communication via Ward Committees (Urban)
(Total of 63 respondents)
Totally
Unsatisfactory
3%
Satisfactory
49%
Not Completely
Satisfactory
35%
Excellent
13%
Satisfaction w ith communication via Ward Committees (Tribal)
(Total of 473 respondents)
Satisfactory
51%
Totally
Unsatisfactory
8%
Excellent
2% Not Completely
Satisfactory
39%

23
Telephonic Communication In the survey, 83 of the respondents indicated that they receive communication from the uMhlathuze Municipality telephonically. Of these, 52 live in urban areas and 31 live in tribal areas. Satisfaction levels with this form of communication are recorded below:
Satisfaction w ith telephonic communication
(Total of 83 respondents)
Totally
Unsatisfactory
4%
Satisfactory
71%
Not Completely
Satisfactory
12%
Excellent
13%
Personal Contact 137 respondents cited “personal contact” as the means by which the Municipality keeps in touch with them. Of these, 102 live in urban areas. Satisfaction levels with this form of communication are recorded below:
Satisfaction w ith communication via Personal Contact
(Total of 137 respondents)
Totally
Unsatisfactory
4%
Satisfactory
53%
Not Completely
Satisfactory
21%
Excellent
22%
No communication with the municipality
685 respondents do not have any communication with the municipality. Of these, 60 respondents are from urban areas and 625 from tribal areas.
No communication w ith the Municipality
(Total of 685 respondents)
Excellent
0%
Totally
Unsatisfactory
48%
Satisfactory
12%
Not Completely
Satisfactory
40%

24
Suitability of information in the Newsletter
Satisfaction of suitability of information in New sletter (All)
(Total of 1753 respondents)
Totally
Unsatisfactory
5%
Satisfactory
57%
Not Completely
Satisfactory
17%
Excellent
21%
Satisfaction w ith suitability of information in New sletter (Urban)
(Total of 1429 respondents)
Excellent
22%
Not Completely
Satisfactory
14%
Satisfactory
60%
Totally
Unsatisfactory
4%
Satisfaction of suitability of information in New sletter (Tribal)
(Total of 273 respondents)
Totally
Unsatisfactory
14%
Satisfactory
39%
Not Completely
Satisfactory
33%
Excellent
14%

25
ELECTRICITY SUPPLY
Of the 3087 households surveyed, 2887 reported having electricity. (1726 of these were in the urban areas and 1109 in the tribal areas). Customer satisfaction with the quality of their electricity supply is recorded in the three charts below:
Satisfaction w ith Electricity Supply (ALL)
(total of 2887 respondents)
Totally
Unsatisfactory
4%
Satisfactory
48%Not Completely
Satisfactory
15%
Excellent
33%
Satisfaction w ith Electrical Supply (Urban)
(Total of 1726 respondents)
Satisfactory
45%
Not Completely
Satisfactory
13%
Excellent
40%
Totally
Unsatisfactory
2%
Satisfaction w ith electrical Supply (Tribal)
(Total of 1109 respondents)
Totally
Unsatisfactory
6%
Satisfactory
55%
Not Completely
Satisfactory
16%
Excellent
23%

26
IDP / BUDGET PROCESS
Satisfaction on IDP/Budget process (All)
(Total of 1996 respondents)
Totally
Unsatisfactory
27%
Satisfactory
34%
Not Completely
Satisfactory
24%
Excellent
15%
Satisfaction IDP/Budget process (Urban)
(Total of 1349 respondents)
Totally
Unsatisfactory
20%
Satisfactory
41%
Not Completely
Satisfactory
22%
Excellent
17%
Satisfaction on IDP/Budget process (Tribal)
(Total of 647 respondents)
Totally
Unsatisfactory
41%
Satisfactory
21%
Not Completely
Satisfactory
28%
Excellent
10%

27
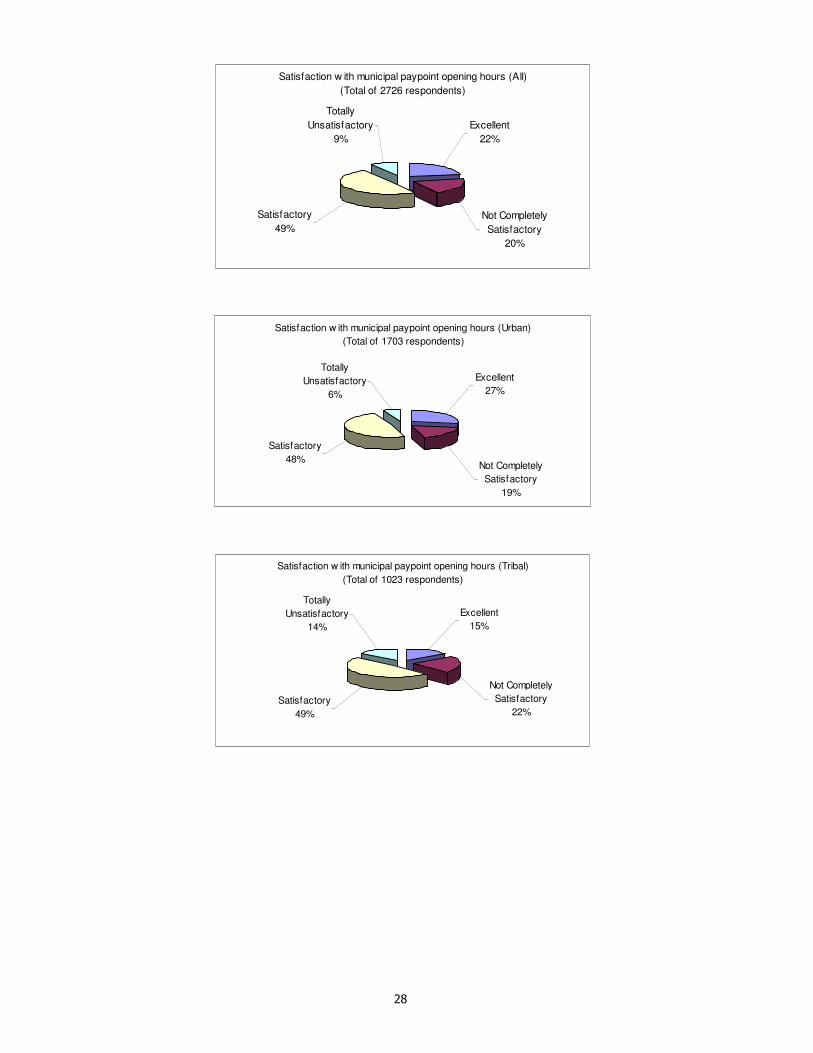
MUNICIPAL PAYPOINTS
A majority of households surveyed 2765 make use of Municipal paypoints. Of these, 1698 are urban dwellers. Satisfaction levels with regard to location and opening times of these paypoints are recorded in the charts below:
Satisfaction with position of municipal paypoint (All)
(Total of 2765 respondents)
Excellent
27%
Not
Completely
Satisfactory
20%
Satisfactory
44%
Totally
Unsatisfactory
9%
Satisfaction w ith position of municipal paypoint (Urban)
(Total of 1698 respondents)
Totally
Unsatisfactory
3%
Satisfactory
50%
Excellent
37%
Not
Completely
Satisfactory
10%
Satisfaction w ith position of municipal paypoint (Tribal)
(Total of 1067 respondents)
Totally
Unsatisfactory
20%
Satisfactory
35%
Not Completely
Satisfactory
35%
Excellent
10%
28
Satisfaction w ith municipal paypoint opening hours (All)
(Total of 2726 respondents)
Totally
Unsatisfactory
9%
Satisfactory
49%
Not Completely
Satisfactory
20%
Excellent
22%
Satisfaction w ith municipal paypoint opening hours (Urban)
(Total of 1703 respondents)
Totally
Unsatisfactory
6%
Satisfactory
48%Not Completely
Satisfactory
19%
Excellent
27%
Satisfaction w ith municipal paypoint opening hours (Tribal)
(Total of 1023 respondents)
Totally
Unsatisfactory
14%
Satisfactory
49%
Not Completely
Satisfactory
22%
Excellent
15%

29
SPORTS FACILITIES
The following charts illustrate levels of respondent satisfaction with the availability and quality of Municipal sports facilities, and usage thereof. 1175 of respondents indicated that there are no sports facilities in their area. Of these responses, 979 were from the tribal areas.
Usage of sports facilities
Usage of sports facilites (All)
(Total of 3087 respondents)
No facilities
38%
Sometimes
30%
Never
19%
Frequently
13%
Usage of sport facilites (Urban)
(Total of 1749 respondents)
No facilities
11%
Sometimes
42%Never
27%
Frequently
20%
Usage of sports facilities (Tribal)
(Total of 1338 respondents)
No facilities
73%
Frequently
3%
Sometimes
15%
Never
9%

30
Satisfaction with sport facilities There were 1855 responses regarding the quality of sporting facilities. (1232 respondents did not offer comment, either because there are no facilities, or they do not use them).
Satisfaction w ith sports facilites (All)
(Total of 1855 respondents)
Totally
Unsatisfactory
11%
Satisfactory
50%
Not Completely
Satisfactory
25%
Excellent
14%
The following figure illustrates satisfaction levels among the 1449 respondents in urban areas (304 respondents did not offer comment, either because there are no facilities, or they do not use them):
Satisfaction w ith sports facilites (Urban)
(Total of 1449 respondents)
Totally
Unsatisfactory
7%
Satisfactory
52%
Not Completely
Satisfactory
24%
Excellent
17%
The following figure illustrates the satisfaction level among the 406 respondents in the tribal areas (928 respondents did not offer comment, either because there are no facilities, or they do not use them):
Satisfaction w ith sports facilites (Tribal)
(Total of 406 respondents)
Totally
Unsatisfactory
27%
Excellent
2%
Satisfactory
40%
Not Completely
Satisfactory
31%

31
COMMUNITY FACILITES
Usage of facilities
Usage of Municipal Facilites (All)
(Total of 3074 respondents)
No facilities
34%
Sometimes
37%
Never
10%
Frequently
19%
Usage of municipal facilites (UIrban)
(Total of 1751 respondents)
Sometimes
54% Never
11%
Frequently
30%
No facilities
5%
Usage of Municipal Facilites (Tribal)
(Total of 1323 respondents)
No facilities
73%
Sometimes
15%
Never
9%
Frequently
3%

32
Satisfaction with municipal facilities
Satisfaction w ith Municipal Facilites (All)
(Total 1977 respondents)
Totally
Unsatisfactory
8%
Satisfactory
56%
Not Completely
Satisfactory
18%
Excellent
18%
Satisfaction w ith Municipal Facilites (Urban)
(Total of 1598 respondents)
Satisfactory
60%
Totally
Unsatisfactory
3%
Not Completely
Satisfactory
15%
Excellent
22%
Satisfaction w ith municipal facilites (Tribal)
(Total of 405 respondents)
Satisfactory
47%
Totally
Unsatisfactory
25% Not Completely
Satisfactory
25%
Excellent
3%

33
VEHICLE LICENSING SERVICE
1215 respondents indicated that they had made use of the Municipality’s vehicle licensing service. (1872 respondents indicated that they did not make use of the Municipality’s vehicle licensing service). Their levels of satisfaction with the service are indicated in the following figure:
Satisfaction w ith licensing service (All)
(Total of 1215 respondents)
Excellent
26%
Not Completely
Satisfactory
16%
Satisfactory
51%
Totally
Unsatisfactory
7%
The following figure illustrates the satisfaction level among the 1074 respondents from the urban areas (681 respondents did not make use of this service):
Satisfaction w ith licensing service (Urban)
(Total of 1074 respondents)
Totally
Unsatisfactory
7%
Satisfactory
51%Not Completely
Satisfactory
16%
Excellent
26%
The following figure illustrates the satisfaction level among the 141 respondents from the tribal areas (1191 respondents did not make use of this service):
Satisfaction w ith licensing service (Tribal)
(Total of 141 respondents)
Totally
Unsatisfactory
6%
Satisfactory
50% Not Completely
Satisfactory
18%
Excellent
26%

34
LAW ENFORCEMENT VISIBILITY
The following figure illustrates the response received from 3006 respondents from all areas expressing their satisfaction level with regard to the visibility of the Municipality’s law enforcement service. It is important to note that respondents referred to SAPS personnel as well as to the Municipality’s law enforcement service. 81 respondents did not respond
Satisfaction w ith law enforcement visiblity (All)
(Total of 3006 respondents)
None
51%
Excellent
4%
Totally
Unsatisfactory
18%
Satisfactory
16%
Not Completely
Satisfactory
11%
The following figure illustrates the satisfaction level among the 1728 respondents of the total above living in the urban areas:
Satisfaction w ith law enforcement (Urban)
(Total of 17281 respondents)
52%
None
20%
Totally
Unsatisfactory
9%
Satisfactory
12%
Not Completely
Satisfactory
7%
The following figure illustrates the satisfaction level among the 1278 respondents of the total above living in the tribal areas. 54 respondents did not respond :
Satisfaction w ith law enforcement visibility (Tribal)
(Total of 1278 respondents)
None
67%
Totally
Unsatisfactory
19%
Satisfactory
7%
Excellent
1%
Not Completely
Satisfactory
6%

35
AFTER-HOUR EMERGENCY SERVICES
1766 respondents indicated that they had called upon the Municipality’s after-hours emergency services in the past 12 months (1321 respondents did not make use of this service). 1124 of the responses were received from the urban areas, and 642 from the tribal areas. It should be noted that the vast majority, if not all, of the responses with reference to use of after-hours emergency services refer to the SAPS rather than to the Municipality’s law enforcement. The following figures illustrate the type of after-hours emergency services called upon:
Types of after-hours emergency service (All)
(Total of 1766 respondents)
Electricity
51%
Fire & Rescue
2%
Law
Enforcement
10%
Sewage
9%
Water
28%
Type of after-hours emergency services (Urban)
(Total of 1124 respondents)
Water
30%Electricity
47%
Fire & Rescue
2%
Law
Enforcement
9%
Sewage
12%
Type of after-hours ermegency service (Tribal)
(Total of 642 respondents)
Electricity
57%Fire & Rescue
2%
Sew age
3%
Law
Enforcement
12%
Water
26%

36
Satisfaction with after-hours emergency services The following figures illustrate the satisfaction level of all responses received, urban and tribal.
Satisfaction w tih after-hours emergency services (All)
(Total of 1861 respondents)
Totally
Unsatisfactory
15%
Satisfactory
48%
Not Completely
Satisfactory
22%
Excellent
15%
Satisfaction w ith after-hours emergency services (Urban)
(Total of 1267 respondents)
Totally
Unsatisfactory
12%
Satisfactory
46%
Not Completely
Satisfactory
21%
Excellent
21%
Satisfaction w ith after-hours emergency service (Tribal)
(Total of 594 respondents)
Totally
Unsatisfactory
23%
Excellent
4%
Satisfactory
47%
Not Completely
Satisfactory
26%

37
4. CONCLUSION The survey confirms that in the more developed areas of the Municipality people are, by and large, satisfied with the services they receive. In the less well developed urban areas, levels of satisfaction drop. Dissatisfaction is greatest in the tribal areas. A number of respondents in these areas expressed anger that (yet) another survey was being conducted when there had been no noticeable change in response to concerns raised in the previous survey.
5. COMMENTS RECEIVED The following comments were made by respondents. (Only issues raised by a number of households, as opposed to an issue of concern to one individual, are highlighted here).
Richards Bay Aquadene
1. Community hall very small 2. Storm water problem 3. No speed humps 4. Would like house refuse to be removed twice a week 5. Need a clinic 6. Sports ground not looked after 7. Need to be informed beforehand if there is going to be power interruption
Brackenham
1. Need speed humps 2. Need street lights 3. Refuse not collected 4. Sports ground not taken care of
Weldenweide
1. Need street humps 2. Need street lights 3. Municipal workers do not remove refuse bags which are placed next to a 240 litre bin when there is no space to put in more refuse 4. No sports facilities 5. No parks 6. No library 7. Muddy drinking water
Veldenvlei
1. Open sites not looked after, hiding place for criminals 2. Need more street lights 3. Need a library

38
Birdswood
1. No sports facilities 2. No street lights 3. Need speed pumps 4. Soil that accumulates on roads during rainy weather is not removed
Mandlanzini
1. No sports facilities 2. RBM road causes chest problems for communities residing next to the road 3. VIP toilets are falling apart 4. Want household refuse to be removed by municipality 5. Water always muddy
Meerensee
1. Need skip bins next to school grounds 2. Not enough sports facilities 3. Library not well stocked 4. Trees alongside the road cause problems for motorists 5. Not informed when the municipality is working on electrical power 6. Need to clear up open spaces
Arboretum
1. Need speed humps 2. Water tastes bad 3. Water pipes burst all the time
Mzingazi
1. No sports facilities 2. No municipal toilets 3. No community facilities e.g. hall, library etc 4. Boreholes a distance away from households 5. Poor roads 6. Never alerted when power is going to be cut
Empangeni
1. House refuse remains on the streets for a long time before it is collected. Also when it is finally removed rubbish that drops off the bags is just left littering the streets 2. Muddy water from the taps 3. Electricity turned off without notice 4. Municipal contractors who mow grass alongside the streets leave piles of grass lying next to the streets. 5. Pot holes are becoming a problem for motorists
6. Toilets at the sports ground are not in a good order 7. Trees alongside the streets are not taken care of. They cause accidents on the road 8. Confusion with reading water meters caused by estimation system
9. Street lights are not always working

39
Hillview
1. Air pollution from Ticor South Africa 2. No library 3. No sports ground 4. Need street humps 5. Empty sites with long grass becoming a hiding place for criminals 6. Pot holes
Nseleni
1. VIPs are too small! 2. Some people don’t know about the IDP process 3. Sometimes have to go to Richards Bay, because the local paypoint runs out of cards 4. People want more free electricity, (e.g. those households where a pensioner was the only
one bringing money in, and when they die there’s no income at all, so the bill can’t be paid) 5. Sports facilities dirty, grass not cut 6. Lack of capacity in community halls (not enough seats for everyone) 7. Library is shared with Khoza - shortage of books
Esikhawini
1. There are water cuts/ interruptions to supply; some complaints about taste of water; leaking pipes 2. Meter readings wrongly recorded; Meters located in gardens can’t be read 3. Broken sewer pipes – residents told to fix them themselves 4. With reference to rubbish collection: lack of supply of black bags; poor quality of bags; if bags delivered when householder not home they get stolen 5. Need a dump for garden refuse 6. There is a Clinic, but when you go there is no medicine, long queues, nurses are rude or neglectful or ignore patients, so you end up going to the Pharmacy 7. Provincial roads are poor: potholes; humps are getting flattened, which leads to speeding; undergrowth/verges need cutting; need pavements for pedestrians 8. Municipal roads: streets too narrow; need pavements; need more humps; where there are humps, they are not signposted; no street signs; where there are street signs, the locals don’t know the people they’re named after; potholes 9. Some people don’t receive the newsletter. It’s only available in at paypoints and in the Library 10. Paypoint position is satisfactory, but people don’t like having their usage estimated. Opening times are a problem if you have a job. 11. Facilities are generally not good. Soccer pitches not good quality and don’t have lights; need benches and grandstands. Not safe at night. The Library is not good enough for students’ study purposes. Poor quality community halls. There are only soccer fields; need facilities for other codes. No facilities for children. The swimming pool is too far away 12. Police visibility is nil 13. After-hours call-outs for electricity from the Richards Bay office is fine, but not from Esikhawini. Some people complain of tardy service

40
Ngwelezane
1. Only one sports grounds with no facilities like toilets or changing rooms. Generally not in a good order – no maintenance 2. No swimming pool 3. Only one park, not kept well and next to the road 4. No bus shelters 5. Poor storm water drainage; problems when it rains 6. No streets lights 7. Library not well stocked; need to go to Empangeni when needing reading and other reference material 8. Crime is a big problem 9. Problems with water meters. Paying same water rates even though one has been away for a long time and has not been using water. 10. Problem with sewer for residents living next to the sewerage; overspilling 11. Need toilets inside houses. Not safe to go out in the dark and also a problem for sick people who may need to use a toilet urgently. 12. Speed humps desperately needed
Vulindlela
The 30 residents of Vulindlela interviewed were largely satisfied, although there were comments made about communication from the Municipality, lack of knowledge of the IDP process, and unannounced water and electricity cuts.
Bhejane Khoza, Dube, Madlebe, and Mkhwanazi North and South
Residents interviewed in these rural areas voiced the following common concerns:
1. Many households do not have water, sanitation, electricity or domestic refuse removal services to comment on. 2. With regard to electricity there are complaints about unannounced interruptions, and the cost of electricity – particularly in households with little or no income. [A number of residents spoke of a price differential in electricity between local paypoints and Richards Bay] 3. With regard to health care, the general complaint is that clinics are too far away, although service at the clinics is regarded as good. 4. Not many comments were received about provincial roads, but a common complaint about municipal roads is that they are very bad - turning to mud when it rains. 5. Sports facilities, Libraries, community halls, street lights, and bus shelters are generally lacking.
6. A common complaint is that Police are not visible.