Cushion Engineering, design, and testing - Westpak · cushion engineering, design and testing...
44
CUSHION ENGINEERING, DESIGN AND TESTING PREPARED BY HERBERT H. SCHUENEMAN, CP-P/MH PRESENTED BY WESTPAK, INC. 83 Great Oaks Blvd., San Jose, CA 95119 (408) 224-1300 FAX (408) 224-5113 www.westpak.com ________________________________________________
-
Upload
phungtuong -
Category
Documents
-
view
215 -
download
0
Transcript of Cushion Engineering, design, and testing - Westpak · cushion engineering, design and testing...
CUSHION ENGINEERING,
DESIGN AND TESTING
PREPARED BY
HERBERT H. SCHUENEMAN, CP-P/MH
PRESENTED BY
WESTPAK, INC. 83 Great Oaks Blvd., San Jose, CA 95119
(408) 224-1300 FAX (408) 224-5113 www.westpak.com
________________________________________________
I. INTRODUCTION
A cushion or "cushion system" is a protective medium that provides an interface between a fragile product and a potentially harmful environment. Primary "harmful" inputs to be considered here are shock and vibration.
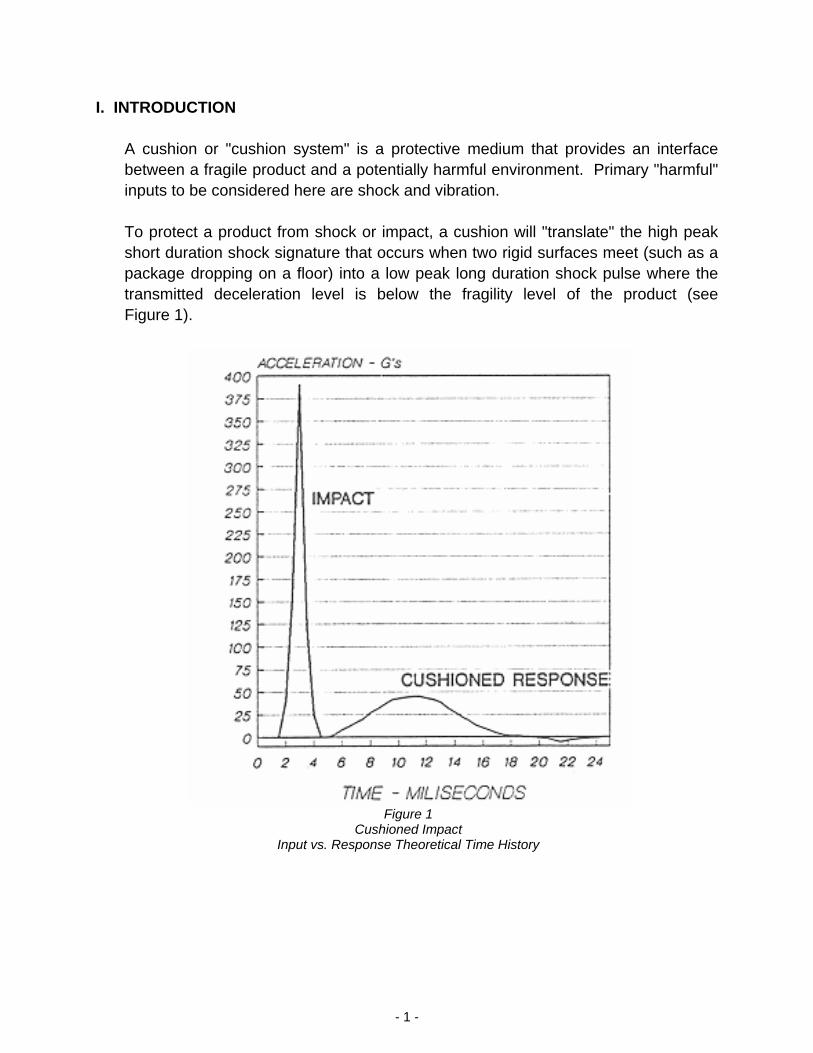
To protect a product from shock or impact, a cushion will "translate" the high peak short duration shock signature that occurs when two rigid surfaces meet (such as a package dropping on a floor) into a low peak long duration shock pulse where the transmitted deceleration level is below the fragility level of the product (see Figure 1).
Figure 1
Figure 1 Cushioned Impact
Input vs. Response Theoretical Time History
- 1 -
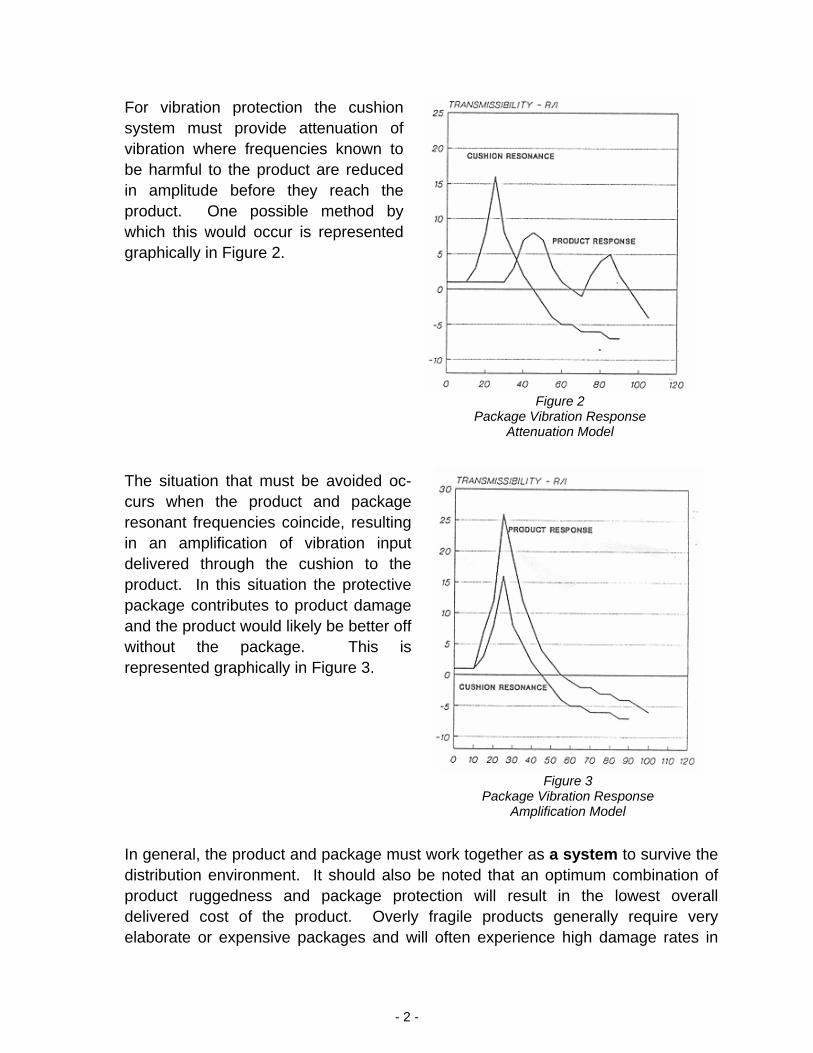
For vibration protection the cushion system must provide attenuation of vibration where frequencies known to be harmful to the product are reduced in amplitude before they reach the product. One possible method by which this would occur is represented graphically in Figure 2.
The situation that must be avoided oc-curs when the product and package resonant frequencies coincide, resulting in an amplification of vibration input delivered through the cushion to the product. In this situation the protective package contributes to product damage and the product would likely be better off without the package. This is represented graphically in Figure 3.
In general, the product and package musdistribution environment. It should also product ruggedness and package protdelivered cost of the product. Overlyelaborate or expensive packages and w
- 2 -
Figure 2 Package Vibration Response
Attenuation Model
Figure 3 Package Vibration Response
Amplification Model
t work together as a system to survive the be noted that an optimum combination of ection will result in the lowest overall fragile products generally require very ill often experience high damage rates in
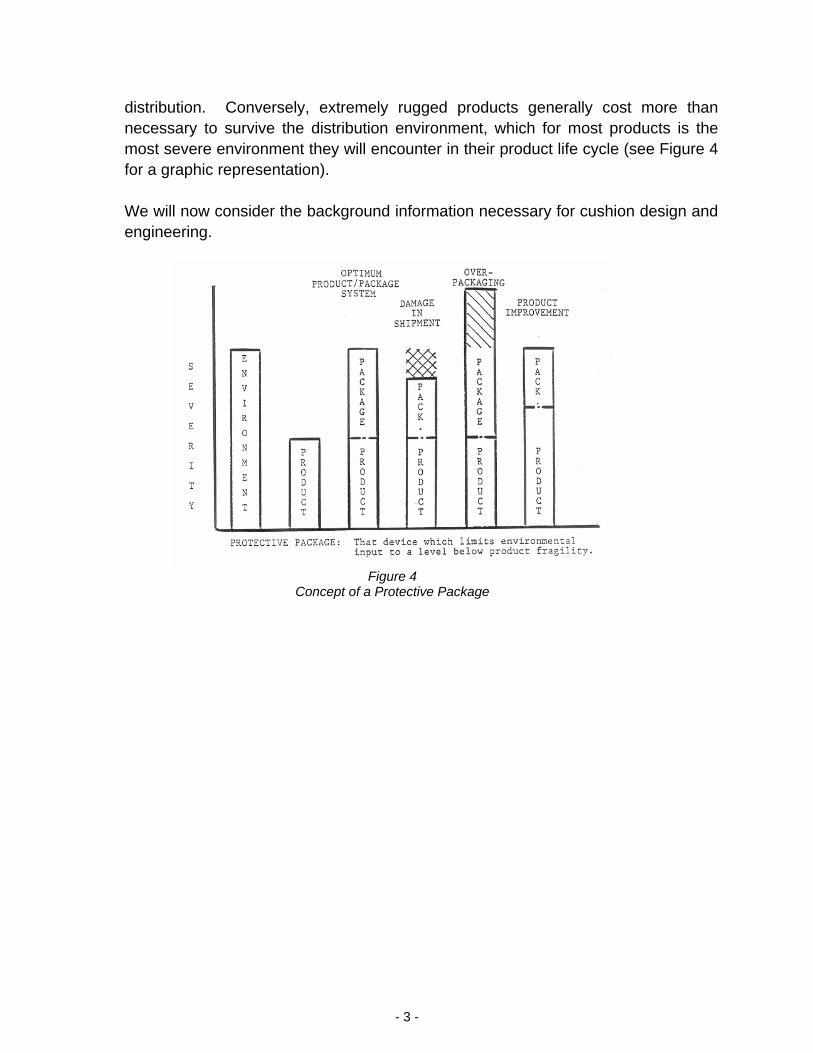
distribution. Conversely, extremely rugged products generally cost more than necessary to survive the distribution environment, which for most products is the most severe environment they will encounter in their product life cycle (see Figure 4 for a graphic representation).
We will now consider the background information necessary for cushion design and engineering.
Figure 4
Concept of a Protective Package
- 3 -
II. QUANTIFYING ENVIRONMENTAL INPUTS
A prerequisite for package system design is a good understanding of the distribution environment from manufacturer to customer. This is when the package system performs its job.
SHOCK OR IMPACT
Most impacts occur during handling, especially the loading and unloading of transport vehicles. The impacting of one vehicle against another (rail car coupling) also produces significant shocks. In general, defining the distribution shock environment amounts to quantifying the drop height likely to be experienced by the packaged product.
The following generalities apply to package drop heights:
1. Most packages are subjected to many low level impacts while relatively few
receive more than one "high" drop. (1) 2. Unitized loads are subject to fewer impacts and lower drop heights than
individual packages. (2) 3. Most packages are dropped on their base. 50% or more of total impacts are
base drops. (2) 4. The heavier the package, the lower the drop height. (2) 5. The larger the package, the lower the drop height. (2) 6. Warning labels such as "Fragile" and "Handle with Care" have little effect on
package handling. (2) 7. Handholds on the sides of packages appear to reduce the incidence of higher
drop heights. (2)
- 4 -
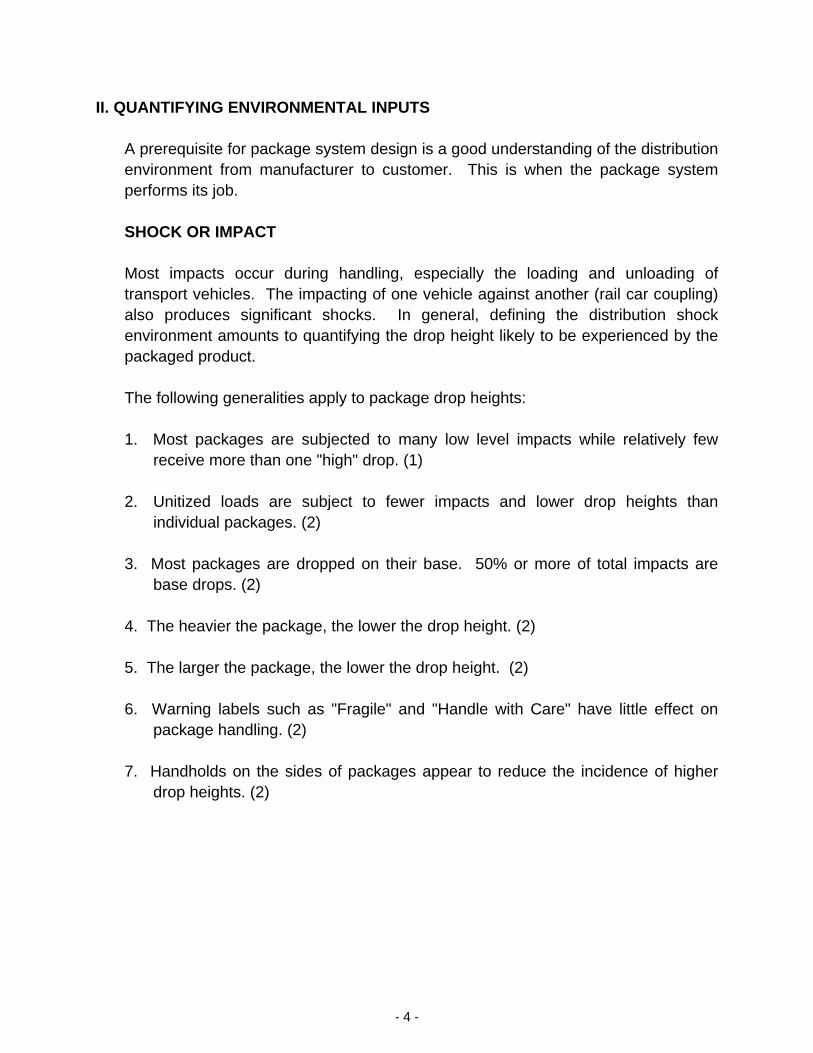
The data used to define package drop height has recently come under question due to the introduction of more sophisticated measuring devices. Likely this area will change drastically in the future and the packaging engineer is encouraged to keep informed.
Drop Heigh
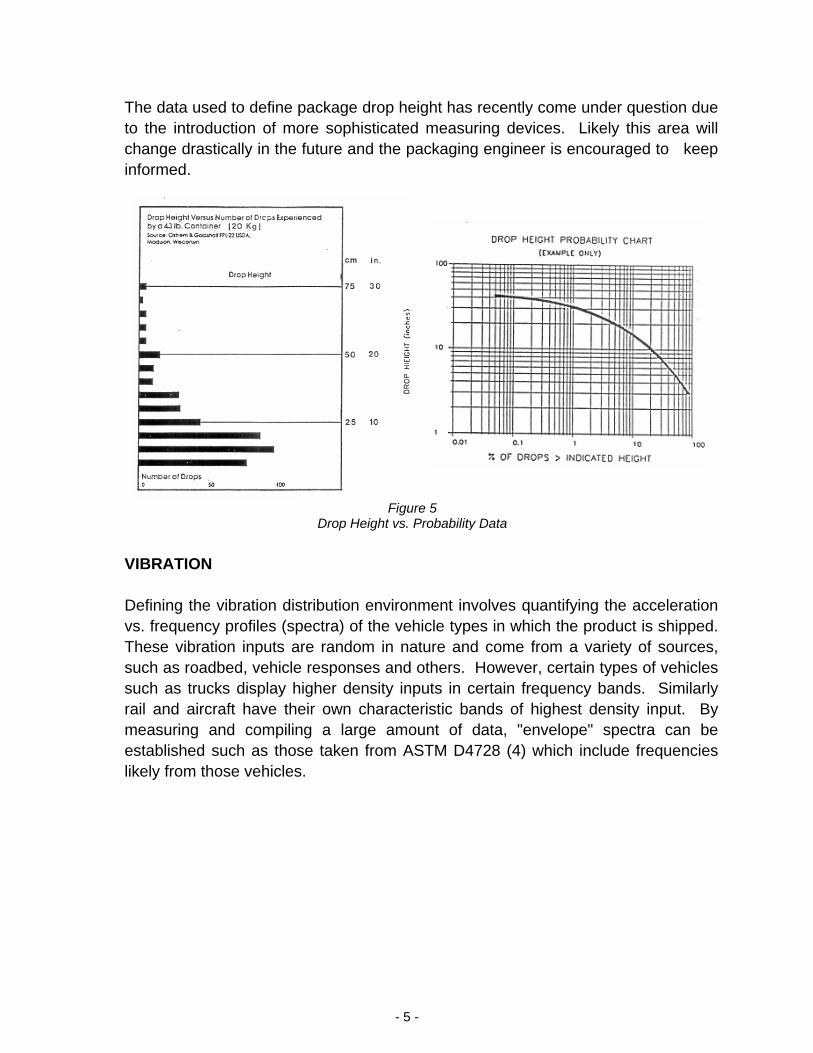
VIBRATION
Defining the vibration distribution environvs. frequency profiles (spectra) of the vehThese vibration inputs are random in nasuch as roadbed, vehicle responses and such as trucks display higher density inprail and aircraft have their own charactemeasuring and compiling a large amoestablished such as those taken from ASlikely from those vehicles.
- 5 -
Figure 5 t vs. Probability Data
ment involves quantifying the acceleration icle types in which the product is shipped. ture and come from a variety of sources, others. However, certain types of vehicles uts in certain frequency bands. Similarly ristic bands of highest density input. By unt of data, "envelope" spectra can be TM D4728 (4) which include frequencies
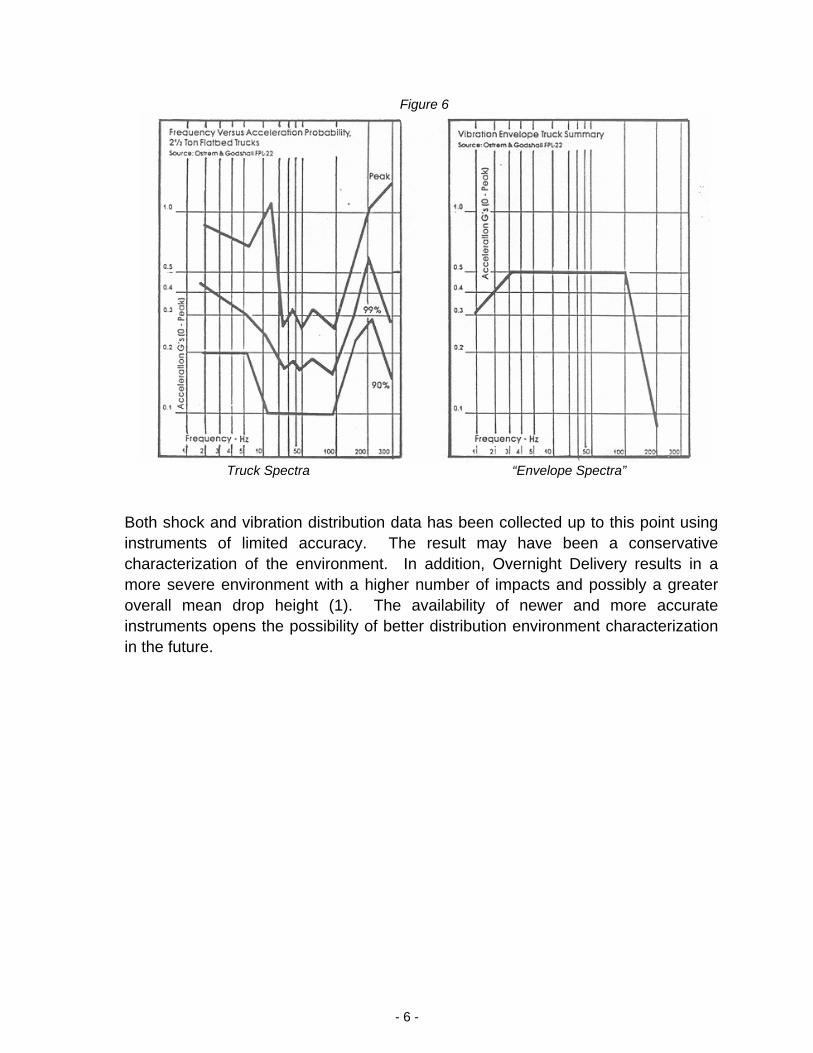
Figure 6
Truck Spectra “Envelope Spectra”
Both shock and vibration distribution data has been collected up to this point using instruments of limited accuracy. The result may have been a conservative characterization of the environment. In addition, Overnight Delivery results in a more severe environment with a higher number of impacts and possibly a greater overall mean drop height (1). The availability of newer and more accurate instruments opens the possibility of better distribution environment characterization in the future.
- 6 -
- 7 -
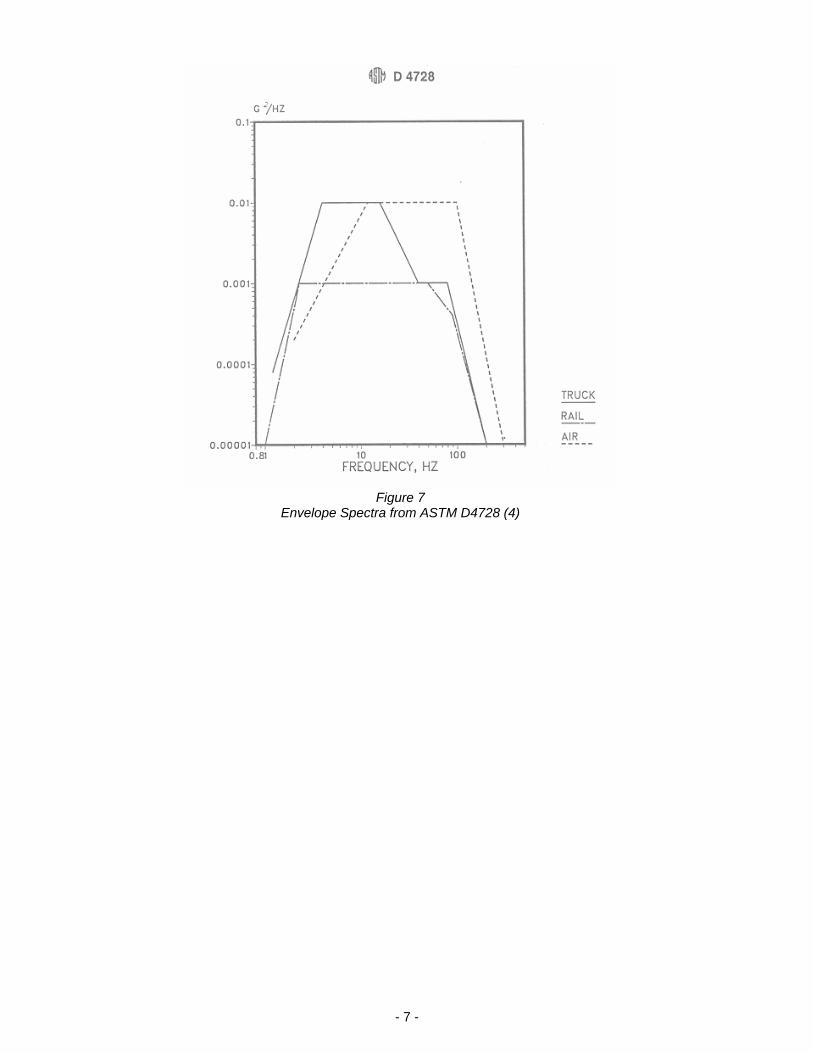
Figure 7
Envelope Spectra from ASTM D4728 (4)
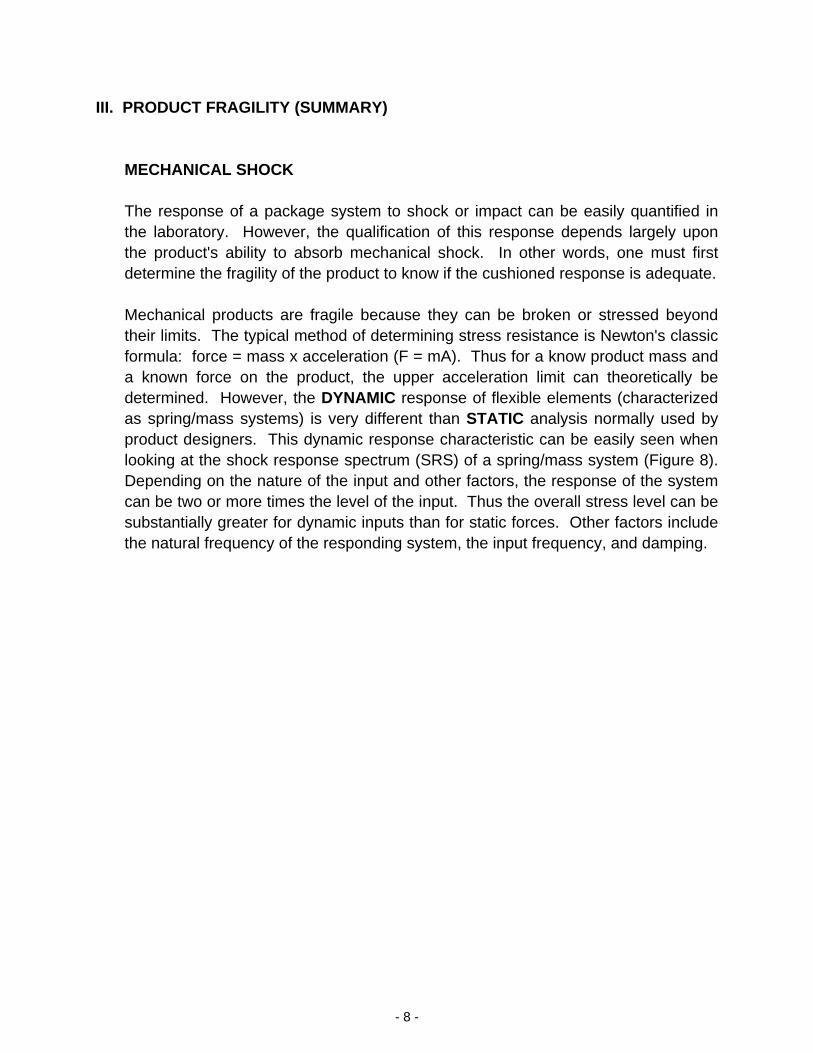
III. PRODUCT FRAGILITY (SUMMARY)
MECHANICAL SHOCK
The response of a package system to shock or impact can be easily quantified in the laboratory. However, the qualification of this response depends largely upon the product's ability to absorb mechanical shock. In other words, one must first determine the fragility of the product to know if the cushioned response is adequate.
Mechanical products are fragile because they can be broken or stressed beyond their limits. The typical method of determining stress resistance is Newton's classic formula: force = mass x acceleration (F = mA). Thus for a know product mass and a known force on the product, the upper acceleration limit can theoretically be determined. However, the DYNAMIC response of flexible elements (characterized as spring/mass systems) is very different than STATIC analysis normally used by product designers. This dynamic response characteristic can be easily seen when looking at the shock response spectrum (SRS) of a spring/mass system (Figure 8). Depending on the nature of the input and other factors, the response of the system can be two or more times the level of the input. Thus the overall stress level can be substantially greater for dynamic inputs than for static forces. Other factors include the natural frequency of the responding system, the input frequency, and damping.
- 8 -
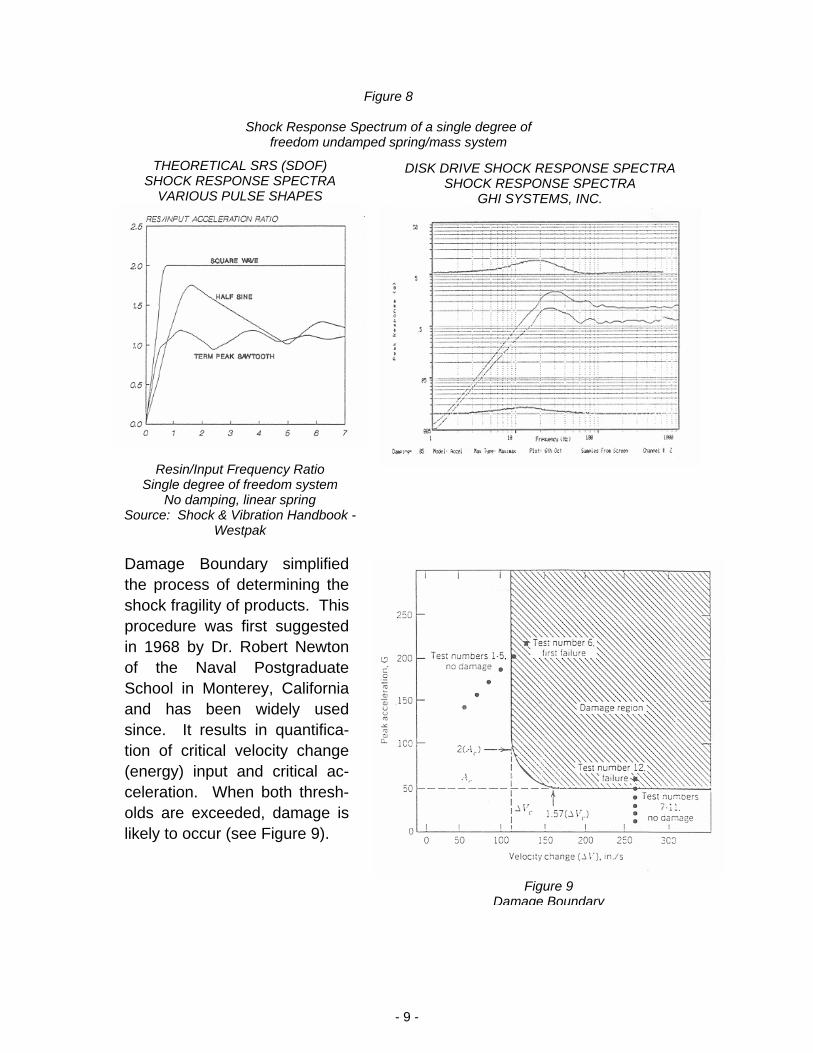
Figure 8
Shock Response Spectrum of a single degree of freedom undamped spring/mass system
THEORETICAL SRS (SDOF) SHOCK RESPONSE SPECTRA
VARIOUS PULSE SHAPES
Resin/Input Frequency Ratio Single degree of freedom system
No damping, linear spring Source: Shock & Vibration Handbook -
Westpak
DISK DRIVE SHOCK RESPONSE SPECTRA SHOCK RESPONSE SPECTRA
GHI SYSTEMS, INC.
Damage Boundary simplified the process of determining the shock fragility of products. This procedure was first suggested in 1968 by Dr. Robert Newton of the Naval Postgraduate School in Monterey, California and has been widely used since. It results in quantifica-tion of critical velocity change (energy) input and critical ac-celeration. When both thresh-olds are exceeded, damage is likely to occur (see Figure 9).
Figure 9 Damage Boundary
- 9 -
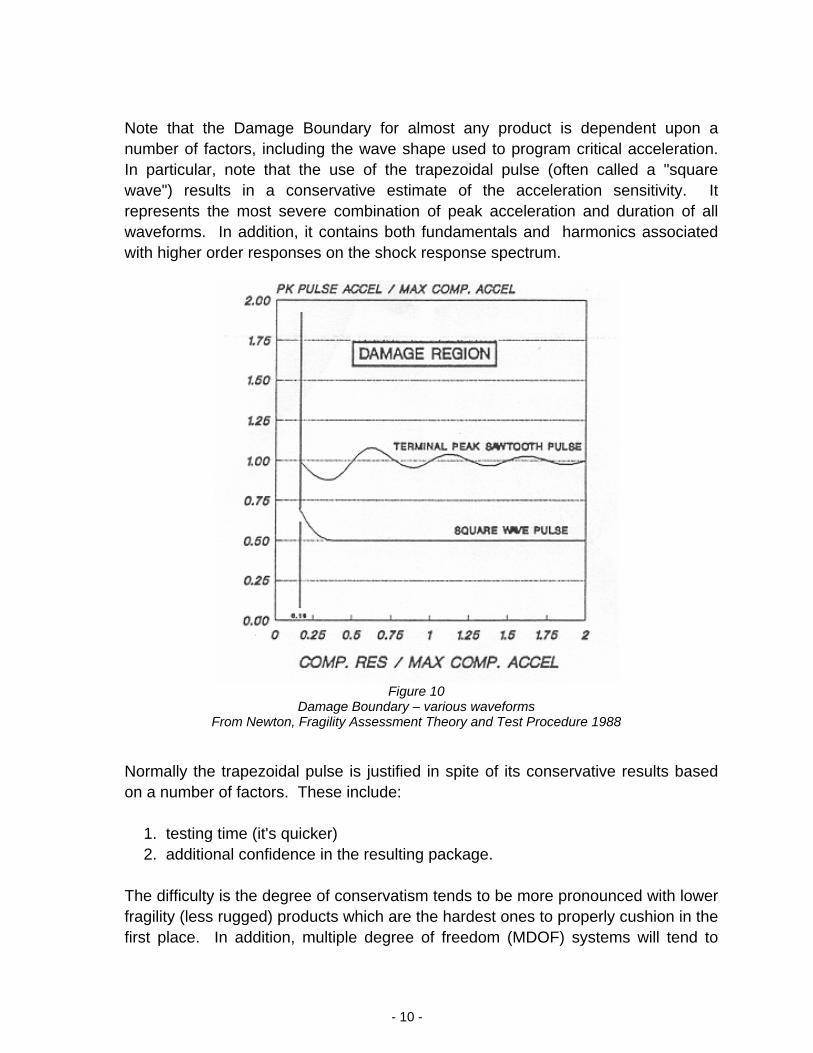
Note that the Damage Boundary for almost any product is dependent upon a number of factors, including the wave shape used to program critical acceleration. In particular, note that the use of the trapezoidal pulse (often called a "square wave") results in a conservative estimate of the acceleration sensitivity. It represents the most severe combination of peak acceleration and duration of all waveforms. In addition, it contains both fundamentals and harmonics associated with higher order responses on the shock response spectrum.
Figure 10
Damage Boundary – various waveforms From Newton, Fragility Assessment Theory and Test Procedure 1988
Normally the trapezoidal pulse is justified in spite of its conservative results based on a number of factors. These include:
1. testing time (it's quicker) 2. additional confidence in the resulting package.
The difficulty is the degree of conservatism tends to be more pronounced with lower fragility (less rugged) products which are the hardest ones to properly cushion in the first place. In addition, multiple degree of freedom (MDOF) systems will tend to
- 10 -
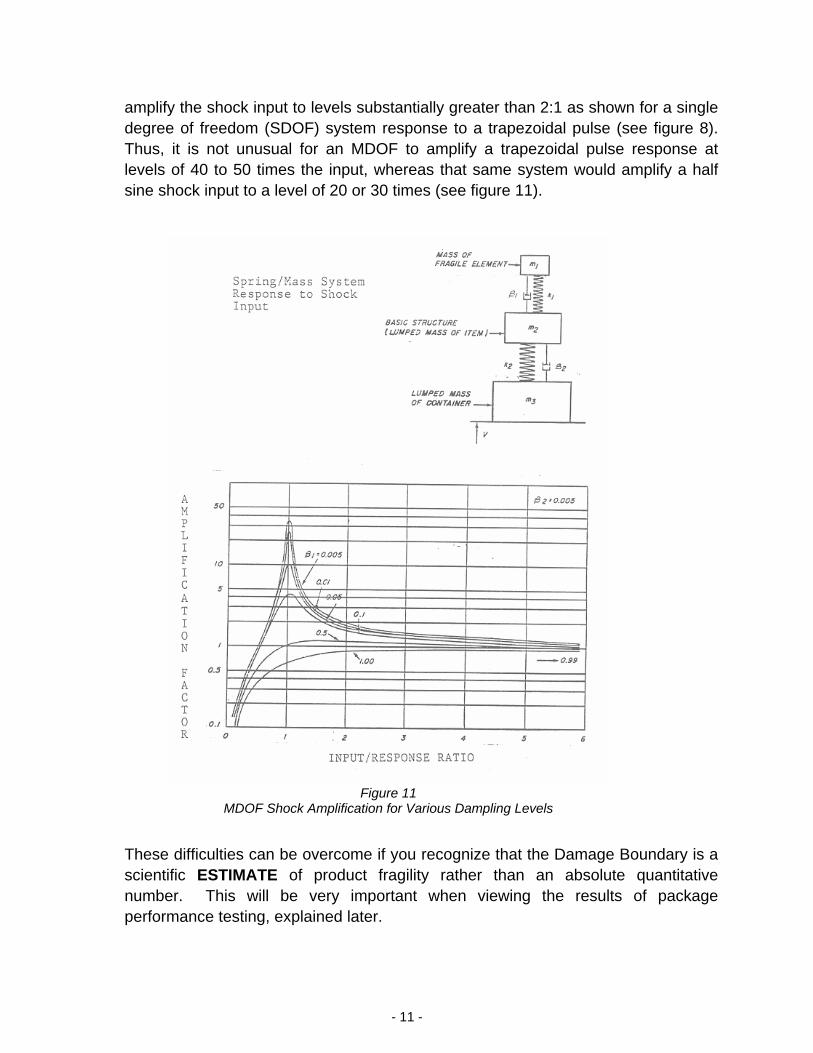
amplify the shock input to levels substantially greater than 2:1 as shown for a single degree of freedom (SDOF) system response to a trapezoidal pulse (see figure 8). Thus, it is not unusual for an MDOF to amplify a trapezoidal pulse response at levels of 40 to 50 times the input, whereas that same system would amplify a half sine shock input to a level of 20 or 30 times (see figure 11).
These difficulties can be overcome if you recognize that the Damage Boundary is a scientific ESTIMATE of product fragility rather than an absolute quantitative number. This will be very important when viewing the results of package performance testing, explained later.
Figure 11
MDOF Shock Amplification for Various Dampling Levels
- 11 -
Another procedure for determining product fragility, often overlooked, is ASTM D3331 (now withdrawn by ASTM Committee D-10). This procedure describes a test method for the assessment of mechanical shock fragility using package cushion materials instead of a programmable shock test machine. To conduct this test, the product is supported on a cushioning pad inside a protective shipping container and is subjected to a series of shock inputs (drops) of increasing severity. This is accomplished by decreasing the thickness of the cushion under the product or by increasing the drop height. The shock level experienced by the product is recorded and the level at which damage occurs is taken to be the frailty of the product in that orientation.
VIBRATION
Product vibration sensitivity results from exciting critical components within the product at their natural or resonant frequencies, resulting in fatigue and stress failure. As a general rule, products will not be damaged as a result of non resonant loading caused by vibration typical of the distribution environment. The acceleration levels of most vehicles are relatively low when compared to the critical acceleration levels of most products. It is only when a component of a product is excited at its natural frequency that damage is likely.
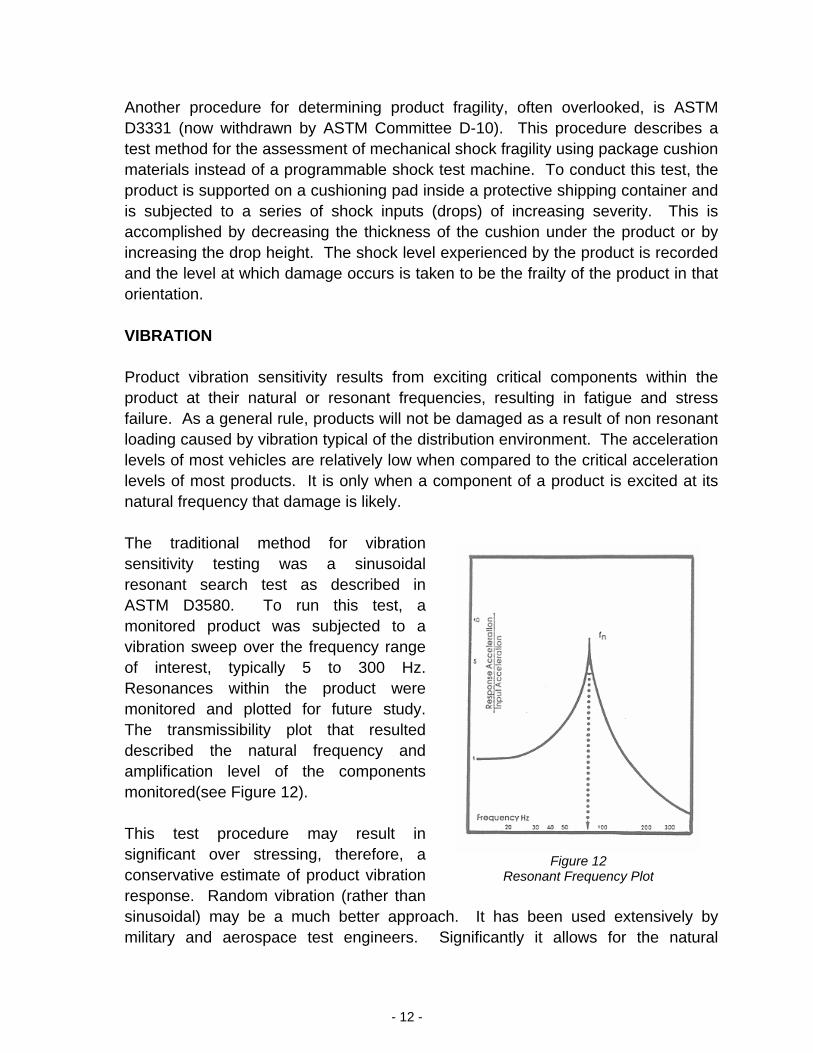
The traditional method for vibration sensitivity testing was a sinusoidal resonant search test as described in ASTM D3580. To run this test, a monitored product was subjected to a vibration sweep over the frequency range of interest, typically 5 to 300 Hz. Resonances within the product were monitored and plotted for future study. The transmissibility plot that resulted described the natural frequency and amplification level of the components monitored(see Figure 12).
Figure 12
Resonant Frequency Plot
This test procedure may result in significant over stressing, therefore, a conservative estimate of product vibration response. Random vibration (rather than sinusoidal) may be a much better approach. It has been used extensively by military and aerospace test engineers. Significantly it allows for the natural
- 12 -
interaction (both constructive and destructive) of spring/mass components within a system to occur as they would in the shipping environment. In general, the response of a product to random vibration will be less severe than for single frequency sinusoidal inputs at component resonance.
Sinusoidal sweep testing is a simpler approach and is easier to understand, but it may not be realistic. The widespread use of computerized vibration analyzers now makes it an easy matter to determine vibration transmissibility with random vibration input. This was certainly not the case five or ten years ago.
Other variables affect product fragility testing and analysis; these include:
1. Fixturing: The fixture holds the product to the shock or vibration test machine.
In theory it should be designed to bear against a product in a fashion similar to that of the intended package system. The manner in which this is done can have a significant impact (pun intended) on the response of the product. Fixture design is an important and often overlooked part of product fragility testing.
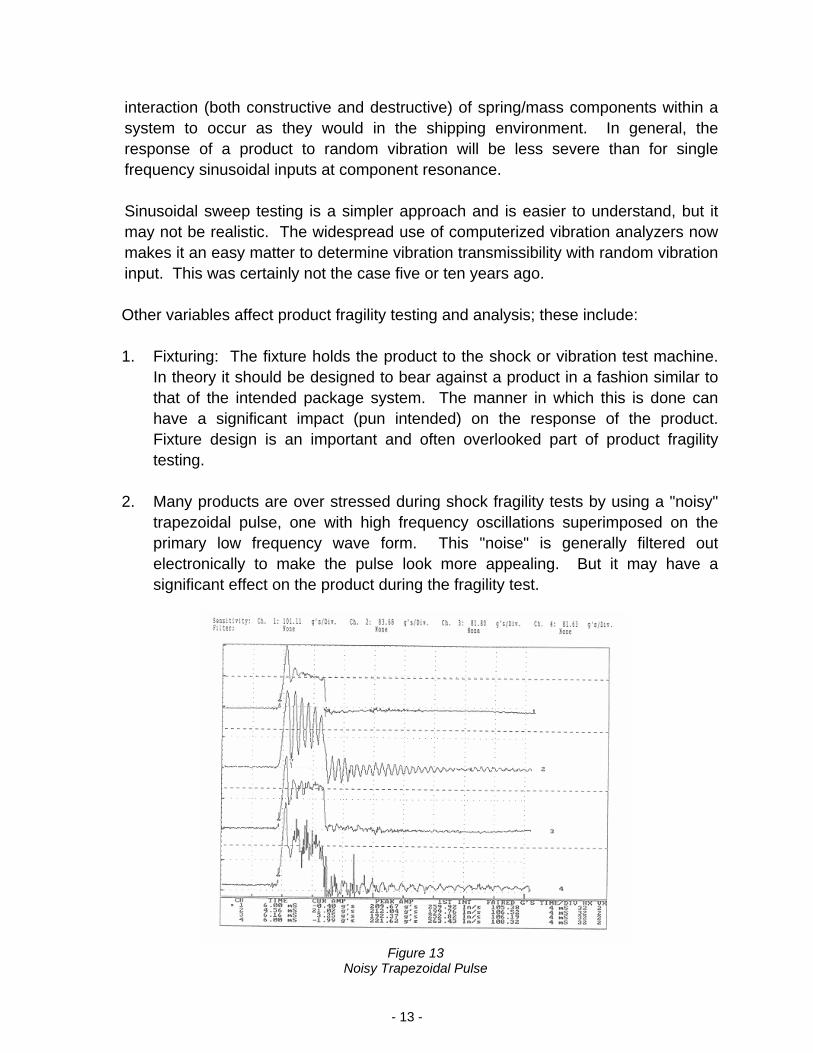
2. Many products are over stressed during shock fragility tests by using a "noisy"
trapezoidal pulse, one with high frequency oscillations superimposed on the primary low frequency wave form. This "noise" is generally filtered out electronically to make the pulse look more appealing. But it may have a significant effect on the product during the fragility test.
Figure 13
Noisy Trapezoidal Pulse
- 13 -
3. Fatigue of the test specimen is difficult to characterize but definitely occurs, especially in vibration. Since this testing is normally done on high value products, it is difficult to obtain sufficient number of products to eliminate this effect entirely. Fatigue results in a conservative estimate of both shock and vibration fragility.
4. The statistical significance of a small sample size may have a large effect on the
data generated. Again, because this is a potentially destructive test procedure and is often run on expensive products, the replicates are normally held to an absolute minimum. The overall effect is lower confidence in the data generated.
5. This testing is normally done on prototype products rather than production units.
This will result in some level of difference, perhaps conservative vs. the results of testing production product. Recognizing this, some firms will require periodic Damage Boundary testing as part of a comprehensive quality control program.
This list emphasizes the fact that product fragility testing results in at best a scientific engineering ESTIMATE of the levels at which damage occurs to a product. They should not be viewed as quantitative absolutes.
- 14 -
IV. CUSHION TESTING
IMPACT
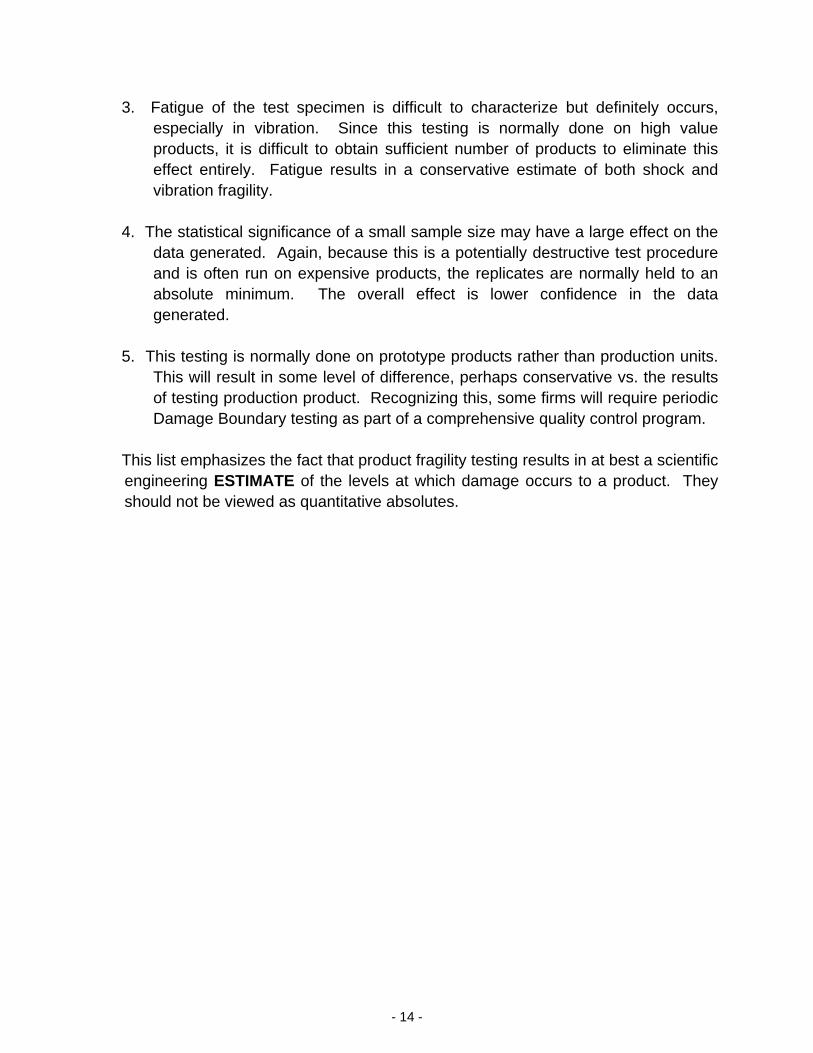
The shock or impact performance of a cushion material is measured using instrumented drops, resulting in a cushion curve such as that shown in Figure 14. This curve describes the amount of deceleration transmitted through a given thickness of material as a function of the loading (weight per unit area) on the cushion and the drop height. The procedure is covered by standards such as ASTM D1596. It describes dropping a guided platen of predetermined mass onto a cushion of known thickness and area from a given drop height.
Most cushion curves have the general shape of that shown in Figure 14. The left hand portion shows a relatively high transmitted deceleration. In this area the loading is low and the product does not have sufficient force to deflect the cushion, therefore, it resembles having no cushion at all. In the center portion of the curve the object has sufficient force to deflect the cushion and cause the resulting deceleration to be spread over a longer period of time. The result is a lower deceleration level. On the right hand portion of the curve the material is overloaded and the object continues right through the cushion (it "bottoms out") and impacts the surface on which the cushion is resting resulting in, once again, high deceleration levels.
Figure 14
Typical Cushion Curve
- 15 -
Note that cushion curves are "best fit curves". This is because they are generated from averaged data at specific loading points on specific cushion samples. There is variability in the manufacture of the material and judgment involved in drawing smooth curves from "non-classical" data. The effects of sample variability, averaged data, and curve fitting cannot be ignored, therefore, the curves must be viewed as approximate values.
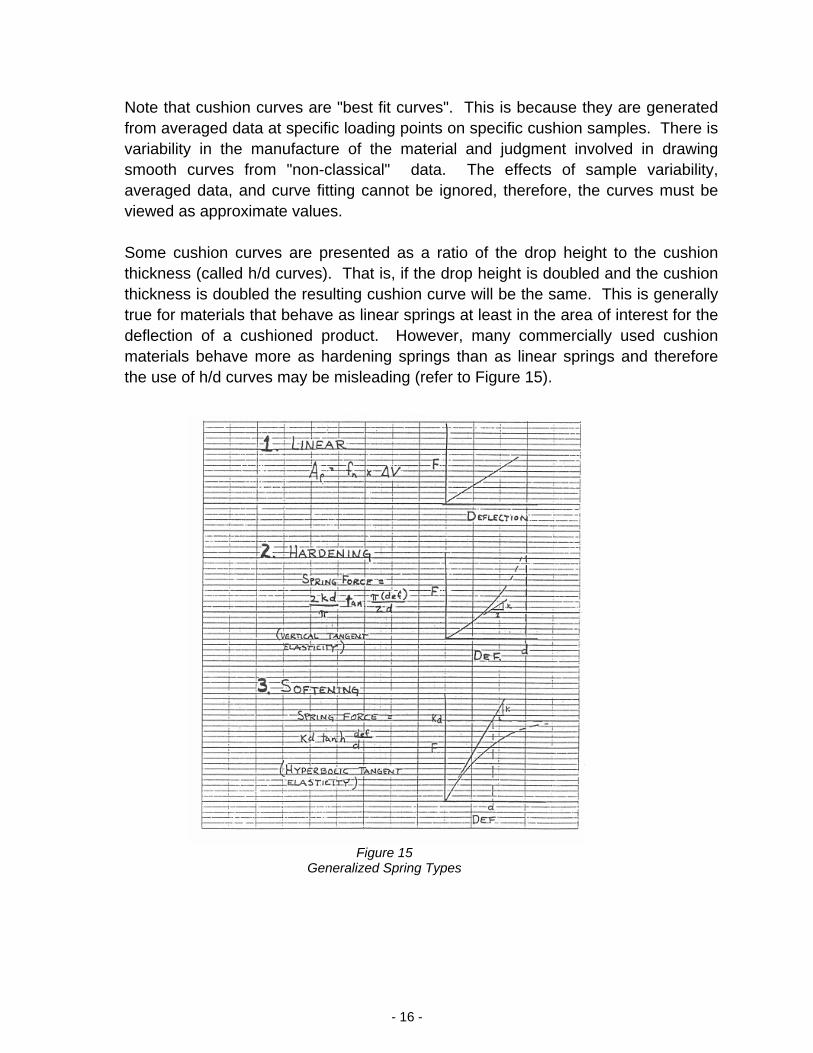
Some cushion curves are presented as a ratio of the drop height to the cushion thickness (called h/d curves). That is, if the drop height is doubled and the cushion thickness is doubled the resulting cushion curve will be the same. This is generally true for materials that behave as linear springs at least in the area of interest for the deflection of a cushioned product. However, many commercially used cushion materials behave more as hardening springs than as linear springs and therefore the use of h/d curves may be misleading (refer to Figure 15).
Figure 15 Generalized Spring Types
- 16 -
It should be noted that the use of the ASTM D1596 procedure is intended primarily for comparison of one cushion material to another, but not necessarily for the design of a protective package system. In addition, the procedure recommends dropping a platen five times onto a given cushion sample at a given static stress level and the first impact value is discarded. The resulting cushion curve is the average of the last four of five impacts. In the real world a packaged product receives the first impact and is likely not to receive an impact of equal or greater drop height. Therefore, first drop data is extremely important.
Most cushions are not used as right rectangular prisms as the cushion test procedure recommends. It is known that the shape of a cushion, in particular the use of ribs, will have a great effect on the shock absorbing capabilities of a given material. ASTM D1596 standard test procedure does not allow for this variability.
Finally, the ASTM D1596 procedure uses a platen which impacts a cushion sample, with an air gap between the two prior to impact. This is not realistic or characteristic of the actual package/product drop environment. A more realistic approach may be the procedure recommended in ASTM D4168, commonly referred to as the Enclosed Test Block Procedure.
VIBRATION
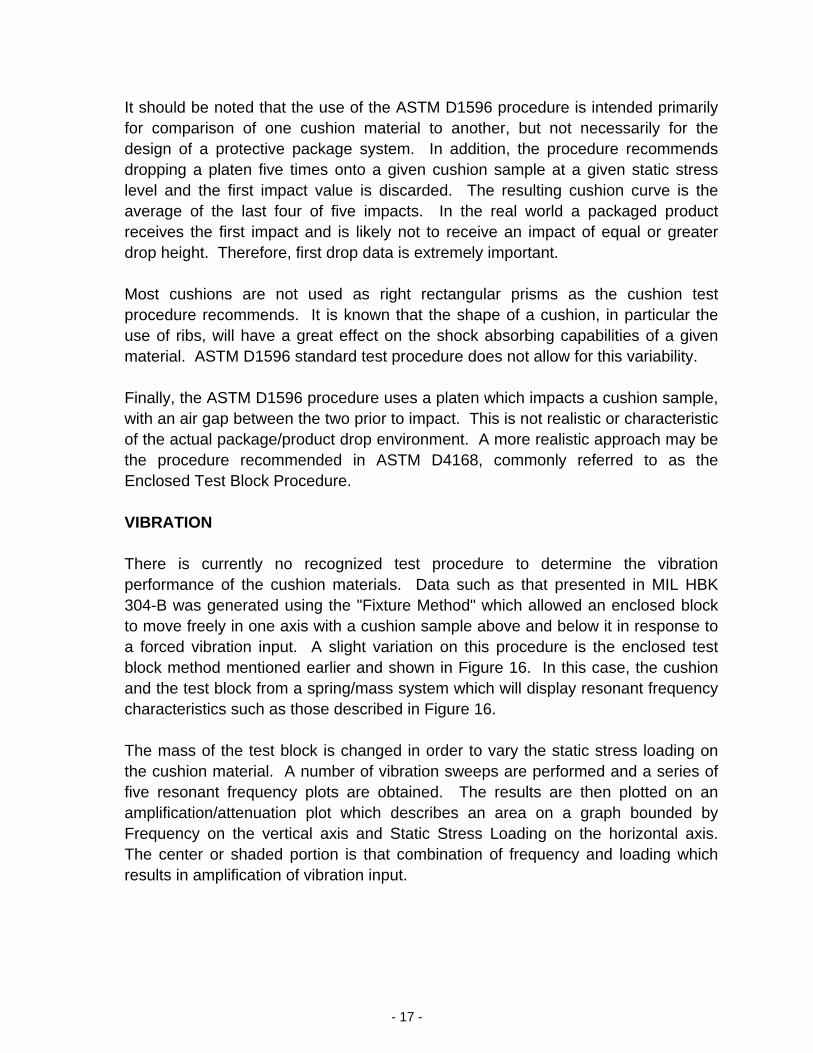
There is currently no recognized test procedure to determine the vibration performance of the cushion materials. Data such as that presented in MIL HBK 304-B was generated using the "Fixture Method" which allowed an enclosed block to move freely in one axis with a cushion sample above and below it in response to a forced vibration input. A slight variation on this procedure is the enclosed test block method mentioned earlier and shown in Figure 16. In this case, the cushion and the test block from a spring/mass system which will display resonant frequency characteristics such as those described in Figure 16.
The mass of the test block is changed in order to vary the static stress loading on the cushion material. A number of vibration sweeps are performed and a series of five resonant frequency plots are obtained. The results are then plotted on an amplification/attenuation plot which describes an area on a graph bounded by Frequency on the vertical axis and Static Stress Loading on the horizontal axis. The center or shaded portion is that combination of frequency and loading which results in amplification of vibration input.
- 17 -
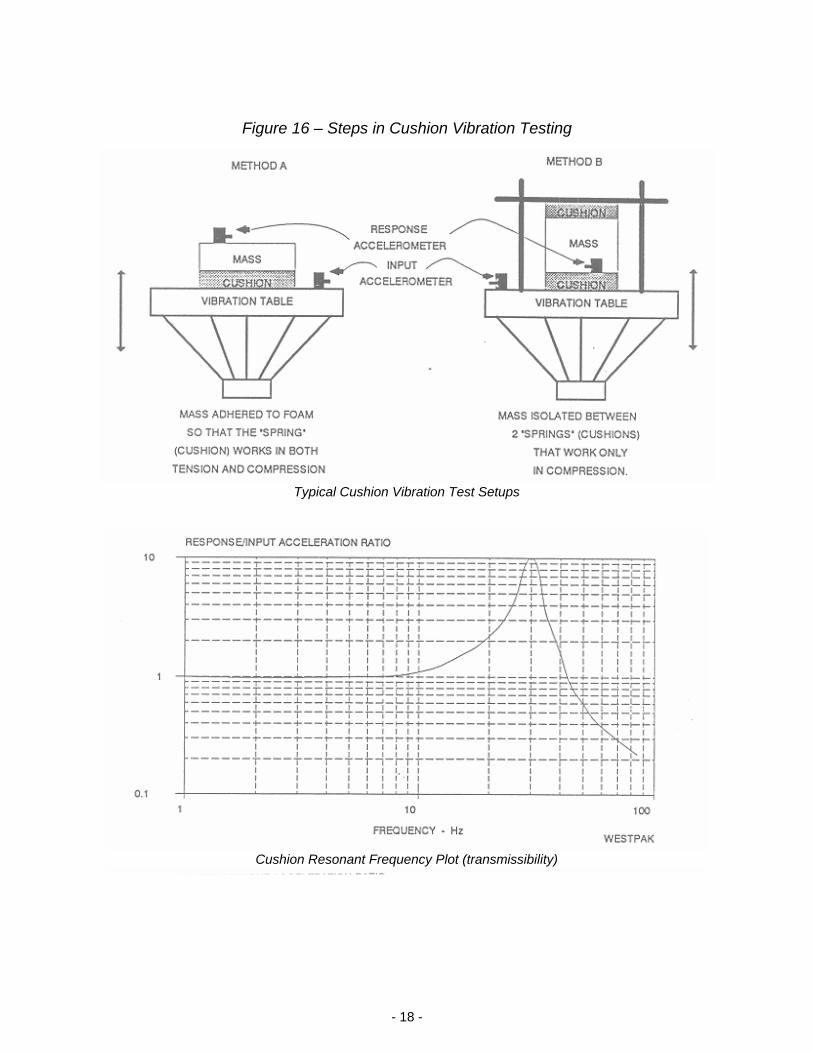
Figure 16 – Steps in Cushion Vibration Testing
Typical Cushion Vibration Test Setups
Cushion Resonant Frequency Plot (transmissibility)
- 18 -
Response/Input Acceleration Ratio
Amplification/Attenuation Plot
OTHER CUSHION PROPERTIES
Other cushion characteristics are important but often overlooked. These include the following:
1. Stress/Strain Behavior: The dynamic stress/strain curve for a cushion
material describes deflection (strain) of the material as a function of an applied load (stress). This information is useful to determine the overall "efficiency" of the material, in other words, what percentage of the material can be
- 19 -
compressed before the spring bottoms or becomes a hardening spring. The stress/strain curve also gives some indication of the linearity of the cushion material...the uniformity between deflection and applied load. The spring rate can be estimated from stress/strain data. It is interesting to note that before the advent of cushion curves, a "cushion factor" was developed using stress/strain data. The cushion factor plotted static stress against the ratio of static stress to energy absorbed at that static stress. The resulting curve gave some indication of the optimum loading for the material.
2. Compressive Creep Data: This information (ASTM D2221), shows what
percentage of the material will deflect under long term static load. This is very important for some materials that tend to creep or lose thickness under a constant load.
3. Tensile Strength: This characteristic shows the material's ability to resist
tearing and separation internally due to applied external forces. This is important for applications such as "floating decks" where both compression and tensile loads are considerable.
4. hear Strength: This information is useful in designs that suspend the product
from the cushion in a shear mode. This type of design work is not straight forward and must be approached with a great deal of caution.
- 20 -
V. DETERMINING PACKAGE TEST PROCEDURES
Before a package system is designed or tested, it is important to establish the procedure used to judge its performance. This should include the design drop height and the test procedure used to evaluate vibration characteristics. In addition, the amount and duration of input should be specified. For example, will the package be subject to 1, 2 or 3 impacts on each face from the design drop height or one impact on each face, corner, and edge or another procedure such as ASTM D4169?
The reason for establishing the test procedure before the design process comes from the characteristics of some cushion materials. They tend to transmit higher levels of deceleration with increasing drops. Thus, the first drop on a cushion from a given height and static stress level will result in lower transmitted deceleration than succeeding drops. This is especially true for semi-resilient cushions such as expanded polystyrene foam (EPS) and molded pulp cushions. The heavier loading necessary to achieve lower deceleration levels will also have a negative effect on the cushion's ability to withstand repeated impacts. On the other hand, resilient materials such as polyethylene foam generally show very little degradation with repeated impacts.
The result is that if one were designing an EPS cushion for a single impact verification test procedure, the static stress loading would be different than if the test procedure required multiple impacts on the same location. However, if one were using polyethylene cushions it would probably make little difference if the test procedure called for one or multiple impacts per axis.
PERFORMANCE VS. INTEGRITY TEST PROCEDURES
There is a subtle though distinct difference between the performance and integrity characteristics of the package, both in terms of design criteria and in the test procedure used to verify compliance with those criteria. The performance of a package refers to its ability to mitigate shock and vibration input to levels below product fragility. This is distinguished from integrity which refers to the ability of the package itself to withstand the normal forces involved in the distribution process. It is possible to design a package that has the proper performance characteristics but will not withstand the forces typical of the shipping environment (no integrity).
Package impact or drop performance testing normally involves a series of flat impacts with the deceleration transmitted through the cushion monitored by
- 21 -
appropriate instrumentation. Impact integrity of a package system is generally verified by a series of flat, corner and edge impacts typical of the ASTM D4169 or NSTA test procedures.
Vibration performance refers to the ability of a package system to attenuate vibration at and near product natural frequencies. Vibration performance is tested by subjecting an instrumented package to vibration input in a sinusoidal sweep test or a random vibration "burst" test. The normal vibration integrity test involves one or more resonant frequency dwells at package critical frequencies. Random vibration testing may be used in place of or in addition to resonant dwell testing.
It is interesting to note that design performance is something that is taught in universities and verified by analytical techniques. The integrity of a design, however, is something that must be learned by experience and is probably as much art as science. It is indeed rare to find a designer who can successfully integrate both performance and integrity requirements into package designs.
- 22 -
VI. CUSHION SYSTEM DESIGN
The package design process begins with determining the thickness of the cushioning material necessary to achieve the desired performance. To do this, assume the material behaves as a linear spring and determine the total deflection necessary to achieve the desired deceleration from the design drop height. Use the following formula:
X = 2h / (A-2)
where:
X = CUSHION DEFLECTION IN INCHES h = DROP HEIGHT IN INCHES A = DECELERATION LEVEL IN G's
Remember that this gives the theoretical deflection necessary, not the overall cushion thickness. In general, cushion materials will compress about 40 to 60% of their total thickness before bottoming starts to occur. Flexible materials such as polyurethane foam may compress up to 80% before bottoming.
After optimum thickness has been estimated, a static stress loading can be determined by referring to a cushion curve (see Figure 17). Theoretically, any portion that lies below the product fragility level will be capable of protecting the product. (Remember, cushion curves are APPROXIMATIONS only.) For optimum material usage it is desirable to load the cushion at the highest static stress level allowed by the curve. Many designers load the material at the lowest point of the curve where the transmitted deceleration is minimum.
Note that the procedure used for running a cushion curve will have an effect (potentially significant) on the usefulness of the information. In particular, curves run from ASTM D1596 may be less able to predict package cushion performance than procedures such as ASTM D4168.
VIBRATION
Vibration data is used by selecting the amplification/attenuation plot for the material and thickness determined earlier. Draw a horizontal line tangent with the lowest product natural frequency determined in the product fragility testing. A minimum
- 23 -
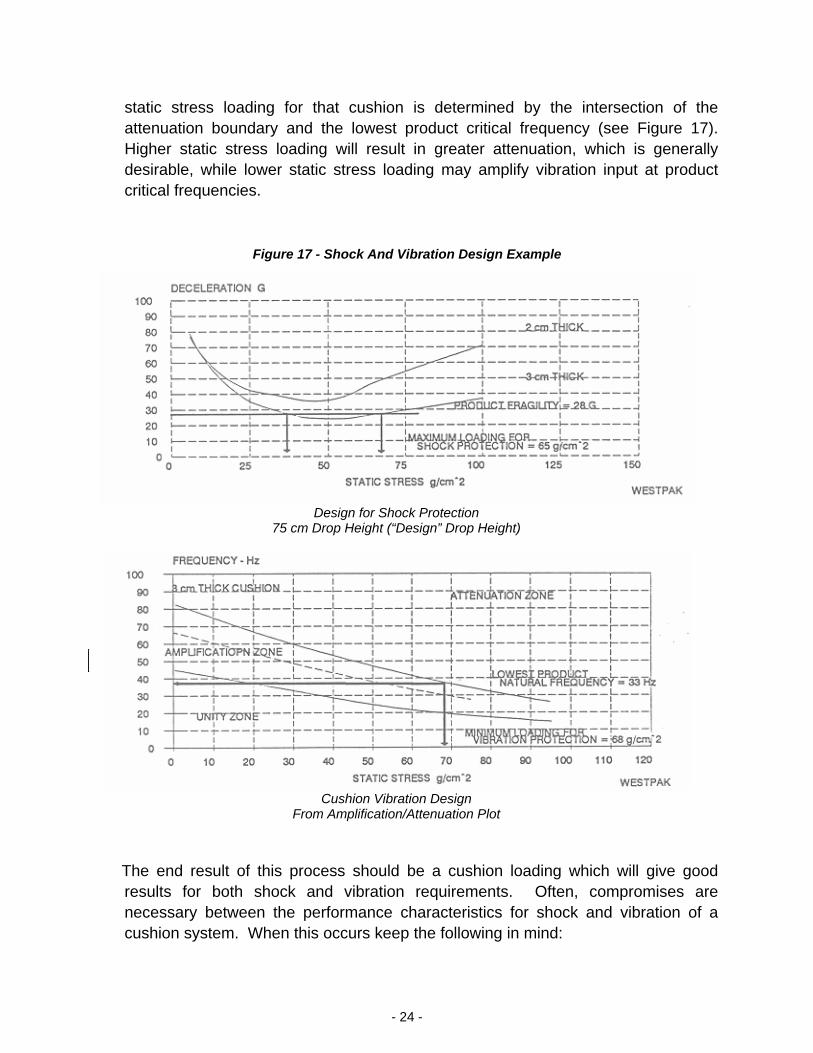
static stress loading for that cushion is determined by the intersection of the attenuation boundary and the lowest product critical frequency (see Figure 17). Higher static stress loading will result in greater attenuation, which is generally desirable, while lower static stress loading may amplify vibration input at product critical frequencies.
Figure 17 - Shock And Vibration Design Example
SHOCK DESIGN VIBRATION DESIGN
Design for Shock Protection
75 cm Drop Height (“Design” Drop Height)
Cushion Vibration Design
From Amplification/Attenuation Plot
The end result of this process should be a cushion loading which will give good results for both shock and vibration requirements. Often, compromises are necessary between the performance characteristics for shock and vibration of a cushion system. When this occurs keep the following in mind:
- 24 -
1. We know that vibration is a certainty. It will occur no matter which mode of
shipment is used because it is characteristic of vehicles in which products travel. Drops, on the other hand, have a probability associated with them. Not all packages will be dropped and certainly not all will be dropped from the design drop height.
2. The fragility level established by Damage Boundary testing using a trapezoidal
wave is conservative. It is normal for a product to survive a shock pulse of a less damaging wave form at peak accelerations greater than the fragility level. This means that it is usually best to lean toward vibration protection when compromises need to be made.
3. The use of ribs in a cushion material or different cushion types used in series
may resolve the conflict in a relatively straightforward fashion.
Testing of the package system will provide an evaluation of any compromises or tradeoffs made in the design of a prototype package.
DESIGNING WITH RIBS
It is instructive to investigate why ribs have been used over the years in package system design. In general, ribs will result in less material usage and therefore higher loading on the material which remains. This results in greater deflection from a given cushion thickness.
The significant benefit can be a change in vibration characteristics without a major change in the shock response characteristics. The reason is that the deflection necessary to determine vibration performance is a small portion of that necessary for shock performance. The key is to design a rib with the proper depth and geometry to satisfy vibration requirements without compromising shock performance.
There are no recognized procedures which guide the designer to a certain rib configuration. Most of the work done in this area has been intuitive in nature. The following guidelines are offered for establishing rib geometry:
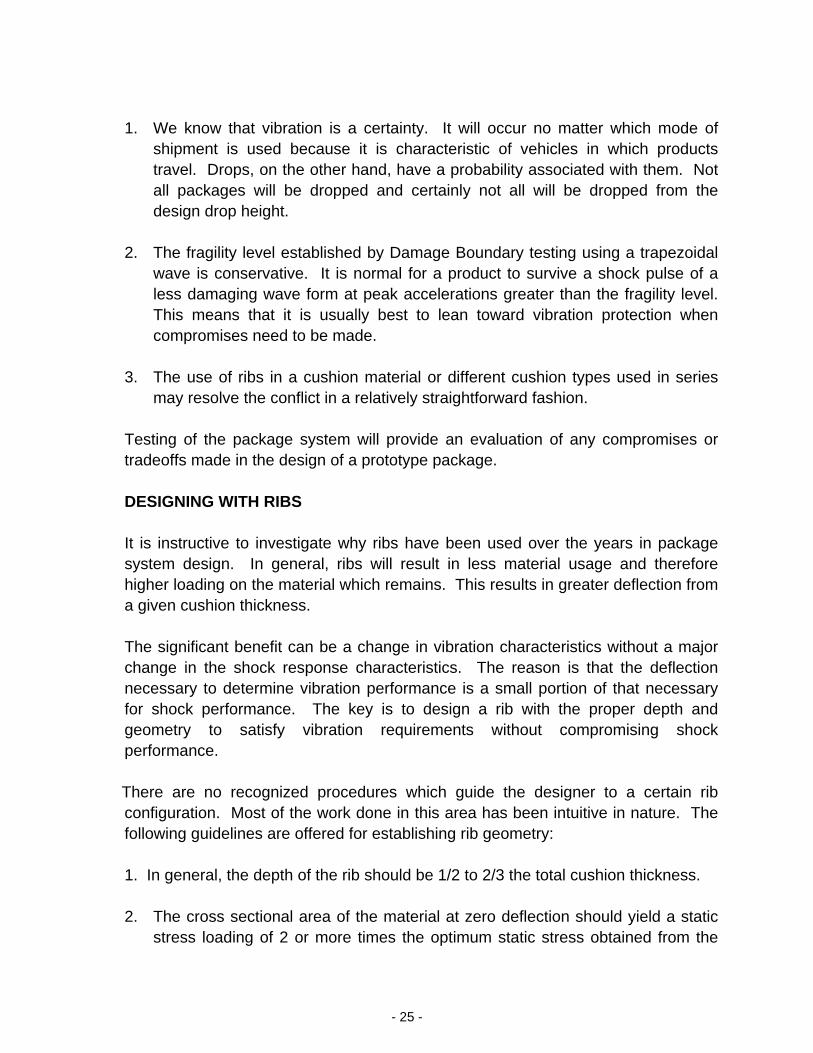
1. In general, the depth of the rib should be 1/2 to 2/3 the total cushion thickness. 2. The cross sectional area of the material at zero deflection should yield a static
stress loading of 2 or more times the optimum static stress obtained from the
- 25 -
cushion curve for that material, thickness and drop height combination. For example, to achieve a 50 G response from a 36 inch freefall, the optimum static stress for a material 3 inches thick may be 0.4 psi. Using this guideline, the area of the top of the cushion rib would yield a static stress loading of 0.8 psi (see Figure 18).
3. The cross sectional area at 25% total cushion deflection should be approxi-
mately equal to that which would give the optimum static stress loading for the material from a representative cushion curve. For example, at 25% deflection the static stress for the cushion mentioned above should be 0.4 psi.
4. The cross sectional area of the rib at 50% total deflection should equal a static
stress approximately half that called for by the appropriate cushion curve.
Figure 18
Various Rib Configurations
It is interesting to note that most rib designs are trapezoidal in cross section and most literature treats this as "standard" shape for ribs. From a theoretical standpoint the best rib design is a pyramid cross section. A hemispherical cross section is also good. The reason is that at zero deflection the static stress loading is (theoretically) infinite and therefore deflection occurs very rapidly at the onset of a dynamic input. As deflection of the cushion material continues in response to the impact, the static stress decreases as the area of the cushion increases. Ideally this deflection and change in loading will occur at a rate which is optimum for shock performance of cushions.
Of greater significance is the fact that vibration response characteristics of a cushion material can be substantially altered through the use of ribs. In particular, a higher static stress loading at the peak of a rib will result in a lower natural frequency for the package system, which is generally desirable for vibration sensitive products. The force levels of environmental vibration are relatively small compared to the shock levels. Therefore, the deflection of the cushion is correspondingly small. This deflection will occur at the point of maximum static stress. If this is the peak of the rib, that area will determine the vibration characteristics of the entire package system. If designed properly, the ribs can effectively attenuate higher frequency vibration.
- 26 -
CUSHION DESIGN SUMMARY
Once the total thickness, static stress, and rib configurations are determined, the package must be designed using this information. This is the point where the performance and integrity requirements of the package system must be addressed. Certainly numerous other factors enter into the process of determining the best package design. These include fabrication requirements, end user constraints, ecological considerations including recyclability, flammability, and a host of others. The crucial requirement for dynamics is a static stress loading in each product axis which satisfies a product's shock sensitivities and does not result in vibration amplification at product critical frequencies.
- 27 -
VII. CUSHION SYSTEM TESTING
Once the design is complete and a prototype fabricated, it must be tested for performance and integrity.
For performance testing, flat impacts are generally used with the deceleration transmitted through the cushion measured by one or more accelerometers mounted on the product. The test procedure should be that previously agreed to, but in most cases will follow ASTM D775 or similar. Take care to ensure flat impacts. This is important! The difference between a flat drop and an "almost flat" drop can be noticeable in terms of response acceleration.
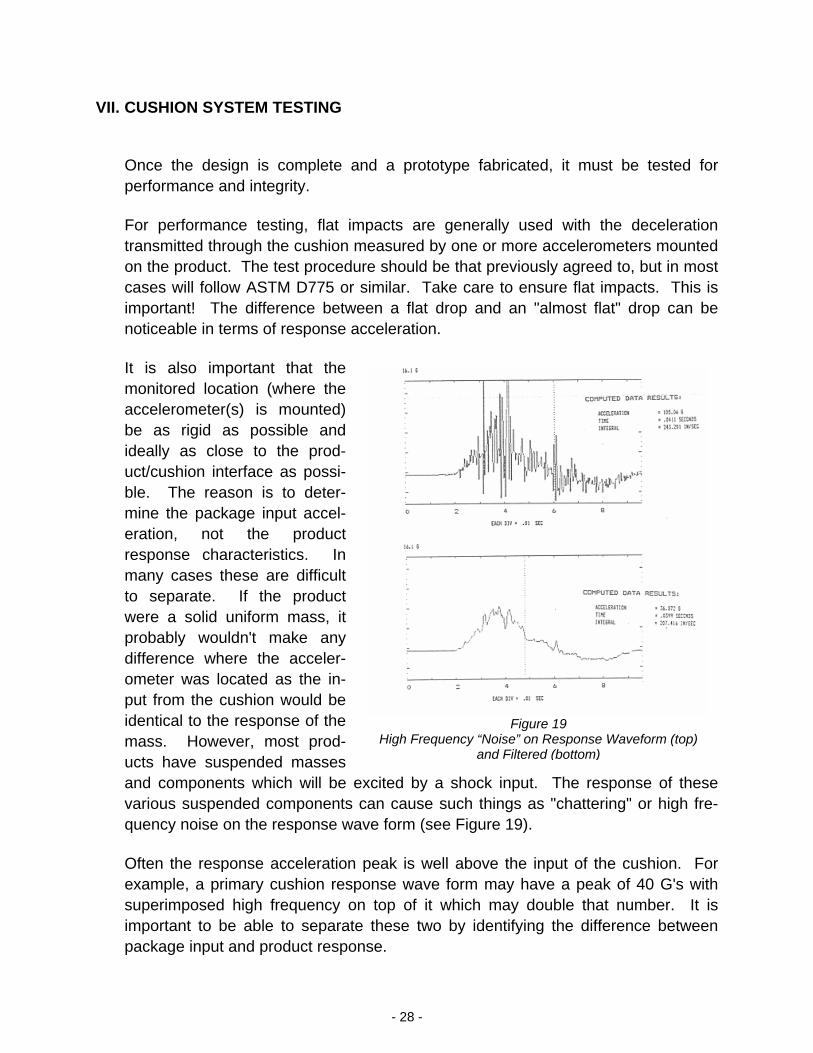
It is also important that the monitored location (where the accelerometer(s) is mounted) be as rigid as possible and ideally as close to the prod-uct/cushion interface as possi-ble. The reason is to deter-mine the package input accel-eration, not the product response characteristics. In many cases these are difficult to separate. If the product were a solid uniform mass, it probably wouldn't make any difference where the acceler-ometer was located as the in-put from the cushion would be identical to the response of the mass. However, most prod-ucts have suspended masses and components which will be evarious suspended components cquency noise on the response wa
Often the response acceleration example, a primary cushion respsuperimposed high frequency onimportant to be able to separatepackage input and product respon
Figure 19
High Frequency “Noise” on Response Waveform (top) and Filtered (bottom)
xcited by a shock input. The response of these an cause such things as "chattering" or high fre-
ve form (see Figure 19).
peak is well above the input of the cushion. For onse wave form may have a peak of 40 G's with top of it which may double that number. It is these two by identifying the difference between se.
- 28 -
Noisy data is one of the most common problems in package response testing. There are several methods of avoiding this problem which should be helpful.
1. Learn to mount the response accelerometer in the proper location, avoiding
flexible elements and locating the transducer as close as possible to the cushion material.
2. Understand the use of electronic filters and how they can reduce the apparent
effect of high frequency ringing superimposed on the primary response wave form. Exercise care to avoid overfiltering and distorting the response data. (See Figure 19)
3. If possible, restrict flexible elements within the product in order to make it as
homogeneous and rigid as possible. It is sometimes instructive to perform two drop tests; one with the flexible elements unrestrained showing the high frequency response and the second with flexible elements restrained. Note the difference on the product response characteristics.
The vibration performance of a package system is verified by subjecting it to a sine sweep over the same frequency range likely to be experienced in the distribution environment. With an accelerometer mounted on a rigid part of the product, the designer can identify the frequencies where the cushion material amplifies vibration input and where it begins to attenuate that input. If the job was done correctly, the package will attenuate (reduce in amplitude) those frequencies where the product is most sensitive.
Package shock integrity tests typically involve a series of corner and edge impacts such as those called out in ASTM D4169. This procedure is perhaps the most up-to-date method incorporating much of the environmental input studies to date. This standard is recommended for package integrity testing.
The vibration integrity characteristics of a package system are tested using a random vibration procedure. Select a suitable random vibration spectrum that "envelopes" about 98% of the anticipated input from vehicles known to be used to distribute the product. Dwell times vary; some firms use a dwell equal to 5 to 10% of the anticipated time the product will be exposed to vibration input. Thus a 20-hour truck trip may dictate a 1-hour random dwell. Some experimentation in this area will be necessary.
- 29 -
Beware of the "mechanical bounce" test sometimes called a vibration test procedure. The bounce test (conducted on a mechanical shaker) amounts to a series of repeated impacts with very short intervals between events. It may be referred to as a repeated impacts with very short intervals between events. It may be referred to as a repeated impact test, a bounce test, a fatigue test or something else...but it should not be mistaken for a vibration test.
If the package system meets all its requirements, then the job is finished. If not, further package system refinements are necessary. The following information may help.
- 30 -
VIII. INTERPRETING PACKAGE RESPONSE DATA
WAVE FORM ANALYSIS
The response wave form generated during a package drop test contains a wealth of information useful to the package designer. A good designer should learn to interpret this data.
The first piece of information taken from a response wave form is the total velocity change, or what can be thought of as the energy released during the impact. This can be determined by integrating the wave form. The integral is the area under the acceleration vs. time signature. This can be estimated by multiplying the peak acceleration times the duration times a factor appropriate for the shape of the response pulse; 0.6 is generally used for halfsine or haversine pulses. Some instrumentation systems given this data automatically. The velocity change should fall somewhere between the minimum and maximum values for the drop height and the coefficient of restitution for the cushion being used. If it doesn't, there's something wrong and the test should be investigated.
In general, the rise time of a shock pulse (the time from onset of the pulse to peak acceleration) should be approximately 1/2 total pulse duration. If the rise time is shorter than this, it generally indicates that the cushion is too stiff or under loaded. If the rise is greater than 1/2 pulse duration, this indicates the material is too flexible or overloaded. In a similar way, if a sharp spike is seen at the very beginning of the wave form, it generally indicates the material is too stiff or under loaded. Conversely, if a spike occurs at the end of the wave form it generally indicates the material is too flexible or overloaded.
- 31 -
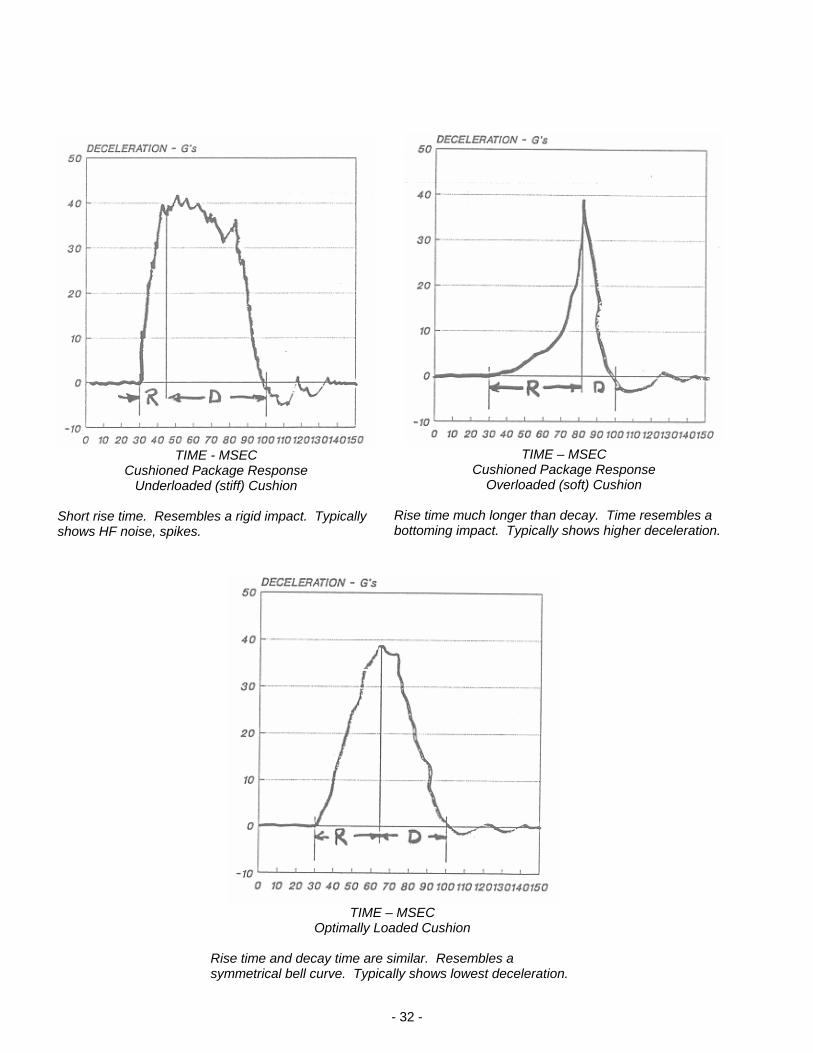
TIME – MSEC
Cushioned Package Response Overloaded (soft) Cushion
Rise time much longer than decay. Time resembles a bottoming impact. Typically shows higher deceleration.
TIME - MSEC
Cushioned Package Response Underloaded (stiff) Cushion
Short rise time. Resembles a rigid impact. Typically shows HF noise, spikes.
TIME – MSEC
Optimally Loaded Cushion
Rise time and decay time are similar. Resembles a symmetrical bell curve. Typically shows lowest deceleration.
- 32 -
INCONSISTENT DATA
In some cases, repeated drops will produce different results at the same drop height and accelerometer location. This generally indicates that the drop is not flat or that the product is rotating within the cushion upon impact. One way to resolve this is to use two accelerometers at different locations within the package or use two separate drops with the accelerometer moved to a different location for the second impact.
Product rotation is normal and an indication that the cushion material is not properly distributed in relation to the C/G of the product. Another method of determining this is to use a triaxial accelerometer (three accelerometers in one) to measure the cross axis acceleration during a package drop test.
SIMULTANEOUS INPUT AND RESPONSE MEASUREMENT
The SIRM technique is an attempt to determine the difference between package input and product response. This sounds like a fairly academic question, one that should be easily resolved, but many packaging engineers, especially at high tech companies, are struggling with this issue. To use this technique it is most desirable to generate fragility data using both an input and a response accelerometer. This deviates from the recommended practice for Damage Boundary testing (ASTM D3332) in that normally only the input is monitored. The last non-failure acceleration input is considered to be the fragility limit of the product. Using the SIRM approach, however, both the input to the product and the response of a component (such as a disc drive) would be monitored. This is shown in Figure 21.
- 33 -
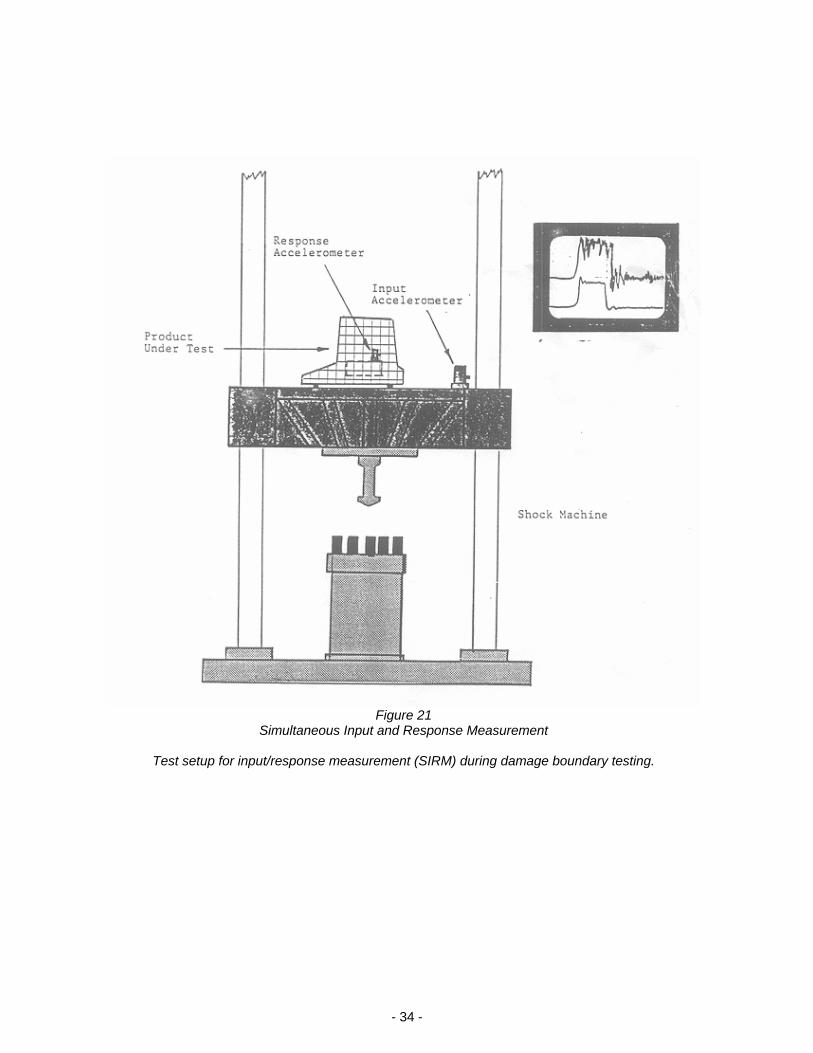
Figure 21
Simultaneous Input and Response Measurement
Test setup for input/response measurement (SIRM) during damage boundary testing.
- 34 -
When the product is placed in a package system for package performance testing, the acceleration response is monitored on both a rigid portion of the product and on the element monitored during Damage Boundary testing. A word of caution is in order here. The high frequency ringing and other response typical of this type of testing will make the data look very "noisy" and difficult to interpret. Filtering techniques are helpful in a situation like this.
Many interesting and useful things can be learned by this technique. In most cases it should easily resolve the issue of package input vs. product response. This may result in significant cost savings from many over designed package systems for high technology products.
Another advantage is that vibration response can be estimated from wave form duration. It should be emphasized that this results only in an estimate of the natural frequencies involved in the product/package system and that accurate response data should be obtained from vibration transmissibility tests.
- 35 -
IX. CONCLUSION
All cushion systems work in the same general way. They trade peak acceleration for duration, that is, they trade a high peak, short duration for a longer duration lower peak shock pulse. Ideally the peak acceleration is below product critical acceleration. Cushion deflection can be the result of compression, shear, flexure or other motion of the material. The results are the same . . . the material must "give" in order to change the shape of the acceleration vs. time pulse delivered to the product. The nature of this deflection is controlled by a series of simple physical laws. Also, the relationship of the variables involved in dynamic package response is relatively straightforward. Once understood, it can be of great help in optimizing cushion design.
Vibration performance, often though a high tech issue only, is now very significant for many product/package systems. It is likely that vibration will become more significant in the future due to further optimization of existing packages and light weighting and cost reducing of existing products. The use of ribs on cushion materials and similar techniques should help resolve conflicts that occur between shock and vibration performance requirements of a package system.
Of particular significance is the availability of computer programs to analyze complex dynamic situations. For example, Finite Element Analysis programs should adequately describe cushion material performance and generate information necessary for a workable prototype with very little trial and error work in the laboratory. While these tools are not widely used at this time, it is likely that they will be in the future.
As is the case with society in general, package design and testing will become more technical in the future. However, increased sophistication will simply involve adaptations of a few basic techniques explored in this paper. The package designer is encouraged to learn why and how cushion materials to their job and to use this information to design better and more efficient package systems.
- 36 -
REFERENCES 1. Schueneman, H H , "Package Testing For the Overnight Delivery Distribution
Environment", Westpak, Inc., 1988. 2. Ostrem, F.E. and Godshall, W.D., "An Assessment of the Common Carrier
Distribution Environment," General Technical Report FPL 22, Forest Products Lab, USDA, Madison, WI, 1979.
3 Schueneman, H H, "Package Drop Height; What The Data Is Really Telling Us",
Presented at PACKEXPO 88, Chicago, IL, 1988. 4. American Society for Testing and Materials D 4728, Standard Test Method for
Random Vibration Testing of Shipping Containers, Annual book of ASTM standards vol. 15.09, Philly, PA, 1993.
- 37 -


APPENDIX I
DEFINITION OF TERMS
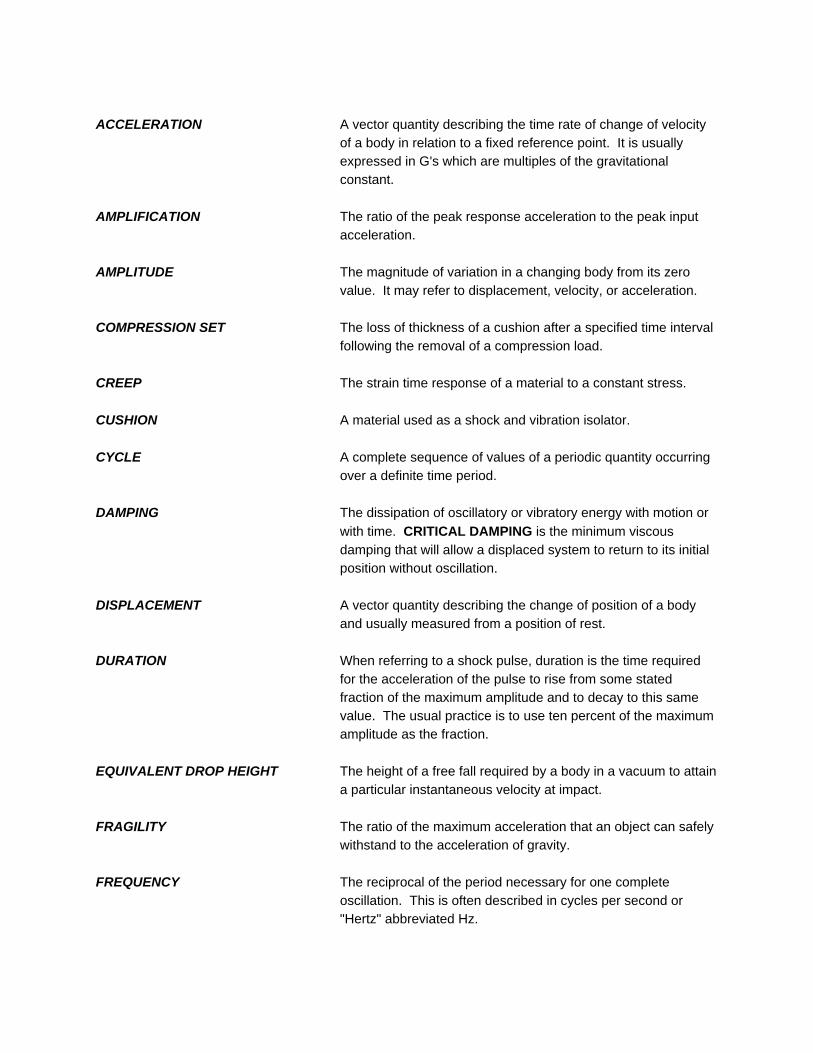
ACCELERATION A vector quantity describing the time rate of change of velocity
of a body in relation to a fixed reference point. It is usually expressed in G's which are multiples of the gravitational constant.
AMPLIFICATION The ratio of the peak response acceleration to the peak input
acceleration. AMPLITUDE The magnitude of variation in a changing body from its zero
value. It may refer to displacement, velocity, or acceleration. COMPRESSION SET The loss of thickness of a cushion after a specified time interval
following the removal of a compression load. CREEP The strain time response of a material to a constant stress. CUSHION A material used as a shock and vibration isolator. CYCLE A complete sequence of values of a periodic quantity occurring
over a definite time period. DAMPING The dissipation of oscillatory or vibratory energy with motion or
with time. CRITICAL DAMPING is the minimum viscous damping that will allow a displaced system to return to its initial position without oscillation.
DISPLACEMENT A vector quantity describing the change of position of a body
and usually measured from a position of rest. DURATION When referring to a shock pulse, duration is the time required
for the acceleration of the pulse to rise from some stated fraction of the maximum amplitude and to decay to this same value. The usual practice is to use ten percent of the maximum amplitude as the fraction.
EQUIVALENT DROP HEIGHT The height of a free fall required by a body in a vacuum to attain
a particular instantaneous velocity at impact. FRAGILITY The ratio of the maximum acceleration that an object can safely
withstand to the acceleration of gravity. FREQUENCY The reciprocal of the period necessary for one complete
oscillation. This is often described in cycles per second or "Hertz" abbreviated Hz.
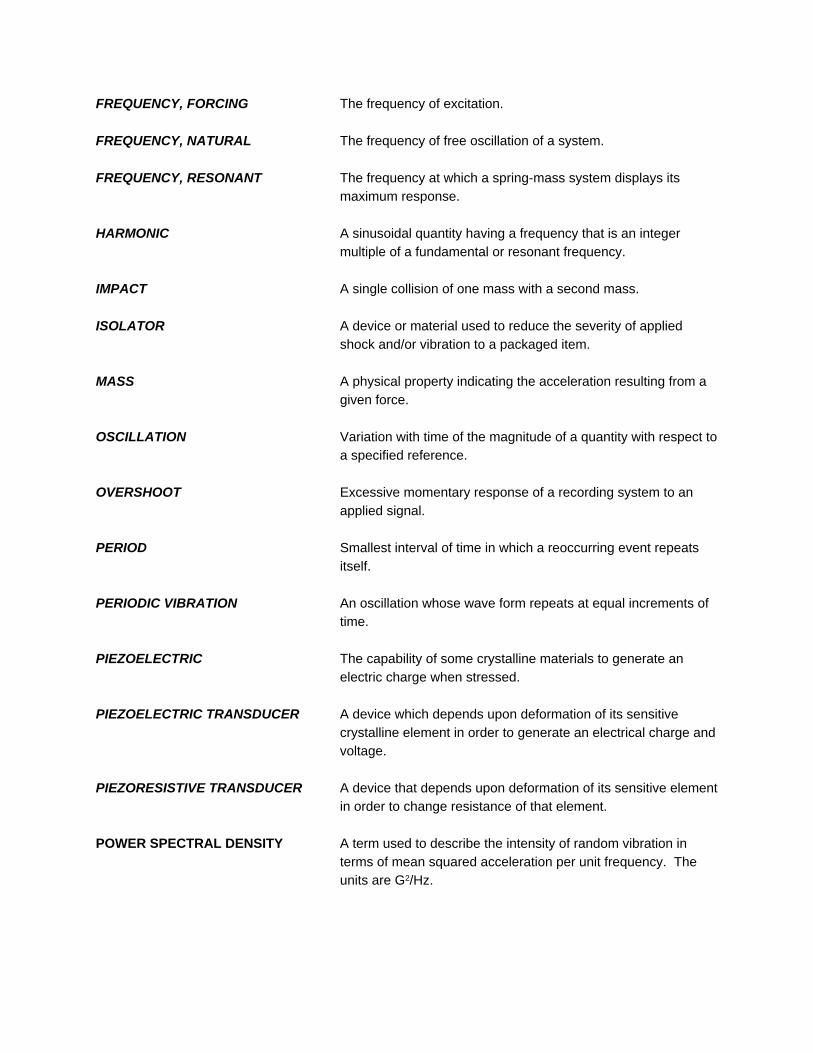
FREQUENCY, FORCING The frequency of excitation. FREQUENCY, NATURAL The frequency of free oscillation of a system. FREQUENCY, RESONANT The frequency at which a spring-mass system displays its
maximum response. HARMONIC A sinusoidal quantity having a frequency that is an integer
multiple of a fundamental or resonant frequency. IMPACT A single collision of one mass with a second mass. ISOLATOR A device or material used to reduce the severity of applied
shock and/or vibration to a packaged item. MASS A physical property indicating the acceleration resulting from a
given force. OSCILLATION Variation with time of the magnitude of a quantity with respect to
a specified reference. OVERSHOOT Excessive momentary response of a recording system to an
applied signal. PERIOD Smallest interval of time in which a reoccurring event repeats
itself. PERIODIC VIBRATION An oscillation whose wave form repeats at equal increments of
time. PIEZOELECTRIC The capability of some crystalline materials to generate an
electric charge when stressed. PIEZOELECTRIC TRANSDUCER A device which depends upon deformation of its sensitive
crystalline element in order to generate an electrical charge and voltage.
PIEZORESISTIVE TRANSDUCER A device that depends upon deformation of its sensitive element
in order to change resistance of that element. POWER SPECTRAL DENSITY A term used to describe the intensity of random vibration in
terms of mean squared acceleration per unit frequency. The units are G2/Hz.
RESILIENCE A material characteristic indicating an ability to withstand temporary deformation without permanent deformation or rupture.
RESONANCE Resonance of a system in forced vibration exists when any
change, however small, in the frequency of excitation causes a decrease in the response of the system. Resonance represents a maximum of response of a spring-mass system to forced vibration.
SHOCK A sudden, severe, non-periodic excitation of an object or
system. SHOCK MACHINE A device for subjecting a system to a controlled and
reproducible mechanical shock. SHOCK PULSE A substantial disturbance characterized by a rise and decay of
acceleration from a constant value in a short period of time. Shock pulses are normally displayed graphically as curves of acceleration as a function of time.
SHOCK SPECTRUM A plot of the maximum response experienced by a single-
degree-of-freedom system as a function of its own natural frequency in response to an applied shock input. The response may be expressed in terms of acceleration, velocity, or displacement.
SIMPLE HARMONIC MOTION Periodic vibration that is a sinusoidal function of time. SINGLE-DEGREE-OF-FREEDOM SYSTEM A system consisting of a rigid mass attached to a referenced
foundation by a massless spring that is constrained along a straight line.
STRAIN Deformation per unit length. STRESS Force per unit length. TRANSDUCER An instrument that converts shock and vibration or other
mechanical phenomena into a corresponding electrical signal. TRANSMISSIBILITY The dimensionless ratio of the response amplitude of a system
in steady state forced vibration to the excitation amplitude. The ratio may represent acceleration, forces, displacements or velocities.
VELOCITY A vector quantity describing the time rate of change of displacement of a body in relation to a fixed reference point.
VELOCITY CHANGE The difference in system velocity magnitude and direction from
the start to the end of a shock pulse. The magnitude may be determined from the integral of the acceleration versus time signature.
VELOCITY SHOCK A mechanical shock resulting from a rapid net change in
velocity. The velocity change is rapid if it takes place in a time that is very short compared to the natural period of the test specimen.
VIBRATION The oscillation of an element of a mechanical system about a
fixed reference point. VIBRATION, PERIODIC A vibration consisting of a wave form that is repeated at equal
time intervals. VIBRATION, RANDOM An oscillation having an instantaneous frequency and amplitude
that can be specified only on a probability basis. VISCOELASTIC An adjective indicating that a material or system has both
energy storing and energy dissipating capability during deformation.