Zero-Coupon Yield Curve Estimation with the Package termstrc

2014, 2 (3), 651-665
651
Curve Estimation Modeling between Area and Volume of Landslides
in Tajan River Basin, North of Iran
Mohammadali Hadian-Amri1,2
*, Karim Solaimani3, Ataollah Kavian
3,
Peyman Afzal4,5
and Thomas Glade2
1 Department of Watershed Management Engineering, Faculty of Natural Resources, University of
Mazandaran, Babolsar, Iran 2 Department of Geography and Regional Research, University of Vienna, Austria 3 Department of Watershed Management Engineering, Faculty of Natural Resources, Sari University of
Agricultural Science and Natural Resources, Sari, Iran 4 Department of Mining Engineering, South Tehran Branch, Islamic Azad University, Tehran, Iran 5 Camborne School of Mines, University of Exeter, Penryn, UK
Received: 30 July 2014 / Accepted: 27 September 2014 / Published Online: 13 April 2015
ABSTRACT Determining landslide size could be a difficult and expensive task. In this research,
size parameters of 142 landslides recognized in Tajan River Basin, northern Iran, have been assessed.
The dataset was prepared through the extensive field surveys and using the satellite imagery
available via Google Earth. Dependence between landslides area (A-m2), volume (V-m
3), and depth
(D-m) was appointed by the Pearson correlation coefficient (r) at 0.05 and 0.01 levels. Then, the
relation between the area and volume variables has been investigated using 10 curve estimation (CE)
models. Coefficient of determination (R2), F statistic, and RMSE were calculated to compare the
models with each other. Results showed that the power law fit the data better than other CE models.
Although, the quadratic and cubic relationships have represented high R2 and low RMSE, they have
resulted negative estimated volumes, and also their F statistic is less than its value in power law. To
achieve a better result, the estimated volumes were compared with the observed ones using paired
test. Results indicated that the estimated volumes were in conformity with the observed ones and
there was no statistically significant difference between them (R2=0.801, sig=0.633). Although, the
estimated depths were significantly different from the observed ones, the mean depth was estimated
5.5 m which was close to mean of the actual depths (5.53 m).
Key words: Coefficient of determination, Depth, Pearson correlation coefficient, Power model
1 INTRODUCTION
Landslides occur due to various triggering
mechanisms and are influenced by
susceptibility factors such as susceptible
geology, steep slopes, uneven topography,
changeable climatic and microclimatic
conditions, rainfall, earthquake and vegetation
degradation, and cause considerable damages
(Crozier, 1986; Turner and Schuster, 1996;
Gerrard and Gardner, 2002; Wobus et al., 2003;
Hasegawa et al., 2009). They generate large
amount of sediment in mountainous watersheds;
however, quantifying the downstream delivery of
landslide-derived sediment remains a challenge
(e.g. Tsai et al., 2013).
This phenomenon is one of the main natural
*Corresponding author: Department of Watershed Management Engineering, Faculty of Natural Resources, University of Mazandaran, Babolsar,
Iran. Tel: +98 911 960 6208, +98 935 930 4913, E-mail: [email protected]

M.A. Hadian-Amri et al. ______________________________________ ECOPERSIA (2014) Vol. 2(3)
652
catastrophic events in Iran that could happen
any time and makes great economic and public
losses annually; as annual economic losses of
landslide in Iran have been estimated to be
approximately 600 Million $US excluding the
loss of non-retrievable resources (Ajalloeian et
al., 2013). Regarding the database of landslides
in Iran and annual report prepared by Mass
Erosion and Landslide Stabilization Group
(MELSG) of Iran (2007), the economic losses
of landslides was estimated to be about 12,700
million $US from 1982 by the end of 2007 in
the country (MELSG of Iran, 2007; 2012;
Hagh’shenas, 2009). MELSG of Iran (2012)
has reported about 188 persons killed due to
landslide occurrence; roads and railroad
network damages were estimated 307.67 km
totally (forest roads: 3 km, railroads: 6 km,
main roads: 252.67 km and rural roads: 46 km)
during a 25-year period, from 1982 to 2007.
Thus, it is important to recognize the
landslides number and size (area, volume, and
depth) in vulnerable regions to estimate the
landslide susceptibility, hazard and risk
assessment and mitigation (e.g. Guzzetti et al.,
1999; Cardinali et al., 2002; Malamud et al.,
2004, Reichenbach et al., 2005), and to assess
the landslides contribution to erosion and
sediment yield (e.g. Hovius et al., 1997, 2000;
Martin et al., 2002; Guthrie and Evans, 2004b;
Lavé and Burbank, 2004; Chuang et al., 2009;
Tsai et al., 2013). The statistics of the number,
density and area of landslides can be calculated
for different periods, if landslide inventory
maps are available in digital form (Guzzetti et
al., 2005, 2006; Imaizumi and Sidle, 2007;
Galli et al., 2008).
Estimating the volume of slope failures is a
difficult, expensive and challenging task which
needs data collection on the surface and sub-
surface geometry of the slope, especially for a
large population of landslides in an area
(Malamud et al., 2004; Guzzetti et al., 2009).
At present, it can be achieved only through a
thoughtful implementation of the empirical
relationships to connect the volume of single
landslides to other geometrical parameters of
the failures, specially measured landslide area
so that (Simonett, 1967; Rice et al., 1969;
Innes, 1983; Hovius et al., 1997, Guthrie and
Evans, 2004a; Korup, 2005; ten Brink et al.,
2006; Imaizumi and Sidle, 2007; Guzzetti et al.,
2008, 2009; Imaizumi et al., 2008).
The relation between landslide area (m2) and
volume (m3) was investigated by many
researchers all over the world (e.g. Korup,
2005; ten Brink et al., 2006; Imaizumi and
Sidle, 2007; Guzzetti et al., 2008, 2009;
Imaizumi et al., 2008). Tsai et al. (2013)
estimated Landslide erosion and sediment
delivery to the Shihmen Reservoir watershed in
Taiwan using empirical landslide frequency–
area and volume–area relationships, empirical
landslide runout models, and the Hydrological
Simulation Program- FORTRAN (HSPF). They
found that just a small percentage of the
landslide material was transported to
downstream and the sediment delivery in the
fluvial system is mainly limited regarding the
model simulations. The imbalance between
sediment supply and transportation capacity has
resulted in a significant quantity of landslide
material remaining in the upstream regions of
the watershed.
Guthrie and Evans (2004a) found the
relation V=0.1549×A1.0905
by considering 124
debris slides in the west coast of Vancouver
Island, British Columbia. Korup (2005) studied
23 large landslides in the Western Southern
Alps, New Zealand, and established that
V=0.02×A1.95
with A in km2 and V in km
3.
Imaizumi and Sidle (2007) measured the
volume of 51 shallow landslide scars in the
Miyagawa catchment, central Japan, and
obtained that V=0.39×A1.31
. Imaizumi et al.

CE Modeling between Area and Volume of Landslides __________________ ECOPERSIA (2014) Vol. 2(3)
653
used geometry of 11 landslides and determined
that V=0.19×A1.19
. Guzzetti et al. (2008), found
the relationship V=0.0844×A1.4324
using a
preliminary listing of 539 landslides worldwide.
Guzzetti et al. (2009) showed that V=0.074×A1.45
for 677 landslides of the slide type selected from a
worldwide dataset and used the relation in the
Collazzone area, central Italy.
A general review of landslide geometrical
characteristics in Iran provides few numbers of
international authentic papers on the subject; so
that, there are no papers considering the relation
between landslides size characteristics, area-
volume relation mainly, so far. Omidvar and
Kavian (2011) represented the relationship
V=0.974×A1.176
(R2=0.823), for 442 landslides
in the range of ≈123 m2≤A≤≈1085E03 m
2 in
Mazandaran province (the province mapped in
Figure 1) northern Iran, at the regional scale
and published the result in Persian.
The main purposes of this research are to
present a detailed geometric attributes of 142
landslides inventory of Tajan River Basin, north
of Iran and assess their volume-area at the basin
scale. The main difference between the present
study and the previous publications is that it
indicates the results of comparison 10 curve
estimation models between area and volume
with each other. Finally, a relationship to
estimate volume value will be proposed for the
landslide in the study area.
2 MATERIALS AND METHODS
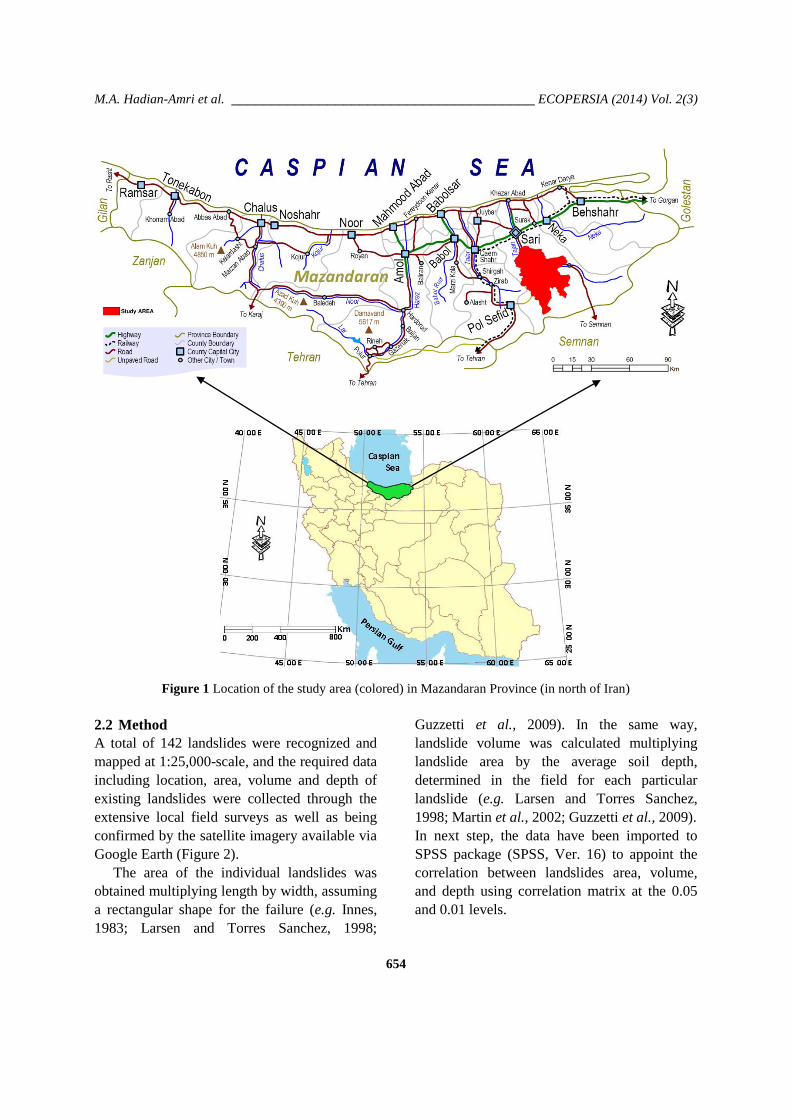
2.1 Study Area
The study area, a part of Tajan River Basin, is
located in the Mazandaran province, north of
Iran and south of Caspian Sea, between UTM
coordinate 680119E and 725053E, and
3986371N and 4041448N, covering
approximately 1,300 km2 (Figure 1). The
altitude of the area ranges from 78 to 3,105
AMSL (m) and the slope angel ranges from 0 to
79 degree based on a 20 m×20 m digital
elevation model (DEM) within the study area.
Annual mean rainfall of the area is almost 700
mm calculated from data set of 27 rain-gauge
stations inside (8 gauges) and outside (19
gauges) the area. Regarding the geological map
of Iran, 1:100,000 series, sheets 6662 (Pol-e-
Sefid) and 6762 (Kiasar) (GSI, 1997) lithology
of the area is covered 42.96% by M2,3m,s,l
group
which is a Miocene formation, including marl,
limy sandstone and siltstone, silty marl, sandy
limestone, mudstone and minor conglomerate,
and 15.96% by K2l,m
group whose geological
age is the Late Cretaceous, including cream-
light green-grey glauconitic marly limestone,
limy marl, silty marl and marl. The major
landuse of the study area is forest which
includes high and medium density forests plus
mixed forest/orchard and covers nearly 73% of
the area. The total length of major faults in the
area is 58.17 km (GSI 1997). This area is one of
the rainiest regions and frequently hit by severe
rainstorms every year that usually trigger a
large number of landslides due to its geologic,
geomorphologic, and climatic settings, which
result in serious economic losses and casualties.
This research was conducted to investigate area,
volume, and depth parameters of 142 recorded
landslides in the area.
M.A. Hadian-Amri et al. ______________________________________ ECOPERSIA (2014) Vol. 2(3)
654
Figure 1 Location of the study area (colored) in Mazandaran Province (in north of Iran)
2.2 Method
A total of 142 landslides were recognized and
mapped at 1:25,000-scale, and the required data
including location, area, volume and depth of
existing landslides were collected through the
extensive local field surveys as well as being
confirmed by the satellite imagery available via
Google Earth (Figure 2).
The area of the individual landslides was
obtained multiplying length by width, assuming
a rectangular shape for the failure (e.g. Innes,
1983; Larsen and Torres Sanchez, 1998;
Guzzetti et al., 2009). In the same way,
landslide volume was calculated multiplying
landslide area by the average soil depth,
determined in the field for each particular
landslide (e.g. Larsen and Torres Sanchez,
1998; Martin et al., 2002; Guzzetti et al., 2009).
In next step, the data have been imported to
SPSS package (SPSS, Ver. 16) to appoint the
correlation between landslides area, volume,
and depth using correlation matrix at the 0.05
and 0.01 levels.

CE Modeling between Area and Volume of Landslides __________________ ECOPERSIA (2014) Vol. 2(3)
655
Figure 2 Spatial distribution of 142 individual landslides in the study area
Dependence between the variables was
appointed by the Pearson correlation coefficient
(r) (Pearson, 1896) at the 0.05 and 0.01 levels
(Equation 1).
1
2 2
1 1
n
i ii
n n
i ii i
X X Y Yr
X X Y Y
(1)
Where Xi, Yi, X , Y and n are each observed
data, estimated data equivalent to that of
observed one, mean of total observed data,
mean of total estimated data and number of
data, respectively.
In that case, the relation between area and
volume has been investigated using 10 curve
estimation models (CEM) such as Linear,
Logarithmic, Inverse, Quadratic (degree 2
polynomial), Cubic (degree 3 polynomial),
Compound, Power, S Curve, Growth and
Exponential between landslides area (m2) and
volume (m3) as independent and dependent
variables, respectively (Table 1, Pallant, 2007;
Chatterjee and Hadi, 2006).

M.A. Hadian-Amri et al. ______________________________________ ECOPERSIA (2014) Vol. 2(3)
656
Table 1 General equation of curve estimation models used in this research (Chatterjee and Hadi, 2006; Pallant, 2007)
Model Type General equation
Linear 1y a b x
Logarithmic 1 lny a b x
Inverse 1by a
x
Quadratic 2
1 2y a b x b x
Cubic 2 3
1 2 3y a b x b x b x
Compound 1
xy ab 1ln ln ln( )y a b x
Power 1by ax
1ln ln lny a b x
S curve 1ba
xy e
1lnb
y ax
Growth 1a b xy e
1ln y a b x
Exponential 1b xy ae
1ln lny a b x
Coefficient of determination (R2), F statistic
and RMSE (Equation 2, Kim et al., 2008) were
calculated to compare the models with together.
2
i iO ERMSE
n
(2)
Where, Oi, Ei and n are each observed data,
estimated data equivalent to that of observed
one and number of data, respectively.
Regarding the final area-volume model, the
depth of landslides has been estimated and then,
the predicted depths have been compared with the
actual ones measured through the field surveys,
using paired samples test at the 0.01 level.
3 RESULTS
Statistical parameters of 142 landslides in the
study area have been shown in Table 2. The
area of smallest and largest landslides is 180 m2
and 900,000 m2, respectively.
Table 3 presents the result of correlation matrix
between area, volume, and depth at the 0.05 and
0.01 levels. As it shows there is significant
correlation between these parameters at the
mentioned levels.
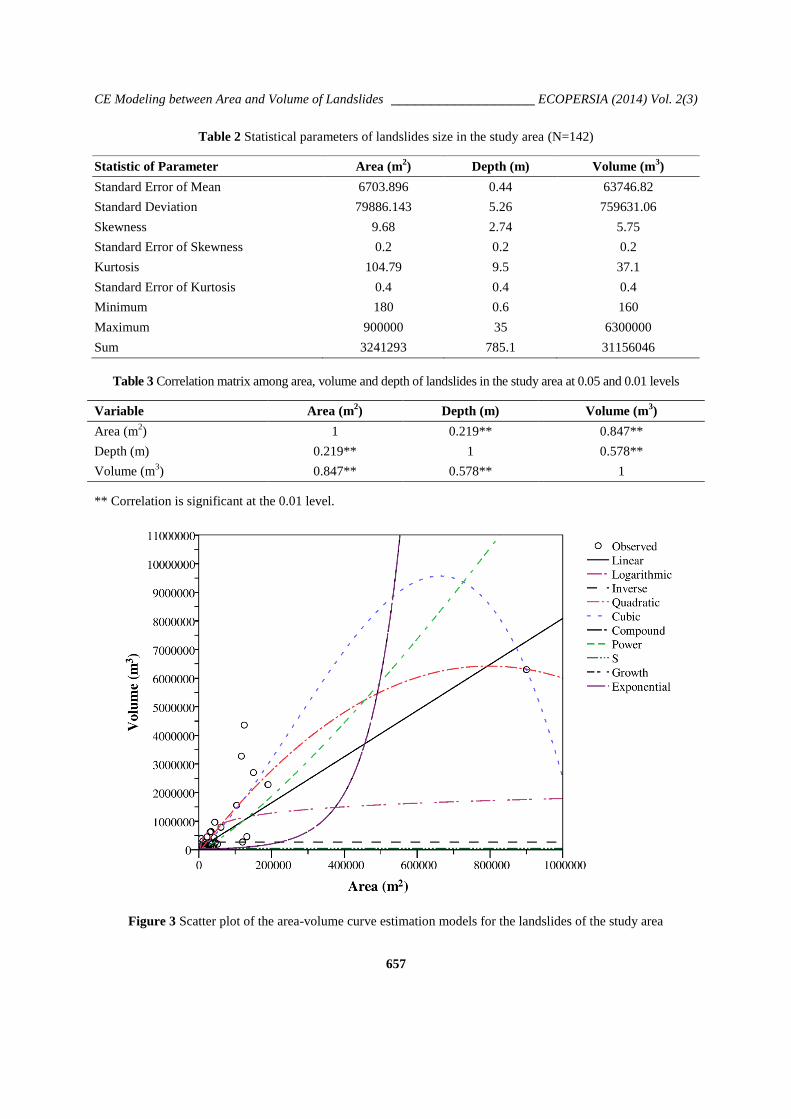
The results obtained using CE models and the
results of comparing between the models with
together were shown in Figure 3 and Table 4,
respectively. Dependent and independent
variables are volume and area of landslides,
respectively.
or
or
or
or
or
CE Modeling between Area and Volume of Landslides __________________ ECOPERSIA (2014) Vol. 2(3)
657
Table 2 Statistical parameters of landslides size in the study area (N=142)
Statistic of Parameter Area (m2) Depth (m) Volume (m
3)
Standard Error of Mean 6703.896 0.44 63746.82
Standard Deviation 79886.143 5.26 759631.06
Skewness 9.68 2.74 5.75
Standard Error of Skewness 0.2 0.2 0.2
Kurtosis 104.79 9.5 37.1
Standard Error of Kurtosis 0.4 0.4 0.4
Minimum 180 0.6 160
Maximum 900000 35 6300000
Sum 3241293 785.1 31156046
Table 3 Correlation matrix among area, volume and depth of landslides in the study area at 0.05 and 0.01 levels
Variable Area (m2) Depth (m) Volume (m
3)
Area (m2) 1 0.219** 0.847**
Depth (m) 0.219** 1 0.578**
Volume (m3) 0.847** 0.578** 1
** Correlation is significant at the 0.01 level.
Figure 3 Scatter plot of the area-volume curve estimation models for the landslides of the study area

M.A. Hadian-Amri et al. ______________________________________ ECOPERSIA (2014) Vol. 2(3)
658
Table 4 Comparison of curve estimation models between volume and area of study landslides
Model R2 F RMSE
Linear 0.72 357.15 402716.4
Logarithmic 0.33 69.56 619428.3
Inverse 0.02 2.65 749940.8
Quadratic 0.8 281.99 337560.9
Cubic 0.81 191.42 334156.4
Compound 0.22 39.83 45327369.9
Power 0.82 627.61 639723.7
S curve 0.38 84.8 775014.2
Growth 0.22 39.83 45327369.9
Exponential 0.22 39.83 45327369.9
4 DISCUSSION
Results (Table 4) indicated that the power law
fit the data better than other CE models because
of R2=0.82, F=627.61 (sig=0.000) and
RMSE=639,723.7.
Although quadratic and cubic relationships
have represented R2= (0.8; 0.81) and RMSE=
(337,560.9; 334,156.4), respectively, they have
resulted negative values of estimated volumes
and also F statistic of them has been resulted
less than its value in power law relationship.
Hence, the power law has been confirmed as
model of the best fit.
For better inspection of the power law
relation, the scatter of the empirical data was
shown in log–log coordinates (Figure 4).
Standard errors of skewness and kurtosis
shown in Table 2 represent that frequency
distribution of landslides in the study area
follows a normal distribution. Figure 5 indicates
frequency distribution of landslides in different
classes of their areas (m2) and volumes (m
3) and
confirms that it follows nearly a normal
distribution related to areas and volumes, as
well.
Frequency distribution above can be
characterized as bimodal that can be related to
two different types of landslides in the study
area.
On the plots compiled in non-logarithmic
scale (Figures 3) it is clear that only one event
has an area of about 0.9 km2, which is more
than 4 times larger than the largest of others.
Since the power law, quadratic and cubic
models showed high value of R2 (Table 4),
these models have been reconstructed by
excluding the largest size from the dataset as
outlier data. Results show that R2 decreased
slightly in power law from 0.8157 to 0.8055,
while it decreased significantly in quadratic and
cubic models from 0.8 and 0.81 to 0.6385 and
0.6719, respectively (Figure 6 and Figure 7).

CE Modeling between Area and Volume of Landslides __________________ ECOPERSIA (2014) Vol. 2(3)
659
Figure 4 Logarithmic coordinate of the power law relationship between area (A) m
2 and volume (V) m
3 of the
landslides in the study area
Figure 5 Frequency distribution of the landslides follows nearly a normal distribution related to their areas and
volumes. Gray columns show the landslides frequency in different classes of the areas and volumes
V = 0.4763 A1.244
R² = 0.8157
V= 0.4763A1.244
R2= 0.8157

M.A. Hadian-Amri et al. ______________________________________ ECOPERSIA (2014) Vol. 2(3)
660
Figure 6 Area-volume power law, quadratic, and cubic models after excluding the largest data
Figure 7 Logarithmic coordinate of the area-volume CE models after excluding the largest data
V=0.4261A1.2572
R2= 0.8055
V=2E-05A2 + 12.691A – 53720
R2 = 0.6385
V= -1E-09A3 + 0.0003A2 – 0.7108A + 22279
R2 = 0.6719
V=2E-05A2 + 12.691A – 53720
R2 = 0.6385
V= -1E-09A3 + 0.0003A2 – 0.7108A
+ 22279
V= -1E-09A3 + 0.0003A2 – 0.7108A + 22279
R2 = 0.6719
V=0.4261A1.2572
R2 = 0.8055
V= -1E-09A3 + 0.0003A2
– 0.7108A + 22279

CE Modeling between Area and Volume of Landslides __________________ ECOPERSIA (2014) Vol. 2(3)
661
In fact, we are not allowed to exclude the
landslide occurring in the area as an outlier data
because it is a reality, and the data of this large
landslide are real, hence, it is important to
consider all data in various sizes for
determination of risk. If we remove the
mentioned landslide from the dataset, then, we
decrease the susceptibility, hazard, and risk
levels in hazardous and risky areas for
subsequent researches in landslide zonation
assessment and evaluation while the area-
volume relationship will not consider the reality
which is another thing.
In order to achieve a better result, the power
law relationship has been applied to estimate
the volumes and then estimated values
compared with the observed ones using paired
test. Results indicated that the estimated
volumes are in conformity with the observed
ones and there is no statistically significant
difference between them (R=0.801, sig=0.633),
(Table 5). 95% confidence interval of the
difference indicated that the mean of estimated
volumes is less than the mean of the observed
ones (-79178.77≤µd≤129673.44).
In this step, the mean of actual area was
calculated and then based on the final model
(power law), the average of estimated volume
obtained. Hence, the average depth of 5.5 m
was estimated that is close to the mean of the
observed one (5.53 m, Table 2).
Also, values of the estimated depths were
compared with the observed ones using paired
test. Results indicated that the estimated depths
are in disagreement with the observed ones and
they are significantly different (R=0.48,
sig=0.004), (Table 6). 95% confidence interval
of the difference indicated that the mean of the
estimated depths is less (in this case a little bit)
than the mean of the observed ones
(0.37≤µd≤1.9).
Table 5 Results of paired samples correlation and test between the observed and estimated volume of landslides
N Correlation Sig. 95% Confidence Interval of the Difference
t df Sig.
Lower Upper
142 0.801 0.000 -79178.765 129673.443 0.478 141 0.633
Table 6 Results of paired samples correlation and test between the observed and estimated depth
N Correlation Sig.
95% Confidence Interval of the Difference
t df Sig.
Lower Upper
142 0.48 0.000 0.369 1.931 2.912 141 0.004

M.A. Hadian-Amri et al. ______________________________________ ECOPERSIA (2014) Vol. 2(3)
662
5 CONCLUSION
Adopting the statistical area-volume
relationship of landslides would be useful for
estimating the volume and depth of a landslide
due to difficulties in preparing required data on
the surface and sub-surface of the slope
(Malamud et al., 2004; Guzzetti et al., 2008;
2009), for erosion and sediment yield
assessments (Chuang et al., 2009; Tsai et al.,
2013), and for managing the risky and
susceptible slopes as well.
A practical relationship to connect landslide
area (m2) to landslide volume (m
3) was
achieved from a dataset catalogue of 142
landslides and fitted to the observed data in
Tajan River Basin, north of Iran. The
relationship is an equation of the form V=ρAα
and is in the same form with relationships
published by Simonett, 1967; Rice et al., 1969;
Innes, 1983; Guthrie and Evans, 2004a; Korup,
2005; ten Brink et al., 2006; Imaizumi and
Sidle, 2007; Guzzetti et al., 2008, 2009;
Imaizumi et al., 2008; Omidvar and Kavian,
2011.
Guzzetti et al. (2009) concluded that the
relationship is chiefly geometrical, and not
controlled significantly by geomorphological or
mechanical properties of the mass movement
types. In other word, landslides occurred in
various physiographic and climatic
environments and were caused by different
triggers indicate that the relationship between
volume and area is chiefly independent of the
physiographical setting. They mentioned that it
suggested a self-similar behavior of the
dependency between landslide area and
volume. Their conclusion refers to fractal
behavior of natural phenomena like landslides.
Regarding to the depth, it is acceptable
estimation just for calculating the mean statistic
of the collective data and not suitable for the
depth estimation of each landslide based on the
obtained volume- area relationship since
according to the depth importance in
determination landslide vulnerability and risk,
even low differences in depth could be
significant. Therefore, it is better to assess the
CE relationships between depth and area or
other geomorphometry parameters of landslides
that could be measured on the surface of the
failure to estimate depth of landslides.
6 REFERENCES
Ajalloueian, R., Mirsanei, R. and Fatehi, L.
Applied analysis of landslide. Isfahan
Branch of Jihad-e-Daneshgahi Press.
2013; 356 P. (In Persian)
Cardinali, M., Reichenbach, P., Guzzetti, F.,
Ardizzone, F., Antonini, G., Galli, M.,
Cacciano, M., Castellani, M. and Salvati,
P. A geomorphological approach to
estimate landslide hazard and risk in
urban and rural areas in Umbria, central
Italy. Nat. Hazard Earth Sys., 2002; 2 (1-
2): 57-72.
Chatterjee, S. and Hadi, A.S. Regression
analysis by example. Wiley. 4th Edition.
ISBN: 978-0-470-05545-8. 2006; 416 P.
Chuang, Sh.Ch., Chen, H., Lin, G.W., Lin,
Ch.W. and Chang, Ch.P. Increase in
basin sediment yield from landslides in
storms following major seismic
disturbance. Eng. Geol., 2009; 103: 59-
65.
Crozier, M.J. Landslides: Causes,
Consequences & Environment. Croom
Helm Pub, London. 1986; 245 P.
Galli, M., Ardizzone, F., Cardinali, M.,
Guzzetti, F. and Reichenbach, P.
Comparison of landslide inventory maps.
Geomorphology. 2008; 94: 268-289.
Geology Survey of Iran (GSI). 1997;
http://www.gsi.ir/Main/Lang_en/index.ht
ml.
CE Modeling between Area and Volume of Landslides __________________ ECOPERSIA (2014) Vol. 2(3)
663
Gerrard, J. and Gardner R. Relationships
between landsliding and land use in the
Likhu Khola drainage basin, Middle
Hills, Nepal. Mt. Res. Dev., 2002; 22:
48-55.
Guthrie, R.H. and Evans, S.G. Analysis of
landslide frequencies and characteristics
in a natural system, coastal British
Columbia. Earth Surf. Proc. Land.,
2004a; 29: 1321-1339.
Guthrie, R.H. and Evans, S.G. Magnitude and
frequency of landslides triggered by a
storm event, Loughborough Inlet, British
Columbia. Nat. Hazards and Earth Sys.
Sci., 2004b; 4: 475-483.
Guzzetti, F., Ardizzone, F., Cardinali, M.,
Rossi, M. and Valigi, D. Landslide
volumes and landslide mobilization rates
in Umbria, central Italy. Earth Planet. Sc.
Lett., 2009; 279: 222-229.
Guzzetti, F., Ardizzone, F., Cardinali, M., Galli,
M., Reichenbach, P. and Rossi, M.
Distribution of landslides in the Upper
Tiber River basin, central Italy.
Geomorphology. 2008; 96: 105-122.
Guzzetti, F., Carrara, A., Cardinali, M.,
Reichenbach, P. Landslide hazard
evaluation: a review of current
techniques and their application in a
multi-scale study. Geomorphology. 1999;
31: 181-216.
Guzzetti, F., Galli, M., Reichenbach, P.,
Ardizzone, F. and Cardinali, M.
Landslide hazard assessment in the
Collazzone area, Umbria, central Italy.
Nat. Hazard Earth Sys., 2006; 6: 115-
131.
Guzzetti, F., Reichenbach, P., Cardinali, M.,
Galli, M. and Ardizzone, F. Probabilistic
landslide hazard assessment at the basin
scale. Geomorphology. 2005; 72: 272-
299.
Hagh’shenas, A. Landslides: Classification and
importance in Iran. National Workshop
on Landslide Hazard Zonation.
International Institute of Earthquake
Engineering and Seismology (IIEES).
Tehran, Iran. 2009; (In Persian)
Hasegawa, S., Dahal, R.K., Yamanaka, M.,
Bhandary, N.P., Yatabe, R. and Inagaki,
H. Causes of large-scale landslides in the
Lesser Himalaya of central Nepal.
Environ. Geol., 2009; 57: 1423-1434.
Hovius, N., Stark, C.P., Hao-Tsu, C. and Jinn-
Chuan, L. Supply and removal of
sediment in a landslide-dominated
mountain belt: Central Range, Taiwan. J.
Geol., 2000; 108: 73-89.
Hovius, N., Stark, C.P. and Allen, P.A.
Sediment flux from a mountain belt
derived by landslide mapping. Geology,
1997; 25: 231-234.
Imaizumi, F. and Sidle, R.C. Linkage of
sediment supply and transport processes
in Miyagawa Dam catchment, Japan. J.
Geophys. Res., 2007; 17: 112 P.
Imaizumi, F., Sidle, R.C. and Kamei, R. Effects
of forest harvesting on the occurrence of
landslides and debris flows in steep
terrain of central Japan. Earth. Surf. Proc.
Land., 2008; 33: 827-840.
Innes, J.N. Lichenometric dating of debris-flow
deposits in the Scottish Highlands. Earth.
Surf. Proc. Land., 1983; 8: 579-588.
Kim, S. and Kim, H.S. Neural networks and
genetic algorithm approach for nonlinear
evaporation and evapotranspiration
modeling. J. Hydrol., 2008; 351: 299-
317.
M.A. Hadian-Amri et al. ______________________________________ ECOPERSIA (2014) Vol. 2(3)
664
Korup, O., Distribution of landslides in
southwest New Zealand. Landslides.
2005; 2: 43-51.
Larsen, M.C. and Torres Sanchez, A.J. The
frequency and distribution of recent
landslides in three montane tropical
regions of Puerto Rico. Geomorphology.
1998; 24: 309-331.
Lavé, J., Burbank, D. Denudation processes and
rates in the transverse ranges, southern
California: erosional response of a
transitional landscape to external and
anthropogenic forcing. J. Geophys. Res.,
2004; 109:F01006.
Malamud, B.D., Turcotte, D.L., Guzzetti, F. and
Reichenbach, P. Landslide inventories and
their statistical properties. Earth. Surf.
Proc. Land., 2004; 29: 687-711.
Martin, Y., Rood, K., Schwab, J.W. and
Church, M. Sediment transfer by shallow
landsliding in the Queen Charlotte
Islands, British Columbia. Can. J. Earth
Sci., 2002; 39 (2): 189-205.
Mass Erosion and Landslide Stabilization
Group of Iran. Database and
questionnaires of landslides in Iran:
Annual report. Forests, Rangelands and
Watershed Management Organization of
Iran. 2007. (In Persian)
Mass Erosion and Landslide Stabilization
Group (MELSG) of Iran. A report on
economic evaluation of landslides
stabilization in Iran. Iranian Specialty
Seminar on Landslides. Mazandaran,
Iran. 2012. (In Persian)
Omidvar, E. and Kavian, A. Landslide volume
estimation based on landslide area in a
regional scale (case study: Mazandaran
province). Journal of Range and
Watershed Management (JRWM), Iran.
J. Nat. Resour., 2011; 63(4): 439-455. (In
Persian)
Pallant, J. SPSS Survival Manual: A step by
step guide to data analysis using SPSS.
Open University Press. 3rd
Edition.
ISBN-13: 978-0335223664, ISBN-10:
0335223664. 2007; 352 P.
Pearson, K. Mathematical contributions to the
Theory of the Evolution-III, Regression,
Heredity and Panmixia, Philos. T. Roy.
Soc. A. 1896; 187: 253-318.
Reichenbach, P., Galli M., Cardinali, M.,
Guzzetti, F. and Ardizzone F.
Geomorphologic mapping to assess
landslide risk: concepts, methods and
applications in the Umbria Region of
central Italy. In: Glade, T., Anderson,
M.G., Crozier, M.J. (Eds.), Landslide
Risk Assessment. John Wiley,
Chichester. 2005; 429-468.
Rice, R.M., Corbett, E.S. and Bailey, R.G. Soil
slips related to vegetation, topography,
and soil in Southern California. Water
Resour. Res., 1969; 5 (3): 647-659.
Simonett, D.S., Landslide distribution and
earthquakes in the Bewani and Torricelli
Mountains, New Guinea. In: Jennings,
J.N., Mabbutt, J.A. (Eds.), Landform
Studies from Australia and New Guinea.
Cambridge University Press, Cambridge.
1967; 64-84.
ten Brink, U.S., Geist, E.L. and Andrews, B.D.
Size distribution of submarine landslides
and its implication to tsunami hazard in
Puerto Rico. Geophys. Res. Lett., 2006;
3: L11307.
Tsai, Z.X., You, G.J.Y., Lee, H.Y. and Chiu,
Y.J. Modeling the sediment yield from
landslides in the Shihmen Reservoir
watershed, Taiwan. Earth. Surf. Proc.
Land., 2013; 38: 661-674.
CE Modeling between Area and Volume of Landslides __________________ ECOPERSIA (2014) Vol. 2(3)
665
Wobus, C.W., Hodges, K.V. and Whipple, K.X.
Has focused denudation sustained active
thrusting at the Himalayan topographic
front? Geology, 2003; 861-864.
بخیس تجه، شمال ایرانلغسش در حوزه آ سازی برآورد منحنی بیه سطح و حجم زمیه مذل
12هحوذعلی ادیاى اهزی 2تهاط گالد 45پیواى افضل، 3کایاى عطاءاهلل، 3، کزین علیوای*
ایزاى هاسذراى، تاتلغز،داؾگا داؾکذ هاتع طثیعی، گز هذعی آتخیشداری، -1
ای، داؾگا یي اتزیؼ گز جغزافیا تحقیقات هطق -2
ایزاىداؾگا علم کؾارسی هاتع طثیعی عاری، عاری، داؾکذ هاتع طثیعی، عی آتخیشداری، گز هذ -3
ایزاى تزاى، ،گز هذعی هعذى، داؾکذ فی هذعی، داؾگا آساد اعالهی احذ تزاى جب -4
تز اگلغتاىغکداؾگا اگز هعذى، -5
1334فزردیي 24/ تاریخ چاج: 1333هز 5 یزػ:/ تاریخ پذ 1333هزداد 8تاریخ دریافت:
آری داد طی عولیات صئهتزی عطحی سیزعطحی داه گغیختگی، لغشػ ت دلیل جوع تخویي اذاس سهیي چکیذه
در حس آتخیش تجي اقع ؽذ ییؽاعالغشػ سهیي 142ای اذاس تز اعت. در ایي تحقیق، یضگی کاری هؾکل شی
ای در ؽوال ایزاى، هرد تزرعی قزار گزفت اعت. هجوع داد طی تزرعی هیذای گغتزد اعتفاد اس تصایز هاار
ط ضزیة وثغتگی فزان ؽذ. وثغتگی تیي هتغیزای عطح حجن تع Google Earthقاتل دعتزط اس طزیق
. هذل تزآرد هحی تزرعی ؽذ 10تعط عپظ راتط تیي عطح حجن تعییي درصذ 1 5پیزعى در عطح
ا هحاعث ؽذذ. تایج ؾاى داد ک هذل تای غثت ت عایز هقایغ هذل هظر ت F RMSEضزیة تثییي، آهار
R عم هقذارای درج دم ای ا داؽت اعت. اگزچ راتط چذجول ای تزآرد هحی، تزاسػ تتزی تز داد هذل2
تز اس هقذار پاییي ا ىآ Fاذ یش آهار ای تزآردی هفی را تیج داد اذ لی حجن پاییی را ؾاى داد RMSEتاال
تعط آسهى هقایغ ؽذ هؾاذای تزآردی دعتیاتی ت تیج تتز، حجن هظر ت. تد اعتآى در هذل تای
پیزی ود، اختالف ؽذ هؾاذار گزفتذ. تایج ؾاى داد ک هقادیز حجن تخویی اس هقادیز سجی هرد هقایغ قز
sig ،801/0=R=633/0جد ذارد ) ا آىداری تیي آهاری هعیداری تا هعی طر تای تخویی (. اگزچ عوق2
هتز( شدیک عوق هیاگیي 5/5ؽذ ) يیتخولی عوق هیاگیي ذ در هطق دارای اختالف غتذ، ؽ ای هؾاذ عوق
تاؽذ. هتز( هی 53/5) ؽذ هؾاذ
هذل تای ،عوق، ضزیة وثغتگی پیزعىضزیة تثییي، کلمات کلیذی: