BEST FIT MODEL FOR YIELD CURVE ESTIMATION
13
Croatian Operational Research Review (CRORR), Vol. 3, 2012 28 BEST FIT MODEL FOR YIELD CURVE ESTIMATION Zdravka Aljinović University of Split/Faculty of Economics Cvite Fiskovića 5 E-mail: [email protected] Tea Poklepović University of Split/Faculty of Economics Cvite Fiskovića 5 E-mail: [email protected] Kristina Katalinić University of Split/Faculty of Economics Cvite Fiskovića 5 E-mail: [email protected] Abstract Yield curve represents a relationship between the rate of return and maturity of certain securities. A range of activities on the market is determined by the abovementioned relationship; therefore its significance is unquestionable. Besides that, its shape reflects the shape of the economy, i.e. it can predict recession. These are the reasons why it is very important to properly and accurately estimate the yield curve. There are various models evolved for its estimation; however the most used are parametric models: Nelson-Siegel model and Svensson model. In this paper the yield curves are estimated on Croatian financial market, based on weekly data in years 2011 and 2012 both with Nelson-Siegel and Svensson model, and the obtained results are compared. Key words: yield curve, Nelson-Siegel model, Svensson model, Croatian financial market 1. INTRODUCTION The yield curve, as a picture of relationships between the yields on bonds of different maturities, provides a way of understanding the common markets’ evaluation in the future, and whether the economy will be strong or weak (Cano, Correa and Ruiz, 2010).
Transcript of BEST FIT MODEL FOR YIELD CURVE ESTIMATION

Croatian Operational Research Review (CRORR), Vol. 3, 2012
28
BEST FIT MODEL FOR YIELD CURVE ESTIMATION
Zdravka Aljinović University of Split/Faculty of Economics
Cvite Fiskovića 5 E-mail: [email protected]
Tea Poklepović
University of Split/Faculty of Economics Cvite Fiskovića 5
E-mail: [email protected]
Kristina Katalinić University of Split/Faculty of Economics
Cvite Fiskovića 5 E-mail: [email protected]
Abstract
Yield curve represents a relationship between the rate of return and maturity of certain securities. A
range of activities on the market is determined by the abovementioned relationship; therefore its
significance is unquestionable. Besides that, its shape reflects the shape of the economy, i.e. it can
predict recession. These are the reasons why it is very important to properly and accurately estimate
the yield curve. There are various models evolved for its estimation; however the most used are
parametric models: Nelson-Siegel model and Svensson model.
In this paper the yield curves are estimated on Croatian financial market, based on weekly data in
years 2011 and 2012 both with Nelson-Siegel and Svensson model, and the obtained results are
compared. Key words: yield curve, Nelson-Siegel model, Svensson model, Croatian financial market
1. INTRODUCTION The yield curve, as a picture of relationships between the yields on bonds of different maturities,
provides a way of understanding the common markets’ evaluation in the future, and whether the
economy will be strong or weak (Cano, Correa and Ruiz, 2010).

Croatian Operational Research Review (CRORR), Vol. 3, 2012
29
Interest rates movements depend on the maturity period and the form of the yield curve has a great
effect on the financial markets and the behaviour of financial intermediaries. Intermediaries will, to
maximize their own profits, take into account the difference between short-term and long-term interest
rates. A full range of activities in the financial markets is actually determined by the relationship
between the interest rate and maturity. Yield curve can be observed from micro and macro aspects.
From micro aspect yield curve helps investors alerting them on the possible recession or the upturn of
the economy. The yield curve can be used as a benchmark for pricing other securities with fixed
interest rates. By predicting movements in the yield curve, managers of fixed interest rates may
attempt to earn above-average returns on their portfolios of bonds. Several strategies are developed to
get the above-average returns in different interest rate environments. Macro aspect of yield curve
highlights the importance of the term structure of interest rates for macroeconomic analysis because of
its effects on the consumer decisions and investment decisions of economic agents and thus aggregate
demand, which is one of the determinants of inflation in the economy. From a financial standpoint, the
existence of the yield curve favours the development of domestic capital markets, primary and
secondary, allowing the recovery of financial instruments (debt and derivatives) (Pereda, 2009).
Table 1: Central banks and yield curve models
CENTRAL BANK MODEL
Belgium Nelson-Siegel, Svensson
Canada Svensson
USA Fisher-Nychka-Zervos (Spline)
Finland Nelson-Siegel
France Nelson-Siegel, Svensson
Germany Svensson
Italy Nelson-Siegel
Japan Fisher-Nychka-Zervos (Spline)
Norway Svensson
Spain Svensson
UK Anderson and Sleath (Spline) (until 2001 Svensson)
Sweden Fisher-Nychka-Zervos (Spline), before Svensson
Switzerland Svensson
EU Svensson Source: Pereda, J. (2009) , “Estimación de la Curva de Rendimiento Cupón Cero para el Perú”, Banco Central de reserva del Perú, Revista Estudios Económicos N° 17

Croatian Operational Research Review (CRORR), Vol. 3, 2012
30
To estimate the yield curve central banks use different models. The table 1 provides a review of the
use of certain types of models in some countries
It can be seen that in the most foreign countries dominate Svensson and Nelson-Siegel models. Both
models have their advantages and disadvantages. Nelson Siegel model is extremely popular in the
practice; both individual investors and the central banks use this model. This model is simple and
stable for the evaluation, it is quite flexible and very well suited for assessing yields for more bonds or
one bond and for the time series of returns, for a large number of countries and time periods and for
different classes of bonds. It also has good prediction ability (Marciniak, 2006). Second quite used
model is Svensson model. Svensson model is an extension of the Nelson-Siegel model, which
provides sufficient precision adjustment and smooth curve shape of periodic rents. It has become very
popular in the mid 90's. Since then, it has been used by the substantial number of central banks
worldwide to assess the bond structure with a single coupon and future interest rates (forward rates).
However, the model has a number of weaknesses, such as limited ability to adapt irregular shapes of
the yield curve, the tendency of taking extreme values at the bottom of the curve and a relatively
strong dependence on the estimations in different or even nonadjacent segments of the yield curve
(Marciniak, 2006).
In this paper yield curves on Croatian financial market are calculated on weekly basis from 7th October
2011 to 24th August 2012 using both Nelson-Siegel and Svensson model. The results are compared in
order to find out the best fitting model on Croatian financial market for the yield curve evaluation.
In the first part of the paper theoretical overview of the yield curve is provided, followed by the
explanation of the two most commonly used models for yield curve evaluation. In the third part of the
paper current situation on the Croatian financial market is explained. Finally, yield curves are
calculated and empirically tested using both models on Croatian financial market.
2. NELSON-SIEGEL MODEL
Often used model for developing yield curve in the practice is the Nelson-Siegel model (Nelson and
Siegel, 1987). Nelson and Siegel introduced a simple, parsimonious model, which can adapt to the
range of shapes of yield curves: monotonic, humped and S shape.
A class of functions that readily generates the typical yield curve shapes is that associated with
solutions to differential or difference equations (Aljinović, Marasović and Škrabić, 2009). If the
instantaneous forward rate at maturity T, f(t,T), is given by the solution to a second-order differential
equation with real and unequal roots, it is of the form:

Croatian Operational Research Review (CRORR), Vol. 3, 2012
31
( ) 1 20 1 2,
T t T t
f t T e eτ τβ β β− −
− −
= + + (1)
where 1τ and 2τ are time constants associated with the equation, and 0β , 1β and 2β are determined
by initial conditions.
Now, zero-coupon rates ( )R t can be calculated by averaging the corresponding instantaneous
forward rates:
( ) ( )1, ,T
t
R t T f x T dxT t
=− ∫ (2)
A more parsimonious model that can generate the same range of shapes is given by the equation
solution for the case of equal roots:
( ) 0 1 2,T t T tT tf t T e eτ τβ β β
τ
− −− −−
= + + (3)
By substituting (3) into (2) and integrating, it is obtained:
( ) ( )
( )
0 1 2
0 1 1 2
1 1, ,
1 1
T T T t T t
t t
T t T t T t
T tR t T f x T dx e e dxT t T t
T tT t e e eT t
τ τ
τ τ τ
β β βτ
β β τ β τ β ττ
− −− −
− − −− − −
−= = + + = − − −
= − − + + − − + −
∫ ∫ (4)
After a simple rearrangement of this expression, the yield to maturity is given by:
( ) ( )0 1 2 21,
T tT teR t T eT t
ττβ β β β
τ
−− −
−−= + + −
− (5)
So, the forward and zero-coupon yield curves are functions of four parameters: 0β , 1β , 2β and τ . It can be seen that
( ) 0lim ,T
R t T β→∞
= (6)
and 0β corresponds to zero-coupon rates for very long maturities.
At the short end of the curve it is:
( ) 0 1lim ,T t
R t T β β→
= + (7)
which implies that the sum of parameter values 0β and 1β should be equal to the level of the shortest
interest rates.

Croatian Operational Research Review (CRORR), Vol. 3, 2012
32
It can be seen that if 1β is negative, the forward curve will have a positive slope and other way round.
The parameter 2β , indicates the magnitude and the direction of the hump and if it is positive, a hump
will occur at τ whereas,. In case it is negative, a U-shaped value will occur at τ . So it can be
concluded that parameter τ which is positive, specifies the position of the hump or U-shape on the
entire curve. Consequently, Nelson and Siegel propose that with appropriate choices of weights for
these three components, it is possible to generate a variety of yield curves based on forward rate
curves with monotonic and humped shapes (Aljinović, Marasović and Škrabić, 2009).
3. SVENSSON MODEL
Svensson (1994) extended Nelson-Siegel model by introducing additional parameters that allow yield
curve to have an additional hump. Thus this model is considered to be computably more demanding.
Svensson suggested forward curve to be estimated as (Andraž, 2006):
( ) 1 1 20 1 2 3
1 2
,T t T t T tT t T tf t T e e eτ τ τβ β β β
τ τ
− − −− − −− −
= + + + (8)
The corresponding yield to maturity is of the form:
( )1 1 2
1 2
1 1 2
0 1 2 31 1 1,
T t T t T tT t T t
T t T t T te e eR T t e e
τ τ ττ τ
τ τ τ
β β β β
− − −− − −− −
− −
− − −
− − − = + + − + −
(9)
From the relation (8) it can be noticed that the 2β is identical to the 2β term with 1τ replaced by 2τ .
The two additional parameters 3β and 2τ explain the extended flexibility of the Svensson approach.
The linear parameter 3β defines the form (convex or concave) of the second hump of the spot interest
rate curve, and the non-linear parameter 2τ , like 1τ in the Nelson-Siegel model, defines it position
(Ganchev, 2008).
4. MAIN CONCLUSIONS OF PREVIOUS RESEARCHES ON NELSON-SIEGEL
AND SVENSSON MODELS
The Nelson-Siegel model, which has only four parameters, enables us to estimate the yield curve,
without being over-parameterized, when the number of observed bond prices is limited (Kladivko,
2010). In the practice Nelson-Siegel model is preferred for the use especially where there are few
input data (Rohde, 2007). Nelson and Siegel (1987) demonstrated that their proposed model is capable

Croatian Operational Research Review (CRORR), Vol. 3, 2012
33
of capturing many of the typically observed shapes that the spot rate curve assumes over time (Berec,
2010). A significant weakness of the Nelson-Siegel model, resulting from its low elasticity, is
goodness of fit that is lower than in the case of polynomial models. When the curve is fitted to an
irregular set of data points this can result in relatively large deviations of model values from actually
observed rates (Marciniak, 2006).
The extended Nelson-Siegel model by Svensson offers a satisfactory precision of fit and a smooth
shape of implied forward curve. Svensson model has a number of weaknesses, e.g. a limited ability to
fit irregular yield curve shapes, a tendency to take extreme values at the short end, and a relatively
strong co-dependence of estimates in different – even non-neighbouring – segments of the yield curve
(Marciniak, 2006). Thus sometimes calculations using Nelson-Siegel model can be more correct.
5. CROATIAN FINANCIAL MARKET SITUATION
Worldwide financial crisis had its effects on the Croatian market. Complete inactivity on the
secondary market of the public debt still remains. There exists a marginal bond trade, treasury bills
trade is not transparent enough, and due to its low returns, they are not in the focus neither for pension
nor investment funds. Lately, there are some movements and asset growth under bond mutual funds.
However, these trends are not sufficient to lead to a considerable growth in activity on secondary
market. Under these conditions the primary market still functions, i.e. new issues of government bonds
are, without any bigger problems, sold out. However, total illiquidity on a secondary market most
certainly influences, and in future will influence even more, the price on which the government
indebts. Therefore, the return of the activity on a lethargic secondary market of public debt is most
definitely of great interest for the issuer, i.e. government, and after all the development and
improvement of the domestic securities is defined as one of the Government goals in February 2011
(Štimac, 2012). In the year 2012 the liquidity increases which increases optimism and gives hope for
the future developments (HNB, 2012).
6. YIELD CURVE ESTIMATION USING NELSON-SIEGEL AND SVENSSON
MODEL ON CROATIAN FINANCIAL MARKET
In Croatia still does not exist an official yield curve due to a scarce issue of Croatian bonds
denominated in Kuna and weak trade on a secondary market. In order to calculate yield curve on a
Croatian financial market data from Zagreb money market, where data for treasury bills can be found,
and Reuters data base, where data for government bonds can be found, is collected. Yield curves are
calculated on a weekly basis from 7th October 2011 to 24th August 2012 using both Nelson-Siegel and

Croatian Operational Research Review (CRORR), Vol. 3, 2012
34
Svensson model. Even though on these dates there was pour trade on treasury bills and bonds (on
observed dates the number of securities traded was mostly 10), yield curves are successfully estimated
using above mentioned formulas.
Parameters 0β , 1β , 2β and τ are estimated for Nelson-Siegel model, and 0β , 1β , 2β and 1τ and
2τ for Svensson model in MS Office Excel using least square method with quasi-Newton. In the case
where it was particularly difficult to estimate parameters, using Simplex method in Statistica starting
points for an estimation of parameters are generated. These appropriate start values are then used in
subsequent quasi-Newton iterations1
R2 gives information about the
.
goodness of fit of these models and provide an answer which model fits
better to the data, i.e. which model approximates better to the real data points. It indicates the percent
of total variation in interest rate which can be explained by the model.
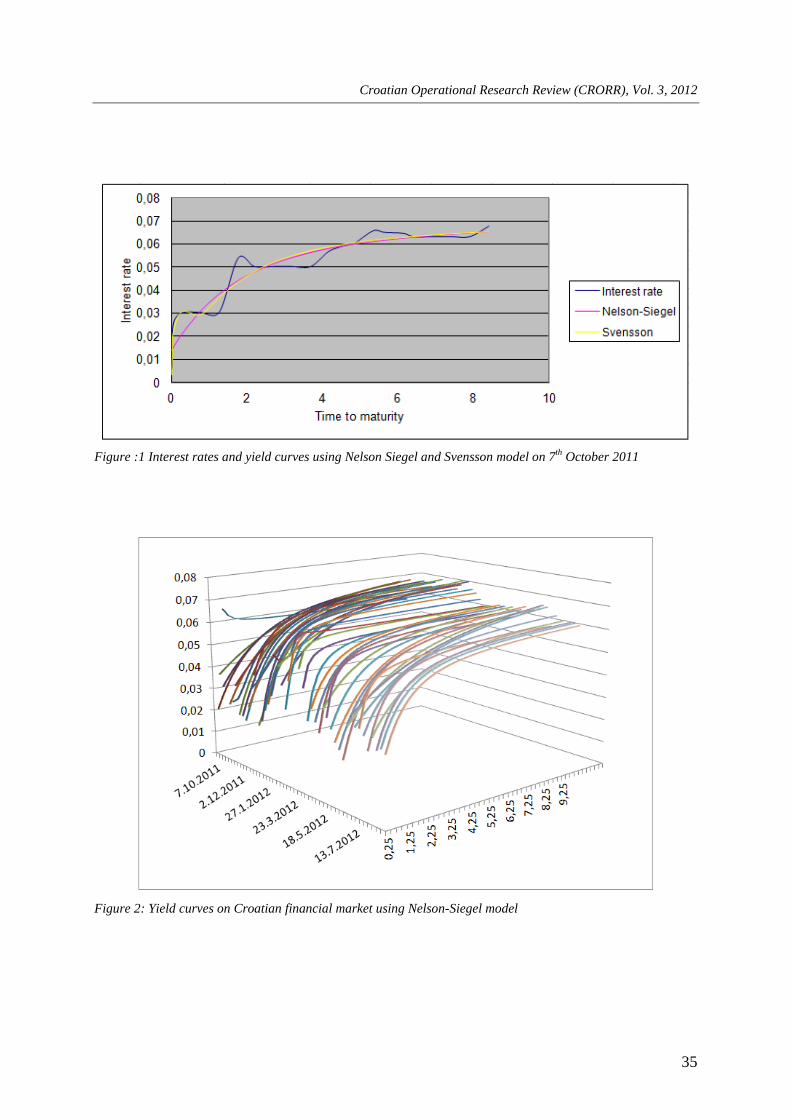
Figure 1 displays interest rates and yield curves on Croatian financial market on 7th October 2011 (the
parameters for both models and determination coefficient are presented in Table 2). Apart from the
figure that shows how Svensson model clearly fits to the data better than Nelson-Siegel model,
determination coefficients for Svensson model are in every case higher than for Nelson-Siegel model
which leads to the conclusion that Svensson model is the best fit model for yield curve estimation. For
Nelson-Siegel model parameter 0β corresponds to zero-coupon rates for very long maturities and
equals 7.29%. The sum of parameters 0β and 1β represents the level of the shortest interest rates and
equals 1.41%. Since 1β is negative, the curve has a positive slope. The parameter 2β , indicates the
magnitude and the direction of the hump at time τ and since it is nearly equal to zero the curve has a
monotonic shape. Based on R2 92.33% of total variation in interest rates can be explained by the
Nelson-Siegel model. In Svensson model the long term interest rate equals 7.16%, the short term
interest rate is 0.11%, the parameter 2β which is negative indicates that an U-shape occurs at time
1τ =0.5 and 3β which is positive indicates the position of a hump at time 2τ =0.06. 95.78% of total
variation in interest rates can be explained by the Svensson model.
1 Simplex method is generally less sensitive to local minima and is usually used in combination with the quasi-Newton method (StatSoft)
Croatian Operational Research Review (CRORR), Vol. 3, 2012
35
Figure :1 Interest rates and yield curves using Nelson Siegel and Svensson model on 7th October 2011
Figure 2: Yield curves on Croatian financial market using Nelson-Siegel model

Croatian Operational Research Review (CRORR), Vol. 3, 2012
36
Figure :3 Yield curves on Croatian financial market using Svensson model
Figures 2 and 3 show yield curves calculated and drawn, firstly with Nelson-Siegel and secondly with
Svensson model on weekly basis from 7th October 2011 to 24th August 2012 with associated interest
rates and quarterly time to maturity, based on parameters estimated and presented in Table 2. Using
Svensson model the yield curves show additional hump that occurs in data, as an opposite to Nelson-
Siegel model where in most cases the hump is not recorded.
Table 3 shows t-statistics for the difference between two determination coefficients. With the
significance of 1% it can be concluded that Svensson model fits better to the data than Nelson-Siegel
model. On average 88.94% of total variation in interest rates can be explained by the Nelson-Siegel
model and 93.36% of total variation in interest rates can be explained by the Svensson model.

Croatian Operational Research Review (CRORR), Vol. 3, 2012
37
Table 1: Nelson-Siegel and Svensson model parameters with R2 on Croatian financial market from 7th October 2011 to 24th August 2012

Croatian Operational Research Review (CRORR), Vol. 3, 2012
38
Table 2: t-statistics for difference between Nelson-Siegel and Svensson models’ determination coefficients

Croatian Operational Research Review (CRORR), Vol. 3, 2012
39
7. CONCLUSION
In this paper two most used parametric models for yield curve estimation: Nelson-Siegel and Svensson
model are theoretically reviewed and empirically tested on Croatian financial market. The aim was to
compare results and to carry out the best fitting model for yield curve estimation in the specific market
conditions with low volume, illiquidity and small number of traded securities. The yield curves are
estimated based on weekly data from 7th October 2011 to 24
th August 2012 using both Nelson-Siegel
and Svensson model. Based on empirical results on parameters, determination coefficients and t-
statistics it can be concluded that, unexpectedly, Svensson model fits better to the data and provides a
more accurate yield curve on Croatian financial market. The resulting yield curves are for both models
very similar, with gaps in the short term and an increase in the long time horizon.
REFERENCES
Aljinović, Z., Marasović, B. and Škrabić, B. (2009), “Comparative Analysis of the Stochastic and
Parsimonious Interest Rates Models on Croatian Government Market”, International Journal of
Human and Social Sciences, 4:13, pp. 924-928.
Aljinović, Z., Ercegovac, R. and Marasović, B.(2010), “Country risk premium – Case study Croatia”,
2010 International Conference on Education and Management Technology (ICEMT), pp. 142-147.
Andraž, G. (2006), “The effect of parallel OTC-DVP bond market introduction on yield curve
volatility”, Ekonomski fakultet Rijeka, vol. 24 sv. 1, pp. 123-140.
Berec R. (2010), “Extraction of Nelson-Siegel Factors from Bond Prices”, Comenius University in
Bratislava - Faculty of Mathematics, Physics and Informatics, Master thesis.
Cano, C., Correa, R. and Ruiz, L. (2010), “La curva de rendimientos y la toma de decisiones
financieras”, Revista Moneda, N° 145.
Ganchev A. (2009), “Modelling the Yield Curve of Spot Interest Rates under the conditions in
Bulgaria”, “Dimitar A. Tsenov” Academy of Economics, Department of Finance and Credit,
Narodnostopanski Arhiv, International edition, pp. 119-137.
Hrvatska Narodna Banka (2012), Bilten 184, XVIII, rujan 2012,
http://www.hnb.hr/publikac/bilten/informacija/hinformacija.pdf [Accessed 23.9.2012.]
Kladivko K. (2010), “The Czech Treasury Yield Curve from 1999 to the Present”, The Czech Journal
of Economics and Finance (Finance a úver), 60(4), pp. 307-335.
Marciniak M. (2006), “Yield Curve Estimation at the National Bank of Poland”, National Bank of
Poland, Working paper N° 47.
Nelson, C. R. and Siegel, A. F. (1987), “Parsimonious modelling of yield curves”, Journal of
Business, 60, pp. 474-489.
Pereda J. (2009), “Estimación de la Curva de Rendimiento Cupón Cero para el Perú”, Banco Central
de reserva del Perú, Revista Estudios Económicos N° 17.
Rohde N. (2007), “Qualitätsvalidierung von Zinsstrukturkurven mit statistischen Modellen”,
Humboldt - Universität zu Berlin, Institut für Informatik, Diplomarbeit.

Croatian Operational Research Review (CRORR), Vol. 3, 2012
40
Štimac, D. (2012), “Tržište javnog duga u Hrvatskoj – pogled institucionalnih investitora”,
http://www.ijf.hr/javni_dug/full/stimac.pdf [Accessed 23.9.2012.]
Svensson, L.E.O. (1994), “Estimating and interpreting forward interest rates: Sweden 1992-1994”,
Cambridge: National Bureau of Economic Research, Working paper 4871.
StatSoft,http://documentation.statsoft.com/STATISTICAHelp.aspx?path=NonlinearEstimation/Nonlin
earEstimation/Dialogs/ModelEstimation/ModelEstimationQuickTab [Accessed 23.9.2012.]


![[Salomon Brothers] Understanding the Yield Curve, Part 5 - Convexity Bias and the Yield Curve](https://static.fdocuments.in/doc/165x107/577d26641a28ab4e1ea111d0/salomon-brothers-understanding-the-yield-curve-part-5-convexity-bias-and.jpg)