CURRENT WOOD RESOURCES AVAILABILITY AND … · ece/tim/dp/49 timber section, geneva, switzerland...
74
United Nations Food and Agriculture Organization Economic Commission for Europe of the United Nations GENEVA TIMBER AND FOREST STUDY PAPER 51 CURRENT WOOD RESOURCES AVAILABILITY AND DEMANDS NATIONAL AND REGIONAL WOOD RESOURCE BALANCES EU/EFTA COUNTRIES By Florian Steierer UNITED NATIONS UNECE
-
Upload
truongcong -
Category
Documents
-
view
216 -
download
1
Transcript of CURRENT WOOD RESOURCES AVAILABILITY AND … · ece/tim/dp/49 timber section, geneva, switzerland...

United Nations Food and Agriculture Organization Economic Commission for Europe of the United Nations
GENEVA TIMBER AND FOREST STUDY PAPER 51
CURRENT WOOD RESOURCES AVAILABILITY AND DEMANDS
NATIONAL AND REGIONAL WOOD RESOURCE BALANCES
EU/EFTA COUNTRIES
By Florian Steierer
UNITED NATIONS
UNECE


ECE/TIM/DP/49
Timber Section, Geneva, Switzerland
GENEVA TIMBER AND FOREST STUDY PAPER 51
CURRENT WOOD RESOURCES AVAILABILITY AND DEMANDS
NATIONAL AND REGIONAL WOOD RESOURCE BALANCES
EU/EFTA COUNTRIES
By Florian Steierer
UNITED NATIONS Geneva 2010
United Nations Economic Commission for Europe/ Food and Agriculture Organization of the United Nations
UNECE

Note
The designations employed and the presentation of material in this publication do not imply the expression of any opinion whatsoever on the part of the secretariat of the United Nations concerning the legal status of any country, territory, city or area, or of its authorities, or concerning the delimitation of its frontiers or boundaries.
Abstract
The UNECE/FAO Study Paper on Current wood resources availability and demands National and regional wood resource balances 2005 EU/EFTA countries provides a detailed and balanced overview about the use, re-use and recycling of wood fibres in the forest based sector. Using UNECE and FAO databases as starting point, the approach of the wood resource balance cross-checks official production and trade data of the main forest sector products with the reported co-products, such as chips, particles and residues. It uses further some external data sources such as European waste statistics as well as conversion factors (ECE/TIM/DP/49). The study calculates and presents individual wood resource balances separately for each single member state in the target region. The draft version of this study paper served as the background paper Wood resources availability and demands – Part I for the UNECE/FAO workshop on national wood resource balances (http://www.unece.org/timber/workshops/2008/wood-balance/docs/wood%20availability_part1_final.pdf). Country correspondents participated in a data review process and actively confirmed, completed and revised the data presented in this study. The experience from this comprehensive and balanced data presentation will be used in further work of the UNECE/FAO Timber Section and is planned to be one of the core tools for the upcoming revision of the European Forest Sector Outlook Study.
Keywords
Wood resource balance, Europe, EFTA, production, imports, exports, informal trade, unrecorded trade, unrecorded removals, removals, forestry industry, forestry trade, forestry statistics, black liquor, production, pulp production, roundwood equivalent, sawnwood, supply gap, wood based panels, wood chips, wood energy, wood fuel, wood particles, wood pellets, wood processing co-products, wood residues, wood waste, post consumer recovered wood.
UNITED NATIONS PUBLICATIONS
ISSN 1020 7228
ECE/TIM/DP/51

EU/EFTA sub-regional and national wood resource balances 2005 __________________________________________________ iii
PREFACE
Needs to be written …

-iv-________________________________________EU/EFTA sub-regional and national wood resource balances 2005
ACKNOWLEDGEMENTS
First of all I whish to express my sincere gratitude to Professor Dr. Udo Mantau from Hamburg University for his support, advise and review. This study has only been made possible by his groundbreaking empirical work and experience in Germany. The first draft of this study was written at Hamburg University where I was offered to work for one year.
Special thanks also to Sebastian Hetsch, co-author of the previous draft versions of this study and organizer of the workshop on national wood resource balances for which he also published the proceedings (ECE/TIM/DP/DP 53). He used the outcome of this wood resource balances 2005 for projecting “potential sustainable wood supply ” (ECE/TIM/DP/52) to satisfy the needs of the forest based sector as well as the strongly growing wood energy sector in response to the renewable energy targets by 2020 set by the European Council. The development of the hereafter presented first wood resource balances for the reference year 2005 rely strongly on national data as well as conversion factors. Therefore I whish to thank sincerely the national correspondents of the Joint Forest Sector Questionnaire and delegates to the Joint Working Party of Forest Economics and Statistics for their comments, support and feed back during the data review process. Their overwhelming response rate and comments were a tremendous support to review the national data of the draft version. Special thanks the member of the UNECE Task Force on wood availability, Jeremy Wall (EC DG ENTR), Bénédicte Hendrickx (EPF), Bernard de Galembert (CEPI), Jan-Olof Loman (Swedish Forest Agency), Jarmo Hämäläinen (Metsäteho Oy) and for their discussions and their valuable inputs and revision of the paper. Adrian Whiteman (FAO) gave important input to the study, especially through his knowledge on forest sector outlook studies.
Several staff from the UNECE/FAO Timber Section were a big support for collecting of necessary background information. In particular Alex McCusker (UNECE) as a key persons for data for the Timber Sector and Matt Fonseca as the key person for conversion factors facilitated the development of the balances in this study.
Initial technical reviews in the UNECE/FAO Timber Section were done in chronological order by Mr. Kit Prins, Mr. Douglas Clark, Dr. Ed Pepke as well as Mr. Adrian Whiteman from the Forest Products and Industry Division, FAO Forestry Department.
This manuscript was completed on 23 December 2009. It is my pleasure to thank all members of the Team, the many other contributors, for their dedicated work in producing this study on Wood Resource Balances.
Florian Steierer Wood Energy Data Specialist UNECE/FAO Timber Section
Trade and Timber Division United Nations Economic Commission for Europe
Palais des Nations CH - 1211 Geneva 10, Switzerland
E-mail: [email protected]

EU/EFTA sub-regional and national wood resource balances 2005 ___________________________________________________ v
C O N T E N T S
Acknowledgements ............................................................................................................................. ix
Preface..................................................................................................................................................x
Executive Summary ............................................................................................................................ xi
1. Introduction: .............................................................................................................................. 1 1.1 Forest and energy – the revival of an old story ........................................................................... 1 1.2 Objectives of the wood resource balance for Europe ................................................................. 2 1.3 Framework of the study ................................................................................................................. 4
2. Methodology............................................................................................................................... 4 2.1 Why a wood resources balance? ................................................................................................... 4 2.2 Structure of a Wood Resource Balance ....................................................................................... 4 2.3 Data sources and availability......................................................................................................... 6 2.4 Units and conversion factors.......................................................................................................... 7 2.5 Measuring wood fibres’ cascaded use .......................................................................................... 7 2.6 Processed wood fuels....................................................................................................................... 8
3. Data update ................................................................................................................................ 9 3.1 Data review process ........................................................................................................................ 9 3.2 Updated JFSQ dataset.................................................................................................................. 10
4. Results....................................................................................................................................... 11 4.1 Wood supply .................................................................................................................................. 11
4.1.1 Direct wood supply form the forest ....................................................................................... 11 4.1.2 Total wood supply .................................................................................................................. 12
4.2 Wood use ........................................................................................................................................ 13 4.2.1 Material use........................................................................................................................... 13 4.2.2 Energy use............................................................................................................................... 13
4.3 Balancing the balance - A question of data! .............................................................................. 14 4.3.1 Supply and use at national and regional level........................................................................ 14 4.3.2 Particularly weak data ............................................................................................................ 15
5. Conclusions............................................................................................................................... 17
6. Recommendations ................................................................................................................... 17
7. Glossary .................................................................................................................................... 18
8. References................................................................................................................................. 20
9. Annex ........................................................................................................................................ 21 ANNEX I: European wood resource balance - detailed overview.................................................... 22 ANNEX II : Regional wood resource balances EU/EFTA ............................................................... 24 ANNEX III : National wood resource balances EU/EFTA countries................................................ 26 ANNEX IV : National wood resource balances Serbia and Turkey .................................................. 55

-vi-________________________________________EU/EFTA sub-regional and national wood resource balances 2005
L I S T O F T A B L E S
Table 1 : Result of the data revision process (EU/EFTA only) .............................................................. 9
Table 2 : Direct and indirect sources (EU/EFTA) ................................................................................. 11
Table 3 : Wood use 2005 (EU/EFTA) ...................................................................................................... 13
Table 4 : Major wood energy consuming countries............................................................................... 13
Table 5: Total wood supply and use (EU/EFTA)................................................................................... 15
L I S T O F F I G U R E S
Figure 1 : Flow chart of post consumer wood sector in Germany in Mt (air dry) (2004) ........................... 5
Figure 3 : Wood fibre streams for supply and consumption.................................................................. 6
Figure 4 : Components of wood supply and consumption in the wood resource balance ................ 10
Figure 5 : Wood supply EU/EFTA .......................................................................................................... 11
Figure 6 : Material versus energy use by fibre provenance (EU/EFTA) ............................................ 14

EU/EFTA sub-regional and national wood resource balances 2005 __________________________________________________vii
L I S T O F A B B R E V I A T I O N S
cm centimetre CHP Combined heat and power generation m3 cubic metre m3sw cubic metre of solid wood M3rw cubic metre roundwood EU/EFTA EU-27 plus Norway and Switzerland DG TREN European Commission Directorate General for Energy and Transport EFSOS European Forest Sector Outlook Study EFTA European Free Trade Area X Exports FAO Food and Agriculture Organization of the United Nations GJ Gigajoule HS Harmonized Commodity Description and Coding System I Imports IEA International Energy Agency ITTO International Tropical Timber Organization JFSQ Joint Forest Sector Questionnaire JWEE Joint Wood Energy Enquiry MDF medium density fiberboard M metre mt metric ton mm millimetre Mtoe million tonnes oil equivalent MCPFE Ministerial Conference on the Protection of Forests in Europe mcd moisture content dry basis mcw moisture content wet basis NAI net annual increment UNECE region North America, pan-Europe, Russia, Central Asia OSB oriented strand-board odmt oven dry metric ton ob over bark PJ Peta Joule P Production RES Renewable Energy Sources swe solid wood equivalent M2 square metre SITC Standard International Trade Classification SFM Sustainable Forest Management Toes Tonnes of oil equivalent TPES Total Primary Energy Supply ub under bark UN SD United National Statistical Division UNECE United Nations Economic Commission for Europe WCO World Customs Organization COST European Cooperation in Science and Technology Programme

-viii-________________________________________EU/EFTA sub-regional and national wood resource balances 2005

EU/EFTA sub-regional and national wood resource balances 2005 __________________________________________________ ix

-x-________________________________________EU/EFTA sub-regional and national wood resource balances 2005

EU/EFTA sub-regional and national wood resource balances 2005 __________________________________________________ xi
EXECUTIVE SUMMARY
The study assesses in depth. wood supply and consumption in 29 EU/EFTA countries,based on the most recently available data from 2005 (and Serbia and Turkey), using the structure of the "wood resource balance" developed by Mantau (2004, 2005, 2006). It differs significantly from earlier simpler attempts to draw up ‘wood balances’, which focused only on production, imports and exports to arrive at an implied level of consumption. Furthermore, these earlier wood balances did not take account of wood fibre used for energy purposes nor the re-use of fibre. This current methodology calculates independently the wood supply and use of wood fibres. It considers national import and export patterns as well as use and re-use of wood fibres for both industrial and energy purposes.
At the EU/EFTA level, the results of the study show wood supply, at 780 million m3, to be lower than wood consumption (807 million m3). At the country level, the differences between supply and consumption vary: in some cases, calculated wood supply is higher than the figure for wood use. The overall imbalance of 27 million m3 is probably due to weak and missing data on both sides of the balance (e.g. data on woody biomass supply from outside the forest, supply of post consumer recovered wood, use of logging residues). The study acknowledges that data on wood use for energy in private households are particularly weak in many countries. Hence the study cannot draw reliable conclusions about the quality (supply deficit vs unknown use), or the size of differences in the balance sheets totals - this could only be done by detailed empiric research at country level.
Experience at the international (Joint Wood Energy Enquiry) and national levels (e.g. household surveys in Germany, France, Norway) has shown that volumes of wood used by the forest industries and, in particular for energy generation, are sometimes much higher than national and international statistics record. Empirical research would be needed to gain a better picture of actual wood supply and demand, as well as how much wood contributes to energy supply.
Despite some weaknesses in the data, the results presented are the best information presently available. They provide a solid basis for a complementary assessment of future wood demand for both energy and industrial use in the light of the European Renewable Energy Directive, with its goal for renewable energy to achieve a 20% share of total energy demand by 2020.
National correspondents confirmed during a vital review process (response rate: 60%) that data were of the right order of magnitude. Of the 21 responses, only six proposed changes, resulting in wood supply increasing by 17.6 million m³ (+2%) and wood use by 10 million m³ (+1%).
Results of this wood resource balance indicate that just over two-thirds (68%) of the EU/EFTA wood fibre supply comes directly from forests, just under a quarter (24%) from co-products of the forest industries (including chips, particles and black liquor), 5% from post-consumer recovered wood; 2% is derived from outside the forest and 1% from processed wood fuels (such as pellets and briquetts). With 58% material use dominates the energy use of wood fibres (42%) on the wood use.
The study concludes that better data and discussion are needed for the various elements of wood supply and wood use. This knowledge is vital to allow policy makers to make judgements about the future role of wood as raw material for the wood-processing industry and for energy generation.
In any case, overall energy efficiency and efficient use of wood is fundamental for a sustainable future energy and wood resource supply.
Based on the results of this study, the UNECE/FAO Timber Section conducted a second study on future wood demand for energy. In this subsequent study, national and EU policy targets for renewable energy (and if available for bioenergy and wood energy) were gathered and simple, transparent scenarios constructed that allowed the calculation of the volumes of roundwood that might be needed to a range of possible policy targets. Furthermore, the study calculates wood consumption from the wood-based industries1 for 2010 and 2020, based on the European Forest Sector Outlook Study (UNECE 2005)2.
1 Wood-based panels, sawmilling and pulp & paper industries

-xii-________________________________________EU/EFTA sub-regional and national wood resource balances 2005
2 See: www.unece.org/timber

EU/EFTA sub-regional and national wood resource balances 2005____________________________________________________1
1. INTRODUCTION:
1.1 Forest and energy – the revival of an old story
Currently, more than half of the wood harvested and removed from European forests is used for industrial processing purposes, where, on top of the carbon storage effect, it generates substantial added value as construction elements, interior finishing applications, furniture, packaging products, etc.
On the other hand, the use of wood for energy has become increasingly important. Although wood is the oldest form of energy, used for thousands of years, it has recently gained new attention. Sharply rising prices for fossil fuels between 2004 and 2008 (400%), the increasing dependency on energy imports from insecure regions, and the effects of climate change are challenges that society and policy makers are tackling by various measures:
In the Kyoto Protocol many developed countries committed themselves to reduce greenhouse gas emissions to mitigate climate change. Another important policy component is renewable energies. Already in 2001 the EU3 set a target for 2010 of having 12% of its electricity production derived from renewable energy sources, such as wood. In January 2007 the EU disclosed new climate and energy targets for 2020. Two years later, 2009, the European Parliament and the European Council approved the European Directive on the “promotion of the use of energy from renewable sources”4. Member states commit to 20% of the energy consumed should come from renewable sources. Important for reaching these targets are besides energy generation from renewable sources an increase in energy efficiency by 20% and energy savings on EU and national levels.
These targets have to be seen in the context of the current state of renewable energies. In 2007, renewable energies accounted for only 8.5 % of energy consumption in the European Union. Biomass constitutes the largest source of renewable energies (hydro, wind, photovoltaic, geothermal and biofuels) in the EU (66%)5, and wood is the major source for biomass (wood and wood waste: 89%)6. Thus, wood is currently the major source (50%) for all renewable energy generation in the EU. Similar patterns are found in most other European countries. To close the gap between the current share of renewable energies and the targets, countries are elaborating diverse strategies. The EU has developed a Biomass Action Plan (EC 20057 a), looking at all kinds of biomass (forest-based, agricultural and municipal) and many other countries are designing similar plans or strategies. The EU Biomass Action Plan suggests doubling the production of bioenergy by 2010. This raises the question: where are these resources supposed to come from?
According to the EU Biomass Action Plan:
• The use of wood from the forest for bioenergy can be expected to more than double. • Bioenergy from (organic) waste is foreseen to increase more than twofold.
However, looking more closely at this number, most of this category is co-products and waste from the wood-processing industry, so actually this is wood as well.
• Finally, energy crops from agriculture are expected to increase dramatically from 2 to 44 Mtoe (million tonnes of oil equivalent).
The above mentioned 2009 Directive on promotion of the use of energy from renewable sources b 2020 ended the process of the national Biomass Action Plans. These very various action plans are now being replaced by “National Renewable Energy Action Plans”. The European Commission decided to
3 2001/77/EC http://eur-lex.europa.eu/LexUriServ/LexUriServ.do?uri=OJ:L:2001:283:0033:0040:EN:PDF
4 2009/28/EC http://eur-lex.europa.eu/LexUriServ/LexUriServ.do?uri=OJ:L:2009:140:0016:0062:EN:PDF
5 http://nui.epp.eurostat.ec.europa.eu/nui/show.do?dataset=nrg_1071a&lang=en
6 http://nui.epp.eurostat.ec.europa.eu/nui/show.do?dataset=nrg_1072a&lang=en
7 COM 628 (2005): http://eur-lex.europa.eu/LexUriServ/LexUriServ.do?uri=COM:2005:0628:FIN:EN:PDF

-2-________________________________________EU/EFTA sub-regional and national wood resource balances 2005
establish a template for National Renewable Energy Action Plans under Directive 2009/28/EC8. Any member state is now requested to use the harmonized template to report on how they aim to achieve the RES targets by 2020. This process is ongoing.
With the strong political support for renewable energy research and technology, new fuels are very likely to develop in the near future. New players might get interested in wood, once second-generation biofuels - producing ethanol and biodiesel from ligno-cellulosic material - are developed and are economically viable. These players are new to the forest sector and might change behaviour in the forest sector as well, since the energy sector is a fast moving, rapidly evolving sector with huge financial capital and potential.
Energy policies are of highest priority for all countries' and regions' economies and society, while forest policies often play a minor role in the overall policymaking. However, given the circumstances, energy policies will have a strong influence on the forest-based sector and wood-based industries. Therefore, it is important to develop outlooks for the forest-based sector in the light of this rapidly changing picture and to analyse the impacts and opportunities. However, this must not be done just in the forest-based sector, but a cross-sectoral approach is essential. The forest-based sector has to understand the developments in the energy sector, driven by society and economical demands, but also the energy sector and policy makers should understand the forest-based sector, its opportunities and limits. Linking at least these two sectors and ensuring a good mutual understanding, will help ensure a successful, sustainable development of both sectors and achieving society's demand for green and clean energy.
1.2 Why a wood resources balance?
International timber production and trade statistics (e.g. Joint Forest Sector Questionnaire of the UNECE/FAO/Eurostat/ITTO) provide best internationally available data on wood removals, trade and production. Inherent to their structure, these statistics are consistent within themselves and subtitles always sum up to the main heading. Definitions and classifications of the commodities are bound to international production and trade (SITC9 and HS10) definitions and classifications.
Hence they cover economically important activities of the wood and timber markets to a great extent. Nevertheless, trade statistics are not able to cover informal trade (e.g. wood use by private households) wood residues and waste recovery streams (e.g. black liquor, post consumer recovered wood). For a long time this information deficiency on minor wood fibre sources did not matter, as overall sufficient wood resources were readily available and sustainable forest management was a matter of course.
High market prices for fossil fuels and important decisions in energy and climate policies gave strong stimulus to renewable energy sources in general and wood energy in particular. Thus, the fast evolving energy sector links up with the forest and timber sector and boosts demand and competition for wood as raw material. Consequently, two unequal sectors start competing for woody biomass – even though each with a slightly different criterion. Energy producer interests are energy-content driven whereas most of the raw material needs of the forest based industries are quality driven.
Commodities with formerly little economic value experience raising demand (e.g. bark, logging residues, woody biomass outside the forest, post consumer recovered wood) and their mobilized and traded volumes increase rapidly. In addition, high value wood fuel commodities emerge on the market. Wood pellets have become a star by traded volume as well as by its estimated economical value. Their high energy content per volume and homogenous, often standardized quality, make them perfectly suitable for enhanced trade over longer distances.
Wood pellets are an easily accessible substitute for light fuel oil heating systems in single and multiple dwellings due to their characteristics. Despite the economic value of the wood pellets’ market, no
8 C(2009) 5174-1 http://ec.europa.eu/energy/renewables/doc/nreap__adoptedversion__30_june_en.pdf
9 SITC – Standard International Trade Classification (United National Statistical Commission)
10 HS – Harmonized Commodity Description and Coding System (World Customs Organization)

EU/EFTA sub-regional and national wood resource balances 2005____________________________________________________3
separate production or trade classification is available, yet. Since the January 2009, the European Community included a separate classification for wood pellets in the Combined Nomenclature under 4401 30 1011. Hence, international wood and timber statistics fail to keep track of trade and production of this commodity, too.
Pace keeping with fast changing markets requires a more holistic assessment method for wood volumes and flows. The wood resource balance easily integrates cross-sectoral information, going far beyond existing trade and production classifications of the forest based sector.
11 http://eur-lex.europa.eu/LexUriServ/LexUriServ.do?uri=OJ:C:2008:133:0001:0402:EN:PDF
Wood balance vs. wood resource balance
Wood balances are based on production and trade statistics. Based on product related conversion factors they calculate roundwood equivalents over one or several production steps which would theoretically be required to produce a wooden product having a measurable final volume. Consumption is calculated as the balance sheet total. They are weak in detecting unrecorded flows (e.g. fuelwood removals from forests and outside forests) or accounting for re-entering/regained volumes (e.g. post consumer recovered wood).
Wood resource balances are also based on available production and trade statistics which are in addition supplemented by a sector specific consumption analysis. Hence the available statistics is strongly supplemented with empiric field research (e.g. enterprise survey). Specific conversion factors considering e.g. average plant sizes, production technologies in the specific sector, tree species are used to measure the transferred amount of wood from one sector to another. Empiric surveys not only ask for the amount of co-products, but also the trade partner for each commodity (e.g. chips to pulp plant). This more consistent and complex approach of wood resource balances facilitates assessing inter-sectoral trade flows and cascaded uses. Data gaps are filled with empiric (field) research or by gap calculation in all flows. Thus, the method permits to detect unrecorded wood flows.
Figure 1 :: Difference between wood balance and wood resource balance Mantau U. 2005

-4-________________________________________EU/EFTA sub-regional and national wood resource balances 2005
1.3 Objectives of the wood resource balance for Europe
The underlying reason for this study was to gain a better picture of the supply and use of wood from all sources and for all end uses, both energy and industrial. The best available data (from 2005) were used to feed into the structure and method of a "wood resource balance".
This basic research-related study is explorative in character, examining wood flows for industrial production and energy generation. It does not look at policy impacts directly but it does contribute to an improved understanding between the forest and energy sectors and how their policies might interact. While some individual countries have begun to conduct national studies on the interactions between forest sector and renewable energy polices, and different stakeholders made analysis on the impacts of these polices on their sector. there has not been, until now, any comprehensive study at a pan-European level.
The study should encourage stakeholders on national and international level to continue collecting better (empirically) information as a basis and input for policies and policy targets for bioenergy and wood energy. Future wood demand and potential supply are crucial information to determine the impacts and opportunities when designing these policies.
1.4 Framework of the study
This study has to be seen in a larger context of activities on "Monitoring and forecasting European wood resources and demands" by the UNECE/FAO Timber Section and partners. It builds in particular on information gathered on wood energy (mainly through the Joint Wood Energy Enquiry, Steierer et al 2007)12. The University of Hamburg contributed in particular through its methodological work on wood resource balances and monitoring wood flows.
This study was used as an input to the on-going discussion on bioenergy policies and their interactions with the forest sector. Following its presentation as a draft at the UNECE/FAO Forest Policy Forum (10th October 2007), national correspondents, specialists and stakeholders were invited to review and to help refine the results.
2. METHODOLOGY
2.1 Structure of a Wood Resource Balance
The structure of the wood resource balance is based on the German wood resource balance scheme developed, applied and refined by MANTAU (2005). The main advantage is its possibility to detect and roughly estimate missing or weak information by comparing the two sides. Results of the German wood resource balance indicate that unregistered (legal) cuttings occur and may be of significant proportion of the supply. The key solution for improved information in Germany was a comprehensive empiric assessment of the forest based sector, including marginal commodities such as fuel wood use in private households and post consumer recovered wood.
The structure of the wood resource biomass is not fixed. If new sources or users occur that are not included in the HS yet, they can be added. STEIERER (in MANTAU et al. 2007) included processed based fuel production and use while calculating the European wood resource balance 2005. Thus the balance approach is very flexible and sectors can be added or differentiated, depending on the focus, as long as any action is counterbalanced on each side. Depending on the level of details in resource statistics partial wood resource balances can be derived, like e.g. shown in figure 1-1 post-consumer recovered wood.
12 http://www.unece.org/timber/docs/stats-sessions/stats-29/english/report-conclusions-2007-03.pdf and http://timber.unece.org/fileadmin/DAM/meetings/jwee2-data-report-24march.pdf
16 Difficulties to keep track of Intra-European trade / threshold – transport pattern

EU/EFTA sub-regional and national wood resource balances 2005____________________________________________________5
Figure 2 : Flow chart of post consumer wood sector in Germany in Mt (air dry) (2004)
5,963 89,8% 6,638 100,0% 0,674 10,2%
0,568 8,6% 0,017 0,3% 0,849 11,3%
0,000 0,0% 6,339 100,0% 3,323 52,4%
1,475 23,3% 0,681 10,7%
0,000 0,0% 0,674 10,6%
0,186 2,9% 0,000 0,0%
domestic availability
stock changes
saw mill industry housholds
other material uses other energy user
panel industry
import export
domestoc supply
energy plants < 1 MW
pulp industry energy plants > 1 MW
disposal plants unrecorded uses
Source: MANTAU, U.: Wood resource balance methodology (June 2010)
A wood resource balance compares the entire supply of wood fibres with its use for material and energy purposes in a national economy. It is a consistency check of national wood flows that counter-checks the balance sheet total of all sources of wood material against the independently derived balance sheet total of the consumption side. It includes wood fibres import and export at national level. Generally it is possible to take stock changes into account as well, but by practical reasons (lack of data) it is not included.
The wood resource balance of this study is based on harmonised calculations and assumptions, national wood resource balances for each country. In a second step, the regional wood resource balance for the EU 27/EFTA region is calculated as the sum of different national wood resource balances.
Every resource sector is composed of different segments. After determining the domestic availability based on official statistics. The domestic supply is extended by imports and reduced by exports. Unfortunately, few data are available only about stock levels. Inventory modifications also affect the domestic availability. The amount of the domestically available wood raw materials is finally assigned to the different demand sectors.
The information from official databases is completed by inquiries in sectors not documented in official statistics (e.g. black liquor, pellets, etc.). If neither statistics nor inquiries are available model calculation by conversion factors and other information are undertaken.
For commodity flow analysis further information the distribution structure and/or the procurement structure is needed. The following figure is a rough documentation of the results for the post consumer wood sector in Germany.
Similarly, all other sectors are analyzed and quantified. Finally all sectors can be summarized in a matrix of resource flows. In contrast to the methodology applied in Germany, the actual study does not rely on empirically collected data, although it is hoped to at least partially remedy this in the follow up to the study. It considers only publicly available information and data from international databases and enquiries from different sectors such as waste, energy, etc. and hence could be effectively considered as a survey of surveys.
Despite the comprehensive approach, regional (EU/EFTA) and national wood resource balances cover intra-European trade only as far as international timber trade statistics do. A lower wood fibre consumption than wood fibre supply in a national wood resource balance might indicate an “undifferentiated use” (e.g. energy generation in private households) or could otherwise also be a hint on unrecorded intra-regional trade (e.g. between the Netherlands and Belgium). Fibres from recovered

-6-________________________________________EU/EFTA sub-regional and national wood resource balances 2005
paper and cardboard are not included in the balance (for both the supply and use) so far as the wood resource balance was limited to wood raw material and products flows to and within the forest based industries. However, these details could be easily included as well.
2.2 Data sources and availability
In contrast to the methodology applied in Germany, the actual study does not rely on empirically collected data, although it is hoped to at least partially remedy this in the follow up to the study16. It considers only publicly available information and data from international databases and hence could be effectively considered as a survey of surveys. Important sources of information on the wood sector are the above mentioned Joint FAO/ UNECE/ ITTO/ Eurostat Forest Sector Questionnaire17 (JFSQ), Joint FAO/ UNECE/ IEA/ Eurostat Wood Energy Enquiry18 (JWEE), MCPFE/ UNECE/ FAO enquiry on quantitative indicators of sustainable forest management19. Energy information comes from European Commission (Eurostat, DG TREN), World Energy Outlook 2006 (IEA 2007) and the EurObserv’ER. Information on post consumer recovered wood derives from the results of the COST E31 on recovered wood.
The wood resource balance of this study presents a comprehensive picture of wood supply and use at regional (EU/EFTA) and national level. It does not present or discuss wood flows and wood procurement pattern for single wood processing sectors. Information on roundwood, co-products, residues or post consumer recovered wood use by each sector is contained in the underlying database (see figure 1). Nevertheless, these details are not presented to keep the report and information comprehensible to facilitate a focussed discussion.
Despite the comprehensive approach, regional (EU/EFTA) and national wood resource balances cover intra-European trade only as far as international timber trade statistics does. Fibres from recovered paper and cardboard are not included in the balance (for both the supply and use) so far as the wood resource balance was limited to primary wood raw material and products flows to and within the forest based industries. However, these details could be easily included as well.
Figure 4 : Wood fibre streams for supply and consumption
17 UNECE, FAO, Eurostat and ITTO
18 UNECE, FAO, EC and IEA (Steierer et al 2006)
19 MCPFE/UNECE/FAO

EU/EFTA sub-regional and national wood resource balances 2005____________________________________________________7
2.3 Units and conversion factors
In order to compare all different commodities, a common unit is needed. Therefore, all figures in the balance are converted into roundwood equivalent (cubic metre of solid volume under bark). This is the usual unit for wood removals, production and trade data, and therefore conversions are needed in fewer cases on the supply side of the balance.
On the use side each wood processing technique of the different forest based sector industries requires individual conversion factors to calculate the sector specific roundwood equivalent of the recorded production.
Therefore, conversion factors are needed to convert from cubic metre sawnwood or panel, tonne pulp or energy units into cubic metre roundwood. As one can easily imagine many different factors influence these conversion factor: wood properties (specific weight), moisture content of the wood, material and energy efficiency of the processing, etc. The study used general conversion factors for each commodity. Even though most of the conversion factors have a weak empirical basis, only marginal changes to sectoral wood consumption have been proposed during the review process with national correspondents.
Wood volumes for energy use are based upon results of the Joint Wood Energy Enquiry (Steierer et al. 2007) and data from international energy statistics (IEA, Eurostat, Eurobserv’ER). Data from energy statistics require conversion factors to calculate corresponding roundwood equivalents. The study applies global conversion factors (energy content of fuelwood, etc.) as presented by the World Energy Council20 to convert energy units (Toe21/PJ22) to the above mentioned roundwood equivalent.
These global conversion factors, for energy as well as material use, may only provide an approximation of the real picture at national and regional level. This does not imply that the conversion factors are correct, but they seem to be the best available, in many countries.
Only few countries dispose of the required (empirically gained) precise information on conversion factors and are currently able to check and provide such information (e.g. Finland, Austria, Germany).
The authors of the study urge countries to improve or develop scarce information on conversion factors for material and energy use at national level. The national conversion factors should consider the structure, processing technologies and the material efficiencies of each branch of the forest based sector. Similar information is urgently required for the energy production, too. Respective background information and suggestions for improvement can be found in the background paper for the UNECE/FAO workshop on “national wood resource balances” (Thivolle-Cazat 2008).
Improved conversion factors will certainly influence the difference between the balance sheet total of the supply and use side.
2.4 Measuring wood fibres’ cascaded use
Wood is a highly versatile material being used and reused in many different processes. Co-products of the wood-processing industry (chips from sawmill industry) are an important raw material for further processing. They can easily be used directly in on-site integrated processes (e.g. black liquor for energy generation or pellets production by sawmills) or they are sold to trader and/or producer using the fibres for subordinated processing (e.g. chips from sawmill used for pulp production, sawdust for panel production, etc.). Wood fibres that reappear as “secondary” raw material increase the overall wood availability on the market. This kind of cascade use can be documented by the wood resource balance.
It is sometimes seen as “double-counting”, but this kind of cascade use is a typical advantage of wood resources. On the other hand without including cascade use, the wood resource balance would be 20 www.energycouncil.org
21 Mtoe: Toe : tons of oil equivalent
22 PJ : Peta Joule

-8-________________________________________EU/EFTA sub-regional and national wood resource balances 2005
incomplete. However, it is always possible to set up special wood resource balances for forest resources, industrial rest wood, post consumer wood or others.
This is already done in the flow chart models of the wood resources balance in Germany where sufficient empirical data are available. In this case the wood resource balance is not set up on its own, but is the sum of the flow charts models of all resources.
The cascade-factor of the EU/EFTA wood resource balance is 1,5 (807 M m³ overall use / 526 M m³ wood supply from forest).
The wood resource balance translates fibres’ reuse by cascade counting of wood fibres on the supply side. Subordinated production processes that use co-products, residues or recovered wood to at least some extent (e.g. wood pellets production, panel industry, incineration, etc.) counterbalance the cascade counting of the use side. When reporting properly all wood fibres supplies and uses, cascade-counting does not introduce a systematic over- or underestimation of either the wood supply or wood use, but it enlarges the balance sheet total on both side.
The inclusion of re-used fibres on the supply side allows accounting for net trade (import and export) of those items. Similar to wood products, international trade can play an important role for wood co-products and residues in some countries. International trade becomes particularly important for wood pellets.(see “processed wood fuels”).
The increase of the balance sheet total by accounting for the multiple use may be a suitable indicator for the material efficiency and the level of cascaded use of wood fibres by the national forest based sectors. A higher difference between initially harvested and supplied wood volumes from the forest (“supply forest”) and the balance sheet total (“total supply”) indicates a better integrated and more (material) efficient forest based sector. The results of this study may provide a rough approximation for the order of magnitude of this factor. Only empirical research will enable a more precise knowledge on real efficiencies and the role of cascaded use of raw materials at national level23.
2.5 Processed wood fuels
Processed wood fuels comprise pellets and briquettes. They are the only “product” that appears in the wood resource balance on the supply side and contributes to intentional cascade-counting. Pellets and briquettes are considered as a final product being exclusively produced for energy purposes. In contrast to any other product, processed wood fuels have a short life cycle and feeds directly into final use for energy generation. Energy use comprises pellets and briquettes consumption and counterbalances the double counting on the use side.
23 Mention the Task Force on conversion factors
Example:
A saw log (supply) enters a sawmill. Sawnwood (use) is produced, as well as wood chips (supply), which is available for further use. These chips might enter the next process - e.g. the pulp production (use). After the (chemical) pulping process the contained lignin (and hemi-celluloses) end up as black liquor (supply) – which is then used for energy generation (use). Hence the triple supply of the fibre is counterbalanced by triple use
Converted to solid cubic metre equivalents, the same fibre might be reported three or more times as source that feeds into a downstream wood use. Hence, each cascade counting of wood fibres on the supply side is balanced out by an additional fibre demanding process.
Finished or semi-finished wood products (e.g. sawn wood) are considered as wood fibres leaving the circulation for a longer period - until they reappear as post consumer recovered wood. Only landfilled wood (not shown in the balance) and energy use can be considered as real final wood use.

EU/EFTA sub-regional and national wood resource balances 2005____________________________________________________9
Wood pellets and briquettes are suitable commodities for international trade and long distance transported (e.g. shipping). Hence it is absolutely necessary to consider their net trade at country level. Some countries export up to 100% of their production (e.g. Baltic states), whereas other countries depend heavily on pellets imports (e.g. Denmark, Italy or the Netherlands). Results24 from different studies indicate that about 1/3 of the global wood pellets production is being traded internationally. Reporting processed wood fuels on the supply side facilitates taking into account the importance of net trade. In countries with an export oriented pellets production the balance sheet total of the supply side remains unchanged (or increases only by little), whereas it increases in case of net importing countries.
The study does not consider storage capacities and stock changes of wood pellets. It was assumed that these didn’t play any role in the reference year 2005 due to high demand. These details may play a certain role in the successive years (e.g. 2007)25.
From January 2009 onwards wood pellets will be reported under a new and specific trade code in the revised European Combined Nomenclature (19422???). This new code will help to significantly improve the data availability and comparability of production and trade. However, pellets are an internationally traded commodity. The authors urge national decision takers from national member states to appeal to the International Customs Organization to develop an internationally agreed definition that could be included in the Harmonized System and hence cover the international trade. This action calls on urgency, as the HS is being revised only every 5 years and the current revision cycle is almost finalized.
3. DATA UPDATE
3.1 Data review process
The first draft version of this report served as a background paper to the UNECE/FAO Policy Forum, held in Geneva 10th October 2007. Since then, the original draft report and data presented have undergone an extensive review process. The report was sent to country correspondents of all countries presented in the report as well as countries annexing geographically to the Eurasian area.
Out of 42 Countries contacted (29 EU/EFTA / 13 Non-EU/EFTA) 27 replies were sent back (19 EU/EFTA / 8 Non-EU). The remarkable response rate was confirms the high interest of the issue wood energy. Nevertheless, the responses were of very different qualities.
7 countries confirmed and endorsed (calculated) dataset
6 countries proposed data adjustments
8 countries provided (positive) general comments without rejecting/correcting data
4 countries responses are still pending as research is ongoing
2 countries provided complete new data set (Serbia and Turkey)
(million m³) Wood supply Wood use
Proposed increase +29.8 +12.5
Proposed decreased - 12.2 - 2.5
Net change +17.6 +10.0
Table 1 : Result of the data revision process (EU/EFTA only)
24 JWEE (UNECE 2007), Alakangas (2007)
25 Further information on the market situation of wood pellets may be found in the pellets@las (www.pelletcentre.info)

-10-________________________________________EU/EFTA sub-regional and national wood resource balances 2005
Data provided in the data review process increased the supply more than the use side. Hence the original difference of the balance sheet total between supply and use decreased by about 7 million m³.
Bark and woody biomass outside the forest clearly increased, whereas recovered wood, industrial roundwood and pulp production co-products clearly decreased. Increase and decrease of wood chips and residues showed an uneven picture and came close to a tie. The increase of 3 million m³ as corrected by some countries where superimposed by 5 million m³ decrease by some other countries.
The feed back from the data review process confirms that data presented in the draft report tended to be prudent estimations that slightly underestimated use and supply.
3.2 Updated JFSQ dataset
During the revision of the study and its underlying dataset of the JFSQ has been updated and incorporates now the JFSQ dataset for the year 2005 as of 10th February 2008. Due to this new dataset slight changes may have occurred even in countries that did not actively proposes any changes to their dataset during the review process. Nevertheless, the new dataset had only a slight impact on the balance sheet total and the difference between supply and use. Only Swedish data refers to JFSQ data for 2004 (industrial roundwood and fuelwood),
EU / EFTA 2005million m³ % % million m³
Industrial Roundwood - JFSQ 381 49%
Industrial Roundwood* 15 2% 26% 214
Fuelwood - JFSQ 79 10% 11% 88
Fuelwood* 3 0% 19% 152
Bark 28 4% 1% 7
Used logging residues 20 3% 1% 6
Woody biomass outside the forest 19 2%
Supply co-products:
Chips, particles & wood residues 122 16%
Pulp production co-products** 70 9%
Supply recovered wood: 6% 49
Recovered wood*** 36 5% 8% 65
Supply processed wood fuel: 11% 92
Processed wood fuel 7 1% 17% 135
780 808
* maximum difference unreported to JFSQ** black liquor, tall oil, etc.*** post consumer recovered wood for material & energy use**** processed wood fuel industry
Pellets, briquetts etc. ****
Other physical utilization
Power and heat
28
Difference SUPPLY TOTAL
Supply from forest & woody biomass outside the forest:
TOTAL USE
Industrial internal
Private households
Undifferentiated energy use
Material use:
Energy use:
Sawmill industry
Panel industry
Pulp industry
Figure 5 : Components of wood supply and consumption in the wood resource balance
However significant changes occurred balance-internal. Data for “Fuelwood – JFSQ” jumped from 56 million m³ (draft report) to 79 million m³ (final version). At the same moment “fuelwood - unreported to the JFSQ” dropped from 29 million m³ (draft report) to 5 million m³ (final version). The reason for the radical change of unrecorded removals was due improved data supply methodology in France. Since 2005 the French data submission to the JFSQ incorporates empirical results on fuelwood use by private households. The authors highly appreciate this improvement and whish to encourage other countries to follow the excellent example.
EU/EFTA sub-regional and national wood resource balances 2005___________________________________________________11
4. RESULTS
4.1 Wood supply
4.1.1 Direct wood supply form the forest
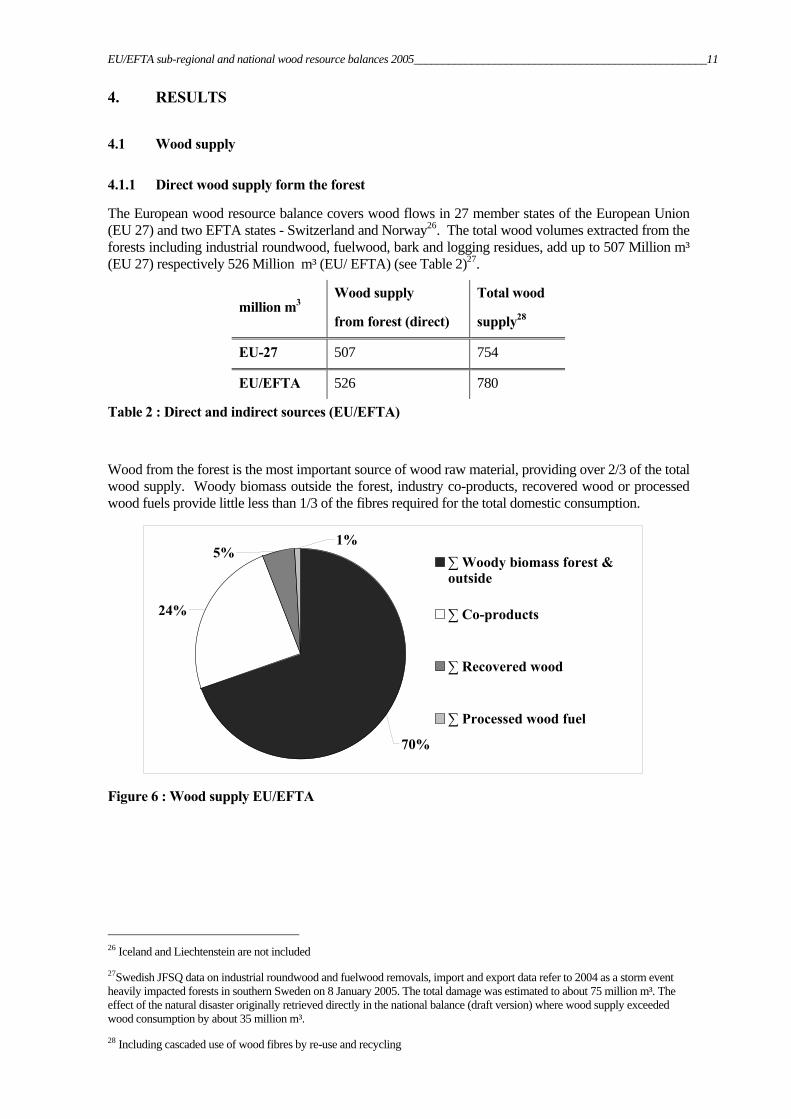
The European wood resource balance covers wood flows in 27 member states of the European Union (EU 27) and two EFTA states - Switzerland and Norway26. The total wood volumes extracted from the forests including industrial roundwood, fuelwood, bark and logging residues, add up to 507 Million m³ (EU 27) respectively 526 Million m³ (EU/ EFTA) (see Table 2)27.
million m3 Wood supply
from forest (direct)
Total wood
supply28
EU-27 507 754
EU/EFTA 526 780
Table 2 : Direct and indirect sources (EU/EFTA)
Wood from the forest is the most important source of wood raw material, providing over 2/3 of the total wood supply. Woody biomass outside the forest, industry co-products, recovered wood or processed wood fuels provide little less than 1/3 of the fibres required for the total domestic consumption.
70%
24%
5%1%
∑ Woody biomass forest &outside
∑ Co-products
∑ Recovered wood
∑ Processed wood fuel
Figure 6 : Wood supply EU/EFTA
26 Iceland and Liechtenstein are not included
27Swedish JFSQ data on industrial roundwood and fuelwood removals, import and export data refer to 2004 as a storm event heavily impacted forests in southern Sweden on 8 January 2005. The total damage was estimated to about 75 million m³. The effect of the natural disaster originally retrieved directly in the national balance (draft version) where wood supply exceeded wood consumption by about 35 million m³.
28 Including cascaded use of wood fibres by re-use and recycling

-12-________________________________________EU/EFTA sub-regional and national wood resource balances 2005
Wood removals from forests are significantly higher than reported by the Joint Forest Sector Questionnaire (JFSQ)29, which reports about 82% of the removals from forests and outside forests. Bark and felling/logging residues are not comprised by international definition of roundwood removals. In addition to unclassified products a certain amount of unrecorded wood removals may occur in many countries.
These removals must be distinguished from illegal logging. It is the nature of definitions, reporting structures and value thresholds for reporting that not all wood removals feed into national records (see German experience under 2.4.). Therefore unrecorded removals are not illegal in most (probably all) cases of the national wood resources balances in Europe. The term “woody biomass from outside the forest” deliberately avoids the JFSQ definition “other wooded land or other felling sites”. It seems to play a crucial role in wood supply – in particular for wood fuel supply for private user (e.g. France). The data coverage about this source is scarce and only some countries could provide (empiric) information on the issue. Woody biomass outside the forest covers a wide range of sources: urban and amenity trees, hedgerows, trees from fruit orchards, etc.
4.1.2 Total wood supply
The total wood supply is the balance sheet total of the left side of the balance, taking into account all multiple sources for wood fibres for further processing: It considers supply from forest and woody biomass outside the forest, as well as chips particles and wood residues, recovered wood for material and energy use (excluding landfill), pulp production co-products and processed wood fuel.
Production co-products and recovered wood represent on average about 1/3 of the total wood raw material supply to the national wood fibre consumption and make an important contribution to the efficient use of wood. Indirect wood sources such as chips, particles and residues seem to play a prominent role (>50%) for the national supply in the Netherlands, Denmark and Belgium – Import of processed raw material seems to play a dominant role in these three countries . However, the use of co-products from further processing seems to play a minor role (<20%)30 in Hungary, Bulgaria and Poland.
Post consumer recovered wood for energy and material use accounts for 36 million m³ and represents a significant secondary wood resource (4% of supply total) already today. The total emergence of recovered wood volumes is estimated to be even higher. For balance reasons, only volumes for energy and material use have been considered, whereas landfilled volumes were excluded. The EU Landfill Directive (1999/31/EC) obliges its member states to reduce the amount of biodegradable waste that they decrease landfill of biodegradable products to 35% of 1995 levels by 2016. This goal is expected to increase the amounts of recovered post-consumer wood for material and energy use in the future.
Processed wood fuels sch as pellets and briquettes a ccount for only 1% of the total supply in 2005. However, the Joint Wood Energy Enquiry 200731 indicated that their production and trade is steeply increasing.
29 JFSQ reports 416 million m³ for EU-27 and 433 million m³ for EU/EFTA
30 see annex I and III
31 http://timber.unece.org/fileadmin/DAM/meetings/jwee2-data-report-24march.pdf

EU/EFTA sub-regional and national wood resource balances 2005___________________________________________________13
4.2 Wood use
4.2.1 Material use
Material use is any process where wood is used to produce goods like sawnwood, pulp and paper, wood-based panels and other products. All these processes have in common that the wood fibres or particles contained in the products and co-products can be reused in downstream processes, recovery or recycling processes. In EU/EFTA the material use of wood accounts for 58% of the total wood use from all sources.
Material use Energy use Total use
Million m³ % Million m³ % Million m³
EU-27 447 57 % 332 43 % 779
EU/EFTA 467 58 % 341 42 % 807
Table 3 : Wood use 2005 (EU/EFTA)
Among the wood-based industries’ sector, the sawmill industry is the biggest wood consumer of solid roundwood for material purposes using 206 million m³ (EU-27) and 214 million m³ (EU/EFTA) – corresponding to 26% of total consumption. The pulp and paper producing industries are second accounting for 144 and 152 million m³ (19% of total consumption) followed by the panel industry (11%) consuming 85 and 88 million m3 respectively. Each industry has specific requirements for entrant wood qualities. In a material efficient and well-linked national forest-based industry, industrial roundwood would enter the sawmill sector before its co-products would be used in other processes such as pulp and paper or wood-based panel industries. In contrast to the sawmill sector, which depends entirely on roundwood supply, the latter use roundwood only to a certain extent (the pulp industry purchases about ¾32 and the panel industry about 1/333 of their fibres from roundwood).
4.2.2 Energy use
The energy use of wood is smaller than the overall material use by all wood based sectors. However, most countries have a much higher proportion of wood use for energy than recorded in international (energy) statistics. About 42 %, or 332 million m³ (EU27) and 341 million m³ (EU/EFTA) of the total wood volumes available are already used for energy generation. According to available statistics, Greece, Hungary and Denmark seem to have exceedingly high percentages of wood use for energy – accounting for more than 80% of the total national wood consumption (including imports). According to available data and information Belgium, Slovakia and the United Kingdom seem to use less than 25% of the nationally available wood volumes for energy generation. Reason for these extremes can only be identified by empirical research at country level.
Country Million m³ Share of domestic use
Sweden 48 36 % France 44 81 % Germany 41 37 % Finland 35 33 %
Table 4 : Major wood energy consuming countries
32 CEPI annual report – see: www.cepi.org
33 CEI-Bois annual “GESBOIS” questionnaire
-14-________________________________________EU/EFTA sub-regional and national wood resource balances 2005
The biggest four wood energy producing countries consume together 168 million m³. However, according to weak data information in particular on wood energy use by private households, it is very likely that countries with similar structure (GDP, population density, share of rural inhabitants, etc. ) have much higher wood consumption for energy generation that it is currently reflected by energy and forestry statistics. Further, in depth empirical research at country level is urgently needed to better reflect the real current situation on the ground.
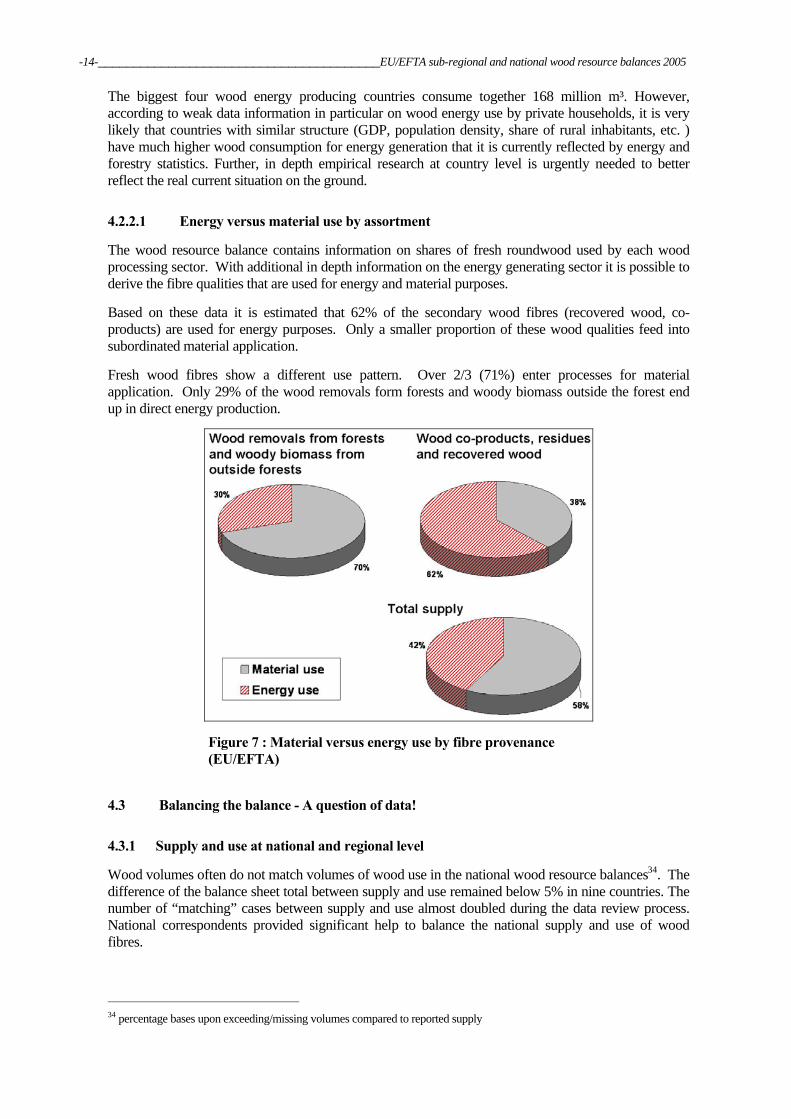
4.2.2.1 Energy versus material use by assortment
The wood resource balance contains information on shares of fresh roundwood used by each wood processing sector. With additional in depth information on the energy generating sector it is possible to derive the fibre qualities that are used for energy and material purposes.
Based on these data it is estimated that 62% of the secondary wood fibres (recovered wood, co-products) are used for energy purposes. Only a smaller proportion of these wood qualities feed into subordinated material application.
Fresh wood fibres show a different use pattern. Over 2/3 (71%) enter processes for material application. Only 29% of the wood removals form forests and woody biomass outside the forest end up in direct energy production.
Figure 7 : Material versus energy use by fibre provenance (EU/EFTA)
4.3 Balancing the balance - A question of data!
4.3.1 Supply and use at national and regional level
Wood volumes often do not match volumes of wood use in the national wood resource balances34. The difference of the balance sheet total between supply and use remained below 5% in nine countries. The number of “matching” cases between supply and use almost doubled during the data review process. National correspondents provided significant help to balance the national supply and use of wood fibres.
34 percentage bases upon exceeding/missing volumes compared to reported supply
EU/EFTA sub-regional and national wood resource balances 2005___________________________________________________15
In 17 countries35 the difference between supply and use exceeds the difference between supply and use by more that 5% of the balance sheet total in either way. However, only six of these show a really distort imbalance between supply and use. This may occur due to highly incompatible energy data. Using the energy data for energy generated from wood and wood waste may in some countries include woody biomass that is not accounted for in the JFSQ. Hence it could be the case that residues from olive trees and olive kernels are reported under the energy statistics as “from wood and wood waste”. The details of these imbalances can only be overcome by thorough empirical work at national level.
Missing national data (e.g. bark, used logging residues) have not been extrapolated from average data in other countries. Filling these gaps requires empirical research in the ECE Member States. Imbalances on national level may be caused to a certain extent by the patchwork of different data sources and conversion factors from energy and wood statistics (see below).
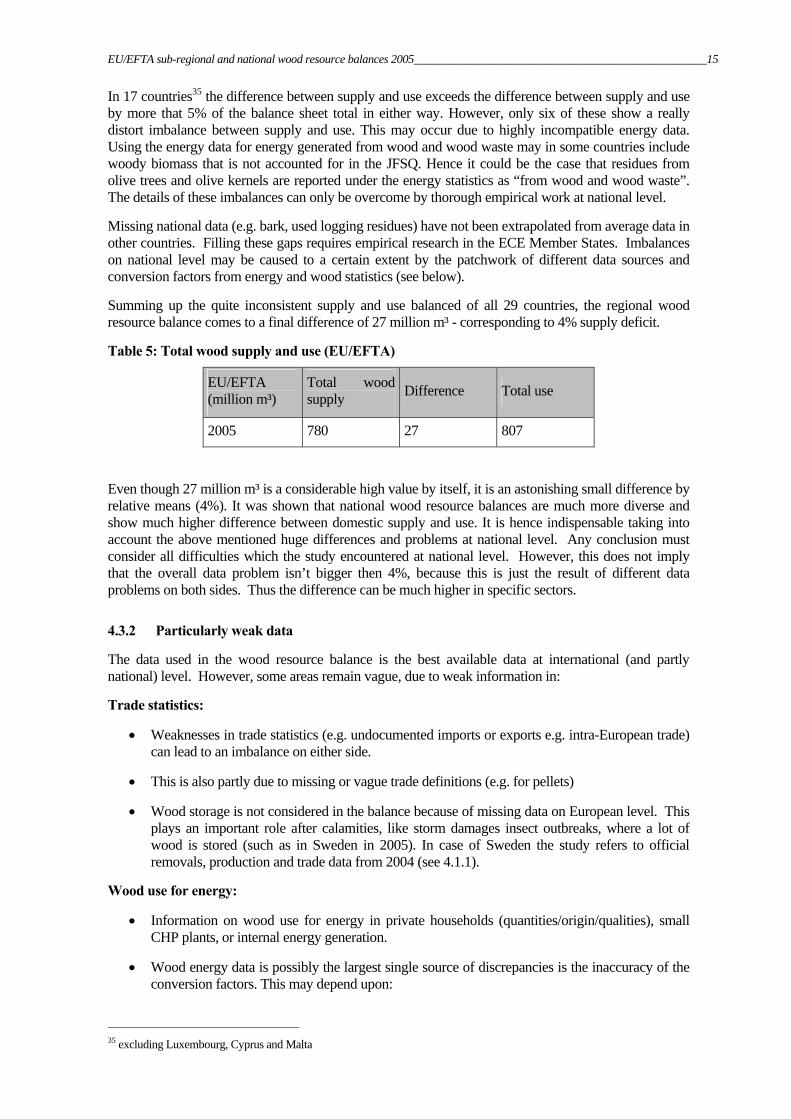
Summing up the quite inconsistent supply and use balanced of all 29 countries, the regional wood resource balance comes to a final difference of 27 million m³ - corresponding to 4% supply deficit.
Table 5: Total wood supply and use (EU/EFTA)
EU/EFTA (million m³)
Total wood supply Difference Total use
2005 780 27 807
Even though 27 million m³ is a considerable high value by itself, it is an astonishing small difference by relative means (4%). It was shown that national wood resource balances are much more diverse and show much higher difference between domestic supply and use. It is hence indispensable taking into account the above mentioned huge differences and problems at national level. Any conclusion must consider all difficulties which the study encountered at national level. However, this does not imply that the overall data problem isn’t bigger then 4%, because this is just the result of different data problems on both sides. Thus the difference can be much higher in specific sectors.
4.3.2 Particularly weak data
The data used in the wood resource balance is the best available data at international (and partly national) level. However, some areas remain vague, due to weak information in:
Trade statistics:
• Weaknesses in trade statistics (e.g. undocumented imports or exports e.g. intra-European trade) can lead to an imbalance on either side.
• This is also partly due to missing or vague trade definitions (e.g. for pellets)
• Wood storage is not considered in the balance because of missing data on European level. This plays an important role after calamities, like storm damages insect outbreaks, where a lot of wood is stored (such as in Sweden in 2005). In case of Sweden the study refers to official removals, production and trade data from 2004 (see 4.1.1).
Wood use for energy:
• Information on wood use for energy in private households (quantities/origin/qualities), small CHP plants, or internal energy generation.
• Wood energy data is possibly the largest single source of discrepancies is the inaccuracy of the conversion factors. This may depend upon:
35 excluding Luxembourg, Cyprus and Malta

-16-________________________________________EU/EFTA sub-regional and national wood resource balances 2005
Material efficiency:
Few reliable measurements on raw material input to produce given product quantities. Different production techniques (for the same product) may have considerable in material efficiencies. The same international conversion factors have been “recycled" in so many studies and refer to each other. Considerable caution must be used in assessing the cubic metre cubic metre equivalent figures, as they may be under- or overestimates (see also paper from Thivolle-Cazat (2008)).
Energy efficiency:
Humidity related specific energy content of solid biofuels hampers estimating precisely raw material input for energy (heat and/or electricity) production. Sound and detailed national conversion factors converting energy to biomass units are crucial precondition to foster communication and understanding between energy and forestry sector.
Wood supply for energy:
Cuttings and removals are not reported to production and trade statistics (problem related to data gathering). Lacking information on unreported wood extraction needs to be clearly distinguished from illegal logging! Fuelwood extraction can occur by collecting logging residues after harvesting activities or by small forest owners selling on informal markets (e.g. to private households); No statistics necessarily capture these wood flows, however, these volumes can add up to significant numbers. They can play a crucial role in assessing future wood availability, because much more wood might already be used than shown by statistics.
• Fuelwood removal for personal use / wood harvesting in private forest.
• Amounts and use of bark, logging residues, stumps.
• Trees outside the forest (urban/agriculture trees, shrubs and hedges).
• Emerging amounts of recovered wood.
• Current and future contribution of short rotation coppice.

EU/EFTA sub-regional and national wood resource balances 2005___________________________________________________17
5. CONCLUSIONS
The wood resource balance for 2005, at the national and EU/EFTA levels shows the broad pattern of wood supply and use in demand. Unevenly distributed data weaknesses on both sides of the wood resource balance confirm clearly that further empirical research is needed at national level. Nevertheless, the regional wood resource balanced allows some first conclusions:
1. Where available, results from empiric studies on wood energy at country level (France/Germany/Norway/Austria) confirm that direct energy use of wood is much higher than previously assumed. The required supply of woody biomass for this increased energy generation is not reflected in the forest sectors’ statistics. Therefore, these removals and flows have to be taken into account when estimating the available potential wood supply in the future.
2. It is very important that unrecorded removals must not be confused with illegal logging. International forest products statistics fail to account for informal wood flows and small trade of wood volumes due to the rules of accounting (e.g. value of transaction, little volumes, small Export/Import values). Experiences and comments from some countries indicate that the total amount of such unrecorded removals may well account for significant wood supply to national wood balance, notably for heat generation in private households.
3. Traditional analysis of wood supply and demand, centred on wood removals from forests and wood input to industries seems to be inadequate, since not all sources and uses of wood is considered. Therefore, an up-dated, more complex approach, based on comprehensive wood resource balances, is necessary.
6. RECOMMENDATIONS
Many of the elements for such a wood resource balance are already available, even at the international level, but several other elements need original research and data gathering, notably the following:
a. Unrecorded sources of wood supply, in particular trees outside the forest, logging residues, and post consumer recovered wood.
b. Unrecorded use of wood (often from small scale private properties.
c. Wood fibres origin for energy generation in particular for energy in private households and small combined heat and power plants.
d. Input/output conversion factors for wood using industries (inaccuracies in this respect could significantly increase, or decrease, the difference between supply and use of wood).
e.
There is an urgent need to analyse the potential of wood supply in quantitative terms, taking account of local realities, such as costs, ownership patterns, quality requirements, infrastructure etc.
The authors of the study urge countries to improve or develop scarce information on conversion factors for material and energy use at national level. The national conversion factors should consider the structure, processing technologies and the material efficiencies of each branch of the forest based sector. Similar information is urgently required for the energy production, too. Respective background information and suggestions for improvement can be found in the background paper for the UNECE/FAO workshop on “national wood resource balances” (Thivolle-Cazat 2008).

-18-________________________________________EU/EFTA sub-regional and national wood resource balances 2005
7. GLOSSARY
Bioenergy: Energy derived from any sort of solid, liquid or gaseous biomass.
Biofuel: Solid, liquid or gaseous renewable energy sources from biomass. Hence it not limited to “liquid transport fuel from biomass”- as often referred to in the EU context.
Wood co-products: The volume of roundwood that is left over after the production of primary forest products in the forest processing industry (i.e. forest processing residues) or that has been reduced to chips or particles. It includes sawmill rejects, slabs, edgings and trimmings, veneer log cores, veneer rejects, sawdust. It comprises wood that has been reduced to small pieces and is suitable for pulping, for particleboard and/or fibreboard production, for use as a fuel, or for other purposes. It excludes wood chips made either directly in the forest from roundwood or made from residues (i.e. already counted as pulpwood, round and split or wood chips and particles).
Forest-based industries: Forest-based industries consist of the wood products industry (sawn wood, wooden panels, plywood, wooden boards, joinery industry, house-building and wooden furniture), pulp, paper and paperboard industries, and the printing industry. The forestry sector is an essential part of the forest-based industries. (Depending on national definitions, furniture production may or not be included in different countries. In any case the use categories do not include furniture).
Other wooded land: Land not classified as forest, spanning more than 0.5 hectares; with trees higher than 5 metres and a canopy cover of 5–10 percent, or trees able to reach these thresholds in situ; or with a combined cover of shrubs, bushes and trees above 10 percent. It does not include land that is predominantly under agricultural or urban land use (MCPFE 2007 / FAO 2004).
Post consumer recovered wood:
Recovered wood includes all kinds of wooden material that is available at the end of its use as a wooden product (“post-consumer” or “post-use” wood).
- Recovered wood mainly comprises
- Packaging materials,
- Demolition wood,
- Timber from building sites and
- Fractions of used wood from residential, industrial & commercial activities.
Processed wood fuel: Wood pellets and briquetts.
Removals: The volume of all trees, living or dead, that are felled and removed from the forest, other wooded land or other felling sites. It includes natural losses that are recovered (i.e. harvested), removals during the year of wood felled during an earlier period, removals of non-stem wood such as stumps and branches (where these are harvested) and removal of trees killed or damaged by natural causes (i.e. natural losses), e.g. fire, windblown, insects and diseases. It excludes bark and other non-woody biomass and any wood that is not removed, e.g. stumps, branches and tree tops (where these are not harvested) and felling residues (harvesting waste). It is reported in cubic metres solid volume underbark (i.e. excluding bark). Where it is measured overbark (i.e. including bark), the volume has to be adjusted downwards to convert to an underbark estimate.
Roundwood: All wood removed with or without bark, including wood removed in its round form, or split, roughly squared or in other form (e.g. branches, roots, stumps and burls (where these are harvested) and wood that is roughly shaped or pointed. It is an aggregate comprising wood fuel, including wood for charcoal and industrial roundwood (wood in the rough). It is reported in cubic metres solid volume underbark (i.e. excluding bark).

EU/EFTA sub-regional and national wood resource balances 2005___________________________________________________19
Woody biomass outside the forest: Any woody biomass originating from other than forest and other wooded land. This includes urban and amenity trees, hedgerows, trees from fruit orchards, rail and roadside green and trees.
Material use: Wood fibres feeding into production processes of the forest based industries, excluding furniture production, that lead to physical products. Wood fibres or particles contained in the products and co-products can be reused in downstream processes, recovery or recycling processes.
Energy use: Wood fibres used for energy (heat and/or electricity) production.
-20-________________________________________EU/EFTA sub-regional and national wood resource balances 2005
8. REFERENCES
Alakangas, E., Heikkinen, A. Lensu, T., Vesterinen P. (2007) Biomass fuel trade in Europe - Summary report. VTT_R_03508-07, EUBIONET II-project, Jyväskyä http://www.eubionet.net/ACFiles/Download.asp?recID=4705
European Commission (1997) Energy for the Future: Renewable Sources of Energy. White Paper for a Community Strategy and Action Plan. COM(97)599 final, 26 Nov 1997. Brussels, Belgium.
European Commission (2005 a): Biomass action plan. COM(2005) 628 final. 7 December 2005. Brussels, Belgium.
European Commission (2005 b): Green paper on energy efficiency: Doing more with less. COM(2005) 265 final. 22 June 2005. Brussels, Belgium.
EurObserv'ER (2006): State of renewable energies in Europe. 6th report. Paris, France. Online: http://www.energies-renouvelables.org/
IEA (2005): World Energy Outlook (2006). Paris, France.
Mantau, U. (2004): Holzrohstoffbilanz Deutschland. Bestandsaufnahme 2002. Abschließender Forschungsbericht, Hamburg 2004.
Mantau, U. (2005) Development of methods to generate market information and linkages between biomass supply and demand. INFRO - Information Systems for Resources. Hamburg, Germany.
online: [http://webapp.rrz.uni-hamburg.de/~holz/files/161_Methods%2006.pdf]
Mantau, U., Soergel, C. (2006): Holzrohstoffbilanz Deutschland. Bestandsaufnahme 2004. Methodikbericht. Hamburg 2006.
MCPFE/UNECE/FAO (2007MCPFE) enquiry on quantitative indicators of sustainable forest management
Schulmeyer, F. (2005) European Forest Sector Outlook Study: Trends 2000-2005 compared to the EFSOS Scenarios. Geneva Timber and Forest Discussion Paper 47. ECE/TIM/DP/47. Geneva, Switzerland.
Steierer F, Fischer-Ankern A, Francoeur M, Wall J, Prins K. (2007): Wood energy in Europe and North America: A new estimate of volumes and flows. Joint Wood Energy Enquiry, UNECE/FAO, Geneva, Switzerland.
Thivolle-Cazat, A (2008) Conversion factors – A necessity for an accurate estimation of wood consumption by industries. Paper for the workshop on National Wood resource Balances. 31 March – 1 April 2008. Geneva, Switzerland.
UNECE (2005) European Forest Sector Outlook Study. Main Report. Geneva Timber and Forest Study Paper 20. ECE/TIM/SP/20. Geneva, Switzerland.
UNECE (2007) Timber Committee Price Database. Online: [http://www.unece.org/trade/timber/mis/fp-stats.htm]

EU/EFTA sub-regional and national wood resource balances 2005___________________________________________________21
9. ANNEX

-22-________________________________________EU/EFTA sub-regional and national wood resource balances 2005
ANNEX I: European wood resource balance - detailed overview
2005
JFSQM
aximum
difference unreported
to JFSQ
JFSQM
aximum
difference unreported
to JFSQ(P
+I-X)(P)
(P+I-X)(P)
(P+I-X)(P)
(P)(P+I-X)
(P)(P)
(P)(P+I-X)
Austria21 100
05 100
02 800
…5 729
9 6001 271
1 5503 417
1 21829 000
50 236Belgium
6 4080
6340
……
…1 601
4101 366
2 805…
7 04311 859
Bulgaria2 798
1 4972 555
0…
……
449196
327246
…6 851
7 742Cyprus
63
40
……
…4
……
0…
1317
Czech Republic12 490
0966
0175
1 3652 833
2 356…
…1 851
4014 996
22 077Denm
ark1 885
01 549
0…
……
1 535…
…0
1 3473 434
6 316Estonia
4 5270
9330
……
…1 991
……
168…
5 4607 618
Finland62 399
05 310
07 625
1 825…
18 0271 488
1 50319 699
9877 158
116 470France
26 7350
24 1040
1 958…
8 70012 429
1 70014 200
4 622333
52 79780 582
Germ
any47 091
6 5826 387
1 0572 520
9 900283
15 57011 924
…4 267
33373 537
105 914G
reece637
01 034
0…
……
518…
9000
…1 671
2 188Hungary
2 170646
3 0030
……
…652
1964
0…
5 8196 490
Ireland2 524
019
0…
……
955646
9640
…2 543
4 144Italy
7 7585 032
6 5380
……
…4 784
2 9633 224
240383
19 32727 698
Latvia9 056
0608
0…
……
2 109…
…0
…9 664
11 772Lithuania
4 0430
1 118298
70465
…2 027
……
0141
6 2278 396
Luxembourg
35012
-390
……
…216
……
0…
324539
Malta
……
0…
……
…0
……
……
00
Netherlands750
0263
0125
……
1 928600
2 499226
8801 139
4 772Norw
ay11 111
01 287
1 753…
……
3 193369
4972 016
4114 151
19 770Poland
29 9821 194
3 4040
1 400227
6367 210
6 2704 917
1 88817
36 20752 227
Portugal9 234
0595
0…
……
1 68561
4722 749
…9 829
14 325Rom
ania11 787
2412 662
0869
……
1 920…
…294
…15 559
17 773Slovakia
7 3690
1780
15010
302 055
50…
470…
7 70710 313
Slovenia1 924
85808
0…
159276
456149
215294
122 975
4 163Spain
16 7880
2 1050
……
…5 454
2 0402 400
2 880…
18 89329 267
Sweden
69 2760
6 1350
9 6996 000
…18 920
1 4501 568
21 3251 836
91 110134 642
Switzerland
2 8240
1 2190
210500
2401 320
…667
334…
4 7536 646
United Kingdom8 122
0126
1200
……
2 6774 872
11 0720
2008 449
16 198
EU 27
367 21015 291
76 1001 356
28 22519 551
18 487117 129
36 10947 240
67 4406 839
507 733753 737
EU 27 / EFTA
381 14515 291
78 6063 109
28 43520 051
18 727121 641
36 47848 403
69 7906 880
526 636780 154
∑ SUPPLY
FOR
EST
∑ SUP
PLY
TOTAL
1000 m³
(Roundwood
equivalent)
Industrial Roundwood
Fuelwood
BarkUsed
logging residues
Woody
biomass
outside the forest
Chips, particles &
wood
residues
Recovered w
ood for m
aterial & energy use
Recovered w
ood other use
Pulp
production co-products
Processed w
ood fuel

EU/EFTA sub-regional and national wood resource balances 2005___________________________________________________23
2005
(C)
(C)
(C) (C)
(C) (C
)
49 09818 100
4 1007 414
2 021…
17 463A
ustria10 389
2 1203 272
2 805…
…2 193
Belgium
5 832934
573474
……
3 852B
ulgaria7
70
……
…C
yprus20 777
7 1201 863
3 524193
1097 968
Czech R
epublic7 649
324345
…333
…6 646
Denm
ark8 486
3 923668
235…
…3 660
Estonia105 241
23 9014 586
41 322392
32134 719
Finland78 414
16 9008 480
9 273250
…43 511
France110 340
36 43420 500
10 320333
1 88940 864
Germ
any6 137
306870
……
…4 961
Greece
6 913344
804…
……
5 765H
ungary4 138
1 6921 332
……
…1 115
Ireland21 266
2 5677 882
1 255283
…9 279
Italy18 039
6 940798
……
..10 301
Latvia8 098
3 000586
…352
4943 666
Lithuania1 608
899709
……
……
Luxembourg
0…
……
……
…M
alta7 774
47522
463180
7145 920
Netherlands
19 3085 139
8237 167
71336
5 773N
orway
54 79017 500
9 8373 847
333987
22 286P
oland23 421
1 6731 793
5 881…
…14 075
Portugal
25 9547 021
1 629565
……
16 739R
omania
10 0764 302
1 3812 593
40…
1 760S
lovakia5 367
1 410786
56558
1162 431
Slovenia
42 1627 116
7 2606 104
33…
21 649S
pain133 008
36 0001 113
46 6051 600
047 690
Sw
eden8 840
2 6421 487
897…
293 785
Sw
itzerland14 003
5 2504 229
814200
4663 043
United K
ingdom
778 989206 258
85 419144 059
6 6035 096
331 555EU
27807 137
214 03987 729
152 1236 674
5 461341 112
EU 27 / EFTA
Energy usePanel industry P
ulp industry P
rocessed w
ood fuel industry
Other
physical utilization
1000 m³
(Roundwood equivalent)
∑ USE
TOTAL
Saw
mill
industry

-24-________________________________________EU/EFTA sub-regional and national wood resource balances 2005
ANNEX II : Regional wood resource balances EU/EFTA
EU 27
EU 27
1.000 m³ % % 1.000 m³
Industrial Roundwood - JFSQ (P+I-X) 367 210 49%
Industrial Roundwood - Maximum difference unreported to JFSQ (P) 15 291 2% 26% 206 258 (C)
Fuelwood - JFSQ (P+I-X) 76 100 10% 11% 85 419 (C)
Fuelwood - Maximum difference unreported to JFSQ (P) 1 356 0% 18% 144 059 (C)
Bark (P) 28 225 4% 1% 6 603 (C)
Used logging residues (P) 19 551 3% 1% 5 096 (C)
Woody biomass outside the forest (P) 18 487 2%
Supply by-products:
Chips, particles & wood residues (P+I-X) 117 129 16%
Pulp production co-products (P) 67 440 9%
Supply recovered wood: 6% 45 637 (C)
Recovered wood for material & energy use (P) 36 109 5% 8% 63 247 (C)
Supply processed wood fuel: 11% 87 334 (C)
Processed wood fuel (P+I-X) 6 839 1% 17% 135 336 (C)
753 737 778 989
(P)
(I)
(X)
(P+I-X)
(C)
∑
Wood supply and use - EU 27 (2005)
70% 57%
24% 43%
5% 0%
1%
0%
1990 1995 2000 2005#NV - #NV #NV
- harvesting losses ( ? %) #NV - #NV #NV
- unused roundwood ( ? %)#NV - #NV #NV
Potential roundwood supply from forest #NV - #NV #NV#NV - #NV #NV
Supply from forest & woody biomass outside the forest:
331 555
0
6 839
447 434∑ Woody biomass forest & outside
Wood supply (1.000 m³): Wood use (1.000 m³):
526 220
184 569
2005
∑ SUPPLY TOTAL
Other physical utilization
∑ TOTAL USE
Material use:
Energy use:
Power and heat
Industrial internal
Sawmill industry
25 251
Difference
∑ Co-products
∑ Recovered wood
∑ Processed wood fuel
Wood consumption
0
Import
∑ Material use
Panel industry
Pulp industry
Processed wood fuel industry
Production / Removals
Private households
Undifferentiated energy use
Export
Apparent consumption
Sum
Source: MCPFE/UNECE/FAO
EU 27: Net annual increment (million m³ over bark):
∑ Energy use
Balance36 109
0%
10%
20%
30%
40%
50%
60%
70%
80%
90%
100%
Wood supply(1.000 m³):
∑ Woody biomass forest & outside
∑ Co-products
∑ Recovered wood
∑ Processed wood fuel
Wood use(1.000 m³):
∑ Energy use
∑ Material use
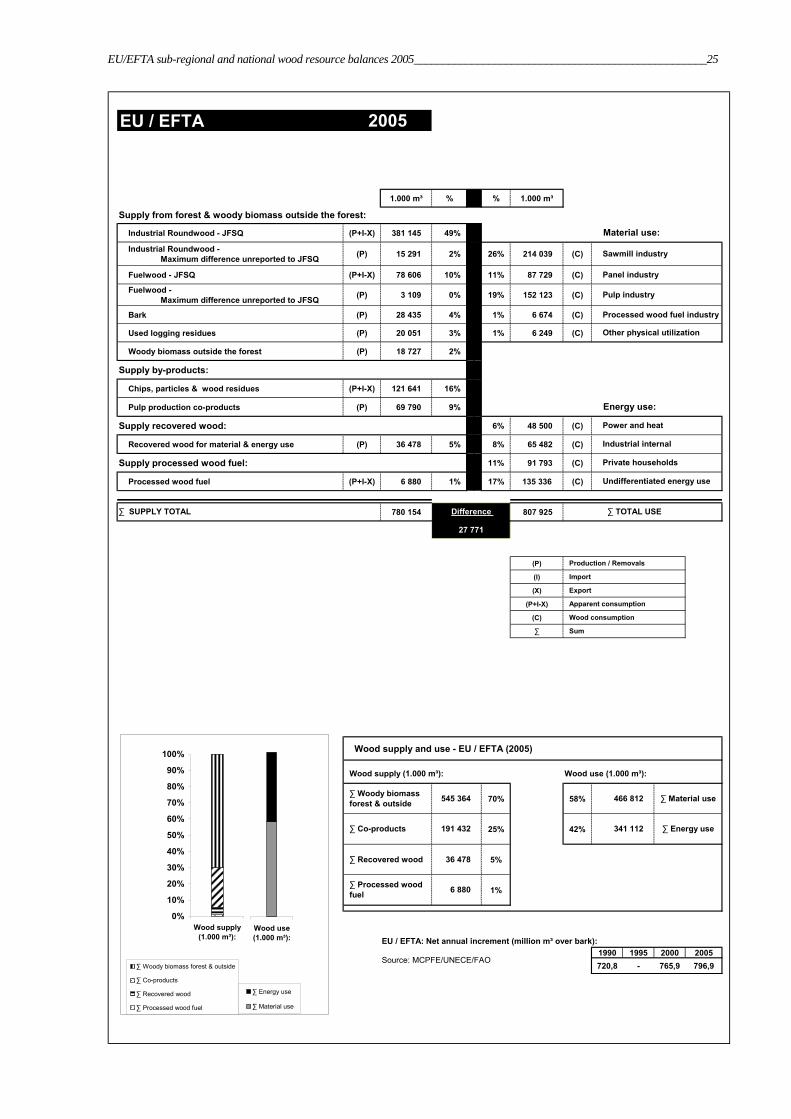
EU/EFTA sub-regional and national wood resource balances 2005___________________________________________________25
EU / EFTA
EU / EFTA
1.000 m³ % % 1.000 m³
Industrial Roundwood - JFSQ (P+I-X) 381 145 49%
Industrial Roundwood - Maximum difference unreported to JFSQ (P) 15 291 2% 26% 214 039 (C)
Fuelwood - JFSQ (P+I-X) 78 606 10% 11% 87 729 (C)
Fuelwood - Maximum difference unreported to JFSQ (P) 3 109 0% 19% 152 123 (C)
Bark (P) 28 435 4% 1% 6 674 (C)
Used logging residues (P) 20 051 3% 1% 6 249 (C)
Woody biomass outside the forest (P) 18 727 2%
Supply by-products:
Chips, particles & wood residues (P+I-X) 121 641 16%
Pulp production co-products (P) 69 790 9%
Supply recovered wood: 6% 48 500 (C)
Recovered wood for material & energy use (P) 36 478 5% 8% 65 482 (C)
Supply processed wood fuel: 11% 91 793 (C)
Processed wood fuel (P+I-X) 6 880 1% 17% 135 336 (C)
780 154 807 925
(P)
(I)
(X)
(P+I-X)
(C)
∑
Wood supply and use - EU / EFTA (2005)
70% 58%
25% 42%
5% 0%
1%
0%
1990 1995 2000 2005720,8 - 765,9 796,9
- harvesting losses ( ? %) -58 - -61 -64
- unused roundwood ( ? %)-86 - -92 -96
Potential roundwood supply from forest -58 - -61 -64519 - 551 574
Supply from forest & woody biomass outside the forest:
341 112
0
6 880
466 812∑ Woody biomass forest & outside
Wood supply (1.000 m³): Wood use (1.000 m³):
545 364
191 432
2005
∑ SUPPLY TOTAL
Other physical utilization
∑ TOTAL USE
Material use:
Energy use:
Power and heat
Industrial internal
Sawmill industry
27 771
Difference
∑ Co-products
∑ Recovered wood
∑ Processed wood fuel
Wood consumption
0
Import
∑ Material use
Panel industry
Pulp industry
Processed wood fuel industry
Production / Removals
Private households
Undifferentiated energy use
Export
Apparent consumption
Sum
Source: MCPFE/UNECE/FAO
EU / EFTA: Net annual increment (million m³ over bark):
∑ Energy use
Balance36 478
0%
10%
20%
30%
40%
50%
60%
70%
80%
90%
100%
Wood supply(1.000 m³):
∑ Woody biomass forest & outside
∑ Co-products
∑ Recovered wood
∑ Processed wood fuel
Wood use(1.000 m³):
∑ Energy use
∑ Material use

-26-________________________________________EU/EFTA sub-regional and national wood resource balances 2005
ANNEX III : National wood resource balances EU/EFTA countries
Austria
Austria
1.000 m³ % % 1.000 m³
Industrial Roundwood - JFSQ (P+I-X) 21 100 42%
Industrial Roundwood - Maximum difference unreported to JFSQ (P) 37% 18 100 (C)
Fuelwood - JFSQ (P+I-X) 5 100 10% 8% 4 100 (C)
Fuelwood - Maximum difference unreported to JFSQ (P) 15% 7 414 (C)
Bark (P) 2 800 6% 4% 2 021 (C)
Used logging residues (P) (C)
Woody biomass outside the forest (P) 5 729 11%
Supply by-products:
Chips, particles & wood residues (P+I-X) 9 600 19%
Pulp production co-products (P) 3 417 7%
Supply recovered wood: 4% 2 051 (C)
Recovered wood for material & energy use (P) 1 271 3% 8% 3 855 (C)
Supply processed wood fuel: 17% 8 538 (C)
Processed wood fuel (P+I-X) 1 218 2% 6% 3 020 (C)
50 235 49 098
(P)
(I)
(X)
(P+I-X)
(C)
∑
Wood supply and use - Austria (2005)
69% 64%
26% 36%
3% 0%
2%
0%
1990 1995 2000 200527,3 - 31,3 -
- harvesting losses ( ? %) -2 - -3 #WERT!
- unused roundwood ( ? %)-3 - -4 #WERT!
Potential roundwood supply from forest -2 - -3 #WERT!20 - 23 #WERT!
Supply from forest & woody biomass outside the forest:
17 463
0
1 218
31 635∑ Woody biomass forest & outside
Wood supply (1.000 m³): Wood use (1.000 m³):
34 729
13 017
2005
∑ SUPPLY TOTAL
Other physical utilization
∑ TOTAL USE
Material use:
Energy use:
Power and heat
Industrial internal
Sawmill industry
1 137
Difference
∑ Co-products
∑ Recovered wood
∑ Processed wood fuel
Wood consumption
0
Import
∑ Material use
Panel industry
Pulp industry
Processed wood fuel industry
Production / Removals
Private households
Undifferentiated energy use
Export
Apparent consumption
Sum
Source: MCPFE/UNECE/FAO
Austria: Net annual increment (million m³ over bark):
∑ Energy use
Balance1 271
0%
10%
20%
30%
40%
50%
60%
70%
80%
90%
100%
Wood supply(1.000 m³):
∑ Woody biomass forest & outside
∑ Co-products
∑ Recovered wood
∑ Processed wood fuel
Wood use(1.000 m³):
∑ Energy use
∑ Material use

EU/EFTA sub-regional and national wood resource balances 2005___________________________________________________27
Belgium
Belgium
1.000 m³ % % 1.000 m³
Industrial Roundwood - JFSQ (P+I-X) 6 408 54%
Industrial Roundwood - Maximum difference unreported to JFSQ (P) 20% 2 120 (C)
Fuelwood - JFSQ (P+I-X) 634 5% 31% 3 272 (C)
Fuelwood - Maximum difference unreported to JFSQ (P) 27% 2 805 (C)
Bark (P) (C)
Used logging residues (P) (C)
Woody biomass outside the forest (P)
Supply by-products:
Chips, particles & wood residues (P+I-X) 1 601 14%
Pulp production co-products (P) 2 805 24%
Supply recovered wood: (C)
Recovered wood for material & energy use (P) 410 3% (C)
Supply processed wood fuel: (C)
Processed wood fuel (P+I-X) 21% 2 193 (C)
11 859 10 389
(P)
(I)
(X)
(P+I-X)
(C)
∑
Wood supply and use - Belgium (2005)
59% 79%
37% 21%
3% 0%
0%
1990 1995 2000 20055,2 - 5,3 5,3
- harvesting losses ( ? %) 0 - 0 0
- unused roundwood ( ? %)-1 - -1 -1
Potential roundwood supply from forest 0 - 0 04 - 4 4
Supply from forest & woody biomass outside the forest:
2 193
0
8 197∑ Woody biomass forest & outside
Wood supply (1.000 m³): Wood use (1.000 m³):
7 043
4 407
2005
∑ SUPPLY TOTAL
Other physical utilization
∑ TOTAL USE
Material use:
Energy use:
Power and heat
Industrial internal
Sawmill industry
1 470
Difference
∑ Co-products
∑ Recovered wood
∑ Processed wood fuel
Wood consumption
0
Import
∑ Material use
Panel industry
Pulp industry
Processed wood fuel industry
Production / Removals
Private households
Undifferentiated energy use
Export
Apparent consumption
Sum
Source: MCPFE/UNECE/FAO
Belgium: Net annual increment (million m³ over bark):
∑ Energy use
Balance410
0%
10%
20%
30%
40%
50%
60%
70%
80%
90%
100%
Wood supply(1.000 m³):
∑ Woody biomass forest & outside
∑ Co-products
∑ Recovered wood
∑ Processed wood fuel
Wood use(1.000 m³):
∑ Energy use
∑ Material use

-28-________________________________________EU/EFTA sub-regional and national wood resource balances 2005
Bulgaria
Bulgaria
1.000 m³ % % 1.000 m³
Industrial Roundwood - JFSQ (P+I-X) 2 798 36%
Industrial Roundwood - Maximum difference unreported to JFSQ (P) 1 497 19% 16% 934 (C)
Fuelwood - JFSQ (P+I-X) 2 555 33% 10% 573 (C)
Fuelwood - Maximum difference unreported to JFSQ (P) 8% 474 (C)
Bark (P) (C)
Used logging residues (P) (C)
Woody biomass outside the forest (P)
Supply by-products:
Chips, particles & wood residues (P+I-X) 449 6%
Pulp production co-products (P) 246 3%
Supply recovered wood: (C)
Recovered wood for material & energy use (P) 196 3% (C)
Supply processed wood fuel: (C)
Processed wood fuel (P+I-X) 66% 3 852 (C)
7 742 5 832
(P)
(I)
(X)
(P+I-X)
(C)
∑
Wood supply and use - Bulgaria (2005)
88% 34%
9% 66%
3% 0%
0%
1990 1995 2000 200511,2 - 13,6 14,1
- harvesting losses ( ? %) -1 - -1 -1
- unused roundwood ( ? %)-1 - -2 -2
Potential roundwood supply from forest -1 - -1 -18 - 10 10
Supply from forest & woody biomass outside the forest:
3 852
0
1 980∑ Woody biomass forest & outside
Wood supply (1.000 m³): Wood use (1.000 m³):
6 851
695
2005
∑ SUPPLY TOTAL
Other physical utilization
∑ TOTAL USE
Material use:
Energy use:
Power and heat
Industrial internal
Sawmill industry
1 909
Difference
∑ Co-products
∑ Recovered wood
∑ Processed wood fuel
Wood consumption
0
Import
∑ Material use
Panel industry
Pulp industry
Processed wood fuel industry
Production / Removals
Private households
Undifferentiated energy use
Export
Apparent consumption
Sum
Source: MCPFE/UNECE/FAO
Bulgaria: Net annual increment (million m³ over bark):
∑ Energy use
Balance196
0%
10%
20%
30%
40%
50%
60%
70%
80%
90%
100%
Wood supply(1.000 m³):
∑ Woody biomass forest & outside
∑ Co-products
∑ Recovered wood
∑ Processed wood fuel
Wood use(1.000 m³):
∑ Energy use
∑ Material use

EU/EFTA sub-regional and national wood resource balances 2005___________________________________________________29
Czech Republic
Czech Republic
1.000 m³ % % 1.000 m³
Industrial Roundwood - JFSQ (P+I-X) 12 490 57%
Industrial Roundwood - Maximum difference unreported to JFSQ (P) 34% 7 120 (C)
Fuelwood - JFSQ (P+I-X) 966 4% 9% 1 863 (C)
Fuelwood - Maximum difference unreported to JFSQ (P) 17% 3 524 (C)
Bark (P) 175 1% 1% 193 (C)
Used logging residues (P) 1 365 6% 1% 109 (C)
Woody biomass outside the forest (P) 2 833 13%
Supply by-products:
Chips, particles & wood residues (P+I-X) 2 356 11%
Pulp production co-products (P) 1 851 8%
Supply recovered wood: 3% 538 (C)
Recovered wood for material & energy use (P) 11% 2 270 (C)
Supply processed wood fuel: 25% 5 131 (C)
Processed wood fuel (P+I-X) 40 0% 0% 29 (C)
22 077 20 777
(P)
(I)
(X)
(P+I-X)
(C)
∑
Wood supply and use - Czech Republic (2005)
81% 62%
19% 38%
0%
0%
0%
1990 1995 2000 200517,0 - 19,8 20,5
- harvesting losses ( ? %) -1 - -2 -2
- unused roundwood ( ? %)-2 - -2 -2
Potential roundwood supply from forest -1 - -2 -212 - 14 15
Supply from forest & woody biomass outside the forest:
7 968
0
40
12 809∑ Woody biomass forest & outside
Wood supply (1.000 m³): Wood use (1.000 m³):
17 829
4 207
2005
∑ SUPPLY TOTAL
Other physical utilization
∑ TOTAL USE
Material use:
Energy use:
Power and heat
Industrial internal
Sawmill industry
1 299
Difference
∑ Co-products
∑ Recovered wood
∑ Processed wood fuel
Wood consumption
0
Import
∑ Material use
Panel industry
Pulp industry
Processed wood fuel industry
Production / Removals
Private households
Undifferentiated energy use
Export
Apparent consumption
Sum
Source: MCPFE/UNECE/FAO
Czech Republic: Net annual increment (million m³ over bark):
∑ Energy use
Balance
0%
10%
20%
30%
40%
50%
60%
70%
80%
90%
100%
Wood supply(1.000 m³):
∑ Woody biomass forest & outside
∑ Co-products
∑ Recovered wood
∑ Processed wood fuel
Wood use(1.000 m³):
∑ Energy use
∑ Material use

-30-________________________________________EU/EFTA sub-regional and national wood resource balances 2005
Denmark
Denmark
1.000 m³ % % 1.000 m³
Industrial Roundwood - JFSQ (P+I-X) 1 885 30%
Industrial Roundwood - Maximum difference unreported to JFSQ (P) 4% 324 (C)
Fuelwood - JFSQ (P+I-X) 1 549 25% 5% 345 (C)
Fuelwood - Maximum difference unreported to JFSQ (P) (C)
Bark (P) 4% 333 (C)
Used logging residues (P) (C)
Woody biomass outside the forest (P)
Supply by-products:
Chips, particles & wood residues (P+I-X) 1 535 24%
Pulp production co-products (P)
Supply recovered wood: (C)
Recovered wood for material & energy use (P) (C)
Supply processed wood fuel: (C)
Processed wood fuel (P+I-X) 1 347 21% 87% 6 646 (C)
6 316 7 649
(P)
(I)
(X)
(P+I-X)
(C)
∑
Wood supply and use - Denmark (2005)
54% 13%
24% 87%
0%
21%
0%
1990 1995 2000 20054,6 - 4,8 5,2
- harvesting losses ( ? %) 0 - 0 0
- unused roundwood ( ? %)-1 - -1 -1
Potential roundwood supply from forest 0 - 0 03 - 3 4
Supply from forest & woody biomass outside the forest:
6 646
0
1 347
1 003∑ Woody biomass forest & outside
Wood supply (1.000 m³): Wood use (1.000 m³):
3 434
1 535
2005
∑ SUPPLY TOTAL
Other physical utilization
∑ TOTAL USE
Material use:
Energy use:
Power and heat
Industrial internal
Sawmill industry
1 333
Difference
∑ Co-products
∑ Recovered wood
∑ Processed wood fuel
Wood consumption
0
Import
∑ Material use
Panel industry
Pulp industry
Processed wood fuel industry
Production / Removals
Private households
Undifferentiated energy use
Export
Apparent consumption
Sum
Source: MCPFE/UNECE/FAO
Denmark: Net annual increment (million m³ over bark):
∑ Energy use
Balance
0%
10%
20%
30%
40%
50%
60%
70%
80%
90%
100%
Wood supply(1.000 m³):
∑ Woody biomass forest & outside
∑ Co-products
∑ Recovered wood
∑ Processed wood fuel
Wood use(1.000 m³):
∑ Energy use
∑ Material use

EU/EFTA sub-regional and national wood resource balances 2005___________________________________________________31
Estonia
Estonia
1.000 m³ % % 1.000 m³
Industrial Roundwood - JFSQ (P+I-X) 4 527 59%
Industrial Roundwood - Maximum difference unreported to JFSQ (P) 46% 3 923 (C)
Fuelwood - JFSQ (P+I-X) 933 12% 8% 668 (C)
Fuelwood - Maximum difference unreported to JFSQ (P) 3% 235 (C)
Bark (P) (C)
Used logging residues (P) (C)
Woody biomass outside the forest (P)
Supply by-products:
Chips, particles & wood residues (P+I-X) 1 991 26%
Pulp production co-products (P) 168 2%
Supply recovered wood: (C)
Recovered wood for material & energy use (P) (C)
Supply processed wood fuel: (C)
Processed wood fuel (P+I-X) 43% 3 660 (C)
7 618 8 486
(P)
(I)
(X)
(P+I-X)
(C)
∑
Wood supply and use - Estonia (2005)
72% 57%
28% 43%
0%
0%
1990 1995 2000 200510,2 - 11,4 11,0
- harvesting losses ( ? %) -1 - -1 -1
- unused roundwood ( ? %)-1 - -1 -1
Potential roundwood supply from forest -1 - -1 -17 - 8 8
Supply from forest & woody biomass outside the forest:
3 660
0
4 826∑ Woody biomass forest & outside
Wood supply (1.000 m³): Wood use (1.000 m³):
5 460
2 158
2005
∑ SUPPLY TOTAL
Other physical utilization
∑ TOTAL USE
Material use:
Energy use:
Power and heat
Industrial internal
Sawmill industry
867
Difference
∑ Co-products
∑ Recovered wood
∑ Processed wood fuel
Wood consumption
0
Import
∑ Material use
Panel industry
Pulp industry
Processed wood fuel industry
Production / Removals
Private households
Undifferentiated energy use
Export
Apparent consumption
Sum
Source: MCPFE/UNECE/FAO
Estonia: Net annual increment (million m³ over bark):
∑ Energy use
Balance
0%
10%
20%
30%
40%
50%
60%
70%
80%
90%
100%
Wood supply(1.000 m³):
∑ Woody biomass forest & outside
∑ Co-products
∑ Recovered wood
∑ Processed wood fuel
Wood use(1.000 m³):
∑ Energy use
∑ Material use

-32-________________________________________EU/EFTA sub-regional and national wood resource balances 2005
Finland
Finland
1.000 m³ % % 1.000 m³
Industrial Roundwood - JFSQ (P+I-X) 62 399 54%
Industrial Roundwood - Maximum difference unreported to JFSQ (P) 23% 23 901 (C)
Fuelwood - JFSQ (P+I-X) 5 310 5% 4% 4 586 (C)
Fuelwood - Maximum difference unreported to JFSQ (P) 39% 41 322 (C)
Bark (P) 7 625 7% 0% 392 (C)
Used logging residues (P) 1 825 2% 0% 321 (C)
Woody biomass outside the forest (P)
Supply by-products:
Chips, particles & wood residues (P+I-X) 18 027 15%
Pulp production co-products (P) 19 699 17%
Supply recovered wood: 10% 10 399 (C)
Recovered wood for material & energy use (P) 1 488 1% 18% 18 596 (C)
Supply processed wood fuel: 5% 5 724 (C)
Processed wood fuel (P+I-X) 98 0% 0% 0 (C)
116 470 105 241
(P)
(I)
(X)
(P+I-X)
(C)
∑
Wood supply and use - Finland (2005)
66% 67%
32% 33%
1% 0%
0%
0%
1990 1995 2000 200576,0 - 79,4 92,9
- harvesting losses ( ? %) -6 - -6 -7
- unused roundwood ( ? %)-9 - -10 -11
Potential roundwood supply from forest -6 - -6 -755 - 57 67
Supply from forest & woody biomass outside the forest:
34 719
0
98
70 522∑ Woody biomass forest & outside
Wood supply (1.000 m³): Wood use (1.000 m³):
77 158
37 726
2005
∑ SUPPLY TOTAL
Other physical utilization
∑ TOTAL USE
Material use:
Energy use:
Power and heat
Industrial internal
Sawmill industry
11 230
Difference
∑ Co-products
∑ Recovered wood
∑ Processed wood fuel
Wood consumption
0
Import
∑ Material use
Panel industry
Pulp industry
Processed wood fuel industry
Production / Removals
Private households
Undifferentiated energy use
Export
Apparent consumption
Sum
Source: MCPFE/UNECE/FAO
Finland: Net annual increment (million m³ over bark):
∑ Energy use
Balance1 488
0%
10%
20%
30%
40%
50%
60%
70%
80%
90%
100%
Wood supply(1.000 m³):
∑ Woody biomass forest & outside
∑ Co-products
∑ Recovered wood
∑ Processed wood fuel
Wood use(1.000 m³):
∑ Energy use
∑ Material use

EU/EFTA sub-regional and national wood resource balances 2005___________________________________________________33
France
France
1.000 m³ % % 1.000 m³
Industrial Roundwood - JFSQ (P+I-X) 26 735 33%
Industrial Roundwood - Maximum difference unreported to JFSQ (P) 21% 16 900 (C)
Fuelwood - JFSQ (P+I-X) 24 104 30% 11% 8 480 (C)
Fuelwood - Maximum difference unreported to JFSQ (P) 12% 9 273 (C)
Bark (P) 1 958 2% 0% 250 (C)
Used logging residues (P) 1% 788 (C)
Woody biomass outside the forest (P) 8 700 11%
Supply by-products:
Chips, particles & wood residues (P+I-X) 12 429 15%
Pulp production co-products (P) 4 622 6%
Supply recovered wood: 1% 945 (C)
Recovered wood for material & energy use (P) 1 700 2% 10% 7 875 (C)
Supply processed wood fuel: 42% 33 030 (C)
Processed wood fuel (P+I-X) 333 0% 2% 1 661 (C)
80 582 79 202
(P)
(I)
(X)
(P+I-X)
(C)
∑
Wood supply and use - France (2005)
76% 45%
21% 55%
2% 0%
0%
0%
1990 1995 2000 200584,1 - 97,6 102,5
- harvesting losses ( ? %) -7 - -8 -8
- unused roundwood ( ? %)-10 - -12 -12
Potential roundwood supply from forest -7 - -8 -861 - 70 74
Supply from forest & woody biomass outside the forest:
43 511
0
333
35 691∑ Woody biomass forest & outside
Wood supply (1.000 m³): Wood use (1.000 m³):
61 497
17 051
2005
∑ SUPPLY TOTAL
Other physical utilization
∑ TOTAL USE
Material use:
Energy use:
Power and heat
Industrial internal
Sawmill industry
1 380
Difference
∑ Co-products
∑ Recovered wood
∑ Processed wood fuel
Wood consumption
0
Import
∑ Material use
Panel industry
Pulp industry
Processed wood fuel industry
Production / Removals
Private households
Undifferentiated energy use
Export
Apparent consumption
Sum
Source: MCPFE/UNECE/FAO
France: Net annual increment (million m³ over bark):
∑ Energy use
Balance1 700
0%
10%
20%
30%
40%
50%
60%
70%
80%
90%
100%
Wood supply(1.000 m³):
∑ Woody biomass forest & outside
∑ Co-products
∑ Recovered wood
∑ Processed wood fuel
Wood use(1.000 m³):
∑ Energy use
∑ Material use
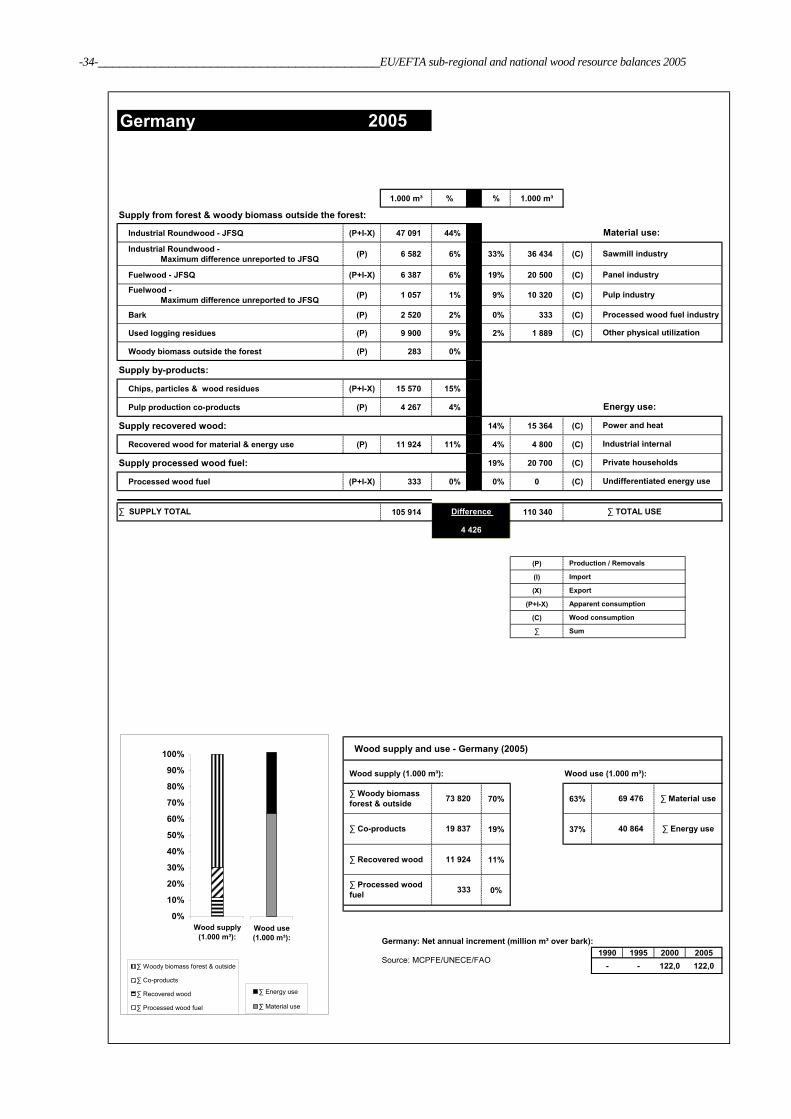
-34-________________________________________EU/EFTA sub-regional and national wood resource balances 2005
Germany
Germany
1.000 m³ % % 1.000 m³
Industrial Roundwood - JFSQ (P+I-X) 47 091 44%
Industrial Roundwood - Maximum difference unreported to JFSQ (P) 6 582 6% 33% 36 434 (C)
Fuelwood - JFSQ (P+I-X) 6 387 6% 19% 20 500 (C)
Fuelwood - Maximum difference unreported to JFSQ (P) 1 057 1% 9% 10 320 (C)
Bark (P) 2 520 2% 0% 333 (C)
Used logging residues (P) 9 900 9% 2% 1 889 (C)
Woody biomass outside the forest (P) 283 0%
Supply by-products:
Chips, particles & wood residues (P+I-X) 15 570 15%
Pulp production co-products (P) 4 267 4%
Supply recovered wood: 14% 15 364 (C)
Recovered wood for material & energy use (P) 11 924 11% 4% 4 800 (C)
Supply processed wood fuel: 19% 20 700 (C)
Processed wood fuel (P+I-X) 333 0% 0% 0 (C)
105 914 110 340
(P)
(I)
(X)
(P+I-X)
(C)
∑
Wood supply and use - Germany (2005)
70% 63%
19% 37%
11% 0%
0%
0%
1990 1995 2000 2005- - 122,0 122,0
- harvesting losses ( ? %) #WERT! - -10 -10
- unused roundwood ( ? %)#WERT! - -15 -15
Potential roundwood supply from forest #WERT! - -10 -10#WERT! - 88 88
Supply from forest & woody biomass outside the forest:
40 864
0
333
69 476∑ Woody biomass forest & outside
Wood supply (1.000 m³): Wood use (1.000 m³):
73 820
19 837
2005
∑ SUPPLY TOTAL
Other physical utilization
∑ TOTAL USE
Material use:
Energy use:
Power and heat
Industrial internal
Sawmill industry
4 426
Difference
∑ Co-products
∑ Recovered wood
∑ Processed wood fuel
Wood consumption
0
Import
∑ Material use
Panel industry
Pulp industry
Processed wood fuel industry
Production / Removals
Private households
Undifferentiated energy use
Export
Apparent consumption
Sum
Source: MCPFE/UNECE/FAO
Germany: Net annual increment (million m³ over bark):
∑ Energy use
Balance11 924
0%
10%
20%
30%
40%
50%
60%
70%
80%
90%
100%
Wood supply(1.000 m³):
∑ Woody biomass forest & outside
∑ Co-products
∑ Recovered wood
∑ Processed wood fuel
Wood use(1.000 m³):
∑ Energy use
∑ Material use

EU/EFTA sub-regional and national wood resource balances 2005___________________________________________________35
Greece
Greece
1.000 m³ % % 1.000 m³
Industrial Roundwood - JFSQ (P+I-X) 637 29%
Industrial Roundwood - Maximum difference unreported to JFSQ (P) 5% 306 (C)
Fuelwood - JFSQ (P+I-X) 1 034 47% 14% 870 (C)
Fuelwood - Maximum difference unreported to JFSQ (P) (C)
Bark (P) (C)
Used logging residues (P) (C)
Woody biomass outside the forest (P)
Supply by-products:
Chips, particles & wood residues (P+I-X) 518 24%
Pulp production co-products (P)
Supply recovered wood: (C)
Recovered wood for material & energy use (P) (C)
Supply processed wood fuel: (C)
Processed wood fuel (P+I-X) 81% 4 961 (C)
2 188 6 137
(P)
(I)
(X)
(P+I-X)
(C)
∑
Wood supply and use - Greece (2005)
76% 19%
24% 81%
0%
0%
1990 1995 2000 20053,8 - - -
- harvesting losses ( ? %) 0 - #WERT! #WERT!
- unused roundwood ( ? %)0 - #WERT! #WERT!
Potential roundwood supply from forest 0 - #WERT! #WERT!3 - #WERT! #WERT!
Supply from forest & woody biomass outside the forest:
4 961
0
1 176∑ Woody biomass forest & outside
Wood supply (1.000 m³): Wood use (1.000 m³):
1 671
518
2005
∑ SUPPLY TOTAL
Other physical utilization
∑ TOTAL USE
Material use:
Energy use:
Power and heat
Industrial internal
Sawmill industry
3 949
Difference
∑ Co-products
∑ Recovered wood
∑ Processed wood fuel
Wood consumption
0
Import
∑ Material use
Panel industry
Pulp industry
Processed wood fuel industry
Production / Removals
Private households
Undifferentiated energy use
Export
Apparent consumption
Sum
Source: MCPFE/UNECE/FAO
Greece: Net annual increment (million m³ over bark):
∑ Energy use
Balance
0%
10%
20%
30%
40%
50%
60%
70%
80%
90%
100%
Wood supply(1.000 m³):
∑ Woody biomass forest & outside
∑ Co-products
∑ Recovered wood
∑ Processed wood fuel
Wood use(1.000 m³):
∑ Energy use
∑ Material use

-36-________________________________________EU/EFTA sub-regional and national wood resource balances 2005
Hungary
Hungary
1.000 m³ % % 1.000 m³
Industrial Roundwood - JFSQ (P+I-X) 2 170 33%
Industrial Roundwood - Maximum difference unreported to JFSQ (P) 646 10% 5% 344 (C)
Fuelwood - JFSQ (P+I-X) 3 003 46% 12% 804 (C)
Fuelwood - Maximum difference unreported to JFSQ (P) (C)
Bark (P) (C)
Used logging residues (P) (C)
Woody biomass outside the forest (P)
Supply by-products:
Chips, particles & wood residues (P+I-X) 652 10%
Pulp production co-products (P)
Supply recovered wood: (C)
Recovered wood for material & energy use (P) 19 0% (C)
Supply processed wood fuel: (C)
Processed wood fuel (P+I-X) 83% 5 765 (C)
6 490 6 913
(P)
(I)
(X)
(P+I-X)
(C)
∑
Wood supply and use - Hungary (2005)
90% 17%
10% 83%
0% 0%
0%
1990 1995 2000 200511,0 - 11,7 12,9
- harvesting losses ( ? %) -1 - -1 -1
- unused roundwood ( ? %)-1 - -1 -2
Potential roundwood supply from forest -1 - -1 -18 - 8 9
Supply from forest & woody biomass outside the forest:
5 765
0
1 148∑ Woody biomass forest & outside
Wood supply (1.000 m³): Wood use (1.000 m³):
5 819
652
2005
∑ SUPPLY TOTAL
Other physical utilization
∑ TOTAL USE
Material use:
Energy use:
Power and heat
Industrial internal
Sawmill industry
423
Difference
∑ Co-products
∑ Recovered wood
∑ Processed wood fuel
Wood consumption
0
Import
∑ Material use
Panel industry
Pulp industry
Processed wood fuel industry
Production / Removals
Private households
Undifferentiated energy use
Export
Apparent consumption
Sum
Source: MCPFE/UNECE/FAO
Hungary: Net annual increment (million m³ over bark):
∑ Energy use
Balance19
0%
10%
20%
30%
40%
50%
60%
70%
80%
90%
100%
Wood supply(1.000 m³):
∑ Woody biomass forest & outside
∑ Co-products
∑ Recovered wood
∑ Processed wood fuel
Wood use(1.000 m³):
∑ Energy use
∑ Material use
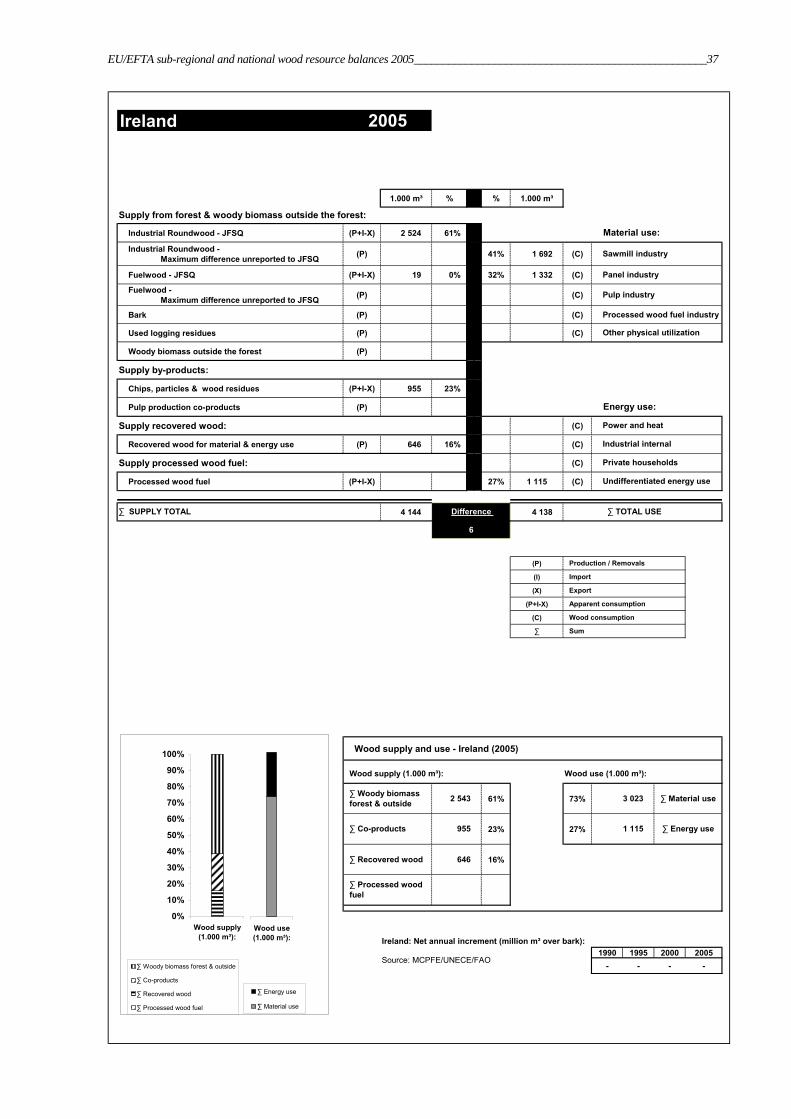
EU/EFTA sub-regional and national wood resource balances 2005___________________________________________________37
Ireland
Ireland
1.000 m³ % % 1.000 m³
Industrial Roundwood - JFSQ (P+I-X) 2 524 61%
Industrial Roundwood - Maximum difference unreported to JFSQ (P) 41% 1 692 (C)
Fuelwood - JFSQ (P+I-X) 19 0% 32% 1 332 (C)
Fuelwood - Maximum difference unreported to JFSQ (P) (C)
Bark (P) (C)
Used logging residues (P) (C)
Woody biomass outside the forest (P)
Supply by-products:
Chips, particles & wood residues (P+I-X) 955 23%
Pulp production co-products (P)
Supply recovered wood: (C)
Recovered wood for material & energy use (P) 646 16% (C)
Supply processed wood fuel: (C)
Processed wood fuel (P+I-X) 27% 1 115 (C)
4 144 4 138
(P)
(I)
(X)
(P+I-X)
(C)
∑
Wood supply and use - Ireland (2005)
61% 73%
23% 27%
16% 0%
0%
1990 1995 2000 2005- - - -
- harvesting losses ( ? %) #WERT! - #WERT! #WERT!
- unused roundwood ( ? %)#WERT! - #WERT! #WERT!
Potential roundwood supply from forest #WERT! - #WERT! #WERT!#WERT! - #WERT! #WERT!
Supply from forest & woody biomass outside the forest:
1 115
0
3 023∑ Woody biomass forest & outside
Wood supply (1.000 m³): Wood use (1.000 m³):
2 543
955
2005
∑ SUPPLY TOTAL
Other physical utilization
∑ TOTAL USE
Material use:
Energy use:
Power and heat
Industrial internal
Sawmill industry
6
Difference
∑ Co-products
∑ Recovered wood
∑ Processed wood fuel
Wood consumption
0
Import
∑ Material use
Panel industry
Pulp industry
Processed wood fuel industry
Production / Removals
Private households
Undifferentiated energy use
Export
Apparent consumption
Sum
Source: MCPFE/UNECE/FAO
Ireland: Net annual increment (million m³ over bark):
∑ Energy use
Balance646
0%
10%
20%
30%
40%
50%
60%
70%
80%
90%
100%
Wood supply(1.000 m³):
∑ Woody biomass forest & outside
∑ Co-products
∑ Recovered wood
∑ Processed wood fuel
Wood use(1.000 m³):
∑ Energy use
∑ Material use

-38-________________________________________EU/EFTA sub-regional and national wood resource balances 2005
Italy
Italy
1.000 m³ % % 1.000 m³
Industrial Roundwood - JFSQ (P+I-X) 7 758 28%
Industrial Roundwood - Maximum difference unreported to JFSQ (P) 5 032 18% 12% 2 567 (C)
Fuelwood - JFSQ (P+I-X) 6 538 24% 37% 7 882 (C)
Fuelwood - Maximum difference unreported to JFSQ (P) 6% 1 255 (C)
Bark (P) 1% 283 (C)
Used logging residues (P) (C)
Woody biomass outside the forest (P)
Supply by-products:
Chips, particles & wood residues (P+I-X) 4 784 17%
Pulp production co-products (P) 240 1%
Supply recovered wood: (C)
Recovered wood for material & energy use (P) 2 963 11% (C)
Supply processed wood fuel: (C)
Processed wood fuel (P+I-X) 383 1% 44% 9 279 (C)
27 698 21 266
(P)
(I)
(X)
(P+I-X)
(C)
∑
Wood supply and use - Italy (2005)
70% 56%
18% 44%
11% 0%
1%
0%
1990 1995 2000 200526,3 - 31,8 38,3
- harvesting losses ( ? %) -2 - -3 -3
- unused roundwood ( ? %)-3 - -4 -5
Potential roundwood supply from forest -2 - -3 -319 - 23 28
Supply from forest & woody biomass outside the forest:
9 279
0
383
11 987∑ Woody biomass forest & outside
Wood supply (1.000 m³): Wood use (1.000 m³):
19 327
5 024
2005
∑ SUPPLY TOTAL
Other physical utilization
∑ TOTAL USE
Material use:
Energy use:
Power and heat
Industrial internal
Sawmill industry
6 432
Difference
∑ Co-products
∑ Recovered wood
∑ Processed wood fuel
Wood consumption
0
Import
∑ Material use
Panel industry
Pulp industry
Processed wood fuel industry
Production / Removals
Private households
Undifferentiated energy use
Export
Apparent consumption
Sum
Source: MCPFE/UNECE/FAO
Italy: Net annual increment (million m³ over bark):
∑ Energy use
Balance2 963
0%
10%
20%
30%
40%
50%
60%
70%
80%
90%
100%
Wood supply(1.000 m³):
∑ Woody biomass forest & outside
∑ Co-products
∑ Recovered wood
∑ Processed wood fuel
Wood use(1.000 m³):
∑ Energy use
∑ Material use

EU/EFTA sub-regional and national wood resource balances 2005___________________________________________________39
Latvia
Latvia
1.000 m³ % % 1.000 m³
Industrial Roundwood - JFSQ (P+I-X) 9 056 77%
Industrial Roundwood - Maximum difference unreported to JFSQ (P) 38% 6 940 (C)
Fuelwood - JFSQ (P+I-X) 608 5% 4% 798 (C)
Fuelwood - Maximum difference unreported to JFSQ (P) (C)
Bark (P) (C)
Used logging residues (P) (C)
Woody biomass outside the forest (P)
Supply by-products:
Chips, particles & wood residues (P+I-X) 2 109 18%
Pulp production co-products (P)
Supply recovered wood: (C)
Recovered wood for material & energy use (P) (C)
Supply processed wood fuel: (C)
Processed wood fuel (P+I-X) 57% 10 301 (C)
11 772 18 039
(P)
(I)
(X)
(P+I-X)
(C)
∑
Wood supply and use - Latvia (2005)
82% 43%
18% 57%
0%
0%
1990 1995 2000 200516,5 - 16,5 16,5
- harvesting losses ( ? %) -1 - -1 -1
- unused roundwood ( ? %)-2 - -2 -2
Potential roundwood supply from forest -1 - -1 -112 - 12 12
Supply from forest & woody biomass outside the forest:
10 301
0
7 738∑ Woody biomass forest & outside
Wood supply (1.000 m³): Wood use (1.000 m³):
9 664
2 109
2005
∑ SUPPLY TOTAL
Other physical utilization
∑ TOTAL USE
Material use:
Energy use:
Power and heat
Industrial internal
Sawmill industry
6 266
Difference
∑ Co-products
∑ Recovered wood
∑ Processed wood fuel
Wood consumption
0
Import
∑ Material use
Panel industry
Pulp industry
Processed wood fuel industry
Production / Removals
Private households
Undifferentiated energy use
Export
Apparent consumption
Sum
Source: MCPFE/UNECE/FAO
Latvia: Net annual increment (million m³ over bark):
∑ Energy use
Balance
0%
10%
20%
30%
40%
50%
60%
70%
80%
90%
100%
Wood supply(1.000 m³):
∑ Woody biomass forest & outside
∑ Co-products
∑ Recovered wood
∑ Processed wood fuel
Wood use(1.000 m³):
∑ Energy use
∑ Material use

-40-________________________________________EU/EFTA sub-regional and national wood resource balances 2005
Liechtenstein
Liechtenstein
1.000 m³ % % 1.000 m³
Industrial Roundwood - JFSQ (P+I-X) 18 #DIV/0!
Industrial Roundwood - Maximum difference unreported to JFSQ (P) 3 #DIV/0! (C)
Fuelwood - JFSQ (P+I-X) 8 #DIV/0! (C)
Fuelwood - Maximum difference unreported to JFSQ (P) ##### #DIV/0! (C)
Bark (P) (C)
Used logging residues (P) (C)
Woody biomass outside the forest (P)
Supply by-products:
Chips, particles & wood residues (P+I-X)
Pulp production co-products (P) #DIV/0! #DIV/0!
Supply recovered wood: (C)
Recovered wood for material & energy use (P) (C)
Supply processed wood fuel: (C)
Processed wood fuel (P+I-X) ##### 0 (C)
#DIV/0! #DIV/0!
(P)
(I)
(X)
(P+I-X)
(C)
∑
Wood supply and use - Liechtenstein (2005)
##### #####
##### #####
##### ######
#####
#DIV/0!
1990 1995 2000 20050,0 - 0,0 -
- harvesting losses ( ? %) 0 - 0 #WERT!
- unused roundwood ( ? %)0 - 0 #WERT!
Potential roundwood supply from forest 0 - 0 #WERT!0 - 0 #WERT!
Supply from forest & woody biomass outside the forest:
0
0
#DIV/0!∑ Woody biomass forest & outside
Wood supply (1.000 m³): Wood use (1.000 m³):
29
#DIV/0!
2005
∑ SUPPLY TOTAL
Other physical utilization
∑ TOTAL USE
Material use:
Energy use:
Power and heat
Industrial internal
Sawmill industry
#DIV/0!
Difference
∑ Co-products
∑ Recovered wood
∑ Processed wood fuel
Wood consumption
0
Import
∑ Material use
Panel industry
Pulp industry
Processed wood fuel industry
Production / Removals
Private households
Undifferentiated energy use
Export
Apparent consumption
Sum
Source: MCPFE/UNECE/FAO
Liechtenstein: Net annual increment (million m³ over bark):
∑ Energy use
Balance
0,00%
0,10%
0,20%
0,30%
0,40%
0,50%
0,60%
0,70%
0,80%
0,90%
1,00%
Wood supply(1.000 m³):
∑ Woody biomass forest & outside
∑ Co-products
∑ Recovered wood
∑ Processed wood fuel
Wood use(1.000 m³):
∑ Energy use
∑ Material use

EU/EFTA sub-regional and national wood resource balances 2005___________________________________________________41
Lithuania
Lithuania
1.000 m³ % % 1.000 m³
Industrial Roundwood - JFSQ (P+I-X) 4 043 48%
Industrial Roundwood - Maximum difference unreported to JFSQ (P) 37% 3 000 (C)
Fuelwood - JFSQ (P+I-X) 1 118 13% 7% 586 (C)
Fuelwood - Maximum difference unreported to JFSQ (P) 298 4% (C)
Bark (P) 704 8% 4% 352 (C)
Used logging residues (P) 65 1% 6% 494 (C)
Woody biomass outside the forest (P)
Supply by-products:
Chips, particles & wood residues (P+I-X) 2 027 24%
Pulp production co-products (P)
Supply recovered wood: 10% 775 (C)
Recovered wood for material & energy use (P) 5% 422 (C)
Supply processed wood fuel: 25% 2 012 (C)
Processed wood fuel (P+I-X) 141 2% 6% 458 (C)
8 396 8 098
(P)
(I)
(X)
(P+I-X)
(C)
∑
Wood supply and use - Lithuania (2005)
74% 55%
24% 45%
0%
2%
0%
1990 1995 2000 2005- - 9,0 9,9
- harvesting losses ( ? %) #WERT! - -1 -1
- unused roundwood ( ? %)#WERT! - -1 -1
Potential roundwood supply from forest #WERT! - -1 -1#WERT! - 6 7
Supply from forest & woody biomass outside the forest:
3 666
0
141
4 432∑ Woody biomass forest & outside
Wood supply (1.000 m³): Wood use (1.000 m³):
6 227
2 027
2005
∑ SUPPLY TOTAL
Other physical utilization
∑ TOTAL USE
Material use:
Energy use:
Power and heat
Industrial internal
Sawmill industry
297
Difference
∑ Co-products
∑ Recovered wood
∑ Processed wood fuel
Wood consumption
0
Import
∑ Material use
Panel industry
Pulp industry
Processed wood fuel industry
Production / Removals
Private households
Undifferentiated energy use
Export
Apparent consumption
Sum
Source: MCPFE/UNECE/FAO
Lithuania: Net annual increment (million m³ over bark):
∑ Energy use
Balance
0%
10%
20%
30%
40%
50%
60%
70%
80%
90%
100%
Wood supply(1.000 m³):
∑ Woody biomass forest & outside
∑ Co-products
∑ Recovered wood
∑ Processed wood fuel
Wood use(1.000 m³):
∑ Energy use
∑ Material use

-42-________________________________________EU/EFTA sub-regional and national wood resource balances 2005
Luxembourg
Luxembourg
1.000 m³ % % 1.000 m³
Industrial Roundwood - JFSQ (P+I-X) 350 61%
Industrial Roundwood - Maximum difference unreported to JFSQ (P) 12 2% 56% 899 (C)
Fuelwood - JFSQ (P+I-X) 44% 709 (C)
Fuelwood - Maximum difference unreported to JFSQ (P) (C)
Bark (P) (C)
Used logging residues (P) (C)
Woody biomass outside the forest (P)
Supply by-products:
Chips, particles & wood residues (P+I-X) 216 37%
Pulp production co-products (P)
Supply recovered wood: (C)
Recovered wood for material & energy use (P) (C)
Supply processed wood fuel: (C)
Processed wood fuel (P+I-X) (C)
578 1 608
(P)
(I)
(X)
(P+I-X)
(C)
∑
Wood supply and use - Luxembourg (2005)
63% 100%
37%
0%
0%
1990 1995 2000 20050,7 - 0,7 0,7
- harvesting losses ( ? %) 0 - 0 0
- unused roundwood ( ? %)0 - 0 0
Potential roundwood supply from forest 0 - 0 00 - 0 0
Supply from forest & woody biomass outside the forest:
0
0
1 608∑ Woody biomass forest & outside
Wood supply (1.000 m³): Wood use (1.000 m³):
363
216
2005
∑ SUPPLY TOTAL
Other physical utilization
∑ TOTAL USE
Material use:
Energy use:
Power and heat
Industrial internal
Sawmill industry
1 030
Difference
∑ Co-products
∑ Recovered wood
∑ Processed wood fuel
Wood consumption
0
Import
∑ Material use
Panel industry
Pulp industry
Processed wood fuel industry
Production / Removals
Private households
Undifferentiated energy use
Export
Apparent consumption
Sum
Source: MCPFE/UNECE/FAO
Luxembourg: Net annual increment (million m³ over bark):
∑ Energy use
Balance
0%
10%
20%
30%
40%
50%
60%
70%
80%
90%
100%
Wood supply(1.000 m³):
∑ Woody biomass forest & outside
∑ Co-products
∑ Recovered wood
∑ Processed wood fuel
Wood use(1.000 m³):
∑ Energy use
∑ Material use

EU/EFTA sub-regional and national wood resource balances 2005___________________________________________________43
Malta
Malta
1.000 m³ % % 1.000 m³
Industrial Roundwood - JFSQ (P+I-X)
Industrial Roundwood - Maximum difference unreported to JFSQ (P) (C)
Fuelwood - JFSQ (P+I-X) (C)
Fuelwood - Maximum difference unreported to JFSQ (P) (C)
Bark (P) (C)
Used logging residues (P) (C)
Woody biomass outside the forest (P)
Supply by-products:
Chips, particles & wood residues (P+I-X)
Pulp production co-products (P)
Supply recovered wood: (C)
Recovered wood for material & energy use (P) (C)
Supply processed wood fuel: (C)
Processed wood fuel (P+I-X) (C)
0 0
(P)
(I)
(X)
(P+I-X)
(C)
∑
Wood supply and use - Malta (2005)
##### #####
##### #####
##### ######
#####
#DIV/0!
1990 1995 2000 2005- - - -
- harvesting losses ( ? %) #WERT! - #WERT! #WERT!
- unused roundwood ( ? %)#WERT! - #WERT! #WERT!
Potential roundwood supply from forest #WERT! - #WERT! #WERT!#WERT! - #WERT! #WERT!
Supply from forest & woody biomass outside the forest:
0
0
0∑ Woody biomass forest & outside
Wood supply (1.000 m³): Wood use (1.000 m³):
2005
∑ SUPPLY TOTAL
Other physical utilization
∑ TOTAL USE
Material use:
Energy use:
Power and heat
Industrial internal
Sawmill industry
0
Difference
∑ Co-products
∑ Recovered wood
∑ Processed wood fuel
Wood consumption
0
Import
∑ Material use
Panel industry
Pulp industry
Processed wood fuel industry
Production / Removals
Private households
Undifferentiated energy use
Export
Apparent consumption
Sum
Source: MCPFE/UNECE/FAO
Malta: Net annual increment (million m³ over bark):
∑ Energy use
Balance
0,00%
0,10%
0,20%
0,30%
0,40%
0,50%
0,60%
0,70%
0,80%
0,90%
1,00%
Wood supply(1.000 m³):
∑ Woody biomass forest & outside
∑ Co-products
∑ Recovered wood
∑ Processed wood fuel
Wood use(1.000 m³):
∑ Energy use
∑ Material use

-44-________________________________________EU/EFTA sub-regional and national wood resource balances 2005
Netherlands
Netherlands
1.000 m³ % % 1.000 m³
Industrial Roundwood - JFSQ (P+I-X) 750 16%
Industrial Roundwood - Maximum difference unreported to JFSQ (P) 6% 475 (C)
Fuelwood - JFSQ (P+I-X) 263 6% 0% 22 (C)
Fuelwood - Maximum difference unreported to JFSQ (P) 6% 463 (C)
Bark (P) 125 3% 2% 180 (C)
Used logging residues (P) 9% 714 (C)
Woody biomass outside the forest (P)
Supply by-products:
Chips, particles & wood residues (P+I-X) 1 928 40%
Pulp production co-products (P) 226 5%
Supply recovered wood: 18% 1 400 (C)
Recovered wood for material & energy use (P) 600 13% 2% 150 (C)
Supply processed wood fuel: 5% 412 (C)
Processed wood fuel (P+I-X) 880 18% 51% 3 958 (C)
4 772 7 774
(P)
(I)
(X)
(P+I-X)
(C)
∑
Wood supply and use - Netherlands (2005)
24% 24%
45% 76%
13% 0%
18%
0%
1990 1995 2000 20052,2 - 2,2 2,2
- harvesting losses ( ? %) 0 - 0 0
- unused roundwood ( ? %)0 - 0 0
Potential roundwood supply from forest 0 - 0 02 - 2 2
Supply from forest & woody biomass outside the forest:
5 920
0
880
1 854∑ Woody biomass forest & outside
Wood supply (1.000 m³): Wood use (1.000 m³):
1 139
2 154
2005
∑ SUPPLY TOTAL
Other physical utilization
∑ TOTAL USE
Material use:
Energy use:
Power and heat
Industrial internal
Sawmill industry
3 002
Difference
∑ Co-products
∑ Recovered wood
∑ Processed wood fuel
Wood consumption
0
Import
∑ Material use
Panel industry
Pulp industry
Processed wood fuel industry
Production / Removals
Private households
Undifferentiated energy use
Export
Apparent consumption
Sum
Source: MCPFE/UNECE/FAO
Netherlands: Net annual increment (million m³ over bark):
∑ Energy use
Balance600
0%
10%
20%
30%
40%
50%
60%
70%
80%
90%
100%
Wood supply(1.000 m³):
∑ Woody biomass forest & outside
∑ Co-products
∑ Recovered wood
∑ Processed wood fuel
Wood use(1.000 m³):
∑ Energy use
∑ Material use

EU/EFTA sub-regional and national wood resource balances 2005___________________________________________________45
Norway
Norway
1.000 m³ % % 1.000 m³
Industrial Roundwood - JFSQ (P+I-X) 11 111 56%
Industrial Roundwood - Maximum difference unreported to JFSQ (P) 27% 5 139 (C)
Fuelwood - JFSQ (P+I-X) 1 287 7% 4% 823 (C)
Fuelwood - Maximum difference unreported to JFSQ (P) 1 753 9% 37% 7 167 (C)
Bark (P) 0% 71 (C)
Used logging residues (P) 2% 336 (C)
Woody biomass outside the forest (P)
Supply by-products:
Chips, particles & wood residues (P+I-X) 3 193 16%
Pulp production co-products (P) 2 016 10%
Supply recovered wood: 3% 595 (C)
Recovered wood for material & energy use (P) 369 2% 10% 2 011 (C)
Supply processed wood fuel: 16% 3 167 (C)
Processed wood fuel (P+I-X) 41 0% 0% 0 (C)
19 770 19 308
(P)
(I)
(X)
(P+I-X)
(C)
∑
Wood supply and use - Norway (2005)
72% 70%
26% 30%
2% 0%
0%
0%
1990 1995 2000 200520,1 - 22,7 24,0
- harvesting losses ( ? %) -2 - -2 -2
- unused roundwood ( ? %)-2 - -3 -3
Potential roundwood supply from forest -2 - -2 -214 - 16 17
Supply from forest & woody biomass outside the forest:
5 773
0
41
13 535∑ Woody biomass forest & outside
Wood supply (1.000 m³): Wood use (1.000 m³):
14 151
5 209
2005
∑ SUPPLY TOTAL
Other physical utilization
∑ TOTAL USE
Material use:
Energy use:
Power and heat
Industrial internal
Sawmill industry
462
Difference
∑ Co-products
∑ Recovered wood
∑ Processed wood fuel
Wood consumption
0
Import
∑ Material use
Panel industry
Pulp industry
Processed wood fuel industry
Production / Removals
Private households
Undifferentiated energy use
Export
Apparent consumption
Sum
Source: MCPFE/UNECE/FAO
Norway: Net annual increment (million m³ over bark):
∑ Energy use
Balance369
0%
10%
20%
30%
40%
50%
60%
70%
80%
90%
100%
Wood supply(1.000 m³):
∑ Woody biomass forest & outside
∑ Co-products
∑ Recovered wood
∑ Processed wood fuel
Wood use(1.000 m³):
∑ Energy use
∑ Material use

-46-________________________________________EU/EFTA sub-regional and national wood resource balances 2005
Poland
Poland
1.000 m³ % % 1.000 m³
Industrial Roundwood - JFSQ (P+I-X) 29 982 57%
Industrial Roundwood - Maximum difference unreported to JFSQ (P) 1 194 2% 32% 17 500 (C)
Fuelwood - JFSQ (P+I-X) 3 404 7% 18% 9 837 (C)
Fuelwood - Maximum difference unreported to JFSQ (P) 7% 3 847 (C)
Bark (P) 1 400 3% 1% 333 (C)
Used logging residues (P) 227 0% 2% 987 (C)
Woody biomass outside the forest (P) 636 1%
Supply by-products:
Chips, particles & wood residues (P+I-X) 7 210 14%
Pulp production co-products (P) 1 888 4%
Supply recovered wood: 5% 2 885 (C)
Recovered wood for material & energy use (P) 6 270 12% 9% 4 800 (C)
Supply processed wood fuel: 1% 525 (C)
Processed wood fuel (P+I-X) 17 0% 26% 14 076 (C)
52 227 54 790
(P)
(I)
(X)
(P+I-X)
(C)
∑
Wood supply and use - Poland (2005)
71% 59%
17% 41%
12% 0%
0%
0%
1990 1995 2000 2005- - - 67,6
- harvesting losses ( ? %) #WERT! - #WERT! -5
- unused roundwood ( ? %)#WERT! - #WERT! -8
Potential roundwood supply from forest #WERT! - #WERT! -5#WERT! - #WERT! 49
Supply from forest & woody biomass outside the forest:
22 286
0
17
32 504∑ Woody biomass forest & outside
Wood supply (1.000 m³): Wood use (1.000 m³):
36 842
9 098
2005
∑ SUPPLY TOTAL
Other physical utilization
∑ TOTAL USE
Material use:
Energy use:
Power and heat
Industrial internal
Sawmill industry
2 563
Difference
∑ Co-products
∑ Recovered wood
∑ Processed wood fuel
Wood consumption
0
Import
∑ Material use
Panel industry
Pulp industry
Processed wood fuel industry
Production / Removals
Private households
Undifferentiated energy use
Export
Apparent consumption
Sum
Source: MCPFE/UNECE/FAO
Poland: Net annual increment (million m³ over bark):
∑ Energy use
Balance6 270
0%
10%
20%
30%
40%
50%
60%
70%
80%
90%
100%
Wood supply(1.000 m³):
∑ Woody biomass forest & outside
∑ Co-products
∑ Recovered wood
∑ Processed wood fuel
Wood use(1.000 m³):
∑ Energy use
∑ Material use

EU/EFTA sub-regional and national wood resource balances 2005___________________________________________________47
Portugal
Portugal
1.000 m³ % % 1.000 m³
Industrial Roundwood - JFSQ (P+I-X) 9 234 64%
Industrial Roundwood - Maximum difference unreported to JFSQ (P) 7% 1 673 (C)
Fuelwood - JFSQ (P+I-X) 595 4% 8% 1 793 (C)
Fuelwood - Maximum difference unreported to JFSQ (P) 25% 5 881 (C)
Bark (P) (C)
Used logging residues (P) (C)
Woody biomass outside the forest (P)
Supply by-products:
Chips, particles & wood residues (P+I-X) 1 685 12%
Pulp production co-products (P) 2 749 19%
Supply recovered wood: (C)
Recovered wood for material & energy use (P) 61 0% (C)
Supply processed wood fuel: (C)
Processed wood fuel (P+I-X) 60% 14 075 (C)
14 325 23 421
(P)
(I)
(X)
(P+I-X)
(C)
∑
Wood supply and use - Portugal (2005)
69% 40%
31% 60%
0% 0%
0%
1990 1995 2000 2005- - 12,9 -
- harvesting losses ( ? %) #WERT! - -1 #WERT!
- unused roundwood ( ? %)#WERT! - -2 #WERT!
Potential roundwood supply from forest #WERT! - -1 #WERT!#WERT! - 9 #WERT!
Supply from forest & woody biomass outside the forest:
14 075
0
9 347∑ Woody biomass forest & outside
Wood supply (1.000 m³): Wood use (1.000 m³):
9 829
4 434
2005
∑ SUPPLY TOTAL
Other physical utilization
∑ TOTAL USE
Material use:
Energy use:
Power and heat
Industrial internal
Sawmill industry
9 097
Difference
∑ Co-products
∑ Recovered wood
∑ Processed wood fuel
Wood consumption
0
Import
∑ Material use
Panel industry
Pulp industry
Processed wood fuel industry
Production / Removals
Private households
Undifferentiated energy use
Export
Apparent consumption
Sum
Source: MCPFE/UNECE/FAO
Portugal: Net annual increment (million m³ over bark):
∑ Energy use
Balance61
0%
10%
20%
30%
40%
50%
60%
70%
80%
90%
100%
Wood supply(1.000 m³):
∑ Woody biomass forest & outside
∑ Co-products
∑ Recovered wood
∑ Processed wood fuel
Wood use(1.000 m³):
∑ Energy use
∑ Material use

-48-________________________________________EU/EFTA sub-regional and national wood resource balances 2005
Romania
Romania
1.000 m³ % % 1.000 m³
Industrial Roundwood - JFSQ (P+I-X) 11 787 66%
Industrial Roundwood - Maximum difference unreported to JFSQ (P) 241 1% 27% 7 021 (C)
Fuelwood - JFSQ (P+I-X) 2 662 15% 6% 1 629 (C)
Fuelwood - Maximum difference unreported to JFSQ (P) 2% 565 (C)
Bark (P) 869 5% (C)
Used logging residues (P) (C)
Woody biomass outside the forest (P)
Supply by-products:
Chips, particles & wood residues (P+I-X) 1 920 11%
Pulp production co-products (P) 294 2%
Supply recovered wood: (C)
Recovered wood for material & energy use (P) (C)
Supply processed wood fuel: (C)
Processed wood fuel (P+I-X) 64% 16 739 (C)
17 773 25 954
(P)
(I)
(X)
(P+I-X)
(C)
∑
Wood supply and use - Romania (2005)
88% 36%
12% 64%
0%
0%
1990 1995 2000 200532,1 - 34,6 34,6
- harvesting losses ( ? %) -3 - -3 -3
- unused roundwood ( ? %)-4 - -4 -4
Potential roundwood supply from forest -3 - -3 -323 - 25 25
Supply from forest & woody biomass outside the forest:
16 739
0
9 215∑ Woody biomass forest & outside
Wood supply (1.000 m³): Wood use (1.000 m³):
15 559
2 214
2005
∑ SUPPLY TOTAL
Other physical utilization
∑ TOTAL USE
Material use:
Energy use:
Power and heat
Industrial internal
Sawmill industry
8 181
Difference
∑ Co-products
∑ Recovered wood
∑ Processed wood fuel
Wood consumption
0
Import
∑ Material use
Panel industry
Pulp industry
Processed wood fuel industry
Production / Removals
Private households
Undifferentiated energy use
Export
Apparent consumption
Sum
Source: MCPFE/UNECE/FAO
Romania: Net annual increment (million m³ over bark):
∑ Energy use
Balance
0%
10%
20%
30%
40%
50%
60%
70%
80%
90%
100%
Wood supply(1.000 m³):
∑ Woody biomass forest & outside
∑ Co-products
∑ Recovered wood
∑ Processed wood fuel
Wood use(1.000 m³):
∑ Energy use
∑ Material use

EU/EFTA sub-regional and national wood resource balances 2005___________________________________________________49
Slovakia
Slovakia
1.000 m³ % % 1.000 m³
Industrial Roundwood - JFSQ (P+I-X) 7 369 71%
Industrial Roundwood - Maximum difference unreported to JFSQ (P) 43% 4 302 (C)
Fuelwood - JFSQ (P+I-X) 178 2% 14% 1 381 (C)
Fuelwood - Maximum difference unreported to JFSQ (P) 26% 2 593 (C)
Bark (P) 150 1% 0% 40 (C)
Used logging residues (P) 10 0% (C)
Woody biomass outside the forest (P) 30 0%
Supply by-products:
Chips, particles & wood residues (P+I-X) 2 055 20%
Pulp production co-products (P) 470 5%
Supply recovered wood: (C)
Recovered wood for material & energy use (P) 50 0% (C)
Supply processed wood fuel: (C)
Processed wood fuel (P+I-X) 17% 1 760 (C)
10 313 10 076
(P)
(I)
(X)
(P+I-X)
(C)
∑
Wood supply and use - Slovakia (2005)
75% 83%
24% 17%
0% 0%
0%
1990 1995 2000 200510,2 - 11,7 12,0
- harvesting losses ( ? %) -1 - -1 -1
- unused roundwood ( ? %)-1 - -1 -1
Potential roundwood supply from forest -1 - -1 -17 - 8 9
Supply from forest & woody biomass outside the forest:
1 760
0
8 316∑ Woody biomass forest & outside
Wood supply (1.000 m³): Wood use (1.000 m³):
7 737
2 526
2005
∑ SUPPLY TOTAL
Other physical utilization
∑ TOTAL USE
Material use:
Energy use:
Power and heat
Industrial internal
Sawmill industry
237
Difference
∑ Co-products
∑ Recovered wood
∑ Processed wood fuel
Wood consumption
0
Import
∑ Material use
Panel industry
Pulp industry
Processed wood fuel industry
Production / Removals
Private households
Undifferentiated energy use
Export
Apparent consumption
Sum
Source: MCPFE/UNECE/FAO
Slovakia: Net annual increment (million m³ over bark):
∑ Energy use
Balance50
0%
10%
20%
30%
40%
50%
60%
70%
80%
90%
100%
Wood supply(1.000 m³):
∑ Woody biomass forest & outside
∑ Co-products
∑ Recovered wood
∑ Processed wood fuel
Wood use(1.000 m³):
∑ Energy use
∑ Material use

-50-________________________________________EU/EFTA sub-regional and national wood resource balances 2005
Slovenia
Slovenia
1.000 m³ % % 1.000 m³
Industrial Roundwood - JFSQ (P+I-X) 1 924 46%
Industrial Roundwood - Maximum difference unreported to JFSQ (P) 85 2% 26% 1 410 (C)
Fuelwood - JFSQ (P+I-X) 808 19% 15% 786 (C)
Fuelwood - Maximum difference unreported to JFSQ (P) 11% 565 (C)
Bark (P) 1% 58 (C)
Used logging residues (P) 159 4% 2% 116 (C)
Woody biomass outside the forest (P) 276 7%
Supply by-products:
Chips, particles & wood residues (P+I-X) 456 11%
Pulp production co-products (P) 294 7%
Supply recovered wood: 1% 28 (C)
Recovered wood for material & energy use (P) 149 4% 10% 531 (C)
Supply processed wood fuel: 31% 1 655 (C)
Processed wood fuel (P+I-X) 12 0% 4% 218 (C)
4 163 5 367
(P)
(I)
(X)
(P+I-X)
(C)
∑
Wood supply and use - Slovenia (2005)
78% 55%
18% 45%
4% 0%
0%
0%
1990 1995 2000 20055,1 - 6,5 7,3
- harvesting losses ( ? %) 0 - -1 -1
- unused roundwood ( ? %)-1 - -1 -1
Potential roundwood supply from forest 0 - -1 -14 - 5 5
Supply from forest & woody biomass outside the forest:
2 431
0
12
2 935∑ Woody biomass forest & outside
Wood supply (1.000 m³): Wood use (1.000 m³):
3 252
750
2005
∑ SUPPLY TOTAL
Other physical utilization
∑ TOTAL USE
Material use:
Energy use:
Power and heat
Industrial internal
Sawmill industry
1 204
Difference
∑ Co-products
∑ Recovered wood
∑ Processed wood fuel
Wood consumption
0
Import
∑ Material use
Panel industry
Pulp industry
Processed wood fuel industry
Production / Removals
Private households
Undifferentiated energy use
Export
Apparent consumption
Sum
Source: MCPFE/UNECE/FAO
Slovenia: Net annual increment (million m³ over bark):
∑ Energy use
Balance149
0%
10%
20%
30%
40%
50%
60%
70%
80%
90%
100%
Wood supply(1.000 m³):
∑ Woody biomass forest & outside
∑ Co-products
∑ Recovered wood
∑ Processed wood fuel
Wood use(1.000 m³):
∑ Energy use
∑ Material use

EU/EFTA sub-regional and national wood resource balances 2005___________________________________________________51
Spain
Spain
1.000 m³ % % 1.000 m³
Industrial Roundwood - JFSQ (P+I-X) 16 788 57%
Industrial Roundwood - Maximum difference unreported to JFSQ (P) 17% 7 116 (C)
Fuelwood - JFSQ (P+I-X) 2 105 7% 17% 7 260 (C)
Fuelwood - Maximum difference unreported to JFSQ (P) 14% 6 104 (C)
Bark (P) 0% 33 (C)
Used logging residues (P) (C)
Woody biomass outside the forest (P)
Supply by-products:
Chips, particles & wood residues (P+I-X) 5 454 19%
Pulp production co-products (P) 2 880 10%
Supply recovered wood: (C)
Recovered wood for material & energy use (P) 2 040 7% (C)
Supply processed wood fuel: (C)
Processed wood fuel (P+I-X) 51% 21 649 (C)
29 267 42 162
(P)
(I)
(X)
(P+I-X)
(C)
∑
Wood supply and use - Spain (2005)
65% 49%
28% 51%
7% 0%
0%
1990 1995 2000 2005- - 28,6 -
- harvesting losses ( ? %) #WERT! - -2 #WERT!
- unused roundwood ( ? %)#WERT! - -3 #WERT!
Potential roundwood supply from forest #WERT! - -2 #WERT!#WERT! - 21 #WERT!
Supply from forest & woody biomass outside the forest:
21 649
0
20 514∑ Woody biomass forest & outside
Wood supply (1.000 m³): Wood use (1.000 m³):
18 893
8 334
2005
∑ SUPPLY TOTAL
Other physical utilization
∑ TOTAL USE
Material use:
Energy use:
Power and heat
Industrial internal
Sawmill industry
12 895
Difference
∑ Co-products
∑ Recovered wood
∑ Processed wood fuel
Wood consumption
0
Import
∑ Material use
Panel industry
Pulp industry
Processed wood fuel industry
Production / Removals
Private households
Undifferentiated energy use
Export
Apparent consumption
Sum
Source: MCPFE/UNECE/FAO
Spain: Net annual increment (million m³ over bark):
∑ Energy use
Balance2 040
0%
10%
20%
30%
40%
50%
60%
70%
80%
90%
100%
Wood supply(1.000 m³):
∑ Woody biomass forest & outside
∑ Co-products
∑ Recovered wood
∑ Processed wood fuel
Wood use(1.000 m³):
∑ Energy use
∑ Material use

-52-________________________________________EU/EFTA sub-regional and national wood resource balances 2005
Sweden
Sweden
1.000 m³ % % 1.000 m³
Industrial Roundwood - JFSQ (P+I-X) 69 276 51%
Industrial Roundwood - Maximum difference unreported to JFSQ (P) 27% 36 000 (C)
Fuelwood - JFSQ (P+I-X) 6 135 5% 1% 1 113 (C)
Fuelwood - Maximum difference unreported to JFSQ (P) 35% 46 605 (C)
Bark (P) 9 699 7% 1% 1 600 (C)
Used logging residues (P) 6 000 4% (C)
Woody biomass outside the forest (P)
Supply by-products:
Chips, particles & wood residues (P+I-X) 18 920 14%
Pulp production co-products (P) 21 325 16%
Supply recovered wood: 8% 10 995 (C)
Recovered wood for material & energy use (P) 1 450 1% 15% 19 458 (C)
Supply processed wood fuel: 7% 8 923 (C)
Processed wood fuel (P+I-X) 1 836 1% 6% 8 313 (C)
134 642 133 008
(P)
(I)
(X)
(P+I-X)
(C)
∑
Wood supply and use - Sweden (2005)
68% 64%
30% 36%
1% 0%
1%
0%
1990 1995 2000 200590,2 - 90,7 91,4
- harvesting losses ( ? %) -7 - -7 -7
- unused roundwood ( ? %)-11 - -11 -11
Potential roundwood supply from forest -7 - -7 -765 - 65 66
Supply from forest & woody biomass outside the forest:
47 690
0
1 836
85 318∑ Woody biomass forest & outside
Wood supply (1.000 m³): Wood use (1.000 m³):
91 110
40 245
2005
∑ SUPPLY TOTAL
Other physical utilization
∑ TOTAL USE
Material use:
Energy use:
Power and heat
Industrial internal
Sawmill industry
1 634
Difference
∑ Co-products
∑ Recovered wood
∑ Processed wood fuel
Wood consumption
0
Import
∑ Material use
Panel industry
Pulp industry
Processed wood fuel industry
Production / Removals
Private households
Undifferentiated energy use
Export
Apparent consumption
Sum
Source: MCPFE/UNECE/FAO
Sweden: Net annual increment (million m³ over bark):
∑ Energy use
Balance1 450
0%
10%
20%
30%
40%
50%
60%
70%
80%
90%
100%
Wood supply(1.000 m³):
∑ Woody biomass forest & outside
∑ Co-products
∑ Recovered wood
∑ Processed wood fuel
Wood use(1.000 m³):
∑ Energy use
∑ Material use

EU/EFTA sub-regional and national wood resource balances 2005___________________________________________________53
Switzerland
Switzerland
1.000 m³ % % 1.000 m³
Industrial Roundwood - JFSQ (P+I-X) 2 824 42%
Industrial Roundwood - Maximum difference unreported to JFSQ (P) 30% 2 642 (C)
Fuelwood - JFSQ (P+I-X) 1 219 18% 17% 1 487 (C)
Fuelwood - Maximum difference unreported to JFSQ (P) 10% 897 (C)
Bark (P) 210 3% (C)
Used logging residues (P) 500 8% 0% 29 (C)
Woody biomass outside the forest (P) 240 4%
Supply by-products:
Chips, particles & wood residues (P+I-X) 1 320 20%
Pulp production co-products (P) 334 5%
Supply recovered wood: 26% 2 268 (C)
Recovered wood for material & energy use (P) 3% 224 (C)
Supply processed wood fuel: 15% 1 293 (C)
Processed wood fuel (P+I-X) 0% 0 (C)
6 646 8 840
(P)
(I)
(X)
(P+I-X)
(C)
∑
Wood supply and use - Switzerland (2005)
75% 57%
25% 43%
0%
0%
1990 1995 2000 2005- - 9,0 -
- harvesting losses ( ? %) #WERT! - -1 #WERT!
- unused roundwood ( ? %)#WERT! - -1 #WERT!
Potential roundwood supply from forest #WERT! - -1 #WERT!#WERT! - 6 #WERT!
Supply from forest & woody biomass outside the forest:
3 785
0
5 056∑ Woody biomass forest & outside
Wood supply (1.000 m³): Wood use (1.000 m³):
4 993
1 654
2005
∑ SUPPLY TOTAL
Other physical utilization
∑ TOTAL USE
Material use:
Energy use:
Power and heat
Industrial internal
Sawmill industry
2 194
Difference
∑ Co-products
∑ Recovered wood
∑ Processed wood fuel
Wood consumption
0
Import
∑ Material use
Panel industry
Pulp industry
Processed wood fuel industry
Production / Removals
Private households
Undifferentiated energy use
Export
Apparent consumption
Sum
Source: MCPFE/UNECE/FAO
Switzerland: Net annual increment (million m³ over bark):
∑ Energy use
Balance
0%
10%
20%
30%
40%
50%
60%
70%
80%
90%
100%
Wood supply(1.000 m³):
∑ Woody biomass forest & outside
∑ Co-products
∑ Recovered wood
∑ Processed wood fuel
Wood use(1.000 m³):
∑ Energy use
∑ Material use

-54-________________________________________EU/EFTA sub-regional and national wood resource balances 2005
United Kingdom
United Kingdom
1.000 m³ % % 1.000 m³
Industrial Roundwood - JFSQ (P+I-X) 8 122 50%
Industrial Roundwood - Maximum difference unreported to JFSQ (P) 37% 5 250 (C)
Fuelwood - JFSQ (P+I-X) 126 1% 30% 4 229 (C)
Fuelwood - Maximum difference unreported to JFSQ (P) 1 0% 6% 814 (C)
Bark (P) 200 1% 1% 200 (C)
Used logging residues (P) 3% 466 (C)
Woody biomass outside the forest (P)
Supply by-products:
Chips, particles & wood residues (P+I-X) 2 677 17%
Pulp production co-products (P)
Supply recovered wood: 2% 258 (C)
Recovered wood for material & energy use (P) 4 872 30% 4% 491 (C)
Supply processed wood fuel: 5% 684 (C)
Processed wood fuel (P+I-X) 200 1% 11% 1 610 (C)
16 198 14 003
(P)
(I)
(X)
(P+I-X)
(C)
∑
Wood supply and use - United Kingdom (2005)
52% 78%
17% 22%
30% 0%
1%
0%
1990 1995 2000 200518,0 - 20,7 20,7
- harvesting losses ( ? %) -1 - -2 -2
- unused roundwood ( ? %)-2 - -2 -2
Potential roundwood supply from forest -1 - -2 -213 - 15 15
Supply from forest & woody biomass outside the forest:
3 043
0
200
10 960∑ Woody biomass forest & outside
Wood supply (1.000 m³): Wood use (1.000 m³):
8 449
2 677
2005
∑ SUPPLY TOTAL
Other physical utilization
∑ TOTAL USE
Material use:
Energy use:
Power and heat
Industrial internal
Sawmill industry
2 195
Difference
∑ Co-products
∑ Recovered wood
∑ Processed wood fuel
Wood consumption
0
Import
∑ Material use
Panel industry
Pulp industry
Processed wood fuel industry
Production / Removals
Private households
Undifferentiated energy use
Export
Apparent consumption
Sum
Source: MCPFE/UNECE/FAO
United Kingdom: Net annual increment (million m³ over bark):
∑ Energy use
Balance4 872
0%
10%
20%
30%
40%
50%
60%
70%
80%
90%
100%
Wood supply(1.000 m³):
∑ Woody biomass forest & outside
∑ Co-products
∑ Recovered wood
∑ Processed wood fuel
Wood use(1.000 m³):
∑ Energy use
∑ Material use

EU/EFTA sub-regional and national wood resource balances 2005___________________________________________________55
ANNEX IV : National wood resource balances Serbia and Turkey
a) Wood resource balances from Serbia and Turkey
The authors would like to express their gratitude to country correspondents from Serbia and Turkey for sending a complete national wood resource balance 2005 during the review process.
Each of the two countries’ balances is based upon a single estimate. This contrasts with all other countries’ balances which are based upon a common selection of energy and forestry statistics’ databases. Due to different underlying data framework these balances can not be included in the overall presentation and assessment of the report. Further the dataset has not been subject to any consistency check and is published as submitted by correspondents.
The presented balances are excellent food for thought for launching discussion on wood flows at national level. It is an excellent starting point for assessing the “real” situation of wood supplies and uses at national level.
Subsequent discussions should involve stakeholders from forestry and energy sector and should take all viewpoints of the cross-sectoral issue into consideration. Empiric research (e.g. households’ surveys) will help finding or improving information on weak or blank areas (post consumer recovered wood, fuelwood use by private households).
The authors would like to encourage other countries of the UNECE region to draft national wood resource balances to improved discussion between all sectors involved.

-56-________________________________________EU/EFTA sub-regional and national wood resource balances 2005
Turkey
Turkey
1.000 m³ % % 1.000 m³
Industrial Roundwood - JFSQ (P+I-X) 26 320 66%
Industrial Roundwood - Maximum difference unreported to JFSQ (P) 700 2% 28% 8 578 (C)
Fuelwood - JFSQ (P+I-X) 5 319 13% 25% 7 536 (C)
Fuelwood - Maximum difference unreported to JFSQ (P) 3 510 9% 4% 1 094 (C)
Bark (P) (C)
Used logging residues (P) 6% 1 700 (C)
Woody biomass outside the forest (P) 1 300 3%
Supply by-products:
Chips, particles & wood residues (P+I-X) 2 992 7%
Pulp production co-products (P)
Supply recovered wood: (C)
Recovered wood for material & energy use (P) (C)
Supply processed wood fuel: (C)
Processed wood fuel (P+I-X) 37% 11 270 (C)
40 141 30 178
(P)
(I)
(X)
(P+I-X)
(C)
∑
Wood supply and use - Turkey (2005)
93% 63%
7% 37%
0%
0%
1990 1995 2000 200532,7 - 35,0 36,6
- harvesting losses ( ? %) -3 - -3 -3
- unused roundwood ( ? %)-4 - -4 -4
Potential roundwood supply from forest -3 - -3 -324 - 25 26
Export
Apparent consumption
Sum
Source: MCPFE/UNECE/FAO
Turkey: Net annual increment (million m³ over bark):
∑ Energy use
Balance
Panel industry
Pulp industry
Processed wood fuel industry
Production / Removals
Private households
Undifferentiated energy use
9 963
Difference
∑ Co-products
∑ Recovered wood
∑ Processed wood fuel
Wood consumption
0
Import
∑ Material use
2005
∑ SUPPLY TOTAL
Other physical utilization
∑ TOTAL USE
Material use:
Energy use:
Power and heat
Industrial internal
Sawmill industry
Supply from forest & woody biomass outside the forest:
11 270
0
18 908∑ Woody biomass forest & outside
Wood supply (1.000 m³): Wood use (1.000 m³):
37 149
2 992
0%
10%
20%
30%
40%
50%
60%
70%
80%
90%
100%
Wood supply(1.000 m³):
∑ Woody biomass forest & outside
∑ Co-products
∑ Recovered wood
∑ Processed wood fuel
Wood use(1.000 m³):
∑ Energy use
∑ Material use

EU/EFTA sub-regional and national wood resource balances 2005___________________________________________________57
Serbia
Serbia
1.000 m³ % % 1.000 m³
Industrial Roundwood - JFSQ (P+I-X) 1 168 30%
Industrial Roundwood - Maximum difference unreported to JFSQ (P) 32% 976 (C)
Fuelwood - JFSQ (P+I-X) 1 589 41% 3% 94 (C)
Fuelwood - Maximum difference unreported to JFSQ (P) 4% 123 (C)
Bark (P) 98 3% 1% 38 (C)
Used logging residues (P) 330 9% 7% 210 (C)
Woody biomass outside the forest (P) 15 0%
Supply by-products:
Chips, particles & wood residues (P+I-X) 507 13%
Pulp production co-products (P) 111 3%
Supply recovered wood: (C)
Recovered wood for material & energy use (P) 10 0% (C)
Supply processed wood fuel: (C)
Processed wood fuel (P+I-X) 29 1% 52% 1 589 (C)
3 857 3 030
(P)
(I)
(X)
(P+I-X)
(C)
∑
Wood supply and use - Serbia (2005)
83% 48%
16% 52%
0% 0%
1%
0%
1990 1995 2000 20055,6 - 5,2 5,2
- harvesting losses ( ? %) 0 - 0 0
- unused roundwood ( ? %)-1 - -1 -1
Potential roundwood supply from forest 0 - 0 04 - 4 4
Export
Apparent consumption
Sum
Source: MCPFE/UNECE/FAO
Serbia: Net annual increment (million m³ over bark):
∑ Energy use
Balance10
Panel industry
Pulp industry
Processed wood fuel industry
Production / Removals
Private households
Undifferentiated energy use
827
Difference
∑ Co-products
∑ Recovered wood
∑ Processed wood fuel
Wood consumption
0
Import
∑ Material use
2005
∑ SUPPLY TOTAL
Other physical utilization
∑ TOTAL USE
Material use:
Energy use:
Power and heat
Industrial internal
Sawmill industry
Supply from forest & woody biomass outside the forest:
1 589
0
29
1 441∑ Woody biomass forest & outside
Wood supply (1.000 m³): Wood use (1.000 m³):
3 200
618
0%
10%
20%
30%
40%
50%
60%
70%
80%
90%
100%
Wood supply(1.000 m³):
∑ Woody biomass forest & outside
∑ Co-products
∑ Recovered wood
∑ Processed wood fuel
Wood use(1.000 m³):
∑ Energy use
∑ Material use

-58-________________________________________EU/EFTA sub-regional and national wood resource balances 2005

EU/EFTA sub-regional and national wood resource balances 2005___________________________________________________59
Inside of back cover
UNECE/FAO GENEVA TIMBER AND FOREST STUDY PAPERS
The UNECE/FAO Geneva Timber and Forest Study Paper series contains annual and periodic analyses of the forest and forest industries sector. These studies are the official outputs of regular activities conducted within the Integrated Programme of Work of the UNECE Timber Committee and the FAO European Forestry Commission and as such should contribute to policy formation. Target audiences are Governments, industry, research institutions, universities, international organizations, non-governmental organizations as well as experts from other sectors. These publications often form the basis for discussions of the Timber Committee and the European Forestry Commission and their subsidiary bodies.
Study Papers are usually based on statistics, forecasts and information submitted by country correspondents in the UNECE region (Europe, North America and Commonwealth of Independent States). The basic information is often submitted via agreed questionnaires, and then complemented by expert analysis from outside and within the secretariat. Study papers are issued on the responsibility of the secretariat, although the studies most often are the work of many contributors outside the UNECE/FAO.
Study Papers are translated whenever possible into the three official languages of the UNECE: English, French and Russian. They are UN sales documents and are distributed accordingly via UN bookstores and their affiliates. They are automatically distributed to heads of delegation of the Committee and the Commission, as well as nominated repository libraries, information centres and official distribution lists. They are also available via the Sales and Marketing Sections in Geneva and New York via [email protected] and [email protected] respectively. Study papers are also available on the Timber Committee and European Forestry Commission website at: www.unece.org/trade/timber
Readers’ comments are welcome. A reader survey is available via www.unece.org/timber
UNECE/FAO Timber Section Trade and Timber Division United Nations Economic Commission for Europe/ Food and Agriculture Organization of the United Nations Palais des Nations CH-1211 Geneva 10, Switzerland Fax +41 22 917 0041 www.unece.org/timber [email protected]

-60-________________________________________EU/EFTA sub-regional and national wood resource balances 2005