Current Status of the Drought Monitor and Related … · • A variety of data and the experience...
30
Current Status of the Drought Monitor and Related Activities in Canada Trevor Hadwen and Maginda Magendrathajan Agriculture and Agri-Food Canada National Agroclimate Information Service Regina, Saskatchewan, Canada North American Drought Monitor Forum Calgary, Alberta, May 1-3, 2018
Transcript of Current Status of the Drought Monitor and Related … · • A variety of data and the experience...
Current Status of the Drought
Monitor and Related Activities in
Canada
Trevor Hadwen and Maginda Magendrathajan Agriculture and Agri-Food Canada
National Agroclimate Information Service
Regina, Saskatchewan, Canada
North American Drought Monitor Forum
Calgary, Alberta, May 1-3, 2018

• AAFC’s National Agroclimate Information Service (NAIS) is responsible for drought monitoring in Canada.
• Since 2003, Canada has been providing NADM input utilizing the shared ‘Drought Monitor’ methodology.
• In 2016, Canada started publishing Canadian Drought Monitor maps on the Drought Watch Website.
• A variety of data and the experience of multiple experts are applied to creating monthly assessments.
• Monthly drought assessments cover all of Canada with the exception of the territory of Nunavut.
• NAIS continues to improve the online maps, narratives and interactive tools we offer on our Drought Watch web site.
Canadian Drought Monitor
2

Challenges Monitoring Drought In Canada 1. Canada is a big and environmentally diverse country
2. Agricultural land covers a relatively small percentage of the country; (AAFC needs to rely on input from other agencies to assess
drought outside of agricultural areas)
3. Much of Canada is sparsely inhabited and lacks environmental monitoring infrastructure – Limited data and information; Limited Resources;
– Heavily reliant on modeled drought indicators in some regions
4. Drought is not well understood in Northern/Arctic regions
5. Winter… – Much of the annual precipitation received is snow, and snow is
inherently difficult to measure, and gauge reliability is poor.
– Hydrologic gauges are of limited use as much of the year water is frozen.
3
2016-2018 Improvements • Over the past two years, we have focused CDM development
efforts on greater assessment efficiency
– Utilizing ArcGIS Online tools
– Packaging data more appropriately for extremes monitoring
• We are using more drought indicators and more complicated and powerful tools for assessment.
– internal assessment efficiencies – new tools
– improved assessment outside ag extent*
– improved the data and indices being used *new indicators*
– strengthened and expanded CDM web presence *web services and tools*
4

5
Monitoring Outside the Agricultural Extent
• AAFC is the lead for Drought monitoring for all of Canada however has limited knowledge of drought outside the agricultural areas.
• Limited climate stations and the lack of understanding of drought in northern regions is a significant challenge.

Monitoring Outside the Agricultural Extent
We have started to address these issues by:
• working with the Canadian Forest Service to develop a relative indicator from their Drought Code;
• using Environment Canada’s Canadian Precipitation Analysis CaPA data; and
• beginning discussions on what drought means in northern environments.
6
New Indicators for Canada
Added in 2017:
• Evaporative Stress Index
• Canadian Precipitation Analysis (CaPA)
• New percentile time frames
In development - (2018):
• Weekly/biweekly drought indices (SPI, PDI…)
• VegDRI for Canada
• ESI
Exploring:
• EDDI
7
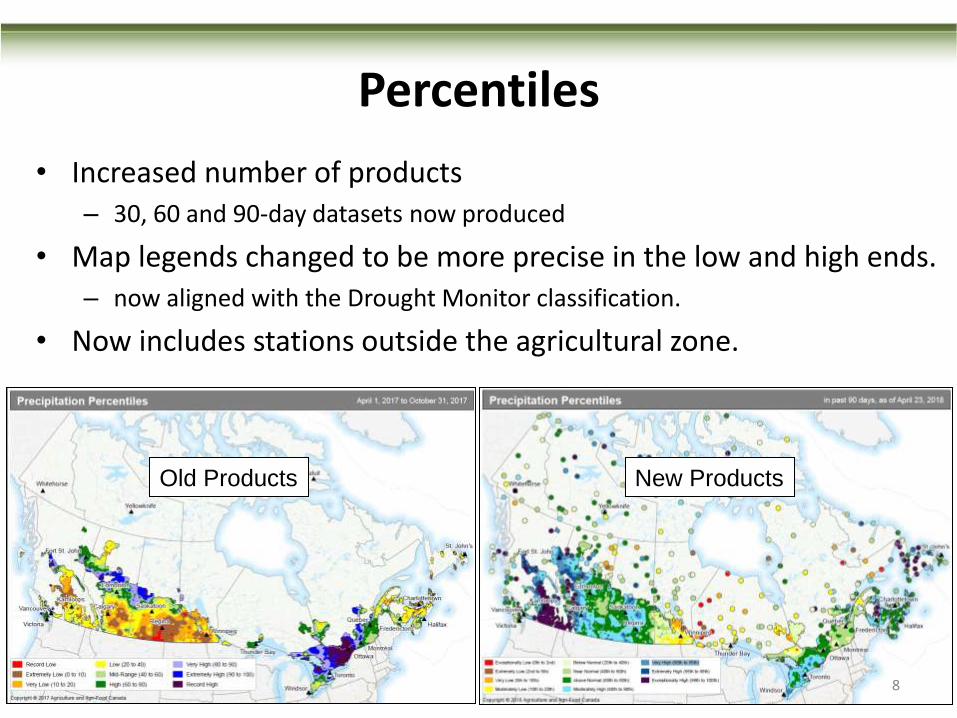
Percentiles
• Increased number of products – 30, 60 and 90-day datasets now produced
• Map legends changed to be more precise in the low and high ends. – now aligned with the Drought Monitor classification.
• Now includes stations outside the agricultural zone.
Old Products New Products
8
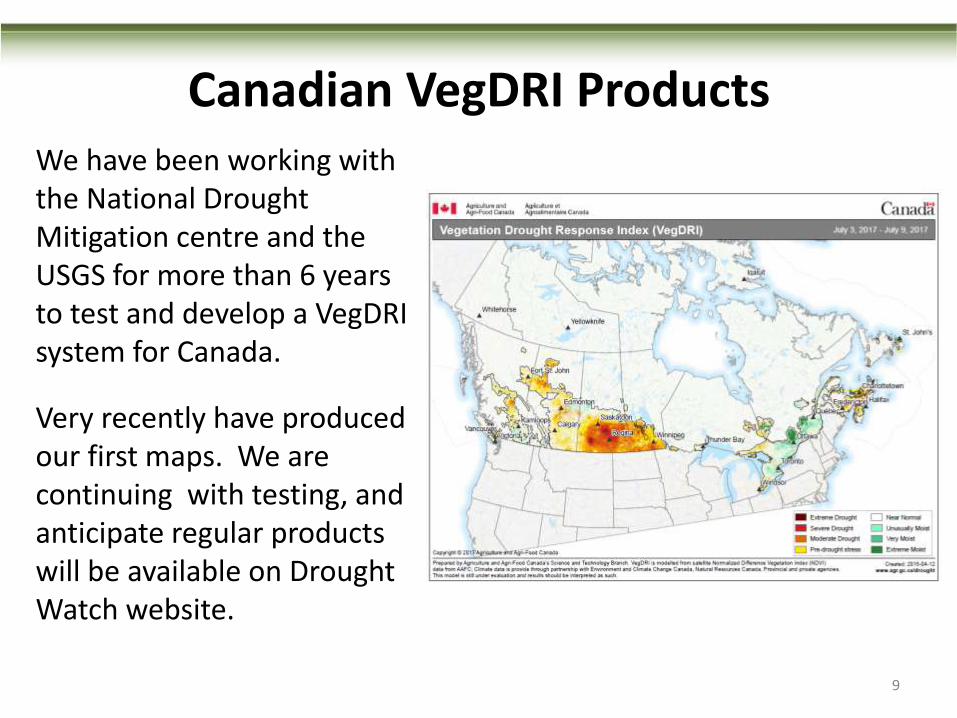
Canadian VegDRI Products We have been working with the National Drought Mitigation centre and the USGS for more than 6 years to test and develop a VegDRI system for Canada.
Very recently have produced our first maps. We are continuing with testing, and anticipate regular products will be available on Drought Watch website.
9
Significant updates since the 2016 NADM Forum:
– Created ArcGIS Web Services for our daily climate products so the data are easier to use
– Developed ArcGIS Online Editor and Review Applications to improve assessments
– Incorporated ESRI Story Map to add context to the narrative and maps
– Added Drought Analysis tools to allow users to explore the data and make it more
Canadian Drought Monitor Tools
10

Web Services and our Data
• As part of a recent upgrade of our daily agroclimate mapping system and products, we created web services of many of our daily monitoring products.
• This has enabled us to use these products in all of our different online applications significantly increasing the efficiency of our assessments.
11

Editor Application
• The CDM Editor Application is an ArcOnline Application that allows the CDM authors to edit the assessment of drought in a cloud-based environment.
• The application contains the CDM and may of the required maps to assess drought as Web Service layers
The benefits:
Increased efficiency
Increased flexibility
Multiple editors,
Portable
Easily incorporate web services
and outside spatial data
12

Review Application
• The Reviewer Application is similar to the Editor Application, but is specifically built for the Canadian team to review the draft assessments and provide comments and suggest edits.
– Reviewers are able to draw in polygons or add points with annotations for suggested changes
The benefits
– Provides a platform for reviewers other than email
– Links directly to the Editor Application
– Increases precision and accuracy
– Increases efficiency
13

Drought Analysis Tools
• Various analytical tools have been developed to provide additional content, increased visibility and interactivity and use of our products and data.
– Time Slider: slide through historical assessments
– Monthly Comparison Tool: compare two CDM maps side by side
– Change Maps: view improvement or degradation of drought over a given period of time
– Stats and Graphs: allows users to interact with the current and historical CDM data looking at the impact of drought
14
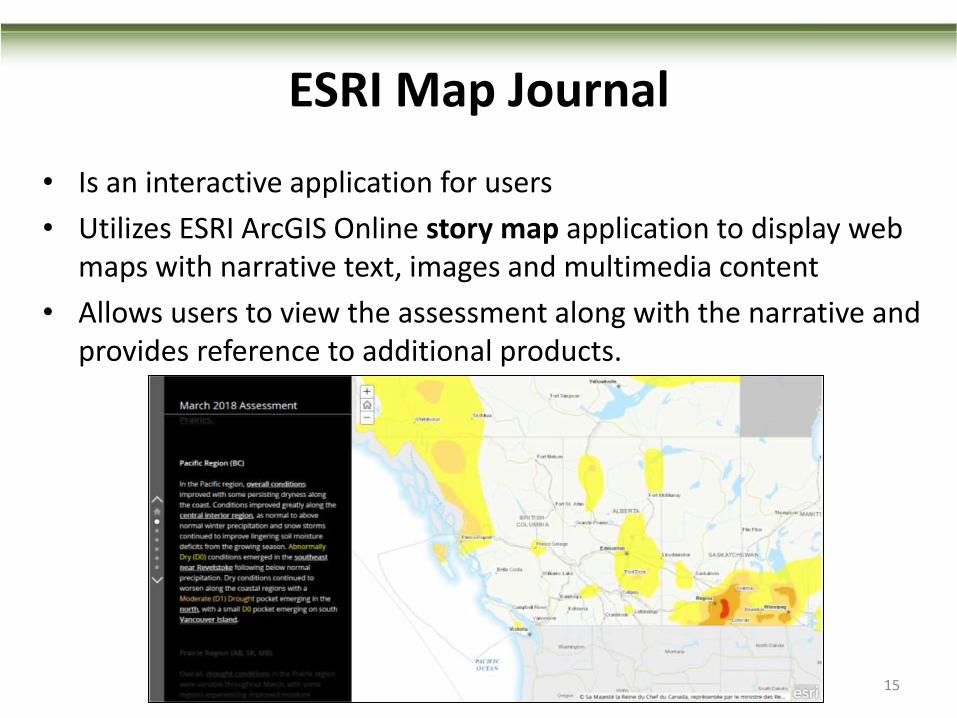
• Is an interactive application for users
• Utilizes ESRI ArcGIS Online story map application to display web maps with narrative text, images and multimedia content
• Allows users to view the assessment along with the narrative and provides reference to additional products.
ESRI Map Journal
15

Demonstration of
The CDM
Applications and Tools
16

Editor Application
17

18

19

20

Review Application
21

Review Application
22
ESRI Map Journal
23
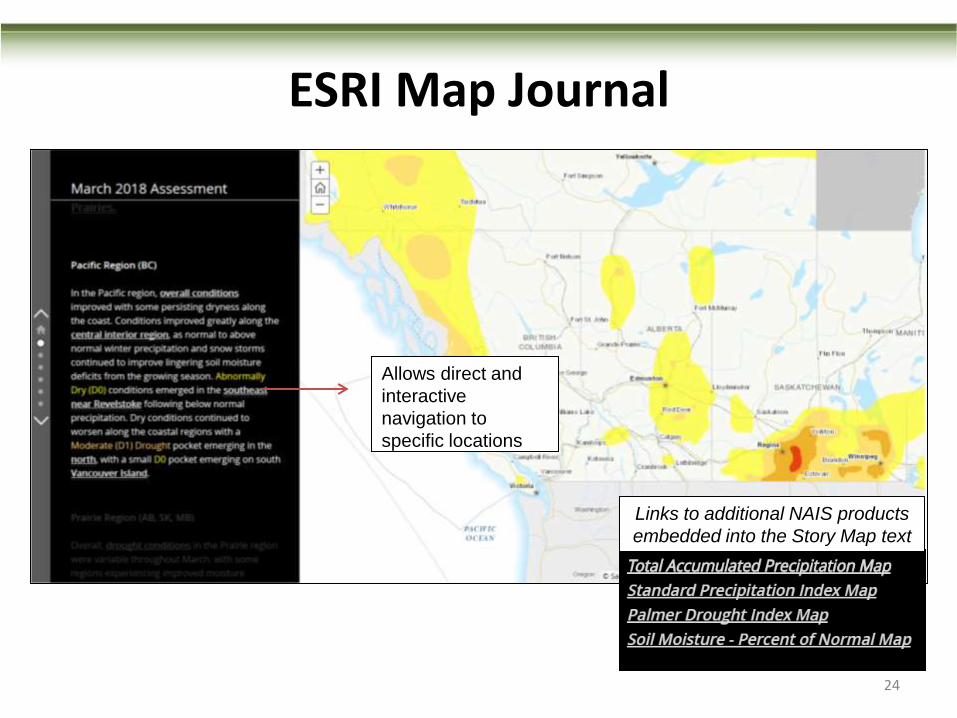
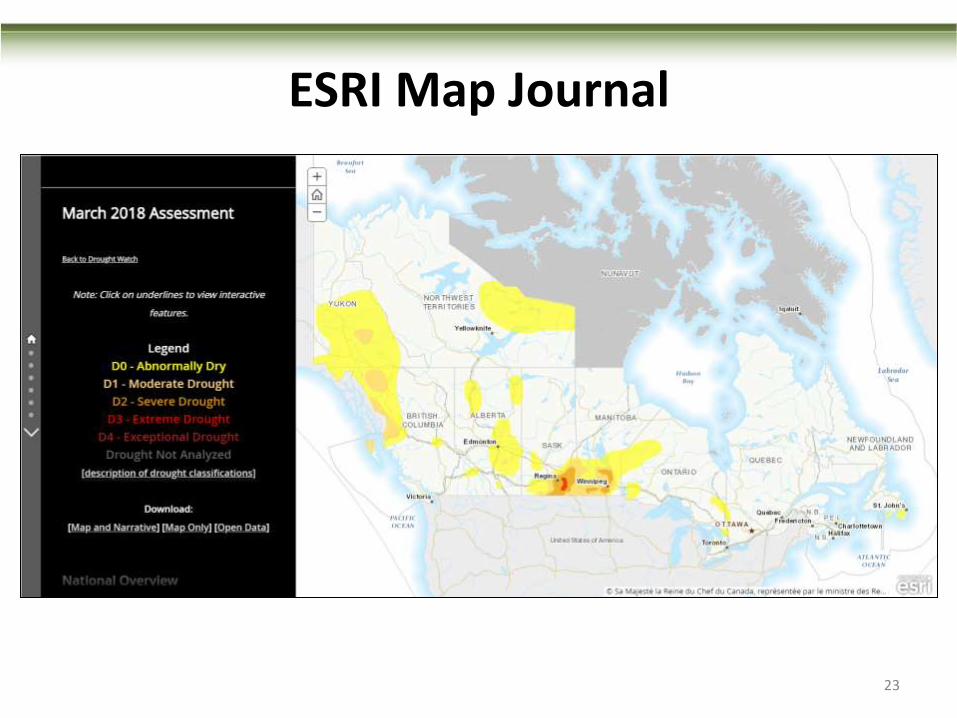
Allows direct and
interactive
navigation to
specific locations
Links to additional NAIS products
embedded into the Story Map text
ESRI Map Journal
24
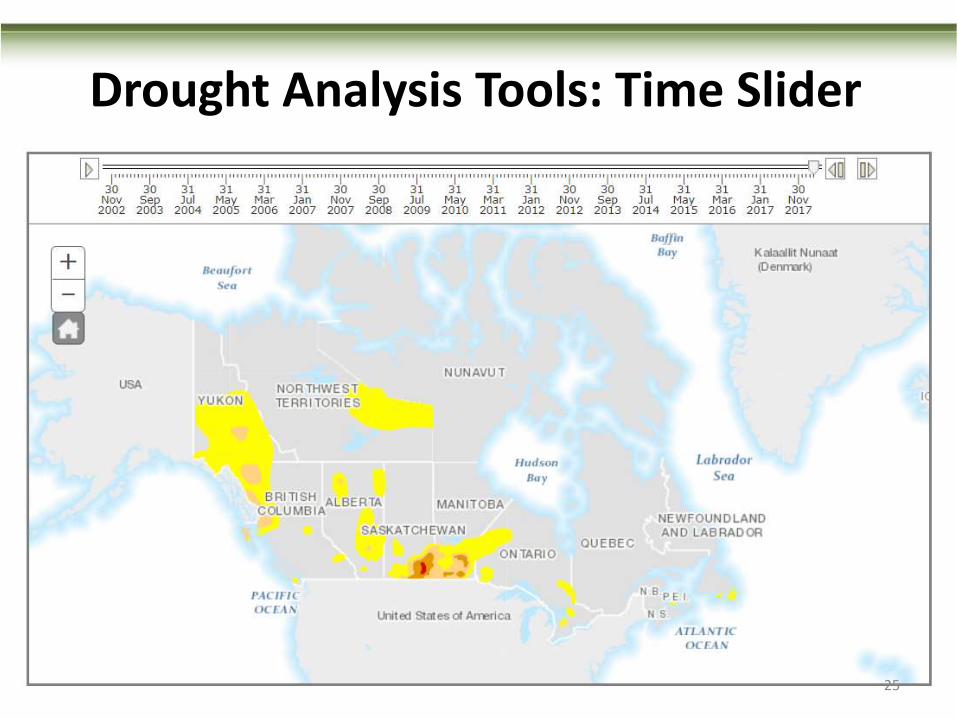
Drought Analysis Tools: Time Slider
25
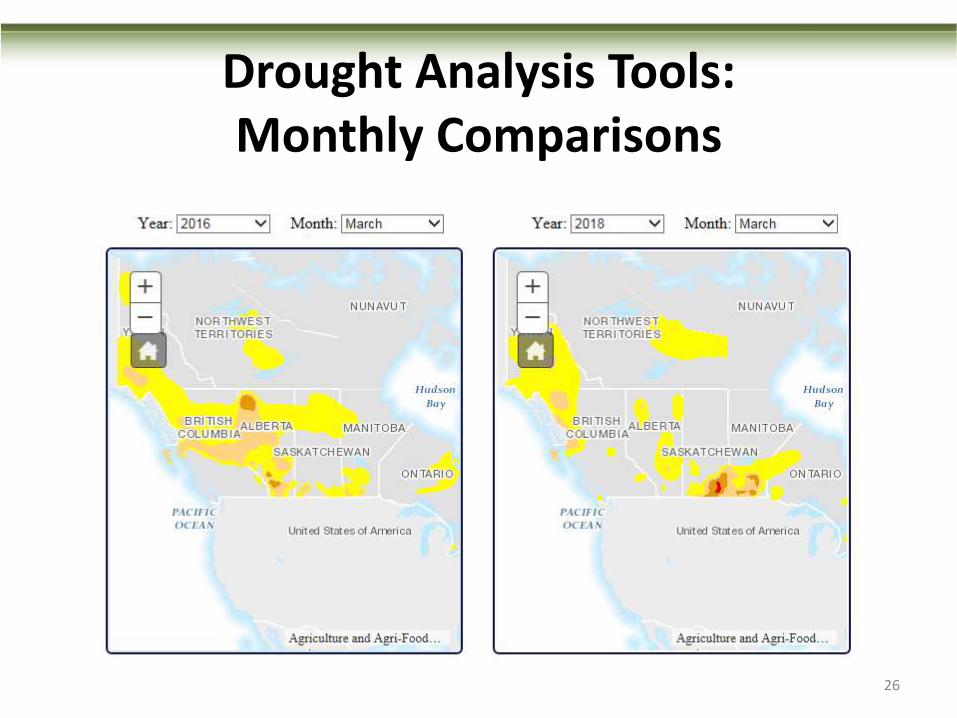
Drought Analysis Tools: Monthly Comparisons
26

Drought Analysis Tools: Change Maps
27

Drought Analysis Tools: Stats and Graphs
The Stats and graphs page is currently being developed and will be released later in 2018.
This page will allow users to interact with the current and historical CDM data looking at the impact of drought on agriculture.
28
Next steps and future priorities
• Continue improving the communication and outreach tools
• Develop a Drought Outlook for Canada
• Improve the existing assessment with new indicators and datasets (e.g. VegDRI, EDDI, …)
• Better define drought in northern regions in order to include Nunavut and create a cross-Canada drought assessment.
29

Trevor Hadwen: [email protected]
Maginda Magendrathajan:
National Agroclimate information Service, Agriculture &Agri-Food Canada
Thank you
30