Current and Future Natural Gas Demand in China and India · April 2017, BEG/CEE China/India Gas...
133
April 2017, BEG/CEE China/India Gas Demand, Page 1 Global Gas/LNG Research Current and Future Natural Gas Demand in China and India By Miranda Wainberg Senior Energy Advisor Michelle Michot Foss, Ph.D. Chief Energy Economist and Program Manager Gürcan Gülen, Ph.D. Senior Energy Economist and Research Scientist Daniel Quijano Economist and Research Associate April 2017
-
Upload
nguyenhanh -
Category
Documents
-
view
214 -
download
0
Transcript of Current and Future Natural Gas Demand in China and India · April 2017, BEG/CEE China/India Gas...

April 2017, BEG/CEE China/India Gas Demand, Page 1
Global Gas/LNG Research
Current and Future Natural Gas Demand in China and India
By
Miranda Wainberg Senior Energy Advisor
Michelle Michot Foss, Ph.D. Chief Energy Economist and Program Manager
Gürcan Gülen, Ph.D. Senior Energy Economist and Research Scientist
Daniel Quijano Economist and Research Associate
April 2017

April 2017, BEG/CEE China/India Gas Demand, Page 2
TABLE OF CONTENTS ESSENTIAL ACRONYMNS, UNITS AND CONVERSIONS ................................................................................................... 5 ACKNOWLEDGMENTS .................................................................................................................................................... 6 PREFACE ......................................................................................................................................................................... 7 INTRODUCTION ............................................................................................................................................................. 8 MACROECONOMIC CONTEXT FOR NATURAL GAS IN CHINA AND INDIA ...................................................................... 9
Composition of GDP and Employment Structure ...................................................................................................... 9 GDP Growth and Industrial Structures in China and India ...................................................................................... 11
Industrial overcapacity and debt in China .......................................................................................................... 12 India’s Plans to Increase Share of Industrial Output ........................................................................................... 14 India’s Corporate Sector ..................................................................................................................................... 18
NATURAL GAS MARKET CHARACTERISTICS ................................................................................................................. 20 Historical Trends in Natural Gas Consumption ....................................................................................................... 20 Role of Natural Gas in Total Primary Energy ........................................................................................................... 22 Natural Gas Supplies ............................................................................................................................................... 22 Natural Gas Infrastructure ...................................................................................................................................... 25
China ................................................................................................................................................................... 26 India .................................................................................................................................................................... 29
Gas Supply Allocation Policies ................................................................................................................................. 31 China ................................................................................................................................................................... 31 India .................................................................................................................................................................... 32
Regional Gas Consumption ..................................................................................................................................... 33 China ................................................................................................................................................................... 34 India .................................................................................................................................................................... 35
Natural Gas Pricing .................................................................................................................................................. 35 China ................................................................................................................................................................... 36 India .................................................................................................................................................................... 42
Natural Gas Consumption Detail ............................................................................................................................. 46 Industrial Sector .................................................................................................................................................. 48 Considerations for Gas Use in the Industrial Sector in China ............................................................................. 67 Considerations for Gas Use in the Industrial Sector in India .............................................................................. 68
Electric Power Sector .............................................................................................................................................. 68 Installed Capacity versus Generation.................................................................................................................. 70 Considerations for Gas Use in Power Generation in China ................................................................................. 71 Conclusions on Chinese Power Sector Gas Use .................................................................................................. 77 Considerations for Gas Use in Power Generation in India .................................................................................. 80 Conclusions on Indian Power Sector Gas Use ..................................................................................................... 85
Residential/Commercial (Households): China ......................................................................................................... 86 Transport Sector - China.......................................................................................................................................... 88 City Gas Distribution and the Residential and Transport Sectors: India ................................................................. 90
NATURAL GAS AND ENERGY SECURITY........................................................................................................................ 93 SUMMARY AND CONCLUSIONS ................................................................................................................................... 96 REFERENCES ................................................................................................................................................................. 97 APPENDIX 1 - MAPS ................................................................................................................................................... 114 APPENDIX 2 – HISTORICAL AND FORECAST DATA ..................................................................................................... 118 IMPLICATIONS FOR AND FROM OUR RESEARCH FOR OUTLOOKS ............................................................................. 118
Discrepancies in Historical Data Series.................................................................................................................. 119 Natural Gas Demand Forecasts ............................................................................................................................. 123
LIST OF TABLES
Table 1. Stalled Projects (by value) as a fraction of GDP ............................................................................................. 17
Table 2. Snapshot of China and India Natural Gas Supplies ........................................................................................ 23

April 2017, BEG/CEE China/India Gas Demand, Page 3
Table 3. Natural Major Gas Pipelines in China ............................................................................................................ 26
Table 4. 2012 National Gas Utilization Policy in China by Customer Type .................................................................. 32
Table 5. Gas Utilization Policy in India (2013).............................................................................................................. 33
Table 6. China Natural Gas Prices as of March 2016 in US$/MMBtu .......................................................................... 37
Table 7. West-East Pipeline Transmission Tariffs in China .......................................................................................... 38
Table 8. Other Industrial Sector Gas Use in China 2014 (BCM) ................................................................................... 63
Table 9. Urea Production Capacity by Feedstock ........................................................................................................ 65
Table 10. Incremental Urea Fertilizer Natural Gas Demand above 16 BCM ............................................................... 66
Table 11. Forecast Average Annual Growth Rates of Electricity Consumption in China and India ............................. 69
Table 12. Renewables Electric Generating Capacity GW ............................................................................................. 74
Table 13. China Electric Generation from Renewables 2011-2015 ............................................................................. 75
Table 14. Increases in China Power Sector Gas Demand 2014-2030 (BCM) ............................................................... 78
Table 15. Stranded and Operating Gas-Fired Power Generation Capacity in India, 4/14-1/15 .................................. 85
Table 16. Increases in Indian Power Sector Gas Demand, 2014-2030 (BCM) ............................................................. 85
Table 17. Gas Consumption by Indian Electric Sector in IEO13 and IEO16 (Quad Btu) ............................................... 86
Table 18. Residential Fuel Prices, July 2015 ($/MMBtu) ............................................................................................. 88
Table 19. Piped Natural Gas Customers by State, City, Company and Consumer Type .............................................. 91
Table 20. CNG Activities as of 3/31/15 ........................................................................................................................ 92
Table 21. China and India Gas Supply and Import Infrastructure ................................................................................ 94
Table 22. China Total Gas Consumption .................................................................................................................... 119
Table 23. India Total Gas Consumption ..................................................................................................................... 119
Table 26. China Historical Gas Demand by Sector by Reporter as Revised (BCM) .................................................... 121
Table 27. India Historical Gas Demand by Sector by Reporter as Revised (BCM) ..................................................... 122
Table 28. Primary Energy Growth Rates for India, China .......................................................................................... 124
Table 29. China Forecast Comparisons BCM ............................................................................................................. 126
Table 30. BMI Research China Generation Fuel Sources ........................................................................................... 128
Table 31. IEA WEO15 Fossil Fuel Import Prices by Scenario. ..................................................................................... 129
Table 32. India Forecast Comparisons BCM .............................................................................................................. 129
Table 33. IEA NPS India Power Sector Outlooks ........................................................................................................ 132
LIST OF FIGURES
Figure 1. GDP Growth, Primary Energy and Natural Gas in China and India ................................................................. 9
Figure 2 – Composition of GDP in China and India (Value Added by Sector) .............................................................. 10
Figure 3. Historical and Forecasted GDP Growth Rates .............................................................................................. 11
Figure 4. China Industrial Enterprises Value Added and Growth Rate (%) .................................................................. 12
Figure 5. Manufacturing Value Added as Percentage of GDP ..................................................................................... 15
Figure 6. Gross Fixed Capital Investment in India as Percentage of GDP .................................................................... 16
Figure 7. Subsidy Burden in India ................................................................................................................................ 16
Figure 8 – Public and Private Investment in India’s Key Sectors ................................................................................. 18
Figure 9 – Health of the Indian Corporations .............................................................................................................. 19
Figure 10. Natural Gas Consumption in China and India ............................................................................................ 21
Figure 11 – Natural Gas Production, Consumption and Imports in China and India, 2005-2015 ................................ 21
Figure 12. Distribution of Primary Energy in China and India, 2015 ........................................................................... 22
Figure 13. China and India Gas Production (BCM), Gas Imports (BCM) and Production Growth Rates % .................. 23
Figure 14. Global Trends in Natural Gas Prices and Demand ...................................................................................... 36
Figure 15. Prices for Oil, Imported LNG and Pipeline Gas, and City Gate Prices in China ($/MMBtu) ........................ 39
Figure 16. Estimated Wholesale Prices of Natural Gas, Fuel Oil, LPG in China March 2016 ($/MMBtu) .................... 39
Figure 17. Distribution Gross Margin by City and Gas Consuming Sector March 2016 ($/MMBtu) ........................... 40
April 2017, BEG/CEE China/India Gas Demand, Page 4
Figure 18. Average City-gate and Netback Producer Natural Gas Prices ($/MMBtu) ................................................. 41
Figure 19. Indian Domestic Gas Price versus International Gas Prices, 1997-2014 ($/MMBtu) ................................. 43
Figure 20. Indian Domestic Natural Gas Prices November 2014-March 2016 ($/MMBtu) ......................................... 44
Figure 21. Natural Gas Consumption in China and India by Sector 2014 .................................................................... 46
Figure 22. Industrial Gas Consumption by Sector in China (BCM) ............................................................................... 48
Figure 23. Industrial Gas Consumption by Sector in India (BCM) ................................................................................ 49
Figure 24. Chemicals Sector Use of Gas and Energy in China ...................................................................................... 52
Figure 25. China Total Petrochemical Cracker Feedstock by Fuel, 2016 ..................................................................... 52
Figure 26. Refinery Capacity and Throughput in China and India ............................................................................... 55
Figure 27. Refining Sector Use of Gas and Energy in China ......................................................................................... 57
Figure 28. Steel Sector Use of Gas and Energy in China .............................................................................................. 60
Figure 29. Non-Ferrous Metals Sector Use of Gas and Energy in China ...................................................................... 62
Figure 30. Other Industries’ Use of Gas in China (BCM) .............................................................................................. 64
Figure 31. Urea Fertilizer Sales, Production and Imports in India ............................................................................... 65
Figure 32. Electricity Consumption and GDP in China and India ................................................................................. 69
Figure 33. Installed Generation Capacity in China and India, 2015 ............................................................................. 70
Figure 34. Generation by Fuel in India and China, 2015 .............................................................................................. 71
Figure 35. Prices of Alternative Fuels in Power Generation ........................................................................................ 72
Figure 36. Power Sector Gas Use Scenarios in China ................................................................................................... 79
Figure 37. Coal Production, Consumption and Targets in India .................................................................................. 80
Figure 38. Captive Power Plant Generation by Fuel in India (148 billion kWh), 2013 ................................................. 82
Figure 39. Accumulated Losses by Power Sector Segment, 2003-2011 ...................................................................... 83
Figure 40. Gas Demand of the Power Sector and Domestic Gas Production in India ................................................. 84
Figure 41. Comparison of Overall Cost of Power Gen under Different Fuel-Mix Scenarios in India ........................... 84
Figure 42. Household Energy Demand in China (MMTOE) .......................................................................................... 87
Figure 43. Natural Gas Use in China Transportation ................................................................................................... 89
Figure 44. India City Gas Distribution Gas Demand vs. LPG (BCM) ............................................................................. 91
Figure 45. Map of China Natural Gas Features .......................................................................................................... 115
Figure 46. China’s Natural Gas and Electric Power Value Chain ............................................................................... 116
Figure 47. Map of India Natural Gas Features ........................................................................................................... 117
Figure 48. China Historical Industrial Gas Demand as Reported and Revised (BCM) ................................................ 120
Figure 49. India Historical Industrial Gas Demand as Reported and Revised (BCM) ................................................. 121
Figure 50. Historical Primary Energy Demand Growth and Forecasts for China and India ....................................... 124
Figure 51. IEA WEO Outlooks on China Natural Gas Demand .................................................................................. 125
Figure 52. IEA WEO Outlooks on India Natural Gas Demand ................................................................................... 125
April 2017, BEG/CEE China/India Gas Demand, Page 5
ESSENTIAL ACRONYMNS, UNITS AND CONVERSIONS
Terms:
CNG Compressed natural gas
EIA US Energy Information Administration. IEO is EIA’s International Energy Outlook.
GOI Government of India.
IEA International Energy Agency. WEO is IEA’s World Energy Outlook.
LNG Liquefied natural gas; mainly methane, chilled under atmosphere pressure, to -256 F (Farenheit). See CEE’s Introduction to LNG, http://www.beg.utexas.edu/energyecon/INTRODUCTION%20TO%20LNG%20Update%202012.pdf
LPG Liquid petroleum gas, mainly propane; may have butane present.
Natural gas A hydrocarbon mixture that can include a variety of molecules including methane (one carbon and four hydrogen atoms, CH4), ethane (two carbon atoms or C2), propane (C3), butane (C4), pentane (C5) and other forms and compounds that result in variation in molecular size and weight. The most common reference to natural gas in this paper is methane. See http://naturalgas.org/ for basics and descriptions of natural gas value chain segments and facilities and natural gas occurrence, and http://www.beg.utexas.edu/energyecon/GlobalGas-LNG/ for similar background relative to LNG development, safety and security.
NBSC National Bureau of Statistics, China
NGLs Natural gas liquids, including C1 – C5 (methane, propane, butane/isobutane, pentanes.
Units and conversions:
Natural gas quantities in cf, Btu, cm
A cubic foot, cf, of natural gas is the volume per cf at standard (normal) temperature (60 degrees Farenheit) and pressure (sea level). A cf of natural gas that is entirely methane, gives off about 1,011 British thermal units (Btus) per cf. Energy (heat) content varies with natural gas composition. Natural gas heat values can range from 950 to 1150 depending upon molecular composition (see http://www.engineeringtoolbox.com/heating-values-fuel-gases-d_823.html). Natural gas volumes in metric are expressed in cubic meters or cm. Natural gas volumes in this paper are measured in thousand (M), million (MM), billion (B), trillion (T). Average throughput associated with natural gas facilities (the volume of natural gas moved through facilities such as pipelines, underground storage and LNG trains, storage and regasification is expressed generally as volumes “per day” or “cf/d” or for metric “per annum” or cma. One billion cubic feet or Bcf of natural gas converts to metric, one billion cubic meters or Bcm, using a multiplier of 0.028. The BP Statistical Review of World Energy, http://www.bp.com/en/global/corporate/energy-economics/statistical-review-of-world-energy.html includes useful conversion factors and data.
LNG quantities in t, tpa
Tonnes of LNG, t, a measure of LNG facilities’ capacity and tonnes per annum, tpa, a measure of throughput from LNG facilities. LNG facility capacities and throughput are most commonly expressed as million tonnes, mt, and million tonnes per annum, mtpa. A Bcf of natural gas converts to 1 mt of LNG with a multiplier of 0.021 (rounded). A Bcm of natural gas is converted to 1 mt of LNG with a multiplier of 0.74 (rounded).
Bbl, BOE Standard 42-gallon barrel, or Bbl, of crude oil, liquids, or oil equivalent (expressed as barrel of oil equivalent or BOE).
See EIA Glossary for more information. https://www.eia.gov/tools/glossary/
See BP Annual Statistical Review for typical conversions.
http://www.bp.com/en/global/corporate/energy-economics/statistical-review-of-world-energy.html
April 2017, BEG/CEE China/India Gas Demand, Page 6
ACKNOWLEDGMENTS
This research has been supported by the following organizations, through generous commitments of
funding as well as in-kind support.
UT Jackson School of Geosciences Endowment
BEG State of Texas Advanced Resource Recovery (STARR) Program/Office of the Comptroller
And:
Chevron Global Gas Ernst & Young ExxonMobil Frost Bank GE Oil & Gas Haddington Ventures
Southern Company McKinsey & Company SUEZ Energy North America Toyota Motor North America
We also acknowledge the generous interest and support of CEE’s wide network of business, government
and research colleagues in the U.S. and worldwide who engage primarily through our Think Day
seminars and mid-year and annual conferences for research reviews in input. We also benefit from their
ongoing interactions and peer reviews. In particular we recognize CEE’s boards of advisors.
Global Advisory Board: Vicky Bailey, BHMM Energy Services
Hal Chappelle, Alta Mesa
Juan Eibenschutz, CNSNS-Mexico
Herman Franssen, EIG
Luis Giusti, CSIS
Sheila Hollis, Duane Morris
Ernesto Marcos, Marcos y Asociados
Ed Morse, Citibank
Hisanori Nei, National Graduate Institute for Policy
Studies
Bob Skinner, University of Calgary
Analytics/Modeling Advisors: Les Deman, Consultant
Bill Gilmer, University of Houston
Ed Kelly, IHS Markit
Dave Knapp, EIG
Don Knop, Consultant
Rae McQuade, NAESB
Andrew Slaughter, Deloitte
Bruce Stram, BST Ventures
Terry Thorn, Consultant

April 2017, BEG/CEE China/India Gas Demand, Page 7
PREFACE
This research paper is part of a body of work undertaken to better understand demand for natural gas in
key world regions and implications for natural gas trade over the next 20 years. The research is being
conducted by the Bureau of Economic Geology’s Center for Energy Economics, The University of Texas at
Austin, with external collaborators and peer reviewers. Research and preparation of this paper was led
by Miranda Wainberg, Senior Energy Advisor and Michelle Michot Foss, Chief Energy Economist and
Program Manager with extensive support from Gürcan Gülen, Senior Energy Economist and Research
Scientist and Danny Quijano, Economist and Research Associate.
To address the complexity of these large and dominant markets, the CEE team took several steps: a
research seminar on China in March 2015; presentation of research concept and early observations at
the World Gas Conference in Paris, June 2015 (by Dr. Michot Foss); a research seminar on Asia natural
gas trends with a focus on China and India in September 2015; and a research seminar on initial findings
and draft conclusions on the combined China/India report in May 2016 (along with review of a separate
report on global LNG supply trends by Andy Flower, including Mr. Flower’s own views on China and India
energy and natural gas developments). Peer reviewers for this paper were: Dr. Michelle Michot Foss,
Principal Investigator for CEE’s global gas and LNG research; Dr. Gürcan Gülen, research scientist and
senior energy economist; Mr. Guy Dayvault, Energy Deal Solutions; Dr. Donald Knop, CEE analytics and
modeling advisor; Dr. Bhamy Shenoy, CEE India/Asia advisor; and Ms. Deniese Palmer-Huggins, CEE
senior energy advisor.
Preparation of this paper benefitted from past CEE research team project experience in China and India,
including work funded through the U.S. Agency for International Development (USAID), as well as broad
and diverse research and projects related to natural gas and LNG development and use in roughly 20
countries over the years. Readers are invited to explore CEE’s Global Gas and LNG page,
http://www.beg.utexas.edu/energyecon/GlobalGas-LNG/, for a summary of experience and outputs.
The research team benefits from a broad network of collaborators with whom we maintain ongoing
exchanges. In particular we recognize the following: research staff at the IEA, who were generous with
their time on historical and outlook data series; The Energy Research Institute (TERI) in India which
helped with current data gathering; Professor Xiaojie Xu, a long-time CEE collaborator, Institute of World
Economics and Politics, Chinese Academy of Social Sciences; colleagues at the Oxford Institute for
Energy Studies, with whom we’ve had many interactions on these geographies; and the many energy
industry and government professionals who engage with us on a regular basis, in separate meetings as
well as our periodic seminars and regular annual meetings, as we perform our work.
Undertaking a deep exploration of patterns of energy use requires a strong dose of “data courage”. For
all of their size, market and political heft, China and India are woefully short in data transparency. The
result is a vast landscape of unreliable analysis, outlooks and forecasts upon which crucial decisions are
made. It also means that the governments themselves do not have the necessary information streams
to underpin the kinds of policy and regulatory strategies that are incumbent upon them in our modern
age. Whether the lack of timely and transparent data is intentional is not for us to say. The
consequence is a divergence between what could and what should be expected with respect to
potential outcomes, adding to the risks and uncertainties inherent in energy systems today.
.

April 2017, BEG/CEE China/India Gas Demand, Page 8
INTRODUCTION
Natural gas is expected to play an increasingly larger role in global energy portfolios owing to its
increasing abundance via pipelines and, especially liquefied natural gas (LNG), and its lower emissions.
China and, to a lesser extent, India have been seen as leading drivers of demand for natural gas.
Together, these two countries account for roughly a third of world’s population. Rapid economic growth
in these countries, especially China, in the 2000s was the locomotive of the world economy. However,
China (along with Brazil and Russia) has recently experienced a significant decline in gross domestic
product (GDP) growth.
In this report, we investigate the potential for natural gas demand growth in these countries within their
macroeconomic context, existing and emerging natural gas industry trends, and, most importantly,
commercial frameworks within each country that can facilitate or hamper the development of a vibrant
natural gas sector.
Both countries rely heavily on central planning rather than on markets and both countries have large
bureaucracies and rely heavily on state owned enterprises (SOEs). Both countries give lip service to
increased private sector economic participation and a smaller economic role for the state, and to
increased reliance on market forces.
India has tended to utilize the import substitution model of economic development. China has followed
the East Asian export promotion model of economic development. Consistent with the relative success
of those models elsewhere the Chinese approach has been more far more successful than the Indian
approach. China has grown much more rapidly, especially in the decade before the great recession and
has significantly higher per capita income.
India is more agrarian and has a smaller industrial sector though it does have a larger service sector.
India plans to increase the manufacturing share of GDP. Indian GDP growth is expected to continue to
average about 5 percent though that depends on successfully increasing its manufacturing sector share.
There is no reason to expect India to duplicate the double digit growth rates that China achieved prior to
the great recession.
China’s export promotion model resulted in rapid growth in both GDP and energy and other
commodities. China is now attempting to shift to a more consumption based economy. That means
much lower GDP growth and significantly lower energy and commodity demand growth due to the
lower GDP growth and falling energy and commodity intensity of GDP. China’s economic growth has
slowed significantly from double digit rates prior to the great recession to the 6 to 7 percent range.
Many analysts think the current growth rate may be even lower.
Future Chinese GDP growth is expected to average 5 to 6 percent. The transition to a consumption
based economy is likely to take a number of years, and there is considerable question how smoothly the
planned transition to slower growth and a more service and consumer oriented economy will go and
how long it will take. A “hard landing” has been avoided thus far but that does not mean that it will be
avoided. China is not likely to return to double digit GDP growth rates that were the norm a few years
ago.
Economic growth has led to serious urban air pollution problems in both India and China, which they are
attempting to address. Although environmental issues could lead to increased demand for natural gas at
April 2017, BEG/CEE China/India Gas Demand, Page 9
the expense of coal, it is not clear how much either country is willing to pay to internalize environmental
externalities, including those associated with carbon.
India and China GDP growth projections may prove too optimistic unless the global economy is able to
approach its pre Great Recession growth rates. China probably is the most vulnerable to weak global
growth given its higher reliance on export markets.
MACROECONOMIC CONTEXT FOR NATURAL GAS IN CHINA AND INDIA
Economic growth is a necessary but not sufficient condition for energy consumption in general and
natural gas consumption in particular. Natural gas demand growth in both China and India are no
exceptions. Although primary energy consumption growth has been more closely related to economic
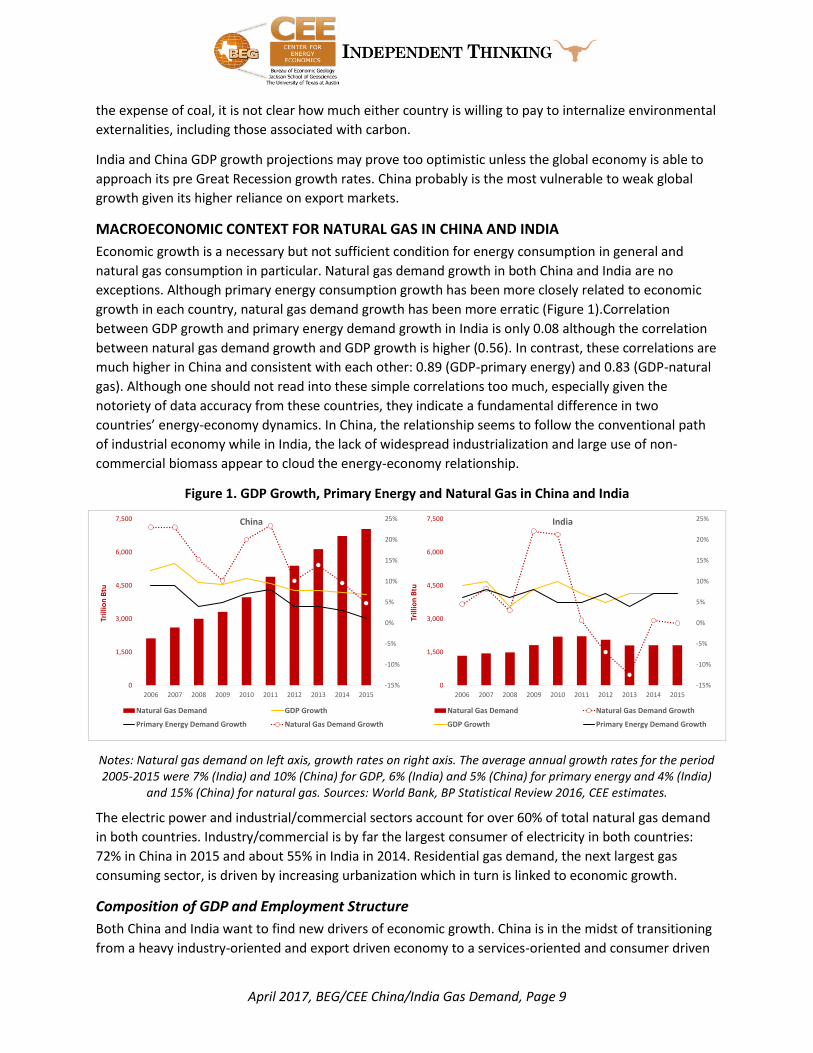
growth in each country, natural gas demand growth has been more erratic (Figure 1).Correlation
between GDP growth and primary energy demand growth in India is only 0.08 although the correlation
between natural gas demand growth and GDP growth is higher (0.56). In contrast, these correlations are
much higher in China and consistent with each other: 0.89 (GDP-primary energy) and 0.83 (GDP-natural
gas). Although one should not read into these simple correlations too much, especially given the
notoriety of data accuracy from these countries, they indicate a fundamental difference in two
countries’ energy-economy dynamics. In China, the relationship seems to follow the conventional path
of industrial economy while in India, the lack of widespread industrialization and large use of non-
commercial biomass appear to cloud the energy-economy relationship.
Figure 1. GDP Growth, Primary Energy and Natural Gas in China and India
Notes: Natural gas demand on left axis, growth rates on right axis. The average annual growth rates for the period 2005-2015 were 7% (India) and 10% (China) for GDP, 6% (India) and 5% (China) for primary energy and 4% (India)
and 15% (China) for natural gas. Sources: World Bank, BP Statistical Review 2016, CEE estimates.
The electric power and industrial/commercial sectors account for over 60% of total natural gas demand
in both countries. Industry/commercial is by far the largest consumer of electricity in both countries:
72% in China in 2015 and about 55% in India in 2014. Residential gas demand, the next largest gas
consuming sector, is driven by increasing urbanization which in turn is linked to economic growth.
Composition of GDP and Employment Structure
Both China and India want to find new drivers of economic growth. China is in the midst of transitioning
from a heavy industry-oriented and export driven economy to a services-oriented and consumer driven
-15%
-10%
-5%
0%
5%
10%
15%
20%
25%
0
1,500
3,000
4,500
6,000
7,500
2006 2007 2008 2009 2010 2011 2012 2013 2014 2015
Trill
ion
Btu
China
Natural Gas Demand GDP Growth
Primary Energy Demand Growth Natural Gas Demand Growth
-15%
-10%
-5%
0%
5%
10%
15%
20%
25%
0
1,500
3,000
4,500
6,000
7,500
2006 2007 2008 2009 2010 2011 2012 2013 2014 2015
Trill
ion
Btu
India
Natural Gas Demand Natural Gas Demand Growth
GDP Growth Primary Energy Demand Growth
April 2017, BEG/CEE China/India Gas Demand, Page 10
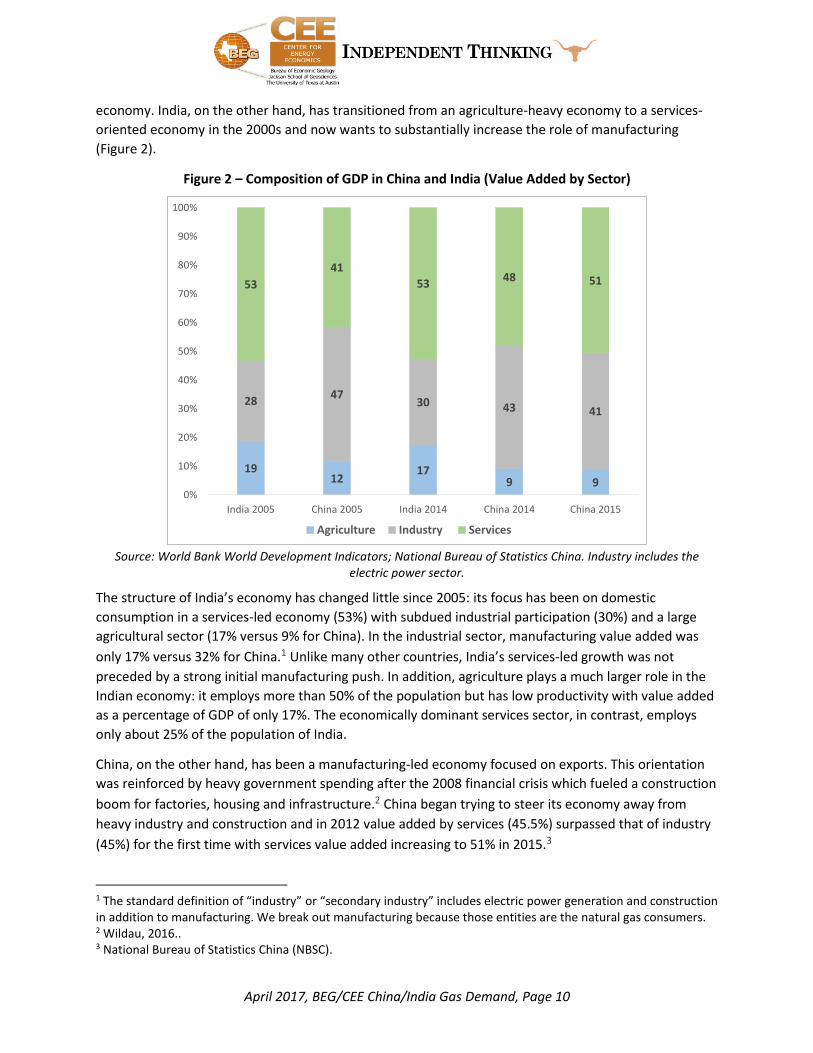
economy. India, on the other hand, has transitioned from an agriculture-heavy economy to a services-
oriented economy in the 2000s and now wants to substantially increase the role of manufacturing
(Figure 2).
Figure 2 – Composition of GDP in China and India (Value Added by Sector)
Source: World Bank World Development Indicators; National Bureau of Statistics China. Industry includes the
electric power sector.
The structure of India’s economy has changed little since 2005: its focus has been on domestic
consumption in a services-led economy (53%) with subdued industrial participation (30%) and a large
agricultural sector (17% versus 9% for China). In the industrial sector, manufacturing value added was
only 17% versus 32% for China.1 Unlike many other countries, India’s services-led growth was not
preceded by a strong initial manufacturing push. In addition, agriculture plays a much larger role in the
Indian economy: it employs more than 50% of the population but has low productivity with value added
as a percentage of GDP of only 17%. The economically dominant services sector, in contrast, employs
only about 25% of the population of India.
China, on the other hand, has been a manufacturing-led economy focused on exports. This orientation
was reinforced by heavy government spending after the 2008 financial crisis which fueled a construction
boom for factories, housing and infrastructure.2 China began trying to steer its economy away from
heavy industry and construction and in 2012 value added by services (45.5%) surpassed that of industry
(45%) for the first time with services value added increasing to 51% in 2015.3
1 The standard definition of “industry” or “secondary industry” includes electric power generation and construction in addition to manufacturing. We break out manufacturing because those entities are the natural gas consumers. 2 Wildau, 2016.. 3 National Bureau of Statistics China (NBSC).
1912
179 9
2847
30 43 41
53
41
5348 51
0%
10%
20%
30%
40%
50%
60%
70%
80%
90%
100%
India 2005 China 2005 India 2014 China 2014 China 2015
Agriculture Industry Services

April 2017, BEG/CEE China/India Gas Demand, Page 11
In its 2015 World Energy Outlook (WEO15), the International Energy Agency (IEA) points out that
industry-led growth requires at least 10 times more energy per unit of value added compared with
services-led growth; the services sector is also more electricity intensive.4 In a services-led economy,
natural gas demand growth relies more on power sector gas consumption to offset decreases in
manufacturing gas consumption.
In both countries, the state is a significant participant in the economy, often through state-owned
enterprises (SOEs) in key sectors such as energy. Both countries would like, in varying degrees, to see
private sector economic participation grow and the economic role of the state reduced. There has been
rhetoric in both countries about allowing, to some extent, free market forces to influence their
economies.5
Both India and China are trying to make major structural reforms to their economies without heavily
damaging GDP growth and employment in the process-a very difficult balancing act. To further
complicate the process, economic growth has led to serious urban air pollution problems in both
countries and the costs of addressing those problems are an additional burden on their economies.
Although environmental issues could lead to increased demand for natural gas at the expense of coal, it
is not clear to date whether either country is willing to absorb the full costs of carbon penalties.
GDP Growth and Industrial Structures in China and India
Forecasts of long term GDP growth are around the 6%/year level, some declining below that beginning
2020-2025 (Figure 3). Average growth between 2014 and 2035 is estimated at 5% in BP Energy Outlook
2016.
Figure 3. Historical and Forecasted GDP Growth Rates
Source: World Bank for actuals; ExxonMobil 2016 Outlook for Energy (EM); Energy Information Administration International Energy Outlook 2016 (EIA); International Energy Agency World Energy Outlook 2015 (IEA); World
Bank Global Economic Prospects, 2016 (WB); International Monetary Fund Country Report No. 15/234 for China, World Economic Outlook for India (IMF); BMI Research China Oil & Gas Report Q3 2016 (BMI).
4 IEA WEO15. 5 “Calibrated market freedom” is the Indian phrase.
0%
1%
2%
3%
4%
5%
6%
7%
8%
9%
10%
11%
12%
13%
14%
15%
2006 2007 2008 2009 2010 2011 2012 2013 2014 2015 2016 2017 2018 2019 2020 2025 2030
China
Actual EM EIA
IEA WB IMF Reform
IMF No Reform BMI AVERAGE
0%
1%
2%
3%
4%
5%
6%
7%
8%
9%
10%
11%
12%
13%
14%
15%
2006 2007 2008 2009 2010 2011 2012 2013 2014 2015 2016 2017 2018 2019 2020 2025 2030
India
Actual EM EIA IEA WB IMF BMI AVERAGE

April 2017, BEG/CEE China/India Gas Demand, Page 12
China’s GDP growth rate moderated to 6.9% in 2015, down from 7.3% in 2014, and government officials
are forecasting a growth rate of 6.5% for 2016. The International Monetary Fund (IMF) expects GDP
growth of 6.3% in 2016 and 6% in 2017 reflecting weaker investment growth as the economy continues
to rebalance.6
Industrial overcapacity and debt in China
The value added to GDP by the industrial sector continued to grow in 2015 but at a lower rate (Figure 4).
However, total profits for industrial enterprises decreased 2.3% in 2015 with industrial SOEs’ profits
falling 22%.7 In addition, industrial output continued to fall; the Caixin manufacturing China Purchasing
Managers Index (PMI) has indicated a manufacturing contraction since March 2015 through June 2016.8
In fact, the PMI has been below 50 (indicating a contraction) most of the time since 2012. China’s faster-
than-expected slowdown in exports (25% year-on-year in early 2016) highlight the need for greater
growth in domestic consumption to reach government GDP targets.
Figure 4. China Industrial Enterprises Value Added and Growth Rate (%)
Source: World Bank
China is struggling with massive overcapacity and high debt levels9 in its manufacturing sector: energy
intensive steel, non-ferrous metals (aluminum, copper, bauxite), building materials (cement, glass),
6 IMF, World Economic Outlook Update, 1/19/16. 7 The SOEs are clustered in energy, steel, coal, shipbuilding and heavy machinery. 8 The Caixin manufacturing China PMI is derived from a survey of 430 industrial companies on five indexes that are then combined with the following weights: New Orders-30%; Output-25%; Employment-20%; Suppliers’ Delivery Times-15% and Stock of Items Purchase-10%. 9 Macquarie Securities estimates that SOE debt at the end of 2015 was about 88% of GDP; private company debt was 55% of GDP (143% of GDP total corporate). Standard & Poor’s estimates that corporate debt is 160% of GDP.
0%
5%
10%
15%
20%
25%
30%
35%
$0
$500
$1,000
$1,500
$2,000
$2,500
$3,000
$3,500
$4,000
$4,500
$5,000
2007 2008 2009 2010 2011 2012 2013 2014
Bill
ion
USD
Value Added China Growth Rate China

April 2017, BEG/CEE China/India Gas Demand, Page 13
chemicals, and refining. If China significantly reduces capacity and output from these industries, it will
have a negative impact on natural gas demand. Some of these industries will decline but the pace and
magnitude of the declines are uncertain. Although the government recognizes the need to reduce
overcapacity in these industries, progress has been muted to date due to government fears about
unemployment and social unrest. Instead of closing the unprofitable SOEs that dominate these sectors,
the government seems to be relying on mergers, reorganizations and debt restructuring to minimize
“discomfort.”10 The number of SOEs continues to grow, increasing from 110,000 in 2008 to about
160,000 in 2014.11
Government spending has been increasing in an effort to maintain growth and accounted for 36% of the
investment in fixed assets in 2015. Central and local government debt as a percentage of GDP increased
from 51% and 21%, respectively, in 2014 to 53% and 33% in 2015.12 China’s total debt (government,
corporate and household) has quadrupled since 2007 and was almost 250% of GDP at the end of 2015.13
In early 2016 the central government announced a series of actions designed to stimulate investment
and spending including:
1. A reduction in the reserve requirements of banks, responsible for about 70% of all lending in China,
in an effort to stimulate lending;
2. A reduction in businesses taxes (the central government will take over some local government debt
as local government revenues will be reduced by the tax cut14); and
3. The central government will increase its budget deficit to 3% from 2.3% in 2015 to inject spending
and investment into the economy.
These actions suggest that the “gradual rebalancing” of China’s industrial sector will be a prolonged
process. At this time, the government appears unwilling to risk the social turmoil that could result from
harsher and more immediate measures. It has launched the “One Belt, One Road” initiative with the
hope that the infrastructure investment required by the project would be an outlet for some of China’s
excess industrial capacity.15 However, there has been limited concrete progress (construction contracts
signed, financings established) to date and critics maintain that there are many operational challenges
to overcome, not the least of which is the coordination among multiple central government institutions,
UBS estimates that China’s total debt in January 2016 was 260% of GDP. Sources: Wall Street Journal 3/7/16, 2/25/16, 3/2/16 and 3/6/16; Moody’s 3/2/16. 10 Wall Street Journal, 3/5/16 and 3/8/16. 11 Kroeber (2016). 12 He, L., 2016. 13 The Guardian, 2016. 14 The Wall Street Journal, 3/7/16. 15 Goodman, 2004. The OBOR initiative was announced by President Xi Jinping in late 2013 with the dual objectives of (1) expanding China’s international presence and economic impact and (2) helping to absorb China’s massive industrial overcapacity and developing poor underdeveloped western provinces (Johnson, 2016). Some researchers like Johnson think that the domestic economic objectives are paramount. OBORs initial focus is building an economic corridor in Central and Southeast Asia along the geographic lines of the ancient Silk Road. Regional connectivity will be enhanced by building transport infrastructure and establishing industrial and financing projects. A $40 billion Silk Road Fund backed by three large Chinese financial institutions, including its sovereign wealth fund, became active in 2015. The Bank of China plans to extend $120 billion in credit to OBOR-related projects between 2015 and 2018. The Asian Infrastructure Investment Bank (AIIB) is also expected to finance OBOR construction. OBOR is the creation of President Xi Jinping and has his strong personal support.

April 2017, BEG/CEE China/India Gas Demand, Page 14
multiple provincial governments, SOEs and private companies. Similar operational challenges hobbled
previous “develop the west” initiatives like President Jiang Zemin’s Great Western Development
campaign of the 1990s (Goodman, 2004).
In March 2016 Moody’s changed the outlook on China’s sovereign debt rating from “stable” to
“negative” citing further possible fiscal weakening if underlying economic growth, excluding policy-
supported economic activity, remained weak.16 Moody’s singled out “high and rising” SOE leverage as
increasing the risk of a sharp economic slowdown and/or further deterioration of bank asset quality.
However, Moody’s did point out that the Chinese government has some time and room to maneuver as
large domestic savings continue to fund government debt at affordable levels. The IMF said in August
2015 that stabilizing near-term GDP growth at around 7% by relying on the old growth engines of credit
and investment could lead to a protracted period of significantly slower growth post-2017 (IMF No
Reform in Figure 3).
Overall the “rebalancing” of the industrial landscape in China is negative for natural gas demand. Key
developments to monitor include government policies that affect the pace and magnitude of the
slowdown in energy intensive manufacturing such as mandated capacity reductions, bank lending and
other financing policies, SOE restructuring, local government policies that may be inconsistent with
central government initiatives, subsidy levels, global trade actions that affect exports and the level of
government investment in and support for these industries.
India’s Plans to Increase Share of Industrial Output
India’s development path has been different from that of China (and those of many other countries).
Typically, economic growth follows a path from agriculture to industry and then finally to services. In
contrast, Indian economy grew fast, especially since the early 2000s) on the basis of the services sector
with the industrial sector trailing. As a result, the share of manufacturing in GDP remained in the range
of 16-17% in India while it was more than 40% in China in the mid-2000s although the maturing
economy in China with the help of an emerging middle class started to shift to services and the share of
manufacturing declined to 36% by 2014, still more than twice as large as in India (Figure 5).
16 Moody’s, 3/2/16.

April 2017, BEG/CEE China/India Gas Demand, Page 15
Figure 5. Manufacturing Value Added as Percentage of GDP
Source: World Bank World Development Indicators
Although India’s GDP has been growing (previous Figure 3), China’s GDP is five times the size of India’s
($10 trillion versus $2 trillion) and India’s GDP per capita is low relative to other emerging economies,
one fifth of that of China. Note, however, that in terms of purchasing power, the differences narrow
according to the World Bank statistics. Chinese GDP in PPP terms is only 2.5 times as large as India’s
GDP; and Chinese GDP per capita is only 2.3 times as large. The last poverty rates, measured as percent
of population living on $3.10/day or less in purchasing power terms, reported for the two countries by
the World Bank (World Development Indicators) were 58% for India (2011) and 27% for China (2010).
As such, India’s economic growth issues are quite different from those of China. Instead of trying to curb
runaway industrialization like China, India wants to increase the role of manufacturing in its services-led
economy from 17% of GDP value added in 2013 to 25% by 2022 and adding 100 million jobs to the
sector (Figure 5). The Modi administration has a specific “Make in India” policy to support that goal.
There is a growing realization that services-led growth is not delivering the employment opportunities
needed by India’s expanding labor force.17 If this manufacturing policy is successful, particularly in
energy intensive sectors such as chemicals, steel, aluminum, paper and cement, demand for natural gas
should grow more rapidly than it has done in the past.
There are challenges facing India’s “Make in India” manufacturing policy. Both public and private capital
investment have been weak (Figure 6) reflecting high leverage and weak profitability in the corporate
sector, limited lending capacity and continued asset quality deterioration in the banking sector and the
limited ability of the central government to make much needed economy-stimulating investments.
17 Government of India, Economic Survey 2014-2015.
15%16% 16%
15% 15% 15%
18% 18%17% 17%
41%42%
41% 41%39%
40% 40%38%
37%36%
0%
5%
10%
15%
20%
25%
30%
35%
40%
45%
2005 2006 2007 2008 2009 2010 2011 2012 2013 2014
India China

April 2017, BEG/CEE China/India Gas Demand, Page 16
India’s gross fixed capital formation averaged 31% of GDP from 2005 through 2014 compared to 40% in
China and its growth rate was about 4% p.a. 2012-2014.
Figure 6. Gross Fixed Capital Investment in India as Percentage of GDP
Source: World Bank Development Indicators
Figure 7. Subsidy Burden in India
Source: IMF Country Report 16/75, page 68, March 2016
With respect to government investment, India is constrained by a relatively high total government debt
(66% as of early 2015 compared to about 42% for China at the same time18) and a subsidy burden equal
18 Trading Economics, Government Debt to GDP, http://www.tradingeconomics.com/china/government-debt-to-gdp.
23% 23%25% 24% 23% 23%
26%24%
22% 21%
7% 8%
8%8% 9% 8%
8%
7%8%
8%
0%
5%
10%
15%
20%
25%
30%
35%
2005 2006 2007 2008 2009 2010 2011 2012 2013 2014
Private Sector Public Sector

April 2017, BEG/CEE China/India Gas Demand, Page 17
to about 2% of GDP.19 As a result, interest expense and subsidies account for about 40% of total
government spending and capital expenditures account for about 15%.20 Subsidy expenditure has begun
to decline as India has eliminated and reformed certain subsidies and other subsidies have decreased
with crude oil prices (Figure 7) and is expected to fall 3% in 2016-17.21 Government capital expenditures
are budgeted to increase a modest 3.9% in 2016-17, following a 21% increase in 2015-16, for investment
in ports, roads, rail, irrigation and other infrastructure projects. This level of investment was a
disappointment to many in the business community but India is under some pressure to contain its fiscal
deficit.22 The weak private investment picture is partly explained by the large inventory of stalled
projects in India (Table 1), which was equivalent to 6.9% of GDP at the end of 2014: 5.5% in the private
sector and 1.4% in the public sector.23 The overhang of stalled projects limits new capital investment.
Table 1. Stalled Projects (by value) as a fraction of GDP
Year Government Private Total
2011-12 2% 5.7% 7.7%
2012-13 1.9% 6.1% 8.9%
2013-14 1.8% 6.5% 8.3%
2014-15(till Q3) 1.4% 5.5% 6.9% Source: GOI Economic Survey 2014-15.
Most of the stalled projects in the private sector are in manufacturing, including steel, cement, garment
and food processing. As a result, the value of new investment projects minus the shelved projects are
reported as negative in many quarters during 2013 and 2014 (Figure 8). Most of the stalled projects in
the public sector are in the power sector and non-financial services; manufacturing forms the major
component of stalled projects in the private sector.24 The top reason for stalling in manufacturing
projects is poor market conditions, including weak demand.25
Electric generation projects in both the public and private sectors are stalled due to fuel curtailment
(coal and natural gas, at subsidized prices) and the near bankruptcy of many electric distribution
companies.26 In later sections we discuss India’s fuel pricing policies and implications for both fuel
curtailments (supply) and infrastructure. Public projects also are stalled due to land acquisition
problems, lack of non-environmental clearances due to “policy paralysis” and lack of funds.27 Private
projects are stalled due to unfavorable market conditions, lack of promoter interest, and lack of non-
environmental clearances.28
19 The Chinese government does not report its subsidies like India does. 20 Standard & Poor’s 2015. 21 The fiscal year in India starts in April and runs through March of the following year. 22 IMF 3/2/16 Country Report No. 16/75. 23 GOI Economic Survey 2014-15. 24 Ibid. 25 Information from IMF and/or Government of India Budget Explanation. 26 Ibid. 27 Ibid. 28 Ibid.

April 2017, BEG/CEE China/India Gas Demand, Page 18
The stalling rate began to plateau in 2014-15 and the inventory of stalled projects decreased slightly.
Due to the limitations on government investment, private investment remains the primary engine of
long-term growth.
Figure 8 – Public and Private Investment in India’s Key Sectors
Source: IMF country Report 15/62, page 56, March 2015
India’s Corporate Sector
A private sector “asset bubble” is not inconsistent with the data. Some analysts think that Indian private
corporations face a classic debt overhang problem in the aftermath of a debt-fueled investment bubble,
further exacerbated by difficulties in devising an exit strategy from poor projects. India has weak
institutions relating to bankruptcy (Debt Recovery Tribunals, Asset Restructuring Companies) which
makes exit procedures from poor projects inefficient and time consuming. The Modi government has
implemented some measures to streamline resolution of insolvent projects.
Corporate leverage in India is about 150 (debt-to-equity), among the highest in emerging markets. The
top one percent of companies in India account for half of the overall debt. Infrastructure sector,
including electric power, gas and water, accounts for 35% of corporate debt.29 The gas, water and
electricity sector has the second highest debt-to-equity ratio at an average of about 150, following the
construction sector at an average of about 225 (Figure 9).
The Modi government has enacted many positive reforms including improved governance of public
sector banks; an Rs 200 billion fund for infrastructure; new bankruptcy and debt restructuring
procedures; a 5% corporate tax decrease; subsidy rationalization; a revised coal mine leasing process;
liberalization of foreign direct investment policy; an urban development initiative and a scheme to
29 IMF Country Report No. 16/76, March 2016.

April 2017, BEG/CEE China/India Gas Demand, Page 19
financially restructure debt-laden state-owned power distribution companies, among others. However,
to date the government has not succeeded in obtaining key legislation addressing the goods and
services tax (GST) and a more industry-favorable land acquisition policy and its overall reform
implementation capacity is uncertain. Both the GST and the land acquisition legislation are perceived as
critical to India’s further economic progress and setbacks in these areas have helped tilt overall
economic risks to the downside.30
Figure 9 – Health of the Indian Corporations
Source: IMF country Report 16/76, page 7, March 2016
Due to the limitations on government investment, private investment remains the primary engine of
long-term growth. However, the pace and strength of private sector investment recovery is uncertain as
is the outlook for natural gas demand growth in the manufacturing sector. Key developments to monitor
include:
1. the pace and magnitude of private and public sector investment, particularly those that affect
energy intensive industries;
2. further implementation of subsidy reforms that free up public capital;
3. the passage of the GST and land acquisition legislation together with additional labor market
reforms;
4. the inventory of stalled projects and the pace of stalling and resolution;
5. private sector profitability and debt levels; and
6. the pace and magnitude of electric distribution companies restructuring.
30 Modi’s BJP party does not control the upper house of Parliament and the opposition has been able to block the proposed GST and land acquisition legislation.

April 2017, BEG/CEE China/India Gas Demand, Page 20
NATURAL GAS MARKET CHARACTERISTICS
China’s natural gas market is about four times the size of India’s: 197 BCM versus 51 BCM in 2015.
Contributing to the size differential between the Chinese and Indian natural gas markets are significant
differences in the size, integration and geographical reach of their gas infrastructure. Development of
the natural gas resource base, gas import capacity and the associated gas delivery infrastructure is
significantly more advanced in China than India (Table 3). China’s domestic gas production has increased
more rapidly than India’s growing at an average annual rate of 11% 2005-2015 compared to less than
1% in India over the same period. As a result, India’s reliance on imports as a percentage of total gas
supplies was 43% in 2015 compared to 30% in China.
Despite its larger size, China’s gas infrastructure is not well integrated and is concentrated in four areas
around Beijing and Bohai Bay, Shanghai and the Yangtze River delta and central west Chongqing. There
are regional and local gaps, especially in the northeast and growing southeastern coastal areas as well as
lack of delivery capacity between some gas import terminals and demand centers. China has a growing
space heating market in the northern parts of the country but lacks the gas storage capacity necessary
to manage seasonal swings in demand. China’s gas infrastructure may not have the flexibility needed to
perform peaking and other load balancing services for the power industry.
India’s gas infrastructure is much less extensive and more highly fragmented than China’s. India’s
domestic gas production has been declining since 2012 in part due to lack of investment in the upstream
sector which in turn is partly due to a government administered natural gas pricing system that does
incentivize upstream investment. 40% of India’s gas pipeline and distribution infrastructure is only in the
two western states of Gujurat and Maharashtra. It is difficult to extend the gas delivery infrastructure in
India and/or build new import terminals due to limited capital markets and significant land acquisition
problems as well as the myriad of problems afflicting the expansion of any industrial activity in India.
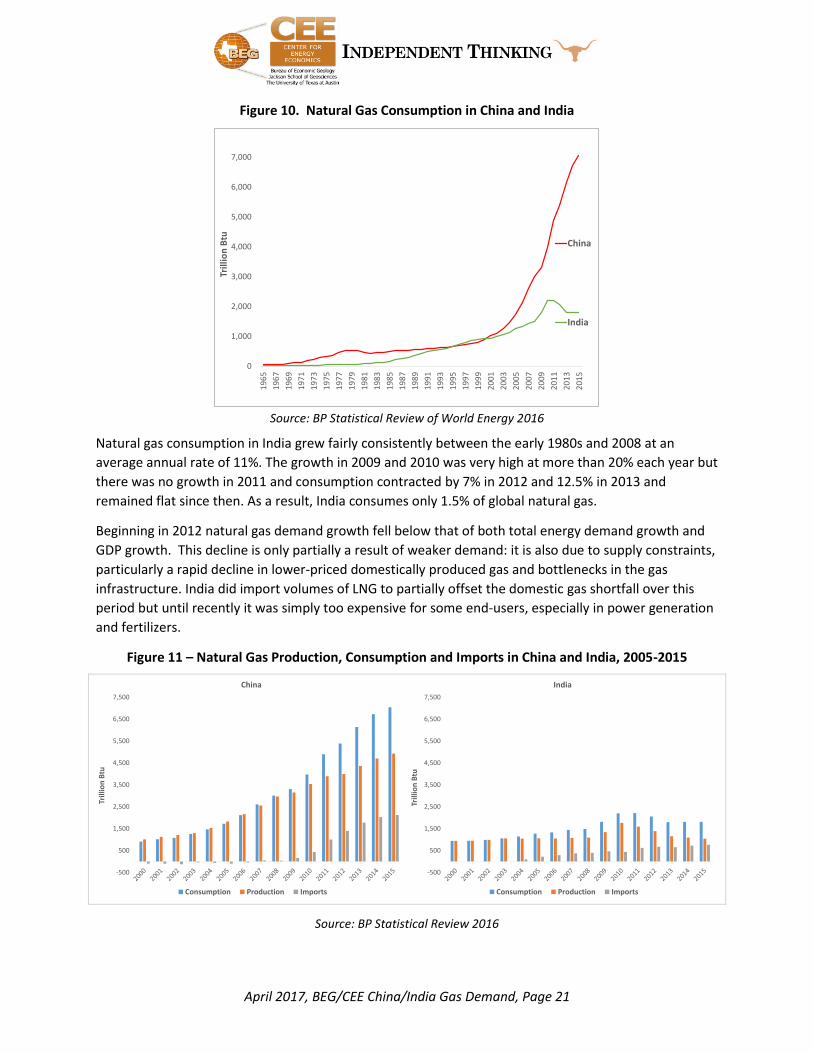
Historical Trends in Natural Gas Consumption
Neither country was a major consumer of natural gas until the early 2000s (Figure 10). However,
Chinese consumption of natural gas started to grow exponentially in the early 2000s. Between 2009 and
2010, growth was 20.1% with additional growth of 23.3% between 2010 and 2011. Between 1999 and
2011, average annual growth rate was more than 16%, outpacing GDP growth of about 10%. This
growth slowed down significantly in recent years, to 4.7% from 2014 to 2015, still faster than the growth
in primary energy demand at about 1%. It is noteworthy that the service sector’s contribution to GDP
(45.5%) surpassed that of industry (45%) for the first time in 2015.
Despite the recent slowdown in gas demand growth, average annual growth between 1999 and 2015
was still close to 15%. In contrast, coal demand grew by about 5% per year on average over the same
period. As a result of this growth, China accounted for 5.7% of global gas consumption in 2015 as
compared to 4.2% in 2011 and 1% in 2000. The primary drivers of gas demand growth were the large
expansions in manufacturing and power sector gas demand, which grew at 16% and 22%, respectively
between 2005 and 2015. The growth of natural gas consumption in China has been supported by the
expansion of import projects such as long-distance pipelines from Central Asia and Myanmar, and LNG
import terminals.
April 2017, BEG/CEE China/India Gas Demand, Page 21
Figure 10. Natural Gas Consumption in China and India
Source: BP Statistical Review of World Energy 2016
Natural gas consumption in India grew fairly consistently between the early 1980s and 2008 at an
average annual rate of 11%. The growth in 2009 and 2010 was very high at more than 20% each year but
there was no growth in 2011 and consumption contracted by 7% in 2012 and 12.5% in 2013 and
remained flat since then. As a result, India consumes only 1.5% of global natural gas.
Beginning in 2012 natural gas demand growth fell below that of both total energy demand growth and
GDP growth. This decline is only partially a result of weaker demand: it is also due to supply constraints,
particularly a rapid decline in lower-priced domestically produced gas and bottlenecks in the gas
infrastructure. India did import volumes of LNG to partially offset the domestic gas shortfall over this
period but until recently it was simply too expensive for some end-users, especially in power generation
and fertilizers.
Figure 11 – Natural Gas Production, Consumption and Imports in China and India, 2005-2015
Source: BP Statistical Review 2016
0
1,000
2,000
3,000
4,000
5,000
6,000
7,000
19
65
19
67
19
69
19
71
19
73
19
75
19
77
19
79
19
81
19
83
19
85
19
87
19
89
19
91
19
93
19
95
19
97
19
99
20
01
20
03
20
05
20
07
20
09
20
11
20
13
20
15
Trill
ion
Btu
China
India
-500
500
1,500
2,500
3,500
4,500
5,500
6,500
7,500
Trill
ion
Btu
China
Consumption Production Imports
-500
500
1,500
2,500
3,500
4,500
5,500
6,500
7,500
Trill
ion
Btu
India
Consumption Production Imports

April 2017, BEG/CEE China/India Gas Demand, Page 22
Role of Natural Gas in Total Primary Energy
Both countries are heavily dependent on coal and oil despite years of policies to promote natural gas,
renewables and nuclear (Figure 12). India is also heavily dependent on non-commercial biomass
(estimated at 21% on the basis of IEA’s World Energy Outlook 2015). In 2015, coal accounted for 64% of
total primary energy consumption in China and 46% in India (58% of commercial energy). Oil was in
second place in both countries with 19% in China and 22% in India (28% of commercial energy). It is
highly likely that heavy subsidies, especially in India, inflated the role of oil and coal in both countries.
Still the transition is taking place; natural gas accounted for almost 6% of China’s total primary energy
consumption in 2015 up from 2% in 2005 whereas coal’s share declined from 72% to 64%. Reasons for
the declining share of coal include replacement of old coal fired generation plants with more efficient
supercritical technology and policies mandating the reduction of coal use in industrial applications.31
Figure 12. Distribution of Primary Energy in China and India, 2015
Note: About one-third of the Chinese population have no clean cooking facilities and use coal and biomass. The NBSC does not include biomass in its primary energy reporting. IEA estimated china “bioenergy” at 216 MTOE in 2013 or 7% of total primary energy demand (TPED). In India, IEA says bioenergy is 188 MTOE in 2013 or 24% of
TPED.32 Source: BP Statistical Review of World Energy 2016, CEE estimates for biomass in India based on IEA WEO 2015.
In India, the share of natural gas in total primary energy mix has not changed significantly since 2000.
Coal’s share of primary energy demand has grown due to expansion of the coal-fired power generation
fleet and increased use of coking coal in the steel industry. The use of biomass has declined as other
fuels, principally LPG and, to a lesser extent, natural gas is used for cooking.
Natural Gas Supplies
Although China and India have locations where natural gas resources could be exploited, neither one
has an endowment large enough to support potential demand (should gas truly make incursions into
applications and segments dominated by other fuels). Thus, both countries are faced with importing
31 Per the IEA, China has contributed most to the global increase in coal power plant efficiency as it built numerous advanced coal plants while retiring inefficient plants. China’s coal-fired plant efficiency is now equal to that of OECD countries. (IEA, WEO 2015). 32 IEA WEO 2015.
64%
19%
8%
6%2% 1%
ChinaTotal: 121,762 Trillion Btu
Coal Oil Hydro Gas Renewables Nuclear
46%
22%
3%
5%
2%1%
22%
IndiaTotal: 35,439 Trillion Btu
Coal Oil Hydro Gas Renewables Nuclear Biomass

April 2017, BEG/CEE China/India Gas Demand, Page 23
enough quantities of natural gas to satisfy customer requirements. Both pipeline and LNG import
deliveries are challenged by infrastructure, costs and myriad inadequacies in forming internal gas price
signals. Maps of gas basins, where some production is located, demand centers and infrastructure are
provided in Figure 45and Figure 47 in APPENDIX 1.
China’s gas production grew at an average annual rate of 13.5% during 2005-2015 compared to a 15%
growth rate in gas demand over the same period. In contrast, India’s gas production grew less than 1%
2005-2015 compared to a 4% growth rate in demand.
Figure 13. China and India Gas Production (BCM), Gas Imports (BCM) and Production Growth Rates %
Source: BP SR 2016. Growth rates are annual averages.
Table 2. Snapshot of China and India Natural Gas Supplies
Indicator China India
2015 Proved Gas Reserves TCM 3.8 1.5
2015 Gas Production BCM 138 29
2015 Gas Imports BCM/ Percent of Total Gas Supply Percent Pipeline Percent LNG
59/30% 58% 42%
22/43% 0%
100% Source: BP SR 2016
Gas production in China is dominated by its three state-owned national oil companies: PetroChina,
Sinopec and CNOOC. PetroChina controlled 68% of 2014 gas production, followed by Sinopec (16%) and
CNOOC (11%).33
33 Energy Insights, McKinsey, 2016.
-20%
-10%
0%
10%
20%
30%
40%
0
20
40
60
80
100
120
140
160
2005 2006 2007 2008 2009 2010 2011 2012 2013 2014 2015
BC
M
China Gas Production China Gas Imports
India Gas Production India Gas Imports
Growth Rate China Production Growth Rate India Production

April 2017, BEG/CEE China/India Gas Demand, Page 24
The Ordos basin is China’s largest gas producing region accounting for 31% of total gas production in
2014.34 State-owned PetroChina, together with some international oil company partners, are beginning
to exploit the largest fields’ tight gas resources which could possibly add 30 BCM of new production.
PetroChina’s Tarim field is the second largest gas producer in the country accounting for 18% of 2014
production. It was developed in 1989 and reached peak production in 1989; PetroChina thinks it has
undiscovered resources in the field.
The Sichuan basin has two high-sulphur gas fields operated by state-owned Sinopec one of which
peaked in 2012 and the other began production in 2014. Offshore gas production is led by state-owned
CNOOC and its large gas field in the western South China Sea which has been declining. CNOOC expects
a pipeline of exploration and production projects to contribute to increased gas production post-2018.
China’s shale gas resources are estimated to be the largest in the world but production to date has been
disappointing due to difficult geological and topographical conditions, relatively high costs and
insufficient pipeline infrastructure, among others.35 There are wide-ranging forecasts of possible shale
gas production in 2020 of 15-30 BCM.36
The forecasts we reviewed have wide-ranging estimates of future Chinese natural gas production by
2030 from 160-400 BCM due to differing views on potential shale gas, tight gas and coal bed methane
production. Given the uncertainties surrounding China’s unconventional gas resources, our view is
closer to the lower end of the forecasts.
The bulk – some 75% – of India’s proved natural gas reserves are offshore and slightly more than half of
these offshore reserves were controlled by state-owned ONGC. State-owned OIL and ONGC control 92%
of India’s onshore proved gas reserves.37 In 2004 a large gas discovery in India’s eastern offshore region,
Krishna-Godavari (KG) D6, was made by BP and Reliance Industries. Production from KG D6 began in
2009, peaked in 2010 and began to decline at a faster than expected rate thereafter accounting for most
of the decline in India’s gas production 2005-2015. Analysts believe that up to 10 BCM in production
could be restored at the KG D6 fields with additional development expenditures. However, the KG D6
partners have been unwilling to make the capital investment to date due to an ongoing price dispute
with the government.38
The Krishna Godavari basin offers the highest prospect for gas production growth according to BMI
Research. Deepwater KG development requires prices of around $7.15/MMBtu compared to today’s
$3.15/MMBtu.39 Indian producers have been saying for several years that gas prices of $6.00-
$7.00/MMBtu are necessary to revive gas production, with most of the new production coming post-
2020.40 BMI thinks that higher prices would unlock a number of shale gas and coal bed methane projects
that have been difficult to get off the ground.41
34 BMI Research, 2016, China Oil & Gas Report Q4 2016. 35 Energy Insights, McKinsey, 2016. 36 Ibid. 37 GOI Vision 2030. 38 BMI Research, 2016, India Oil & Gas Report Q4 2016. 39 Ibid. 40 Sen, A., 2015 and GOI Vision 2030. 41 BMI Research, 2016, India Oil & Gas Report Q4 2016.

April 2017, BEG/CEE China/India Gas Demand, Page 25
The forecasts we reviewed either expect continued declines in domestic gas production through 2025
from 38 BCM to 27 BCM or increases from 38 BCM in 2014 to 40-63 BCM in 2030. Our view is closer to
the less aggressive scenarios given the lack of upstream incentives in the current pricing mechanisms,
the slow pace of upstream energy reform and the difficult struggle to increase production at KG D6.
Natural Gas Infrastructure
A well-connected and pervasive gas transport network with sufficient storage capacity (preferably large
underground storage with good geographic diversity) to handle seasonal and daily demand variations
are necessary for a robust natural gas market. Both countries, India especially, need significant future
infrastructure investment in order to meet the natural gas demand envisioned in many forecasts. The
constrained availability of funding for gas infrastructure in India is a serious impediment. Not only is the
required investment level daunting but additional issues such as community opposition, geographical
challenges and environmental obstacles can negatively impact both timing and ultimate cost. This
“network requirement” for natural gas can disadvantage it against competing energy sources that either
do not require such a high degree of transport and storage infrastructure or have it already.
China’s gas infrastructure is not well-integrated. Numerous regional pipeline bottlenecks exist,
distribution is inadequate in some places and the country has insufficient storage for42 and many
bottlenecks in moving regasified LNG from import terminals to demand centers. However, further gas
pipeline and storage development is required to (1) expand natural gas deliveries to new and/or
underserved demand centers; (2) to expand CGD networks in more cities and to integrate regional and
local CGD networks with LNG regasification terminals and the national trunk lines, and (3) possibly to
accommodate future gas deliveries from Russia’s Siberian gas fields in 2018. China has plans to double
the size of its pipeline network by 2020 but it is not certain that they will do that given the current
economic situation. Its state-owned oil and gas companies, especially PetroChina, are under severe
financial pressures from imported gas losses, the low crude oil price and the November 2015 gas price
reduction.
India is at an earlier stage than China in the development of its natural gas infrastructure and has a long
way to go to the establishment of a National Gas Grid. The government recognizes that reforms are
needed in the areas of gas pricing, pipeline regulation and tariffs and overall market design. A more
favorable land acquisition regime is critical. Currently the consent of 70-80% of families affected by a
project requiring land use must be obtained.
Funding of infrastructure investment is a big challenge in India. There are competing claims on public
funds as well as an overall fiscal constraint resulting in low public investment levels. Greater private
investment, including foreign investment, is required and to date has not been forthcoming in large
quantities. In the natural gas sector, there are many factors that curb the appetite of private investors
including administered pricing for natural gas and electricity; near-bankruptcy of many electric
distribution companies; a complex and administratively difficult business environment; economic reform
delays; regulatory conflicts; blurred authority boundaries among local, state and central governments
and environmental and community opposition. In addition, there are not many financing options for
private investors: currently Indian banks, many of which have large stressed loan portfolios, provide 90%
42 China has 129 operational domestic liquefaction plants with an annual capacity of 32 BCM/year. In March 2016, these plants were operating at 40% of capacity. Most of this domestic LNG is delivered by truck.

April 2017, BEG/CEE China/India Gas Demand, Page 26
of corporate financing on a short term basis. The longer term corporate bond market is under-
developed although the government is taking steps to improve the situation. Foreign direct investment
flows are improving but are small relative to the infrastructure needs. The IEA in 2015 said that the scale
of required energy sector investment and the high levels of uncertainty surrounding funding sources
presented a downside risk to their consumption projections.
China
The backbone west-to-east national trunk pipeline system connecting western domestic gas supplies
and imported Central Asian gas supplies to demand centers in eastern coastal regions is fairly well-
developed due to accelerated investment by PetroChina (Figure 45). There are three west-to-east
pipelines constructed since 2002 with the third put into operation in 2015 with a combined capacity of
about 2.8 TCF/year (EIA, 2015). PetroChina controls about 80% of China’s gas pipelines and is China’s
largest gas producer (3 TCF in 2014).
State-owned Sinopec operates key long-haul pipelines that connect central domestic gas supplies in
Shaanxi and Sichuan to Shanghai in the south and to Shandong along the northeastern coast. In 2016
Sinopec announced it would sell 50% of the $9.4 billion Sichuan-Shanghai pipeline to fund new projects
in shale gas extraction.43 Offshore pipelines off the eastern and southern coasts owned by state-owned
CNOOC connects offshore gas supplies with demand centers.
Table 3. Natural Major Gas Pipelines in China
Pipeline Origin Destination Transmission Capacity (Bcm/yr)
Remarks
Shale Gas Pipeline
Changning Shale Block, Sichuan
Yunnan 1.64 92.8 km
West-East (First Pipeline)
Xinjiang Shanghai 12 Active since 2004
West-East (Second Pipeline)
Turkmenistan Xinjiang
14 provinces, autonomous regions, municipalities to the Pearl River Delta
30 Active since 2011 8,700 km Expansion began in March 2012 to connect pipeline to Hong Kong
West-East (Third Pipeline)
Xinjiang Fuzhou, Fujian 30 Will be linked to the Central Asia pipeline, which brings in gas from Turkmenistan and Uzbekistan 817 km segment connecting Jiangxi-Fuzhou will be completed in H215
Central Asia-China Gas Pipeline
Turkmenistan Uzbekistan Kazakhstan
Xinjiang 30 Will be expanded to 55 Bcm/yr in H215
Active since 2009 (Line A), 2010 (Line B) and 2014 (Line C)
43 Yu, F., 2016.
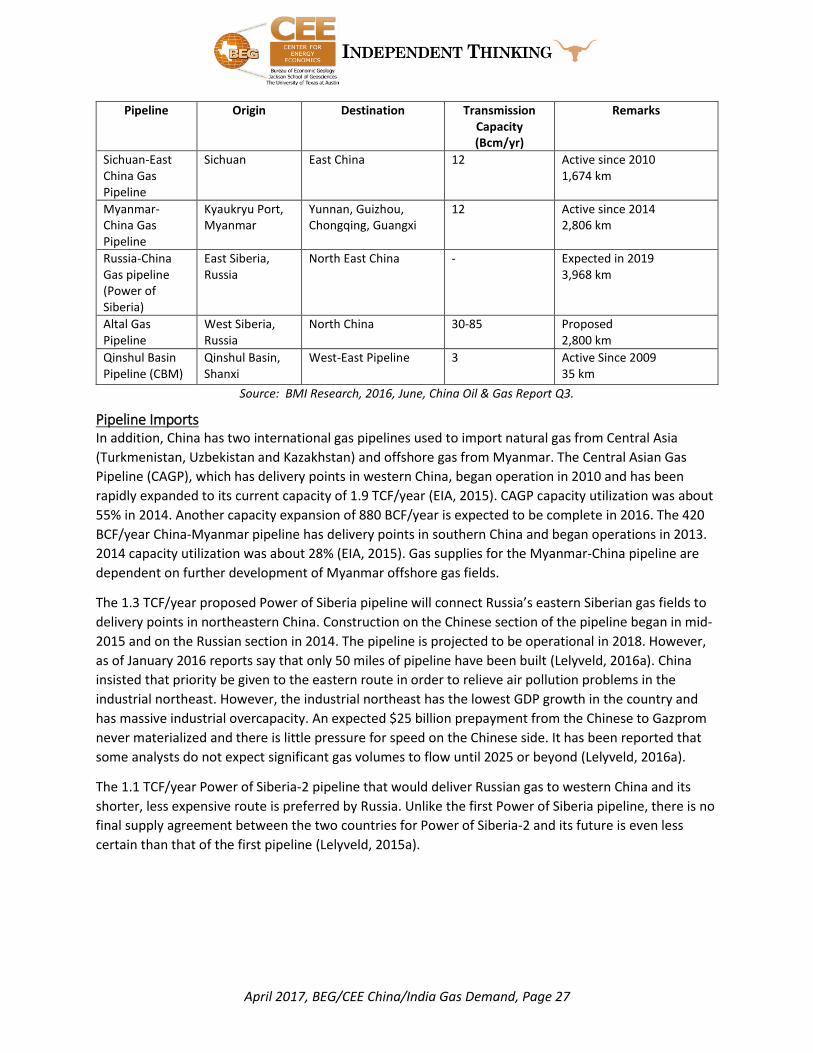
April 2017, BEG/CEE China/India Gas Demand, Page 27
Pipeline Origin Destination Transmission Capacity (Bcm/yr)
Remarks
Sichuan-East China Gas Pipeline
Sichuan East China 12 Active since 2010 1,674 km
Myanmar-China Gas Pipeline
Kyaukryu Port, Myanmar
Yunnan, Guizhou, Chongqing, Guangxi
12 Active since 2014 2,806 km
Russia-China Gas pipeline (Power of Siberia)
East Siberia, Russia
North East China - Expected in 2019 3,968 km
Altal Gas Pipeline
West Siberia, Russia
North China 30-85 Proposed 2,800 km
Qinshul Basin Pipeline (CBM)
Qinshul Basin, Shanxi
West-East Pipeline 3 Active Since 2009 35 km
Source: BMI Research, 2016, June, China Oil & Gas Report Q3.
Pipeline Imports In addition, China has two international gas pipelines used to import natural gas from Central Asia
(Turkmenistan, Uzbekistan and Kazakhstan) and offshore gas from Myanmar. The Central Asian Gas
Pipeline (CAGP), which has delivery points in western China, began operation in 2010 and has been
rapidly expanded to its current capacity of 1.9 TCF/year (EIA, 2015). CAGP capacity utilization was about
55% in 2014. Another capacity expansion of 880 BCF/year is expected to be complete in 2016. The 420
BCF/year China-Myanmar pipeline has delivery points in southern China and began operations in 2013.
2014 capacity utilization was about 28% (EIA, 2015). Gas supplies for the Myanmar-China pipeline are
dependent on further development of Myanmar offshore gas fields.
The 1.3 TCF/year proposed Power of Siberia pipeline will connect Russia’s eastern Siberian gas fields to
delivery points in northeastern China. Construction on the Chinese section of the pipeline began in mid-
2015 and on the Russian section in 2014. The pipeline is projected to be operational in 2018. However,
as of January 2016 reports say that only 50 miles of pipeline have been built (Lelyveld, 2016a). China
insisted that priority be given to the eastern route in order to relieve air pollution problems in the
industrial northeast. However, the industrial northeast has the lowest GDP growth in the country and
has massive industrial overcapacity. An expected $25 billion prepayment from the Chinese to Gazprom
never materialized and there is little pressure for speed on the Chinese side. It has been reported that
some analysts do not expect significant gas volumes to flow until 2025 or beyond (Lelyveld, 2016a).
The 1.1 TCF/year Power of Siberia-2 pipeline that would deliver Russian gas to western China and its
shorter, less expensive route is preferred by Russia. Unlike the first Power of Siberia pipeline, there is no
final supply agreement between the two countries for Power of Siberia-2 and its future is even less
certain than that of the first pipeline (Lelyveld, 2015a).

April 2017, BEG/CEE China/India Gas Demand, Page 28
Despite the rapid progress in developing import gas pipeline infrastructure,44 the IEA in 2012 stated that
China’s pipeline network is insufficient when compared to its annual demand levels.45 Additional long
distance high pressure pipelines and the development of regional networks are required. China’s
pipeline network is not yet expansive enough: it connects certain gas producing areas with certain
demand centers but its ability to deliver gas to southern areas is constrained.46 Many regional networks
and storage capacity need additional development.
China has about 7.4 Bcm of working gas storage capacity,47 even though it has depleted gas reservoirs
that could be used for this purpose. With the exception of a single facility in Xinjiang, all the remaining
storage is in the high heating demand northeast CNPC, the parent company of PetroChina, is the major
gas storage developer. The government wants storage capacity sufficient for 30 days of consumption. If
all projects in construction and planning phases are developed, capacity could approach 47 Bcm with
about 50% located in Beijing, Tianjin and Hebei.48
In addition, city gas distribution companies have cryogenic LNG tank storage associated with domestic
liquefaction capacity of 32 Bcm/year at the end of 2015 (see APPENDIX 1 - MAPS).49 City gas distribution
companies cannot afford to develop underground storage capacity.
The lack of storage capacity is a concern in light of the growing residential gas market and the increase
in gas-fired peaking generation. As a point of comparison, OECD European countries with a high gas
import dependency and a similar high share of residential demand have working storage of about 20%
of their annual gas demand.50 In the U.S., which consumes almost 23% of natural gas in the world as
compared to 5.7% for China, there is 123 Bcm of natural gas storage capacity (or 60 times as much as in
China), mostly underground in depleted reservoirs or salt domes. Each market is different in terms of
composition of natural gas consumers, pipeline connectivity, geographic distribution of sources and
consumers, and degree of seasonality but these comparisons indicate that China needs significantly
more than the current level of storage capacity to have a smoothly-functioning natural gas sector
without major dislocations and outages.
LNG Imports51 At the beginning of 2015 China had 12 LNG regasification terminals in operation with capacity of 5.2
Bcf/day with another 5 terminals under construction. 4.4 Bcf/day of additional capacity is expected to
be on-line by 2017 (EIA, 2015). 10 Bcf/day of regasification capacity represents about 56% of China’s
44 An overview of Chinese pipeline infrastructure is provided in the separate Executive Summary. http://www.beg.utexas.edu/energyecon/GlobalGas-LNG/. 45 IEA, China Gas Pricing and Regulation, 2012. Germany, for example, has more than twice China’s pipeline network but has lower annual gas demand. 46 Overton, T.W., 3/4/13. 47 BMI Research, China Oil & Gas Report, June 2016. 48 BMI Research, China Oil & Gas Report, June 2016. 49 BMI Research, China Oil & Gas Report, June 2016. 50 Ibid. 51 A companion paper commissioned by CEE, LNG Supply Outlook 2016 to 2030 by Andy Flower is available at http://www.beg.utexas.edu/energyecon/GlobalGas-LNG/. The reader should refer to that document for our consensus views on LNG supply and demand for China and India.

April 2017, BEG/CEE China/India Gas Demand, Page 29
average daily gas consumption of 18 Bcf/day in 2015. Terminal capacity utilization was 59% in 2013,
declining to 51% in 2014 (Russell, 2015).
Like major natural gas pipelines, LNG regasification terminals have been under the purview of China’s
state-owned oil and gas companies. CNOOC was the pioneer, followed by PetroChina in 2011 and
Sinopec in 2014. CGD companies and/or local municipal governments have equity interests in six of the
12 operational terminals and in four of the 8 terminals under construction. CGD Jovo Group, serving
southern markets, owns a 135 MMcf/D terminal at Dongguan. CGD companies have growing LNG
businesses (see sectoral demand discussion) and find it easier to obtain terminal capacity for their
cargoes when they have a terminal ownership interest. The NDRC issued guidelines in 2014 about
allowing third-party access to existing terminals and as a result new players (such as CGD companies,
private gas development companies and power generators), attracted by falling LNG prices, vie to
contract for capacity in existing terminals. As of mid-2015 only PetroChina offered terminal import and
storage services for a fee. CNOOC and Sinopec have been more reluctant saying that the guidelines are
not laws (Xieli, 2015). Prolonged capacity negotiations with the terminal owner can derail opportunities
for importing spot cargoes. Nevertheless, private companies like ENN Energy, one of the largest CGD
companies, is constructing a 395 MMcf/D terminal in Zhejiang, which should begin operations in 2017.
In March 2016 ENN signed a contract with Origin Energy to acquire 500,000 tonnes of LNG for five years
beginning 2018/2019 from Origin’s APLNG project in eastern Australia. ENN also signed a 10 year LNG
supply contract with Total for 500,000 tonnes of LNG per year beginning in 2018.52 Guanghui Energy, a
private gas development company, is building an 80 MMcf/D terminal in Jiangsu to come on-line late
2016. China Huadian, a large top five state-owned power generator, is seeking regulatory approval to
build two new terminals and China Huaneng, another top five power generator, is planning to construct
new terminals (Xieli, 2015).
CGD Networks The city gas distribution networks have been rapidly expanded over the last decade. Numerous gas
distribution companies were established over this period, many owned or associated with central
and/or local government entities, which enabled an accelerated buildout of the networks. Annual sales
volumes growth was 20% plus over this period, although growth rates have declined in recent years.
Approximately 32% of medium and large-size cities (240 million people) in China had access to piped
natural gas in 2014, leaving a large unserved potential market for CGD.
India
India’s natural gas infrastructure (Figure 47) is fragmented and inadequate to move gas supplies to
demand centers or to develop new demand centers. India currently has about 13,000 kilometers of gas
transmission pipelines.53Total capacity of the onshore pipeline network was about 364 MMSCMD at
March 2015, unchanged from the previous year.54 State-owned GAIL India controlled about 63% of total
operating natural gas pipeline capacity as of January, 2016 and 22% of capacity (the East-West Pipeline
52 BMI Research, 2016, June, China Oil & Gas Report Q3 June 2016. 53 BMI Research, 2016, March, India Oil & Gas Report Q2. 54 Offshore pipelines with capacity of 106 MMSCMD are owned by state-owned ONGC. Utilization was 43% in
2013-14 and 41% in 2014-15. Ministry of Petroleum and Natural Gas (MOPNG), 2014-15. Indian Petroleum and
Natural Gas Statistics 2014-15; http://www.petroleum.nic.in/docs/pngstat.pdf.

April 2017, BEG/CEE China/India Gas Demand, Page 30
from Andhra Pradesh to Gujarat; see maps in APPENDIX 1 - MAPS) was controlled by Reliance Gas
Transportation Infrastructure Limited. The remaining 15% of capacity was owned by Gujarat State
Petronet Limited, Gujarat Gas Company Limited, Indian Oil Corporation Limited, Assam Gas Company
Limited, and Deepak Fertilizer & Petrochemicals Corp. Ltd.55 Utilization of the onshore pipelines was
40% in 2013-14 and 2014-15.56
There is a strong regional imbalance with regard to access to natural gas. 40% of India’s gas
infrastructure is concentrated in two western states: Gujarat (GJ) and Maharashtra (MH). Gujarat,
Maharashtra and Uttar Pradesh (UP) together consume more than 65% of India’s natural gas. Five states
in the northeast have no pipeline infrastructure. The eastern, southern, central and northwestern
regions have limited gas infrastructure.
To date India has been unable to create an expansive gas infrastructure across the country, in part due
to lack of funding and difficulties in pipeline siting and land acquisition. The government has had a plan
to spend $8 billion beginning in 2012 to develop a National Gas Grid which would expand gas pipeline
market delivery capacity to 515 MMSCMD by April 2017. Pursuant to this plan, the southern and
northern states would catch up to the western states in terms of pipeline infrastructure. However,
there has been practically no progress on this plan as the onshore pipeline capacity has remained flat at
current levels since 2013. There are 11,300 km of pipelines reported to be under construction but only
100 km have been completed.57 The lack of progress is attributed to legal disputes, land acquisition
problems (see discussion of GAIL Kochi pipelines below), statutory clearances delays, contract issues and
lack of anchor load customers (Oil & Gas Journal, 2015).
Gas Imports India currently has four operational LNG regasification terminals on the west coast (Dahej, Hazira,
Dabhol and Kochi, Figure 47) with a total import capacity of 23 million tons per annum (MMTPA). The
largest of these, Dahej at 10 MMTPA, operates at a high load factor (96% in 2013-14) and an expansion
to 15 MMTPA will be completed in 2016.58 The Hazira terminal (5 MMTPA) operated at a 56% load
factor in 2013-14. Equally-sized Dabhol terminal cannot operate during the monsoon season (May-
October) in absence of a breakwater so its effective capacity is about half (2.25 MMTPA) of its
nameplate capacity and its annual load factor is just less than 50% of 2.25 MMTPA.A breakwater is
planned to be constructed in 2016..59 Another 5-MMTPA terminal at Kochi operates at less than 2% load
factor because GAIL has been unable to complete new pipelines to northern Kerala, Mangalore and
Bangalore. The terminal is sending out small volumes of LNG by truck. GAIL had to suspend pipeline
construction work in 2013 due to farmers’ protests that grew into a large political issue in the state of
Tamil Nadu illustrating the difficulties of land acquisition for non-agricultural purposes.60 The four
55 Petroleum and Natural Gas Regulatory Board, Data Bank, Operating Natural Gas Pipelines in India, 2016. 56 Ministry of Petroleum and Natural Gas (MOPNG), 2014-15. Ministry of Petroleum and Natural Gas (MOPNG),
2014-15. Indian Petroleum and Natural Gas Statistics 2014-15; http://www.petroleum.nic.in/docs/pngstat.pdf. 57 MOPNG, Petroleum Planning and Analysis Cell, Gas Pipeline Construction. 58 Petronet LNG Ltd., October 2015. 59 The Economic Times, 5/3/15. 60 The Supreme Court of India in early 2016 ruled against the Tamil Nadu’s government’s petition to re-route the pipeline and instructed GAIL to pay enhanced compensation to the farmers. GAIL started the project in 2012 but
April 2017, BEG/CEE China/India Gas Demand, Page 31
terminals together had load factors of 70% and 77% for the first ten months of 2014-15 and 2015-16,
respectively.
There are seven planned LNG import terminals, with five of them on the east coastline of India.
However, the only that has been making progress is the terminal proposed for the Gujarat state on the
west coast. Given the limitations of pipeline infrastructure on the eastern states (with the exception of
the Kakinada location), it is difficult to see how these other projects can proceed.
The Asian Development Bank is sponsoring the 1,600 kilometers Turkmenistan-Afghanistan-Pakistan-
India (TAPI) gas pipeline which would transport 33 BCM/year from Turkmenistan to the other three
countries. In April 2016 the TAPI shareholders signed an Investment Agreement to provide over $200
million to fund engineering and route surveys, environmental and social safeguards, and procurement
and financing activities that will enable a final investment decision (FID).61 Once a positive FID is made,
construction is expected to take up to 3 years. This project has been under development since 2003.
In October 2016 India and Russia announced an agreement to explore the feasibility of building a $25
billion gas pipeline from Siberia to India.62 This project is in very early stages.
CGD Networks The city gas distribution infrastructure mirrors that of the major pipelines infrastructure: the majority is
in the states of Gujarat, Maharashtra, and Delhi in Uttar Pradesh with very limited or no coverage
elsewhere (see APPENDIX 1 - MAPS)63 Gas consumption by the CGD sector grew from 3 Bcm to about 5
Bcm in 2014. As of June 2015 there were 2.8 million consumers with access to piped natural gas. Future
growth is constrained by the lack of infrastructure and gas supplies.
Gas Supply Allocation Policies
The central governments in both China and India direct natural gas supplies to certain sectors and
prohibit or restrict its use in other sectors. India also uses price to discriminate among sectors: lower
priced domestic gas is allocated to certain priority sectors and other sectors have to use more expensive
imported LNG. These supply allocation policies can create demand distortions in the market.
China
China adopted a gas utilization policy in 2007 under the purview of the National Development and
Reform Commission (NDRC). The 2007 policy permitted gas usage in the residential and industrial
sectors, including natural gas vehicles (NGVs) but prohibited its usage for power generation with the
exception of distributed combined heat and power (CHP). The policy was updated in 2012 and the
prohibition on gas usage for power generation was partially lifted (Table 4).
the Tamil Nadu government stopped work in 2013 when 5,500 farmers protested. GAIL will have to re-tender the construction contract to re-start work. 61 Asian Development Bank, 2016. 62 The Hindustan Times, 2016. 63 MOPNG, Petroleum Planning and Analysis Cell, September 2015.

April 2017, BEG/CEE China/India Gas Demand, Page 32
Operationally the NDRC sets an annual natural gas production target based on customer consumption
estimates submitted by natural gas producers.64,65 Actual gas production levels may deviate from the
submitted targets as long as gas producers adhere to the NDRC’s annual natural gas guidance supply
plan, which is based on the policy summarized in Table 4 and requires that specific gas volumes are
delivered to designated key municipalities and key enterprises.66 Residential gas consumers have first
priority in a gas supply shortage situation (Li, 2015a).
Table 4. 2012 National Gas Utilization Policy in China by Customer Type
Type Gas Consumers Gas Supply Gas Pricing Gas Project Approvals
Preferred Urban residential; public service facilities; NGVs and vessels; distributed CHP; storage facilities; interruptible industrial users
Priority assurance of supply except for interruptible industrial users
Preferential Discounted prices for interruptible industrial users
Preferential for projects displacing coal, oil and LPG
Permitted Power generation; Chemical feedstock for low economic hydrogen & low economic nitrogen fertilizer
Priority after preferred
Peaking projects with sufficient gas supply
Restricted Ammonia expansion; some chemicals using methane
Non-essential load power generation
Prohibited Methanol production Base load gas power in 13 large coal producing regions
Sources: Vinson & Elkins, 2013; Reuters; IEA 2009
India
India has an annual gas utilization plan that allocates the supplies of domestically produced natural gas
and imported LNG to various customer classes (Table 5 below) and determines priority in a gas shortage
situation. Since domestic gas has been much less expensive than LNG until recently, gas consumers have
been anxious to maximize their allocation of domestic gas. (See pricing discussion). Fertilizer producers
had the number one priority for many years until July, 2014 when they lost the top slot to city gas
distribution (CGD) for households and transport. This change reflects the Modi government’s desire to
significantly expand CGD throughout India. When he was governor of Gujarat state, PM Modi oversaw
the establishment and expansion of very successful CGD operations which he would like to replicate
nationally.
64 State-owned PetroChina is the largest domestic gas producer and owns the vast majority of China’s onshore natural gas pipelines. 65 PetroChina 2014 SEC Form 20F. About 78% of its sales volumes in 2014 were sold under one-year and multi-year contracts. Most of the one-year contracts have been renewed for 10 consecutive years. As a result, PetroChina is very familiar with its customers’ consumption patterns. 66 PetroChina 2014 SEC Form20F.

April 2017, BEG/CEE China/India Gas Demand, Page 33
Table 5. Gas Utilization Policy in India (2013)
Tier Customer and Priority Order Domestic Gas %
LNG %
Tier 1
Fertilizer Plants; LPG Extraction Plants ; Grid-Connected Power Plants; City Gas for Households & Transport
86% 53%. Prices subsidized for fertilizer plants and grid connected power plants.
Tier 2
Steel, Refineries & Petrochemical Plants; City Gas for Industrial & Commercial Customers; Other Consumers, Captive & Merchant Power Plants, Feedstock or Fuel
10% 40%
Total 96% 93% Source: Sen (2015a)
Fertilizer plants are still high priority along with grid-connected power plants and LPG extraction plants.
The gas supply sources for Tier 1 customers were about 80%-84% domestic in 2013. Industrial
customers (other than steel, refineries and petrochemical plants) and captive and merchant power
plants are allocated the least domestic gas. This seems counter-intuitive as the industrial and merchant
power sectors are highly price-sensitive and CGD household and transport customers are less so. In
addition, end use prices charged by CGD operators are not controlled.
The Tier 2 customers’ domestic gas supply was 33%-55% of their total gas supply depending on their
place in the Tier 2 list. At times, Tier 1 customers may not be able to use all of their domestic gas
allocation due to infrastructure constraints between the domestic gas source and the consumers’
location. As a result Tier 1 consumers are allocated LNG as well. In 2013 Tier 1 users consumed over
50% of the total LNG supplied but it was subsidized for power and fertilizer plant users. Unused Tier 1
domestic gas allocations are then allocated to Tier 2 consumers.
As government, not market prices, determine resource allocation in India, consumption distortions can
occur. For example, the fertilizer sector gets a very high percentage of its gas supply from cheaper
domestic gas but even so its business is unsustainable without significant government subsidies. Gas-
fired merchant power plants are allocated more expensive LNG to produce power that is too expensive
for the almost bankrupt electric distribution companies to purchase. Further government subsidies are
required in order to run those plants and avoid peak day electricity outages. Finally, a major competitor
to natural gas, the subsidized LPG industry, is allocated less expensive domestic gas in order to reduce
the government subsidy burden.
Regional Gas Consumption
Gas consumption in China and India is concentrated in certain regions which mirrors the gas
infrastructure in each country. These regions include four areas around Beijing and Bohai Bay, Shanghai
and the Yangtze River delta and central west Chongqing in China and the two western states of Gujurat
and Maharashtra in India. These areas have been the focus of industrial activity, urbanization and
population growth in the two countries to date. However, there are economic growth centers in areas of
both countries which do not have sufficient gas infrastructure, especially the southeastern coastal areas
of China and the entire southern region of India. India is undertaking a Smart Cities initiative which could
accelerate urbanization and economic growth in areas that have little to no gas infrastructure at

April 2017, BEG/CEE China/India Gas Demand, Page 34
present.67 Significant expansion of gas infrastructure into these newer regions will be required to realize
gas demand growth.
China
Natural gas consumption in China varies significantly by region (see map, Figure 45). It is influenced by a
province’s proximity to domestic gas production (Xinjiang, Sichuan and Shaanxi) and/or gas import
infrastructure; its available gas infrastructure; its economic wealth and its industrial and power outputs.
Four regions accounted for 60% of natural gas consumption in 2014: the southwest, the Bohai Bay area,
the Yangtze River delta and the southeast coastal area. Additional CGD infrastructure and enhanced
regional connectivity is required to increase market penetration across the rest of the country.
The gas producing regions are in the far west (Xinjiang), the northwest (Shaanxi) and the center-
southwest (Sichuan). These provinces have China’s top producing gas basins: Ordos in Shaanxi; Sichuan
and Tarim in Xinjiang. They export gas (about 60% of local supplies) to nearby provinces like Chongqing
and Henan and to the coastal provinces. Their infrastructure is more mature and their gas access rates
are higher than the national average (57% and 45% for Sichuan and Shaanxi, respectively, by the end of
2012). Gas-fired power generation competes with hydropower in this area and can be significant in poor
rainfall years. In Shaanxi the industrial sector is the major gas consumer whereas in Sichuan the
residential sector dominates. These provinces also have the highest concentration of natural gas
vehicles and fueling stations. The producing provinces and their neighbors enjoy natural gas prices that
are among the lowest in the country as their gas supply is local.
Chongqing and Henan are not as industrialized as many of the coastal cities and provinces but their
economies outgrew the national GDP growth rate of 7.4% in 2014: 11% and 9%, respectively. Henan had
the fifth largest provincial GDP in the country in 2014 representing 5% of total GDP. Chongqing was
among the top ten exporting provinces in 2014. Their neighboring provinces supply their gas and the
natural gas prices in Chongqing and Henan are either below or at the national average.
The coastal provinces of Guangdong and Jiangsu and the metropolitan areas of Beijing and Shanghai are
among China’s wealthiest provinces/municipalities and are large natural gas consumers. The two coastal
provinces represented 21% of the nation’s GDP in 2014 and were the top two exporting provinces. They
are heavily industrialized and Guangdong has significant gas-fired power generation (11.1 GW in 2014,
which was about 17% of China’s total gas-fired generation capacity). Power sector gas use accounted for
50% of Guangdong’s total gas consumption in 2012, followed by industrial and residential gas use (30%
and 11%, respectively). The low residential use was due to the lack of CGD infrastructure: the province’s
gas access rate was 16% compared to the national average of 34%. The regional grids in these provinces
67 “Smart Cities” is an urban renewal and development program sponsored by the Modi government with the goal of redeveloping 500 cities and developing 100 new cities over five years beginning 2015-16 which will be equipped with basic core infrastructure and will offer a sustainable high quality of life to residents. 100 potential smart cities were nominated by the states/union territories and 20 cities (see map) were chosen in January 2016 from the list to receive financing. About 12 of the 20 cities are in areas with limited to no gas infrastructure. Ministry of Urban Development, Smart Cities: Mission Statement and Guidelines, June, 2015; The Hindu, 2016, January 30, Govt. announces list of first 20 smart cities under ‘Smart Cities Mission’, http://www.thehindu.com/news/national/list-of-first-20-smart-cities-under-smart-cities-mission/article8162775.ece.
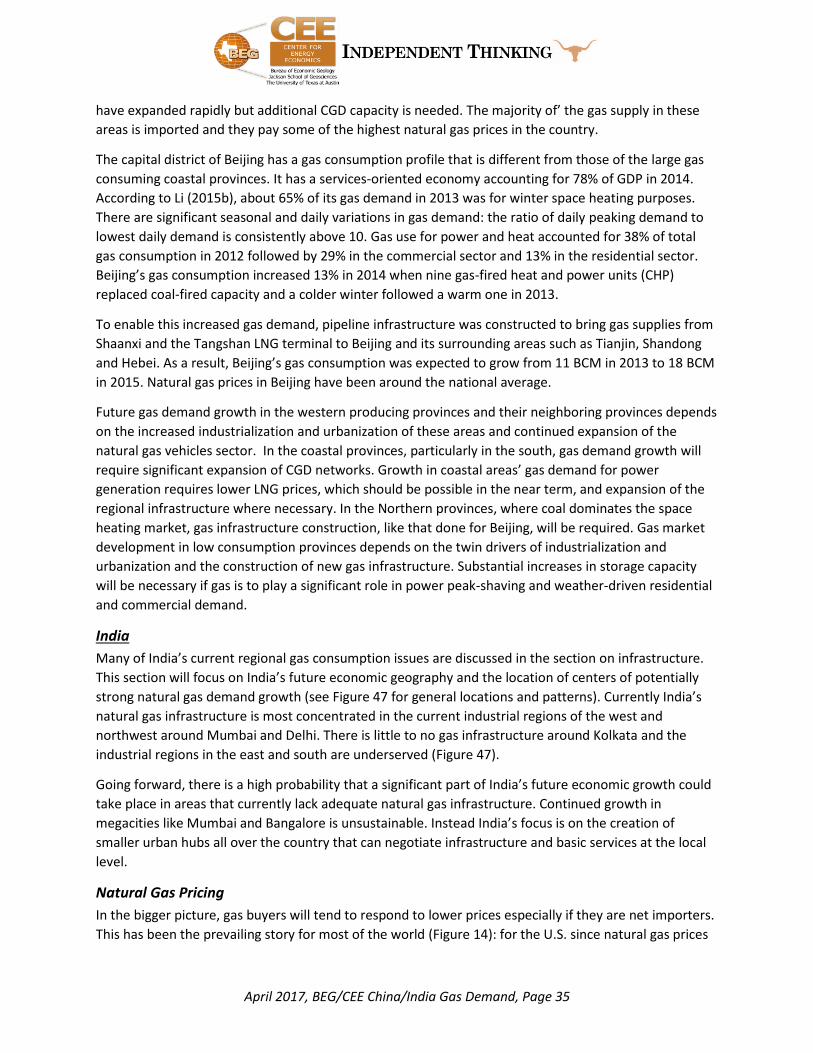
April 2017, BEG/CEE China/India Gas Demand, Page 35
have expanded rapidly but additional CGD capacity is needed. The majority of’ the gas supply in these
areas is imported and they pay some of the highest natural gas prices in the country.
The capital district of Beijing has a gas consumption profile that is different from those of the large gas
consuming coastal provinces. It has a services-oriented economy accounting for 78% of GDP in 2014.
According to Li (2015b), about 65% of its gas demand in 2013 was for winter space heating purposes.
There are significant seasonal and daily variations in gas demand: the ratio of daily peaking demand to
lowest daily demand is consistently above 10. Gas use for power and heat accounted for 38% of total
gas consumption in 2012 followed by 29% in the commercial sector and 13% in the residential sector.
Beijing’s gas consumption increased 13% in 2014 when nine gas-fired heat and power units (CHP)
replaced coal-fired capacity and a colder winter followed a warm one in 2013.
To enable this increased gas demand, pipeline infrastructure was constructed to bring gas supplies from
Shaanxi and the Tangshan LNG terminal to Beijing and its surrounding areas such as Tianjin, Shandong
and Hebei. As a result, Beijing’s gas consumption was expected to grow from 11 BCM in 2013 to 18 BCM
in 2015. Natural gas prices in Beijing have been around the national average.
Future gas demand growth in the western producing provinces and their neighboring provinces depends
on the increased industrialization and urbanization of these areas and continued expansion of the
natural gas vehicles sector. In the coastal provinces, particularly in the south, gas demand growth will
require significant expansion of CGD networks. Growth in coastal areas’ gas demand for power
generation requires lower LNG prices, which should be possible in the near term, and expansion of the
regional infrastructure where necessary. In the Northern provinces, where coal dominates the space
heating market, gas infrastructure construction, like that done for Beijing, will be required. Gas market
development in low consumption provinces depends on the twin drivers of industrialization and
urbanization and the construction of new gas infrastructure. Substantial increases in storage capacity
will be necessary if gas is to play a significant role in power peak-shaving and weather-driven residential
and commercial demand.
India
Many of India’s current regional gas consumption issues are discussed in the section on infrastructure.
This section will focus on India’s future economic geography and the location of centers of potentially
strong natural gas demand growth (see Figure 47 for general locations and patterns). Currently India’s
natural gas infrastructure is most concentrated in the current industrial regions of the west and
northwest around Mumbai and Delhi. There is little to no gas infrastructure around Kolkata and the
industrial regions in the east and south are underserved (Figure 47).
Going forward, there is a high probability that a significant part of India’s future economic growth could
take place in areas that currently lack adequate natural gas infrastructure. Continued growth in
megacities like Mumbai and Bangalore is unsustainable. Instead India’s focus is on the creation of
smaller urban hubs all over the country that can negotiate infrastructure and basic services at the local
level.
Natural Gas Pricing
In the bigger picture, gas buyers will tend to respond to lower prices especially if they are net importers.
This has been the prevailing story for most of the world (Figure 14): for the U.S. since natural gas prices

April 2017, BEG/CEE China/India Gas Demand, Page 36
collapsed in 2007 (new supply from drilling encountering recession and the warm 2011-2012 winter)
and the Asia-Pacific region (where native growth in demand has been embellished by lower LNG prices,
under pressure from both falling oil prices and generous feedstock gas and LNG supply and influenced
by the U.S. Henry Hub marker). The exception has been Europe, where natural gas use diminished with
economic deterioration on the continent and the resulting plight of Europe’s utility sector while also
being impacted by rising oil-indexed LNG cost.
Figure 14. Global Trends in Natural Gas Prices and Demand
Source: CEE depiction based on BP Statistical Review data.
Natural gas demand in China and India is very price sensitive as all demand sectors have alternative fuel
options. In both countries, natural gas prices are “administered” by both the central and local
governments. The timing and magnitude of the government intervention is not always predictable,
creating uncertainty for investors in all segments of the natural gas value chain. Markets do not play a
significant role in pricing natural gas to various customers. The degree of market influence on the
administered prices is a function of government political and policy goals as well as the price sensitivity
and political influence of the consuming sectors. This price intervention by the governments in both
China and India creates market distortions which in turn impede the development of a robust natural
gas market.
China
Natural gas prices at the city gate are set by the NDRC (Table 6). The frequency of NDRC price
adjustments is not defined; they have been more often since 2013. Provincial governments, through
local pricing bureaus, establish the retail natural gas prices for end users. In April 2015 the NDRC set the
$0
$2
$4
$6
$8
$10
$12
$14
$16
$18
0
100
200
300
400
500
600
700
800
$2
01
5 an
d $
No
min
al (LNG
) pe
r Millio
n B
tuM
illio
n T
on
ne
s O
il Eq
uiv
ale
nt
US European Union
Japan+South Korea China
India Rest of Asia Pacific
$2015 per MMBtu LNG (Japan)

April 2017, BEG/CEE China/India Gas Demand, Page 37
city gate natural gas price for industrial68 and power generation users based on a formula using the
prices of two substitutes: 85% of the weighted average of (60% of fuel oil import prices) and (40% of LPG
import prices)).69 The average city gate price was $11.00/MMBtu in April 2015; there are significant
regional variations (also see APPENDIX 1 - MAPS). Future price adjustments will be tied to that formula.
Table 6. China Natural Gas Prices as of March 2016 in US$/MMBtu
City Gate Non-Residential
(Power & Mfg.)
Retail Power
Generation
Retail Mfg. Retail Transport (CNG)
Retail Residential
Tier 1
Gas Producing Cities/Provinces (PP)& Neighboring Provinces (NP)/Cities (NC)
Urumqi, Xinjiang PP 4.89 6.38-8.46 12.33 5.82
Xian, Shaanxi PP 5.70 10.46 15.77 8.42
Chengdu, Sichuan PP 7.01 13.73 12.75 8.03
Chongqing NC 6.93 9.10 13.90 7.31
Xining/Qinghai NP 5.40 7.69-9.27 7.40 (buses) 9.27 (other transport)
6.29
Lanzhou, Gansu NP 6.08 8.46 12.33 7.23
Producing Areas Simple Average
6.00 9.19 11.96 7.18
Gas Consuming Cities/Provinces
Beijing Municipality 8.14 13.69 10.03-13.43 18.74 9.69
Shanghai Municipality 9.22 10.41 11.69 (chemical) 13.47 (city gas industrial)
20.32 12.75
Harbin/Heilongjiang 7.48 16.15 16.15 11.90
Nanjing/Jiangsu 9.22 13.22 17.85 10.63
Wujan/Hubei 8.33 14.85 17.43 10.75
Zhengzhou/Henan 8.54 12.33 15.56 9.56
Guangzhou/Guangdong 9.27 18.53 25.16 14.66
Hohhot, Inner Mongolia Autonomous Region
5.70 11.35 15.13 7.74
Consuming Areas Simple Average
8.27 12.05 13.50 18.51 10.88
Source: ICIS, China Gas Price Pool, China Gas Market Monthly, Vol.III-03, No. 18, March 2016.70
Domestic natural gas producers are paid the city gate price less a pipeline transmission fee. Pipeline
transmission tariffs are also determined by the NDRC based on construction and operating costs,
distance from gas source to city gate, taxes and an “appropriate margin.” Tariffs also change according
to the pipeline vintage. For example, tariffs are about $4/MMBtu to Henan and $5/MMBtu to Shanghai
on the newer West-East pipelines (Table 7). The tariffs on older pipelines are lower. PetroChina reported
68 All references to “industrial users” in the pricing discussion excludes fertilizer plants which have their own lower gas prices. 69 Industry participants can charge up to 20% more than the NDRC-determined prices based on supply and demand. There is no downward limit on price fluctuations. 70 ICIS sources its data from local pricing bureaus and local development and reform commissions. Reported prices in CNY converted to US$ at rate of CNY6.49=US$1. Reported prices per Kcm converted to MMBtu as follows: (US$/Kcm/36.253)*100. www.icis.com/energy/channel-info-finder/.

April 2017, BEG/CEE China/India Gas Demand, Page 38
an average tariff of $.63/MMBtu in 2014.71 The distribution fees of CGD companies are set by provincial
and/or local pricing authorities based on a cost analysis similar to that underlying pipeline tariffs.
Table 7. West-East Pipeline Transmission Tariffs in China
From Xinjian to: Transmission Tariff ($/MMBtu)
Gansu 1.3
Ningxia 1.6
Shaanxi 1.8
Shanxi 3.3
Henan 3.8
Anhui 4.2
Jiangsu 4.7
Zhejiang 4.8
Shanghai 4.9
Source: Paltsev and Zhang (2015).
In August 2016 the NDRC released a draft proposal reducing the return on gas pipeline investment from
an estimated 10-12% to a cap of 8% based on 75% utilization rates with a goal of increasing
transparency around pipeline operating costs; reducing city gate gas prices and eventually facilitating
third-party pipeline access.72 Implementation will take time: pipeline cost estimates are not due for
NDRC review until June 2017 with rate adjustments every three years thereafter. In addition, it is up to
local governments whether or not to pass through any transportation rate decreases to end-users.
LNG importers and producers of shale gas, coal bed methane and coal gas are not governed by city gate
prices and can directly negotiate prices with suppliers and buyers. Beginning April 2015 large industries
and power producers were allowed to directly negotiate gas supplies and prices with domestic
producers, pipelines and LNG importers. As a result, bypass of local gas distribution companies could
occur.
Before April 201573 there were two city gate gas prices: a lower price for existing volumes (about 90% of
volumes) and a higher price for incremental volumes (Figure 15, through mid-2015). This two-price
regime was an attempt to reflect the higher prices of imported gas in the city gate prices. It was
replaced by the formula linking city gate prices to the prices of alternate fuels in April 2015. The NDRC
kept average city gate natural gas prices around the relatively high level of $11.00/MMBtu as the prices
of crude oil, LPG and fuel oil continued to drop and coal remained under $5.00/MMBtu.
71 PetroChina SEC Form 20F 2014. 72 CNOOC claims that the pipeline rates of PetroChina and Sinopec are grossly inflated. PetroChina and Sinopec do not disclose their pipeline operating costs systematically. Guo, 2016; Meidan, 2016. 73 The NDRC adjusted city gate natural gas prices three times between July 2013 and April 2015, resulting in a close to 40% increase over the period.

April 2017, BEG/CEE China/India Gas Demand, Page 39
Figure 15. Prices for Oil, Imported LNG and Pipeline Gas, and City Gate Prices in China ($/MMBtu)
Source: Paltsev and Zhang (2015).
In November 2015 the NDRC lowered the average city gate price to $7.60/MMBtu, reflecting the lower
fuel oil and LPG prices. As a result, natural gas demand increased only 5% from 2014 to 2015, well below
the 15% average annual growth rate of the last decade (previous Figure 14).
At the wholesale level (commodity price plus applicable taxes) natural gas became more competitive
with fuel oil and LPG. Gas demand increased 9% from October to November 2015. As seen in Figure 16,
fuel oil and LPG are taxed more heavily. Oil products consumption taxes have been raised in the last
several years. Their VAT is 17% versus 13% for natural gas. There is no VAT on transport gas.74
Figure 16. Estimated Wholesale Prices of Natural Gas, Fuel Oil, LPG in China March 2016 ($/MMBtu)
Source: CEE estimates
74 PetroChina SEC Form 20F 2014.
$7.60
$3.60
$8.00
$3.49
$0.99$1.21
$1.36
$0
$1
$2
$3
$4
$5
$6
$7
$8
$9
$10
City Gate Natural Gas Fuel Oil LPG
$/M
MB
tu
Commodity Price Consumption Taxes VAT

April 2017, BEG/CEE China/India Gas Demand, Page 40
CGD company bypass is possible for large non-residential users. However, China’s gas pipeline open
access for third parties policy is in its infancy with the guidelines released by the National Energy
Administration in February 2014 for “trial implementation” with the effective date of implementation
unknown. PetroChina and Sinopec have had substantial discretion in determining whether or not they
have surplus capacity and to date have not been required to “unbundle” transportation operations from
their sales and marketing operations.75 There were reports in 2015 that the NDRC was considering a
plan to spin off SOE-owned pipelines into a separate company to ensure competitive access but
PetroChina and Sinopec resisted strongly. That plan appears to have been abandoned and replaced by
the August 2016 NDRC draft proposal reducing transportation costs. The August 2016 draft proposal
states that pipeline owners should provide open access to infrastructure and that pipeline operations
should be separated from other businesses or, at a minimum, be accounted for separately.
Distribution costs are a significant part of end-user prices. In Figure 28 the distribution gross margin,
which includes distribution costs, taxes and cross-subsidies among sectors, is estimated by subtracting
the city gate natural gas price from the delivered end user price. The higher gross margins for the
manufacturing and transport sectors compensate for the lower margins on residential customers.
Figure 17. Distribution Gross Margin by City and Gas Consuming Sector March 2016 ($/MMBtu) (Delivered End User Price less City Gate Price=Gross Margin)
Source: ICIS, China Gas Price Pool, China Gas Market Monthly, Vol.III-03, No. 18, March 2016.
Gross margin is CEE calculation.
The NDRC has a difficult balancing act. On the one hand, the government wants competitive natural gas
prices to encourage consumption and on the other hand, it wants gas prices high enough to incentivize
75 The two companies have often claimed that they are at full capacity in order to limit access and protect their midstream profits. Meidan, M., 2016, August 19, op.cit.
$5.55
$1.19
$5.29
$6.80
$9.27
$2.17
$4.76
$10.61$11.09
$15.90
$6.97
$10.07
$1.55
$3.53
$5.40
$0.38
$2.72
$0
$2
$4
$6
$8
$10
$12
$14
$16
$18
Beijing Shanghai Guangzhou Chongqing Xian
$/M
MB
tu
Power Manufacturing Transport Residential 1st Tier

April 2017, BEG/CEE China/India Gas Demand, Page 41
producer investment and to minimize the losses its national oil companies (PetroChina, CNOOC and
Sinopec) are incurring on imported pipeline gas and LNG. It is reported (Lelyveld, 2016c) that some
analysts think that the NDRC’s pricing policies have resulted in a “worst of both worlds” scenario: gas
prices are too high to stimulate consumption and too low to incentivize production (Figure 18). Gas
demand growth rates in 2014 (9.5%) and 2015 (4.7%) fell significantly below the double-digit growth
rates of 2005-2013 (average 16.7%) as gas prices increased. On the other hand, domestic gas production
grew at 9.3% and 7.7% in the higher price years of 2013 and 2014, dropping to 4.8% in 2015. PetroChina,
the country’s largest gas producer, forecasts gas production growth of only 1.3% in 2016.76
Figure 18. Average City-gate and Netback Producer Natural Gas Prices ($/MMBtu)
Source: S. Paltsev and Zhang (2015) and CEE estimates for netback producer prices. The pipeline tariff used to estimate the netback producer prices is the simple average of the older pipeline tariff ($0.63/MMBtu) and the
newer high one to Shanghai ($4.91/MMBtu).
In January 2016, the NDRC put a floor under LPG and fuel oil prices based on a crude oil price of
$40/barrel. If the crude oil price drops below $40/barrel there will not be a corresponding decrease in
LPG and fuel oil. This action suggests that the NDRC may prefer to maintain the prices of competing
fuels at artificially higher levels rather than decrease natural gas prices further and impair upstream gas
investment. The price floor is also meant to protect the refining profits of China’s state-owned oil and
gas companies and to discourage “wasteful consumption.”
Residential, agricultural and fertilizer plant gas users did not experience the city gate price adjustments
and the sector’s average retail rate has stayed around $11.00/MMBtu. These sectors enjoy a cross-
subsidy from the industrial, power and transport sectors. These cross-subsidies impair the
competitiveness of natural gas in the major gas-consuming industrial and power sectors. As a result,
many local and provincial governments commonly provide various subsidies to industrial and power gas
users in order to generate provincial economic growth and protect provincial jobs (Haley and Haley,
2013). Tax incentives, cheap loans, credits for reducing air pollution and outright price discounts are
some of the mechanisms deployed to keep industrial and power sector gas prices below the full
76 Guo, 2016.
$9.89
$11.45 $11.40
$7.60 $7.11
$8.67 $8.62
$4.82
$0
$2
$4
$6
$8
$10
$12
7/13 - 8/14 9/14 - 3/15 4/15 - 10/15 11/15 -Most Recent
$/M
MB
tu
Average City Gate Average Producer Price

April 2017, BEG/CEE China/India Gas Demand, Page 42
regulated rate. It is a common practice for gas-fired power generators to negotiate the gas price directly
with local governments (Ng, 2015).
The continuing provision of sizable subsidies by debt-laden local governments to offset the costs of a
growing cross-subsidy is probably not sustainable. Residential gas use grew rapidly over the past decade
thereby increasing the cross-subsidy to unmanageable levels. The cross-subsidy needs to be eliminated
to reduce the cost burden on the power, industrial and transport sectors and to stimulate demand in
those large gas consuming sectors. However, residential rates are politically very sensitive and are
administered by local government agencies. The agendas of local governments are not always consistent
with those of the central government. In an effort to tackle the cross-subsidy, the NDRC in 2013
introduced tiered pricing (e.g., prices increase with volume used) for residential users in a six-city pilot
program. Although the NDRC began to implement the pricing nationwide in 2015, it will not have a
material impact in the near term because the lowest-priced tier, e.g., current residential rates, applies to
about 80% of households. The second tier which has a 20% price increase from current levels applies to
only about 15% of households. It is the beginning of a very long process.
The first six months of 2016 saw an initial sizeable demand response to lower domestic natural gas
prices and lower imported LNG prices: gas consumption increased by 9.8% reaching 99.5 BCM in the first
six months of 2016 compared with the same period in 2015 with LNG imports increasing 21.2% for the
same period year on year.77 However, domestic gas production increased only 2.9% over 2015 for the
same six month period reflecting lower prices paid to producers.78 Gas consumption growth moderated
to 2.3% year on year July reflecting sluggish economic growth and weakening seasonal consumption.79
LNG imports in July 2016 declined 17% from those in July 2015 as LNG prices into China increased. July
2016 pipeline imports, primarily from Turkmenistan and Uzbekistan, rose 21% from those in July 2015.80
The average price of pipeline gas was $4.77/MMBtu in July 2016 compared to $5.40/MMBtu for LNG.81
Despite the fall in LNG and domestic gas prices in 2015 and the first half of 2016, coal-fired plants were
still first in the dispatch order for baseload generation based on LNG prices into Guangdong in southern
China.82
India
Like China, India has administered pricing for natural gas: central and local governments intervene in
price setting in all segments of the natural gas value chain (upstream, midstream and downstream end
users). The Gas Utilization Policy (GUP) discussed previously (Table 5) determines end-user prices by
sector. The GUP basically rations lower-priced domestic gas to Tier 1 priority sectors while LNG fills the
remaining demand. Domestic gas prices are set by the central government; LNG prices are determined
by contract and spot prices. However, if domestic gas supplies are not sufficient to meet 100% of Tier 1
demand and/or physical constraints impair the Tier 1 consumer’s ability to take domestic gas, LNG is
supplied to these customers at a subsidized price. Pooling of domestic and LNG gas prices is generally
77 LNG World News, 2016. 78 Kohl, 2016. 79 China Daily, 2016. Bloomberg News, 2016, August 9. 80 Sikorski and Tertzakian, 2016. 81 Ibid. 82 Ibid.

April 2017, BEG/CEE China/India Gas Demand, Page 43
not permitted except for fertilizer plants and grid-connected power plants under specific pricing
programs.
The pricing mechanism for domestic gas was revised in late 2014 in response to a continued decline in
domestic gas production (a high of 53 BCM in 2010 to 19 BCM in 2014). Prior to that date, the gas price
paid to producers stayed at or below $2.00/MMBtu from 1997 to 2010 and was $4.20/MMBtu from
2010 to November 2014. Concerned that prices were too low to spur upstream investment, the Modi
administration tied the gas price paid to domestic producers to the gas consumption volume weighted
average of natural gas prices in the U.S., Mexico, Russia and Canada:
𝐷𝑜𝑚𝑒𝑠𝑡𝑖𝑐 𝑁𝑎𝑡𝑢𝑟𝑎𝑙 𝐺𝑎𝑠 𝑃𝑟𝑖𝑐𝑒 =𝑉𝐻𝐻 ∙ 𝑃𝐻𝐻 + 𝑉𝐴𝐶 ∙ 𝑃𝐴𝐶 + 𝑉𝑁𝐵𝑃 ∙ 𝑃𝑁𝐵𝑃 + 𝑉𝑅 ∙ 𝑃𝑅
𝑉𝐻𝐻 + 𝑉𝐴𝐶 + 𝑉𝑁𝐵𝑃 + 𝑉𝑅
Where VHH is total annual natural gas consumption in the U.S. and Mexico; PHH is the annual average of
daily prices at Henry Hub; VAC is total annual natural gas consumption in Canada; PAC is the annual
average of monthly prices at Alberta Hub; VNBP is total annual natural gas consumption in the EU and
Former Soviet Republics excluding Russia; PNBP is the annual average of daily prices at the National
Balancing Point in the UK; VR is total annual natural gas consumption in Russia; and PR is the annual
average of monthly prices in Russia. All prices include a deduction of $0.50/MMBtu for transportation.83
The new domestic pricing formula was highly controversial. Critics claimed that American, Canadian,
European and Russian gas prices were not relevant to the Indian market and that the government was
trying to manage the price level by selecting some of the lowest international gas prices (Figure 19).
Domestic gas producers said they needed prices of at least $6-$7/MMBtu and sometimes $10/MMBtu
to revive domestic gas production.84
Figure 19. Indian Domestic Gas Price versus International Gas Prices, 1997-2014 ($/MMBtu)
Source: Sen (2015a).
83 Sen, A., April 2015. 84 Sen (2015a). Ministry of Petroleum and Natural Gas (MOPNG).

April 2017, BEG/CEE China/India Gas Demand, Page 44
Prices are reviewed every six months based on price and volume data for the previous four quarters
with a one-quarter lag and are set based on gross calorific value. The resulting domestic gas price was
$5.05/MMBtu in terms of gross calorific value from November 2014 to April 2015.85 Domestic price
adjustments led the domestic gas price to decline to $4.66 between May and October 2015 and $3.82
since November 2015 (Figure 20). Underdeveloped states in the northeast receive a 60% discount on
both domestic gas and LNG prices.
Figure 20. Indian Domestic Natural Gas Prices November 2014-March 2016 ($/MMBtu)
Source: The Indian Express (2015).
The new pricing policy made provision for a premium (undefined) to be added to the formula price for
high temperature and high pressure fields as well as deep water and ultra-deep water fields. In March
2016, the Cabinet approved a special pricing policy for existing but undeveloped discoveries and new
discoveries in those fields. Domestic producers will be free to negotiate prices for production from those
fields subject to a price cap (“calibrated marketing freedom”). The cap price, in gross calorific value, will
be the lowest of the following:
the landed import price of fuel oil;
the weighted average trailing one year landed import prices of coal (30%), naphtha (30%) and fuel
oil (40%); and
the landed import price of LNG.86
The ceiling price will be adjusted every six months. The government expects the prices for production
from these fields to be 70-80% higher (around $6.50-$7.00/MMBtu, gross calorific value) than current
levels. It remains to be seen if those price levels result in increased upstream investment. In any case, it
will be at least several years before that production enters the market.
The government does not control LNG import prices. Contract LNG prices have been around $12-
$13.00/MMBtu until the 2015 renegotiation of the Qatar RasGas - Petronet contract LNG price, which
85 Government of India, Report of the Committee on Gas Pricing, 2014. 86 The Hindu (2016).
$5.05
$4.66
$3.82
$5.61
$5.18
$4.24
$0
$1
$2
$3
$4
$5
$6
11/14-4/15 5/15-10/15 10/15-3/16
$/M
MB
tu
Gross Calorific Value Net Calorific Value

April 2017, BEG/CEE China/India Gas Demand, Page 45
lowered the price by linking it to a three-month trailing average of Brent crude oil prices.87 In return for
the price concession, Petronet agreed to increase contract volumes from 7.5 MMTPA to 8.5 MMTPA.
The new contract price is currently in the range of $5-$6.00/MMBtu and the “landed price” for end-
users is estimated to be $8.50-$9.00/MMBtu. Although the price competitiveness of LNG is improved,
liquid fuels will continue to pose competition in the current oil price environment.
The government has had to devise special pricing schemes for gas-fired, grid-connected power plants
and urea fertilizer plants. These two sectors represented about 55% of total gas consumption in 2014-15
and have required government natural gas price subsidies in order to remain commercially viable. Urea
fertilizer producers have not been able to recover their production costs from farmers that pay
government subsidized low prices for fertilizers. As a result, urea production has remained flat for
several years leading to increased more expensive urea imports that increased the government subsidy
burden. The annual central government subsidy for urea is close to 75% of its production cost and is
estimated to be 21% or $580 billion of estimated total subsidies in 2015-16).88
In July 2015 the Cabinet approved gas price pooling for urea fertilizer producers. LNG prices will be
averaged with domestic gas prices to produce a uniform lower gas price. As a result, urea fertilizer
production is expected to increase 9% in 2015-16 and to decrease the government subsidy burden.
Gas power generators have not been able to sell their more expensive power (compared to coal-fired
power) to electric distribution companies because the distribution companies cannot recover their costs
due to controlled low end-user power prices. As a result, gas-fired power plants have been completely
stranded or operated at load factors well below 30%, further exacerbating the overall power supply
deficit in India and the non-performing loan burden of commercial banks.
In 2014 the government introduced a scheme whereby LNG prices were subsidized ($35 billion in 2015-
16) to bring gas-fired generation load factors up to 30%. This scheme will continue in 2016-2017 and the
subsidy burden is expected to decrease as gas prices have dropped.
In order for the large gas consuming sectors of fertilizers and power plants to accommodate market
natural gas prices and remain commercially viable on a stand-alone basis, basic reform of their business
models is required. The government is taking some initial steps to do this in both sectors. However, the
magnitude of the required reforms suggest that it will be a long process that is highly political.
Government support for both sectors is highly likely to continue in the near term.
The Petroleum and Natural Gas Regulatory Board (PNGRB) regulates both pipeline and city gas
distribution transportation tariffs. With respect to interstate pipeline transportation, regulated tariffs
are set on a three-zone basis with an incremental charge for every 300 km. There are also marketing
fees and taxes that must be recovered from end-user prices. In 2011, it was estimated that the total cost
to transport gas from the east coast to the west coast was $1.15/MMBtu.89 Pipeline tariffs currently
reported by GAIL India on its web site are less than $1.00/MMBtu. It appears that most natural gas sales
are done on a bundled basis with GAIL accounting for 51% of the volume. India does have a mandatory
87 The Hindu Business Line, 1/2/16. 88 DNA India, 12/28/15. 89 The Energy and Resources Institute (TERI), March 2016.

April 2017, BEG/CEE China/India Gas Demand, Page 46
open access policy for third parties to utilize spare pipeline capacity. However, demand for this service
has been muted in light of domestic gas shortages and high LNG prices.
Licenses to own, construct and operate CGD systems are given by the PNGRB. The gas sales price for all
CGD customer sectors is not controlled, although states have intervened in the past to prevent price
increases.90 The main competitors to natural gas in the piped natural gas (PNG) market for residential
and commercial customers, and in the compressed natural gas (CNG) market for vehicles are subsidized
liquid petroleum gases (LPG), and gasoline and high speed diesel, respectively. In late 2015, PNG was
competitive with subsidized LPG due to the CGD sector’s increased allocation of domestic gas (as a
function of its number one Tier 1 position)91 which saw an 18% price reduction in October 2015. In
December 2015, the government eliminated the LPG subsidy for higher income consumers while
maintaining it for poor consumers. With the subsidy removal, PNG is estimated to be 33% cheaper than
LPG for those higher income consumers.92 Prior to the RasGas – Petronet LNG contract renegotiation,
demand from industrial PNG customers was weak but could improve with the lower contract prices.
Gasoline and diesel prices are effectively de-controlled. However, the natural gas demand from the CNG
market has been slowing as gasoline and diesel prices have fallen with crude oil prices. However, in
December 2015, the Indian Supreme Court banned the registration of new diesel vehicles in 13 cities,
including Delhi, and directed all taxis in Delhi to convert to CNG.
Natural Gas Consumption Detail
Industrial and power generation applications constituted the larger shares of gas utilization for both
countries in 2014.
Figure 21. Natural Gas Consumption in China and India by Sector 2014
Sources: NBSC and MOPNG as revised by CEE (See APPENDIX 2 for revisions). BP Statistical Review 2016 has total
Chinese gas consumption at 188 BCM. MOPNG reported India’s total gas consumption of 47 BCM. BP SR 16 has
total gas consumption at 51 BCM.
90 Sen, A., April 2015. 91 In July 2014, the Modi government revised the priority order of the Gas Utilization Policy: city gas for households and transportation replaced fertilizer plants as the number one priority in Tier 1. Sen, A., April 2015. 92 ICRA, Indian Gas Utilities, December 2015.
94
27
34
21
10China Total: 186 BCM (2015 Total: 197 BCM; 7 TCF; 7,000 TBtu)
Industrial Power Residential/Commercial Transport Other
25
11
5
6
India Total: 47 BCM (2015 Total: 51 BCM; 1.7 TCF; 1,700 TBtu)
Industrial Power City Gas Distribution Other

April 2017, BEG/CEE China/India Gas Demand, Page 47
As our sectoral analysis indicates, in spite of many inconsistencies and dilemmas in both historical data
as well as published outlooks (see APPENDIX 2 for details), we do not expect substantial change going
forward. However, gas use for power generation is easily challenged by competing fuels and
technologies. The need to address inefficiency and over-capacity in China’s industrial sector and success
(or lack of) India’s industrialization policies will dictate potential outcomes in that sector. Like China,
India saw natural gas demand increase 9% for the three month period April-June 2016 compared with
the same period in 2015 as a result of lower domestic and import prices. Indian LNG import prices
declined from $13.10/MMBtu in 2014 to $7.50/MMBtu in 2015 and to about $4.85/MMBtu in the first
half of 2016.93 In 2015-16, India consumed 46.62 BCM of gas, up 2.9% from 2014-15 and imported LNG
of 21.31 BCM, up 15% from 2014-15.94 LNG accounted for 44% of total gas supply April-July 2016.95 On a
monthly average basis, Indian gas consumption for April-July 2016 was up 17% compared to the average
monthly consumption for 2014-15 and LNG imports were up 14% compared to the average monthly LNG
imports for 2014-15. Like China, Indian LNG imports fell for the first time in 2016 in July by 2%
compared to July 2015 due to a 12% increase in LNG prices from June 2016 to July 2016 and an increase
in domestic gas production.96
Total gas consumption in China increased from 107 BCM in 2010 to 186 BCM in 2014 reflecting the
economic expansion resulting from the government’s economic stimulus efforts after the 2009 global
financial crisis. In India total gas consumption declined 23% from 61 BCM in 2011 to 47 BCM in 2014.97
The decline in India’s total gas use is attributable to large decreases in cheaper domestic gas supplies
and the lack of substitutes given the relatively high price of imported LNG over the period. The industrial
sector was the main driver of gas demand in both countries. The industrial sector’s share of total gas
use grew from 46% to 50% (2010 to 2014) in China accounting for 57% of the 79 BCM increase in total
gas use. In India the industrial sector’s share of total gas use grew from 38% to 52% from 2011 to 2014,
a slight increase of 2 BCM, reflecting lower total gas demand in 2014 rather than significant industrial
sector gas use growth.
In both countries the power sector’s share of total gas use declined: from 17% to 14% in China (2010-
2014) and from 38% to 23% in India (2011-2014). India’s power sector gas use declined 12 BCM due to
the gas supply and price issues mentioned previously whereas China’s power sector gas use increased by
9 BCM.
The residential/commercial sector remained the second largest gas consuming sector in China over the
period growing by 11 BCM to account for 18% of total country gas use in 2014. Gas use in the city gas
distribution (CGD) sector in India remained flat and accounted for 11% of total Indian gas use in 2014.
The 2014 CGD sector in India was much smaller (5 BCM) than the 2014 residential/commercial sector in
China (34 BCM) reflecting more rapid urbanization and rising household incomes in China as well as
more rapid build out of gas distribution infrastructure.
93 Sikorski and Tertzakian, 2016. 94 Petroleum Planning & Analysis Cell, Ministry of Petroleum and Natural Gas, 2016, August, Historical and Current Trend of Natural Gas Consumption, http://ppac.org.in/content/152_1_Consumption.aspx. 95 Ibid. 96 Sikorski and Tertzakian, 2016. 97 MOPNG data prior to 2011 does not include consumption of LNG.

April 2017, BEG/CEE China/India Gas Demand, Page 48
Transport sector gas use in China almost doubled between 2010 and 2014 increasing from 11 BCM to 21
BCM. The Chinese government strongly supports development of a natural gas vehicle (NGV) fleet,
primarily for public vehicles such as buses, taxis and some trucks in order to improve urban air quality.
However, transport sector gas use growth in China slowed in 2015 as natural gas price decreases lagged
the drop in oil prices and the corresponding drop in diesel and gasoline prices. India’s transport sector
gas use is included in CGD gas use and is very small. Some Indian cities like New Delhi are encouraging
NGVs to improve air quality but sector development is in its infancy and impeded by currently cheap and
more abundant alternatives.
Industrial Sector
The largest consumer of natural gas in both China and India is the industrial sector representing about
50% of total gas use in each country. China consumed more than three times as much natural gas in the
industrial sector as India in 2014: 94 BCM in China versus 25 BCM in India. Leading industries differ. In
2014 in China, the chemicals industry represented 34% of total industrial gas use, followed by the
diversified other industrial (25%), energy sector own use (17%)98 and refining (15%) industries. In
contrast, the Indian fertilizer industry, which receives heavily subsidized natural gas in order to support
the farmers in India, represented 62% of total industrial gas use in 2014. Refining, petrochemicals, and
energy sector own use (primarily LPG shrinkage) follow at 19%, 12% and 6%, respectively, of total
industrial gas use.
Figure 22. Industrial Gas Consumption by Sector in China (BCM)
Source: NBSC as revised by CEE (See APPENDIX 2 for revisions)
98 94% of gas use is for oil and gas extraction and 6% for gas production and distribution.
21 23 2531 32
814
16
2023
13
1413
1516
4
710
1414
2
3
3
44
1
1
3
34
0
10
20
30
40
50
60
70
80
90
100
2010 2011 2012 2013 2014
BC
M
Chemicals Other Industrial Energy Sector Own Use
Refining Steel Non-Ferrous Metals

April 2017, BEG/CEE China/India Gas Demand, Page 49
Figure 23. Industrial Gas Consumption by Sector in India (BCM)
Source: MOPNG as revised by CEE (See APPENDIX 2 for revisions). MOPNG data before 2011 does not reflect
consumption of LNG.
In China, the greatest increases in industrial sector natural gas demand between 2010 and 2014
occurred in other industrial categories (15 BCM), chemicals (11 BCM) and refining (10 BCM). Increases in
Indian industrial sector gas demand between 2011 and 2014 occurred in fertilizer (1.2 BCM) and
petrochemicals (1 BCM), offset by a decrease in sponge iron gas use (1.2 BCM).
The forecasts we reviewed (see APPENDIX 2) expect robust industrial sector gas demand growth in
China. The EIA has the most aggressive industrial sector gas demand growth forecast expanding by a
factor of three from 2012 (73 BCM) to 2030 (213 BCM). The EIA forecast is driven by increased gas
demand from the chemicals sector as well as the non-energy-intensive manufacturing sectors.99 These
latter sectors are included in our “other industrial” category and consist of industries that are small gas
consumers currently but have grown rapidly in recent years and should continue to expand in a services-
led economy. The IEA forecasts industrial gas demand growth to grow 66% from 75 BCM in 2013 to 124
BCM in 2030 resulting from chemicals sector gas use growth as well as environmental policy-driven fuel
switching from coal to gas. The same factors drive the Energy Insights McKinsey industrial gas demand
growth of 53% between 2016 (103 BCM) and 2030 (158 BCM). ICIS expects flat to slow growth in the
chemicals sector in the near term but expects non-chemicals industrial/commercial gas demand growth
to increase 51% between 2016 (75 BCM) and 2020 (114 BCM).
99 EIA IEO 16. Non-energy-intensive manufacturing includes fabricated metal products, machinery, computer and electronic products, transportation and electrical equipment. All of these are included in our “other industrial” category.
14 15 16 15
44
4 52
22 3
11
11
0.30.3
0.30.5
11
0.30.1
0
5
10
15
20
25
30
2011 2012 2013 2014
BC
M
Fertilizer Refining Petrochemicals
Energy Sector Own Use Other Industrial Sponge Iron

April 2017, BEG/CEE China/India Gas Demand, Page 50
Chemicals The chemicals sector accounted for 34% and 12%, respectively, of China and India’s total industrial gas
use in 2014. ExxonMobil (2016) asserts that “chemicals production is the fastest-growing source of
industrial energy usage” globally. China’s chemicals industry has experienced rapid growth. According to
IHS analysts, China is now the world’s largest consumer of chemicals driven by consumer goods
manufacturing and growing domestic consumption.100 Morawietz et al. (2015) states that China’s
chemical sales expanded at an average compound rate of 26% from 2005 to 2015. Chemicals are the
building blocks for plastics which are in many consumer products. China’s plastics production grew at an
average annual rate of 14% 2005 to 2014.101
Growth in China’s commodity petrochemicals demand such as polymers, propylene and polypropylene
is slowing according to Hong et al. (2013) and Viswanathan (2015). Nevertheless, China is expected to
increase capacity in some commodity chemicals like naphtha-based ethylene in the near term, driven by
the desire to reduce imports. In the first eight months of 2016, China’s ethylene output increased 6.6%
year-on-year with plastics production rising 7.9% over the same period.102
The chemicals industry is moving increasingly toward the production of high-end specialty chemicals,
which are used in sectors such as pharmaceuticals, coatings, infrastructure, information technology and
automobiles. IHS Specialty Chemicals Update Program (2015) expects consumption of specialty
chemicals in China to grow about 7% per year to 2019, down slightly from 8-9% historically. BMI says
that the growth potential in Chinese chemicals lies in higher value-added products, not the basic
petrochemicals that drove historical demand increases.103 IHS notes that Chinese and Indian
manufacturers have become key players in several specialty chemical markets and expects the trend to
continue. However, the sector’s rapid growth has led to overcapacity in some commodity and specialty
chemicals products depressing profitability, and BMI expects that near term capacity increases will
outpace demand growth.104 However, environmental opposition to chemical plants increased
significantly following five chemical explosions in 2015 and could slow the announced capacity
expansions. 105 Combating overcapacity and shutting down inefficient plants in the sector is expected to
be a focus in the 13th Five-Year Plan under development in 2016 although the timing and magnitude of
such measures are uncertain.
India’s petrochemical sector is expected to expand driven by demand from the textile, automobile and
food packaging industries. BMI expects India’s demand growth (8% p.a. 2014-2024) for polypropylene
and polyethylene to outgrow China’s (6% p.a. 2014-2024) in the future as India’s per capita consumption
is very low compared to Chinese and global per capita consumption of those products. Currently India’s
ethylene/polymers industry is much smaller than China’s: in 2013-2014 India had 9 operational ethylene
100 Pang, et.al., 2016. 101 NBSC, 2016. 102 BMI Research, 2016, Q4, China Petrochemicals Report. 103 Ibid. 104 BMI Research, 2016, Q2, China Petrochemicals Report. 105 Ibid. A chemical explosion in September 2015 killed around 150 people. A review following the disaster identified up to 1,000 chemical units that needed to be relocated and/or upgraded at an estimated cost of about $70 billion.

April 2017, BEG/CEE China/India Gas Demand, Page 51
crackers compared to 58 in China according to Mistry (2014). At the time, China had 18 ethylene cracker
projects in progress compared to three in India.
The supply/demand balance for Indian polyethylene is expected to remain in deficit through 2025 and
the balance for polypropylene is expected to change from surplus to deficit by 2022 (Mistry, 2014). The
IEA expects ethylene production to increase from 3 million tonnes in 2013 to 13 million tonnes by 2040.
Nevertheless, BMI sees threats to new chemicals capacity additions in India due to policy formation and
execution problems, the high cost of domestic capital and development delays in environmental
clearances, land acquisition and general bureaucratic approvals.
The expected demand growth for Indian petrochemical products offer a solid rationale for new capacity
to be developed. However, investment in new capacity to date has been limited owing to many of the
challenges faced by Indian corporate and public sectors as discussed earlier in this report. In addition,
industrial centers in India are regionally fragmented. The chemicals sector benefits from clustering to
achieve scale and integration. The central government has a cluster initiative, the Petroleum, Chemicals
and Petrochemical Investment Regions, and has approved four locations but only one project has made
any significant progress because of “excessive interference and control by the state and failure to
actively involve the private sector.”106 Foreign direct investment in the sector is permitted but has not
been forthcoming due to “policy paralysis, poor infrastructure, and complex legal, tax and regulatory
regimes.”107
The chemicals sector is the largest industrial consumer of natural gas in China accounting for 34% of
total industrial natural gas demand in 2014. The chemicals sector uses naphtha, fuel oil, natural gas and
coal as both fuel and feedstock. The chemicals sector’s natural gas consumption grew at an average
annual rate of 10% from 2005 to 2014 outpacing total average energy demand growth of 8% over the
same period. The share of natural gas in chemical sector energy demand increased from 8% in 2005 to
9% in 2014 (Figure 24). Natural gas has some advantages as a fuel in integrated refinery and
petrochemical complexes. However, unlike many countries, the Chinese chemicals sector also uses coal
as a fuel and as an alternative feedstock and the coal-fired chemical capacity is expected to expand
according to ExxonMobil (2016). Both coal and gas use in the sector grew at an average annual rate of
about 10% 2005 to 2014. The share of coal in total gas use increased from 54% in 2005 to 57% in 2014.
106 IHS Chemical Week, 2/10/14. 107 Ibid.

April 2017, BEG/CEE China/India Gas Demand, Page 52
Figure 24. Chemicals Sector Use of Gas and Energy in China
Source: NBSC, CEE estimates 2014 and 2015
China leads the world in the expansion of ethylene and propylene production. China’s plants are heavily
dependent on naphtha generated by its refining sector as well as imported naphtha (Figure 25).
Figure 25. China Total Petrochemical Cracker Feedstock by Fuel, 2016108
Source: BMI Research, 2016, China Petrochemical Report 4Q
108 BMI Research, 2016, Q2, China Petrochemicals Report.
-20%
-10%
0%
10%
20%
30%
40%
50%
0
2,000
4,000
6,000
8,000
10,000
12,000
14,000
16,000
18,000
20,000
2005 2006 2007 2008 2009 2010 2011 2012 2013 2014
Trill
ion
Btu
Total Energy Consumption Coal Consumption
Natural Gas Consumption Energy Consumption Growth
Coal Consumption Growth Gas Consumption Growth
Naphta75%
Butane19%
Ethane4%
Gasoil2%

April 2017, BEG/CEE China/India Gas Demand, Page 53
In an effort to become feedstock self-sufficient, China has invested in coal-to-olefins technology.
According to Orr (2012), Chinese chemical companies have invested heavily in technologies like coal-to-
olefins.109 China’s investment in unconventional chemicals production was estimated at $20 billion in
2015 alone.110 Coal consumption for coal-to-liquids projects grew at an average annual rate of 31%
between 2010 and 2013.111 IHS projects that by 2020, 40% of olefins in China will come from
unconventional feedstocks such as methanol, coal and propane, up from 20% in 2015.112
China has added more than 9 million tonnes of ethylene capacity between 2010 and 2015 and is
expected to add at least 7 million tonnes of new capacity between 2015 and 2019 according to IHS
Chemical. In 2015, a great majority was coal/methanol based. However, BMI cautions that capacity
utilization rates for coal-based polyethylene plants was 65%-70% to date in 2016, down from over 80%
in 2015.113 The cost of naphtha-based polyethylene is now cheaper than coal-based production and is
negatively impacting margins. The economics of coal and methanol based ethylene projects are poor at
oil prices below $90/Bbl.114 As a result, BMI expects delays or cancellations of announced new coal and
methanol based ethylene capacity but sees naphtha based ethylene capacity almost doubling over the
next five years.115
The operating rate for coal-based polypropylene plants has been around 75% year to date according to
BMI. Integrated coal-to-olefin polypropylene projects produce the lowest priced polypropylene in
China’s domestic market and is expected to account for more than 50% of new capacity in 2016.116
There are mixed outlooks in the natural gas demand forecasts we reviewed for coal and methanol-to-
olefins technologies in China (see APPENDIX 2). ICIS expects the chemicals sector share of total Chinese
gas demand to drop from 13% in 2016 to 9% in 2020 because “natural gas usage as a chemical feedstock
is not encouraged by the state government.”117 BMI expects fuel use in the chemicals sector to be
dominated by coal and naphtha. Other forecasters like McKinsey Energy Insights, IEA, and EIA are more
positive. McKinsey expects gas use in the chemicals sector to “stabilize” as “industrials will replace coal
and heavy oil with gas under pressure from local governments” to combat pollution.118 Similarly, IEA
expects industrial gas use in China to increase by a factor of four driven by “gas demand from the
petrochemical sector and a policy-driven switch from coal use especially in and around urban areas.”119
The EIA expects the coal share of chemical feedstock fuel to increase from 20% to 32% between 2012
and 2040, primarily displacing naphtha. However, the EIA thinks that the natural gas share of chemical
feedstock use will also increase as gas is used more heavily in ammonia and methanol production which
is currently dominated by coal with a 70-80% share of feedstock use.120 In its 2016 Outlook for Energy,
109 Orr, 2014. 110 Pang, et.al., 2016. 111 NBSC, 2016. 112 Pang, et.al., 2016. 113 BMI Research, 2016, China Petrochemicals Report Q4 114 Ibid. 115 Ibid. 116 Ibid. 117 ICIS, 2016. 118 Energy Insights, 2016. 119 IEA WEO 15. 120 EIA IEO 16.

April 2017, BEG/CEE China/India Gas Demand, Page 54
ExxonMobil projects that Asia Pacific chemical sector fuel and feedstock use will be heavily dominated
by naphtha, with coal as an alternative chemical feedstock in China.121
Given the magnitude of the non-natural gas capacity additions to date, we expect chemical sector
natural gas demand growth to slow from historical growth rates. Chemical sector gas use was flat
between 2013 and 2014. The Chinese chemical sector will continue to expand fueled primarily by
naphtha and coal. Significant growth in natural gas use in the sector would depend on price relative to
alternatives and aggressive implementation of government policies regarding pollution. The latter has
been limited thus far.
The key chemical sector developments in China to monitor going forward are:
(1) the magnitude and timing of unconventional feedstock growth;
(2) the magnitude and timing of carbon emissions policies and the relative impacts on fuel costs and the
sector;
(3) chemical sector growth itself in a world of overcapacity and pressured margins;
(4) reduction of sector overcapacity, and
(5) local resistance to sector capacity reductions and continuation of subsidies.
The Indian petrochemicals sector currently relies primarily on domestic naphtha from its refineries as
feedstock and this is expected to continue. Natural gas has played a limited role to date due to lack of
domestic supplies, relatively high LNG prices, and limited distribution infrastructure. Petrochemicals is a
Tier 2 gas consumer and almost 50% of its gas supply has come from higher priced LNG. As with refining,
LNG prices were not a big issue when naphtha prices were high, but competition has intensified as crude
oil prices dropped. The December 2015 renegotiation of India’s Qatar LNG contract will move LNG prices
into the single digits. If India could successfully develop integrated refinery/petrochemicals complexes,
natural gas could possibly have some advantages. Unlike China, India has not made a big investment in
unconventional feedstock technologies such as coal because India’s domestic coal resources contain
limited levels of sub-bituminous coal which is preferred for chemicals production.122 Some companies,
including GAIL and Reliance, are planning to import cheap U.S. ethane for existing (Reliance) and new
(GAIL) plants. Reliance has executed agreements for their ethane imports, including orders for six very
large ethane carriers.123 ExxonMobil projects that Asia Pacific chemical sector fuel and feedstock use
will be heavily dominated by naphtha, with coal as an alternative chemical feedstock in China.124
In view of the subdued level of forecast capacity additions in the Indian petrochemicals sector for the
next 6-10 years (it takes at least 8 years to construct a new petrochemicals plant), it is difficult to see
much near term natural gas demand growth in the sector. There should be moderate growth thereafter
depending on the success of improving the overall business environment in India and successful
implementation of the clustering concept.
121 ExxonMobil forecasts that global use of naphtha and NGLs in the chemical sector will increase by 70% and 90%, respectively, by 2040. Also see footnote 118. 122 Sub-bituminous coal is cleaner, lighter and easier to extract than anthracite coal. The latter is the majority of India’s coal resources whereas almost 50% of China’s coal is sub-bituminous (Mistry, 2014). 123 www.livemint.com, 2/1/16. 124 ExxonMobil forecasts that global use of naphtha and NGLs in the chemical sector will increase by 70% and 90%, respectively, by 2040. Also see footnote 118.

April 2017, BEG/CEE China/India Gas Demand, Page 55
Refining Overcapacity in the refining sector exists globally, regionally in Asia, and in China domestically with
downward pressure on utilization and margins, according to Fitzgibbon and Janssens (2015). These
authors expect utilization rates to fall further in Asia with improvements possibly beginning in 2020.
China has been adding refining capacity at an average annual rate of 6% between 2005 and 2015 in
order to meet local demand. Refinery sector investment grew at an annual average rate of 17% from
2005 to 2014. However, refinery capacity utilization rates have decreased from the peak of 82% in 2010
to 72% in 2014, before increasing to 75% in 2015. BMI Research reports a refinery capacity utilization
rate of 75.7% for the first five months of 2016 and estimates that more than a quarter of the country’s
refining capacity remains idle.125 India has the fourth largest refining capacity in the world after the U.S.,
Russia and China but its capacity is less than one-third of the capacity in China. The public sector owns
59% of refining capacity while the private sector operates 35% with the remaining 6% operated by joint
ventures. Refining capacity grew 7-8% on average until 2012-13 (slightly higher than China at 6%) in
India on the back of strong private sector investment in the sector from companies like Essar Oil and
Reliance, after which the growth stagnated until the addition of the Paradeep refinery in late 2015.
Throughput in India is about 43% of that in China.
Figure 26. Refinery Capacity and Throughput in China and India
Source: BP Statistical Review of World Energy 2016. India data do not include the 15-million tonne Paradeep Refinery commissioned in November 2015
BMI expects Chinese refined products consumption to slow markedly in coming years from 5% per
annum growth 2011-2015 to 1.3% p.a. 2016-2025 due to China’s ongoing economic slowdown and its
shift to a services-led economy.126 Diesel demand in particular is weakening due to the contraction in
the more diesel intensive manufacturing and construction industries. Residual fuel oil (RFO)
consumption will suffer negative impacts from stricter emissions laws and higher fuels standards. In
addition, small private refiners are replacing RFO as a feedstock with imported crude oil since they were
allowed to import crude oil for the first time in early 2014. Gasoline demand is expected to grow but
there is a growing oversupply in the domestic and regional markets which could lead to near term
125 BMI Research, 2016, 4Q, China Oil & Gas Report. 126 Ibid.
0
2,000
4,000
6,000
8,000
10,000
12,000
14,000
Tho
usa
nd
Bar
rels
pe
r D
ay
China
Capacity Throughput
0
2,000
4,000
6,000
8,000
10,000
12,000
14,000
Tho
usa
nd
Bar
rels
pe
r D
ay
India
Capacity Throughput

April 2017, BEG/CEE China/India Gas Demand, Page 56
production cuts. As a result of flagging domestic demand, China became a small net exporter of refined
products (primarily jet fuel and diesel) for the first time in 2015.127 Exports of middle distillates like jet
fuel and diesel are expected to increase, but China should return to being a net refined products
importer driven by gasoline, LPG and, to a lesser extent, residual fuel oil imports.
In spite of slowing demand growth, BMI reports that PetroChina and Sinopec, which together control
about 60% of the industry, are planning to construct five new refineries over the next five years. Others,
such as Fitzgibbon and Janssens (2015) think that the refining industry will slow down or defer new
projects. The industry’s focus could shift away from new capacity additions and towards the
modernization of existing facilities as fuel standards tighten domestically and in export markets. In
August 2016 the government issued new guidelines aimed at reducing overcapacity in the refining and
petrochemical industries. However, some analysts characterize the guidelines as vague; that the
enforcement will be “spotty;” and that they will not result in a meaningful reduction in overcapacity.128
India has had surplus capacity in refining relative to its domestic demand for refined products. The
surplus capacity has been utilized to generate exports. As a result, Indian refineries, unlike China, have
consistently operated above design capacity and their refined products exports accounted for about
15%-20% of the value of total exports in recent years.129 Essar Oil and Reliance account for 80-90% of
India’s refined products exports.130 Reliance owns the largest refinery in the world (1.2 million
barrels/day capacity). Even though domestic oil products consumption has grown at an average annual
rate of about 4%, production has thus far outstripped domestic demand.
However, the volume of refined products exports dropped 10.5% and 19% in 2014 and 2015,
respectively.131 India’s surplus refining capacity is being increasingly utilized to meet strong domestic
demand growth spurred by low fuel prices and a rapidly expanding vehicle fleet. Domestic demand grew
at 4.1% in 2014, 8% in 2015 and 11% through August 2016. The largest demand increase has been for
gasoline, followed by LPG and diesel. Diesel is used heavily in the industrial sector which is expected to
expand. Aided by supportive subsidies the government wants LPG to displace kerosene in the residential
sector and increase its market share by 20%. BMI expects average domestic demand growth of 4.4%
p.a. 2017 to 2021 dropping to 3.5% thereafter. India’s refined products consumption will outpace the
1.3% p.a. forecast annual growth rate for refined products consumption in China.132
However, neither IEA nor BMI expect significant refinery capacity additions going forward. After the
Paradeep refinery, the IEA expects only two smaller projects to be completed before 2020.133 BMI
forecasts very limited capacity growth between 2017 and 2025. The IEA expects refinery capacity
127 Ibid. 128 The guidelines’ weakness is attributed to the government’s contradictory goals for the sectors: Curbing overcapacity while attracting more private capital into the sector. Meidan, 2016. 129 2016, February, ITP Division, Ministry of External Affairs, Monthly Economic Bulletins, http://www.indembkwt.org/Monthly%20Economic%20Bulletin%20%20February%202016.pdf 130 The Oil and Gas Year, 3/24/15. 131 BMI Research, 2016, Q3, India Oil & Gas Report. 132 Ibid. 133 IEA WEO 15.

April 2017, BEG/CEE China/India Gas Demand, Page 57
additions to continue post-2020, moderated by competition from China and the Middle East in export
markets. By 2030, the IEA expects domestic oil products demand to outstrip domestic capacity.
Natural gas use in the Chinese refining industry substantially outgrew GDP growth between 2005 and
2014: an estimated 27% versus 10%. The natural gas market share of total refining sector energy use
grew from 2% in 2005 to 10% in 2013, dropping to 9% in 2014 (Figure 27).134 In recent years refining
natural gas demand grew faster than total energy demand that averaged 6% between 2005 and 2014.
Competing fuels include naphtha, fuel oil and coal: gas competes with fuel oil and coal as a fuel for
process and utility heaters and with naphtha as feed and fuel for hydrogen generating units and as fuel
for gas turbines according to Taraphdar et al. (2012). Taraphdar et. al. (2012) also advocate natural gas
use in integrated refinery and petrochemical complexes to enable recovery of valuable components
from refinery off-gases; to facilitate the release of good quantities of naphtha; to enable more middle
distillate production; and to reduce the carbon footprint. When there is a large differential between
high crude oil and lower natural gas prices, natural gas use enhances refinery/petrochemical complex
profitability. These favorable price differentials existed in 2012-2013 when refinery gas use increased
rapidly in China but narrowed in 2014-2015. China’s naphtha imports surged in 2014-2015 as naphtha
prices plunged to six-year lows in 2015, down more than 50% from the previous year and there are
predictions for sustained low naphtha prices135 Wholesale fuel oil prices also fell after the collapse of
the oil price and were around $8/MMBtu in 2015. While coal is utilized in the refining sector, estimates
of use are not reliable.
Figure 27. Refining Sector Use of Gas and Energy in China
Source: NBSC, CEE estimates 2014
134 National Bureau of Statistics China, 2016, http://data.stats.gov.cn/english/easyquery.htm?cn=C01 135 BMI Research, 2016, Q2, China Petrochemicals Report.
0%
10%
20%
30%
40%
50%
60%
70%
80%
0
1,000
2,000
3,000
4,000
5,000
6,000
2005 2006 2007 2008 2009 2010 2011 2012 2013 2014
Trill
ion
Btu
Total Energy Consumption Natural Gas Consumption
Energy Consumption Growth Gas Consumption Growth

April 2017, BEG/CEE China/India Gas Demand, Page 58
For China’s refining sector, we can see scenarios in which refining sector energy demand growth is lower
than historical growth rates or flat at 2015 levels as the sector deals with overcapacity and weak
profitability through 2020. Continuation of low coal, naphtha and fuel oil prices could also inhibit
natural gas consumption growth in the sector although the fuel oil price floor will keep that price from
dropping further. China’s domestic production of naphtha is expected to increase in the near-term
keeping downward pressure on prices.
The key developments to monitor in the Chinese refining sector are: (1) the timing and magnitude of
throughput improvement; (2) the relationship among natural gas, coal, naphtha and fuel oil prices; (3)
the level of refinery capacity expansions and (4) the domestic and import supplies of coal, naphtha and
fuel oil.
Like China, in India natural gas competes with naphtha, fuel oil and coal in the refining sector. Essar Oil
uses coal to power its refineries, saving 15% in power costs, while others use naphtha, fuel oil and
diesel. India’s refining sector gas use represented 19% of total industrial gas use in 2014. Refining sector
gas use did not increase much (.3 BCM) between 2011 and 2014 as it was constrained by lack of
supplies, due either to price or infrastructure limitations. As a Tier 2 natural gas consumer, LNG has been
a significant component of the refining sector’s supply estimated at about 45% in 2012-13. Until the
recent drop in crude oil prices, refineries could tolerate the relatively high LNG prices because naphtha
and fuel oil were even more expensive.
Growth in Indian refining sector natural gas demand growth through 2020 is dependent on the
persistence of currently low LNG import prices and the ability of the gas infrastructure (terminals and
pipelines) to deliver gas to refining demand centers. It is not clear how much additional gas could be
delivered to the sector without significant infrastructure additions. Post-2020 moderate gas demand
growth from the sector is possible as domestic oil products demand begins to offset possible demand
losses in the export markets. Realizable gas demand growth depends on adequate gas delivery capacity
as well as the price competitiveness of gas versus alternative fuels.
Steel China accounts for over 50% of global steel production with private steel producers accounting for 76%
of total capacity in 2013. Most of its production is commodity steel with higher margin specialty steel
accounting for only 6% of output in 2013. China’s steel production contracted 2.3% in 2015—the first
contraction in 35 years according to Shepherd and Mitchell (2016a). Domestic steel demand was down
about 4% in 2015 due to slowdowns in the construction (41% of demand in 2014) and heavy industries
sectors.136 Member companies of the China Iron and Steel Association had combined net losses totaling
around $10 billion in 2015 compared to profits of around $3 billion in 2014137
Nevertheless, the government, particularly at local levels, has been reluctant to close steel mills due to
anticipated job losses. China has about 1.25 billion tonnes of annual crude steel capacity, with an
estimated surplus capacity of 300 million tonnes: as of July, 2016, only 7% of the estimated surplus
capacity was closed.138 To date the industry has dealt with the overcapacity issue by increasing exports
136 .Zacks Equity Research, 2016. The World Steel Association expects China’s domestic steel demand to fall another 4% in 2016. A recovery in the Chinese construction sector appears unlikely in the near future. 137 Shepherd and Mitchell, 2016. 138 Shepherd, 2016; Lian and Stanway, 2015.

April 2017, BEG/CEE China/India Gas Demand, Page 59
which were up 20% in 2015 (Shepherd and Mitchell, 2016a). China hot rolled steel prices fell by close to
50% between early 2013 and late 2015.139 JP Morgan expects steel exports to have peaked in 2015 due
to a “wave of protectionism”: 37 anti-dumping cases globally were filed against Chinese steel producers
in 2015. However, despite tariffs imposed by the EU and the US in 2014 and 2015 steel exports have
continued to grow.140 On 3/4/16 the US imposed a 266% duty on imports of cold-rolled steel from
China, used to make auto parts, appliances and shipping containers. Some industry analysts think that
the government is propping up old industries like steel to ease the transition to a services-led
economy.141 Steel mills have been regular recipients of substantial government subsidies since 2000, if
not earlier.
The government announced on 2/29/16 that it plans to cut 38% of steel’s estimated 400 million tons of
excess capacity by 2020 and that 1.3 million coal workers and 500,000 steel workers could expect to lose
their jobs. 150 million tonnes of steel production are slated to be cut between now and 2020 per the
2015-2020 Five Year Plan.142 The government plans to establish a US$15 billion fund to help resettle laid
off workers.143 The timing of the cuts is uncertain in the face of increasing social unrest.144 In addition,
local governments, which want employment and tax revenue, have a history of undermining central
government reforms.
Ng (2016) expects steel output to drop another 2-3% in 2016, noting that “production cuts in a glut are a
long drawn out process as mills seek to maintain market share.” In its 2015 World Energy Outlook, IEA
(2015) expects China’s steel output to decline by 30% by 2040 with related energy demand following the
same decline. In contrast, the EIA expects Chinese steel production to increase at an average annual
growth rate of 3% from 2012 to 2040.145 Fitch Ratings expects China’s steel production capacity to peak
in 2016, with shutdowns outpacing additions over the next five years.146 Domestic steel demand is
expected to remain flat over the next few years barring major swings up or down in the real estate
construction business.
India is the world’s largest producer of sponge iron, which is used to produce long finished steel that is
primarily used in the construction sector. India’s steel production is growing but at lower rates as the
global steel glut has persisted. ICRA (2016b) observes that out of the top 10 steel producing countries
only India reported growth in steel production in calendar year 2015. In February 2016 the Indian
government imposed Minimum Import Prices on 173 categories of flat and long steel products for six
months. ICRA (2016b) expects this measure to effectively curb steel imports but expects domestic steel
demand growth to remain muted. There is excess capacity in India’s domestic steel industry: the current
utilization rate is 75% and 10-15 million tonnes of new capacity are being brought on-line. The Sponge
139 SteelBenchmarker Report 249. 2016. Prices improved in 2016 and were down 36% as of August 2016 compared to early 2013. 140 Dempsey, 2015. 141 Magnier, 2016. 142 Yang, 2016. 143 Ibid. A steel industry participant said that China, as a socialist country, must secure the livelihood of its workers. 144 Ibid. The China Labour Bulletin states that there has already been an increase in strikes and “workplace incidents: 503 incidents in Jan. 2016 –almost double the 272 incidents in Jan. 2015. Labor demonstrations doubled in 2015. 145 EIA IEO 16. 146 Fitch Ratings, 11/19/15.

April 2017, BEG/CEE China/India Gas Demand, Page 60
Iron Manufacturers Association (SIMA) is advocating that the government make “heavy expenditures” in
infrastructure and housing to stimulate domestic steel demand.
Scrap steel is an alternative input to sponge iron and has advantages: it is easy to melt and it requires
less fuel. Sponge iron demand in recent years has been hurt by low scrap steel prices and weak steel
demand. China is projected to have a sizable scrap steel surplus going forward. SIMA is calling for new
duties to be imposed on scrap steel imports.
Iron ore is the major input to sponge iron manufacture. Although global iron ore prices dropped 50% in
2014 and have remained weak thereafter, domestic iron ore producers have not lowered prices to
global levels. About 50% of sponge iron producers have captive iron ore mines but the other 50% are
exposed to market prices. Sponge iron producers are financially strained and 50% of the sector’s bank
loans are reported to be non-performing.147
China’s steel industry was the fifth largest industrial consumer of natural gas in 2014 (4.4 BCM)
representing 4.7% of total industrial gas use. The government has encouraged the use of natural gas in
the industry to address air quality issues. Natural gas consumption by the industry has grown at an
average annual rate of 18% from 2005 to 2014 compared to 6% for coal over the same period. Natural
gas increased its share of total steel energy use from 0.3% to 0.8% over the same period. However, coal
continues to be a significant low-price competitor with a market share of 51% in 2014 down only slightly
from 52% in 2005.
Figure 28. Steel Sector Use of Gas and Energy in China
Source: NBSC; CEE Estimates 2014 and 2015
147 Sponge Iron Manufacturers Association, 2015.
0%
5%
10%
15%
20%
25%
30%
35%
40%
45%
50%
0
2,000
4,000
6,000
8,000
10,000
12,000
14,000
16,000
18,000
20,000
2005 2006 2007 2008 2009 2010 2011 2012 2013 2014 2015
Trill
ion
Btu
Total Energy Consumption Coal Consumption
Natural Gas Consumption Energy Consumption Growth
Coal Consumption Growth Gas Consumption Growth

April 2017, BEG/CEE China/India Gas Demand, Page 61
Despite carbon reduction commitments, we expect that displacement of coal in the steel industry will be
a long process. As IEA (2015) notes, “the switch away from coal [for industrials] is not easy, requiring
time to plan and implement as well as significant capital investment.” Steel industry natural gas
demand growth in the near term depends on continued growth in steel production. For the first half of
2016, Chinese steel production declined 1.1% year-on-year.148 Resumption of natural gas demand
growth at historical levels in the longer term also seems unlikely in an industry expected to contract by
30%. Barring the imposition of carbon costs that disadvantage the price of coal relative to the price of
natural gas, we do not see the steel sector as a potential major growth market for natural gas.
India’s steel production is growing but at lower rates as the global steel glut has persisted.149 In addition,
non-coking coal-based production accounts for 90% of total Indian sponge iron production even though
it consumes up to twice as much energy and generates more pollution than natural gas-based
production.150 Load factors for coal and gas sponge iron plants were 40% and 25% in 2014-15,
respectively. SIMA reported gas supply shortages in late 2015 claiming that available gas met only 15%
of the industry’s total gas requirements. 67% and 48% of the sponge iron sector’s gas supply was LNG in
2012-13 and 2007-2014, respectively. Reduced gas availability and high LNG prices saw sponge iron
natural gas use drop sharply in 2013-14 and 2014-15.
The outlook for the Indian sponge iron sector is not vibrant. The sector’s current problems are daunting
and the future appears to be veering away from it. Planned Indian primary steelmaking capacity
expansions use blast furnaces and do not require sponge iron as an input. It is difficult to see much
natural gas demand growth in this sector. The Vision 2030 sponge iron gas demand projections of 4 BCM
by 2020 and 5 BCM by 2030 are probably on the high side. This is not a major growth market for natural
gas.
Non-Ferrous Metals in China The non-ferrous metals industry includes products like aluminum, brass, copper, and titanium to name a
few. The aluminum industry is electricity-intensive but it also uses natural gas. Natural gas can be used
to extract aluminum oxide (alumina) from bauxite and the alumina is further smelted using large
amounts of electricity. Coal is a major competitor to gas in the total non-ferrous metals industry and had
a 61% share of total sector energy use in 2014 compared to 3% for gas.
In China, aluminum production is one of the largest non-ferrous metals industries. According to
Mukherji et al. (2015b), China now accounts for 50% of global aluminum production compared to 11% in
2000 with production growing at an average annual rate of 22% 2005-2015. China, the Middle East and
Russia are currently the lowest cost aluminum producers driving prices down by 27% in 2015 according
to Deaux (2015). Electricity is the primary energy source and China has some of the lowest cost
aluminum production in the world due to many smelters owning captive coal mines to fuel their needed
power (Home, 2015). Most smelters in southwest China do not have captive coal mines and are more
vulnerable to shut downs.
148 Bloomberg News, 2016, July 15. 149 ICRA reported that out of the top 10 steel producing countries only India reported growth in steel production in calendar year 2015. ICRA, Indian Steel Industry, February 2016. 150 According to IEA India is the only country in the world that uses coal for large-scale sponge iron production.

April 2017, BEG/CEE China/India Gas Demand, Page 62
China’s aluminum industry is similar to steel in that it suffers from overcapacity and oversupply of the
domestic markets. Domestic demand is weak due to decreased consumption by the real estate and
manufacturing sectors. Refined aluminum prices are low and state-owned Aluminum Corp. of China had
the biggest net loss of any state owned enterprise in 2014.151 Like steel, this sector too has relied on
export growth, 25% on average between 2005 and 2015, to deal with the overcapacity situation
(Mukherji et al., 2015b). In international markets, Chinese aluminum exports are viewed like its steel
exports: illegal dumping of subsidized production.
Although the industry has closed 3 million tons of aluminum capacity since 2010, it added 17 million
tons of new capacity 2010-2015, 4 million tons in 2015 alone (Mukherji et al., 2015b). It is expected to
add another 7 million tons in 2016 even though it is not certain that it can be put into operation (Leung,
2016). Like steel the aluminum industry enjoys government subsidies including tax credits and cheap
loans.
Total energy use in the non-ferrous metals sector grew at an average annual rate of 11% 2005-2014.
Non-ferrous metals sector gas use was 4.3 BCM in 2014 accounting for 4.6% of total industrial gas use
and grew at an average rate of 32% 2005-2014. Gas increased its share of total industry energy use from
0.7% in 2005 to about 3% in 2014. Coal is the main competitor to natural gas in the non-ferrous metals
sector and coal use grew at an annual average rate of 25% 2005-2014 and increased its share of total
sector energy use from 29% in 2005 to 61% in 2014.
Figure 29. Non-Ferrous Metals Sector Use of Gas and Energy in China
Source: NBSC, CEE estimates 2014 and 2015
151 Wildau, 2016.
0%
10%
20%
30%
40%
50%
60%
70%
80%
90%
0
500
1,000
1,500
2,000
2,500
3,000
3,500
4,000
4,500
5,000
2005 2006 2007 2008 2009 2010 2011 2012 2013 2014
Trill
ion
Btu
Total Energy Consumption Natural Gas Consumption
Energy Consumption Growth Gas Consumption Growth

April 2017, BEG/CEE China/India Gas Demand, Page 63
We think that the aluminum industry in its current configuration is unsustainable and, like steel, will
contract over the long term. Rebalancing capacity and production will take time for the same reasons as
in the steel industry. The rebalancing is complicated by local government subsidies to smelters to
support employment. Electricity accounts for most of the energy consumption in aluminum smelting
and local governments have offered off-balance-sheet loans and power subsidies to keep capacity on-
line (Mukherji et al., 2015b). Overall, weak profitability in the near term and the likelihood of sector
contraction in the longer term renders it unlikely for gas demand in the aluminum sector to grow
significantly.
With respect to the total non-ferrous metals sector, gas use is small although it has grown rapidly.
Significant total sector gas demand growth is dependent on expansion of the non-aluminum industries
and/or coal to gas switching driven by government environmental policies.
Gas Use in Other Industries The “other industrial” sector accounted for 25% (23 BCM) of total industrial gas use in China in 2014 but
is insignificant (2%) in India. The large “other industrial” category in China reflects its larger economy
and more diverse gas-consuming industries as well as the wider delivery capacity of its gas
infrastructure. The components of the “other industrial” category can be seen in Table 8.
The other industrial category’s gas use grew at an average annual rate of 34% between 2010 and 2014 (
Figure 30) but growth began to slow in 2014. The two largest gas consuming categories (non-metallic
minerals (clay, glass, cement) manufacture and wholesale/retail trade) accounted for 75% and 59% of
the sector’s gas use in 2010 and 2014, respectively, and grew at an average annual rate of 24% over the
period. The remaining categories grew more rapidly as the economy expanded.
Coal is a major competitor for natural gas in the non-metallic minerals, food and beverage, and paper
categories: its share of those categories energy use in 2014 was 89%, 63% and over 90%, respectively. It
is moderately present in wholesale and retail trade and textiles with market shares of 35% and 25%,
respectively. In the remaining categories, the coal market share is 10% or less.
Table 8. Other Industrial Sector Gas Use in China 2014 (BCM)
Other Industrial Sector Category BCM Percent of Total
Non-metallic minerals (Clay, glass, cement) manufacture 9.2 39%
Wholesale & retail trade; hotels; restaurants 4.7 20%
Manufacture of transport equipment 2.2 9%
Manufacture of machinery 2.0 8%
Food & beverage manufacture & processing 1.6 7%
Manufacture electronics & electric equipment152 1.4 6%
Manufacture of metal products 1.4 6%
Manufacture of textiles .6 3%
Manufacture of paper .6 3%
Total 23 100% Source: NBSC. Numbers may not add due to rounding.
152 Includes manufacture of communications equipment and computers.

April 2017, BEG/CEE China/India Gas Demand, Page 64
Figure 30. Other Industries’ Use of Gas in China (BCM)
Source: NBSC.
The manufacture of non-metallic minerals category could see slower growth as China transitions to a
services-led economy, especially if the construction sector contracts significantly. This category’s annual
growth rate dropped from 33% in 2013 to 12% in 2014. Manufacture of specialty glass for cars is
expected to grow more rapidly than cement going forward. In contrast, the wholesale/retail trade
category grew 25% in 2014 compared to flat growth in 2013. This category should continue to grow in a
services-led economy. Other consumer-oriented categories such as transport equipment; food &
beverage and electronics which accounted for 22% of other industrial sector gas use in 2014 grew at
average annual rates of 18%, 35%, and 7%, respectively, between 2010 and 2014. These categories
should continue to grow if China successfully transitions to a consumption-led economy.
Fertilizer Sector in India The fertilizer industry is critical to India’s goal of ensuring food security. Most of the phosphorous and
potassium based fertilizers are imported; in contrast, 80% of urea fertilizers are produced domestically.
India would like to be totally self-sufficient in urea production. Natural gas is the feedstock for 81% of
urea capacity and gas use by urea plants increased 8.6% from 14 BCM in 2011 to 15 BCM in 2014. The
highest urea plant gas use in recent years was 16 BCM in 2013.153 The fertilizer industry accounted for
60% of total industrial gas use in 2014.
Plants using naphtha and fuel oil as feedstocks were required to convert to natural gas by the end of the
2015-16 fiscal year but three naphtha have been allowed to continue operations until there is an
153 MOPNG, February 2016.
8
14
16
20
23
6
8
10
12
14
0%
10%
20%
30%
40%
50%
60%
70%
80%
0
5
10
15
20
25
2010 2011 2012 2013 2014
BC
M
Total Other
Non-Metal Minerals & Wholesale/Retail Trade
Total Other Growth Rate

April 2017, BEG/CEE China/India Gas Demand, Page 65
assured supply of gas.154 Feedstock switching could add 4 BCM (or 143 trillion Btu) of gas demand to the
base of 15-16 BCM.155
Table 9. Urea Production Capacity by Feedstock
Feedstock Number of Units Capacity (100.000 MT) % Share of Total Capacity
Gas 21 17.1 81%
Naphtha 4 1.9 9%
Fuel Oil 4 2.1 10%
Total 29 21.1 100%
Source: GOI, Report of the Working Group on Fertilizer Industry for the Twelfth Plan. Total capacity of 20 million
metric tons reported for 2016-17.156
The urea fertilizer industry continues to have priority access to domestic gas although it had to consume
some LNG as domestic production declined. According to the IEA WEO15 imported LNG met almost one-
third of urea plant gas requirements in 2013 at a time when LNG prices were high. Investment in the
sector has been very limited due to feedstock unavailability.
Figure 31. Urea Fertilizer Sales, Production and Imports in India
Source: Ministry of Fertilizers; MOF Annual Report 2015-16.
154 Department of Fertilizers, Fertilizer Annual Report 2015-16. 155 GOI, Vision 2030 Urea Gas Consumption Assumptions. 156 GOI, Department of Fertilizers, Ministry of Chemicals & Fertilizers, 2016, Installed Capacity During
Reporting Year 2016-17.
26
2829
30 30 3031
2122 22
23 23 23
25
56
8 87 7
6
0
5
10
15
20
25
30
35
2009-10 2010-11 2011-12 2012-13 2013-14 2014-15 2015-16*
Mill
ion
Met
ric
Ton
s
Sales Production Imports

April 2017, BEG/CEE China/India Gas Demand, Page 66
Urea production has been relatively flat until 2015-16 and imports have been necessary (Figure 55).
Domestic urea production reached a record 24.5 million tonnes in 2015-16 using existing urea
capacity.157 About 50% of imports in 2015-16 were from China.
In 2015 the government approved pooling of LNG and domestic gas prices for urea plants and prices
dropped from $9.00/MMBtu to $7.50/MMBtu in January 2016 (ICRA 2016 c). The government also
approved the revival of three closed urea plants and the construction of the first new urea plant in 15
years.158 However, securing capital for these projects is a major hurdle and no project had achieved
financial closure as of September 2016.159 India is also exploring coal-based urea production.160 Overall
the pace of new project development in the urea sector is slow.
End-use urea prices to farmers are controlled: the current maximum retail price is about $87/tonne
compared to about $220/tonne on the world market. World urea prices fell 30-35% in 2015 from $310-
$320/tonne in December 2014 due to high Chinese exports according to ICRA (2016c). The difference
between the cost of production and the maximum retail price is paid to the urea producer. The subsidy
covers more than 75% of production costs161 and subsidies paid to domestic urea producers accounted
for 26% ($12 billion) of GOI subsidies in 2012.162 These subsidies have led to over-consumption of urea
by farmers, relative to other price de-controlled fertilizers, which has led to soil chemistry damage.
Actual subsidy payments to urea producers significantly lag sales and these huge subsidy arrears ($8
billion in fiscal 2015)163 deters investment in the sector.
In its Vision 2030 projections, the government expects fertilizer sector gas demand to increase from
about 16 BCM in 2015-16 to 39 BCM in 2020. Incremental additions are shown in Table 10.
Table 10. Incremental Urea Fertilizer Natural Gas Demand above 16 BCM
Incremental Demand Source 2020-21 (BCM)
Naphtha Switching 3.0
Fuel Oil Switching 1.4
Revival of Closed Plants 4.0
Expansion Projects 6.8
Greenfield Projects 6.7
Revamp Projects 1.0
Total 23.0 Source: Vision 2030
The naphtha and fuel oil switching projects could be delayed by current low prices for those fuels. The
expansion, greenfield, and revamp projects require a significant capital outlay in a sector that has not
attracted investment in over a decade. These projects do not consider constraints linked to future gas
157 The Economic Times, 2016. 158 www.dnaindia.com, 12/28/15. 159 Mikhaiel and Khemka, 2016. 160 Ibid. 161 www.dnaindia.com 12/28/15. 162 IEA WEO 15. 163 Mikhaiel and Khemka, op. cit.

April 2017, BEG/CEE China/India Gas Demand, Page 67
supplies or gas infrastructure. In the case of rising natural gas prices, there is an implicit assumption that
the government would shoulder the additional subsidy burden.
ICRA forecasts that urea sector gas demand will increase from 15 BCM in 2014 to 19, 23 and 26 BCM,
respectively, in 2016, 2020 and 2025.164 As urea plants are currently operating at close to 100% of
capacity and the development of new capacity is highly uncertain, we think that projection is high.
At this point, we could see a possible demand increase of around 4 BCM in the near to medium term for
the sector if fuel switching actually occurs, but not much beyond that level. We find it difficult to
envision significant new investment, even if receiving import parity prices for production, in a sector
that requires significant but uncertain government support for its economic viability and that
experiences major delays in receiving that support (ICRA, 2016c). The urea subsidy was raised only 1% in
the 2016-17 budget and ICRA (2016c) expects delays in subsidy payments to continue.
Considerations for Gas Use in the Industrial Sector in China
Despite its environmental issues, coal is a formidable competitor to gas in the industrial sector. Coal
accounted for 72% of Chinese industrial sector energy use in 2014 (up from 62% in 2010) compared to
6% for natural gas. The IEA expects industrial sector coal use to remain flat through 2020 and then
declining around 20% by 2040 while industrial gas use increases 32% (30 BCM) between 2014 and 2030.
Two of the factors leading to the IEA’s projected decline in industrial coal use could also apply to natural
gas, e.g. rebalancing of the economy towards services and less energy-intensive industries and improved
energy efficiency. In the IEA view, the major driver of growth in industrial gas demand is the
enforcement of current pollution and climate policies that require switching from coal to gas that is
stronger than that seen to date.
Other forecasters have more bullish views of industrial gas demand growth. Between 2014 and 2030 the
EIA and Energy Insights McKinsey expect industrial gas demand to increase by 119 BCM and 64 BCM,
respectively. In the EIA Reference Case gas displaces coal in the growing ammonia and methanol
industries; the steel industry and its gas use continues to expand moderately; there is strong growth in
the gas-consuming non-energy intensive manufacturing industries, and pollution and climate policies
promote switching to gas. McKinsey expects significant fuel switching to gas as a consequence of
environmental policies and gas demand growth in the chemicals sector to “stabilize.”
Focusing on the near term, ICIS sees industrial gas demand increasing by 45 BCM from 2014 to 2020.
The chemical sector’s share of total industrial gas use will decline from 13% to 9% and the non-chemical
industries share will increase from 38% to 40%. ICIS also references coal-to-gas switching as a reason for
industrial gas demand growth.
In our view, it is difficult for environmental policies to trump the economic advantages of coal without
the imposition of measures that advantage gas economically to coal such as a meaningful carbon tax. It
seems unlikely that the government will burden an already slowing economy with a tax that is high
enough to trigger the desired fuel switching. The government could rely more upon renewables to meet
environmental goals than large-scale industrial fuel-switching, except in the most polluted urban areas.
As a result, the pace of industrial fuel-switching to gas may be slower than that envisioned in the
forecasts we reviewed. Given the massive investment in coal and methanol-to-olefins technologies, we
164 ICRA, Gas Utilities Report, 2016.

April 2017, BEG/CEE China/India Gas Demand, Page 68
expect usage of those fuels to grow in the chemicals sector. Naphtha will continue to be the dominant
fuel for ethylene production, possibly displacing coal in the near term. We do think gas demand growth
will occur in the non-energy-intensive manufacturing industries, especially in those where coal is not a
dominant competitor, as the economy becomes more consumer-oriented. However, it is difficult to
predict the significance of that growth.
Considerations for Gas Use in the Industrial Sector in India
India’s industrial sector is expected to grow as a result of the government-backed push to transition to
an industry and investment led economy from a services led economy. Progress in the “Make in India”
initiative has been muted to date. Nevertheless, if growth in manufacturing accelerates from current
levels, forecasters see significant expansion of the traditional energy-intensive industries like steel,
cement, refining and chemicals alongside continued growth in non-energy intensive industries such as
textiles, food and beverages, transport equipment and electronics. Growth in the fertilizer industry will
be out-paced by other industrial growth.
However, most forecasters see coal as the dominant fuel in the industrial sector. According to the IEA,
coal’s share of industrial total energy use will expand from 50% currently to 57% by 2040. India’s
environmental goals and commitments will be met with renewables rather than significant industrial
fuel switching from coal to gas. The IEA sees minimal growth in industrial sector gas use of 5-6 BCM by
2030. Growth in gas use in the IEA view is limited by higher gas import prices relative to alternatives,
significant limitations in the gas delivery infrastructure and muted growth in domestic gas supplies as a
result of pricing mechanisms that discourage upstream investment.
The EIA, McKinsey Energy Insights and ICRA forecast greater increases in industrial gas demand from
2014: 42 BCM and 28 BCM by 2030 per the EIA and McKinsey, respectively. ICRA sees industrial gas
demand growing 27 BCM by 2025 with fertilizer gas use dropping from 60% in 2014 to 50% in 2025.
These forecasts appear to be predicated on an energy-intensive industrial expansion that will increase
the use of all fuels.
Although there could be increased gas demand from the fertilizer industry, we expect the pace of gas
demand growth to be slow due to high uncertainty regarding new capacity additions in an industry that
requires major government support to survive. With respect to non-fertilizer industrial demand growth,
our view is closer to that of the IEA. We think industrial gas demand growth will be muted due to
infrastructure and supply impediments; limited duration of current low LNG import prices; limited
progress in the push for manufacturing growth to date; constrained access to affordable capital for
investment as well as overall impediments to industrial activity.165
Electric Power Sector
China generated more than four times the amount of electricity generated in India in 2014: 5,811 Twh in
China compared to 1,305 Twh in India.166 Access to electricity is 100% for rural and urban population in
165 Including, but not limited to, land acquisition difficulties, complex bureaucratic and administrative requirements, time-consuming procedures, local and central government differences, regulatory ambiguity and retroactive taxes. 166 BP Statistical Review of World Energy 2016.

April 2017, BEG/CEE China/India Gas Demand, Page 69
China compared to 79% (urban) and 70% (rural) in India.167 The industrial sectors in both countries are
the largest and fastest growing electricity consumers accounting for about 76% and 55% of total
electricity consumption in China and India, respectively. The agriculture sector plays a much larger role
in the Indian economy compared to China and, as a result, agricultural electricity use accounts for about
18% of total use India and less than 1% in China. The annual average growth rate of power generation
between 2005 and 2015 was higher in China at 9% compared to 7% for India.168 However, the power
generation growth rate in China has declined from an annual average of 11% (2005-2011) to 5% (2011-
2015), with only .3% growth between 2013 and 2014. . In general, electricity consumption and economic
growth move together in China (growth rates are correlated at about 0.83). Weaker electricity demand
growth reflects the effects of transitioning to a services-led economy. The electricity use of energy-
intensive industries decreased by 1.9% in 2015 compared to an increase of 3.7% in 2014.169 In contrast,
the electricity demand of the services sector (tertiary industry) and residential users increased by 7.5%
and 5% respectively in 2015. In contrast, electricity consumption growth has been more stable in India
with an average growth of about 6.6% between 2006 and 2015, albeit fluctuating along with the GDP
growth.
Figure 32. Electricity Consumption and GDP in China and India
Source: BP Statistical Review of World Energy 2016 and World Bank
Electricity consumption is expected to grow in both countries through 2040 as their economies continue
to expand but at lower rates than historical rates. Growth in Indian electricity use is expected to outpace
that of China’s as India improves population electricity access to 100% and its GDP grows at a faster rate
(Table 11; also see discussion in APPENDIX 2).
Table 11. Forecast Average Annual Growth Rates of Electricity Consumption in China and India
Country EIA (2012-2040) IEA (2013-2040)
China 2.2% 2.5%
India 3.2% 4.7%
167 World Bank, World Development Indicators, Electricity production, sources and access, http://wdi.worldbank.org/table/3.7. 168 BP Statistical Review of World Energy 2016. 158 Reuters, 2016, January 17.
0%
3%
6%
9%
12%
15%
0
1,000
2,000
3,000
4,000
5,000
6,000
7,000
2006 2007 2008 2009 2010 2011 2012 2013 2014 2015
Bill
ion
KW
h
China
Electricity Consumption Electricity Consumption Growth GDP Growth
0%
3%
6%
9%
12%
15%
0
1,000
2,000
3,000
4,000
5,000
6,000
7,000
2006 2007 2008 2009 2010 2011 2012 2013 2014 2015
Bill
ion
KW
h
India
Electricity Consumption Electricity Consumption Growth GDP Growth

April 2017, BEG/CEE China/India Gas Demand, Page 70
Installed Capacity versus Generation
In both countries, coal dominates installed capacity with a 60% share (Figure 33).170,171 Only 4% of the
installed capacity in China is from gas-fired generation units as compared to 9% in India. Wind has
claimed a visible share of installed capacity in both countries with 8% in China (larger than the share of
gas) and 7% in India. Solar has also been growing and, in 2015, accounted for 3% of installed capacity in
China and 2% in India. Nuclear represents 2% in each country. There currently is overcapacity in Chinese
power generation: the utilization rates of all types of generating capacity (thermal, hydro, wind, nuclear)
declined in 2014.172 Coal-fired power plants are estimated to have generated 77% of electricity in India
and 71% in China. Gas-fired generation accounted for 2% and 5% of total generation in China and India,
respectively, underlining the low utilization of gas plants. Gas-fired generation has been used primarily
for peaking in both countries resulting in low capacity factors. Up to 2016, the situation in India has
been exacerbated by lack of affordable gas supplies. Power generation gas use accounted for 14% (27
BCM) and 23% (11 BCM) of total gas use in 2014 in China and India, respectively. It is the third largest
gas consuming sector in China after residential/commercial gas use which was 18% of total gas use in
2014. It is the second largest gas consuming sector in India after the industrial sector (52% in 2014).
Figure 33. Installed Generation Capacity in China and India, 2015
Source: Energy Information Administration, International Energy Outlook 2016
170 There is significant captive generation capacity in India, which also depends on coal primarily but also has a larger use of natural gas. See Considerations for Gas Use in Power Generation in India for further details on the potential significance of this captive sector. 171 Unlike China, India’s coal-fired generation fleet is not of advanced design: 85% use subcritical technology and their efficiency of 35% is below that of China according to IEA (2015). Their poor efficiency is exacerbated by high ash content coal and high ambient temperatures. 172 Moody’s, Inside China, 2/1/16.
60%
4%
1%
22%
2%
8%
3% 1%
China - 1,418 GW
Coal Gas Oil Hydro Nuclear Wind Solar Other Renewables
60%
9%
3%
16%
2%
7%2%1%
India - 302 GW
Coal Gas Oil Hydro Nuclear Wind Solar Other Renewables
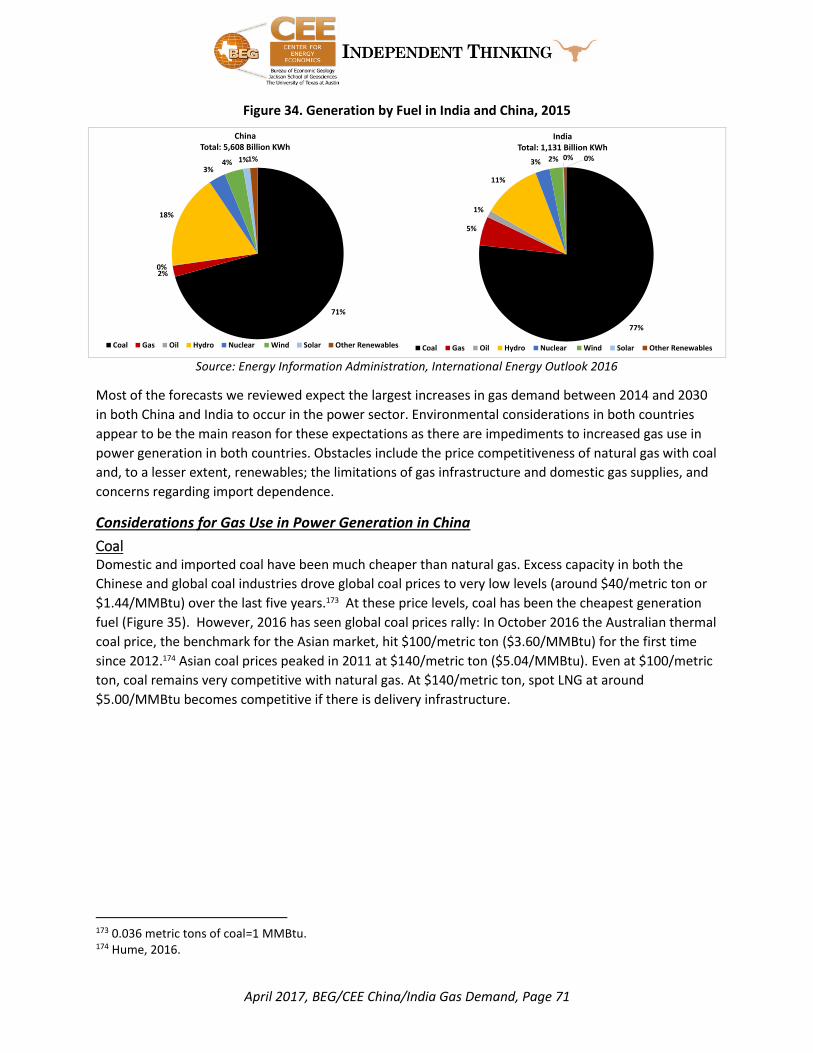
April 2017, BEG/CEE China/India Gas Demand, Page 71
Figure 34. Generation by Fuel in India and China, 2015
Source: Energy Information Administration, International Energy Outlook 2016
Most of the forecasts we reviewed expect the largest increases in gas demand between 2014 and 2030
in both China and India to occur in the power sector. Environmental considerations in both countries
appear to be the main reason for these expectations as there are impediments to increased gas use in
power generation in both countries. Obstacles include the price competitiveness of natural gas with coal
and, to a lesser extent, renewables; the limitations of gas infrastructure and domestic gas supplies, and
concerns regarding import dependence.
Considerations for Gas Use in Power Generation in China
Coal Domestic and imported coal have been much cheaper than natural gas. Excess capacity in both the
Chinese and global coal industries drove global coal prices to very low levels (around $40/metric ton or
$1.44/MMBtu) over the last five years.173 At these price levels, coal has been the cheapest generation
fuel (Figure 35). However, 2016 has seen global coal prices rally: In October 2016 the Australian thermal
coal price, the benchmark for the Asian market, hit $100/metric ton ($3.60/MMBtu) for the first time
since 2012.174 Asian coal prices peaked in 2011 at $140/metric ton ($5.04/MMBtu). Even at $100/metric
ton, coal remains very competitive with natural gas. At $140/metric ton, spot LNG at around
$5.00/MMBtu becomes competitive if there is delivery infrastructure.
173 0.036 metric tons of coal=1 MMBtu. 174 Hume, 2016.
71%
2%0%
18%
3%4% 1%1%
China Total: 5,608 Billion KWh
Coal Gas Oil Hydro Nuclear Wind Solar Other Renewables
77%
5%
1%
11%
3% 2% 0% 0%
IndiaTotal: 1,131 Billion KWh
Coal Gas Oil Hydro Nuclear Wind Solar Other Renewables

April 2017, BEG/CEE China/India Gas Demand, Page 72
Figure 35. Prices of Alternative Fuels in Power Generation
Source: Zero Hedge, JP Morgan 16.
The price rally has been attributed to China’s effort to reduce the number of smaller high-cost coal
mines by putting new coal production caps in place in April 2016. However, China’s coal demand
continued to rise spurred by 2016 government economic stimulus measures undertaken to increase
industrial activity.175 China’s 2Q 2016 domestic coal production decline of 14% was offset by a 17%
increase in imports.176 China has started to loosen the caps on domestic coal production but it has had
little impact to date on a market depleted of supply after years of low prices.177
Longer term China’s efforts to limit new coal-fueled plants and India’s efforts to increase domestic coal
production are expected to act as a check on global coal price increases. BMI Research expects China’s
domestic coal production to resume growth in 2018 after the significant cuts in 2016 eliminate higher
cost producers and coal demand to decrease in 2017 without further economic stimulus measures.178
Some forecasters like Goldman Sachs think that there is little possibility of a rebound in global coal
prices coal prices long-term due to a decline in long-term demand that “appears to be irreversible.”179 In
a forecast released in October 2016 the World Bank predicted that Australian coal prices would rise to
$60/metric ton ($2.16/MMBtu) in 2025, averaging $57.44/metric ton ($2.07/MMBtu) over the period
2017-2025.180
China’s intentions regarding construction of new coal-fired power plants are unclear. In 2015 permits for
155 new coal-fired power projects were issued after approval authority for power plants was
transferred to the provinces (Lelyveld, 2016a). Provinces granted permits seeking construction jobs and
expanded tax bases. In April 2016, the NDRC told the provinces to halt plans for 200 new coal-fired
plants until after 2017 (those seeking approval and those approved but not yet under construction) and
175Goodwill, 2016. 176 Strumpf, 2016. 177 Hume, op.cit. 178 Goodwill, op.cit. 179 Cunningham, 2016. 180 World Bank Commodities Price Forecast (nominal US dollars), 2016, October 19, http://pubdocs.worldbank.org/en/229461476804662086/CMO-October-2016-Forecasts.pdf.

April 2017, BEG/CEE China/India Gas Demand, Page 73
called for accelerated closing of older, dirtier plants.181 However, the NDRC did not stop 190 GW of new
coal-fired power plants under construction.182 (Greenpeace alleges that 400 GW of new coal plants are
in the pipeline.)183Most of the new coal plant construction is being undertaken by the large state-owned
generators incentivized by regulated end-use electricity prices that have not fallen in tandem with fuel
price decreases.184 Wind power operators complain of worsening curtailment of their generation due to
lack of transmission grid access as the state-owned grid operators favor the projects of the state-owned
generators.185
China also is upgrading its coal-fired generation fleet to improve efficiency and address air quality issues.
At least nine large-scale, supercritical coal power bases of advanced design are being developed in
western China along with the construction of twelve or more new ultra-high voltage transmission lines
from west to east.186 According to the IEA WEO 2015, 39% of China’s coal capacity was considered of
supercritical and advanced design compared to 36% in the OECD and 35% worldwide in 2014. In the
early 2000s most of China’s coal plant additions were of subcritical design but in 2014 China built 85% of
the new ultra-supercritical plants added worldwide. By building numerous advanced coal plants and
retiring older subcritical plants, China increased its coal fleet efficiency by six percentage points in just
ten years.187 China’s average coal-fired plant efficiency is equal to that in OECD countries. The March
2016 13th Five Year Plan calls for any new coal-fired power plants to be “ultra-low emissions” with the
goal of making the new plants “as clean as natural gas plants.”188
The government has been directing the replacement of coal-fired boilers in the north with gas-fired
combined heat and power (CHP) plants, particularly in the Beijing-Hebei-Tianjin areas which are heavily
polluted. These conversions have been largely completed. Paltsev and Zhang (2015) estimated that CHP
plants in the Beijing area were losing money on generated power before local government subsidies.
Nevertheless, the 13th Five Year Plan calls for the replacement of coal in non-power sectors either with
electricity or natural gas.189 (As noted previously, a services-led economy is more electricity intensive
than fossil fuels intensive).
Nuclear There were 24 nuclear reactors under construction as of mid-2015 and 31 reactors are operational
according to the International Atomic Energy Agency. China has also developed a capacity in
manufacturing and operations in the nuclear industry that is respected internationally. In its 2016
Outlook for Energy, ExxonMobil expects global demand for nuclear energy to more than double from
2014 to 2040 with China accounting for almost half of this growth. With respect to technological
capacity, China is exporting nuclear reactors, power generation units and ultra-high voltage power grids.
It added nuclear construction services to the list with China General Nuclear Power’s participation in the
181 Forsythe, 2016. 182 Ibid. 183 Wong, 2016. 184 Forsythe, M., 2016, April 25, op. cit. 185 Wong, op. cit. 186 Liu, Z., 2013, Electric power and energy in China, John Wiley & Sons, Singapore. 187 IEA WEO15. 188 Seligsohn and Hsu, 2016. 189 Ibid.

April 2017, BEG/CEE China/India Gas Demand, Page 74
EDF-led troubled Hinkley Point power project in England.190 There are specific provisions in the 13th Five
Year Plan to upgrade China’s nuclear safety apparatus.191
Renewables Renewable fuels for power generation, especially wind and solar, have been making inroads supported
by government policies. Non-hydro renewable generation doubled its share of total electric generation
from 2.2% in 2011 to 4.8% in 2015. By comparison, gas-fired generation was 1.7% of total electric
generation in 2015. Hydroelectric generation is very significant when rainfall is adequate and accounted
for 19% of total electric generation in 2015. Hydro’s share of primary energy consumption grew from 5%
in 2005 to 8% in 2015 with Three Gorges commissioned, making China the world’s largest producer of
hydroelectricity. China increased its use of non-fossil fuels from 9.4% of primary energy consumption in
2010 to 12% in 2015.192 The installed capacity of total renewables grew at an average annual rate of
13% between 2010 and 2015 and were responsible for 24% of total power generation in 2015. Wind
power has dominated China’s non-hydro renewables mix due to its historical cost-advantage over solar
power.193 China now accounts for about one-third of the world’s installed wind capacity and is the
world’s leading manufacturer of wind turbines. China’s wind energy consumption grew from 1.9 TWh in
2005 to 185.1 TWh in 2015 (BP, 2016). China also has a significant solar manufacturing industry which
has vast overcapacity. As a result, “widespread access to cheap components” has lowered costs for solar
power developers.194
Table 12. Renewables Electric Generating Capacity GW
GW 2013 (WEO 15) 2014e (BMI) 2015e (BMI)
Total Non-Hydro Renewables 104.0 158.0 206.0
Bioenergy 9.0 10.0 11.0
Wind 78.0 115.0 145.0195
Solar 17.0 33.0 49.0
Total Electric System Capacity 1,286.0 1,385.0 1,497.0
Total Non-Hydro Renewables % Total 8.1 11.4 13.6
Bioenergy % 0.7 0.7 0.7
Wind % 6.1 8.3 9.7
Solar % 1.3 2.4 3.3 Sources: IEA WEO15, BMI China Renewables Report Q3 2016
190 Burke, 2016. EDF made its final investment decision on July 28, 2016. However, the same day, in a surprise announcement, the UK announced it wanted additional time to review the David Cameron-approved deal and would make its decision in the early autumn. Prime Minister May, among others, has doubts about the project’s viability. The project has many “non-Chinese” issues, including an electric consumer funded subsidy of 37 billion pounds over 35 years, the troubled EDF design, repeated delays and rising costs. Speculation about political security concerns also surround CGNP’s future construction of a reactor in Bradwell, Essex: “Accepting Chinese money is one thing, letting a Chinese company closely tied to the military know enough about your grid software to connect its reactor to the grid is another.” As of October, 2016, the project appears to be going forward. 191 Seligsohn and Hsu, 2016, March 10, op.cit. 192 BMI Research, 2016, Q3, China Renewables Report. 193 Ibid. 194 Ibid. 195 Enerdata, 2016, reported wind capacity of 136 GW as of 5/31/16, an increase of 32% year over year.
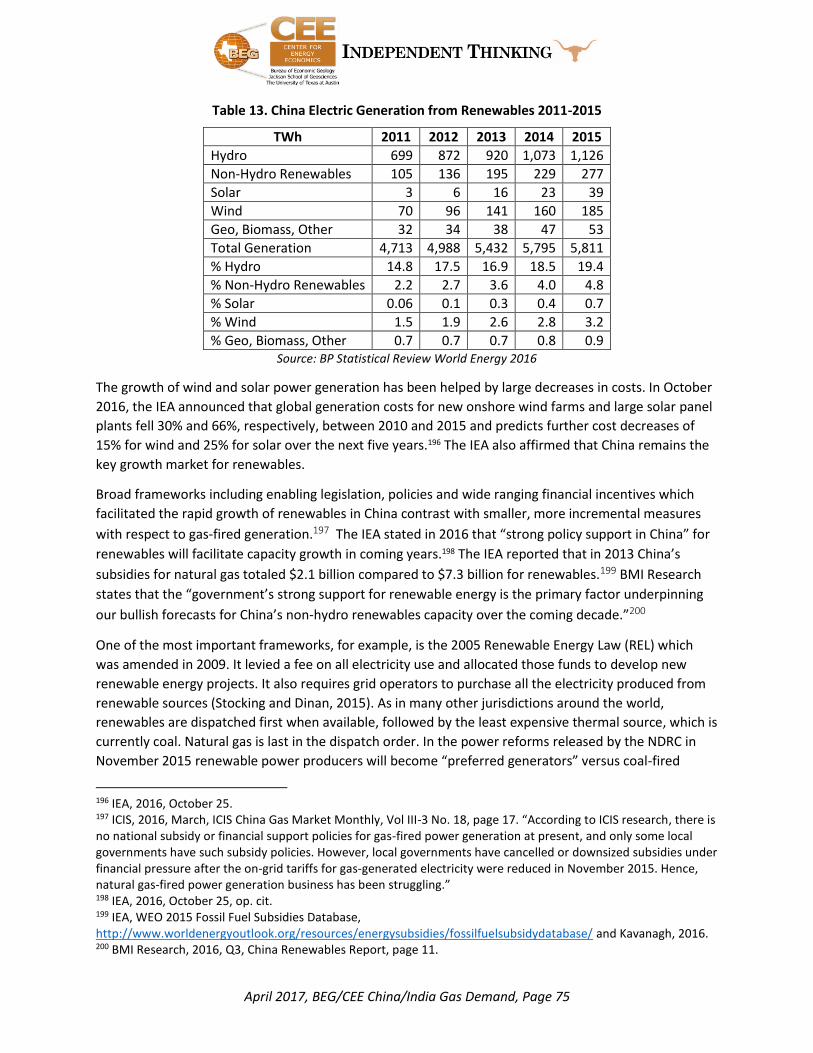
April 2017, BEG/CEE China/India Gas Demand, Page 75
Table 13. China Electric Generation from Renewables 2011-2015
TWh 2011 2012 2013 2014 2015
Hydro 699 872 920 1,073 1,126
Non-Hydro Renewables 105 136 195 229 277
Solar 3 6 16 23 39
Wind 70 96 141 160 185
Geo, Biomass, Other 32 34 38 47 53
Total Generation 4,713 4,988 5,432 5,795 5,811
% Hydro 14.8 17.5 16.9 18.5 19.4
% Non-Hydro Renewables 2.2 2.7 3.6 4.0 4.8
% Solar 0.06 0.1 0.3 0.4 0.7
% Wind 1.5 1.9 2.6 2.8 3.2
% Geo, Biomass, Other 0.7 0.7 0.7 0.8 0.9 Source: BP Statistical Review World Energy 2016
The growth of wind and solar power generation has been helped by large decreases in costs. In October
2016, the IEA announced that global generation costs for new onshore wind farms and large solar panel
plants fell 30% and 66%, respectively, between 2010 and 2015 and predicts further cost decreases of
15% for wind and 25% for solar over the next five years.196 The IEA also affirmed that China remains the
key growth market for renewables.
Broad frameworks including enabling legislation, policies and wide ranging financial incentives which
facilitated the rapid growth of renewables in China contrast with smaller, more incremental measures
with respect to gas-fired generation.197 The IEA stated in 2016 that “strong policy support in China” for
renewables will facilitate capacity growth in coming years.198 The IEA reported that in 2013 China’s
subsidies for natural gas totaled $2.1 billion compared to $7.3 billion for renewables.199 BMI Research
states that the “government’s strong support for renewable energy is the primary factor underpinning
our bullish forecasts for China’s non-hydro renewables capacity over the coming decade.”200
One of the most important frameworks, for example, is the 2005 Renewable Energy Law (REL) which
was amended in 2009. It levied a fee on all electricity use and allocated those funds to develop new
renewable energy projects. It also requires grid operators to purchase all the electricity produced from
renewable sources (Stocking and Dinan, 2015). As in many other jurisdictions around the world,
renewables are dispatched first when available, followed by the least expensive thermal source, which is
currently coal. Natural gas is last in the dispatch order. In the power reforms released by the NDRC in
November 2015 renewable power producers will become “preferred generators” versus coal-fired
196 IEA, 2016, October 25. 197 ICIS, 2016, March, ICIS China Gas Market Monthly, Vol III-3 No. 18, page 17. “According to ICIS research, there is no national subsidy or financial support policies for gas-fired power generation at present, and only some local governments have such subsidy policies. However, local governments have cancelled or downsized subsidies under financial pressure after the on-grid tariffs for gas-generated electricity were reduced in November 2015. Hence, natural gas-fired power generation business has been struggling.” 198 IEA, 2016, October 25, op. cit. 199 IEA, WEO 2015 Fossil Fuel Subsidies Database, http://www.worldenergyoutlook.org/resources/energysubsidies/fossilfuelsubsidydatabase/ and Kavanagh, 2016. 200 BMI Research, 2016, Q3, China Renewables Report, page 11.

April 2017, BEG/CEE China/India Gas Demand, Page 76
plants in proposed electricity trading markets and small-scale solar and wind producers will have
guarantees that distribution companies will buy their power.201
There are some potentially significant problems associated with China’s rapid renewables expansion.
Locations with the highest wind power output are mostly in remote western and northern regions
whereas the demand centers are in the east. As a result, significant electric transmission and
distribution network investment is required. However, actual investment in the electric grid
infrastructure has not been sufficient to accommodate all the added wind and, in some cases, solar,
capacity. Idling of wind and solar generation due to grid infrastructure issues has been increasing and in
the case of wind, idled capacity reached 15% in 2015, a 69% increase from 2014.202 In mid-2016, the
National Energy Administration (NEA) estimated that an average of 26% of total wind power generation
in China is “wasted” due to limited grid connectivity.203In 2016 the NDRC implemented regulations for
grid operators in 11 regions where idling has been frequent requiring them to have guaranteed
utilization hours for wind and solar power. It is not clear if the guaranteed hours can be accommodated
without additional grid investment. In July, 2016 the National Energy Administration (NEA) announced a
new risk alerting system to limit or prohibit construction of new onshore wind capacity in regions where
insufficient transmission capacity leads to a “waste of generated power.” Green, orange and red regions
will be designated on a yearly basis. New onshore wind capacity will not be allowed in red regions.204
Wasted wind power generation reaches 33% and almost 50% of total wind generation in some northern
and western provinces.205
Reluctance to increase China’s electricity costs is another emerging issue. The subsidies for renewable
energy are presumably funded by a surcharge to the electric ratepayers. However, the electric bill
surcharge has been too low to cover the subsidies. Power tariffs have been increased moderately in the
last several years, but apparently not enough to cover the full cost of the subsidies. Local governments
control end-user power tariffs and historically have been very reluctant to increase rates. As a result, it is
estimated that about $5-$6 billion in unpaid subsidies is owed by the government to renewables
developers.206 This situation is having a negative impact on the investment sentiment of project
developers. In addition, feed-in tariffs for onshore wind and photovoltaic solar were reduced in early
2016 and further reductions are expected for onshore wind in 2017 and 2018.207 The feed-in tariff
reduction presumably reflects the falling costs of manufacturing wind turbines and solar panels and
related equipment. It would not have a negative impact on project profitability if the other subsidies
were paid in full.208
201 Aizhu and Rose, 11/30/15. 202 BMI Research, 2016, Q3, China Renewables Report. 203 Enerdata, 2016. 204 Energy Insights, 2016, August 1. 205 Op.cit., Enerdata, 2016, July 25. 206 BMI Research, 2016, Q3, China Renewables Report. Estimates of the National Center for Climate Change Strategy and International Cooperation. 207 Chinese European Energy News, 2016, 11/1. 208 Moody’s, 2016a. The expansion of renewables have been fueled by large subsidies.
April 2017, BEG/CEE China/India Gas Demand, Page 77
Environmental Policies China does have policies to increase the share of non-fossil fuels in primary energy consumption to 15%
by 2020 and 20% by 2030 and to limit the share of coal to less than 62% of primary energy consumption
by 2020.209 China also submitted an Intended Nationally Determined Contribution (INDC) as part of the
21st Conference of the Parties to the United Nations Framework Convention on Climate Change (COP 21)
in 2015. The INDC is not legally binding; it is a statement of national intention but includes the following
targets: peaking of CO2 emissions at around 2030 and making best efforts to peak even earlier. Peaking
in 2030 would entail lowering emissions per unit of GDP 60-65% from the 2005 level.
According to Kossoy et al. (2015), China has said that a carbon emissions trading scheme (ETS) is
necessary for the achievement of their INDC commitment. In 2013-2014 China initiated pilot ETSs in
seven regions: Beijing, Guangdong, Shanghai, Shenzhen, Tiajin, Chongqing and Hubei. In 2015 China
focused on extending the ETS programs beyond the seven regions. The country plans to launch a
nationwide ETS possibly by the end of 2016 and to fully implement it by 2019. The nationwide system
would target carbon emissions reductions in the power, iron and steel, chemicals, building materials,
cement, paper and nonferrous metals industries.210 However, some officials think that the timetable for
a nationwide system is too aggressive and that the country should carry on with some expanded pilots
for the rest of the decade (Reklev, 2015). Market participants are unhappy with over-allocation, price
volatility, low liquidity and a “near complete lack of transparency” in the pilot ETS programs.
Kossoy et al. (2015), among others, report that an average carbon price of between US$80/tCO2e and
US$120/tCO2e by 2030 is consistent with the goal of limiting global warming to two degrees Celsius.
China’s national carbon prices in 2017 and 2020 are expected to be in the range of US$6/tCO2e and
US$9/tCO2e, respectively. The cost of carbon in China would have to increase by at least ten-fold from
present levels if one follows the above guidelines to achieve the country’s INDC.
In the end, however, our view is that for gas to be competitive in the Chinese power sector, attractive
pricing (market based and demand sensitive) and deliverability (supply and enabling infrastructure
including storage) will be more important than environmental policy. If gas cannot be competitive in
terms of fundamentals, environmental policies are likely to foster growth of alternative fuels and
technologies.
Conclusions on Chinese Power Sector Gas Use
All the forecasts we reviewed predict significant growth in electricity demand as the economy continues
to expand, albeit at a lower rate, and becomes more services-oriented and electricity intensive. All the
forecasts expect the largest increases in China’s gas demand between 2014 and 2030 to come from the
power sector. Near term, ICIS expects power sector gas demand to increase by 35 BCM (30%) by 2020. (
Table 14; also see discussion in APPENDIX 2).
209 IEA Energy and Climate, June 2015. 210 Davies and Westgate, 2016, May 4.
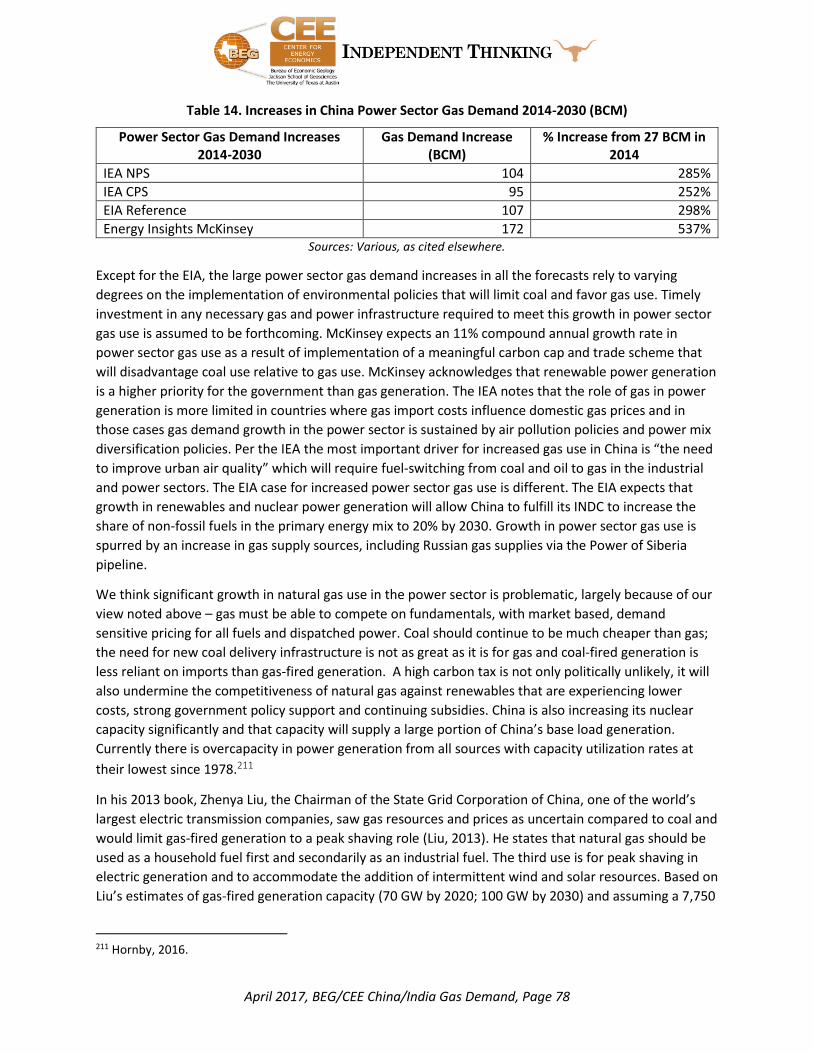
April 2017, BEG/CEE China/India Gas Demand, Page 78
Table 14. Increases in China Power Sector Gas Demand 2014-2030 (BCM)
Power Sector Gas Demand Increases 2014-2030
Gas Demand Increase (BCM)
% Increase from 27 BCM in 2014
IEA NPS 104 285%
IEA CPS 95 252%
EIA Reference 107 298%
Energy Insights McKinsey 172 537% Sources: Various, as cited elsewhere.
Except for the EIA, the large power sector gas demand increases in all the forecasts rely to varying
degrees on the implementation of environmental policies that will limit coal and favor gas use. Timely
investment in any necessary gas and power infrastructure required to meet this growth in power sector
gas use is assumed to be forthcoming. McKinsey expects an 11% compound annual growth rate in
power sector gas use as a result of implementation of a meaningful carbon cap and trade scheme that
will disadvantage coal use relative to gas use. McKinsey acknowledges that renewable power generation
is a higher priority for the government than gas generation. The IEA notes that the role of gas in power
generation is more limited in countries where gas import costs influence domestic gas prices and in
those cases gas demand growth in the power sector is sustained by air pollution policies and power mix
diversification policies. Per the IEA the most important driver for increased gas use in China is “the need
to improve urban air quality” which will require fuel-switching from coal and oil to gas in the industrial
and power sectors. The EIA case for increased power sector gas use is different. The EIA expects that
growth in renewables and nuclear power generation will allow China to fulfill its INDC to increase the
share of non-fossil fuels in the primary energy mix to 20% by 2030. Growth in power sector gas use is
spurred by an increase in gas supply sources, including Russian gas supplies via the Power of Siberia
pipeline.
We think significant growth in natural gas use in the power sector is problematic, largely because of our
view noted above – gas must be able to compete on fundamentals, with market based, demand
sensitive pricing for all fuels and dispatched power. Coal should continue to be much cheaper than gas;
the need for new coal delivery infrastructure is not as great as it is for gas and coal-fired generation is
less reliant on imports than gas-fired generation. A high carbon tax is not only politically unlikely, it will
also undermine the competitiveness of natural gas against renewables that are experiencing lower
costs, strong government policy support and continuing subsidies. China is also increasing its nuclear
capacity significantly and that capacity will supply a large portion of China’s base load generation.
Currently there is overcapacity in power generation from all sources with capacity utilization rates at
their lowest since 1978.211
In his 2013 book, Zhenya Liu, the Chairman of the State Grid Corporation of China, one of the world’s
largest electric transmission companies, saw gas resources and prices as uncertain compared to coal and
would limit gas-fired generation to a peak shaving role (Liu, 2013). He states that natural gas should be
used as a household fuel first and secondarily as an industrial fuel. The third use is for peak shaving in
electric generation and to accommodate the addition of intermittent wind and solar resources. Based on
Liu’s estimates of gas-fired generation capacity (70 GW by 2020; 100 GW by 2030) and assuming a 7,750
211 Hornby, 2016.

April 2017, BEG/CEE China/India Gas Demand, Page 79
Btu/kWh heat rate212 and a 25% capacity factor increasing to 30% in 2025, the “peaking use” natural gas
demand would be lower than that of IEA and EIA (Figure 36).
Figure 36. Power Sector Gas Use Scenarios in China
Source: Energy Information Administration International Energy Outlook 2016 (EIA); International Energy Agency
World Energy Outlook 2015 New Policies scenario (IEA NP). Peaking Use reflects the CEE scenario
The EIA also estimates 74 GW of gas-fired capacity in 2020. With our heat rate assumption, the capacity
factor should be at least 40%, much higher than the recent average of about 30%. For 2030 the EIA
estimate of installed gas-fired capacity is much higher at 124 GW, much higher. A capacity factor of at
least 57% is necessary to burn 4,838 trillion Btus of gas. If the fleet were to be more efficient in 2030
(e.g., a lower heat rate of 7,000), the capacity factor would have to reach 63%. The IEA anticipates 110
GW in 2020 and 170 GW in 2030, significantly larger estimates than both Liu (2013) and EIA. As such,
capacity factors do not have to be as high as those implied by the EIA numbers: about 38% in 2020 and
45% in 2030 would suffice with a heat rate of 7,750. The comparison of forecasts and CEE peaking use
scenario (using the capacity estimates of Liu, 2013) demonstrates the wide discrepancies that exist
across expectations regarding installed capacity of gas-fired generation and their capacity factors.
China’s modern gas-fired power fleet has been utilized mostly for load-following and peaking purposes,
leading to a nationwide average of about 30%. Whether more plants will (or, should) be built while
existing plants are not fully utilized is a valid question to ask. Whether the utilization rates can be
212 This heat rate is less efficient than the average for a modern combined cycle fleet (6,000 to 6,500) but more efficient than most peaking units (9,000 to 10,000). Heat rates will decline if the units are not utilized at high capacity factors and/or owing to hot and humid ambient conditions. As such, this number should be considered a rough average.
1,178
1,7142,0352,012
3,881
4,838
2,581
3,692
4,685
0
1,000
2,000
3,000
4,000
5,000
6,000
2020 2025 2030
Trill
ion
Btu
Peaking Use EIA IEA NP

April 2017, BEG/CEE China/India Gas Demand, Page 80
increased with persistent and, in some cases, growing competition from coal, nuclear and renewables is
also worth questioning.
Considerations for Gas Use in Power Generation in India
Coal Like China, India’s abundant coal resources offer supply security and low costs if they can be managed
properly. The share of imports in total coal consumption in India climbed to almost 26% in 2014 from 7-
8% in the mid-2000s. India is planning to increase its coal production from 603 million tonnes in 2013 to
1.5 billion tonnes by 2020 (Figure 37) in order to decrease reliance on more expensive imported coal.
The plan also calls for increasing the role of the private sector and public sector producers other than
the Coal India Limited, which accounted for about three quarters of production in the past. The target
for 2020 is for reducing the share of Coal India Limited to about 60-65%.
Figure 37. Coal Production, Consumption and Targets in India
Source: EIA which used Energy Statistics 2015 by Government of India, Ministry of Statistics and Programme Implementation; Provisional Coal Statistics 2013-14 by Government of India, Ministry of Coal; and news reports.
These targets represent a very ambitious plan for an industry that has been plagued by production
shortfalls for many years and whose state-owned companies and labor unions oppose competition.
Nevertheless, the government has reformed coal block allocation213 and mine licensing procedures;
213 Coal block allocation refers to the process by which the Indian government allocates coal mines to private and government companies. Prior to March 2015, private companies could have coal mines only for “captive use.” Allowed end uses include iron and steel production, power generation, cement production and coal washing. Prior to the enactment of the Coal Mines (Special Provisions) Bill in March, 2015 (CMB15), the Ministry of Coal (MOC) designated a Screening Committee (SC) to provide recommendations on allocations for captive coal mines. The SC made all captive mine allocations to private companies. All other mine allocations to government companies were made by the MOC. Between 1993 and 2011, 218 coal blocks were allocated to private and government companies under this process. In September 2014, the Indian Supreme Court declared the allocations of 204 of the 218 coal mines illegal as they were arbitrary and not based on objective criteria. The CMB15 established an auction process to allocate the 204 coal mines declared illegal as well as other producing and captive coal mines. 74 mines with a specified end-use (captive) were publicly auctioned pursuant to CMB15 by March 31, 2015. The 204 illegal mines as well as future mines can be government allocated to any company awarded a power plant project through competitive bidding or publicly auctioned to any government, private or JV company and the public auction

April 2017, BEG/CEE China/India Gas Demand, Page 81
expanded the scope of private sector participation in the state-dominated sector and accelerated key
rail transportation projects.214
India’s relatively young coal-fired power plant fleet (around 50% of the plants are ten years old or less
according to IEA, 2015) will remain the backbone of the baseload power generation system. 85% of
today’s coal fleet are based on subcritical boiler technology according to the IEA. India may retire
inefficient plants early and replace them with larger supercritical plants. New coal-fired power plants are
expected to use supercritical technology and the Indian government may make that a mandatory
requirement.
Environmental Policies Similar to China, India’s environmental policies affecting the power sector are heavily tilted to the
development of non-fossil fuel renewables, especially solar and wind, and development of advanced
design coal-fired plants for baseload power. India’s intended nationally determined contribution (INDC)
to reducing global carbon emissions includes increasing solar power capacity from 5 MW in January
2016 to 100 GW; more than doubling wind power capacity to 60 GW; and increasing nuclear power
capacity from 6 GW to 63 GW, all by 2022. Non-fossil fuel power generation capacity will be at least 40%
by 2030.
There are many significant challenges to implementing this plan but this is India’s current path
(CarbonBrief, 2015). Although not explicitly stated, it appears that natural gas’ role will be of a balancing
nature, essential but limited (e.g., daily load following and peaking, accommodating the addition of
intermittent renewables). The price tag for this INDC is very high at an estimated $2.5 trillion and India
says it will need low cost international financial assistance to meet its targets. It is not clear how much
India itself is planning to contribute to the investment and how much of the INDC is conditional upon
financial aid. This is not a minor issue as raising large sums of investment capital in India is fraught with
difficulties. In addition, there are issues related to land acquisition, renewable purchase obligations, and
timeliness of implementation and transmission grid expansion, to name a few. There has not been
mention of the imposition of significant carbon taxes that would disadvantage coal relative to natural
gas. There is currently a tax on coal that partially flows into the National Clean Energy Fund; in the 2016-
17 budget, the tax was raised from $3/tonne to $6/tonne.215
System Reliability and Captive Power India has had peak day power deficits every year since 2009 and this has led to the rise of captive
generation plants. These captive plants are owned by industries that want to protect themselves from
power supply shortages. Their generation was equivalent to about 13% of total generation for the fiscal
year that ended on 3/31/13.
Although dominated by coal-fired generation, captive plants had a larger percentage of gas-fired
generation (16%) than the electric utilities (7% in the year ended 3/31/13). The captive plants tend to be
winners can use the coal for any purpose. The goal of CMB15 is to ensure an equitable and transparent distribution of coal mines and to create a fair, level playing field for them. Another goal is to enable private companies to mine coal for any purpose in order to improve the coal supply in the market. PRS Legislative Research, 2015, March 7, Coal Block Allocations and the 2015 Bill, http://www.prsindia.org/theprsblog/?p=3487. 214 March 2015 Coal Mines Special Provision Bill. EIA 8/25/15. 215 Garg, 2016.

April 2017, BEG/CEE China/India Gas Demand, Page 82
inefficient and under-utilized and those that are coal-fired often worsen local air pollution. Industries
such as steel, cement, chemicals, sugar, fertilizers and textiles are key owners of captive plants
according to IEA (2015).
Figure 38. Captive Power Plant Generation by Fuel in India (148 billion kWh), 2013
Source: Ministry of Power. Data represents industries with more than 1-MW load
Power Companies Financial Problems Thermal (coal, oil and gas) generation capacity factors have been declining since 2009 and in 2014 were
estimated to be 64% for coal-fired plants and less than 25% for gas-fired plants. Reasons for the low load
factors include fuel supply problems in both coal and gas; the overall poor financial condition of India’s
electric distribution companies (EDCs), and inadequate expansion of the electric transmission system.
India’s electric distribution companies (EDCs) have been losing money at an increasing rate since 2003 ().
Sector wide accumulated losses (negative equity on the balance sheet where annual after tax profits or
losses are recorded) in 2011 were $25 billion and $20.3 billion were EDC losses. EDC debt grew at a
CAGR of 23% in real terms 2003-2011 and represented $28 billion or 36% of total power sector debt. By
March 2015, EDC accumulated losses reached about $58 billion with debt of about $64 billion, bearing
14-15% interest rates.
78%
6%
16%
0%
Steam Diesel (Including Wind & Rlys.) Gas Hydro

April 2017, BEG/CEE China/India Gas Demand, Page 83
Figure 39. Accumulated Losses by Power Sector Segment, 2003-2011
Source: World Bank, 2014, More Power to India. Bundled includes state electricity boards and power departments.
According to the World Bank, there are three primary drivers of the EDC losses: tariff underpricing,
distribution technical and nontechnical (theft) losses, and tariff under collections. In 11 states in 2011
electricity tariffs did not cover costs, including interest, assuming “normal” distribution
technical/nontechnical losses of 10%. Average technical/nontechnical distribution losses decreased from
32% in 2003 to 21% in 2011 but remained above the international norm of 10%. The share of revenue
collected to revenue billed was 94% in 2011, up slightly from 89% in 2003.216
In late 2015, the Modi government implemented a plan to improve the operational and financial
performance of EDCs: the UDAY scheme. The scheme has four components: operational efficiency
improvements aimed at reducing technical/nontechnical losses to 15%; power cost reductions through
the increased supply of cheaper domestic coal; interest cost reductions due to the states taking over
75% of the EDCs’ debt by 2016-17 and the imposition of financial discipline by the states on the EDCs as
the states are obligated to fund 50% of future EDC losses. The goal is to achieve EDC profitability by
2018.
As of June, 2016, the Ministry of Power (MOP) reported the following progress on the UDAY scheme
(April-June 2016 compared to the same period in 2015): Average power costs paid to generators are
down 13%; technical/nontechnical losses and revenue under collections are down significantly in several
UDAY states; state assumption of EDC debt is proceeding and 15 states are now participating in the
UDAY scheme. The MOP reviews UDAY scheme progress monthly.217
Critics observe that similar schemes have failed twice in the last 15 years as “state governments gave
away electricity freebies to secure political patronage, discoms (EDCs) obediently picked up the bill on
their balance sheets, and banks subserviently financed the discoms.” The jury is still out.218
Power Sector Declining Gas Use The power sector’s natural gas demand decreased sharply in recent years. The most important driver
was the decline in production of less expensive domestic natural gas (Figure 40). As a result, the power
216 GOI, 2015, November 5, UDAY. 217 Singh, 2016. 218 Gopalakrishnan, 2016.
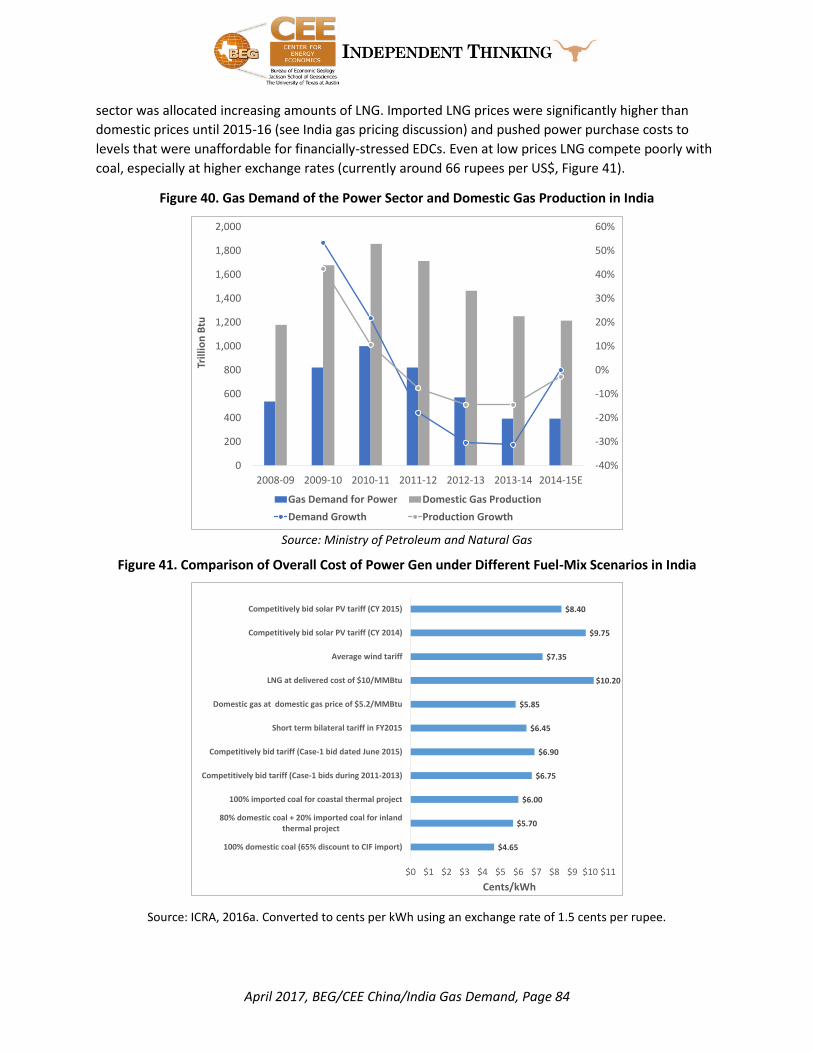
April 2017, BEG/CEE China/India Gas Demand, Page 84
sector was allocated increasing amounts of LNG. Imported LNG prices were significantly higher than
domestic prices until 2015-16 (see India gas pricing discussion) and pushed power purchase costs to
levels that were unaffordable for financially-stressed EDCs. Even at low prices LNG compete poorly with
coal, especially at higher exchange rates (currently around 66 rupees per US$, Figure 41).
Figure 40. Gas Demand of the Power Sector and Domestic Gas Production in India
Source: Ministry of Petroleum and Natural Gas
Figure 41. Comparison of Overall Cost of Power Gen under Different Fuel-Mix Scenarios in India
Source: ICRA, 2016a. Converted to cents per kWh using an exchange rate of 1.5 cents per rupee.
-40%
-30%
-20%
-10%
0%
10%
20%
30%
40%
50%
60%
0
200
400
600
800
1,000
1,200
1,400
1,600
1,800
2,000
2008-09 2009-10 2010-11 2011-12 2012-13 2013-14 2014-15E
Trill
ion
Btu
Gas Demand for Power Domestic Gas Production
Demand Growth Production Growth
$4.65
$5.70
$6.00
$6.75
$6.90
$6.45
$5.85
$10.20
$7.35
$9.75
$8.40
$0 $1 $2 $3 $4 $5 $6 $7 $8 $9 $10 $11
100% domestic coal (65% discount to CIF import)
80% domestic coal + 20% imported coal for inlandthermal project
100% imported coal for coastal thermal project
Competitively bid tariff (Case-1 bids during 2011-2013)
Competitively bid tariff (Case-1 bid dated June 2015)
Short term bilateral tariff in FY2015
Domestic gas at domestic gas price of $5.2/MMBtu
LNG at delivered cost of $10/MMBtu
Average wind tariff
Competitively bid solar PV tariff (CY 2014)
Competitively bid solar PV tariff (CY 2015)
Cents/kWh

April 2017, BEG/CEE China/India Gas Demand, Page 85
As a result, 59% of total gas-fired power capacity was completely stranded from April 2014-January 2015
(Table 15). 74% of private gas-fired capacity was stranded as compared to 35% of central government
plants and 49% of state government generators.
Table 15. Stranded and Operating Gas-Fired Power Generation Capacity in India, 4/14-1/15
Sector Central State Private Total
Stranded Capacity (MW) 1,967 2,665 9,673 14,305
Operating Capacity (MW) 3,657 2,759 3,427 9,844
Average Capacity Factor of Operating Units 35% 42% 22% 32%
Source: Ministry of Power
The Indian government funded a potential $75-billion subsidy scheme ($35 billion in FY 2016 and $40
billion in FY 2017 based on $10/MMBtu LNG) to bring gas-fired generating plants’ load factors up to 25-
30% in order to manage continuing peak day power deficits. Generators bidding the lowest needed
subsidy below a cap would be allocated LNG.
Investors in the natural gas value chain had to make sacrifices: regasification and pipeline transport
charges were reduced by 50% and marketing fees were reduced by 75%. The sales revenue from the
program could only be used for operating and maintenance costs and debt service. No return on equity
was permitted. Banks holding current and potentially non-performing loans of up to $16 billion on these
power plants were “encouraged to negotiate debt relief within Reserve Bank of India guidelines.” The
first two phases of the program allocated LNG to 42-50% of the 24 GW of under-utilized capacity.219 Due
to decreased LNG import prices, the government was able to discontinue subsidies in CY 2016.
Conclusions on Indian Power Sector Gas Use
The forecasts we reviewed project significant growth in power sector gas demand although not as large
as the projected increases in Chinese power sector demand (excluding the GOI Vision 2030). ICRA
predicts an increase in demand from 11 BCM in 2014 to 39 BCM in 2016, with demand remaining flat at
39 BCM between 2016 and 2025.
Table 16. Increases in Indian Power Sector Gas Demand, 2014-2030 (BCM)
Forecast Gas demand increase over 11 BCM in 2014
2030 demand/2014 demand of 11 BCM (%)
IEA NPS 38 344%
IEA CPS 43 391%
EIA Reference 11 104%
McKinsey 21 191%
Vision 2030 118 1073% Sources: Various, as cited elsewhere.
The IEA does not expect gas-fired generation to produce baseload power in India. Instead gas –fired
plants will perform a peaking/load balancing role which is essential in reducing the large peak day
deficits and will drive the increase in sector gas demand. Per the IEA, gas’s share of power sector energy
consumption will increase from 5% in 2013 to 9% by 2040. Coal will remain the dominant fuel in the
219 GOI, Ministry of Power, Office Memorandum No.4/2/2015-Th-I. Also Press Trust of India, 2016.

April 2017, BEG/CEE China/India Gas Demand, Page 86
power sector although its share of total fuel use drops from 79% in 2013 to 66% in 2040. Renewables’
share of total fuel use will increase from 10% in 2013 to 16% in 2040, driven by a six-fold increase in
non-hydro renewables fuel use. The share for nuclear will triple from 3% to 9%.
McKinsey expects that the Indian government will impose carbon taxes that will favor gas and allow
displacement of coal in the power sector. The EIA has a more conservative view of power sector gas
demand. In the EIA case, renewables and nuclear fuel most of total energy demand growth in the power
sector between 2012 and 2040. Gas’ share of total sector fuel use decreases slightly from 6% in 2012 to
5% in 2040 and coal’s share drops from 76% in 2012 to 56% in 2040.
If low LNG prices persist, we think power sector demand will increase enough to have adequate
utilization of existing gas-fired generation capacity. However, given the limitations of India’s gas
infrastructure natural gas is not likely to play a baseload power role in the future or increase its share in
total generation significantly. Given the uncertainties surrounding potential increases in domestic gas
production, and the inability of the sector to tolerate high LNG prices (e.g., the inability of EDCs to
charge electric rates high enough to cover costs), our outlook for power sector demand is on the low
end of the forecasts (Table 16). Solving fundamental problems of price reform and infrastructure
development could take years. It is worth noting that the EIA lowered its projections for electricity
sector gas use in India significantly from the 2013 edition of the International Energy Outlook in the
latest edition in 2016.
Table 17. Gas Consumption by Indian Electric Sector in IEO13 and IEO16 (Quad Btu)
2020 2025 2030
IEO 13 1.1 1.2 1.4
IEO 16 0.4 0.5 0.8 Source: EIA IEO 13 and IEO 14
Key developments to monitor include (1) the relative prices of LNG and coal; (2) gas infrastructure
expansion; (3) growth in domestic gas supplies (3) the implementation of the renewables program,
including the availability of financial aid; (4) domestic coal production levels and (5) the overall financial
condition of the electric distribution sector.
Residential/Commercial (Households): China
Overall household energy demand grew at an average annual rate of 7% 2005-2014. In 2005 coal
accounted for 38% of household total energy consumption dropping to 19% in 2014. In northern China
using coal to heat homes and offices is a common practice and coal demand has been remarkably
persistent at 53 BCM. Natural gas’ market share increased from 4% to 9% over the same period growing
at an average annual rate of 18% to 34 BCM in 2014 (Figure 42). In southern China the main use of gas is
for cooking, water heating and summer air conditioning; in northern China the primary gas use is for
space heating. Northern China gas demand exceeds that of the south. The residential/commercial sector
was the second largest gas consuming sector after the industrial sector in 2014.

April 2017, BEG/CEE China/India Gas Demand, Page 87
Figure 42. Household Energy Demand in China (MMTOE)
Source: NBSC
The growth in residential gas use was driven by rising urbanization, rising consumer incomes, efforts to
reduce air pollution and the cross-subsidization embedded in the gas pricing regime which keeps
residential rates low at the expense of industry, power generators and the transport sector. All of these
growth drivers are expected to stimulate sector gas demand in the future albeit at a lower rate. Urban
areas consumed 98% of household gas in 2012 and China’s urbanization rate is expected to increase
from 55% at the end of 2014 to 67% by 2030.220 Residential gas consumers have priority in the NDRC
gas allocation plan.
A plethora of city gas distribution (CGD) companies have been established, many owned or associated
with central and/or provincial government entities, which has enabled the rapid development of the
pipeline network. These companies have targeted areas which are economically more developed and
densely populated (coastal areas) as well as areas with rich reserves of natural gas (western areas).221
The sales growth of these companies has been 20%+ through 2014 although some analysts are
forecasting future growth rates in the mid to low teens.
Growth in residential/commercial sector gas use requires further expansion of gas distribution systems
as well as associated infrastructure. Twenty-two of China’s 31 regions have household gas access rates
of less than 40% resulting in great potential for further market penetration. Around 32% of medium and
large size cities in China have access to gas pipelines. Expansion of gas storage capacity will be necessary
to accommodate seasonal swings in this sector’s gas demand.
220 OIES, November 2015. 221 Fitch Ratings, 7/17/15.
0%
5%
10%
15%
20%
25%
30%
35%
40%
45%
-
2,000
4,000
6,000
8,000
10,000
12,000
14,000
16,000
2005 2006 2007 2008 2009 2010 2011 2012 2013 2014
Trill
ion
Btu
Primary Energy Use Coal Use Gas Use Gas Growth Rate %

April 2017, BEG/CEE China/India Gas Demand, Page 88
The residential sector is very price sensitive: a 1% price increase is estimated to decrease consumption
by 3%.222 Residential users were shielded from the major gas price increases in 2013 through 2015. As of
mid-2015 gas was competitive with the non-coal alternate fuels. LPG, which also competes with gas in
the residential sector, is now lower than the residential gas price on a wholesale basis although further
decreases are prevented by the price floor. The NDRC is just beginning to allocate additional costs to the
residential sector via a three-tier volume pricing scheme which, in the near term, will affect only 10% of
households. (See discussion in pricing section).
Table 18. Residential Fuel Prices, July 2015 ($/MMBtu)
Fuel Type $/MMBtu
Natural gas 11.40
Electricity 25.40
LPG 25.00
Source: S. Paltsev and D. Zhang, 2015
All the forecasts we reviewed expect residential/commercial sector gas use to triple from 34 BCM in
2014 to around 70-80 BCM in 2030. To realize this growth potential, we think that continued reform of
residential gas pricing and expansion of gas infrastructure, especially storage, are required. Absent a
carbon tax or similar economic penalties, we think it could be difficult to displace much of the persistent
53 BCM in coal use.
Key developments to monitor include: (1) the urbanization rate; (2) CGD infrastructure expansion and
sales growth; (3) NDRC efforts to increase residential gas prices and actions on the pricing of competing
fuels and (4) imposition of carbon costs on residential coal use.
Transport Sector - China
Natural gas use in the transport sector (road vehicles, railway, air and marine) represented 11% (21
BCM) of China’s total gas use. Transport sector natural gas use grew at an average annual rate of 21%
from 2005 to 2014 which outpaced the growth rates of diesel (7%), gasoline (12%) and overall primary
energy (8%). There is a structural change beginning to take place in vehicle fuel demand. Diesel’s share
of total transport energy use declined from a high of 35% in 2010 to 31% in 2014. In contrast, the shares
of gasoline and natural gas increased from 11% and 3%, respectively, in 2005 to 14% and 8%,
respectively, in 2014. The drop in diesel demand is attributed to slower economic growth, greater fuel
efficiency in heavy duty vehicles and competition from NGVs. Growth in gasoline demand is a result of
high light duty car sales. Higher priced gasoline is the main competitor to natural gas in the passenger
car market.
222 Wang, et. al., 2014.

April 2017, BEG/CEE China/India Gas Demand, Page 89
Figure 43. Natural Gas Use in China Transportation
Source: NBSC
China’s NGV (natural gas vehicle) fleet has grown from 693,000 in 2004 to about 4.5 million at the end of
2015223served by 7,000 NGV refueling stations.224 Most vehicles run on CNG (compressed natural gas).
Supported by infrastructure subsidies from the government and CGD companies, there has been rapid
growth in CNG refueling stations. 80% of the NGV fleets are in the gas abundant northwestern provinces
with 12% in the large coastal cities. There are also about 250,000 heavy duty vehicles operating on LNG
on China’s roads.225
The transport sector is the one area in which the Chinese government has actively promoted natural gas
use. The government provided the initial subsidies to build up the NGV refueling infrastructure; private
investment in the sector was given additional government support. Production of natural gas vehicles
peaked in 2013, mostly built by Chinese manufacturers. In recent years, the focus has turned to heavy
duty vehicles such as LNG-fueled trucks and CNG/LNG-fueled buses. Some companies have plans to
build more than 1000 LNG stations in the next five years.226 Some industry analysts think that increased
sales of CNG and LNG for vehicles is the primary growth driver for city gas distribution companies.227
Pricing policies have also favored natural gas. The consumption tax (CT) on diesel and gasoline has been
much higher than the CT on natural gas since 2009 in an effort to reduce air pollution. There have been
223 Stratas Advisors, 2016, March 17. 224 NGVA Europe, 7/8/15. 225 Ibid. 226 NGVA Europe, July 2015. 227 Kim Eng, 3/26/14.
0%
10%
20%
30%
40%
50%
60%
-
2,000
4,000
6,000
8,000
10,000
12,000
2005 2006 2007 2008 2009 2010 2011 2012 2013 2014
Trill
ion
Btu
Primary Energy Use Diesel Use Gasoline Use Gas Use Gas Growth Rate %

April 2017, BEG/CEE China/India Gas Demand, Page 90
reports in January 2016 that the government is planning to raise the CT on oil products again.228
Although retail prices for transport natural gas are higher than prices for any other consuming sector,
ICIS reported in March 2016 that the average CNG retail price in 25 major Chinese cities was 64% of the
average gasoline prices in those cities, from a high of 93% in southeastern Guangzhou to a low of 29% in
western Xining. ICIS noted that CNG prices remained high in cities without access to piped gas supplies
such as those in northeast China and coastal regions in south China, underlining the need for expansion
of gas distribution systems and associated infrastructure.229
Of all the natural gas demand forecasts we reviewed, McKinsey and EIA had the most aggressive
estimates of transport sector gas demand in 2030 of 63 BCM and 45 BCM, respectively, citing strong
government support for gas for environmental reasons. The EIA predicts gas use to increase
significantly in large trucks and buses.
We think that significant growth in transport sector gas use is most dependent on the capital-intensive
expansion of the refueling stations network and expansion of the piped gas distribution infrastructure.
Continuing government support; tax policies that favor gas and expansion of the gas-fueled truck and
buses fleets would help turn potential demand to realizable demand.
City Gas Distribution and the Residential and Transport Sectors: India
The city gas distribution sector (CGD) in India (which includes residential, commercial and transport
categories) was much smaller (5 BCM) in 2014 than the comparable residential/commercial (34 BCM)
and transport (21 BCM) sectors in China. This large difference in market size can be explained by the
following factors:
(1) urbanization, which facilitates development of CGD systems, is more advanced in China (55%) than
in India (30%);
(2) there is a significant residential/commercial space heating market in China that does not exist in
India;
(3) electric units dominate the growing air conditioning market in India and the smaller, seasonal water
heating market;
(4) more than 70% of Indian household energy use is for cooking and solid biomass accounts for about
85% and 25% of rural and urban cooking fuel, respectively;230
(5) in urban areas, subsidized LPG is the cooking fuel that is displacing kerosene and biomass;
(6) diesel, which was subsidized until 2014, accounted for 70% of total transport oil demand;231
(7) declining supplies of inexpensive domestic gas and high prices for imported LNG until 2015-2016;
and
(8) fragmented gas infrastructure and much less investment in CGD systems in India than China.
India’s first CGD company was established in 1972 in Gujarat state. A handful of companies were
established in the 1980s and 1990s but the real growth of CGD companies didn’t occur until post-2005.
Currently 44 cities and towns in India are covered by CGD networks232 with close to 3 million customers
228 Lelyveld, M., 1/2/16. 229 ICIS China Gas Market Monthly, China Gas Price Pool, March 2016. 230 IEA WEO 15. 231 Ibid. 232 Saikia, 4/13/15.
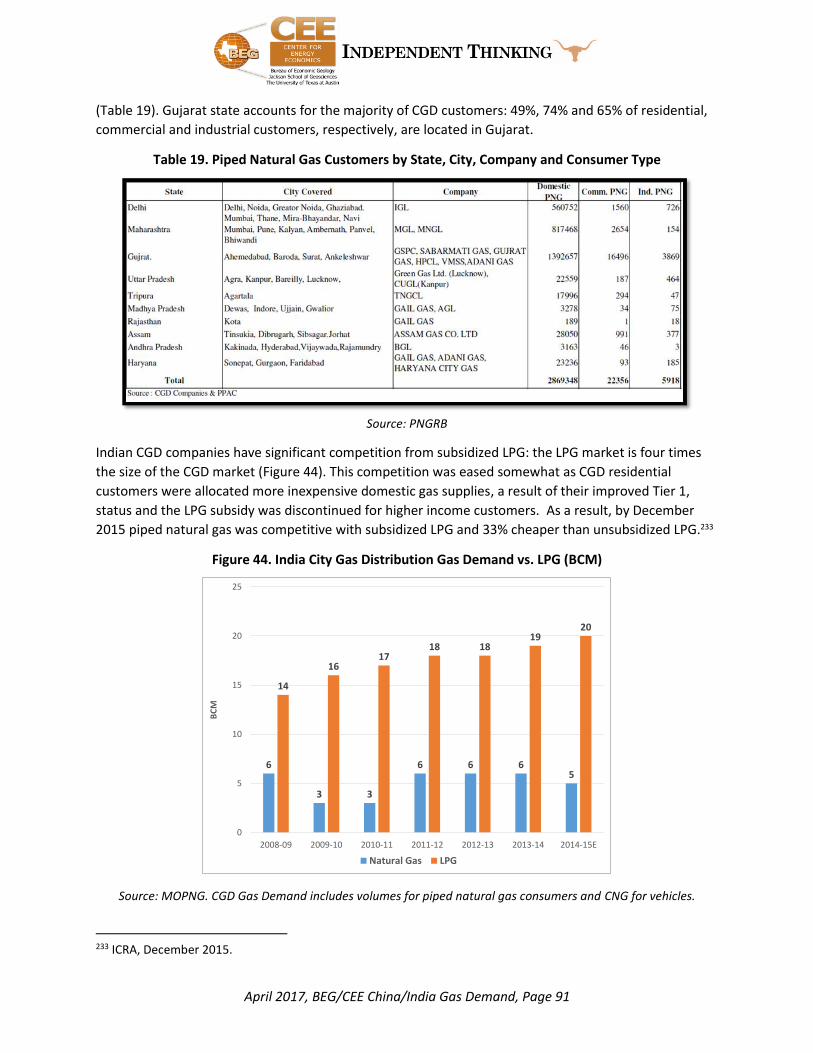
April 2017, BEG/CEE China/India Gas Demand, Page 91
(Table 19). Gujarat state accounts for the majority of CGD customers: 49%, 74% and 65% of residential,
commercial and industrial customers, respectively, are located in Gujarat.
Table 19. Piped Natural Gas Customers by State, City, Company and Consumer Type
Source: PNGRB
Indian CGD companies have significant competition from subsidized LPG: the LPG market is four times
the size of the CGD market (Figure 44). This competition was eased somewhat as CGD residential
customers were allocated more inexpensive domestic gas supplies, a result of their improved Tier 1,
status and the LPG subsidy was discontinued for higher income customers. As a result, by December
2015 piped natural gas was competitive with subsidized LPG and 33% cheaper than unsubsidized LPG.233
Figure 44. India City Gas Distribution Gas Demand vs. LPG (BCM)
Source: MOPNG. CGD Gas Demand includes volumes for piped natural gas consumers and CNG for vehicles.
233 ICRA, December 2015.
6
3 3
6 6 65
14
1617
18 1819
20
0
5
10
15
20
25
2008-09 2009-10 2010-11 2011-12 2012-13 2013-14 2014-15E
BC
M
Natural Gas LPG

April 2017, BEG/CEE China/India Gas Demand, Page 92
Geographical areas for CGD networks are auctioned by the PNGRB. There have been six rounds of
auctions. The results of the fifth round auctions conducted in early 2015 were disappointing: eight of the
20 areas received no bids and four areas received only one bid each. Interest in future CGD bidding
rounds is expected to grow as a result of the price decreases for LNG and mandatory government
decrees to convert some vehicles to natural gas (see transport sector).234
Growth in CGD networks could be constrained by overly aggressive bidding practices. ICRA has been
concerned that bidders are bidding near zero tariff rates and posting large bank-guaranteed
performance bonds that substantially exceed the net worth of the bidding entities.235 The Minimum
Work Programs (required pipeline construction and PNG connections) demanded by the PNGRB in the
early years are substantial (15% of the five year work commitment is in the first year) and slippage could
cause draws on the performance bonds. ICRA thinks that there is a high probability of delays in work
implementation due to the high amount of initial clearances and multiple approvals required from
various civic and governmental agencies. In addition, the acquisition of rights of way and rights of usage
are extremely time consuming.
India had slightly over 2.5 million CNG vehicles on the road in 2015 compared to 4.5 million in China.236
India had about 1,000 refueling stations compared to over 7,000 in China.237
Table 20. CNG Activities as of 3/31/15
Source: MOPNG
India’s CNG consumption has been growing at about 6% per year in recent years (Table 19) but needs
considerably more infrastructure for the sector to take off. The decontrol of gasoline and diesel prices
has been positive for the sector until the recent drop in those prices. The Indian Supreme Court gave the
sector a boost when in late 2015 it mandated that all Delhi taxis must convert to CNG and registration of
new diesel vehicles in the city will no longer be allowed. If similar measures are enacted in other heavily
polluted cities, it would encourage sector growth.
Of the forecasts we reviewed, McKinsey had the most aggressive outlook for gas demand in the CGD
sector with gas demand increasing from 5 BCM in 2014 to 28 BCM in 2030; their 2030 demand estimate
234 Ibid. 235 Ibid. 236 Stratas Advisors, March 17, 2016, op.cit. 237 Ibid.

April 2017, BEG/CEE China/India Gas Demand, Page 93
is close to the GOI Vision 2030 estimate of 31 BCM. McKinsey expects most of the demand growth to
occur in the residential/commercial sector (23 of the 28 BCM) as a result of favorable government
reforms which prioritize household gas consumption over gas use in other sectors. Per McKinsey,
growth in transport sector gas demand is constrained by severe competition from lower price oil
products. The EIA forecasts 25 BCM of CGD gas use in 2030 but, unlike McKinsey, most of the growth
occurs in the transport sector which accounts for 17 BCM of the 25 BCM. The IEA expects more modest
growth in CGD gas demand with gas use increasing to 11 BCM in 2030, with 7 BCM in the
residential/commercial sector. The IEA expects diesel to continue dominating transport sector fuel use
and residential/commercial gas demand growth to be tempered by competition from alternatives.
We think the largest impediments to robust CGD gas demand growth are:
(1) the large capital requirements to expand an infrastructure that is considerably less developed than
China’s;
(2) the dominant role of electricity in the growing air conditioning market; and
(3) the difficulty of displacing biomass for cooking in rural areas.
Key developments to monitor going forward include:
(1) the growth of CGD infrastructure;
(2) the expansion of the refueling station network for both CNG and LNG;
(3) the availability of affordable natural gas supplies; and
(4) government subsidy policies for alternative fuels.
NATURAL GAS AND ENERGY SECURITY
There are a number of security issues affecting the natural gas systems in both China and India including
security of affordable gas supplies; security of international gas shipping and pipeline transportation
routes; the security and adequacy of domestic gas system infrastructure and the ability of the natural
gas system to accommodate demand fluctuations.
As both countries are importers of significant natural gas volumes, international gas supply and
transportation security are important concerns. The current gas import infrastructures of both countries
(pipeline and LND) are shown in APPENDIX 1 - MAPS and Table 21 below. Both countries have
attempted to address these security issues, with varying degrees of success, by increasing domestic gas
production; expanding and diversifying international gas suppliers; expanding and diversifying transport
options; building redundancy in import terminals and increasing global gas supplies through upstream
investment in other countries. To date, China has a more expansive and diversified gas import structure
than India possibly reflecting India’s lack of financial resources and the serious difficulties in building
significant infrastructure in that country. China has had more success in increasing domestic gas
production than India but significant gas imports are expected to continue in both countries in the
foreseeable future. The upstream gas sectors in both countries suffer from disincentives to investment,
particularly around pricing, that are discussed in the body of this paper.
The governments of both countries have encouraged upstream oil and gas investment in foreign
countries as a way to protect against price volatility and supply shortages. China has been more
aggressive in this arena than India, frequently outbidding Indian investors. As of 2014, a total of ten
Chinese companies owned production entitlements in 42 countries, of which about half were located in

April 2017, BEG/CEE China/India Gas Demand, Page 94
the Middle East and Africa.238 Between 2011 and 2013, Chinese companies invested about $73 billion in
global upstream assets.239 In contrast, ONGC Videsh, the international upstream arm of ONGC and the
largest international investor, had 37 oil and gas assets in 17 countries as of March 2015, representing
an investment of $7 billion.240 To enhance the international competitiveness of India’s oil and gas
companies, the government has been considering the merger of 13 state-controlled oil and gas
companies since mid-2016.241
Currently China and India do not have sufficient gas storage to help them respond to supply and
demand disruptions. This is of special concern in China which has a growing residential heating market
with significant seasonal demand swings: the residential and commercial sector was the second largest
gas consuming sector after the industrial sector in 2014. In its 2016 report on global gas security, the IEA
noted the importance of gas storage in increasing the security of a country’s gas network.242 Neither
country appears to have large potential underground storage. LNG tank storage can offer some relief
but it is costly and more suited to covering short-term supply disruptions.
Table 21. China and India Gas Supply and Import Infrastructure
Indicator China India
Domestic Gas Production Growth Rate 2005-2015
13.5% 1%
2015 Gas Imports BCM/Percent of Total Gas Supply
59/30% 22/43%
Percent Pipeline Gas Imports 2015 58% 0%
Percent LNG Imports 2015 42% 100%
# Origin Countries of Contracted LNG Supplies 2017/2021243
6/7 4/4
Dominant LNG Supplier Percent of Total Contracted Supply 2017/2021244
Australia 40/37% Qatar 68/35%
# Operational LNG Regasification Terminals/Average Load Factor
12/51% in 2014 4/77% ten months 2015-16
# LNG Regasification Terminals/Expansions Under Construction October 2016245
10 2
# Operational International Gas Pipelines/Gas Supply Countries/Average Load Factor 2014
2: Central Asia Gas Pipeline/Turkmenistan/55% and China Myanmar Pipeline/Myanmar/28%
0
238 IEA, 2014. 239 Ibid. 240 Verma, N., 2015. 241 Stacey, K., 2017. 242 IEA, 2016, Global Gas Security Review. 243 Ibid. 244 Ibid. The IEA reports that “portfolio players” (LNG aggregators with multiple sources of supply) will play an increasing role in both China and India’s contracted LNG supply portfolio growing from about 22% in 2017 to about 28% in 2021 in China and from 20% to about 33% in India over the same time period. India will rely less on Qatari LNG imports as volumes from the US ramp up from about 3% of total contracted LNG supplies in 2017 to 27% in 2021. 245 Ibid.

April 2017, BEG/CEE China/India Gas Demand, Page 95
Indicator China India
# Planned International Gas Pipelines/Gas Supply Countries
1: Power of Siberia/Russia-Delayed
2: Turkmenistan-Afghanistan-Pakistan-India (TAPI) Pipeline/Turkmenistan-Feasibility Studies and $25 billion pipeline/Russia-In Studies
Gas Storage 7.4 BCM working gas storage; LNG tank storage associated with distribution company liquefaction 32 BCM
Negligible
There has been discussion about the relative riskiness of gas imports by pipeline versus gas imports via
LNG. In its 2016 report on Global Gas Security the IEA noted that there is little volume flexibility in global
LNG liquefaction infrastructure as it operates as baseload facilities. More troubling the IEA reported that
LNG liquefaction capacity unavailable to the market increased from 8% (30 BCM) of total liquefaction
capacity in 2011 to 14% (65 BCM) in 2016. Over the period 2011 to 2016, 76% of liquefaction capacity
unavailability was attributable to lack of feedstock gas. 246
With respect to LNG transportation routes, both countries depend on sea lines of communication
(SLOCs): the Straits of Malacca and Hormuz, the Indian Ocean and the South China Sea. China’s National
Security Law of 2015 requires the state to construct and maintain strategic channels for the
transportation of natural resources and energy and to protect their security.247 Both India and China are
undertaking ambitious naval modernization programs in part to protect their energy SLOCs.248 China’s
military presence in the Indian Ocean has increased considerably in recent years and India is concerned
that China may challenge India’s goal of “being the primary security guarantor in the Indian Ocean.”249
It has been reported that some Chinese policy makers favor oil and gas imports by land from Central
Asia, Russia and even Iran in order to lessen China’s reliance on seaborne energy which is exposed to
interference from the US Navy that controls shipping lanes around the Straits of Malacca and Hormuz,
the Indian Ocean and the South China Sea.250 Some observers view China’s Silk Road strategy (“One Belt,
One Road”) as China’s non-military solution to US global naval dominance.251 Others argue that land
routes for oil and gas imports will be more expensive and more vulnerable to physical attack by
terrorists. Whether by land or sea, it is clear that both India and China are determined to protect their
energy trade routes and that objective will continue to be a part of their foreign policies.
The governments of both countries have policies supporting the development of non-fossil fuel energy
sources for power generation, especially wind, solar and nuclear. Although energy security may not be
the primary driver of these policies and mitigating reliability could be a challenge, wind, solar and
nuclear are domestically-controlled resources and do not have the security disadvantages associated
with imports. In China, non-hydro renewable generation doubled its share of total electric generation
from 2.2% in 2011 to 4.8% in 2015. By comparison, gas-fired generation was 1.7% of total electric
246 Ibid. 247 China Law Translate, 2015. 248 O’Rourke, R., 2016 and Southerland, M., Koch-Weser, I. and Zhang, A., 2014. 249 Southerland, et.al., 2014. 250 Shea, D.C., 2014. 251 Tata, S., 2017.

April 2017, BEG/CEE China/India Gas Demand, Page 96
generation in 2015. China has the largest construction program of new nuclear power generation units
in the world and has developed a domestic manufacturing industry to support it. China has also
developed large wind turbine and solar panel manufacturing industries that allow the country to control
a large portion of the supply chain. India is planning for non-fossil fuel (wind, solar and nuclear) power
generation capacity to be 40% of total generation capacity by 2030.
SUMMARY AND CONCLUSIONS
We expect growth in industrial energy demand in China to slow as it struggles with massive overcapacity
in the energy intensive industries. The uncertainty surrounding the ultimate success of the “Make in
India” initiative clouds the prospect of robust industrial energy demand growth in India. The
continuation of current low domestic gas and LNG prices could result in short-term demand increases in
both China and India but we think continuation of current price levels is not likely over the longer-term.
We expect cheap and abundant coal to continue dominating the energy use of the price-sensitive
industrial and power sectors in both China and India absent the imposition of a meaningful carbon tax
which we think is unlikely. We expect natural gas to play a peaking and load balancing role in both
countries’ power sectors with baseload generation coming from nuclear and supercritical, clean coal
plants. We think there will be continued strong policy support for renewables in power generation to
achieve environmental goals. As a result, our expectation of natural gas demand growth in those two
sectors is at the lower end of the forecasts we reviewed. If there are difficulties in accommodating
renewables in power sector transmission grids, there may be a possibility for gas to play a greater role in
generation.
In our view, there is gas demand growth potential in the city gas distribution sector of China which could
be realized if there is continued strong investment in the expansion of distribution and transport
infrastructure. We expect more modest growth in the gas demand from this sector in India given the
large infrastructure challenges, slower urbanization and the competition from alternatives.
Although India’s population is forecast to exceed China’s around 2022252and its GDP growth is expected
to outpace China’s in the medium term, we think, consistent with the forecasts we reviewed, that
India’s gas market will still be about one-quarter the size of China’s gas market in the foreseeable future.
For both countries, natural gas will be most attractive with enabling infrastructure, including storage;
flexible supply sources; and transparent, market based, demand sensitive pricing. This last condition
applies not only to natural gas but also to other, competing fuels and technologies (and is a condition
that underlies natural gas attractiveness worldwide). Environmental policies will not assure growth in
natural gas use. In all likelihood, they would mainly serve to foster alternative energy approaches.
252 The Globalist, 2015.

April 2017, BEG/CEE China/India Gas Demand, Page 97
REFERENCES
Note that some references require subscription access.
Aizhu, C., Rose, A., 11/30/15. http://af.reuters.com/article/energyOilNews/idAFL3N13P0YC20151130.
Asian Development Bank, 2016, April 7, TAPI Pipeline to help address energy shortages in Pakistan,
https://www.adb.org/news/tapi-pipeline-help-address-energy-shortages-pakistan
Bloomberg News, 2016, June 10, US push on China factories seen as prelude to trade clash, Business Mirror,
http://www.businessmirror.com.ph/us-push-on-china-factories-seen-as-prelude-to-trade-clash/
2016, August 9, The world’s energy engine is slowing, http://www.bloomberg.com/news/articles/2016-
08-09/world-s-energy-engine-slowing-no-help-for-gluts-from-oil-to-coal
2016, July 15, “China’s old economy springs June surprise with steel record,”
http://www.bloomberg.com/news/articles/2016-07-15/china-s-giant-steel-industry-just-notched-up-
record-daily-output.
Blumental, D. M., Yong, X., Deemer, P.C., Zhang, S., 2013, January 24, China issues new natural gas utilization
policy, Vinson & Elkins LLP,
http://www.mondaq.com/unitedstates/x/217828/Oil+Gas+Electricity/China+Issues+New+Natural+Gas+U
tilization+Policy.
BMI Research, 2016, June, China Renewables Report Q3 2016, http://www.bmiresearch.com.
2016, March, China Power Report Q2 2016.
2016, February, China Petrochemicals Report Q2 2016.
2016, October, China Petrochemicals Report Q4 2016.
2016, April, China Oil & Gas Report Q3 2016.
2016, October, China Oil & Gas Report Q4 2016.
2016, March, India Power Report Q2 2016.
2016, March, India Oil & Gas Report Q2 2016.
2016, India Oil & Gas Report Q3.
2016, October, India Oil & Gas Report Q4 2016.
2016, May, India Renewables Report Q3 2016.
Bose, K., 2015, November 9, Gas price pooling leads to breakthrough in urea production, Business Standard,
http://www.business-standard.com/article/economy-policy/gas-price-pooling-leads-to-breakthrough-in-
urea-production-115110900685_1.html.
BP, 2016 edition, BP Energy Outlook, http://www.bp.com/content/dam/bp/pdf/energy-economics/energy-
outlook-2016/bp-energy-outlook-2016.pdf.
BP, 2015, Statistical Review of World Energy, https://www.bp.com/content/dam/bp/pdf/energy-
economics/statistical-review-2015/bp-statistical-review-of-world-energy-2015-full-report.pdf.
Brar, J., Gupta, S., Madgavkar, A., Maitra, B.C., Rohra, S., Sundar, M., 2014, October, India’s economic geography in
2025: states, clusters and cities, Insights India, McKinsey & Co.,
http://mckinseyinsightsindia.com/Documents/India%E2%80%99s%20economic%20geography%20in%202
025%20-%20states,%20clusters%20and%20cities.pdf.
Browne, A., 2016, April 19, Cast in concrete: China’s problem with excess, The Wall Street Journal,
http://www.wsj.com/articles/cast-in-concrete-chinas-problem-with-excess-1461038709.
2016, March 29, Slowing in China: not just economy but political resolve, The Wall Street Journal,
http://www.wsj.com/articles/slowing-in-china-the-political-resolve-1459227912.
2016, May 17, Xi Jinping’s economy gets stuck in theory stage, The Wall Street Journal,
http://www.wsj.com/articles/xis-economy-gets-stuck-in-theory-stage-1463467219.
Burke, T., 2016, August 1, Doubts pile up about UK’s Hinkley nuclear plant,
https://www.chinadialogue.net/blog/9163-Doubts-pile-up-about-UK-s-Hinkley-nuclear-plant/en.
http://www.bp.com/content/dam/bp/pdf/energy-economics/energy-outlook-2016/bp-energy-outlook-2016.pdf

April 2017, BEG/CEE China/India Gas Demand, Page 98
Campbell, R.J., 2014, April 30, China and the United States-A comparison of green energy programs and policies,
Congressional Research Service, https://www.fas.org/sgp/crs/row/R41748.pdf.
CarbonBrief, 2015, February 10, India’s greenhouse gas emissions in 2030 would climb by around 90% compared
to current levels, according to CarbonBrief analysis of its climate pledge to the UN,
http://www.carbonbrief.org/indias-indc.
CEDIGAZ, 2015, February, Medium and Long Term Natural Gas Outlook,
http://www.cedigaz.org/documents/2015/CEDIGAZProspects2015.pdf.
Central Electricity Authority, Ministry of Power India, 2016, April, Executive summary power sector,
http://cea.nic.in/reports/monthly/executivesummary/2016/exe_summary-04.pdf.
2015, April, Growth of Electricity Sector in India from 1947-2015,
http://www.indiaenvironmentportal.org.in/files/file/growth_2015.pdf.
Center for Strategic & International Studies, 2016, The Modi government’s reform program: a scorecard,
http://indiareforms.csis.org/ and http://indiareforms.csis.org/160515_india_reforms.pdf.
Central Statistics Office India, 2013, Energy Statistics 2013 (Twentieth Issue), Ministry of Statistics and Programme
Implementation, http://mospi.nic.in/mospi_new/upload/Energy_Statistics_2013.pdf.
Chen, A., Rose A., 2015, November 30, Update-1-China’s power sector reform focuses on renewable sector,
Reuters Africa, http://af.reuters.com/article/energyOilNews/idAFL3N13P0YC20151130.
Chen, M., 2014, July, The development of Chinese gas pricing: drivers, challenges and implications for demand,
OIES Paper: NG 89, Oxford Institute for Energy Studies, https://www.oxfordenergy.org/wpcms/wp-
content/uploads/2014/07/NG-89.pdf.
2015, August, China’s pricing reform-how far and how fast?, Oxford Energy Forum, Issue 101, p. 17-19,
https://www.oxfordenergy.org/wpcms/wp-content/uploads/2015/09/OEF-101.pdf.
Cheng, S.W., 2015, September 28, Overcapacity a time bomb for China’s economy, South China Morning Post,
http://www.scmp.com/comment/insight-opinion/article/1862024/overcapacity-time-bomb-chinas-
economy.
China Daily, 2016, August 29, China imports less natural gas amid weak consumption, China Daily,
http://www.chinadaily.com.cn/bizchina/2016-08/29/content_26627793.htm.
China Labour Bulletin, 2016, April 15, Workers’ struggle continues as China’s economic growth slows to 6.7
percent, http://www.clb.org.hk/content/workers%E2%80%99-struggle-continues-china%E2%80%99s-
economic-growth-slows-67-percent.
2016, Strike Map, http://maps.clb.org.hk/strikes/en
China Law Translate, 2015, July 1, National Security Law, http://www.chinalawtranslate.com/2015nsl/?lang=en.
Chinese European Energy News, 2016, 11/1, Decrease of renewable energy feed-in tariffs in China,
http://ceenews.info/en/decrease-of-renewable-energy-feed-in-tariffs-in-china/.
Corbeau, A., Volk, D., Sinton, J., Jiang, J., Ping, J., Teng, T., Boshu, L., Fen, Y., 2012, Gas pricing and regulation:
China’s challenges and IEA experience, International Energy Agency, Partner Country Series,
http://www.iea.org/publications/freepublications/publication/chinagasreport_final_web.pdf.
Cornot-Gandolphe, S., 2014, December, China’s coal market: can Beijing tame ‘King Coal”?, OIES Paper: CL 1,
Oxford Institute for Energy Studies, https://www.oxfordenergy.org/wpcms/wp-
content/uploads/2014/12/CL-1.pdf.
Corporate Catalyst India, 2015, April, A brief report on chemical and petrochemical industry in India,
http://www.cci.in/insights/survey-and-reports/chemical-and-petrochemical-industry-in-india.
2015, July, A brief report on the iron and steel industry in India, http://www.cci.in/insights/survey-and-
reports/iron-and-steel-industry-in-india.
Cunningham, N., 2016, February 17, The decline of the coal industry is “long-term” and “irreversible,” Oil Price,
http://oilprice.com/Energy/Coal/The-Decline-Of-The-Coal-Industry-Is-Long-Term-And-Irreversible.html.
Das, D., 2016, June 15, UDAY effect: With interest burden unplugged, more power to Discoms, The Hindu,
http://www.thehindubusinessline.com/economy/uday-effect-with-interest-burden-unplugged-more-

April 2017, BEG/CEE China/India Gas Demand, Page 99
power-to-
discoms/article8733309.ece?utm_source=thehindu&utm_medium=widget&utm_campaign=Widget+Pro
mo.
Davies, P., Westgate, A., 2016, May 4, ETS: China’s move to a low –carbon economy,
https://www.lw.com/thoughtLeadership/china-and-carbon-trading.
Deaux, J., 2015, November 3, When a 127-year-old U.S. industry collapses under china’s weight, Bloomberg News,
http://www.bloomberg.com/news/articles/2015-11-03/when-a-127-year-old-u-s-industry-collapses-
under-china-s-weight.
Deloitte, 2010, Urbanization in China,
https://www.deloitte.com.mx/documents/BoletinFactorChina/Urbanization_in_China.pdf.
Dempsey, K.M., 2015, November 4, Pre-Hearing Statement of Kevin M. Dempsey, American Iron and Steel
Institute, For the Hearing on Inv. 332-555, US International Trade Commission,
https://www.steel.org/~/media/Files/AISI/Public%20Policy/Testimony/AISI%20Pre-
Hearing%20Statement%20on%20Economic%20Impact%20of%20Trade%20Agreements%20110415%20_%
20Final.pdf.
DNA India, 2015, December 28, Confident of India becoming net exporter of urea in few years: Fertiliser Minister,
http://www.dnaindia.com/money/report-fertiliser-sector-in-2015-fertiliser-sector-eyes-over-2-million-
tonnes-output-growth-in-2016-2160102.
Donnan, S., Mitchell, T., 2016, June 12, IMF sounds warning on China’s corporate debt, Financial Times,
http://www.ft.com/intl/cms/s/0/3f8dcf22-304c-11e6-bda0-04585c31b153.html#axzz4BqzMyxuA.
The Economic Times, 2016, April 1, India marks record urea production of 245 L tons in FY 16,
http://articles.economictimes.indiatimes.com/2016-04-01/news/71977238_1_urea-used-fertiliser-tonne.
2015, May 3, GAIL to stop LNG imports at Dabhol till October,
http://articles.economictimes.indiatimes.com/2015-05-03/news/61768244_1_dabhol-lng-gail-india-ltd-
dabhol-terminal.
2013, March 26, RGTIL to lease out 25% space on East-West line to third parties,
http://articles.economictimes.indiatimes.com/2013-03-26/news/38040698_1_kg-d6-mmscmd-east-west-
gas-pipeline.
Enerdata, 2016, July 25, China introduces alert system to slow down wind newbuild,
http://www.enerdata.net/enerdatauk/press-and-publication/energy-news-001/china-introduces-alert-
system-slow-down-wind-newbuild_37801.html.
Energy Insights, 2016, June, Asia gas outlook to 2030, McKinsey Solutions Sprl,
https://www.mckinseyenergyinsights.com/services/market-reports-analysis/regional-gas-lng-outlooks-to-
2030.aspx.
Energy Insights, 2016, August 1, China introduces a risk alert system for onshore wind, McKinsey & Co.,
http://[email protected].
The Energy and Resources Institute (TERI), 2016, March 15, Energy & Environment Data Diary and Yearbook,
https://www.amazon.com/s/ref=nb_sb_noss?url=search-alias%3Daps&field-
keywords=the+energy+and+resources+institute+india+teddy&rh=i%3Aaps%2Ck%3Athe+energy+and+reso
urces+institute+india+teddy.
Eng, K., 2014, June 16, China Oil & Gas, Maybank, http://www.maybank-ke.com/media/2057/140616-
sector_china-oil-gas.pdf.
Engineering 360 News Desk, 2015, October 23, Slowing economy means mixed outlook for Asia’s chemical
industry, IHS says, Engineering 360, IEEE GlobalSpec, http://insights.globalspec.com/article/1626/slowing-
economy-means-mixed-outlook-for-asia-s-chemical-industry-ihs-says .
European Union Chamber of Commerce in China, 2016, February 22, Overcapacity in China: An impediment to the
Party’s reform agenda, http://www.europeanchamber.com.cn/en/publications-archive/405.

April 2017, BEG/CEE China/India Gas Demand, Page 100
Express News Service, 2015, October 1, Government cuts natural gas prices by 18% to $4.24 per unit, The Indian
Express, http://indianexpress.com/article/india/india-news-india/govt-cuts-natural-gas-prices-by-16-to-4-
24-per-unit/.
ExxonMobil, 2016, The Outlook for Energy: A View to 2040,
http://www.corporate.exxonmobil.com/en/energy/energy-outlook.
FitchRatings, 2015, November 19, Fitch InterView: China steel production capacity to peak in 2016,
https://www.fitchratings.com/site/pressrelease?id=994387.
2016, April 13, Fitch: Surplus capacity a secular risk for China coal firms,
https://www.fitchratings.com/site/pressrelease?id=1002405.
2015, September 2, Fitch: Slower growth for China city gas sector as economy slows,
https://www.fitchratings.com/site/pressrelease?id=990261.
Fitzgibbon, T., Janssens, T., 2015, May, Profitability in a world of overcapacity, McKinsey&Company,
http://www.mckinsey.com/industries/oil-and-gas/our-insights/profitability-in-a-world-of-overcapacity.
Flower, A., 2016, July, LNG Supply Outlook 2016 to 2030,
http://www.beg.utexas.edu/energyecon/thinkcorner/CEE_Advisor_Research_Note-
Andy_Flower_LNG_Supply_Outlook-Aug16.pdf.
Forsythe, M., 2016, April 25, China curbs plans for more coal-fired power plants, The New York Times,
http://www.nytimes.com/2016/04/26/business/energy-environment/china-
coal.html?action=click&contentCollection=Asia%20Pacific&module=RelatedCoverage®ion=Marginalia
&pgtype=article.
Foss, M.M., Palmer-Huggins, D., 2016, European and Asian natural gas market developments-swamped by the
present? In Managing Energy Price Risk edited by Vincent Kaminski, Fourth Edition, Risk Books, London,
pp. 185-250.
GAIL (India) Limited, 2016, Approved Provisional Initial Unit Tariff Applicable for Authorized Natural Gas Pipeline
Networks as per PNGRB Tariff Orders, http://www.gailonline.com/final_site/pdf/NGPL_Tariff.pdf.
Garg, V., 2016, April 22, India’s 2016 budget: a mixed bag for clean energy alternatives, IISD,
https://www.iisd.org/blog/india-s-2016-budget-mixed-bag-clean-energy-alternatives.
Gaspar, Miklos, 2015, June, Nuclear power forms an important pillar of many countries’ climate change mitigation
strategies, IAEA Bulletin, http://www-pub.iaea.org/MTCD/Publications/PDF/RDS_2-36_web.pdf.
The Globalist, 2015, November 5, Population growth at the top: China vs. India,
http://www.theglobalist.com/population-growth-at-the-top-china-vs-india/.
Goodman, D. S. G., 2004, The Campaign to ‘Open Up the West’, Cambridge University Press, 2004.
Goodwill, J., 2016, August 19, Growth in Chinese thermal coal imports won’t last,” mining.com,
http://www.mining.com/growth-in-chinese-thermal-coal-imports-will-not-last-long/.
Government of India, 2016, Economic Survey 2015-16, http://indiabudget.nic.in/survey.asp.
2016, February, ITP Division, Ministry of External Affairs, Monthly Economic Bulletins,
http://www.indembkwt.org/Monthly%20Economic%20Bulletin%20%20February%202016.pdf.
2014-15, Ministry of Petroleum & Natural Gas, Economics and Statistics Division, Indian petroleum and
natural gas statistics 2014-15, http://www.petroleum.nic.in/docs/pngstat.pdf.
2013, May, Industry Group Report for the Petroleum & Natural Gas Regulatory Board of India, Vision
2030: Natural gas infrastructure in India, http://www.pngrb.gov.in/Hindi-Website/pdf/vision-NGPV-2030-
06092013.pdf.
2014, Ministry of Petroleum & Natural Gas, Report of the Committee on Gas Pricing,
http://petroleum.nic.in/docs/committee_report_on_gas_pricing_2014.pdf.
2016, Department of Fertilizers, Ministry of Chemicals & Fertilizers, 2016, Installed Capacity During
Reporting Year 2016-17 and Fertilizer Annual Report 2015-16, http://fert.nic.in/.
2015, November 5, UDAY for financial turnaround of power distribution companies,
http://pib.nic.in/newsite/PrintRelease.aspx?relid=130261.

April 2017, BEG/CEE China/India Gas Demand, Page 101
2015, Ministry of Power, Office Memorandum No.4/2/2015-Th-I, Shram Shakti Bhawan, Rafi Marg, New
Delhi Dated 27 March 2015, Subject: Scheme for utilization of Gas based power generation capacity
https://www.mstcecommerce.com/.../psdf/RenderFilepsdf.jsp?...Scheme...dated...2015.
Goyal, A., Kotecha, S., Simons, T.J., 2015, November, Solving the puzzle of India’s petrochemical-intermediates
shortfall, McKinsey&Company, http://www.mckinsey.com/industries/chemicals/our-insights/solving-the-
puzzle-of-indias-petrochemical-intermediates-shortfall.
The Guardian, 2016, June 16, China’s debt is 250% of GDP and ‘could be fatal’ says government expert,
https://www.theguardian.com/business/2016/jun/16/chinas-debt-is-250-of-gdp-and-could-be-fatal-says-
government-expert.
Guo, A., 2016, August 17, China’s draft pipeline guidelines seen boosting gas demand, Bloomberg Markets,
http://www.bloomberg.com/news/articles/2016-08-17/china-s-draft-pipeline-guidelines-seen-boosting-
gas-demand.
2016, March 24, PetroChina cuts output for first time in 17 years, World Oil,
http://www.worldoil.com/news/2016/3/24/petrochina-cuts-output-for-first-time-in-17-years.
Haley, G.T., Haley U.C.V., 2013, March 27, Subsidies to Chinese industries: state capitalism, business strategy and
trade policy, Oxford University Press, United States, http://www.chinasubsidies.com/index.htm.
2014, September 26, The hidden advantage of Chinese subsidies, The World Financial Review,
http://www.worldfinancialreview.com/?p=2942.
He, L., 2016, March 3, China’s government debt woes might worsen in 2016, South China Morning Post,
http://www.scmp.com/business/companies/article/1920063/chinas-government-debt-woes-might-
worsen-2016.
Hewitt, D., 2016, February 22, Overcapacity in China’s industry ever more destructive to domestic and global
economy: report, International Business Times, http://www.ibtimes.com/overcapacity-chinas-industry-
ever-more-destructive-domestic-global-economy-report-2317045.
Higashi, N., 2009, June, Natural gas in China: market evolution and strategy, International Energy Agency, Working
Paper Series, https://www.iea.org/publications/freepublications/publication/nat_gas_china.pdf.
The Hindu, 2016, March 10, Cabinet approves new pricing policy for hard-to-reach, deep sea gas fields,
http://www.thehindu.com/business/Industry/cabinet-approves-new-pricing-policy-for-hardtoreach-deep-
sea-gas-fields/article8337452.ece.
2016, January 30, Govt. announces list of first 20 smart cities under ‘Smart Cities Mission’,
http://www.thehindu.com/news/national/list-of-first-20-smart-cities-under-smart-cities-
mission/article8162775.ece.
The Hindu Business Line, 2015, December 31, Petronet strikes deal with Qatar’s RasGas , to get LNG at half-price,
http://www.thehindubusinessline.com/news/qatar-agrees-to-lower-price-in-gas-deal-with-
india/article8049876.ece.
The Hindu Business Line, 2016, March 31, Natural gas prices slashed by 20%,
http://www.thehindubusinessline.com/economy/domestic-natural-gas-prices-cut-almost-
20/article8418475.ece.
Hindustan Times, 2016, October 16, India, Russia to study construction of gas pipeline costing $25 billion,
http://www.hindustantimes.com/india-news/india-russia-to-study-construction-of-gas-pipeline-costing-
25-billion/story-3vW5HFqAHTpMuCm8V9BcXM.html.
Hodges, P., 2014, November 10, Great Unwinding leads to major chemical market downturn, ICIS, Chemicals & The
Economy, http://www.icis.com/blogs/chemicals-and-the-economy/2014/11/great-unwinding-leads-
chemical-market-downturn/.
Home, A., 2015, July 20, China, the aluminum giant that’s still growing, Reuters London,
http://www.reuters.com/article/us-aluminium-production-ahome-idUSKCN0PU21C20150720.
http://www.scmp.com/business/companies/article/1920063/chinas-government-debt-woes-might-worsen-2016
April 2017, BEG/CEE China/India Gas Demand, Page 102
Hong, S., Liu, N., Luedi, T., 2013, June, What’s next for international chemical companies in China?,
McKinsey&Company, http://www.mckinsey.com/industries/chemicals/our-insights/whats-next-for-
international-chemical-companies-in-china.
Honore, A., Rogers, H., D’Apote. S., Corbeau, A., 2016, September, “LNG Demand Potential,” in LNG Markets in
Transition: The Great Reconfiguration,” edited by A. Corbeau and D. Ledesma, Oxford Institute for Energy
Studies, Oxford University Press.
Hornby, L., 2016, February 10, China breezes past EU as top wind power, Financial Times,
http://www.ft.com/intl/cms/s/0/e2298424-cfdf-11e5-831d-09f7778e7377.html#axzz4B.
2016, June 17, China coalminers seek new debt terms, Financial Times,
http://www.ft.com/intl/cms/s/0/6563de40-345b-11e6-bda0-
04585c31b153.html?siteedition=intl#axzz4BqzMyxuA.
2016, June 14, China rows back on state-sector reforms, Financial Times,
http://www.ft.com/intl/cms/s/0/92e52600-31f7-11e6-ad39-3fee5ffe5b5b.html?siteedition=intl.
2016, June 13, China investment growth slowest since 2000, Financial Times,
http://www.ft.com/intl/cms/s/0/965e861a-311f-11e6-ad39-3fee5ffe5b5b.html#axzz4Br8JyF00.
2016, June 7, China plagued by oil refining overcapacity, Financial Times,
http://www.ft.com/intl/cms/s/0/b1c06f2a-2965-11e6-8b18-91555f2f4fde.html?siteedition=intl.
Hume, N., 2016, October 18, Thermal coal prices hit $100 a tonne, Financial Times,
https://www.ft.com/content/a71cc96c-dcba-3e53-8a87-caf8be075ae6.
Hureau, G., 2016, May 9, Impact of the oil price: how long will this new pricing world continue?, CEDIGAZ, the
International Association for Natural Gas,
http://www.cedigaz.org/documents/2016/IMPACT%20OF%20THE%20OIL%20PRICE%20-
%20Pr%C3%A9sentation%20GH.pdf.
Hwang, M., Weems, P.R., 2016, June 6, LNG oversupply faces slowing Asian demand, King & Spalding LLP, Oil & Gas
Journal, http://www.ogj.com/articles/print/volume-114/issue-6/transportation/lng-oversupply-faces-
slowing-asian-demand.html.
ICIS, 2016, March, China Gas Price Pool, China Gas Market Monthly, Vol.111-03 No.18. .
www.icis.com/energy/channel-info-finder/.
ICIS, 2016, A snapshot of China’s natural gas demand 2016-2020, Infographic, www.icis.com/china-lng-gas.
ICIS, Singapore, 2015, August 25, China’s PX imports surges to 1m tonnes in July; mixed overall,
http://www.icis.com/resources/news/2015/08/25/9916660/china-s-px-imports-surges-to-1m-tonnes-in-
july-mixed-overall/.
ICRA (Investment Information and Credit Rating Agency of India), 2015a, July, Fertilizer Industry Report, Indian
fertilizer sector; major policy initiatives for urea; gas pooling & comprehensive new urea policy 2015,
http://www.icra.in/AllTypesOfReports.aspx?ReportCategory=Fertilizers.
2015b, September, Gas Utilities Report, Indian gas utilities; constrained gas availability and regulatory
challenges to be key hurdles for ambitious target to double pipeline infrastructure,
http://www.icra.in/AllTypesOfReports.aspx?ReportCategory=Gas%20Utilities.
2016a, January, Special Comment, Indian oil and gas sector: note on revision in price formula of RasGas
LNG: credit positive for LNG marketers, regasification and consumer segments, http://www.icra.in.
2016b, February, Ferrous Metals Report, Indian steel industry-minimum import price to provide a
temporary relief to the domestic steel industry,
http://www.icra.in/AllTypesOfReports.aspx?ReportCategory=Ferrous%20Metals.
2016c, March, Fertilizer Industry Report, Indian fertilizer sector: March 2016 update; impact of China on
the fertilizer market; prices trends and outlook,
http://www.icra.in/AllTypesOfReports.aspx?ReportCategory=Fertilizers.

April 2017, BEG/CEE China/India Gas Demand, Page 103
2016d, March, Gas Utilities Report, Indian gas utilities; domestic gas output to rise in long term following
reforms; recent PNGRB notification a marginal plus for transmission sector,
http://www.icra.in/AllTypesOfReports.aspx?ReportCategory=Gas%20Utilities
2016, February, Indian Steel Industry, http://www.icra.in.
Gas Utilities Report, 2016, March, Indian gas utilities; domestic gas output to rise in long term following
reforms; recent PNGRB notification a marginal plus for transmission sector,
http://www.icra.in/AllTypesOfReports.aspx?ReportCategory=Gas%20Utilities.
2015, December, Cessation of LPG subsidy for high income consumers and Supreme Court directive on
diesel ban: credit positives for the CGD sector, www.incraindia.com.
IHS, Specialty Chemicals Update Program, 2015, July, Overview of the specialty chemicals industry,
https://www.ihs.com/products/specialty-chemicals-industry-scup.html.
IHS, 2014, February 10, Chemical Week, http://www.chemweek.com.
International Atomic Energy Agency, 2015 Edition, Country nuclear power profiles, China, Updated 2014,
http://www-pub.iaea.org/MTCD/Publications/PDF/CNPP2015_CD/countryprofiles/China/China.htm.
2015 Edition, Country nuclear power profiles, India, Updated 2009, http://www-
pub.iaea.org/MTCD/Publications/PDF/CNPP2015_CD/countryprofiles/India/India.htm.
2016, Nuclear reactors under construction by country and type,
https://www.iaea.org/PRIS/WorldStatistics/UnderConstructionReactorsByCountry.aspx.
2016, Nuclear reactors operational & long-term shutdown by country and type,
https://www.iaea.org/PRIS/WorldStatistics/OperationalReactorsByCountry.aspx.
2016 Edition, Nuclear power reactors in the world, Reference Data Series No. 2, http://www-
pub.iaea.org/MTCD/Publications/PDF/RDS_2-36_web.pdf.
International Energy Agency, 2016, Global Gas Security Review,
https://www.iea.org/publications/freepublications/publication/GlobalGasSecurityReview2016.pdf.
2016, October 25, Renewable Energy: Medium Term Market Report 2016, Launch Presentation,
https://www.iea.org/newsroom/speeches/MTRMR_2016_Launch_Presentation_FINAL_for_web.pdf.
2015, World Energy Outlook 2015, Paris, France, http://www.worldenergyoutlook.org.
2015, Energy and Climate Change, World Energy Outlook Special Report,
https://www.iea.org/publications/freepublications/publication/WEO2015SpecialReportonEnergyandClim
ateChange.pdf.
2014, Update on Overseas Investments by China’s National Oil
Companies,https://www.iea.org/publications/freepublications/publication/PartnerCountrySeriesUpdateo
nOverseasInvestmentsbyChinasNationalOilCompanies.pdf.
2012. China Gas Pricing and Regulation,
http://www.iea.org/publications/freepublications/publication/chinagasreport_final_web.pdf.
IEA, WEO 2015 Fossil Fuel Subsidies Database,
http://www.worldenergyoutlook.org/resources/energysubsidies/fossilfuelsubsidydatabase/.
International Monetary Fund, 2015, August, People’s Republic of China, 2015 Article IV Consultation, IMF Country
Report No. 15/234, https://www.imf.org/external/pubs/ft/scr/2015/cr15234.pdf.
2016, March 2, India staff report for the 2016 article IV consultation, IMF Country Report No. 16/75,
https://www.imf.org/external/pubs/ft/scr/2016/cr1675.pdf.
Survey Magazine, 2016, March 2, India can lock in good fortune with private investment, structural
reforms, http://www.imf.org/external/pubs/ft/survey/so/2016/CAR030216A.htm.
2016, March, India selected issues, IMF Country Report No. 16/76,
https://www.imf.org/external/pubs/ft/scr/2016/cr1676.pdf.
2016, January 19, World Economic Outlook Update,
http://www.imf.org/external/pubs/ft/weo/2016/update/01/.
April 2017, BEG/CEE China/India Gas Demand, Page 104
Johnson, C.K., 2016, March, President Xi Jinping’s “Belt and Road” initiative, Center for Strategic & International
Studies, https://csis-prod.s3.amazonaws.com/s3fs-
public/publication/160328_Johnson_PresidentXiJinping_Web.pdf.
Jost, B.S., Wang, V.X., 2014, October 9, Encouraging gas development in China-a work in progress, Davis Wright
Tremaine LLP, http://www.dwt.com/Encouraging-Gas-Development-in-ChinaA-Work-In-Progress-10-08-
2014/.
Kavanagh, M., 2016, July 26, A world map of subsidies for renewable energy and fossil fuels, Financial Times,
http://www.ft.com/cms/s/0/fb264f96-5088-11e6-8172-e39ecd3b86fc.html#axzz4GrTDIxcZ.
Kazmin, A., 2016, June 19, Raghuram Rajan’s departure from RBI unnerves India investors, Financial Times,
http://www.ft.com/intl/cms/s/0/303263ae-35dc-11e6-9a05-82a9b15a8ee7.html#axzz4C3Qvklfh.
Kennedy, S., Johnson, C.K., 2016, May, Perfecting China, Inc.: the 13th five-year plan, Center for Strategic &
International Studies, https://csis-prod.s3.amazonaws.com/s3fs-
public/publication/160521_Kennedy_PerfectingChinaInc_Web.pdf.
2016, March, State and market in contemporary China, Center for Strategic & International Studies,
https://csis-prod.s3.amazonaws.com/s3fs-
public/legacy_files/files/publication/160303_Kennedy_StateMarketChina_Web.pdf.
Kohl, K., 2016, August 26, Feeding China’s natural gas addiction, Energy & Capital,
http://www.energyandcapital.com/articles/feeding-chinas-growing-gas-addiction/5577.
Kossoy, A., Peszko, G., Oppermann, K., Prytz, N., Klein, N., Blok, K., Lam, L., Wong, L., Borkent, B., 2015, September,
State and Trends of Carbon Pricing, World Bank, http://www-
wds.worldbank.org/external/default/WDSContentServer/WDSP/IB/2015/09/21/090224b0830f0f31/2_0/
Rendered/PDF/State0and0trends0of0carbon0pricing02015.pdf.
Kroeber, A.R., 2016, February 9, Should we worry about China’s economy?,
http://www.brookings.edu/research/opinions/2016/02/09-worry-about-chinese-economy-kroeber.
Lecarpentier, A., 2015, December 4, Current trends & prospects for natural gas, CEDIGAZ, the International
Association for Natural Gas, http://www.cedigaz.org/documents/2015/PresAB2015.pdf.
Lelyveld, M., 2015a, April 6, Doubts rise on Russia-China gas deal, Radio Free Asia,
http://www.rfa.org/english/commentaries/energy_watch/doubts-rise-on-russia-china-gas-deal-
04062015110032.html.
2015b, October 12, China lags on SOE reform goal, Radio Free Asia,
http://www.rfa.org/english/commentaries/energy_watch/china-lags-on-soe-reform-goal-
10122015104354.html.
2015c, November 11, China’s smokestack industries seek support, Radio Free Asia,
http://www.rfa.org/english/commentaries/energy_watch/chinas-smokestack-industries-seek-support-
11162015105855.html.
2015d, December 28, China pipelines sold far below cost, Radio Free Asia,
http://www.rfa.org/english/commentaries/energy_watch/pipelines-12282015104204.html.
2016a, January 11, China conflicted over coal-fired power, Radio Free Asia,
http://www.rfa.org/english/commentaries/energy_watch/conflicted-
01112016123527.html?searchterm:utf8:ustring=lelyveld.
2016b, January 25, China-Russia project stalls as energy prices plunge, Radio Free Asia,
http://www.rfa.org/english/commentaries/energy_watch/china-russia-01252016152633.html.
2016c, February 1, China sets floor for fuel prices, Radio Free Asia,
http://www.rfa.org/english/commentaries/energy_watch/china-sets-floor-for-fuel-prices-
02012016110332.html.
2016d, February 29, China natural gas market stalls as prices fall, Radio Free Asia,
http://www.rfa.org/english/commentaries/energy_watch/china-gas-
02292016135758.html?searchterm:utf8:ustring=china+energy.
https://csis-prod.s3.amazonaws.com/s3fs-public/publication/160328_Johnson_PresidentXiJinping_Web.pdf
https://csis-prod.s3.amazonaws.com/s3fs-public/publication/160328_Johnson_PresidentXiJinping_Web.pdf
https://csis-prod.s3.amazonaws.com/s3fs-public/publication/160521_Kennedy_PerfectingChinaInc_Web.pdf

April 2017, BEG/CEE China/India Gas Demand, Page 105
2016e, April 25, China struggles as oil losses climb, Radio Free Asia,
http://www.rfa.org/english/commentaries/energy_watch/china-struggles-as-oil-losses-climb-
04252016103856.html?searchterm:utf8:ustring=china+energy.
2016f, May 9, China may stall on steel and coal plans, Radio Free Asia,
http://www.rfa.org/english/commentaries/energy_watch/china-may-stall-on-steel-and-coal-plans-
05092016110823.html?searchterm:utf8:ustring=china+energy.
Leung, J., 2016, January 5, China to add 7 mil mt/year aluminum smelting capacity in 2016, but usage depends on
power costs, S&P Global Platts, http://www.platts.com/latest-news/metals/hongkong/china-to-add-7-
mil-mtyear-aluminum-smelting-capacity-27108165.
Li, X., 2015, November, Natural gas in China: a regional analysis, Oxford Institute for Energy Studies, OIES Paper:
NG 103, https://www.oxfordenergy.org/wpcms/wp-content/uploads/2015/11/NG-103.pdf.
Li & Fung Research Centre, 2010, June, Update on industrial clusters in China (2010), Industrial Cluster Series, Issue
6, http://www.funggroup.com/eng/knowledge/research/LFIndustrial6.pdf.
Lian, R., Stanway, D., 2015, October 28, Things are about to get even worse for Chinese steel,
http://www.businessinsider.com/r-china-steel-industry-expected-to-be-forced-into-deeper-output-cuts-
2015-10.
Liu, Z., 2013, Electric Power and Energy in China, John Wiley & Sons, Singapore.
Livemint, 2016, February 1, GAIL plans to import ethane from US for $5 billion petrochem plant,
http://www.livemint.com/Industry/y11e8bzz9FUug6G3YX00NO/GAIL-plans-to-import-ethane-from-US-
for-5-billion-petrochem.html.
Li, X., 2015, November, Natural gas in China: a regional analysis, OIES Paper: NG 103, Oxford Institute for Energy
Studies, https://www.oxfordenergy.org/wpcms/wp-content/uploads/2015/11/NG-103.pdf.
2015, January, Decarbonizing China’s power system with wind power: the past and the future, OIES Paper:
EL 11, https://www.oxfordenergy.org/wpcms/wp-content/uploads/2015/01/EL-11.pdf.
LNG World News, 2016, August 1, China boosts LNG imports, http://www.lngworldnews.com/china-boosts-lng-
imports/.
Magnier, M., 2016, March 1, Chinese factories start year in slumber as demand ebbs, The Wall Street Journal,
http://www.wsj.com/articles/as-chinas-economy-slows-the-worlds-factory-takes-a-break-1456851826.
2016, March 8, China’s exports tumble amid broad slowdown, The Wall Street Journal,
http://www.wsj.com/articles/chinas-exports-tumble-amid-broad-slowdown-1457412946.
Fung, E., 2016, March 24, China promises corporate tax cuts to support economic shift to services, The Wall Street
Journal, http://www.wsj.com/articles/china-promises-corporate-tax-cuts-to-support-economic-shift-to-
services-1458804737.
2016, March 3, China begins to tackle its ‘zombie’ factory problem, The Wall Street Journal,
http://www.wsj.com/articles/china-readies-plan-to-confront-its-zombie-problem-1457024868.
2016, January 19, As growth slows, China highlights transition from manufacturing to service, The Wall
Street Journal, http://www.wsj.com/articles/as-growth-slows-china-highlights-transition-from-
manufacturing-to-service-1453221751.
Mallet, V., 2016, April 5, India trims interest rates amid economic headwinds, Financial Times,
http://www.ft.com/intl/cms/s/0/bb0223f8-fb02-11e5-b3f6-11d5706b613b.html#axzz4C3Qvklfh.
Mann, D., Narayanan, C., Oh, K.B., Wang, B.R., 2016, Asia leverage-after the boom, Standard Chartered Bank,
https://www.sc.com/BeyondBorders/wp-content/uploads/2016/04/2016-04-01-BeyondBorders-Report-
Asia-leverage.pdf.
Mathews, A., 2016, April 26, India’s scrap steel imports rise sharply in January, Scrap Monster,
https://www.scrapmonster.com/news/indias-scrap-steel-imports-rise-sharply-in-january/1/62764.
Mazneva, E., Arkhipov, I., Baraulina, A., 2016, June 19, Putin said to weigh $11 billion Rosneft sale to China, India,
Bloomberg News, http://www.bloomberg.com/news/articles/2016-06-19/putin-said-to-weigh-11-billion-
rosneft-sale-to-china-and-india.
April 2017, BEG/CEE China/India Gas Demand, Page 106
Meidan, M., 2016, June, China’s 13th Five-Year Plan: Implications for oil markets, Oxford Energy Comment, Oxford
Institute for Energy Studies, https://www.oxfordenergy.org/wpcms/wp-
content/uploads/2016/06/Chinas-13th-Five-Year-Plan-Implications-for-Oil-Markets.pdf.
2016, May, The structure of China’s oil industry: past trends and future prospects, OIES Paper: WPM 66,
Oxford Institute for Energy Studies, https://www.oxfordenergy.org/wpcms/wp-
content/uploads/2016/05/The-structure-of-Chinas-oil-industry-past-trends-and-future-prospects-WPM-
66.pdf.
2016, August 19, China targets gas pipeline costs as part of move to more market-based prices, Energy
Aspects, https://www.energyaspects.com/publications/view/china-targets-gas-pipeline-costs-as-part-of-
move-to-more-market-based-price-2016-08-19.
2016, August 17, China’s latest guidelines will slow the pace of refinery expansions but will fail to cut
overcapacity, Energy Aspects, https://www.energyaspects.com/publications/view/china-s-latest-
guidelines-will-slow-the-pace-of-refinery-expansions-but-wil-2016-08-17.
Meidan, M., Sen, A., Campbell, R., 2015, February, China: the ‘new normal’, Oxford Energy Comment, Oxford
Institute for Energy Studies, https://www.oxfordenergy.org/wpcms/wp-content/uploads/2015/02/China-
the-new-normal.pdf.
Mikhaiel, N., Khemka, P., Nexant Resources, 2016, September 28, Outlook: India natural gas and fertilizer sector,
http://www.nexant.com/resources/outlook-india-natural-gas-and-fertilizer-sector.
Ministry of External Affairs India, Monthly Economic Bulletins,
http://www.indembkwt.org/Monthly%20Economic%20Bulletin%20%20February%202016.pdf.
Ministry of Petroleum and Natural Gas (MOPNG) India, 2014-15. Indian Petroleum and Natural Gas Statistics 2014-
15; http://www.petroleum.nic.in/docs/pngstat.pdf.
Ministry of Power India, 2016, June 13, Power sector at a glance ALL INDIA,
http://powermin.nic.in/content/power-sector-glance-all-india.
1995, October 9, Policy for captive and co-generation plants, http://powermin.nic.in/content/policy-
captive-and-co-generation-plants.
Ministry of Steel India, 2015, July 8, An overview of the steel sector, http://steel.gov.in/overview.htm.
Mecon Limited, 2015, July, Infrastructure study report for 300 MT steel by 2025,
http://steel.gov.in/MECON_Complete%20Infra%20Report%20for%20300MT%20Steel%20by%202015_7Ju
l15.pdf.
2013, March 4, Indian saga of steel, http://steel.gov.in/Indian%20Saga%20of%20Steel.pdf
Ministry of Urban Development, 2015, June, Smart Cities: Mission Statement and Guidelines,
http://smartcities.gov.in/writereaddata/smartcityguidelines.pdf.
Mistry, H., 2014, September, India to outweigh Chinese polyolefin demand growth over the next ten years, Special
Report: Petrochemicals, Platts,
http://www.platts.com/IM.Platts.Content/InsightAnalysis/IndustrySolutionPapers/sr-india-china-
polyolefins-0914.pdf.
Moody’s Investors Service, 2016a, February 1, Inside China,
http://www.moodys.com/viewresearchdoc.aspx?docid=PBC_187245 and
http://www.moodys.com/chinarebalancing and http://www.moodys.com/chinarebalancing,
https://www.chinadialogue.net/blog/9163-Doubts-pile-up-about-UK-s-Hinkley-nuclear-plant/en
2016b, March 2, Moody’s changes outlook on China’s Aa3 government bond rating to negative from
stable: affirms Aa3 rating, https://www.moodys.com/research/Moodys-changes-outlook-on-Chinas-Aa3-
government-bond-rating-to--PR_343931.
2016c, March 8, China credit: conflicts between policy objectives raise risk that momentum on reform will
slow, https://www.moodys.com/researchdocumentcontentpage.aspx?docid=PBC_1018631.
2016d, April 1, Chinese overcapacity sectors: financial pressure tests implicit local government support,
https://www.moodys.com/researchdocumentcontentpage.aspx?docid=PBC_1021905.

April 2017, BEG/CEE China/India Gas Demand, Page 107
2016e, April 28, Moody’s April 2016 issue of Inside China says China’s policy stimulus does not address
structural challenges, https://www.moodys.com/research/Moodys-April-2016-issue-of-Inside-China-says-
Chinas-policy--PR_347887.
2016f, May 26, Authorities have tools to avert financial crisis, but erosion of credit quality likely,
https://www.moodys.com/researchdocumentcontentpage.aspx?docid=PBC_1022458.
2016g, May 26, Chinese banks’ resumption of nonperforming loan securitizations is credit positive,
https://www.moodys.com/researchdocumentcontentpage.aspx?docid=PBC_190116.
Morawietz, M., Gotpagar, J., Sarathy, V., Ratta, V., 2015, Industry perspectives: 2015 chemicals trends, Strategy
and PWC, http://www.strategyand.pwc.com/perspectives/2015-chemicals-trends.
Mukherji, B., Miller, J.W., Yap, C.W., 2015a, March 15, Why Chinese steel exports are stirring protests, The Wall
Street Journal, http://www.wsj.com/articles/why-chinese-steel-exports-are-stirring-protests-1426466068.
Mukherji, B., Miller, J.W., Yap, C.W., 2015b, November 10, Rising Chinese production keeps lid on aluminum prices,
The Wall Street Journal, http://www.wsj.com/articles/rising-chinese-production-keeps-lid-on-aluminum-
prices-1447186082.
Mundy, S., 2016, May 8, India takes steps to overhaul creaking bankruptcy code, Financial Times,
http://www.ft.com/intl/cms/s/0/3b144ede-14e1-11e6-b8d5-4c1fcdbe169f.html#axzz4C3Qvklfh.
National Bureau of Statistics China, 2016, Statistical Data, http://www.stats.gov.cn/english/.
2016, February 29, Statistical Communique of the People’s Republic of China on the 2015 National
Economic and Social Development,
http://www.stats.gov.cn/english/PressRelease/201602/t20160229_1324019.html.
2016, January 19, Industrial Production Operation in December 2015,
http://www.stats.gov.cn/english/PressRelease/201601/t20160119_1306463.html.
2016, January 27, Industrial Profits Decreased in 2015,
http://www.stats.gov.cn/english/PressRelease/201601/t20160127_1311169.html.
2016, June 2, China’s PMI was 50.1 Percent in May,
http://www.stats.gov.cn/english/PressRelease/201606/t20160602_1363625.html.
2016, January 19, Private Investment in Fixed Assets for 2015,
http://www.stats.gov.cn/english/PressRelease/201601/t20160119_1306489.html.
2016, January 19, Investment in Fixed Assets for 2015,
http://www.stats.gov.cn/english/PressRelease/201601/t20160119_1306487.html.
2016, June 9, Consumption of Natural Gas, http://data.stats.gov.cn/english/easyquery.htm?cn=C01.
2016, June 9, Consumption of Coal, http://data.stats.gov.cn/english/easyquery.htm?cn=C01.
2016, June 9, Consumption of Total Energy, http://data.stats.gov.cn/english/easyquery.htm?cn=C01.
2016, June 9, Consumption of Electricity, http://data.stats.gov.cn/english/easyquery.htm?cn=C01.
2016, June 9, Natural Gas Balance Sheet, http://data.stats.gov.cn/english/easyquery.htm?cn=C01.
2016, June 9, National Government Revenue and Expenditure,
http://data.stats.gov.cn/english/easyquery.htm?cn=C01.
2016, June 9, Ratio of Central and Local Governments Expenditure,
http://data.stats.gov.cn/english/easyquery.htm?cn=C01.
2016, June 9, Output of Industrial Products, http://data.stats.gov.cn/english/easyquery.htm?cn=C01.
2016, June 9, Consumption of Major Energy Products by Province,
http://data.stats.gov.cn/english/easyquery.htm?cn=E0103.
2016, June 9, Supply of Natural Gas in Cities, http://data.stats.gov.cn/english/easyquery.htm?cn=E0103.
2016, June 9, Production of Major Energy Products by Province,
http://data.stats.gov.cn/english/easyquery.htm?cn=E0103.
2016, June 9, Supply of Gas in Cities, http://data.stats.gov.cn/english/easyquery.htm?cn=E0103.
2016, June 9, China Regional Economic Development 2013,
http://data.stats.gov.cn/english/swf.htm?m=turnto&id=3.

April 2017, BEG/CEE China/India Gas Demand, Page 108
Natti, S., 2014, November 9, Increased power cost leads industry to opt for captive power plants, The New Indian
Express, http://www.newindianexpress.com/business/news/Increased-Power-Cost-Leads-Industry-To-
Opt-For-Captive-Power-Plants/2014/11/09/article2514065.ece.
The New York Times, Editorial Board, 2016, June 9, China should shut down zombie businesses to help the
economy, The New York Times, http://www.nytimes.com/2016/06/09/opinion/china-should-shut-down-
zombie-businesses-to-help-the-economy.html?_r=1.
Ng, E., 2015, December 13, No pain, no gain, for China steel sector wallowing in glut, South China Morning Post,
http://www.scmp.com/business/companies/article/1889257/no-pain-no-gain-china-steel-sector-
wallowing-glut.
2015, November 30, China’s green power producers to be given sales priority as market forces given
larger sway over prices, South China Morning Post,
http://www.scmp.com/business/companies/article/1885207/chinas-green-power-producers-be-given-
sales-priority-market.
2016, June 12, Chinese power producers face multi-year profit down-cycle amid excesses and market
reform, South China Morning Post, http://www.scmp.com/business/companies/article/1973784/chinese-
power-producers-face-multi-year-profit-down-cycle-amid.
2016, May 2, Husky and Primeline legal threats against CNOOC put spotlight on mainland China gas
pricing dilemma, South China Morning Post,
http://www.scmp.com/business/commodities/article/1940529/husky-and-primeline-legal-threats-
against-cnooc-put-spotlight.
2016, March 23, PetroChina annual profit slips 67 percent on weaker oil prices, South China Morning Post,
http://www.scmp.com/business/article/1929868/petrochina-annual-profit-slips-67-cent-weaker-oil-
prices.
2016, April 20, Chinese gas distributors pummeled by surprise Zhejiang price cap, South China Morning
Post, http://www.scmp.com/business/companies/article/1937330/chinese-gas-distributors-pummelled-
surprise-zhejiang-price-cap.
Ng, J., 2016, January 18, World’s biggest steel industry shrinks for first time since 1991, Bloomberg News,
http://www.bloomberg.com/news/articles/2016-01-19/world-s-biggest-steel-industry-shrinks-for-first-
time-since-1991.
NGVA Europe, 2015, July 8, Air pollution policies spark NGV market in China, https://www.ngva.eu/air-pollution-
policies-spark-ngv-market-in-china.
The Oil & Gas Year, 2015, March 24, Market forces: the growth of the private sector in India’s downstream,
Interview, http://www.theoilandgasyear.com/interviews/market-forces-the-growth-of-the-private-sector-
in-indias-downstream/.
OGJ Editors, 2015, August 3, Minister: GAIL ‘running behind schedule’ on three pipeline projects, Oil & Gas Journal,
http://www.ogj.com/articles/2015/08/minister-gail-running-behind-schedule-on-three-pipeline-
projects.html.
Orr, G., 2014, October 17, Where next for China’s chemical industry?, Gordon’s View Blog, Greater China,
McKinsey&Company, http://www.mckinseychina.com/where-next-for-chinas-chemical-industry/.
O’Rourke, R., 2016, June 17, China Naval Modernization, Congressional Research Service,
https://fas.org/sgp/crs/row/RL33153.pdf
Oxford Energy Forum, 2015, February, Energy in India, Issue 99, Oxford Institute for Energy Studies,
https://www.oxfordenergy.org/wpcms/wp-content/uploads/2015/03/OEF-99.pdf.
Paltsev, S., Zhang, D., 2015, July, Natural gas pricing reform in China: getting closer to a market system?, Report
No. 282, Tsinghua-MIT China Energy & Climate Project,
http://globalchange.mit.edu/files/document/MITJPSPGC_Reprint_15-9.pdf.

April 2017, BEG/CEE China/India Gas Demand, Page 109
Pandit, V., 2015, February, Private equity in India: once overestimated, now underserved, McKinsey&Company,
http://www.mckinsey.com/industries/private-equity-and-principal-investors/our-insights/private-equity-
in-india.
Pandit, V., Tamhane, T., Kapur, R., 2015, June, Indian private equity: route to resurgence, McKinsey&Company,
http://www.mckinsey.com/business-functions/strategy-and-corporate-finance/our-insights/private-
equity-and-indias-economic-development.
Pang, P., Behravesh, N., Potter T., 2016, October 25, “Slowing economy means mixed outlook for Asia’s chemical
industry, IHS says,” Engineering 360, IEEE GlobalSpec,
http://insights.globalspec.com/article/1626/slowing-economy-means-mixed-outlook-for-asia-s-chemical-
industry-ihs-says.
Pargal, S., Banerjee, S.G., 2014, More power to India: the challenge of electricity distribution, World Bank, Energy
and Mining, 88906,
https://openknowledge.worldbank.org/bitstream/handle/10986/18726/889060PUB0978100Box385252B
00PUBLIC0.pdf?sequence=1.
PetroChina Company Limited, 2014, December 31, Form 20-F United States Securities and Exchange Commission,
http://www.petrochina.com.cn/ptr/ndbg/201504/545ec16ff32a44fb929bbabdd678e223/files/cf48cf818a
d942ce97de58335dfe831f.pdf.
Petroleum & Natural Gas Regulatory Board India, 2016, Data Bank: city gas distribution company sales; natural gas
pipelines operating and under construction; city gas distribution networks; maps,
http://www.pngrb.gov.in/data-bank.html.
2016, transportation tariff orders passed by the board, http://www.pngrb.gov.in/trans-tariff.html.
Petroleum Planning & Analysis Cell, Ministry of Petroleum & Natural Gas India, 2016, February, Ready reckoner:
snapshot of India’s oil & gas data, gas pipeline construction,
http://ppac.org.in/WriteReadData/Reports/201603200150232313586AbridgedRR-February2016.pdf.
2016, August, Historical and Current Trend of Natural Gas Consumption,
http://ppac.org.in/content/152_1_Consumption.aspx.
Petronet LNG Limited, 2015, October, Corporate Profile, http://www.petronetlng.com/PDF/USD-Corporate-
Presentation-Oct-2015.pdf.
Platts, Singapore, 2015, May 28, Analysis: China’s naphtha imports surge amid attractive margins for olefins,
aromatics, http://www.platts.com/latest-news/petrochemicals/singapore/analysis-chinas-naphtha-
imports-surge-amid-attractive-26103910.
PMIndia, 2015, May 13, Approval to comprehensive new urea policy 2015,
http://www.pmindia.gov.in/en/news_updates/approval-to-comprehensive-new-urea-policy-2015/.
Potter, N., 2016, January 11, Barclays Commodities Research, Cross Energy Focus, a China sneeze could give global
gas a cold.
Power Finance Corporation Ltd. (a Govt. of India Undertaking), 2015, July, The performance of state power utilities
for the years 2011-12 to 2013-14,
http://www.pfcindia.com/writereaddata/userfiles/file/Operations/state_performance/Report%20on%20t
he%20Performance%20of%20State%20Power%20Utilities%202011-12%20to%202013-14.pdf.
Prasad, E., 2016, June 19, Raghuram Rajan’s departure is huge setback for reform in India, Financial Times,
http://www.ft.com/intl/cms/s/0/c9719ae2-3606-11e6-a780-b48ed7b6126f.html#axzz4C3Qvklfh.
Press Trust of India, 2016, March 16, 1,600-Cr gas subsidy auction for 24 GW plants on March 15,
http://profit.ndtv.com/news/industries/article-rs-1-600-cr-gas-subsidy-auction-for-24-gw-plants-on-
march-15-1284435.
PRS Legislative Research, 2015, March 7, Coal Block Allocations and the 2015 Bill,
http://www.prsindia.org/theprsblog/?p=3487.

April 2017, BEG/CEE China/India Gas Demand, Page 110
PTI, Singapore, 2016, June 10, India’s leading gas importers benefiting from easing prices of LNG: Nomura report,
The Indian Express, http://indianexpress.com/article/business/market/indias-leading-gas-importers-
benefiting-from-easing-prices-of-lng-nomura-report-2845001/.
PTI, New Delhi, 2015, October 23, New urea plant at Ramagundam gets Centre’s green nod, The Economic Times,
http://economictimes.indiatimes.com/industry/indl-goods/svs/chem-/-fertilisers/new-urea-plant-at-
ramagundam-gets-centres-green-nod/articleshow/49503816.cms.
Ratner, M., Nelson, G.M., Lawrence, S.V., 2016, May 2, China’s natural gas: uncertainty for markets, Congressional
Research Service, https://www.fas.org/sgp/crs/row/R44483.pdf.
Ravishankar, S., 2016, February 21, What bogged down a Rs 3,000-crore GAIL pipeline project in Tamil Nadu, The
Economic Times, http://economictimes.indiatimes.com/industry/energy/oil-gas/what-bogged-down-a-rs-
3000-crore-gail-pipeline-project-in-tamil-nadu/articleshow/51070472.cms.
Reklev, S., 2016, April 13, Analysis: Provincial preparations, speed bumps ahead of China’s national ETS, Carbon
Pulse, http://carbon-pulse.com/18338/.
2015, September 8, China’s national carbon price expected to debut at $6, survey finds, Carbon Pulse,
http://carbon-pulse.com/8615/.
Reuters, Mumbai, 2016, June 14, India teams up with South Korea, Japan for better LNG deal, The Indian Express,
http://indianexpress.com/article/business/economy/india-teams-up-with-south-korea-japan-for-better-
lng-deal-2853144/.
New Delhi, 2016, May 6, India to gradually move to gas-based economy: Pradhan, The Hindu Business
Line, http://www.thehindubusinessline.com/economy/policy/india-to-gradually-move-to-gasbased-
economy-pradhan/article8566160.ece.
2016, January 17, China’s 2015 power consumption up .5 pct year-on-year,
http://www.reuters.com/article/china-power-consumption-idUSL3N15104C.
Rossow, R.M., 2015, May 5, Trade and investment policies in India, 2014-2015, Statement before the U.S.
International Trade Commission Investigation No. 332-550, Center for Strategic and International Studies,
https://www.csis.org/analysis/trade-and-investment-policies-india-2014-2015.
2016, May, Modi’s first 24: an international perspective on economic reform, U.S.-India Insight, Center for
Strategic & International Studies, https://csis-prod.s3.amazonaws.com/s3fs-
public/publication/160517_USIndiaInsight_May.pdf.
2016, February 19, India’s changing states, Commentary, Center for Strategic & International Studies,
https://www.csis.org/analysis/india%E2%80%99s-changing-states.
Russell, C., 2015, July 30, Asia LNG output vs. regas capacity mismatch looming, Reuters, United Kingdom Edition,
http://uk.reuters.com/article/column-russell-lng-asia-idUKL3N10A1AK20150730.
2016, February 8, India’s fading oil product exports contrast with China’s boom, Reuters,
http://www.reuters.com/article/us-column-russell-refining-india-idUSKCN0VH1K2.
2016, February 29, LNG needs new pricing, rules to realize its golden age, Reuters,
http://www.reuters.com/article/us-column-russell-lng-asia-idUSKCN0W2174.
S & P Capital IQ, 2016, March 14, Global Credit Portal, India’s new oil and gas policies could improve transparency
and investments in the sector,
https://www.globalcreditportal.com/ratingsdirect/renderArticle.do?articleId=1596015&SctArtId=383471
&from=CM&nsl_code=LIME&sourceObjectId=9560934&sourceRevId=1&fee_ind=N&exp_date=20260414-
15:11:56.
Saikia, S. P., 2015, June 3, Gas gridlocked as cost deters industrial users, The Financial Express,
http://www.financialexpress.com/article/economy/gas-gridlocked-as-cost-deters-industrial-users/79501.
Seligsohn, D., Hsu, A., 2016, March 10, How China’s 13th Five Year Plan addresses energy and the environment,
ChinaFile, https://www.chinafile.com/reporting-opinion/environment/how-chinas-13th-five-year-plan-
addresses-energy-and-environment.

April 2017, BEG/CEE China/India Gas Demand, Page 111
Sen, A., 2015, April, Gas pricing reform in India: implications for the Indian gas landscape, OIES Paper: NG 96,
Oxford Institute for Energy Studies, https://www.oxfordenergy.org/wpcms/wp-
content/uploads/2015/04/NG-96.pdf.
2015, August, Gas pricing reform in India: will it transform the gas landscape?, Oxford Energy Forum, Issue
101, p. 15-17, https://www.oxfordenergy.org/wpcms/wp-content/uploads/2015/09/OEF-101.pdf.
Shea, D.C., 2014, May 21, China’s Energy Engagement with Central Asia and Implications for the United States, US-
China Economic and Security Review Commission,
http://origin.www.uscc.gov/sites/default/files/Shea_Testimony--
China%E2%80%99s%20Energy%20Engagement%20with%20Central%20Asia%20and%20Implications%20f
or%20the%20United%20States_0.pdf.
Shepherd, C., 2016, August 19, China provinces fall short on coal and steel capacity cuts, Financial Times,
http://www.ft.com/cms/s/0/c77f33ac-65e0-11e6-a08a-
c7ac04ef00aa.html?siteedition=intl#recommended-h-957051472487994500
Shepherd, C., Mitchell, T., 2016a, February 1, China’s steel sector hit by losses, Financial Times,
http://www.ft.com/intl/cms/s/0/338b4394-c8aa-11e5-be0b-b7ece4e953a0.html#axzz4C3YqS76E.
Shepherd, C., Mitchell, T., Yang, Y., 2016b, March 28, China faces struggle to recast steel workers for service sector,
Financial Times, http://www.ft.com/cms/s/0/e5eb8716-f0c7-11e5-aff5-
19b4e253664a.html#axzz4CEN2vT5k.
Shepherd, C., Mitchell, T., 2016c, April 10, China says its steel overcapacity will remain, Financial Times,
http://www.ft.com/intl/cms/s/0/e62e3722-fee2-11e5-ac98-3c15a1aa2e62.html#axzz4C3YqS76E.
Shepherd, C., Mitchell, T., 2016d, May 16, China steel mills fire up as prices flare, Financial Times,
http://www.ft.com/cms/s/0/485c4a1e-1749-11e6-b197-a4af20d5575e.html#axzz4CEN2vT5k.
Sikorski, T., Tertzakian, A., 2016, August 26, Global LNG fundamentals, Energy Aspects,
https://www.energyaspects.com/publications/view/2016-08-26-fundamentals
2016, August 31, Hard times: global LNG outlook, Energy Aspects,
https://www.energyaspects.com/publications/view/2016-08-31-hard-times.
Skeer, J., Wang, Y., 2005, May 17, Carbon charges and natural gas use in China, Energy Policy 34, 2006, 2251-2262,
http://uscec.wvu.edu/wp-content/uploads/2013/03/Carbon-charge-and-power-industry-in-China.pdf.
South China Morning Post, 2015, March 30, Mainland China city gas distributor ENN upbeat on gas sales despite
price-led slowdown, http://www.scmp.com/business/companies/article/1751027/mainland-china-city-
gas-distributor-enn-upbeat-gas-sales-outlook.
Southerland, M., Koch-Weser, I. and Zhang, A., 2014, December 22, China-India Relations, US-China Economic and
Security Review Commission,
http://origin.www.uscc.gov/sites/default/files/Research/Staff%20Report_China-India%20Relations--
Tensions%20Persist%20Despite%20Growing%20Cooperation_12%2022%202014.pdf.
Spegele, B, Miller, J.W., 2016, May 9, China continues to prop up its ailing factories, adding to global glut, The Wall
Street Journal, http://www.wsj.com/articles/chinese-exports-surge-amid-overcapacity-at-home-
1462746980.
2016, May 31, China’s coal plant binge deepens overcapacity woes, The Wall Street Journal,
http://www.wsj.com/articles/chinas-coal-plant-binge-deepens-overcapacity-woes-1464692337
Sponge Iron Manufacturers Association India, 2015-16, Statistics, http://www.spongeironindia.in/prodfig06-
07.html.
2015, October, DRI Update, http://www.spongeironindia.in/DRI%20UPDATE%20-
%20October,%202015.pdf.
Stacey, K., 2017, February 2, India eyes merger of state-controlled oil and gas groups, Financial Times,
https://www.ft.com/content/18d1fd5a-e914-11e6-893c-082c54a7f539.
Standard & Poor’s Ratings Services, 2015, April 13, India forges ahead on the path of government and economic
reforms.

April 2017, BEG/CEE China/India Gas Demand, Page 112
2016, April, India credit spotlight,
http://images.ratingsinfo.standardandpoors.com/Web/StandardPoorsRatings/160427_India-Credit-
Spotlight_April%202016.pdf?sp_mid=68173&sp_rid=2075391&elq=ec4133a486a14bcab913841f243a2ec
8.
SteelBenchmarker Report 249. 2016, August 22, Hot Rolled Band Price January 2001-August 2016 for USA, China,
Western Europe and World Export, http://steelbenchmarker.com/files/history.pdf.
Stocking, A., Dinan, T., 2015, June, China’s growing energy demand: implications for the United States,
Congressional Budget Office, Working Paper 2015-05, https://www.cbo.gov/sites/default/files/114th-
congress-2015-2016/workingpaper/50216-China_1.pdf.
Stratas Advisors, 2016, March 17, Increased conversion to natural gas vehicles in Asia,
https://stratasadvisors.com/~/media/.../NaturalGasaFuelAsia-031716.pdf?la=en.
Stratfor, 2016, June 1, The story of steel in China, https://www.stratfor.com/analysis/story-steel-china.
Strumpf, D., 2016, August 15, China’s coal-market reforms fuel rebound in prices,” The Wall Street Journal,
http://www.wsj.com/articles/chinas-coal-market-reforms-fuel-rebound-in-prices-1470654404.
Taraphdar, T., Yadav, P., Prasad, M.K.E., 2012, July, Natural gas fuels the integration of refining and
petrochemicals, Digital Refining,
http://www.digitalrefining.com/article/1000557,Natural_gas_fuels_the_integration_of_refining_and_pet
rochemicals_.html#.V2bhC6IY0pk.
Tata, S., 2017, January 14, Deconstructing China’s Energy Security Strategy, The Diplomat,
http://thediplomat.com/2017/01/deconstructing-chinas-energy-security-strategy/.
Trading Economics, Government Debt to GDP, http://www.tradingeconomics.com/china/government-debt-to-gdp.
United Nations, World Urbanization Prospects, 2014 Revision,
https://esa.un.org/unpd/wup/Publications/Files/WUP2014-Highlights.pdf.
U.S. Energy Information Administration, May 2016, International Energy Outlook 2016,
http://www.eia.gov/forecasts/ieo/.
2016, June 14, India: international energy data and analysis,
https://www.eia.gov/beta/international/analysis.cfm?iso=IND.
2015, May 14, China: international energy data and analysis,
http://www.eia.gov/beta/international/analysis_includes/countries_long/China/china.pdf.
2015, August 25, India’s coal industry in flux as government sets ambitious coal production targets,
http://www.eia.gov/todayinenergy/detail.cfm?id=22652.
U.S. News & World Report, 2016, March 6, Chinese finance minister says budget deficit widening to prevent slide in
growth, support economic reforms, http://www.usnews.com/news/business/articles/2016-03-
06/chinese-finance-minister-deficit-widening-to-support-growth.
Verma, N., 2015, October 20, India’s ONGC targets $10-$12 billion foreign oil and gas investments, Reuters,
http://www.reuters.com/article/us-commodities-summit-india-ongc-idUSKCN0SE0UR20151020
Viswanathan, P., 2015, May 15, New challenges for petrochemical players in China, The Barrel, S&P Global, Platts,
http://blogs.platts.com/2015/05/15/new-challenges-for-petrochemical-china/.
Wang, T., Lin, B., 2014, February, China’s natural gas consumption and subsidies-from a sector perspective, Energy
Policy, Volume 65, pp.541-551.
Wei, L., 2016, March 7, China to shift debt burden in tax overhaul, The Wall Street Journal,
http://www.wsj.com/articles/china-to-revise-tax-regulations-1457358027.
Wildau, G., Cadman, E., Yang, Y., Kavanagh, L., 2016, The Chinese economy at a glance, Financial Times,
https://ig.ft.com/sites/numbers/economies/china.
2016, March 1, China’s state-owned zombie economy, Financial Times,
http://www.ft.com/cms/s/0/253d7eb0-ca6c-11e5-84df-70594b99fc47.html#axzz4CEN2vT5k.

April 2017, BEG/CEE China/India Gas Demand, Page 113
Wind Energy and Electric Vehicle Review, 2015, December 24, China to cut on-grid tariffs for solar energy, wind
power, http://www.evwind.es/2015/12/24/china-to-cut-on-grid-tariffs-for-solar-energy-wind-
power/55051.
Wong, E., 2016, July 13, China pledged to curb coal plants. Greenpeace says it’s still adding them, The New York
Times, http://www.nytimes.com/2016/07/14/world/asia/china-coal-power-greenpeace.html.
World Bank, 2016, June, Global Economic Prospects, http://www.worldbank.org/en/publication/global-economic-
prospects.
World Bank, 2016, World Development Indicators, http://databank.worldbank.org/data/reports.aspx?source=wdi-
database-archives-(beta).
World Bank Commodities Price Forecast (nominal US dollars), 2016, October 19,
http://pubdocs.worldbank.org/en/229461476804662086/CMO-October-2016-Forecasts.pdf.
Wu, W., 2016, June 14, IMF official urges China to take urgent action to address ‘rising vulnerabilities’, South China
Morning Post, http://www.scmp.com/news/china/economy/article/1975027/imf-official-urges-china-
take-urgent-action-address-rising.
Xieli, L., 2015, April 30, LNG focus: the dilemma of dealing with Chinese LNG buyers, ICIS,
http://www.icis.com/press-releases/dilemma-of-dealing-with-chinese-lng-buyers/.
Xinhua, 2016, February 10, China’s natural gas consumption in 2015 hits lowest growth rate in 10 years,”
http://news.xinhuanet.com/2016-02/10/c_1118018340.htm.
Xinhua Finance Agency, 2016, January 27, China focus: china natural gas consumption growth to rally in 2016,
http://en.xinfinance.com/html/Industries/Energy/2016/191680.shtml.
2016, June 16, China’s renewable energy quota to ease curtailment in wind, solar power,
http://en.xinfinance.com/html/Industries/Utilities/2016/233108.shtml.
2016, March 4, China sets targets for local renewable energy use,
http://en.xinfinance.com/html/Industries/Energy/2016/201616.shtml.
2016, April 26, China raises retail fuel prices,
http://en.xinfinance.com/html/Industries/Energy/2016/217807.shtml.
2016, May 12, Hualong One reactor drives transformation of China’s manufacturing industry,
http://en.xinfinance.com/html/Industries/Utilities/2016/222304.shtml.
2016, May 17, China’s thermal power overcapacity likely to worsen: Fitch,
http://en.xinfinance.com/html/Industries/Utilities/2016/223679.shtml.
Yang, Y., 2016, February 29, China to shed 1.8m coal and steel jobs, Financial Times,
http://www.ft.com/cms/s/0/3a8dd2e0-deb4-11e5-b072-006d8d362ba3.html#axzz4CEN2vT5k.
Yap, C. W., Magnier, M., 2016, February 25, Debt loads swell at Chinese firms, The Wall Street Journal Europe,
http://www.pressreader.com/belgium/the-wall-street-journal-europe/20160225/282144995419119.
2016, March 15, China warns officials: no unrest, or lose your job, The Wall Street Journal,
http://blogs.wsj.com/chinarealtime/2016/03/25/china-warns-officials-no-unrest-or-lose-your-job/.
Yu, F., 2016, August 8, China’s natural gas gamble won’t replicate US shale success, Epoch Times,
http://www.theepochtimes.com/n3/2133356-chinas-natural-gas-gamble/.
Zacks Equity Research, 2016, May 24, Steel Industry Stock Outlook-May 2016,
https://www.zacks.com/commentary/81506/steel-industry-stock-outlook---may-2016.

April 2017, BEG/CEE China/India Gas Demand, Page 114
APPENDIX 1 - MAPS
The following maps provide details on locations of domestic natural gas supply and consumption and
key infrastructure components.

April 2017, BEG/CEE China/India Gas Demand, Page 115
Figure 45. Map of China Natural Gas Features

April 2017, BEG/CEE China/India Gas Demand, Page 116
Figure 46. China’s Natural Gas and Electric Power Value Chain

April 2017, BEG/CEE China/India Gas Demand, Page 117
Figure 47. Map of India Natural Gas Features
April 2017, BEG/CEE China/India Gas Demand, Page 118
APPENDIX 2 – HISTORICAL AND FORECAST DATA
IMPLICATIONS FOR AND FROM OUR RESEARCH FOR OUTLOOKS
In order to understand the drivers of future natural gas demand in China and India we analyzed
historical gas use by consuming sector end use: industrial/manufacturing by industry; electric power;
residential/commercial; and transport. Our analysis was complicated by sector consumption
categorization differences among data reporters (NBSC in China and MOPNG in India; U.S. EIA and the
IEA both use Chinese and Indian government data but with definitional changes). These variations in
category and definition in turn lead to differences and anomalies in forecast data. The major
dissimilarities lie in reported gas consumption by the industrial sector, a key gas consumer in both
countries. We revised the reported historical categorizations for this sector as detailed below in order to
make the historical consumption data more comparable among reporters and to gain insights into the
gas use by the major individual industrial segments. Although there are data differences among
reporters with respect to gas use by the other consuming sectors, these are not as significant as the
differences in the industrial gas use data. Thus, we did not revise those estimates nor did we revise
reported country natural gas use data.
Having made adjustments to reported historical categorizations of the industrial sector for both
countries, what can we say about industrial demand in China and India? The industrial sector is the
largest gas consumer in both countries accounting for 50% (China) and 52% (India) of total 2014 gas use.
However, coal is a formidable competitor to gas in the industrial sectors of both countries accounting for
72% (China) and 50% (India) of total sector energy use in 2014.
The composition of the two countries’ gas-consuming industrial sectors are quite different. In 2014
China’s chemicals industry accounted for 34% of total industrial gas use followed by “other industrial”
(25%); energy sector use for oil and gas extraction (17%); refining (15%); steel (5%); and non-ferrous
metals (4%). China’s “other industrial” category includes non-metallic minerals and non-energy intensive
manufacturing businesses such as wholesale and retail trade, electronics, transport equipment and
metals manufacturing, among others. As China transitions to a services-led economy, energy use
(including gas use) in the energy-intensive chemicals, refining, steel, non-ferrous metals and non-
metallic minerals industries could decrease, especially given that these industries are burdened with
massive overcapacity, a point emphasized in our analysis. The chemicals segment is expected to grow
but gas use there is limited by the growth in coal and methanol-to-olefins technologies. These decreases
in energy-intensive industrial gas demand could be offset, to some degree, by gas demand growth in the
non-energy intensive manufacturing (although it is difficult to predict the pace and extent of that
growth). Erosion of demand for natural gas with efficiency improvements in Chinese industry could also
supplanted by gas use for electric power generation, achieving overall net growth in natural gas
consumption. The preceding analysis sections detail the challenges for gas in that sector.
In India industrial sector gas consumption is dominated by the urea fertilizer industry at 61% of total
sector gas use in 2014. The agriculture sector is still very important to the Indian economy and employs
over 50% of the eligible voting population. India has a goal of self-sufficiency in urea production and the
government thus far has been willing to support the industry with large subsidies. However, growth in
fertilizer gas use is problematic due high uncertainty regarding new capacity additions in an industry
that needs major subsidy support to survive.
April 2017, BEG/CEE China/India Gas Demand, Page 119
The Indian fertilizer sector is followed by the refining and petrochemical sectors at 19% and 12%,
respectively, of total industrial gas use. If growth in energy-intensive manufacturing accelerates from
current levels, total industrial sector energy use could increase. However, new capacity in the refining
and petrochemical industries is unlikely in the near term limiting gas demand growth. In addition, as in
China, gas use is expected to be tempered by growth in industrial sector coal use.
Discrepancies in Historical Data Series
Timeliness and transparency of energy data is an ongoing challenge in research and decision making.
Neither one of these large emerging markets, nor many others, much less smaller countries produces
and sustains clear and reliable data streams on many measures that could be of great benefit to
researchers, planners, investors, suppliers and customers. In recent years, some improvements to data
transparency have been made largely as a result of encouragement or outright pressure from
multilateral organizations and capital markets. The Joint Organization Data Initiative (JODI) has provided
an umbrella for numerous entities to report on oil and gas supply and use with consistent definitions.
The JODI effort has yielded the most definitive results for oil and oil products. Data streams on natural
gas and especially electric power remain pitifully short of what is needed. Our observations and findings
in this paper point to a number of concerns about how natural gas supply and demand are widely
interpreted to be evolving in China and India. It is challenging even in the most developed markets to
parse natural gas and electric power systems across myriad and highly interconnected segments.
Without better, more open information, not only on energy value chains and costs but also on
underlying economic structures and performance, we can have little confidence in conventional
understandings and established views about energy systems in crucial markets.
On a total gas consumption basis, the historical Chinese data reported by the NBSC, the BP Statistical
Review of World Energy, and the EIA are fairly consistent. The IEA is about 9% lower than the others.
The historical Indian total gas consumption data is reasonably consistent among all reporters.
Table 22. China Total Gas Consumption
(BCM) 2010 2011 2012 2013 2014 2015
NBSC 107 131 146 171 186 NA
BP SR 16 111 137 151 172 188 197
IEA WEO 15 Gas Balance 98 122 137 156
EIA IEO 16 137 148 Sources: NBSC, BP SR 16, IEA WEO 15 Gas Balance, EIA IEO 16.
Table 23. India Total Gas Consumption
(BCM) 2011 2012 2013 2014 2015
MOPNG 61 54 49 47
BP SR 16 62 58 50 51 51
IEA WEO 15 Gas Balance 61 54 49
EIA IEO 16 67 62 Sources: MOPNG, BP SR 16, IEA WEO 15 Gas Balance, EIA IEO 16.
The historical sector data reported by China and India’s government agencies (the NBSC and MOPNG,
respectively), the IEA and the EIA categorize sector gas consumption differently. The largest differences

April 2017, BEG/CEE China/India Gas Demand, Page 120
are in reported gas consumption by the industrial sector.253 We re-categorized the reported information
to make the industrial sectors more comparable among the data reporters. Total gas consumption by all
sectors remains unchanged. The original and revised categories are summarized in Figure 48 below.
Figure 48. China Historical Industrial Gas Demand as Reported and Revised (BCM)
Note: *As revised by CEE. Sources: NBSC, EIA IEO 2016, IEA WEO 2015254, IEA Gas Balances data provided to CEE.
In addition, there are time differences among the reported historical sector gas demand data series. As
of this writing, China’s NBSC has sector gas demand for each calendar year 2005 to 2014. India’s MOPNG
has sector gas demand that includes LNG imports for each fiscal year (April 1-March 31) 2011-12 to
2014-15. MOPNG sector gas demand data prior to 2011-12 does not include LNG consumption. The
most recent IEA World Energy Outlook (2015) has sector gas demand for 2010-2013 and the most recent
EIA International Energy Outlook (2016) reports sector gas demand for only 2011 and 2012.
The NBSC and IEA do not include energy sector own gas use in the industrial sector gas consumption;
the EIA does include energy sector own gas use as industrial demand. The NBSC puts 94% of energy
sector own use in the mining category and the IEA reports it in the “other energy sector” total energy
use. We added back energy sector own use to the industrial category for NBSC and IEA. The EIA includes
agriculture and mining gas use as industrial gas demand; the IEA and NBSC report those sectors
separately. The NBSC and EIA include chemical sub-sector non-energy gas use in the industrial sector but
the IEA does not: we added back chemical sub-sector non-energy gas use to the IEA industrial sector and
removed it from other. There are still relatively minor differences among the data reporters but there
253 In China, the NBSC defines industrial gas use as the sum of manufacturing and power generation gas use. In this paper, power gas use is not part of industrial gas use and is analyzed separately. 254 Based on the Gas Balances data used in the WEO 2015 as provided by the IEA to CEE. All IEA historical gas demand data in this section is based on the Gas Balances data.
0 20 40 60 80 100
2010
2011
2012
2013
2014
BCM
*IEA WEO 2015 IEA WEO 2015 *EIA IEO 2016 EIA IEO 2016 *NBSC NBSC
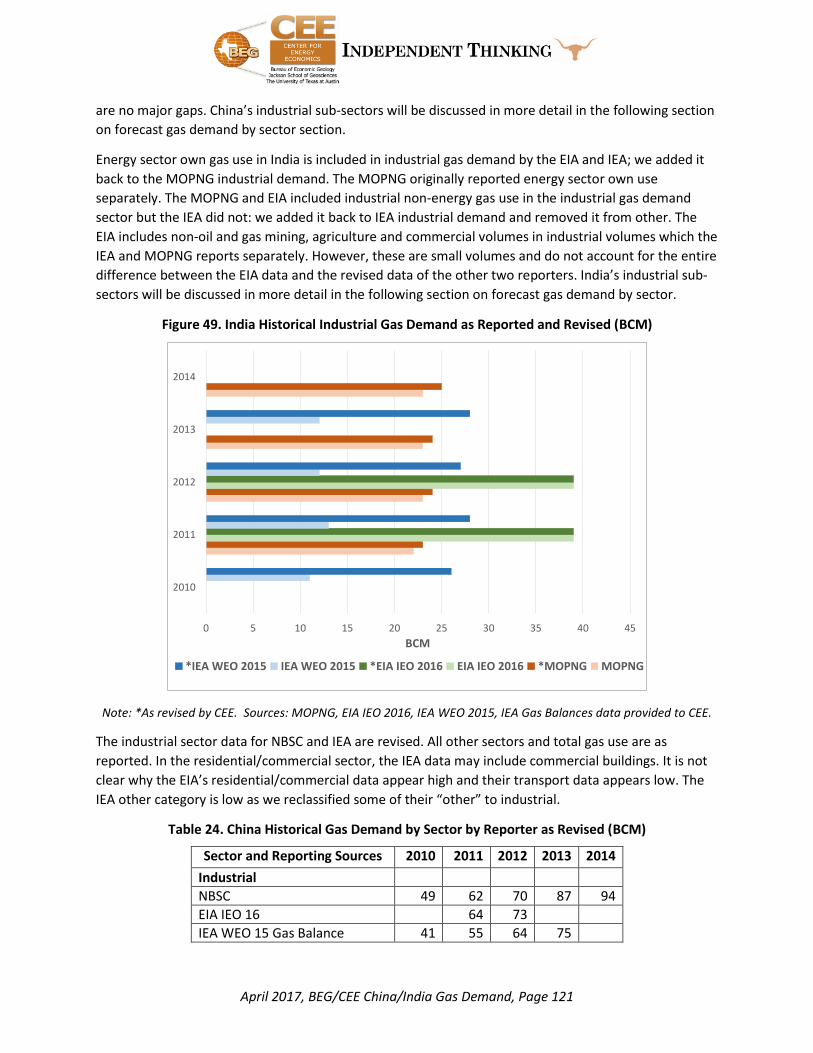
April 2017, BEG/CEE China/India Gas Demand, Page 121
are no major gaps. China’s industrial sub-sectors will be discussed in more detail in the following section
on forecast gas demand by sector section.
Energy sector own gas use in India is included in industrial gas demand by the EIA and IEA; we added it
back to the MOPNG industrial demand. The MOPNG originally reported energy sector own use
separately. The MOPNG and EIA included industrial non-energy gas use in the industrial gas demand
sector but the IEA did not: we added it back to IEA industrial demand and removed it from other. The
EIA includes non-oil and gas mining, agriculture and commercial volumes in industrial volumes which the
IEA and MOPNG reports separately. However, these are small volumes and do not account for the entire
difference between the EIA data and the revised data of the other two reporters. India’s industrial sub-
sectors will be discussed in more detail in the following section on forecast gas demand by sector.
Figure 49. India Historical Industrial Gas Demand as Reported and Revised (BCM)
Note: *As revised by CEE. Sources: MOPNG, EIA IEO 2016, IEA WEO 2015, IEA Gas Balances data provided to CEE.
The industrial sector data for NBSC and IEA are revised. All other sectors and total gas use are as
reported. In the residential/commercial sector, the IEA data may include commercial buildings. It is not
clear why the EIA’s residential/commercial data appear high and their transport data appears low. The
IEA other category is low as we reclassified some of their “other” to industrial.
Table 24. China Historical Gas Demand by Sector by Reporter as Revised (BCM)
Sector and Reporting Sources 2010 2011 2012 2013 2014
Industrial
NBSC 49 62 70 87 94
EIA IEO 16 64 73
IEA WEO 15 Gas Balance 41 55 64 75
0 5 10 15 20 25 30 35 40 45
2010
2011
2012
2013
2014
BCM
*IEA WEO 2015 IEA WEO 2015 *EIA IEO 2016 EIA IEO 2016 *MOPNG MOPNG
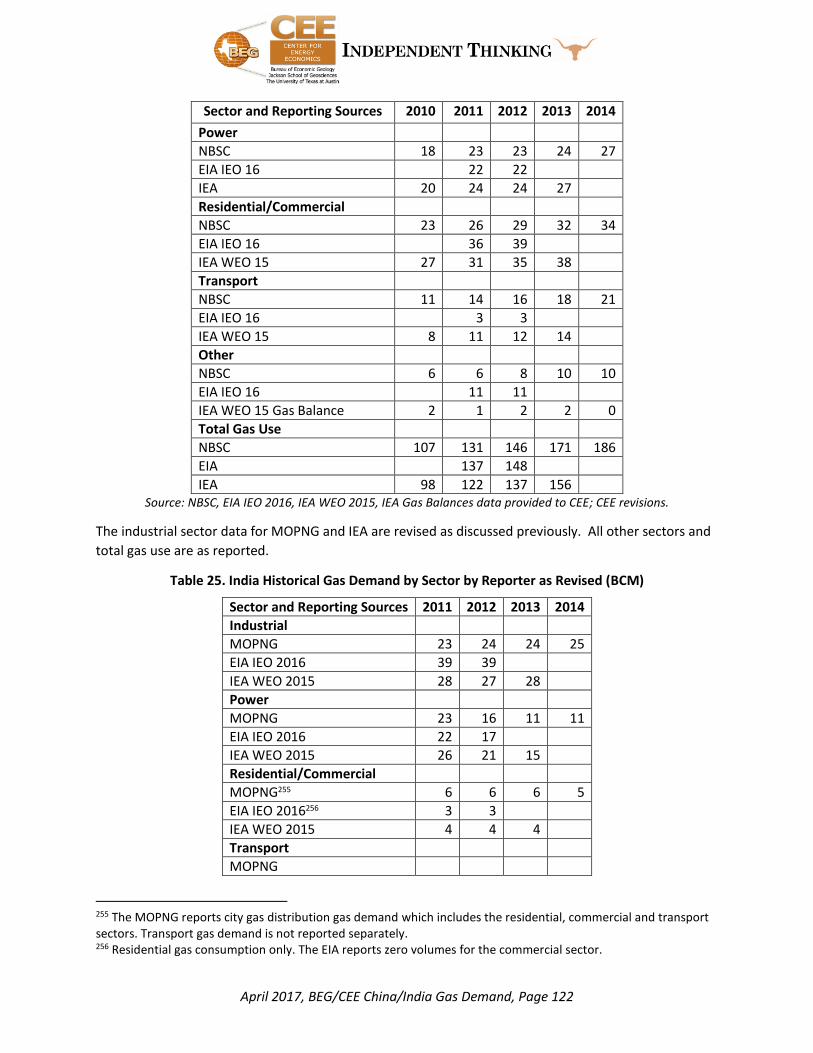
April 2017, BEG/CEE China/India Gas Demand, Page 122
Sector and Reporting Sources 2010 2011 2012 2013 2014
Power
NBSC 18 23 23 24 27
EIA IEO 16 22 22
IEA 20 24 24 27
Residential/Commercial
NBSC 23 26 29 32 34
EIA IEO 16 36 39
IEA WEO 15 27 31 35 38
Transport
NBSC 11 14 16 18 21
EIA IEO 16 3 3
IEA WEO 15 8 11 12 14
Other
NBSC 6 6 8 10 10
EIA IEO 16 11 11
IEA WEO 15 Gas Balance 2 1 2 2 0
Total Gas Use
NBSC 107 131 146 171 186
EIA 137 148
IEA 98 122 137 156 Source: NBSC, EIA IEO 2016, IEA WEO 2015, IEA Gas Balances data provided to CEE; CEE revisions.
The industrial sector data for MOPNG and IEA are revised as discussed previously. All other sectors and
total gas use are as reported.
Table 25. India Historical Gas Demand by Sector by Reporter as Revised (BCM)
Sector and Reporting Sources 2011 2012 2013 2014
Industrial
MOPNG 23 24 24 25
EIA IEO 2016 39 39
IEA WEO 2015 28 27 28
Power
MOPNG 23 16 11 11
EIA IEO 2016 22 17
IEA WEO 2015 26 21 15
Residential/Commercial
MOPNG255 6 6 6 5
EIA IEO 2016256 3 3
IEA WEO 2015 4 4 4
Transport
MOPNG
255 The MOPNG reports city gas distribution gas demand which includes the residential, commercial and transport sectors. Transport gas demand is not reported separately. 256 Residential gas consumption only. The EIA reports zero volumes for the commercial sector.
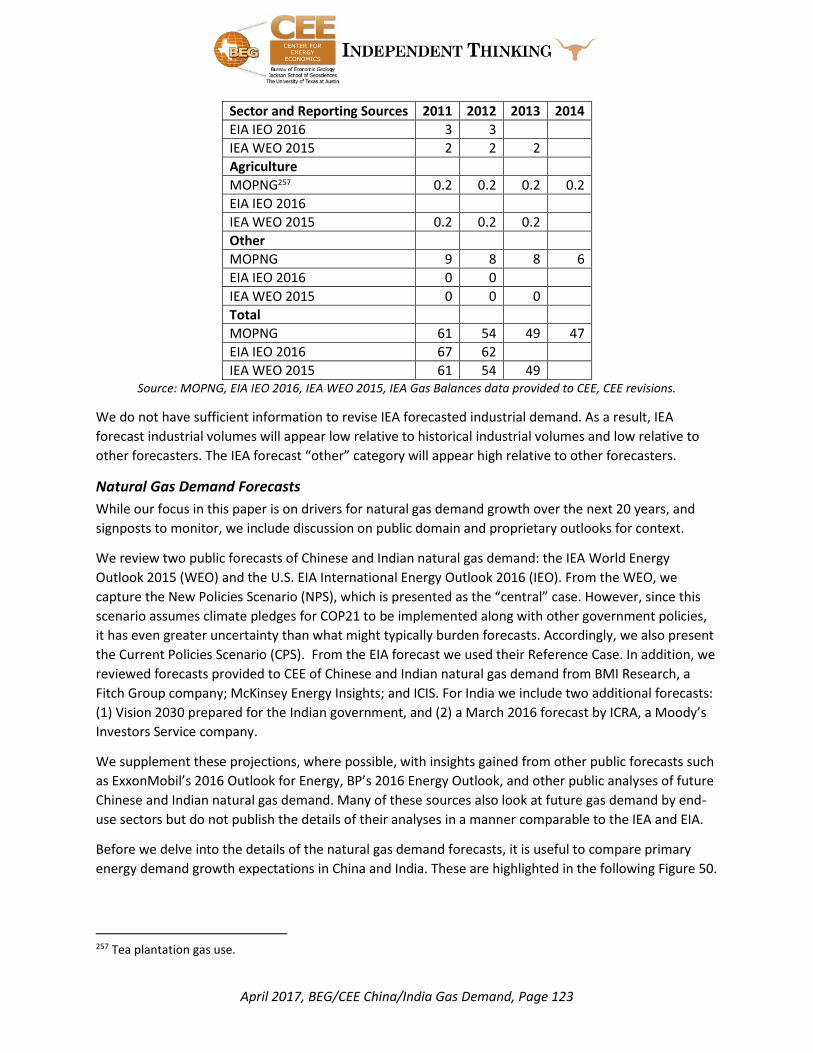
April 2017, BEG/CEE China/India Gas Demand, Page 123
Sector and Reporting Sources 2011 2012 2013 2014
EIA IEO 2016 3 3
IEA WEO 2015 2 2 2
Agriculture
MOPNG257 0.2 0.2 0.2 0.2
EIA IEO 2016
IEA WEO 2015 0.2 0.2 0.2
Other
MOPNG 9 8 8 6
EIA IEO 2016 0 0
IEA WEO 2015 0 0 0
Total
MOPNG 61 54 49 47
EIA IEO 2016 67 62
IEA WEO 2015 61 54 49 Source: MOPNG, EIA IEO 2016, IEA WEO 2015, IEA Gas Balances data provided to CEE, CEE revisions.
We do not have sufficient information to revise IEA forecasted industrial demand. As a result, IEA
forecast industrial volumes will appear low relative to historical industrial volumes and low relative to
other forecasters. The IEA forecast “other” category will appear high relative to other forecasters.
Natural Gas Demand Forecasts
While our focus in this paper is on drivers for natural gas demand growth over the next 20 years, and
signposts to monitor, we include discussion on public domain and proprietary outlooks for context.
We review two public forecasts of Chinese and Indian natural gas demand: the IEA World Energy
Outlook 2015 (WEO) and the U.S. EIA International Energy Outlook 2016 (IEO). From the WEO, we
capture the New Policies Scenario (NPS), which is presented as the “central” case. However, since this
scenario assumes climate pledges for COP21 to be implemented along with other government policies,
it has even greater uncertainty than what might typically burden forecasts. Accordingly, we also present
the Current Policies Scenario (CPS). From the EIA forecast we used their Reference Case. In addition, we
reviewed forecasts provided to CEE of Chinese and Indian natural gas demand from BMI Research, a
Fitch Group company; McKinsey Energy Insights; and ICIS. For India we include two additional forecasts:
(1) Vision 2030 prepared for the Indian government, and (2) a March 2016 forecast by ICRA, a Moody’s
Investors Service company.
We supplement these projections, where possible, with insights gained from other public forecasts such
as ExxonMobil’s 2016 Outlook for Energy, BP’s 2016 Energy Outlook, and other public analyses of future
Chinese and Indian natural gas demand. Many of these sources also look at future gas demand by end-
use sectors but do not publish the details of their analyses in a manner comparable to the IEA and EIA.
Before we delve into the details of the natural gas demand forecasts, it is useful to compare primary
energy demand growth expectations in China and India. These are highlighted in the following Figure 50.
257 Tea plantation gas use.

April 2017, BEG/CEE China/India Gas Demand, Page 124
Figure 50. Historical Primary Energy Demand Growth and Forecasts for China and India
Sources: as noted on charts and in text.
Table 26. Primary Energy Growth Rates for India, China
Year India (BP SR 2016) China (BP SR 2016) China (NBSC as of August 5, 2016)
2006 5.2 9.7 9.6
2007 8.8 8.7 8.7
2008 5.7 3.8 3.2
2009 8.3 4.5 4.7
2010 5.0 7.1 7.4
2011 4.4 8.1 7.2
2012 6.1 4.0 3.9
2013 4.4 3.9 3.7
2014 6.4 2.3 2.2
2015 5.2 1.5 0.9
Source: NBSC, total consumption of energy and its composition,
http://data.stats.gov.cn/english/tablequery.htm?code=AC0H.
Sources for figures and table: National Bureau of Statistics China and BP Statistical Review of World Energy 2016 for actuals, ExxonMobil 2016 Outlook for Energy (EM); Energy Information Administration International Energy Outlook 2016 (EIA); International Energy Agency World Energy Outlook 2015 New Policies scenario (IEA NP) and Current Policies scenario (IEA CP); BP 2016 Statistical Review/Energy Outlook (BP SR); and CEDIGAZ Medium and
Long Term Energy Outlook 2015.
Most forecasters expect primary energy consumption growth to slow down in China (Figure 50) as the
country emerges from a period of rapid and large industrialization and evolves into a more services-
dominated economy. The average of all forecasts is 2.3% in 2016, declining to 2% by 2020 and falling to
1.6% by 2025. Primary energy demand growth forecasts for India cover a wider range than those for
China. However, on average, India’s energy consumption is expected to flatten out and decline.
Given the vagaries of data to underpin projections, much less rapidly shifting paradigms on economic
growth and performance, it is no surprise that forecasts can be subject to substantial revision. This is
not to say that there is such a thing as an outlook that is not subject to change. The issue resides more
in the confidence intervals around inputs and assumptions. The less reliable the inputs, the less reliable
the outputs, with wider envelopes of potential error. As a simple illustration we built a longitudinal
0%
1%
2%
3%
4%
5%
6%
7%
8%
9%
10% China
Actual IEA NP IEA CP EIA EM BP CEDIGAZ AVERAGE
0%
1%
2%
3%
4%
5%
6%
7%
8%
9%
10%India
Actual IEA NP IEA CP EIA AVERAGE

April 2017, BEG/CEE China/India Gas Demand, Page 125
evaluation of IEA World Energy Outlook views on natural gas demand in the two countries. By
comparing different outlooks over time for one public reporting entity, we can better assess the extent
of variability. We can also deduce something about the degree of uncertainty within the reporting
entity. The charts in Figure 51 and Figure 52 provide these comparisons. These are not intended, in any
way, to serve as a critique but rather to point to inherent complexities. Of the two countries, outlooks
for China appear much more certain. However, in our analysis we point to a number of considerations,
such as industrial over-capacity and the impact of that inefficiency on China’s fiscal balances. If
addressed, the picture could be altered substantially. By comparison, and rightly, outlooks on India are
much more variable. If anything, we suspect that confidence intervals around future Indian natural gas
demand might be even more fragile than suggested by our depiction. A key implication in our work is
that confidence intervals can only be improved with better information on the fundamental
components of natural gas use. For that to happen, extensive improvements in data quality and
reporting timeliness will be required.
Figure 51. IEA WEO Outlooks on China Natural Gas Demand
Figure 52. IEA WEO Outlooks on India Natural Gas Demand
Comparative forecasts of natural gas demand for China’s major end use sectors follow in Table 27.
These provide a range of viewpoints regarding possible futures.
0
100
200
300
400
500
600
700
19
90
19
91
19
92
19
93
19
94
19
95
19
96
19
97
19
98
19
99
20
00
20
01
20
02
20
03
20
04
20
05
20
06
20
07
20
08
20
09
20
10
20
11
20
12
20
13
20
14
20
15
Est
.
20
20
20
25
20
30
20
35
20
40
BC
M
IEA Historical
2004
2007
2010
2012 "Golden Age"
2014
2016
-200
-100
0
100
200
300
400
500
600
700
19
90
19
91
19
92
19
93
19
94
19
95
19
96
19
97
19
98
19
99
20
00
20
01
20
02
20
03
20
04
20
05
20
06
20
07
20
08
20
09
20
10
20
11
20
12
20
13
20
14
20
15
20
20
20
25
20
30
20
35
20
40
BC
M
Axis Title
2016 20152014 20132012 20112010 20092008 20072006 20052004 EIA HistoricalIEA Historical
WEO Publication Year (each color stack represents increment added to/subtracted from previous outlook):
0
20
40
60
80
100
120
140
160
180
200
2004 2005 2006 2007 2008 2009 2010 2011 2012 2013 2014 2015 2020 2025 2030 2035 2040
BC
M
BPSR Historical
IEA Historical
2004
2006
2009
2010
2015
2016
32 36 37 40 4251
61 6258
50 51 51
-100
-50
0
50
100
150
200
250
19
90
19
91
19
92
19
93
19
94
19
95
19
96
19
97
19
98
19
99
20
00
20
01
20
02
20
03
20
04
20
05
20
06
20
07
20
08
20
09
20
10
20
11
20
12
20
13
20
14
20
15
20
20
20
25
20
30
20
35
20
40
BC
M
2016 20152014 20132012 20112010 20092008 20072006 20052004 BPSR HistoricalIEA Historical
WEO Publication Year (each color stack represents increment added to/subtracted from previous outlook):

April 2017, BEG/CEE China/India Gas Demand, Page 126
Table 27. China Forecast Comparisons BCM258
2016 2017 2018 2019 2020 2025 2030
Industrial
IEA NPS 75 102 124
IEA CPS 78 132
EIA Ref 126 168 212.8
McKinsey 103 122 140 158
ICIS 101 108 119 130 139
Power
IEA NPS 72 103 131
IEA CPS 71 122
EIA Ref 56 109 134
McKinsey 45 80 134 199
ICIS 36 41 47 55 62
Res/Comm
IEA NPS 69 84 101
IEA CPS 71 110
EIA Ref 73 92 118
McKinsey 54 72 92 109
ICIS 61 67 71 75 82
Transport
IEA NPS 19 23 28
IEA CPS 15 14 18
EIA Ref 11 22 45
McKinsey 22 31 44 63
ICIS
Other
IEA NPS 44 39 31
IEA CPS 44 25
EIA Ref 0 3 2
McKinsey 0 0 0 0
ICIS 0 0 0 0 0 0 0
Total
IEA NPS 280 352 416
IEA CPS 279 407
EIA Ref 266 395 512
BMI 204 223 245 265 288 358
McKinsey 224 305 410 529
ICIS 198 216 237 260 283
Sources: IEA WEO 15, EIA IEO 16, Energy Insights McKinsey 2016; ICIS China gas demand 2016.
258 Forecast sources: (1) BMI Research, 2016, April, China Oil & Gas Report Q3 2016; (2) Energy Insights, 2016, June, Asia gas outlook to 2030, McKinsey Solutions; (3) ICIS, 2016, A snapshot of China’s natural gas demand 2016-2020; (4) IEA WEO 2015, NPS and CPS scenarios; (5) EIA IEO 2016 Reference Case.

April 2017, BEG/CEE China/India Gas Demand, Page 127
China consumed 99 BCM of natural gas in the first half of 2016 due to lower gas prices domestically and
internationally. If that level is sustained in data for the second half of 2016, gas consumption is on track
to reach 200 BCM for 2016 which is the consensus forecast level of BMI, McKinsey and ICIS. The 2020
forecasts are all in the same ballpark of a little less than 300 BCM with McKinsey on the high side.
Forecasts begin to diverge in 2025 continuing in 2030 with IEA low (350-416 BCM) and McKinsey (410-
529 BCM) and EIA (395-512 BCM) high. EIA is very bullish on industrial and residential/commercial gas
consumption. [With respect to industrial use, the reader should recall that EIA has the broadest
definition of industrial demand including energy sector own use and non-energy industrial use which is
in “other” for IEA. As a result, the “other” sector gas consumption in the IEA forecasts range from 25 to
44 BCM compared to zero in the other forecasts.] EIA has a 3% p.a. growth rate for Chinese steel
production despite the severe overcapacity situation. Bulk chemicals production grows at 5% p.a. in the
EIA forecast as reducing dependence on commodity chemical imports remains a government goal.
Although EIA expects the coal share of China’s chemical feedstock fuel use to increase from 20% in 2012
to 32% in 2040 due to its use in ethylene production, EIA staff expect gas use as a feedstock for
methanol and ammonia production to increase over the forecast period. Currently coal is used as a
feedstock for 70% of ammonia production and 80% of methanol production. The EIA expects the
following factors to restrain growth in coal for feedstock use due to: high capital costs for coal-to-olefin
(CTO) plants; fewer valuable coproducts in the CTO process; high CO2 emissions from CTO—more than
twice that of a naphtha steam cracker; CTO is water intensive and CTO plants are or will be in water-
stressed areas in Inner Mongolia and western China. The EIA expects China to be the world’s largest
residential energy consumer by 2040 driven by urbanization. Gas use in the residential sector grows
faster than electricity use although electricity will account for 42% of residential sector energy use by
2040.
McKinsey expects industrial gas demand to grow at a CAGR of 3.1% from 2016 to 2030. Gas use as a
feedstock in chemical production is expected to “stabilize” with growth in industrial gas use coming
from fuel switching from coal and heavy oil under environmental pressure from local governments and
“economics favoring LPG switching to gas in the long run.” McKinsey is very bullish on gas use in the
power sector (CAGR 2016-30 of 11.13%) due to the introduction of a carbon cap and trade system
although they acknowledge that “diversification to renewables in the power mix has higher priority for
the government.” McKinsey expects strong growth (CAGR of 7.92% 2016-2030) in gas use in the
transport sector due to strong government support for NGVs, mainly for public transportation. Vehicle
oil to gas switching in the short term, however, is restrained by low oil and oil product prices.
Residential/commercial gas demand grows at a 5.17% CAGR as a result of increasing urbanization and
rising household incomes.
ICIS expects slower gas demand growth in the short term due to the NDRC’s current gas pricing
mechanism and sluggish Chinese economy but increasing at an 8.9% CAGR from 2016 to 2020. Power
sector gas use will increase from 18% of total gas use in 2016 to 22% in 2020. Chemical feedstock gas
use will decline from 13% of total gas use in 2016 to 9% in 2020 due to a government preference for
coal. Industrial sector (not including chemical feedstock) gas use will increase slightly from 38% of total
gas use in 2016 to 40% in 2020. City gas distribution (residential, commercial and transport) gas use will
decline from 32% of total gas use in 2016 to 29% in 2020.

April 2017, BEG/CEE China/India Gas Demand, Page 128
BMI Research expects the Chinese government to implement its policy to increase the natural gas share
of the primary energy mix from 6% to 10% by 2020. Total gas demand will grow at a 7% CAGR 7% from
2016 to 2025. Current lower prices increase natural gas increases competitiveness with alternatives
which, together with government pressure, encourages fuel switching to gas. Like McKinsey, BMI
expects a carbon cap and trade system to boost natural gas demand post-2017. Downside risks to the
BMI forecast include cost competitive coal especially in the power sector. Non-hydro renewables and
nuclear have higher shares of total generation in 2020 and 2025 (Table 28.
Table 28. BMI Research China Generation Fuel Sources259
2014 2020 2025
Coal Generation % Total Generation 72% 62% 54%
Natural Gas Generation % Total Generation 1.5% 3% 5.4%
Nuclear Generation % Total Generation 2.3% 4.6% 7.6%
Non-Hydro Renewables Generation % Total Generation 4.7% 8.3% 9.6% Source: BMI Research, 2016, March, China Power Report Q2 2016.
The IEA NPS260 WEO15 asserts that “the case for gas use in China is a strong one.” The most important
driver is “the need to improve urban air quality.” Reduction in air pollution and the need for more
flexible peaking capacity drive growth in power sector gas demand with gas generation increasing from
2% of total generation in 2013 to 8% in 2040. Power gas use could be limited by cheap coal, relatively
expensive natural gas import prices, and alternate ways of achieving power sector flexibility such as
electricity storage and demand side management and government policy support for renewables. IEA
expects total renewables generation as a percent of total generation to increase from 4% in 2013 to 17%
by 2040 due to government policy support. Industrial demand will increase due to continued economic
expansion and coal-to-gas and oil-to-gas substitution although steel production is expected to decline
30% by 2020. Demand for natural gas for transport use grows due to oil-to-gas substitution. The need
for environmentally friendly residential heating in large parts of China and the expansion of CGD
infrastructure will grow residential gas demand. Gas use as a percentage of total primary energy use
increases from 5% in 2013 to 11% by 2040.
On a total gas use basis, there is not much difference between the IEA WEO NPS and CPS demand
scenarios (Table 29. Industrial and residential/commercial gas use are slighly higher in CPS as a result of
limited pollution and climate change policies. Power sector gas use is slightly lower in CPS and transport
gas use is significantly lower in CPS without policies to support NGVs.
259 BMI Research, 2016, March, China Power Report Q2 2016. 260 The IEA New Policies Scenario (NPS) incorporates current policies and measures that affect energy markets as well as announced but not implemented policies such as the Intended Nationally Determined Contributions (INDCs) submitted by national governments in October 2015 to combat climate change. It also includes announced but yet to be implemented programs supporting renewables and improved energy efficiency, carbon pricing, alternative transport fuels, energy subsidy reforms and the introduction, expansion or phase-out of nuclear power. Oil, natural gas and OECD steam coal imports prices through 2020 are almost the same in the NPS and CPS scenarios but CPS prices are about 15% than NPS prices by 2030 and 2040. See Table 29.
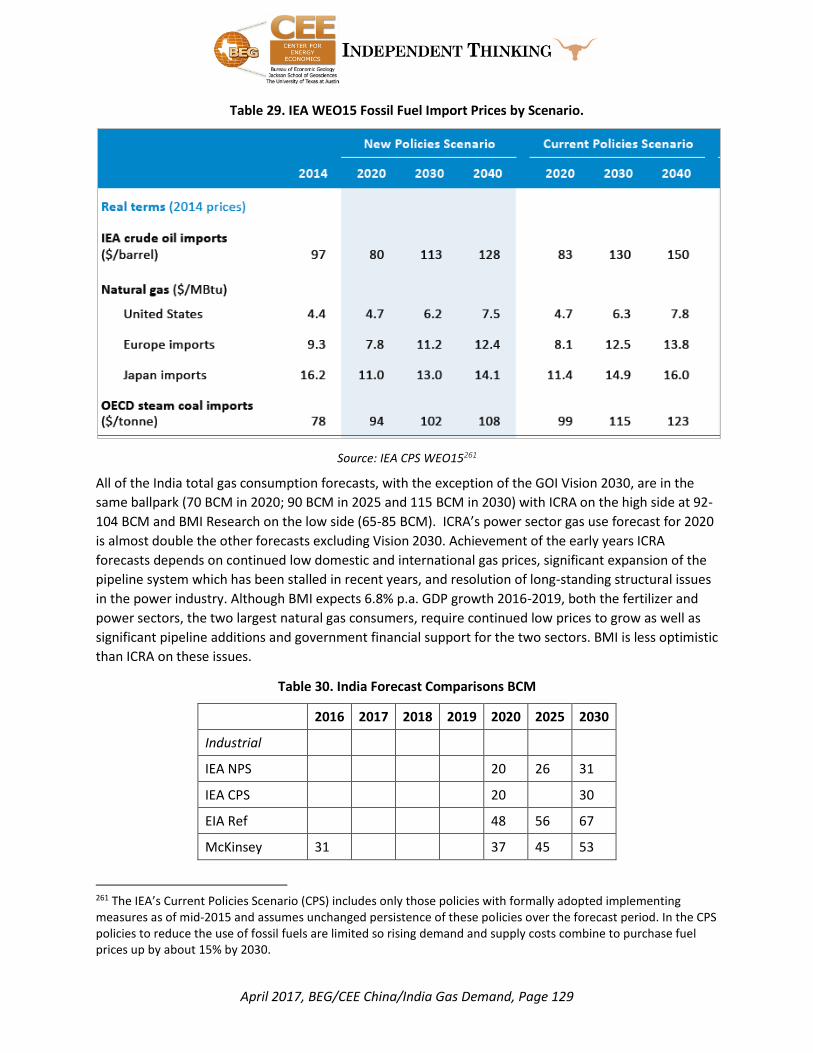
April 2017, BEG/CEE China/India Gas Demand, Page 129
Table 29. IEA WEO15 Fossil Fuel Import Prices by Scenario.
Source: IEA CPS WEO15261
All of the India total gas consumption forecasts, with the exception of the GOI Vision 2030, are in the
same ballpark (70 BCM in 2020; 90 BCM in 2025 and 115 BCM in 2030) with ICRA on the high side at 92-
104 BCM and BMI Research on the low side (65-85 BCM). ICRA’s power sector gas use forecast for 2020
is almost double the other forecasts excluding Vision 2030. Achievement of the early years ICRA
forecasts depends on continued low domestic and international gas prices, significant expansion of the
pipeline system which has been stalled in recent years, and resolution of long-standing structural issues
in the power industry. Although BMI expects 6.8% p.a. GDP growth 2016-2019, both the fertilizer and
power sectors, the two largest natural gas consumers, require continued low prices to grow as well as
significant pipeline additions and government financial support for the two sectors. BMI is less optimistic
than ICRA on these issues.
Table 30. India Forecast Comparisons BCM
2016 2017 2018 2019 2020 2025 2030
Industrial
IEA NPS 20 26 31
IEA CPS 20 30
EIA Ref 48 56 67
McKinsey 31 37 45 53
261 The IEA’s Current Policies Scenario (CPS) includes only those policies with formally adopted implementing measures as of mid-2015 and assumes unchanged persistence of these policies over the forecast period. In the CPS policies to reduce the use of fossil fuels are limited so rising demand and supply costs combine to purchase fuel prices up by about 15% by 2030.

April 2017, BEG/CEE China/India Gas Demand, Page 130
2016 2017 2018 2019 2020 2025 2030
ICRA 39 40 42 42 45 52
GOI Vision 2030 63 84 111
Power
IEA NPS 20 37 49
IEA CPS 22 54
EIA Ref 11 14 22
McKinsey 17 21 26 32
ICRA 39 39 39 39 39 39
GOI Vision 2030 58 80 129
Res/Comm
IEA NPS 6 6 7
IEA CPS 4 7
EIA Ref 3 6 8
McKinsey 8 11 17 23
ICRA 6 6 7 7 8 13
GOI Vision 2030 8 15 31
Transport
IEA NPS 1 2 4
IEA CPS 1 4
EIA Ref 6 8 17
McKinsey 2 3 3 5
ICRA
GOI Vision 2030
Sub-Total
IEA NPS 47 70 90
IEA CPS 47 0 95
EIA Ref 67 84 112
McKinsey 58 0 0 0 72 91 113
ICRA 84 86 88 88 92 104 0
GOI Vision 2030 0 0 0 0 129 179 271
Other
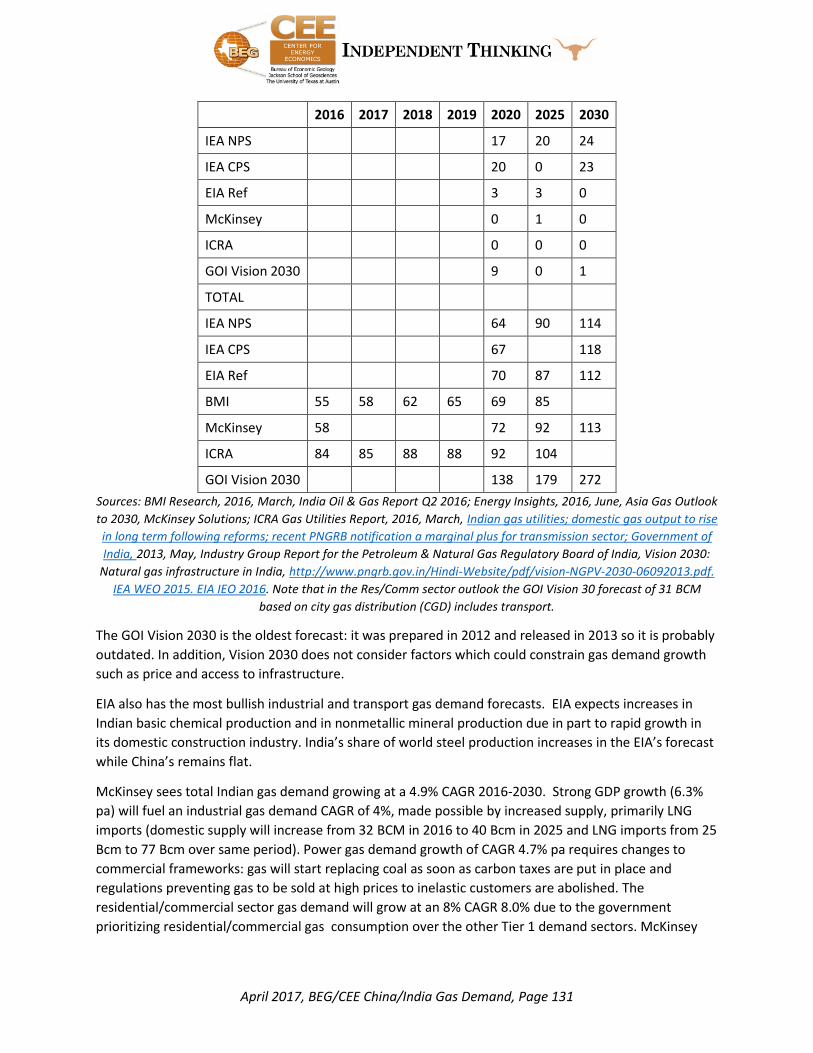
April 2017, BEG/CEE China/India Gas Demand, Page 131
2016 2017 2018 2019 2020 2025 2030
IEA NPS 17 20 24
IEA CPS 20 0 23
EIA Ref 3 3 0
McKinsey 0 1 0
ICRA 0 0 0
GOI Vision 2030 9 0 1
TOTAL
IEA NPS 64 90 114
IEA CPS 67 118
EIA Ref 70 87 112
BMI 55 58 62 65 69 85
McKinsey 58 72 92 113
ICRA 84 85 88 88 92 104
GOI Vision 2030 138 179 272
Sources: BMI Research, 2016, March, India Oil & Gas Report Q2 2016; Energy Insights, 2016, June, Asia Gas Outlook
to 2030, McKinsey Solutions; ICRA Gas Utilities Report, 2016, March, Indian gas utilities; domestic gas output to rise
in long term following reforms; recent PNGRB notification a marginal plus for transmission sector; Government of
India, 2013, May, Industry Group Report for the Petroleum & Natural Gas Regulatory Board of India, Vision 2030:
Natural gas infrastructure in India, http://www.pngrb.gov.in/Hindi-Website/pdf/vision-NGPV-2030-06092013.pdf.
IEA WEO 2015. EIA IEO 2016. Note that in the Res/Comm sector outlook the GOI Vision 30 forecast of 31 BCM
based on city gas distribution (CGD) includes transport.
The GOI Vision 2030 is the oldest forecast: it was prepared in 2012 and released in 2013 so it is probably
outdated. In addition, Vision 2030 does not consider factors which could constrain gas demand growth
such as price and access to infrastructure.
EIA also has the most bullish industrial and transport gas demand forecasts. EIA expects increases in
Indian basic chemical production and in nonmetallic mineral production due in part to rapid growth in
its domestic construction industry. India’s share of world steel production increases in the EIA’s forecast
while China’s remains flat.
McKinsey sees total Indian gas demand growing at a 4.9% CAGR 2016-2030. Strong GDP growth (6.3%
pa) will fuel an industrial gas demand CAGR of 4%, made possible by increased supply, primarily LNG
imports (domestic supply will increase from 32 BCM in 2016 to 40 Bcm in 2025 and LNG imports from 25
Bcm to 77 Bcm over same period). Power gas demand growth of CAGR 4.7% pa requires changes to
commercial frameworks: gas will start replacing coal as soon as carbon taxes are put in place and
regulations preventing gas to be sold at high prices to inelastic customers are abolished. The
residential/commercial sector gas demand will grow at an 8% CAGR 8.0% due to the government
prioritizing residential/commercial gas consumption over the other Tier 1 demand sectors. McKinsey

April 2017, BEG/CEE China/India Gas Demand, Page 132
assumes that the required CGD systems are constructed. Near term transport gas demand growth is
constrained by severe competition from alternative fuels, primarily currently cheap oil products.
BMI expects fertilizer gas demand to grow if current low gas prices persist. (India has some of the lowest
gas prices in Asia-Pacific compared to China, Thailand($11/MMBtu), Indonesia ($10.5/MMBtu) and the
Phillipines ($8.20/MMBtu). Power sector gas demand will grow if delivered gas prices are below $8-
$9/MMBtu; at higher prices, gas is economic for peaking only. Financial backing from the government
will be necessary given the limited ability of power producers to pass on cost increases to the consumer.
BMI’s gas demand growth forecast requires significant gas pipeline additions. Without the
infrastructure,forecast growth is not achieved. If LNG supply prices are tied to oil prices in the future and
oil prices exceed $75/bbl, it will be too expensive for Indian markets. Finally, commercial frameworks in
the gas and power industries need reform if market is to grow.
In its NPS, IEA does not expect a dramatic shift in the primary energy mix. Coal’s share of primary energy
use will increase from 44% to 49% in 2040. The increase in coal use will be split between power
generation (to feed an additional 265 GW of coal plants) and industry for iron, steel and cement. Shares
of oil and natural gas in the primary energy mix will “edge slightly higher.” Biomass use remains stable in
absolute terms but drops from 25% of the primary energy mix in 2013 to 11% in 2040. “Natural gas plays
a relatively minor role in the Indian energy mix in the NPS.” (IEA WEO 15, page 469). Gas will retain an
important role as fertilizer feedstock. The “relatively high price for gas does not allow it to displace other
forms of energy more rapidly.”
In the power sector, coal will continue to be the dominant generation fuel. Gas use will grow from 5% of
total generation energy use in 2013 to 9% in 2030 but its growth will be outstripped by the growth in
use of non-hydro renewables. By 2030 non-hydro renewables will account for 15% of total generation
compared to 5% in 2013. Wind and solar will account for 80% of the renewables generation use by 2030.
Table 31. IEA NPS India Power Sector Outlooks
India Generation Fuel262 Sources 2013 2020 2030
Coal Generation % Total Generation 73% 70% 60%
Gas Generation % Total Generation 5% 5% 9%
Nuclear Generation % Total Generation 3% 4% 6%
Non-Hydro Renewables Generation % Total Generation 5% 10% 15% Source: IEA WEO 2015.
The IEA expects that the commercial services sector energy use will be based primarily on electricity.
Gas use for cooking in urban areas will grow from around 1% of total energy use for cooking in 2013 to
around 15% in 2040. LPG will remain the dominant cooking fuel in urban areas: close to 70% of total
cooking energy use in 2013 and growing to 80% in 2040. In rural areas, there is almost zero use of gas
for cooking and that is not expected to change: biomass will predominate in rural areas and LPG cooking
use will grow from around 15% in 2013 to about 30% in 2040.
Coal use in the industrial sector will increase from 50% of total industrial energy use in 2013 to 56% in
2040. Gas use by industry will grow in absolute terms but its share of total industrial energy use will
decline held back by “subdued growth in domestic production, relatively high import prices and limited
262 BMI Research, 2016, March, India Power Report Q2 2016.

April 2017, BEG/CEE China/India Gas Demand, Page 133
distribution infrastructure” (IEA WEO15 page 478). Petrochemicals production relies heavily on domestic
naphtha from the domestic refining industry. Aluminum production will increase four-fold by 2040 but it
is electricity intensive.
Transport fuels will be dominated by gasoline and diesel over the forecast period, at about a 40/60 ratio,
respectively. Today India has the sixth largest fleet of NGVs in the world, primarily taxis and buses with
refueling networks in “several” cities. Gas use in road transport expands moderately over the forecast
period but remains small in absolute terms.
Gas power generation capacity will grow from 8% of total generation capacity in 2014 to 10% in 2030.
Power demand for gas is highly price sensitive. IEA does not expect gas-fired power plants to produce
baseload power over the forecast period due to the relatively high cost of the fuel. Rather gas-fired
power provides daily load following and peaking flexibility. Gas use for power increases from around 5%
of total power energy use in 2013 to 10% in 2040. The share of all renewables in power generation
increases from 17% in 2013 to 26% in 2040 with wind and solar PV together accounting for 65% of
renewable power growth.
IEA WEO15 CPS: Like China, there is not much difference between the NPS and CPS on a total gas use
basis. Industrial and transport gas demand are about the same. Power gas use is higher in CPS due to
less support for renewables. Increases in residential/commercial gas use are slightly slower in CPS.