
Natural Gas Application Opportunities in China - … Gas Application Opportunities in China ... PwC...
90
Natural Gas Application Opportunities in China 2017 Disclosure: Content based on the Strategy& independent research project sponsored by Shell
Transcript of Natural Gas Application Opportunities in China - … Gas Application Opportunities in China ... PwC...

Natural Gas Application
Opportunities in China
2017
Disclosure: Content based on the Strategy& independent research project sponsored by Shell

Strategy& | PwC
Foreword
1
China’s energy market is becoming more diversified towards clean energy with
increasing digitalization and marketization supported by technological innovation and
policy reform. Meanwhile natural gas consumption continues to rise in China. In June
2017, the National Development and Reform Commission and 12 other commissions
drafted a memo to set natural gas as one of China’s main energy source. The memo
reinforces the importance of natural gas and boosts the confidence of the industry.
Nevertheless, natural gas still faces a series of challenges such as high retail price, low
marketization level, lack of awareness among end-users and slow policy development
etc. To sustain the development of natural gas, PwC Strategy& published the “Natural
Gas Application Opportunities in China” report sponsored by Shell. Through 6 months of
market research, expert interview, data analysis and modeling etc, the report analyzed
the full value of natural gas and evaluated strategies for natural gas to expand in different
regions and sectors. We welcome different industries to understand natural gas and
collaborate with us to further promote natural gas as well as other green energy in China.
Strategy& | PwC
Contacts
2
Tiger Shan
Partner
tiger.shan
@strategyand.cn.pwc.com
Junda Lin
Manager
junda.lin
@strategyand.cn.pwc.com
Joshua Yau
Principal
joshua.yau
@strategyand.hk.pwc.com

Strategy& | PwC 3
Gas As Strategic Enabler For China’s Transformation
Promoting Gas Usage in High Value Sectors
Industrial Heating
Residential/Commercial
Co-generation - Centralized Heating
Co-generation - Distributed Energy
Power Generation
Policy Action to Realize Gas Potential
Strategy& | PwC
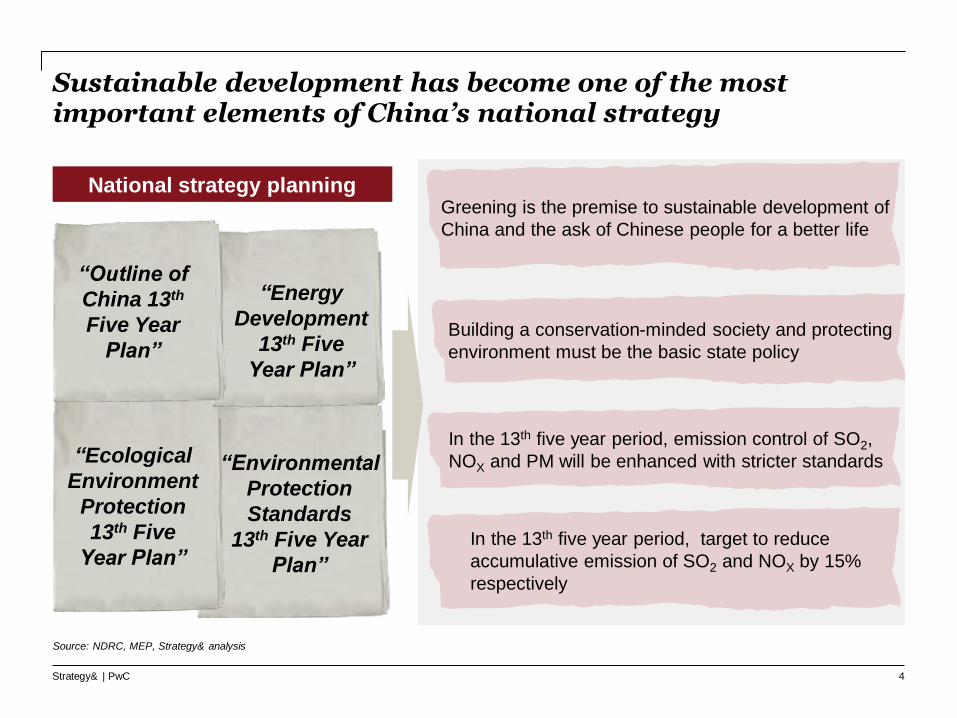
National strategy planning
“Environmental
Protection
Standards
13th Five Year
Plan”
Sustainable development has become one of the most important elements of China’s national strategy
4
“Ecological
Environment
Protection
13th Five
Year Plan”
Greening is the premise to sustainable development of
China and the ask of Chinese people for a better life
Building a conservation-minded society and protecting
environment must be the basic state policy
In the 13th five year period, emission control of SO2,
NOX and PM will be enhanced with stricter standards
In the 13th five year period, target to reduce
accumulative emission of SO2 and NOX by 15%
respectively
“Energy
Development
13th Five
Year Plan”
“Outline of
China 13th
Five Year
Plan”
Source: NDRC, MEP, Strategy& analysis
Strategy& | PwC
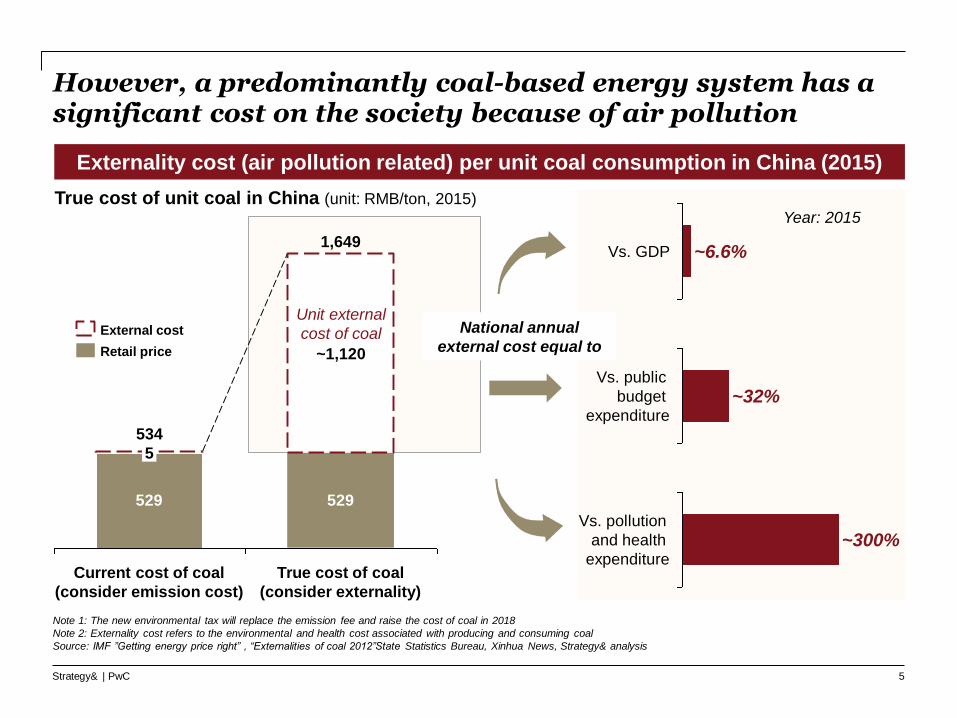
However, a predominantly coal-based energy system has a significant cost on the society because of air pollution
529 529
534
5
1,649
True cost of coal
(consider externality)
Current cost of coal
(consider emission cost)
~1,120
Externality cost (air pollution related) per unit coal consumption in China (2015)
True cost of unit coal in China (unit: RMB/ton, 2015)
Vs. GDP ~6.6%
Vs. public
budget
expenditure~32%
Vs. pollution
and health
expenditure~300%
National annual
external cost equal to
Year: 2015
Unit external
cost of coal External cost
Retail price
5
Note 1: The new environmental tax will replace the emission fee and raise the cost of coal in 2018
Note 2: Externality cost refers to the environmental and health cost associated with producing and consuming coal
Source: IMF ”Getting energy price right” , “Externalities of coal 2012”State Statistics Bureau, Xinhua News, Strategy& analysis

Strategy& | PwC
In addition to air pollution related cost, coal consumption may result in 270 billion RMB climate related cost
Carbon cost of coal, @ 30 RMB/t carbon price
270
Carbon Cost
(reflect the impact
of climate change)
Carbon cost of coal in China (unit: billion RMB)
Vs. GDP ~0.4%
Vs. public
budget
expenditure~1.8%
~17%Vs. pollution
and health
expenditure
• If consider the
externality of climate
change, it would
potentially cost ~270
Billion RMB on
carbon emission of
coal in 2015
6
Year: 2015
Source: IMF ”Getting energy price right” , State Statistics Bureau, Strategy& analysis

Strategy& | PwC
Given the higher carbon cost at 100 RMB/t, carbon cost will increase from 270 billion to ~920 billion RMB
Climate change external cost of coal, @ 100 RMB/t carbon price
922
270
+241.5%
External cost
@30RMB/ton
carbon price
External cost
@100RMB/ton
carbon price
Carbon cost of coal in China (unit: billion RMB)
Vs. GDP ~1.3%
Vs. public
budget
expenditure~6.1%
Vs. pollution
and health
expenditure~57%
7
Year: 2015
Source: IMF ”Getting energy price right” , State Statistics Bureau, Strategy& analysis

Strategy& | PwC
Meeting the target of 10% gas in energy mix by 2020 can result in net system cost savings of ~85 billion
2015
consumption
Additions
Gas consumption
estimation by 2020
~400
193
207
Cost saving of “coal to gas” by 2020
• Assume the additional gas consumption
will all come from “coal to gas” switch
• ~85 Billion RMB total cost saving
(differential between decreased external
cost of air pollution and increased fuel cost)
for 4% additional gas consumption*
0.1%
compare vs. GDP
0.6%
compare
vs.pollution
and health
expenditure
5.2%
compare vs.
public budget
expenditure
10% of primary
energy
Gas consumption estimation by 2020(unit: billion m3)
5.9% of primary
energy
Total cost saving estimation by 2020 compare
with financial factor in 2015
8
Note*: Not considering negative GDP impact due to lower coal output at major coal production provinces
Source: China Energy Development 13th Five Year Plan, IMF ”Getting energy price right” , State Statistics Bureau, Strategy& analysis

Strategy& | PwC 9
Gas As Strategic Enabler For China’s Transformation
Promoting Gas Usage in High Value Sectors
Industrial Heating
Residential/Commercial
Co-generation - Centralized Heating
Co-generation - Distributed Energy
Power Generation
Policy Action to Realize Gas Potential

Strategy& | PwC
Promoting coal to gas switch in various sectors will help China to meet its 10% gas in energy mix target by 2020
• Promoting coal to
gas switch in those
sectors will help
China to meet its
10% gas in energy
mix target by 2020,
in addition to gas
application in
transportation,
chemical and other
sectors.
• Overall, gas is a better alternative for coal boiler retrofitting
• Efforts should be concentrated into high value industries and key
regions such as Textile, Food, Paper, Ceramic etc. & Shandong,
Hebei, Jiangsu, etc.
• LNG-based supply can play a role to drive down the gas retail
price by promoting market competition.
Industrial
heating
• Gas as cleaner and more convenient fuel source have better
usage in residential activities like cooking and water heating
• Large-scale centralized gas CHP is more applicable for the
environment sensitive regions and non-coal zones
Residential
sector
• Distributed gas CHP with 70+% efficiency and less emissions
can be positioned as core component of China power reform
and micro-grid development
• Users with large and stable energy demand, and higher
utilization are identified as better near-term consumers: data
center, industrial park, etc.
Distributed
energy
• Gas peak plant is an important source for power flexibility along
with increasing amount of renewable energy that requires higher
flexible grid system to integrate
• Pricing on the flexibility would be important to encourage
investment in peak-shaving plant
Power
generation
10
Source: Expert interview, Strategy& analysis

Strategy& | PwC 11
Gas As Strategic Enabler For China’s Transformation
Promoting Gas Usage in High Value Sectors
Industrial Heating
Residential/Commercial
Co-generation - Centralized Heating
Co-generation - Distributed Energy
Power Generation
Policy Action to Realize Gas Potential

Strategy& | PwC
As an industrial fuel, the value gas provides is beyond emissions reduction
12
Technology
Heat value (Kcal / kg)
Gas
~11,000
Coal
5,000
Energy efficiency (%)
8570
GasCoal
Space cost (RMB.T/h)
Gas
167
Coal
834
Labor (#/ boiler)
1
3
Coal Gas
Emissions
NOx (t/a, per T/h)
Gas
0.30
Coal
1.60
SO2 (t/a, per T/h)
Coal
4.49
Gas
0.00 0.02
Coal Gas
1.10
PM (t/a, per T/h)
Source: Expert interview, The environment impact assessment report of Beijing Yanjing beer company C2G program, Strategy& analysis

Strategy& | PwC
For investors, coal to gas switch helps to mitigate policy risk, lower land cost, improve productivity and reduce failures
13
Mitigate policy
risk mitigation
Lower land cost
Improve
productivity
Reduce
equipment
failures
Description Case
• Coal boilers are in policy
risk of being shut down,
resulting in sunk cost and
impeding plant operation
• A textile company in
Changshu, Jiangsu :
A 2-year coal boil which
worth 4 million RMB
was forced to shut
down.
• The increased cost is
pushing us to upgrade
the technology and
product.
----- Operation director
• Gas boiler does not require
coal storage and waste
disposal; it saves land space
and related cost
• A cigarette factory in Yunnan: The construction area
of gas boiler room is only 1 /4 of coal
• A textile company in Jiangsu : over hundreds m2
have been saved and converted as warehouse
• Gas boiler will increase the
yield and quality in specific
industries, with the higher
heat values and stable supply
• A chemical company in
Xinjiang: The product revenue (unit: thousand ¥)
has been increased by 33.4%16
12
+33.4%Gas
boiler
Coal
boiler
• Gas boiler is more stable ,
with less failure rate and
longer working hours
• A chemical company in Xinjiang: The coal boiler
had shut down 30 times per year because of high
equipment failures rate, lead to halted service of 47
working days
Source: Expert interview, Literature review, Strategy& analysis

Strategy& | PwC
Gas boilers at city gate price are cost competitive against alternatives such as electricity, biomass and LPG boilers
Annualized unit cost of different boilers (RMB / t.h)
126 112
266
172
534
184
423
42
LPG
428
5
Biomass
184
Gas_retail
275
5 4
Coal_CFB*
155
934
Coal_chain-
grate
Electricity
589
2135
Gas_city
gate
181
5 4
Gas
internal cost
(city gate)
177
9
Internal costOther external cost Carbon cost
Coal Gas Other alternatives
14
Note: 1. CFB*= Cycle Fluidized Bed; 2. 30 RMB/ton for carbon cost; 3. Gas Retail price: 2.9 RMB/m3, City gas at 1.8 RMB/m3; 4. Lack of valid data in Biomass and LPG's external
costs
Source: IMF ”Getting energy price right”, Wind, 315i, Strategy& analysis

Strategy& | PwC
Gas boiler switch can first target coal boiler with efficiency less than 70% as low-hanging fruit
0.5
0.6
0.7
0.8
0.9
1.0
1.1
1.2
1.3
1.4
1.5
1.6
1.7
40% 50% 60% 70% 80% 90% 100%
Break-even
Point
(Cost ratio=1)
Include
carbon tax_100 RMB/ton
and external cost
Annunalized cost
Thermal efficiency
of coal boiler
Boiler cost ratio
(Gas/coal)
How thermal efficiency impact energy production cost ratio? City gate gas price @ 1.8 RMB/m3
Break even
efficiency:45%
Target efficiency:70%
15
• For efficiency less than 45%:
make economic sense and
should switch immediately.
• For efficiency between 45-
70%: have great potential and
should target for switch later
• For efficiency less than 90%:
if carbon price is at 100 RMB/t,
C2G switch will always be
economic in annualized cost
Source: Strategy& analysis
Strategy& | PwC
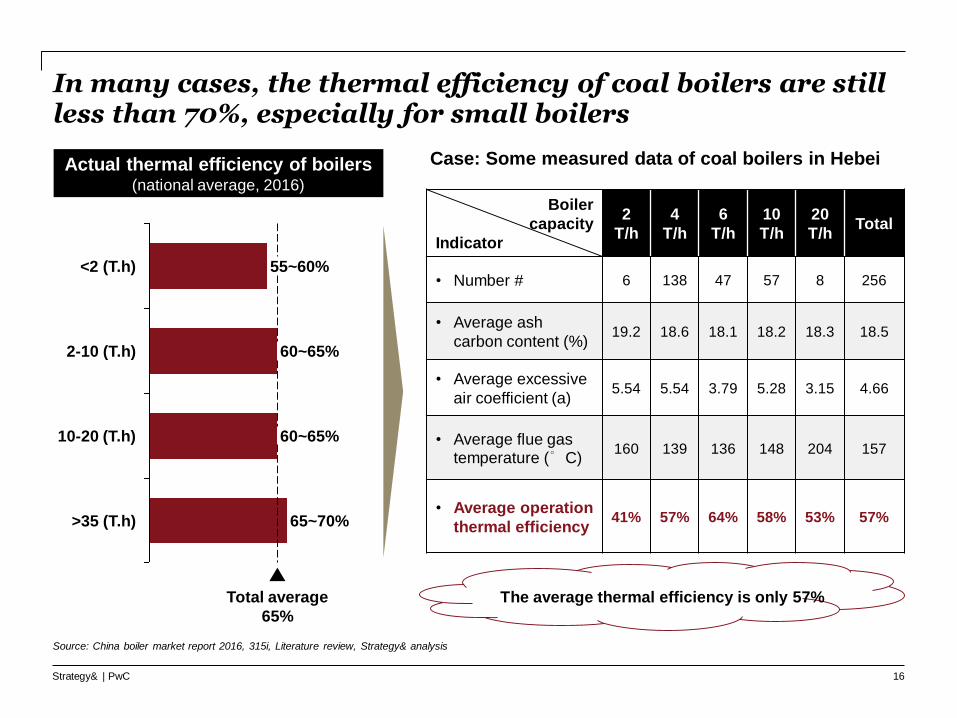
In many cases, the thermal efficiency of coal boilers are still less than 70%, especially for small boilers
Boiler
capacity
Indicator
2
T/h
4
T/h
6
T/h
10
T/h
20
T/hTotal
• Number # 6 138 47 57 8 256
• Average ash
carbon content (%)19.2 18.6 18.1 18.2 18.3 18.5
• Average excessive
air coefficient (a)5.54 5.54 3.79 5.28 3.15 4.66
• Average flue gas temperature (°C)
160 139 136 148 204 157
• Average operation
thermal efficiency41% 57% 64% 58% 53% 57%
Case: Some measured data of coal boilers in Hebei
The average thermal efficiency is only 57%
Actual thermal efficiency of boilers(national average, 2016)
55~60%
60~65%
65~70%
Total average
65%
60~65%
>35 (T.h)
2-10 (T.h)
10-20 (T.h)
<2 (T.h)
16
Source: China boiler market report 2016, 315i, Literature review, Strategy& analysis

Strategy& | PwC
However, industrial gas retail price is on average 70% (or 1.3 RMB/m3) higher than the city gate prices
0
50
100
150
0.7 1.61.51.4Ø 1.31.21.11.00.90.80.60.5 1.70.0 2.42.32.22.12.01.91.8
Price gap (RMB/m3, retail – city gate)
% of Price gap
Zhejiang
Yunnan
Xinjiang
Tianjin
Sichuan
Shanxi Shanghai
Shandong
Shaanxi
Qinghai
Ningxia
Liaoning
Jilin
Jiangxi
Jiangsu
Inner Mongolia
Hunan
Hubei
Henan
Heilongjiang
Hebei
Hainan
Guizhou
Guangxi
Guangdong
Gansu
Fujian
Chongqing Beijing
Anhui
Price gap between provincial retail price and reference city gate* price, as of Feb, 2017
Ø 70
17
Note: Reference City Gate price (基准门站价格)here is based on the guideline announced by NDRC in 2015, actual price may be different
Source: NDRC, Wind, Strategy& analysis

Strategy& | PwC
LNG price in most regions is attractive vs pipeline gas and offers an alternative option for industrial gas users
Price differential* in selected provinces (pipeline industrial - LNG, RMB/m3, June/2017)
-0.4
-0.2
-0.2
-0.1
0.0
0.0
0.1
0.1
0.2
0.3
0.4
0.6
0.7
0.8
1.1
Guizhou
Hunan
Jiangxi
Yunnan
Jilin
Sichuan
Jiangsu
Zhejiang
Shanghai
Hubei
Liaoning
Shandong
Fujian
Guangxi
Guangdong
• With lower oil price and surplus supply, LNG price is reducing and becoming competitive vs pipeline gas.
• Investors using LNG are mostly from areas with well-developed industries or weaker pipeline network
18
Note: *Price gap = pipeline gas price (industrial) - LNG price, which already consider the gasification cost, traffic cost, VAT (11%) and margin of supplier (~10%)
Source: China boiler market report 2016, Gas online, Strategy& analysis

Strategy& | PwC
LNG-based supply offers better flexibility and choices, and can become a complementary supply for end-users
LNG- based supply for industrial user Comparison with pipeline gas
Gas source
(imported or domestic)
LNG terminal
End user _
gasification station
LNG distributed supply market cases:
• Taizhou, Zhejiang: Over 50 companies
• Chaozhou, Guangdong: ~40% of ceramic producers
• Shandong: Encourages LNG to compete with gas
End user _
gasification station
… LNG plant
…
Transmitted by distribution tanker
(Up to 10 ~30 thousand m3 per day,
could support large –size boiler)
LNG Pipeline gas
• Price
• Unregulated
• Connected to
global market
• Semi-regulated
• O&M cost • Lower
• Initial
investment
• Provide more
options, including
free or paid
leasing
• ~1.5 million
RMB
(equipment, con-
struction, deposit)
• Supplier
• Competitive
market, with wide
range of choices,
• Franchise mode,
usually
dominated by
1~2 suppliers
per city
19
Source: Customer survey, Literature review, Strategy& analysis

Strategy& | PwC
The ‘catfish effects’ brought by LNG will help to promote gas market development
• Become an effective alternative of
pipeline gas: LNG can efficiently meet
the surging and distributed demand,
especially in remote areas where
pipeline network may not make
economic sense.
• Accelerate business model
innovation in gas market: LNG
providers are developing innovative
business models such as leasing
• Since there are numerous small and
medium - sized industrial users in
China, more distributed markets will
emerge along with the development of
C2G policy. These distributed markets
requires a more flexible business
model of gas supply.
Values of the LNG-based supply
C2G initiative will create more distributed
industrial customer demands in China
Stricter supervision of
government
• Drive competition: LNG will be a
catalyst in gas market, which will help
to bolster the competition of both price
and service,.
• As a clean fuel, LNG will eventually be
encouraged by local governments but with
stricter supervision.
20
Note*: The catfish effect is the effect that a strong competitor has in causing the weak to better themselves.
Source: Literature review, Expert interview, Strategy& analysis

Strategy& | PwC
• Ambiguous regulations
– Most provinces in China do not have clear
approval process for use of LNG
– The boundary of “franchise right” of pipeline
gas company is not clearly explained
– There are some areas excluded from
regulations e.g. stealing or replacing gas
with hydrogen
However, regulation and pressure from existing pipeline gas suppliers hinder LNG growth and need to be addressed
• Inappropriate regulatory codes
– Current regulatory codes for LNG is decade-
old and tailored for big regas facilities (eg
safety distances)
– End users cannot meet these outdated
standards and are concerned with
compliance risk
– Several small regas projects have been
declared as illegal with unqualified safety
condition
Key LNG market barrier
Conflict with pipeline gas companies1
2
Pipeline gas companies may view
LNG suppliers as market disruptor
and push the local governments
conduct compliance investigation
on LNG supplier
21
LNG project construction should
be tightly regulated and self--built
LNG gasification station must be
under resolute control
—— the Ministry of
Construction in Hubei 《关于加强城镇燃气规划管控,严格LNG工程建设管理的通知》
Source: Public reports, Hubei Provincial Housing Department, Expert interview, Strategy& analysis

Strategy& | PwC
Inappropriate regulatory codes: Current regulatory codesfor LNG use are decade-old and not applicable to small scale LNG used by industrial users
• LNG suppliers and industrial users face
complaints about not meeting safety standards,
which is difficult to evaluate due to the lack of suitable
standards.
• Eg. According to “Code for Design of City Gas
Engineering”, a gas tank with less than 10 m3 must be
located at least 15m away from buildings, 20m away
from gas tanks. Most mid- small industrial users can’t
meet the requirements due to limited space
Reference codes relevant to LNG
Name Year
GB 50028-93: Code for Design
of City Gas Engineering
2001GBJ 16-87: The National Norm
of Building Fire System Design
GB/T 19204 : The general
characteristics of LNG2003
2004
GB/T 20368 : Code of LNG pro-
duction, storage and
transportation
2006
GB 50183 : The code for fire
protection design of petroleum
and natural gas engineering
2006
• “Even though we’ve selected the LNG supplier who
were recommended by local Environmental Protection
Agency, and we were promoted as C2G best practice,
our company was still forced to shut down and
take corrective actions due to the unqualified
safety distance.
—— A coating producer in Zhejiang
Analysis
Market quote
22
Source: China Gas Association Professional Committee of LNG, Customer survey, Literature review, Strategy& analysis

Strategy& | PwC
Ambiguous regulation: LNG use is also hindered by unclear approval process and regulatory gaps
• Some pipeline gas companies believe LNG supply is creating an
unfair competition, and the boundary of “franchise right” is not clearly
explained by government
• Across LNG supply
chain some areas
are not supervised
by local governments
yet, causing stealing
or replacing gas,
which will distort the
market and impact
the customer
confidence
Key issues of LNG regulation
• Most provinces in
China do not have
uniform and clear
approval process for
industrial LNG users
Unclear approval
process
Unclear
differentiation
with pipeline
gas
Key
issues
1
2 3
Unsupervised
areas
• Many small-size users like us
are under great cost pressure
due to C2G policy. We can only
use the cheaper LNG (2.5 RMB
compares to 3.1 RMB of
pipeline gas) , fear to be shut
down at any time.
• We hope the government could
acknowledge the value of LNG
and give us more options on
gas supply.
—— A textile producer in
Guangdong
Market quote
23
Source: Customer survey, Literature review, Strategy& analysis
Strategy& | PwC
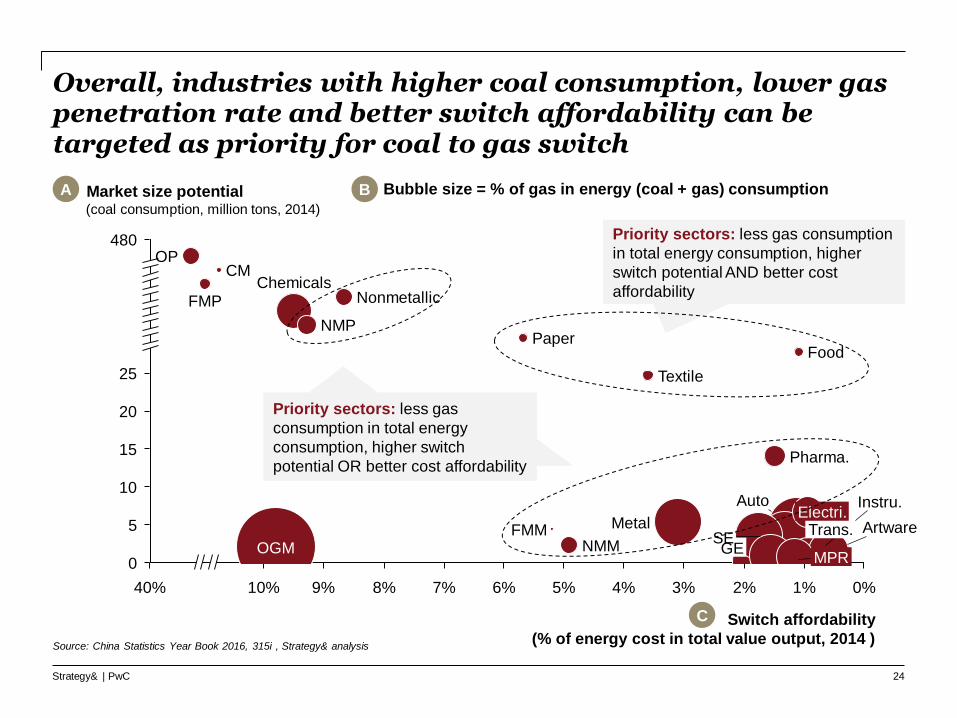
Overall, industries with higher coal consumption, lower gas penetration rate and better switch affordability can be targeted as priority for coal to gas switch
25
20
15
10
5
0
9%
480
6% 5% 0%1%2%3%4%40% 10% 7%8%
Metal
OGM
CM
Furniture
Instru.
Artware
FMP
Textile
Switch affordability
(% of energy cost in total value output, 2014 )
Trans.
Auto
Market size potential(coal consumption, million tons, 2014)
Food
Electri.
Pharma.
PMMPR
GEFMM
SE
Paper
Nonmetallic
NMP
Chemicals
NMM
OP
Bubble size = % of gas in energy (coal + gas) consumptionBA
C
Priority sectors: less gas consumption
in total energy consumption, higher
switch potential AND better cost
affordability
Priority sectors: less gas
consumption in total energy
consumption, higher switch
potential OR better cost affordability
24
Source: China Statistics Year Book 2016, 315i , Strategy& analysis

Strategy& | PwC
Industry with higher coal consumption represents bigger overall switch potential
Specialized Equipments 3.4
General Equipments 3.5
Ferrous Metal Mining 4.4
Automobile 4.7
Metal Products 5.2
Electricals 6.6
Pharmaceuticals 13.9
Textile 24.6
Food Processing 27.8
Paper Making 48.3
Nonferrous Metal Processing 114.8
Chemicals 270.9
Nonmetallic Mineral Processing 330.1
Ferrous Metal Processing 345.3
Coal Mining 356.1
Oil Processing 477.7
Metal Product Repairing 0.1
Instruments 0.3
Furniture 0.6
Printing Materials 0.8
Artwares 1.3
Transportation Equipments 1.9
Oil & Gas Mining 1.9
Nonferrous Metal Mining 2.2
Coal consumption ranking by industry (million tons, 2014)
Largest coal consumer,
major players are SOEs
and listed private giants,
more concentrated industry
clustering
Key polluters, consist of
large number of SMEs
(Paper, Food, Textile), with
less capital to invest in
pollution control
Leading enterprises in top 6 industries (by
coal consuming) have mostly adopted
pollution control mechanism, whilst SMEs
in other industries couldn’t afford the
investment (SMEs are key polluters)
Expert from Department of Thermal Engineering, Tsinghua University
25
Source: China Statistics Year Book 2016, 315i , Strategy& analysis

Strategy& | PwC
Overall gas penetration is still lower than 24% in industry, while industry like FMM, food processing and paper making has good potential
Gas consumption ranking by industries in 2014 % of gas in energy (coal + gas) consumption
15.9%
Textile
Ferrous Metal Processing
Paper Making
Food Processing
Coal Mining
Ferrous Metal Mining
Transpotation Equipments
General Equipments
Instruments
Printing Materials
Oil & Gas Mining
Automobiles
Eletricals
Pharmaceuticals
Nonferrous Metal Processing
Oil Processing
Nonferrous Metal Mining
Nonmetallic Mineral Processing
68.9%
Specialized Equipments
Metal Products
Artwares
Metal Product Repairing
Furniture
Chemicals
2.4%
2.4%
2.1%
26.1%
19.0%
0.7%
0.1%
34.0%
31.3%
30.8%
5.4%
5.3%
3.5%
93.8%
55.9%
48.5%
Ø 24%
8.8%
6.9%
5.6%
37.2%
35.3%
35.0%
26
Source: China Statistics Year Book 2016, 315i , Strategy& analysis

Strategy& | PwC
Industries with lower energy cost as part of their output value can likely afford the switch
IndustryOutput Value,
Billion RMB
Energy Cost,
Billion RMB Coal Gas Others
Artwares 1476.2 8.5 0.7 1.0 6.9
Instruments 828.6 7.6 0.2 0.2 7.2
Electrical 6692.2 62.1 3.5 2.1 56.5
Transportation Equipment 1865.4 21.1 1.0 4.1 16.0
Automobiles 6634.2 73.8 2.5 7.4 64.0
Food Processing 6359.6 68.3 14.7 1.0 52.7
Furniture 734.8 8.4 0.3 0.4 7.7
Specialized Equipment 3503.9 45.8 1.8 3.3 40.6
Pharmaceuticals 2320.0 34.3 7.4 2.2 24.7
Metal Products repairing 85.9 1.4 0.0 0.2 1.2
Printing Materials 689.4 10.7 0.4 0.7 9.5
General Equipment 4715.1 82.3 1.8 3.1 77.3
Metal Products 3661.2 113.0 2.8 4.7 105.5
Textile 3770.4 135.1 13.0 1.5 120.6
Nonferrous Metal Mining 634.8 31.1 1.2 0.2 29.8
Ferrous Metal Mining 933.1 48.4 2.3 0.0 46.1
Paper Making 1377.5 78.1 25.5 2.0 50.6
Oil & Gas Mining 1166.4 114.2 1.0 48.6 64.6
Nonmetallic Mineral Processing 5824.0 503.9 174.6 30.7 298.6
Chemicals 8235.3 781.5 143.3 105.7 532.5
Nonferrous Metal Processing 4615.5 427.7 60.7 14.1 352.8
Coal Mining 2602.5 279.5 188.4 4.2 87.0
Ferrous Metal Processing 7102.7 1312.4 182.6 14.4 1115.4
Oil Processing 4080.3 1603.4 252.7 46.9 1303.8
Least
sensitive to
energy cost
rising
Very
sensitive
to energy
cost
rising
39.3%
18.5%
10.7%
9.3%
9.5%
8.7%
9.8%
5.7%
5.2%
4.9%
3.6%
3.1%
1.8%
1.6%
1.6%
1.5%
1.3%
1.1%
1.1%
1.1%
1.1%
0.9%
0.9%
0.6%
27
% of total value
Source: China Statistics Year Book 2016, strategy& analysis

Strategy& | PwC
Food Industry: A leading food manufacturer has been using gas since 2007 in order to build CSR image and meet the government’s environmental protection requirements
~10%
Procurement
~60%
Self: Gas Boiling
Power Plants
~30%
Steam from gas boiling
Steam from procurement
Steam from power plants
• 16 factories, located in different regions, are
using gas boilers
• The first gas boiler dated back to 2007,
driven by CSR and long-term strategic
assessment
• 30% of the company’s steam demand
comes from external procurement
• A majority of the steam is procured from
gas and other clean energy boilers
• 2 of the company’s factories are using
steam produced by power plants along with
power generation
The company’s sources of steam
CSR consideration and meeting central and local government’s environmental protection
target are the main drivers for this industry leader to switch to gas boilers
28
CASE STUDY
Source: Expert Interview, Strategy& analysis

Strategy& | PwC
Food Industry: Coal to gas switch has provided environmental、operational and branding values for this leading food manufacturer
Benefit fields Gas boiler
Environment
• Cleaner ambient
environment and
workspace
Security
• Automatic and
immediate shut-down
during emergency
Stability• Able to keep the
temperature stable
Headcount cut• No fuel loading
worker needed
Incentive gain
• Stronger bargaining
power against local
regulators
CSR image
• Better CSR image
especially as industry
leaders
“Our products require stable processing temperature. The gas boiler enables our production to
be more efficient and our products to be higher quality”
“As a pioneer that could be set as a successful case to promote the C2G switch, we negotiated with
local governments to get favorable supports”
“Before we chose to use gas, we did experiments and calculation, which many users haven’t, and
found out that overall in long term gas is beneficial”
— Equipment Director of the Company
29
CASE STUDY
Source: Expert Interview, Strategy& analysis

Strategy& | PwC
Food Industry: A leading beer manufacturer in Beijing has switched all its coal boilers to gas, leading to many benefits for the environment and the factory
• Yanjing, one of the biggest beer
manufacturing factories in the
region
− Area: 14,8817.3 m2
− Asset: 448.54 million RMB
− Production Capacity: > 250
tons beer
− Headcount: > 2,000 personnel
• The company had 10 coal boilers
with 6 t/h capacity each before
the C2G switch
• In 2015, the company switched
all its boilers into one 4 t/h, one 6
t/h and five 10 t/h gas boilers
• As a result, the company meets
government’s emission
requirements
Project backgroundKey benefits of the C2G switch
Atmosphere
Water
Solid waste
Noise
Land
1
2
3
4
5
• Gas boilers emit less air pollutions in terms of
density and volume
• Gas boilers don’t produce waste water from
desulfurization and denitration process
• Gas boilers don’t produce coal cinders
• Gas boilers’ noise is lower than coal’s
• Gas boilers occupy smaller space as gas is
supplied via pipeline without storage
30
CASE STUDY
Source: Expert Interview, Yanjing Beer C2G environment impact report, Strategy& analysis

Strategy& | PwC
Food Industry: The switch resulted in 98%, 100%, 82% reduction for PM、SO2 and NOx, helping to address the air pollution challenge
Atmosphere
Water
Solid waste
Noise
Land
1
2
3
4
5
1.04
-98.4%
Before After
65.96
PM emissions
(tons/a)
0.00
-100.0%
AfterBefore
269.55
SO2 emissions
(tons/a)
After
-82.1%
16.68
Before
93.23
NOX emissions
(tons/a)
PM SO2 NOX
Gas boiler (mg/m3) 5 0 80
Beijing standard (mg/m3)1 5 10 80
31
CASE STUDY
1) applied DB11 139-2015 Standard for new industrial boilers constructed before March 31, 2017
Source: Expert Interview, Yanjing Beer C2G environment impact report, Strategy& analysis

Strategy& | PwC
Food Industry: The switch reduced the water consumption and solid waste by 100%
Atmosphere
Water
Solid waste
Noise
Land
1
2
3
4
5
Use of Water (excluding Steam)
(tons/day)
0
40
-100.0%
Before After
Before
After
• 12, 000 tons water is used
for desulfurization and
denitration per year
• No need for desulfurization
and denitration
• Little impact on ambient
water environment
Emission of Coal Cinders
(tons/a)
0
3,150
-100.0%
Before After
Before
After
• 3150 tons coal cinders are
produced along with steam
generation per year
• No cinder emission from
boiling process
32
CASE STUDY
Source: Expert Interview, Yanjing Beer C2G environment impact report, Strategy& analysis

Strategy& | PwC
Food Industry: The switch reduced the boiler land occupation by 80% and increased real estate utilization
Overview of the beer factory
Gas
pipeline
Gas boilers
Former coal
boilers
Factory
boundaries
Boiling zone before switch
Coal piles
Coal
piles
Dust
preventing
workshop
Coal boilers
Become
beer
bottle
storage
area
Become
location
for gas
boilers
Water
pump
Settling
tank
After the C2G switch, only ~20% of former boiling area
(2,500 m2 total) is used for generating steam, the other
80% area is saved for alternative usage e.g. storage
Coal boilers
33
Source: Expert Interview, Photo and data from Yanjing Beer C2G environment impact report, Strategy& analysis
CASE STUDY

Strategy& | PwC
Food Industry: Noise is lower and land occupation is smaller
Atmosphere
Water
Solid waste
Noise
Land
1
2
3
4
5
Noise of daytime to north boundary
(dB)
42.064.8
-35.2%
AfterBefore
Before
After
• To the north boundary
(nearest), average noise is
64.8 dB for day and 53.6
dB for night
• To the same point, average
noise is less than 42 dB
Use of land for the boilers
And related activitiesBefore
After
• Coal boilers require
additional space for coal
piles, dust inhibition, etc.
• No need for above
mentioned space
• Used save space for beer
bottle storage
before
after
34
CASE STUDY
Source: Expert Interview, Photo and data from Yanjing Beer C2G environment impact report, Strategy& analysis

Strategy& | PwC
Food Industry: Coal to gas switch can also reduce plant’s emission cost and the need to lease land
1081,660 13,91015,797
Actual CostAir Pollution
Fee Saving
Solid Waste
Fee Saving
Water fee Saving Land fee saving2
4079
Fuel Cost Increase
Annual fuel cost increase vs. Operational cost reduction at current fee and tariff (thousand RMB)
Air pollution penalty rates (RMB/kg)
224.9
PM
NOx
45.10.3
10.0 261.0
10.0SO2
If air pollution penalty rates increase 9.5 times in average,
the air pollution penalty fee saving would be 15 million
RMB
IMF - ChinaBeijing Current
Water tariff (RMB/t)
396.0Water 9.0
Beijing Current True Value
Dean of School of Environment of RUC suggests that
“the true value of water isn’t realized via water fees” –
By end of 2015,total water use fees charged was 100
billion RMB (2.27% of true value)
S1: If air pollution fee increase 9.5 times S2: If water tariff increase 44 times2
12
1
35
Pollution fees and water tariff need to be raised to close the gap.
CASE STUDY
1) indicates annual cost after depreciation (30 years); 2) coal: 487RMB/t, gas: 2RMB/m3, land: 200RMB/m2 per year, exchange rate: 1USD = 6.217RMB
Source: Expert Interview, Yanjing Beer C2G environment impact report, Strategy& analysis

Strategy& | PwC
Emission cost remains low in most provinces in China compared to Beijing and Shanghai
36
1.3
2.5
3.8
5.1
6.3
8.0
8.5
10.0
Other cities and
provinces
Hubei
Shanghai
Tianjin
Beijing
Jiangsu
Hebei
Shandong
1.3
2.5
3.8
5.1
6.3
6.3
7.0
10.0
Other cities and
provinces
Hubei
Jiangsu
Hebei
Shandong
Tianjin
Shanghai
Beijing
SO2, RMB / KG NOx, RMB / KG
The new environmental tax will replace the emission fee in 2018 and
increase the emission cost for NOx and SO2
Source: Literature Review, Xinhua News, 163 News, Strategy& analysis
Strategy& | PwC 37
Gas As Strategic Enabler For China’s Transformation
Promoting Gas Usage in High Value Sectors
Industrial Heating
Residential/Commercial
Co-generation - Centralized Heating
Co-generation - Distributed Energy
Power Generation
Policy Action to Realize Gas Potential

Strategy& | PwC
Compared to coal, gas is a cleaner, safer, more convenient and more efficient fuel source for residential users
Cleanness
Safety
Convenience
Efficiency
Gas Coal
• Emit less air and solid waste
pollutions when generating
heat
• Gas boiler, stove and heater
can be shut down immediately
whenever needed
• Pipeline gas supply provides
convenience to end users
• Thermal efficiency can be
over 85% with 11000 kcal/m3
average heat value
• High carbon, SO2, NOX and
coal cinder emissions
• Coal boiler, stove and heater
cannot be shut down quickly
as it needs time to cool down
• Coal requires storage space
and labor for fuel loading
• Average thermal efficiency is
around 70% with 5000
kcal/kg average heat value
38
Source: Strategy& analysis

Strategy& | PwC
And natural gas as a cleaner and safer fuel is gradually replacing coal gas and LPG as the primary residential fuel supply
250
400
450
350
300
50
150
100
0
200
2006 2015201320122011 2014
140
286
13
20092007 20102008
+5%
Natural Gas
LPG
Coal Gas
Gas and other alternative fuel supply for residential usage (mainly cooking and showering) (million persons)
-11%
-2%
+13%
06-15 CAGR
39
Source: Wind, Strategy& analysis

Strategy& | PwC
Urbanization is expected to drive residential gas demand to at least 51 billion m3 by 2020
2020F
60.0%
2015
53.7%
China urbanization rate (urban habitants % in total population)
• Official urbanization target stated in 《国家新型城镇化规划(2014-2020)》(National
Plan for New Urbanization)is 60% of total
population by 2020
• The annual growth rate of Chinese
population is assumed to be 0.5% by World
Bank, projecting 1.41 billion by 2020
Base
High
+24%
2020F
106.53
2015
35.98
51.13
China residential gas need (billion m3)
• Assumptions for 2020 Projection:
− Base scenario: residential gas coverage
rate grows steadily as the past five years,
increasing 11 percentage points to 48%
− Upper case: all citizens staying in urban
areas use gas
40
Source: Xinhua News Agency, World Bank, Wind, Strategy& analysis
Strategy& | PwC
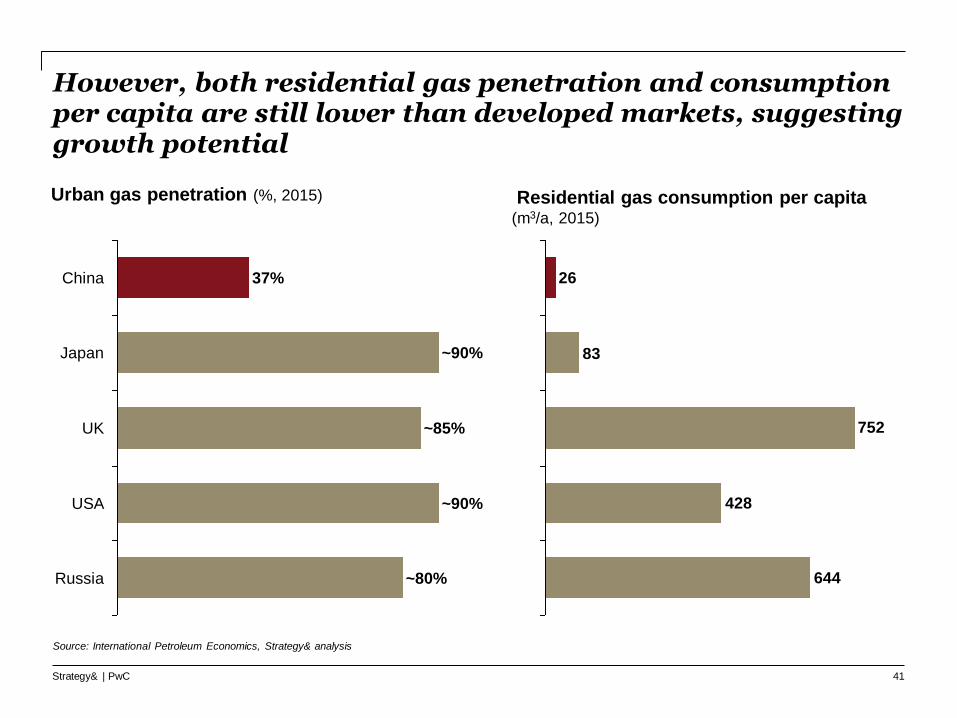
However, both residential gas penetration and consumption per capita are still lower than developed markets, suggesting growth potential
~85%
USA ~90%
China 37%
~90%
~80%
UK
Russia
Japan
Urban gas penetration (%, 2015)
644
428
752
83
26
Residential gas consumption per capita(m3/a, 2015)
41
Source: International Petroleum Economics, Strategy& analysis

Strategy& | PwC
This is partially due to lack of gas infrastructure
~400China
USA >2,000
Total length of local gas branch pipeline(thousand km)
National gas pipeline plan
104
64
2015 2020F
Long-distance pipeline(thousand km)
280
2020F
400
2015
Transportation capacity(billion m3 )
• China and USA comparison
− USA’s local gas branch pipeline is 5.4
times longer than China
− China’s current total length is equal to
USA in 1950s
Nati
on
al
Lo
cal
42
Source: Natural Gas 13th Five Year Plan, National Energy Bureau, Literature Review, Strategy& analysis

Strategy& | PwC
Meanwhile, dispersed coal accounts for less than 14% in the total coal consumption but has been used as major energy in rural areas
Coal consumption structure in China, 2014 (%)
Others9%
LPG5%
Electricity
10%
Dispersed
coal
76%
Energy consumption structure of rural
households in Baoding, Hebei*, 2014 (%)
43
33.0%
Others
(mainly in chemical)
Urban residential
0.8% 1.2% Lodging & catering
Rural residential5.4%
Small coal boiler6.1%
Large Industrial
boiler
10.3%
Thermal
43.2%
Centralized Dispersed
Note*:Sample size = 534 households in Baoding, Hebei
Source: Energy research institute of the State Grid, CRAES, Strategy& analysis

Strategy& | PwC
Dispersed coal in rural residential use has contributed to high emission, despite its smaller share in the total coal consumption…
44
43%
44%
13%
10%
43%
5%
41%
Large coal boiler
(industrial use)
Thermal coal
(power generation)
Dispersed coal
(rural residential use)
Others
Annual PM2.5 emission comparison (2014, 10 thousand tons)
Coal consumption share(%)
Source: Energy research institute of the State Grid, Strategy& analysis

Strategy& | PwC
…because the unit emission of dispersed coal is much higher than the processed coal used by power plants or boiler
0.610.48
3.73
Thermal coal
(power generation)
~7.8 times ~ 6.1 times
Large coal boiler
(industrial use)
Dispersed coal
(rural residential use)
Unit emission of comparison (kg/ton)
3.18
20.72
~6.5 times
Thermal coal
(power generation)
Dispersed coal
(rural residential use)
SO2PM2.5
45
Source: Energy research institute of the State Grid, Strategy& analysis
Strategy& | PwC
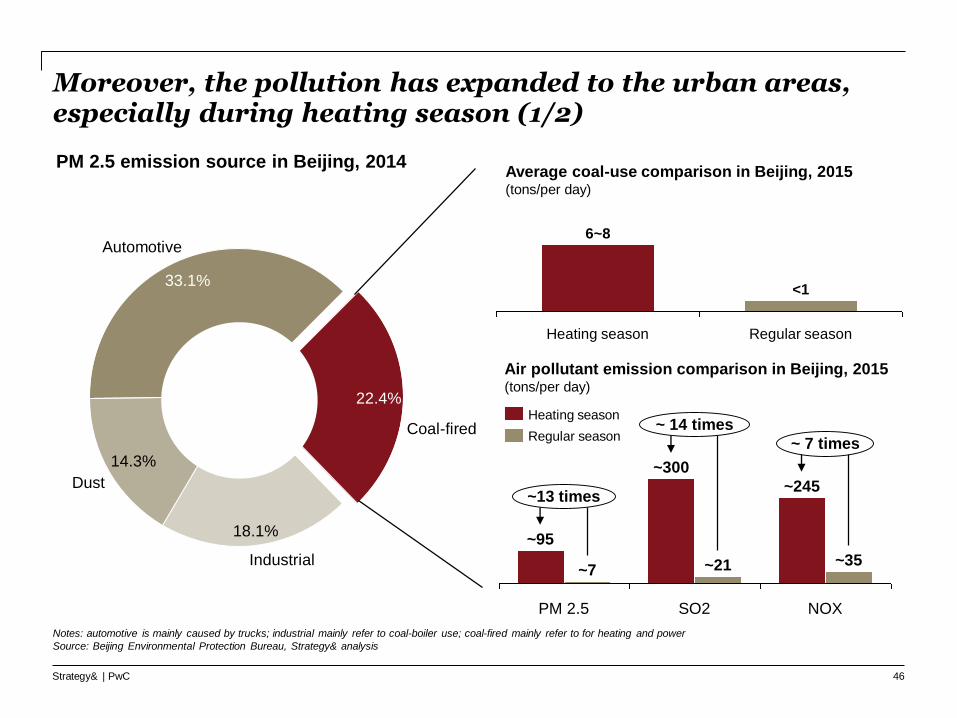
Moreover, the pollution has expanded to the urban areas, especially during heating season (1/2)
33.1%
Coal-fired
Industrial
Dust
Automotive
14.3%
18.1%
22.4%
Regular season
6~8
<1
Heating season
PM 2.5
~95
~7~35
~300
~21
~ 14 times
~245
SO2
~13 times
NOX
~ 7 timesRegular season
Heating season
PM 2.5 emission source in Beijing, 2014Average coal-use comparison in Beijing, 2015 (tons/per day)
Air pollutant emission comparison in Beijing, 2015 (tons/per day)
46
Notes: automotive is mainly caused by trucks; industrial mainly refer to coal-boiler use; coal-fired mainly refer to for heating and power
Source: Beijing Environmental Protection Bureau, Strategy& analysis

Strategy& | PwC
Moreover, the pollution has expanded to the urban areas, especially during heating season (2/2)
The dispersed coal spatial distribution in Beijing
High usage of
dispersed coalHeavy
pollution area
PM 2.5 concentrations in Beijing
47
National standard average concentration: 35μg/m3
Source: Beijing Environmental Protection Bureau, CRAES , Strategy& analysis
Strategy& | PwC
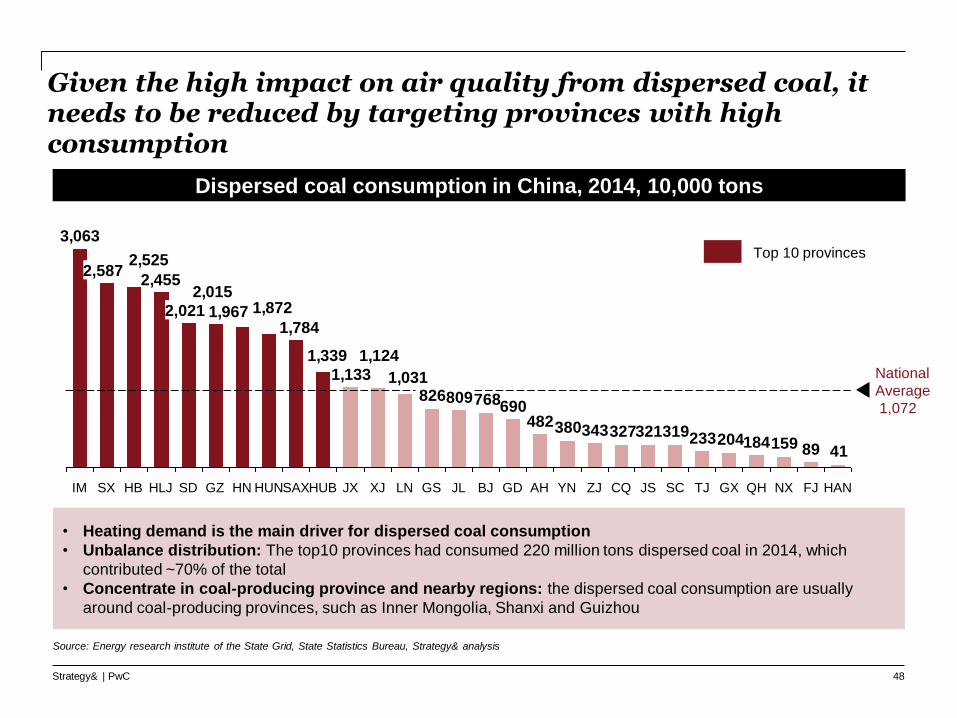
Given the high impact on air quality from dispersed coal, itneeds to be reduced by targeting provinces with high consumption
• Heating demand is the main driver for dispersed coal consumption
• Unbalance distribution: The top10 provinces had consumed 220 million tons dispersed coal in 2014, which
contributed ~70% of the total
• Concentrate in coal-producing province and nearby regions: the dispersed coal consumption are usually
around coal-producing provinces, such as Inner Mongolia, Shanxi and Guizhou
Dispersed coal consumption in China, 2014, 10,000 tons
48
4189159184204233319321327343380482690768809826
1,031
1,124
1,133
1,339
1,784
1,8721,967
2,0152,455
2,525
3,063
JLGSLNXJ QHGXHNGZSD
2,021
HLJHBSX
2,587
IM AHGD TJSCBJ FJNX
National
Average
1,072
HANZJYN JSCQJXHUBSAXHUN
Top 10 provinces
Source: Energy research institute of the State Grid, State Statistics Bureau, Strategy& analysis

Strategy& | PwC
Case: There are pioneers to promote residential gas usage to replace dispersed coal in rural area
Huagang: LNG- based supply for rural area
Gas source: PetroChina
LNG terminal … LNG terminal
…
Gasification
station
Gasification
station
Village gas
pipeline network
Village gas
pipeline network
End user
(villagers)
End user
(villagers)
Villages
Huagang
develops and
operates
gasification
and gas
pipelines
Huagang
grants and
installs
household
gas stove for
free
LNG and village gas pipeline
address the difficulties of gas
pipeline connection between
urban and rural areas
Household gas stove installation
and maintenance subsidy
ensure successful promotion
among villagers
49
CASE STUDY
Source: Oil Business Daily, Strategy& analysis

Strategy& | PwC
Case: Huagang’s rural gas promotion helps Renqiu reduce CO2, SO2 and NOX emissions significantly
Renqiu “gasifying villages” air emission
reduction (totaling 364 villages)
1mtons
Coal consumption reduction
2.6mtons
CO2 emission reduction
8.5ktons
SO2 emission reduction
7.4k tons
NOX emission reduction
Comparison with LPG
Pipeline gas LPG
Price
• 0.28RMB/Mcal
• ~45% of LPG
price
• 0.63RMB/Mcal
Safety
• Safer
• Supplier better
regulated
• Riskier
• Supplier poorly
regulated
Convenience
• Very
convenient for
use
• Less
convenient
due to fuel
loading
Supply
• Less impacted
by external
incidents
• More impacted
by extreme
weather, etc.
50
CASE STUDY
1) heat value of pipeline gas = 8500kcal/m3 with 90% thermal efficiency; heat value of LPG = 11000kcal/kg with 92% thermal efficiency
Source: Oil Business Daily, Strategy& analysis
Strategy& | PwC
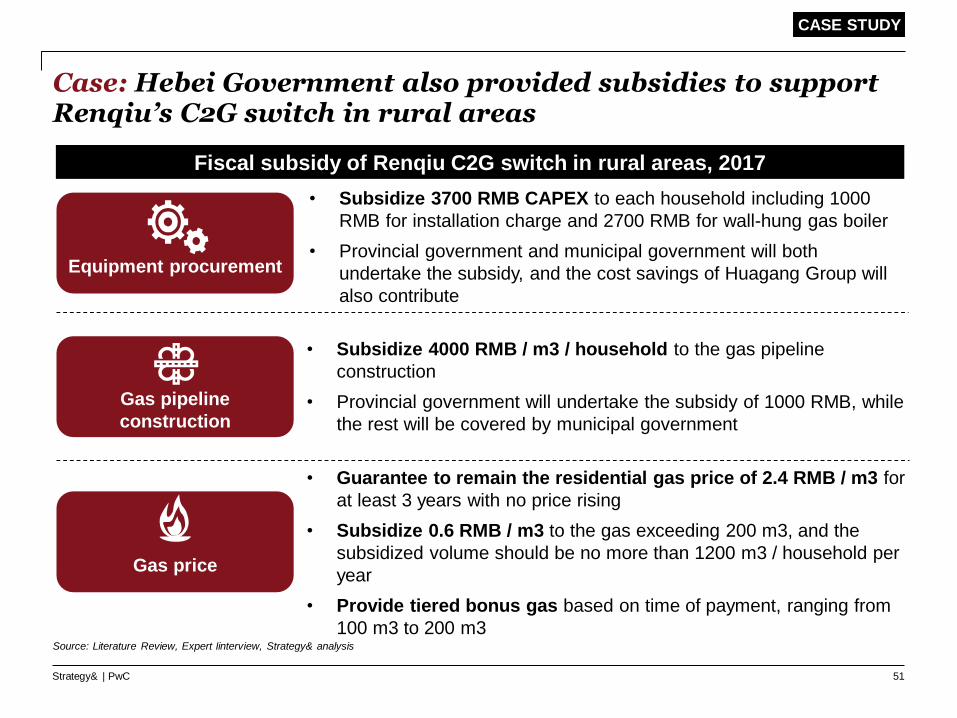
Case: Hebei Government also provided subsidies to support Renqiu’s C2G switch in rural areas
Fiscal subsidy of Renqiu C2G switch in rural areas, 2017
51
Equipment procurement
• Subsidize 3700 RMB CAPEX to each household including 1000
RMB for installation charge and 2700 RMB for wall-hung gas boiler
• Provincial government and municipal government will both
undertake the subsidy, and the cost savings of Huagang Group will
also contribute
• Subsidize 4000 RMB / m3 / household to the gas pipeline
construction
• Provincial government will undertake the subsidy of 1000 RMB, while
the rest will be covered by municipal government
Gas price
• Guarantee to remain the residential gas price of 2.4 RMB / m3 for
at least 3 years with no price rising
• Subsidize 0.6 RMB / m3 to the gas exceeding 200 m3, and the
subsidized volume should be no more than 1200 m3 / household per
year
• Provide tiered bonus gas based on time of payment, ranging from
100 m3 to 200 m3
Gas pipeline
construction
Source: Literature Review, Expert Iinterview, Strategy& analysis
CASE STUDY

Strategy& | PwC 52
Gas As Strategic Enabler For China’s Transformation
Promoting Gas Usage in High Value Sectors
Industrial Heating
Residential/Commercial
Co-generation - Centralized Heating
Co-generation - Distributed Energy
Power Generation
Policy Action to Realize Gas Potential

Strategy& | PwC
Centralized heating accounts for ~65% of total city heating demand in 2015, supported by fast growth of CHP
City centralized heating capacity (MW, 2015)
+13%
+2%
• According to 《电力行业十三五规划》(The 13th Five-
Year Plan for the Power Generation and Utility Industry),
CHP is to be the prior type of centralized heating for the
13th 5-year period, suggesting that gas CHP has potential
to replace current city heating coal boilers
29%41%
52% 53%
71%59%
48% 47%Large
coal boiler
2015
CHP
(include coal
and gas CHPs)
201220092006
06 – 15 GAGR
35%
Distributed
65%
Centralized
City heating demand breakdown (%, 2015)
• In 2015, coverage of city centralized heating
is estimated to be ~65%, indicating ~35% of
heat is provided by scattered boilers, out of
which the majority use coal
• City heating centralization is the trend
53
Source: Wind, Literature Review, Strategy& analysis
Strategy& | PwC
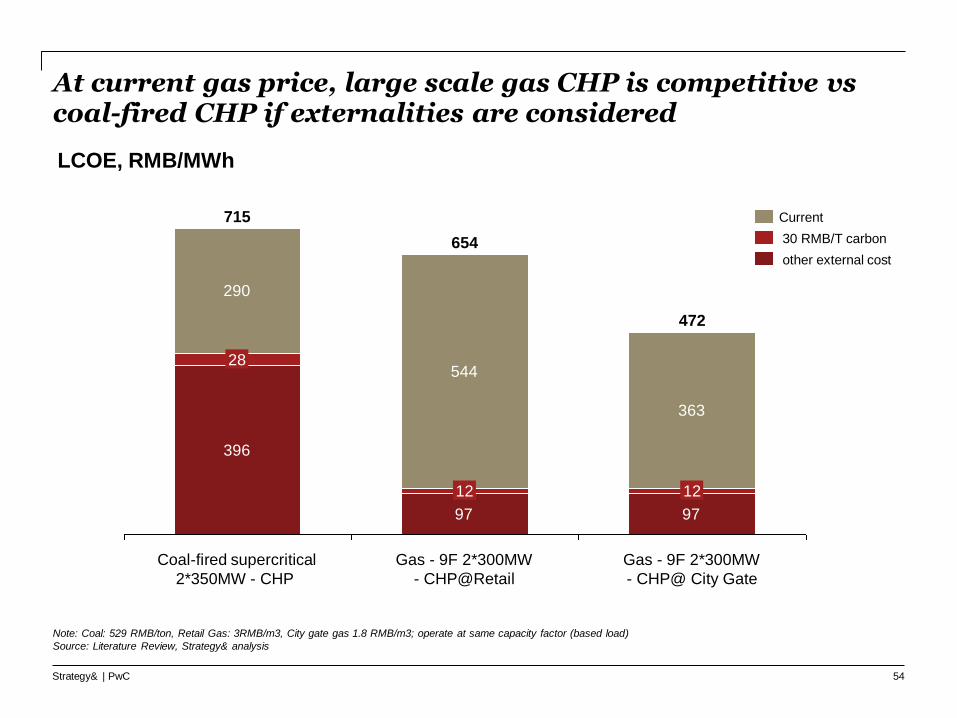
At current gas price, large scale gas CHP is competitive vs coal-fired CHP if externalities are considered
396
97 97
290
544
363
Gas - 9F 2*300MW
- CHP@ City Gate
Gas - 9F 2*300MW
- CHP@Retail
715
Coal-fired supercritical
2*350MW - CHP
12
654
28
472
12
Current
other external cost
30 RMB/T carbon
LCOE, RMB/MWh
54
Note: Coal: 529 RMB/ton, Retail Gas: 3RMB/m3, City gate gas 1.8 RMB/m3; operate at same capacity factor (based load)
Source: Literature Review, Strategy& analysis

Strategy& | PwC
Case: Shanxi Jiajie is the 1st large scale gas CHP project in Central China
Case profile
Shanxi Jiajie Heat and Power Plant
• Located: Taiyuan south urban area, Shanxi
• Scale: 860 MW in total, 2 * 298 MW gas turbine generator units + 1* 264 MW steam
turbine generators units
• Total investment: 2.76 billion RMB
• Annual energy efficiency: 61%
• Heating area: Over 12 million m2
• Gas supply: Pipeline gas or coal-bed gas
• Supplier: Shanxi Provincial Guoxin Energy Development Group Co., Ltd.
• Highlight: Shanxi Jiajie heat and power plant is not only the 1st large scale CHP project
in Shanxi, but also the most efficient gas-steam combined cycle CHP project in China
CASE STUDY
Source: Expert interview, Literature review, Strategy& analysis
55

Strategy& | PwC
Case: The plant has a much stricter emission standard than government requirements and significantly reduce air emission
Measured data by local government (unit: mg/m3)
5035
7
Coal-fired limits
-80%
Gas-fired limitsThis plant
SO2
100
50
14
This plant
-72%
Coal-fired limitsGas-fired limits
NOX
20.0
5.00.5
-90%
Gas-fired limitsThis plant Coal-fired limits
Smoke
dust
Pollutants reduction
• More than 62 coal-fired boilers in urban area,
and over 3800 small coal-fired boilers in
suburbs be replaced
Coal to Gas
956
921
220
SO2 1,594
NOX
Smoke
Dust10
0.1
Contribution of annual emission reduction (t/a)
Actual emission Reduction% of emission
reduction in Taiyuan
total emission
1%
1%
2%
Strict emission
56
CASE STUDY
Source: Expert interview, EIA report, Literature review, Strategy& analysis
Strategy& | PwC 57
Gas As Strategic Enabler For China’s Transformation
Promoting Gas Usage in High Value Sectors
Industrial Heating
Residential/Commercial
Co-generation - Centralized Heating
Co-generation - Distributed Energy
Power Generation
Policy Action to Realize Gas Potential

Strategy& | PwC
Distributed gas energy system is expected to grow rapidly by 2020
11.6
1.00.6
20142013 2015
50
Government
target
• By 2015, there are total
288 Gas DES projects in
China, far behind the
1000 Gas DES projects
target set by “The
guideline of developing
Gas distributed energy ”
in 2011
• Boosted by C2G and
other supporting
policies, Gas DES will
likely grow faster during
the next five years
Installed capacity of Gas Distributed Energy System ( DES) (unit: GW)
58
Note: 2015 data including existing, under construction and planning
Source: Gas DES market report 2016, Strategy& analysis

Strategy& | PwC
Over 50% of Gas DES projects are located in Yangtze river delta and North China
2278
23
46
69
8
8148
17
61
505506
1,4311,199
2,542
10
25
351
Shandong
1117
55
Shaanxi
19
32
Guangdong
22
1,726
Sichuan
31
5
16
35278
Hunan
16
47
5368
Jiangsu
034
Hubei
5
3
Chongqing
8
3
14227
Anhui
9
641
22
Tianjin
13
52
6
Zhejiang HebeiBeijing
32
45
766
Shanghai
57
3
396
Installed capacity(MW)
Construction EstablishedPreparation
Gas DES market distribution
Yangtze River Delta North ChinaSichuan &
ChongqingPearl River delta Other areas
• Project # 99 70 39 22 58
• Share 34.38% 24.31% 13.54% 7.64% 20.14%
• Installed capacity 2609 MW 1346 MW 2768 MW 1725 MW 2673 MW
• Share 23.46% 12.10% 24.89% 15.51% 24.03%
Selected province
59
Source: Gas DES market report 2016, Strategy& analysis

Strategy& | PwC
Industrial parks, commercial buildings, along with other stable energy demand are main Gas DES projects type in China
Others
4.9%
Hotel4.5%
Hospital 11.1%
Traffic hub
3.1%
School
4.5%
Data center
5.6%
Commercial & Office
buildings
29.2%
Industrial
park
37.2%
Gas DES market distribution (Including existing, under construction and planning)
By projects, Total 288 By installed capacity, total 11 GW
4.5%
Industrial park87.6%
Others
4.5%
Data center
3.5%
Commercial & Ofice
buildings
60
Source: Gas DES market report 2016, Strategy& analysis

Strategy& | PwC
Most projects operate at +70% efficiency and help to reduce emissions
0.9
1.1
1.5
5.9
13.1
17.6
24.2
91.1
Hotel
Office building
Hospital
Commercial building
Data center
Inudstrial park
School
Traffic hub
Installed capacity per project (unit: MW) Energy saving and emission reduction analysis(based on 46 selected case)
Energy utilization (unit: project #)
Average emission reduction (unit: tce/kw)
>70%33
(76.7%)
60%~70%
4
(9.3%)
40%~60%6
(14.0%)
1.251.331.371.431.641.75
Data
center
HospitalHotel Inudustrial
park
Office
building
Commercial
building
Total investment
(RMB /kw)
Incremental
investment
(RMB /kw)
• Gas engine 1900 ~2000 7000~8000
• GTCC 9000 ~10000 6000~7500
• micro turbine 20000~22000 16000~19000
Financial efficiency (based on 46 selected case)
61
Source: Gas DES market report 2016, Strategy& analysis

Strategy& | PwC
Some sectors such as data center, industrial park, traffic hub are good fit for Gas DES in China
1
1
2
24
91
14
18
2,500
3,000
3,500
4,000
4,500
5,000
5,500
1.0 1.1 1.2 1.3 1.4 1.5 1.6 1.7 1.8
HotelOffice building
Hospital
6 Commercial building
Data center
Annual utilization
hours (h)
Unit emission reduction
(tce/kw)
Inudstrial park
Traffic Hub
School
Potential ranking:
– Tier 1: Data Centre
– Tier 2: Industrial park ,
Traffic Hub,
– Tier 3: School, Hotel
(limited in installed
capacity)
– Tier 4 : Office building,
Hospital, Commercial
building
Bubble size: average installed capacity
(MW, from small to large)
1
3
2
62
Source: Gas DES market report 2016, Strategy& analysis

Strategy& | PwC
However, most data centers in China are not energy efficient, compared to US and best practice
1.2
1.9
China
US
PUE target for newly-built
data center in China:
1.5
>2.2
PUE comparison between China and USA
Power consumption break-down
35%
Air - conditioning
system
Power distribution
system
5%
Others
40%
18%
2%
UPS
IT device
• 75% of the electricity are
consumed by air -
conditioner and IT device
63
Notes*: Power Usage effectiveness = Total power consumption of data center / The power consumption of its IT device
Source: Ministry of Industry and Information Technology of China, The Green Grid, Strategy& analysis

Strategy& | PwC
Electricity accounts for 70% of data centre O&M cost, hence, energy efficiency is critical
3%
China Telecom 33%
Others
China Mobile
35%
28%
China Unicom
Case:China Unicom has the most data centers by
2015
Case:China Unicom spent 720 million RMB on
utilities (electricity & water & heating)
7.2
Ultilities
expense (2015)
105.6
14.8
Net profit
(2015)
Net profit
(2016, first 3 quarters)
70%
Electricity
30%
Others
O&M cost breakout of data center in China (national average)
Unit: 100 million RMB• According to the survey of the Ministry of
Industry and Information Technology in 2013
– The average electricity price of 255 data
centers in China was 0.87 RMB/ kwh.
– For large and hyper scale, the average price
were 0.66/kwh and 0.78/kwh, the latter
could be as low as 0.3 RMB/kwh
64
Source: Annual report of China Unicom, GDCT, Literature review, Strategy& analysis
Strategy& | PwC
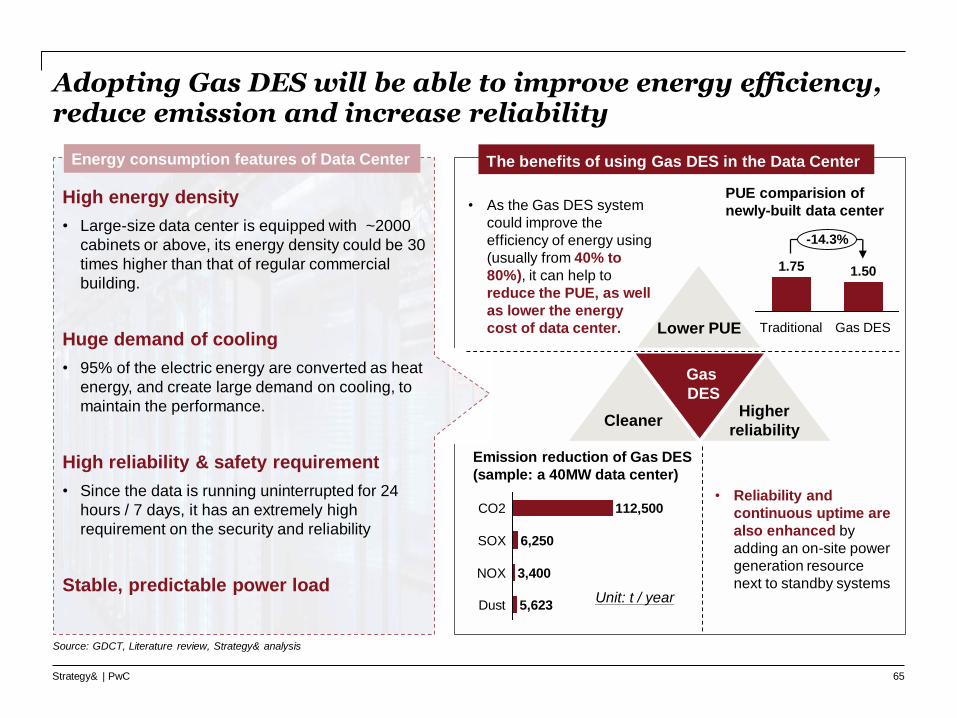
Adopting Gas DES will be able to improve energy efficiency, reduce emission and increase reliability
The benefits of using Gas DES in the Data Center
CleanerHigher
reliability
Lower PUE
Gas
DES
High energy density
• Large-size data center is equipped with ~2000
cabinets or above, its energy density could be 30
times higher than that of regular commercial
building.
Huge demand of cooling
• 95% of the electric energy are converted as heat
energy, and create large demand on cooling, to
maintain the performance.
High reliability & safety requirement
• Since the data is running uninterrupted for 24
hours / 7 days, it has an extremely high
requirement on the security and reliability
Stable, predictable power load
• As the Gas DES system
could improve the
efficiency of energy using
(usually from 40% to
80%), it can help to
reduce the PUE, as well
as lower the energy
cost of data center.
PUE comparision of
newly-built data center
1.75
Traditional Gas DES
1.50
-14.3%
Energy consumption features of Data Center
Emission reduction of Gas DES
(sample: a 40MW data center)
5,623
3,400NOX
Dust
SOX
CO2
6,250
112,500
Unit: t / year
• Reliability and
continuous uptime are
also enhanced by
adding an on-site power
generation resource
next to standby systems
65
Source: GDCT, Literature review, Strategy& analysis
Strategy& | PwC
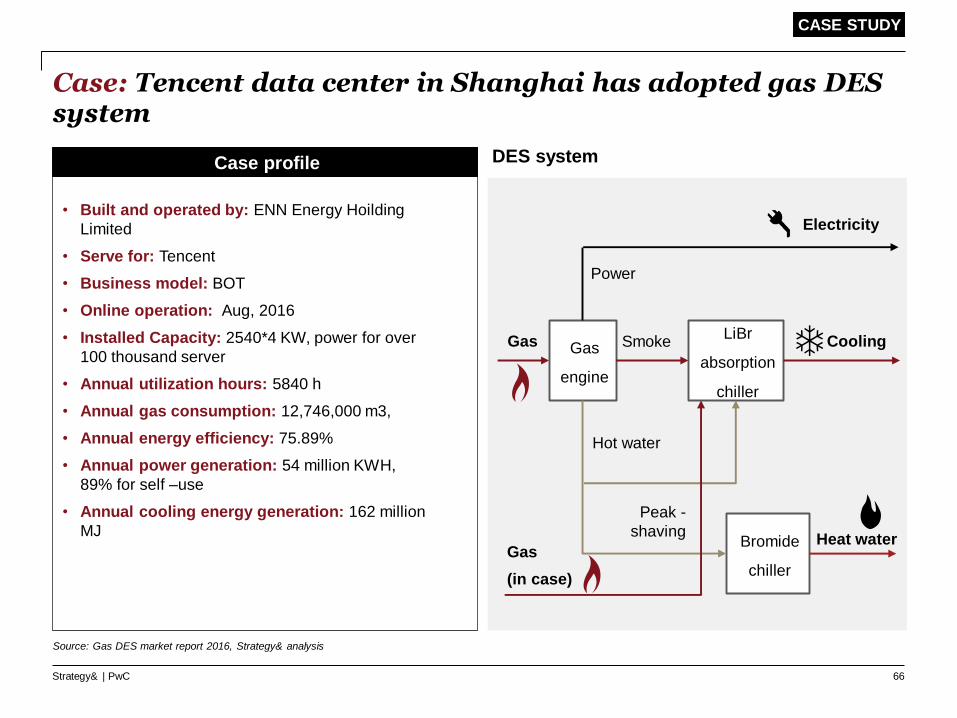
Case: Tencent data center in Shanghai has adopted gas DES system
Case profile
• Built and operated by: ENN Energy Hoilding
Limited
• Serve for: Tencent
• Business model: BOT
• Online operation: Aug, 2016
• Installed Capacity: 2540*4 KW, power for over
100 thousand server
• Annual utilization hours: 5840 h
• Annual gas consumption: 12,746,000 m3,
• Annual energy efficiency: 75.89%
• Annual power generation: 54 million KWH,
89% for self –use
• Annual cooling energy generation: 162 million
MJ
DES system
Electricity
Gas Gas
engine
Power
LiBr
absorption
chiller
Smoke Cooling
Bromide
chiller
Heat water
Hot water
Gas
(in case)
Peak -
shaving
66
CASE STUDY
Source: Gas DES market report 2016, Strategy& analysis

Strategy& | PwC
Case: The project demonstrated both environmental and energy efficiency benefit
4,812Energy
saving
CO2 12,510
Unit: tca / a
Unit: t / a
Operation PUE
Tencent
-36.4%
National
average
<1.4
>2.2
Annual emssion reduction and enegy saving
67
CASE STUDY
Source: Gas DES market report 2016, Literature review, Strategy& analysis
Strategy& | PwC
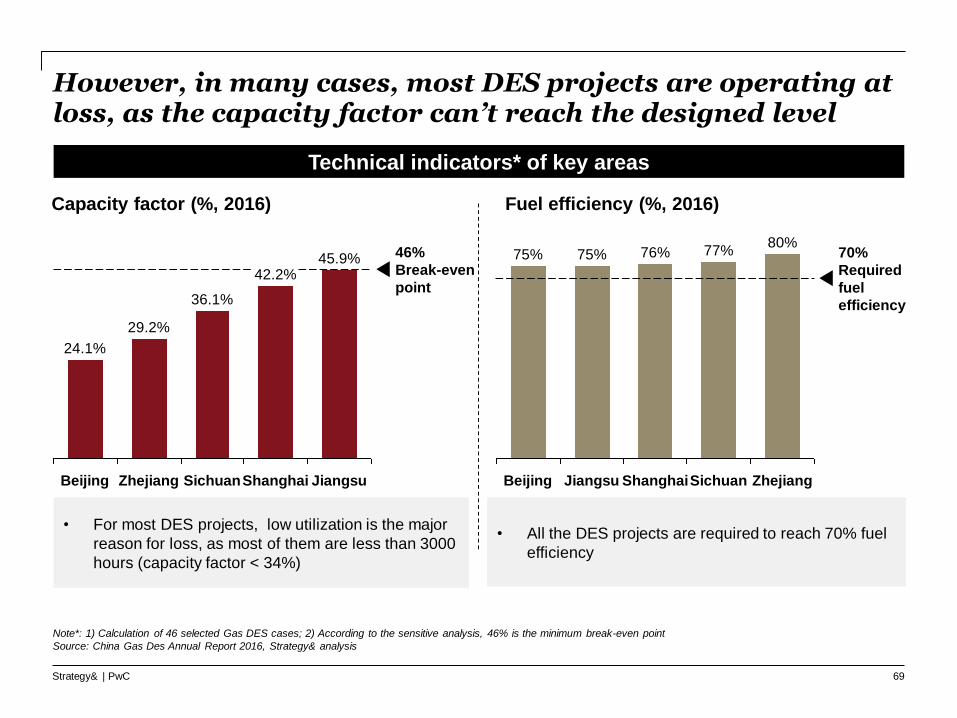
However, in many cases, most DES projects are operating at loss, as the capacity factor can’t reach the designed level
Technical indicators* of key areas
46%
Break-even
point
24.1%
Beijing
42.2%
Zhejiang Shanghai JiangsuSichuan
29.2%
45.9%
36.1%
Capacity factor (%, 2016) Fuel efficiency (%, 2016)
Zhejiang
80%
Sichuan
77%
Shanghai
76% 70%
Required
fuel
efficiency
JiangsuBeijing
75% 75%
• For most DES projects, low utilization is the major
reason for loss, as most of them are less than 3000
hours (capacity factor < 34%)
• All the DES projects are required to reach 70% fuel
efficiency
69
Note*: 1) Calculation of 46 selected Gas DES cases; 2) According to the sensitive analysis, 46% is the minimum break-even point
Source: China Gas Des Annual Report 2016, Strategy& analysis
Strategy& | PwC
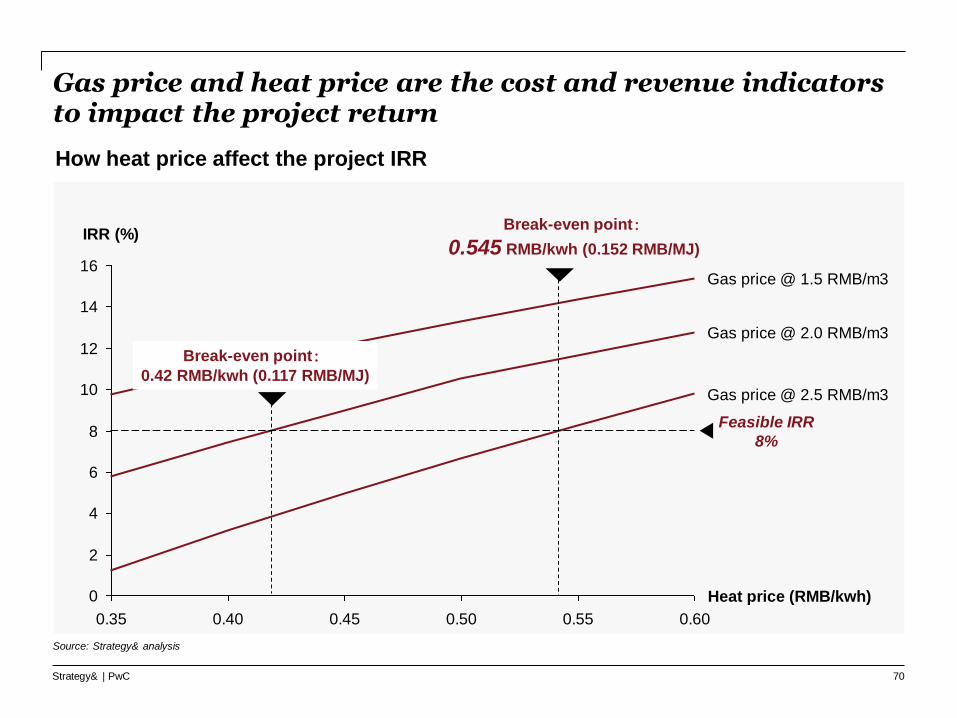
Gas price and heat price are the cost and revenue indicators to impact the project return
0
2
4
6
8
10
12
14
16
0.35 0.40 0.45 0.50 0.55 0.60
Feasible IRR
8%
Gas price @ 1.5 RMB/m3
Gas price @ 2.0 RMB/m3
Gas price @ 2.5 RMB/m3
Heat price (RMB/kwh)
IRR (%)
Break-even point:0.42 RMB/kwh (0.117 RMB/MJ)
How heat price affect the project IRR
Break-even point:
0.545 RMB/kwh (0.152 RMB/MJ)
70
Source: Strategy& analysis

Strategy& | PwC
Even though most projects have received subsidized gas price, low heat price reduces the economic benefit
Economics indicators* of key areas
3.22.72.42.4
2.1
3.23.7
3.22.42.7
Sichuan ZhejiangShanghaiJiangsuBeijing
Market gas priceCCHP gas priceGas price (RMB / Nm3, 2016)
0.18
0.140.12
0.100.10
Sichuan Beijing Shanghai Zhejiang
0.12 RMB/MJ
Break-even
point
Jiangsu
Heat price (RMB / MJ, 2016)• For most provinces, current
heat price are lower than the
expectation, results in poor
revenue of the DES project.
• Shanghai and Zhejiang offer
higher heat price for the
projects, which help to improve
the economic benefit
71
Note*: 1) Calculation of 46 selected Gas DES cases; 2) According to the sensitive analysis, 0.12 RMB/MJ is the minimum break-even point of heat price for a DES project
Source: China Gas Des Annual Report 2016, Strategy& analysis

Strategy& | PwC
Gas DES can help to develop a more integrated and competitive energy system
Gas
DES
Double peak shavingPromote the integration with smart energy
system
Become the driver for the transformation of
China power marketBecome the new driver for economic growth
• Since the inverse distribution of the consumption between power and gas, developing gas DES can help both on the seasonal peak and the day-night peak shaving
• With more customized and smart infrastructure, Gas CHP system can help promote the integration of different energy supply via a micro grid
• The Gas DES market is developing with flexible price mechanism and innovative business model, supporting power market development
• The development of the power spot market will help to further promote gas power development
• The development of Gas DES will drive the growth of other industries across the value chain, especially for the high-tech device and energy saving service
72
Source: Literature review, Gas DES market report 2016, Strategy& analysis

Strategy& | PwC
Gas DES can be integrated with other energy technology to promote integrated energy system in China
73
Integrated energy system — Mirco Grid
Wind PVGas DES StorageHeat pump Fuel cell
Source: Literature review, Gas DES market report 2016, Strategy& analysis
Strategy& | PwC
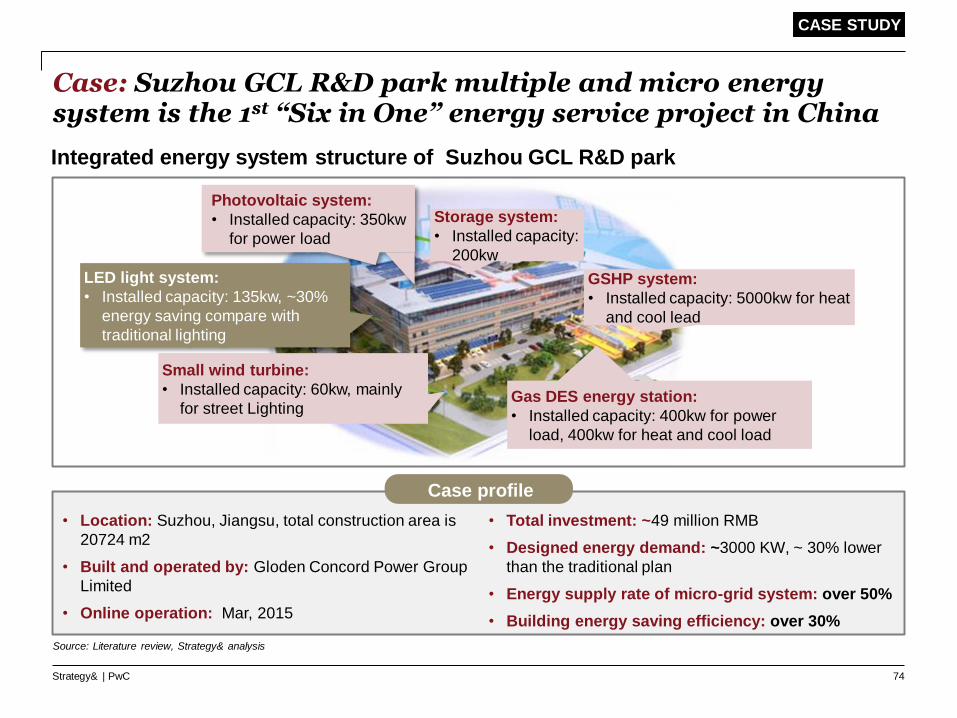
Case: Suzhou GCL R&D park multiple and micro energy system is the 1st “Six in One” energy service project in China
74
Case profile
• Location: Suzhou, Jiangsu, total construction area is
20724 m2
• Built and operated by: Gloden Concord Power Group
Limited
• Online operation: Mar, 2015
Integrated energy system structure of Suzhou GCL R&D park
• Total investment: ~49 million RMB
• Designed energy demand: ~3000 KW, ~ 30% lower
than the traditional plan
• Energy supply rate of micro-grid system: over 50%
• Building energy saving efficiency: over 30%
Photovoltaic system:
• Installed capacity: 350kw
for power load
GSHP system:
• Installed capacity: 5000kw for heat
and cool lead
Storage system:
• Installed capacity:
200kw
Gas DES energy station:
• Installed capacity: 400kw for power
load, 400kw for heat and cool load
Small wind turbine:
• Installed capacity: 60kw, mainly
for street Lighting
LED light system:
• Installed capacity: 135kw, ~30%
energy saving compare with
traditional lighting
Source: Literature review, Strategy& analysis
CASE STUDY

Strategy& | PwC
However, the development of Gas DES in China is still hindered by policy and market challenges
75
Policy related Market related
Power trading
market
• Implementation measures (market
access & retreat, power measuring…)
for gas DES’s participation in power
trading market is unclear
• Peak-shaving value can not be
realized without an ancillary market
Relationship
with grid
National policy
• Gas DES is treated as normal
power source during administrative
application, resulting in high project
feasibility study and application cost
• Currently no national subsidy
• Development of DES may impact
local power grid revenue and face
grid connection challenge
Financing
• Poor bankability due to project
uncertainty and lack of proven
successful experience/cases
Environmental
value
• DES environmental value
(NOx/SOx, PM, solid waste
reduction) are not fully
recognized in money value
Product price
• End products’ (power, heat, cool)
price are regulated but does not
take into account the risk of rising
labor and fuel cost
Source: Gas DES market report 2016, Literature review, Strategy& analysis

Strategy& | PwC 76
Gas As Strategic Enabler For China’s Transformation
Promoting Gas Usage in High Value Sectors
Industrial Heating
Residential/Commercial
Co-generation - Centralized Heating
Co-generation - Distributed Energy
Power Generation
Policy Action to Realize Gas Potential

Strategy& | PwC
Many planned coal-fired projects in China are suspended due to environmental and overcapacity concern
77
3,740
9,330 9,0206,640
4,0405,500
2,680 3,020
8,120
4,900
9,400
3,320 3,200
2,720
3,320
2,000 350
LiaoningGuandong Sichuan
2,000
Gangxi
3,020
Qinghai
700
Henan
7,360
Ningxia
3,380
5,500
Gansu
9,360
Shaanxi
10,640
10,640
12,220
Shandong
12,650
Inner
Mongolia
13,140
Xinjiang
15,540
10,640
Shanxi
18,780
10,660
Incorporated in the plan
Under Construction
Suspended projects by National Energy Administration of China (unit: MW)
Project
#19 18 10 10 9 6 6 6 5 4 3 1 1
• 98 coal-fired projects with total capacity of 114 GW, including under construction and planning, have been
suspend to 14th five-year or later (one has been directly cancelled) by National Energy Administration of China
• According to “China power industry 13th Five Year Plan”, total capacity of coal-fired power generator should
be kept in 1.1billion KW by 2020
Source: National Energy Administration, China power industry 13th Five Year Plan, Strategy& analysis

Strategy& | PwC
Moreover, Over 40% of China’s existing coal-fired capacities are already in regions with extremely high water stress level
78
Coal-fired power plants installed capacity (GW) distribution by water stress level
477
(52%)
437
(48%) 7
(2%)
376
(86%)
55
(13%)
Overwithdrawal (>100% above baseline)
High Stress (40%-80% above baseline)
Exremely high stress (80%-100% above baseline)
In water
stressed
region
Not in water
stressed region
Note: regions with water stress level at least 40% above baseline are considered stressed
Source: “OVERCAPACITY, OVER-WITHDRAWAL: HOW TACKLING COAL POWER OVERCAPACITY CAN EASE WATER STRESS”, GREEN PEACE

Strategy& | PwC
Coal power plant investors face trillions of asset stranding risk
Estimated scale of stranded asset for existing and
new coal plants (billion RMB)
3,086
843
(27%)
2,243
(73%)
2036
(20 years)
2031
(15 years)
Offline
year
1,426
(32%)
4,420
2,994
(68%)
2026
(10 years)
7,201
2,703
(38%)
4,498
(62%)
2021
(5 years)
2,051
(35%)
5,797
3,746
(65%)
Operating assets
Planned and under construction
• Assume all the coal-fired power
plants will be offline in 2036, over 3
trillion RMB will be stranded,27% are operating assets.
• If offline years will be brought
forward from 2036 to 2026, over 5
trillion RMB will be stranded, 35% are operating assets.
• Investment of coal-fired projects will
bear risk of capital misallocation
79
Source: “Stranded coal-fired power assets in China”, Oxford university, Literature review Strategy& analysis

Strategy& | PwC
At current price, gas – fired generation can be competitive even at base load if cost of externalities are considered
524
125 125
337
692
459
829
28
12
Gas - 9F 2*300MW -
Power Generation @ Retail
Coal-fired Ultra supercritical
2*660MW - Power Generation
889
Gas - 9F 2*300MW - Power
Generation @ City Gate
595
12
Current
other external cost
30 RMB/T carbon
LCOE, RMB/MWh
80
Note: Coal: 529 RMB/ton, Retail Gas: 3RMB/m3, City gate gas 1.8 RMB/m3; operate at same 57% capacity factor (based load)
Source: Strategy& analysis

Strategy& | PwC
In China, most provinces have set ambitious RPS targets to encourage the development of renewable energy
Region 2020 RPS targets
2015 Renewable
power
consumption
ratio
2020 – 15
differenceRegion
2020 RPS
targets
2015 Renewable
power
consumption
ratio
2020 – 15
difference
Beijing 10.0% 7.6% 2.4% Jiangsu 7.0% 3.3% 3.7%
Tianjin 10.0% 7.6% 2.4% Chongqing 5.0% 1.4% 3.6%
Shannxi 10.0% 2.7% 7.3% Tibet 13.0% 8.2% 4.8%
Hainan 10.0% 2.8% 7.2% Xinjiang 13.0% 10.5% 2.5%
Liaoning 13.0% 4.0% 9.0% Hebei 10.0% 7.6% 2.4%
Shandong 10.0% 7.7% 2.3% Jiangxi 5.0% 2.2% 2.8%
Henan 7.0% 2.3% 4.7% Heilongjiang 13.0% 11.1% 1.9%
Shanxi 10.0% 7.0% 3.0% Guizhou 5.0% 2.0% 3.0%
Guangdong 7.0% 1.8% 5.2% Guangxi 5.0% 1.0% 4.0%
Zhejiang 7.0% 2.4% 4.6% Fujian 7.0% 3.4% 3.6%
Yunnan 10.0% 5.1% 4.9% Jilin 13.0% 12.2% 0.8%
Hunan 7.0% 2.8% 4.2% Qinghai 10.0% 13.5% -3.5%
Hubei 7.0% 3.7% 3.3% Ningxia 13.0% 13.4% -0.4%
Anhui 7.0% 3.9% 3.1% Gansu 13.0% 11.4% 1.6%
Shanghai 5.0% 1.6% 3.4% Inner Mongolia 13.0% 12.0% 1.0%
Sichuan 5.0% 1.4% 3.6%
81
Note: RPS is Renewable Portfolio Standard
Source: National Statistics Bureau, Strategy& analysis
Strategy& | PwC
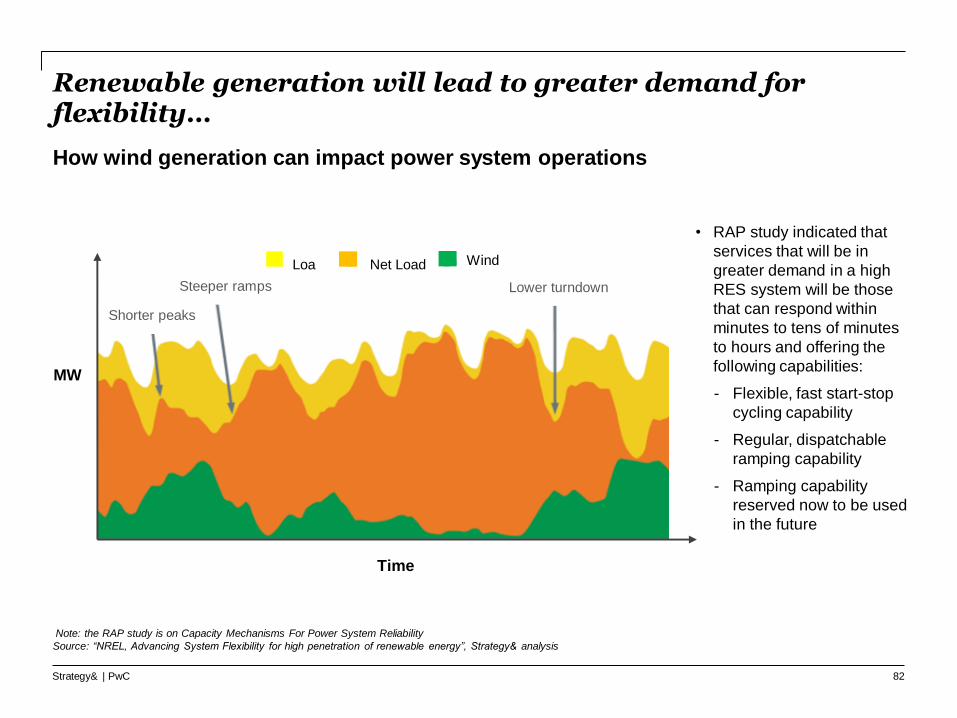
Renewable generation will lead to greater demand for flexibility…
How wind generation can impact power system operations
Loa
d
Net Load Wind
Shorter peaks
Steeper ramps Lower turndown
Time
MW
82
• RAP study indicated that
services that will be in
greater demand in a high
RES system will be those
that can respond within
minutes to tens of minutes
to hours and offering the
following capabilities:
- Flexible, fast start-stop
cycling capability
- Regular, dispatchable
ramping capability
- Ramping capability
reserved now to be used
in the future
Note: the RAP study is on Capacity Mechanisms For Power System Reliability
Source: “NREL, Advancing System Flexibility for high penetration of renewable energy”, Strategy& analysis

Strategy& | PwC
… and larger share of peaker/mid-merit will help to increase overall efficiency in a renewable energy world
RES
Peak Mid merit
Baseload
Impact of thermal plant mix on investment and plant utilization rates
Legacy
(MWh produced)
0
20
40
60
80
PeakMid-meritBaseload
Annual (MWh)
Used
Idle
Transformed
(MWh produced)
RES
PeakMid merit
Baseload
Plant utilization
Plant utilization
0
20
40
60
80
Annual (MWh)
PeakMid-meritBaseload
Idle
Used
83
Base load: power plants that are designed to operate around the clock and that cannot change their output dynamically
Source: “IEA, The Power of Transformation: Wind, Sun and the Economics of Flexible Power Systems”, Strategy& analysis
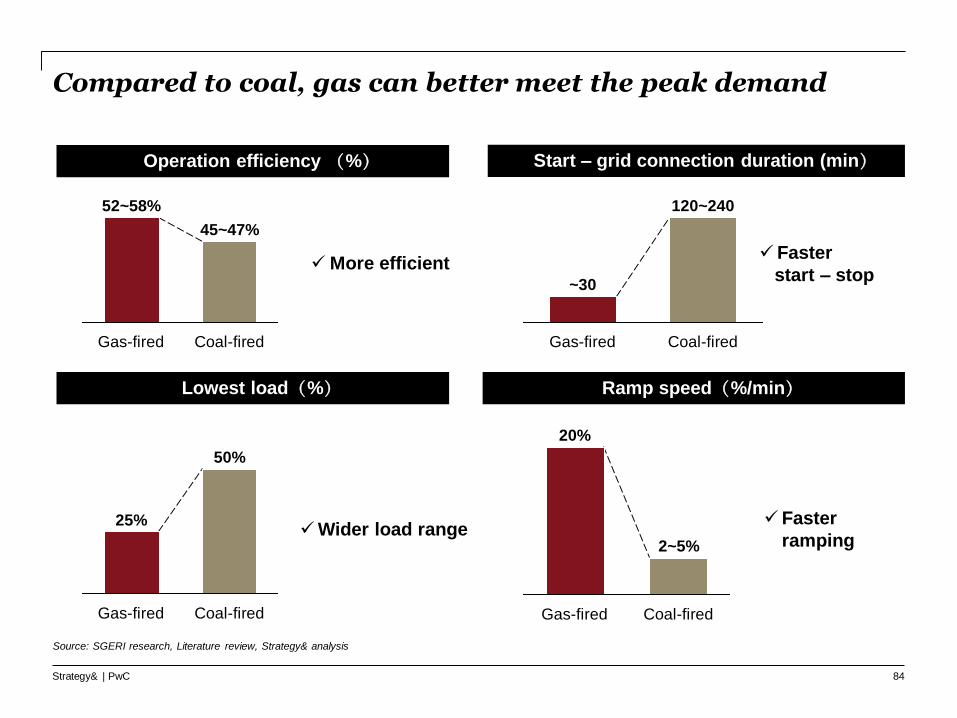
Strategy& | PwC
Compared to coal, gas can better meet the peak demand
More efficient
Gas-fired
52~58%
45~47%
Coal-fired
~30
Coal-fired
120~240
Gas-fired
Operation efficiency (%) Start – grid connection duration (min)
Gas-fired Coal-fired
50%
25%
Faster
start – stop
Wider load range
20%
Coal-firedGas-fired
2~5%
Faster
ramping
Lowest load(%) Ramp speed(%/min)
84
Source: SGERI research, Literature review, Strategy& analysis

Strategy& | PwC
However, current pricing mechanism has limited the peak shaving potential
• Current pricing mechanism has greatly
limited the peak shaving potential:
– Current pricing mechanism is opaque,
varied greatly among generators.
– Most gas generators receive single
pricing, which only consider the power
generation.
– Current pricing mechanism can’t reflect
the value of peak-shaving and
environment protection
• Low utilization hours: 70% of gas power
generator in China is used for peak
shaving, the average utilized hours is only
~2500 hours
• High operation cost: Due to frequently
start-stop, over 100 million RMB is
required by maintenance.
2,6532,938
3,969
2,500
+59%
Average of
thermal power
in 2015
2015E20132012
Others60
(33%)
Device
maintance
120
(67%)
Main bottleneck
Annual utilization hours of gas power generator (h)
Maintenance cost of a sample generator (100m RMB)
85
Source: National Energy Bureau, Literature review, Strategy& analysis

Strategy& | PwC
There are mainly 3 ways to price the flexibility value of a power peaker
86
TOU
price
Ancillary
service
market
Capacity market
TOU price:
• The TOU price should
reflect different power
generation cost and
market value based on the
load demand
• In other countries like US,
the power price of peak
time is 1.8~2 times higher
than the average feed-in
tariff, 5~8 times higher
than the off-peak
Ancillary service
market:
• Through establishing
ancillary service market,
power generator can
gain extra income by
providing ancillary
service such as
regulation and peak
shaving.
• Some generator in UK
have gained half of their
revenue from ancillary
service
• Through bidding and transaction mechanism, power generator with low utilizations can benefit from capacity
market by selling the extras
Capacity market:
Source: Literature review, Strategy& analysis

Strategy& | PwC 87
Gas As Strategic Enabler For China’s Transformation
Promoting Gas Usage in High Value Sectors
Industrial Heating
Residential/Commercial
Co-generation - Centralized Heating
Co-generation - Distributed Energy
Power Generation
Policy Action to Realize Gas Potential

Strategy& | PwC
Policy action to realize gas potential
88
Standards
development 3
• Develop standards and procedures for LNG-based supply to
encourage supply competition
Support
gas CHP 6
• Capacity factor guarantee, tax favor (VAT wave for example, green
finance (lower interest rate) and price subsidy for large-scale gas
CHP at environmental sensitive regions
Increase pollutants
fees & penalty rates4
• Increase emission fees, penalty (NOx/ SOx/PM) and water resource
fee to reflect true externality
Support
DES7
• Equipment subsidy, energy saving subsidy, reserve capacity fee
exemption for distributed gas and promotion through wholesale
power market
Industrial
user subsidy 5 • Provide tax, equipment and gas price subsidy to encourage coal-to-
gas switch in high potential industry and region
Transparent
pricing 2
• Transparent pricing on the transmission and distribution gas pipeline
cost and cut “middleman” cost
Market
education1
• Promote successful coal to gas switch cases to raise market
awareness and provides capacity building support to enable better
end-user decision
Peak plant
pricing8
• Promote spot and ancillary market to capture gas power's value of
flexibility
Source: Expert interview, Strategy& analysis

Strategy& | PwC 89
Abbreviation Definition
C2G Coal to Gas
CCHP Combined Cooling, Heating and Power
CHP Combined Heat and Power
CM Coal Mining
CSR Corporate Social Responsibility
FMM Ferrous Metal Mining
FMP Ferrous Metal Processing
GE General Equipment
GSHP Ground Source Heat Pumps
GTCC Gas Turbine Combined Cycle
LCOE Levelized Cost Of Electricity
MPR Metal Product Repairing
NMM Nonferrous Metal Mining
NMP Nonmetallic Mineral Processing
OP Oil Processing
PUE Power Usage Effectiveness
RAP Regulatory Assistance Project
RES Renewable Energy Source
RPS Renewable Portfolio Standard
SE Specialized Equipment
TOU Time of Use
Glossary

Strategy& | PwC 90
This content is general information purposes only, and should not be used as a substitute for consultation with professional advisors. The reader
should not act upon the information contained in this publication without obtaining specific professional advice. No representation or warranty
(express or implied) is given as to the accuracy or completeness of the information contained in this publication, and, to the extent permitted by
law, PwC Strategy& (Shanghai) Ltd., its partners, principals, employees and agents neither owe nor accept any duty or responsibility for it, and
shall not be liable in respect of any loss, damage or expense of whatsoever nature which is caused by any use the reader may choose to make of
this publication.
© 2017 PwC Strategy& (Shanghai) Ltd.. All rights reserved. PwC refers to the China member firm, and may sometimes refer to the PwC network.
Each member firm is a separate legal entity. Please see www.pwc.com/structure for further details.


