Currency carry trades in Latin America - Bank for ... Papers No 81 Currency carry trades in Latin...
46
BIS Papers No 81 Currency carry trades in Latin America Report submitted by a Study Group established by the Consultative Group of Directors of Operations in the Americas Region and chaired by Julio A Santaella, Bank of Mexico Monetary and Economic Department April 2015 JEL Classification: F31, G15
Transcript of Currency carry trades in Latin America - Bank for ... Papers No 81 Currency carry trades in Latin...
BIS Papers No 81
Currency carry trades in Latin America Report submitted by a Study Group established by the Consultative Group of Directors of Operations in the Americas Region and chaired by Julio A Santaella, Bank of Mexico
Monetary and Economic Department
April 2015
JEL Classification: F31, G15

The views expressed are those of the authors and not necessarily the views of the BIS.
This publication is available on the BIS website (www.bis.org).
© Bank for International Settlements 2015. All rights reserved. Brief excerpts may be reproduced or translated provided the source is stated.
ISSN 1609-0381 (print) ISBN 978-92-9197-081-0 (print)
ISSN 1682-7651 (online) ISBN 978-92-9197-080-3 (online)

BIS Papers No 81 iii
Content
Executive summary ................................................................................................................................. 1
I. Introduction ....................................................................................................................................... 2
II. Carry trade strategies ..................................................................................................................... 3
A. Three types of currency carry trade ............................................................................... 3
Box 1: Two interest parity conditions relevant for carry trades ............................................ 5
1. Carry trade strategy with acquisition of domestic assets ............................ 6
2. Carry trade using (deliverable) FX swaps ............................................................ 6
3. Currency carry trade strategies using non-deliverable forwards or futures .............................................................................................................................. 7
Box 2: Alternative carry trade or related strategies ................................................................... 9
B. Arbitrage or other trades ................................................................................................. 10
C. Portfolio carry trades ......................................................................................................... 12
III. Market characteristics relevant for carry trades ................................................................ 12
A. Foreign investors, counterparties and positions .................................................... 12
B. Maturities, hedging, leverage and funding currencies......................................... 13
C. Funding currencies in Latin America ........................................................................... 14
D. Regulations and policies affecting carry trades ...................................................... 15
IV. Investor perspectives: has the importance of carry trades declined? ....................... 16
V. Indicators of carry trade activity .............................................................................................. 20
A. Indicators of incentives for carry trades (returns and risks) ............................... 20
B. Indicators of arbitrage opportunities and market liquidity ................................ 21
C. Indicators of position-taking .......................................................................................... 22
D. Additional investor perspectives on indicators of carry trade activity ........... 24
VI. Conclusion: what have we learned about carry trades in Latin America? ............... 25
Annex I Some research on carry trades ........................................................................................ 27
Annex II Positioning indicators ........................................................................................................ 29
Annex III Graphs ..................................................................................................................................... 30
References ................................................................................................................................................ 38
Glossary of selected terms used in this report .......................................................................... 41
Acronyms, abbreviations and other terms ................................................................ 41
CCA/CGDO Study Group on Carry Trades ................................................................................... 42


BIS Papers No 81 1
Currency carry trades in Latin America
Report submitted by a Study Group established by the Consultative Group of Directors of Operations in the Americas region. This Study Group was chaired by Julio A Santaella, Bank of Mexico.1
Executive summary
Carry trades are transactions in which a low-interest funding currency is borrowed to invest in assets in a higher-interest destination currency without hedging for currency risk. They raise both macroeconomic and financial stability concerns because they may contribute to extended periods of currency appreciation followed by sudden currency declines.
In Latin America the three main ways to implement carry trades are reportedly: (i) purchasing debt denominated in the destination currency, as observed in a number of Latin American countries; (ii) taking a long position in the destination currency in the (deliverable) swap market, as seen in Mexico; and (iii) taking a long position in the non-deliverable forwards market, as practised in a number of countries in South America. Derivatives positions may be priced so as to earn returns similar to those from purchasing debt denominated in the destination currency. Arbitrage and other trades are also an important motivation for cross-border portfolio investments.
Regulations and market characteristics influence the types of international portfolio investor (ie hedge fund, real money or domestic corporates), their portfolio investment strategies (spot or derivatives markets, deliverable or non-deliverable, extent of hedging etc), and their domestic counterparties. For example, regulations that limit or increase the cost of foreign access to domestic financial markets appear to have encouraged the development of offshore non-deliverable forward foreign exchange markets in the region. Foreign exchange policy (ie intervention) can also influence carry trades. Regulations and taxes have played an important role in the types of market used by foreign investors.
Consultations with the private sector suggest that narrower interest rate differentials have reduced the profitability of carry trade positions. The attractiveness and feasibility of carry trades have been further impaired by the reduced availability of financing for risky leveraged positions, in part due to changes in regulation in the aftermath of the global financial crisis. As a result, in recent years, real money investors who rely less on leverage and who have longer investment horizons have reportedly played an expanded role in cross-border portfolio investment. At the same time, the relative importance of hedge funds has reportedly declined, as has the use of carry trades as an investment strategy.
1 This document was submitted on 17 December 2014, and was subsequently approved by the BIS
Consultative Council for the Americas (CCA) for publication.
2 BIS Papers No 81
While carry trades cannot be directly measured, a number of price and quantity indicators shed light on incentives for carry trades and position-taking resembling such trades. The interest rate differentials adjusted for exchange rate volatility (as measured by the carry-to-risk ratio), have been elevated for extended periods in recent years but have fallen below recent peaks in a number of countries. While incentives for carry trades and some positions taken by foreign investors may be consistent with carry trades, the data are not conclusive. For example, purchases by foreign investors of domestic debt securities have risen considerably but fluctuations are not closely correlated with changes in carry trade incentives. Long forward positions in destination currencies show a higher correlation with carry trade incentives over some periods.
I. Introduction
Capital inflows and reversals pose a number of challenges for monetary authorities in emerging market economies (EMEs). Among the various types of capital flow, currency carry trades raise particular concerns because they may be destabilising: carry trades may contribute to extended periods of currency appreciation, moving and keeping the real exchange rate away from its fundamental equilibrium, and thus eroding competitiveness. Currency carry trades may also be associated with currency crash risks because, in their typical form, they are funded mostly by debt. A shock that produces losses can be amplified by so-called liquidity spirals. Speculators facing funding constraints will close out their positions, further undercutting prices, which can lead to further tightening of funding constraints and close-outs. Recent studies (Brunnermeier and Pedersen (2009); Brunnermeier, Nagel and Pedersen (2009)) provide a theoretical framework and supporting evidence.
While carry trades raise important policy issues and may pose significant risks, it is usually not possible to measure them directly. To study carry trades, academic studies often focus on the returns from alternative carry trade strategies that can be shown to be profitable or on publicly available data on positions taken in certain markets that are consistent with carry trades. However, only limited information is available on actual strategies implemented, the mechanics of carry trade transactions and indicators used to monitor carry trades – which will depend on institutional conditions affecting investors and the funding and destination currencies.2
This makes it harder to assess how far investors are engaged in carry trades, and whether the importance of such trades has changed over time. On the one hand, a number of indicators suggest that some incentives continue to exist for carry trades and position-taking consistent with carry trades. At the same time, gross portfolio investments into Latin America have recovered significantly after the
2 Currency carry trades may also be destabilising in part because of their interaction with monetary
policy. Plantin and Shin (2011) show that the more sensitive is the recipient economy to overheating due to capital inflows, the more likely it is that greater capital inflows will fuel further increases in the recipient country’s (policy) interest rate. This increases the carry trade’s attractiveness, pulling in additional capital inflows. Capital inflows and monetary policy can thus interact to create a vicious circle that encourages destabilising carry trade inflows. For a brief discussion of research on carry trades, see Annex I.

BIS Papers No 81 3
Lehman Brothers bankruptcy and there is evidence of purchases by foreign investors of domestic debt securities or long forward positions in domestic currencies, which are all consistent with carry trades. In line with this, foreign exchange derivatives have been major contributors in the growth of currency turnover in EMEs.3
On the other hand, consultations with the private sector suggest that lower interest rate differentials between destination and funding currencies and a reduced availability of financing for risky leveraged positions have significantly reduced the profitability of carry trades. As a result, in recent years, real money investors who rely less on leverage and who have longer horizons have reportedly played a larger role in cross-border portfolio investment. At the same time, the relative importance of hedge funds has reportedly declined, as has the exclusive reliance on carry trades as an investment strategy.
The purpose of this study is to shed some light on some of the characteristics of currency carry trades in the Americas region. Drawing on responses by central banks to a questionnaire and discussions with investors and other market participants (“market intelligence”), we describe alternative carry trades and related instruments and counterparties, some indicators of carry trade activity that are monitored by central banks, and discuss reports of the apparent decline in the availability of leveraged financing for cross-border portfolio investments, including carry trades.
The study has been carried out at the request of the BIS Consultative Council for the Americas (CCA) by a Study Group of the Consultative Group of Directors of Operations in the Americas Region (CGDO). The report seeks to draw on the comparative advantage of the CGDO in terms of market intelligence and operational knowledge.
II. Carry trade strategies
A. Three types of currency carry trade
Currency carry trades may be defined as investment strategies that borrow low-interest rate currencies (funding currencies) in order to invest in high-interest rate currencies (destination or target currencies), typically with short-term
3 See Ehlers and Packer (2013), who review data from the BIS Triennial Central Bank Survey of foreign
exchange and derivatives market activity in 2013. They note the growth in turnover in EME (mainly OTC) derivatives since 2010 with the most rapid growth for transactions by “other financial institutions” (including official sector financial institutions) and a surge in offshore trading of EME currencies, far outpacing the growth in total FX turnover in EME currencies. Among the currencies with the highest growth in OTC market turnover are the Chinese renminbi, Mexican peso, Turkish lira and Russian rouble. They find that the trading of EME currencies is positively related to the size of cross-border financial flows. They also suggest that, aside from hedging or speculation, the relatively smaller share of spot trading in the FX market turnover of EME currencies may also reflect the still limited scale of high-frequency trading (HFT) in these currencies, as HFT is more common in spot than in derivatives markets.

4 BIS Papers No 81
instruments. The currency risk in a currency carry trade is unhedged.4 Research shows that these trades are profitable over long horizons, which poses a puzzle because such profitability violates the uncovered interest rate parity (UIP) condition (see Box 1). Under UIP, high-interest rate currencies are expected to depreciate to fully offset any gains from the interest rate differential with low-interest rate currencies, while low-interest rate currencies are expected to appreciate. An extensive literature (see Annex I for some references) finds that this is not necessarily the case, which is why carry trades have tended to be profitable over longer periods. A recent analysis (Duarte and Romero (2014)) shows that the failure of uncovered interest parity persists; UIP has not held since early 2009. Daily (excess) returns from currency carry trades have been positive over the same period.
The recent literature on carry trades has suggested that the excess returns generated by currencies with high interest rates is a compensation for providing liquidity in the face of the risk of unexpected events which might cause significant losses (see Brunnermeier and Pedersen (2009)). Brunnermeier, Nagel and Pedersen (2009) also found that, in carry trade strategies, positive interest rate differentials are associated with negative conditional skewness of exchange rate movements (destination currencies are subject to the risk of a crash) and generally the crash risk may discourage speculators from taking on large enough positions to enforce UIP. However, a recent study by Hassan and Mano (2014) casts doubts on some of the preceding explanations. Using a large set of currencies over a long time span, they reject the hypothesis that high-interest rate (destination) currencies tend to appreciate relative to low-interest rate currencies.
While all currency carry trades seek to profit from the favourable interest differential between destination currencies and funding currencies, there are significant differences in how currency carry trades are implemented in various markets in Latin America. These reflect differences in the degree of financial market development and integration as well as regulations that influence the profitability of alternative carry trade instruments or investment vehicles.
According to conversations with US-based market participants, currency carry trades are most frequently transacted in derivative markets (futures, forwards, FX swaps and, to a lesser extent, options), although cash transactions are not uncommon. The view is that activity tends to be concentrated in shorter tenors, of less than six months. According to the BIS Triennial Central Bank Survey of foreign exchange and derivatives market activity, FX swap maturities tend to be even shorter (seven days or less).
Central bank responses to a questionnaire provide additional perspective. In particular, we may distinguish between three types of currency carry trade strategy involving Latin American destination currencies, depending on the instrument used to take a position in the destination currency (for a summary, see Box 2). First, a carry trade strategy involving the acquisition of domestic debt denominated in the destination currency; second, a long deliverable forward position in the destination
4 As discussed below, some market participants take a broader view of what may be considered a
carry trade, or take into account carry returns from investment strategies that are based on other considerations (eg fundamentals), involve longer investment horizons or are at least partially hedged.

BIS Papers No 81 5
currency; and third, currency carry trade strategies using non-deliverable forwards (NDFs) or futures.
Box 1: Two interest parity conditions relevant for carry trades
To provide some context for currency carry trades and their returns, it is worth highlighting two well known interest rate parity conditions, which will provide a framework for discussing the rationale for various strategies based on their returns.
The first is uncovered interest rate parity (UIP), which predicts that any differential between a high-interest rate (destination) currency and a low-interest rate (funding) currency at t=0 will be fully offset by the expected change in the exchange rate between t=0 and t=1. In particular, under UIP the exchange rate of the high-interest rate currency would be expected to depreciate so that there are no gains to be made (relative to the low-interest rate currency) from investing in that currency. UIP may be described by the equation:
− ∗ = ( − ) (1)
where i is the high interest rate for the destination currency, i* is the low interest rate for the funding currency (with the underlying instruments maturing in period 1), is the expected exchange rate (in logs of units of the destination currency in terms of the funding currency) in period 1 and is the log of the exchange rate in period 0.
The relevance of UIP for carry trades may be seen by noting that the expected return from the carry trade strategies discussed in the text may be summarised as follows:
Expected return= − ∗ − ( − ) (2)
If UIP holds in equation (1), the expected change in the exchange rate would offset the interest rate differential, and the expected return in (2) would be zero.
The second is covered interest rate parity (CIP), which states that the interest rate differential between a high-yielding and a low-yielding currency will be equal to the spread between the forward and spot exchange rates of the two currencies, which in turn is the expected change in the exchange rate plus a risk premium. We may describe CIP by the following equation:
− ∗ = − (3)
Where is the log of the forward exchange rate for period 1 set in period 0. Equation (3) implies that the earned carry (the interest rate differential) would equal the cost of hedging. Thus, unless there are distortions in the forward market such as those observed during the global financial crisis, an investor writing a forward contract that satisfies CIP has fully hedged foreign exchange and other risks embedded in the risk premium and will receive zero excess returns from the interest rate differential.
CIP, or equation (3) can also be interpreted as the interest rate differential that is implied by the forward premium. Thus, for a given funding or destination interest rate, it can be solved for the remaining interest rate. This makes CIP particularly useful for the analysis of derivatives implied interest rates, which are relevant for assessing returns on carry trades that are often implemented in derivatives markets. For example, if an interest rate from global financial markets (eg LIBOR) is taken as the funding rate, then the CIP-implied interest rate for the destination currency can be derived as follows:
= + − (4)
Alternatively, if an interest rate from the debt or money markets of the destination currency is taken as the return, the CIP-implied interest rate (in the destination FX market) for the funding currency can be derived. Under normal conditions the CIP-implied interest rate for the funding currency would be close to LIBOR. Equation (4) can then be used to estimate the CIP-implied interest rate in the derivatives market for the destination currency at various maturities, which can be compared to the corresponding interest rates in destination currency fixed income markets.

6 BIS Papers No 81
1. Carry trade strategy with acquisition of domestic assets
In this case, the investor borrows the funding currency and buys the destination currency in the spot market today. The investor can then earn the destination currency yield by investing in a fixed income security (denominated in the destination currency) that matures at some point in the future. Once the security is sold (or the position is closed), the investor would buy the funding currency in the spot market and pay off the funding currency debt principal plus interest. If the position is unhedged and held to maturity, the expected return on this strategy is the interest differential minus the expected exchange rate depreciation.
Based on market intelligence and reported foreign holdings of domestic securities, foreign purchases of domestic securities appear to have been relevant for carry trades in Brazil, but have also been observed in Mexico, Peru and Colombia (see discussion of Graph A4 below). In Brazil, the most usual (onshore) carry trade has involved the purchase of long-tenor nominal government bonds (2021, 2023 and 2025 NTN-Fs. An alternative is to purchase short-term LTNs, or credit-linked notes (CRIs and CRAs) with no hedge. All products related to carry trades are accessible since most of them are transacted on stock and derivatives exchanges, with one- to six-month trading horizons. However, non-residents engaging in onshore transactions would generally have to incur additional costs (see discussion below).
Similar strategies are implemented in other markets in the region. In Mexico, a similar (but not common) strategy could involve borrowing, say, one-month USD LIBOR, purchasing MXN spot in the FX market, and acquiring one-month Treasury bills (CETES). In Peru, foreign investors buy PEN with USD and invest in government debt securities, although the government debt market is not very liquid. These investments are short to medium term and could be hedged or unhedged.
In contrast, in Chile, government regulations limit participation of foreign investors in bonds, and so these are not major vehicles for carry trades.
2. Carry trade using (deliverable) FX swaps
An alternative carry trade strategy is to obtain a long forward position in the destination currency. One way to achieve this (observed in Mexico) is to first purchase the destination currency spot, and then to implement a FX swap transaction in which the investor purchases the funding currency spot and the destination currency forward. The return on this strategy involves several transaction costs (there are two – rather than one – transactions, a spot and a swap during the investment period, and the delivery of the destination currency and the purchase of the funding currency during the settlement period). This strategy may be profitable if the destination currency has appreciated relative to the contracted forward rate at maturity. But it also involves currency risk. If foreign exchange and fixed income markets are liquid and well integrated, and abstracting from transactions costs, the pricing of the forward position should be such that the return from this strategy is similar to the return from investing in fixed income assets.
Foreign investors in Mexico prefer this kind of strategy because the Mexican peso currency swap market is very liquid, especially in the short term. This strategy offers investors the opportunity to unwind positions if needed (say, every 24 or 48 hours). When foreign positions are sufficiently large, there is a reduction in the
BIS Papers No 81 7
implied interest rate (in local currency) in the FX forward and swap markets. In contrast to other Latin American currencies, the offshore NDF market for MXN is not seen as a major channel for carry trade activity. One possible explanation is that the onshore derivative market is very active and foreigners do not face restrictions seen in some other jurisdictions (see discussion below). In contrast, liquidity is lower in the market for short-term government notes because of limited supply. Other instruments are also less important in the Mexican markets. Options are not used because of costs, and bank deposits are not preferred among strategists in MXN. Deliverable forwards are also available onshore in Peru. As discussed below, arbitrage involving offshore NDFs – and not just carry trades – appears to be an important source of activity in onshore derivatives and fixed income markets.
3. Currency carry trade strategies using non-deliverable forwards or futures
NDFs may be used to take a short position in a funding currency and a long position in the destination currency by writing a contract so that, on a settlement date, the buyer of the forward receives (pays) the difference between the contracted NDF rate and the spot rate (applied to a pre-agreed, non-deliverable notional amount) if the destination currency appreciates (depreciates) relative to the contracted NDF price.
Thus a carry trade would involve taking a long forward position in the destination currency so that the return is positive if the spot exchange rate has appreciated relative to the contracted forward rate. In contrast, a hedge would mean the buyer receives a payment when the destination currency depreciates, which requires a short position in the destination currency. NDFs or futures may be used to implement carry trades and the returns may be similar to carry returns obtained in fixed income markets if there is sufficient market integration. As NDF markets are often offshore, the two markets may not be well integrated (see discussion of arbitrage trades below). The relative returns might be lower in the market that is more liquid, which in emerging markets may be the NDF market rather than the fixed income market. An important advantage of non-deliverables is that there is no need to deliver the notional amount, so that returns can be obtained with a far smaller investment. NDF markets play an important role in foreign exchange market and (any) carry trade activity in BRL, CLP, COP and PEN.
For the Brazilian real non-deliverable derivative instruments are the main driver of the foreign exchange market and are the most liquid instrument for BRL FX trades. As a result, the daily volume traded in derivatives is also very large. For the BRL, derivatives (especially offshore NDFs) are thus the main vehicle for investors looking to implement carry trades. Foreign investors use NDF markets as a reference for local swaps and forward curves. While the bulk of carry trades involves the acquisition of financial instruments such as government bonds, derivatives play a very important role in Brazil. A similar currency carry trade strategy can be implemented in the onshore Brazilian derivatives market, as an investor taking a short position in USD futures at BM&FBovespa. The main difference is that this contract requires daily cash settlement for the change in its price. Alternatively, the (non-deliverable) cupom cambial is an interest rate future for which the underlying asset, the cupom cambial, is calculated from the ratio between the capitalised

8 BIS Papers No 81
interbank deposit rates (in the period between the trade date and the last trading day), and the exchange rate variation (in the period between the business day preceding the trade date and the last trading day).5 There is no exchange of the underlying asset. An investor long BRL will gain in the event of an interest rate shock (increase), and lose in the event of an exchange rate shock (depreciation). In Chile, Colombia and Peru, carry trade strategies can also be implemented with NDF contracts, for which markets are quite significant. These positions may be offshore or onshore but, if onshore, they typically require that foreign investors execute derivative transactions with residents, who report any transactions to the central bank. In some cases, such as Colombia’s, non-deliverable contracts account for the majority of derivatives contracts onshore because regulation requires that deliverable contracts be used only to hedge exports, imports, external debt, FX investment and FX guarantees. For carry trades, the foreign agents can take long positions in any of these destination currencies. The maturities most traded by foreign investors are typically short term.
A point to bear in mind is that, while the types of carry trade strategy are known from market intelligence it is not necessarily possible to tell from hard data if a foreign investor position reflects a carry trade or something else. For example, it is generally not known whether debt in a funding currency has been issued to finance investment in a destination currency asset, the extent to which any position may have been hedged, which would mean it does not fit the conventional definition of a carry trade (see also discussion below), or whether foreign acquisitions of debt instruments reflect carry trades or long-term portfolio allocations.
The difficulty in determining whether foreign investors are, in fact, implementing carry trades or some other strategy also applies to derivatives markets. In the case of offshore NDF markets, data on positions taken may simply not be available. Even when forward markets are onshore (or involve transactions with residents) and positions can be tracked by authorities, it may not be possible directly to distinguish speculative investors from hedging investors. Nevertheless, carry trades may be suspected if investors take long positions forward in the destination currency, especially if these positions are held in the shortest-maturity forward contracts.
5 More precisely, the settlement upon maturity is equal to USD100,000 ∗ ∆ − i∗, where i∗ is the
contracted future rate in the cupom cambial market, ID is the interbank deposit rate compounded between the trade date and maturity date and ∆s is the exchange rate variation between these two dates. These contracts are marked to market on a daily basis.

BIS Papers No 81
9
Box 2: Alternative carry trade or related strategies
Carry trade instrument
Transactions Examples of destination currencies
Comments
Debt denominated in destination currency (unhedged)
Investment date. Borrow in funding currency, acquire destination currency spot, purchase domestic debt instrument. Settlement date. Sell debt instrument, purchase funding currency, repay debt incurred in funding currency.
(Foreign holdings of domestic debt) BRL, COP, MXN, PEN
Returns are described by equation (2) in Box 1. Data indicate that these purchases are not highly correlated with incentives for carry trades (Graph A4). Market intelligence suggests that, in recent years, these purchases reflect positions taken by real money investors rather than carry trades.
Deliverable forward long the destination currency
Investment date. Borrow in funding currency, purchase destination currency spot and then purchase FX swap long the destination currency in the forward leg. Settlement date. Receive destination currency and deliver funding currency; use proceeds to buy funding currency in the FX spot market.
MXN This appears to be the most popular way to implement a currency carry trade in Mexico. If markets are well integrated, and CIP holds, returns will be similar to those in equation (2), Box 1.
Non-deliverable forward (NDF) or future long the destination currency
Investment date. Take a short position in a funding currency and a long position in the (destination currency). Settlement date. The buyer of the forward receives (pays) the difference between the contracted NDF rate and the spot rate (applied to a pre-agreed, non-deliverable notional amount) if the destination currency appreciates (depreciates) relative to the contracted NDF price.
NDFs: BRL (offshore), CLP, COP, PEN FX and cupom cambial futures (non-deliverable swap): BRL
If NDF markets are well integrated, NDF rate may be set such that the expected returns are similar to those observed under the first or second investment strategies listed above. Positions that are long the destination currency may vary from country to country. For example they can be implemented in Brazil onshore by (i) taking a short position in USD futures at BM&FBovespa (however, this contract requires daily cash settlement for the change in its price); (ii) in the cupom cambial futures market (see footnote 5).

10 BIS Papers No 81
B. Arbitrage or other trades
Occasionally, foreign investor positions reflect not carry trades but rather efforts to exploit certain arbitrage opportunities. We highlight some of these opportunities because arbitrage trades often account for a significant part of foreign exchange market activity and such positions (eg for the acquisition of domestic debt securities) may resemble carry trades although they in fact are not.
Arbitrage opportunities generally reflect market imperfections that may arise for a number of reasons – including regulatory/prudential requirements that affect the availability of financing in certain markets, capital controls, imbalances between spot and forward markets (due to intervention or other factors), and counterparty risk concerns. Other types of trade may also be cited, including those related to expected changes in the term structure rather than carry trades.
Foreign investors may seek to exploit discrepancies between derivatives-implied interest rates in offshore NDF markets and the implied rates in onshore derivatives markets (eg BRL), or vis-à-vis the rates observed in fixed income markets involving a certain destination currency (eg COP, MXN, PEN, which may lead to what are known as basis trades). Such discrepancies generally reflect a breakdown in covered interest parity (CIP) which would otherwise ensure convergence between the two types of rate in developed financial markets (see Box 1). CIP can break down for a number of reasons, including regulatory/prudential requirements, capital controls or imbalances in supply and demand in the foreign exchange market involving spot and forward markets (due to intervention or other factors). Particularly during episodes of financial stress, liquidity may decline in certain derivatives markets or in money or debt markets, particularly, in some cases, due to heightened concerns about counterparty risks.6
For example, if implied interest rates in derivatives markets are lower, investors may exploit the discrepancy by borrowing (taking a short position) in the funding currency, investing the proceeds in the local debt or money markets and (unlike in the carry trade described earlier) hedging its currency exposure in the forward or FX swap markets. An empirical analysis suggests that these arbitrage opportunities tend to disappear in well integrated financial markets such as Mexico’s, although they may persist for a time.7
Peru provides an example of this type of arbitrage opportunity, and the challenges it may pose to monetary authorities. Between the third quarter of 2012 and the first of 2013, the NDF market came under pressure from foreign investors and local pension funds, inducing negative implied PEN rates. Foreign investors
6 For a discussion of the discrepancies between CIP-implied funding currency interest rates and
interest rates in advanced economy money and debt markets during the global financial crisis, see Baba and Packer (2009) and Baba, Packer and Nagano (2008). For an emerging market example (Korea), see Baba and Shim (2014).
7 The returns from such a strategy may be described by: − = − − ( − )
An empirical analysis for Mexico for the period 2002–14 indicates that the terms i , represented by short-term sovereign treasury rates (Cetes), i and (f − s ) are cointegrated for one-month to 12-month tenors (Acosta, Caballero, Palacios and Santaella (2014)).
BIS Papers No 81 11
took advantage of the spread between the local rates and these (negative) implied rates. The resulting inversion of the local yield curve brought the 10-year yield (3.62%) below the central bank reference rate (4.25%). Foreign demand crowded out local investors, who looked to alternatives such as CDBCRP and local currency corporate bonds, which pushed PEN interest rates lower at a time when the central bank was tightening policy. This contributed to an overshooting in the local yield curve when concerns about Fed tapering arose in May 2013.
The opposite may happen when reduced liquidity in FX derivatives markets, especially during periods of stress, may result in FX derivative-implied interest rates significantly greater than the ones observed in debt and money markets.
A variation on the preceding is the arbitrage opportunity that arises when FX derivatives on the destination currency are traded at different prices in different markets (onshore and offshore), eg USD/BRL OTC NDF (offshore) and USD futures on BM&FBovespa.
Offshore-onshore arbitrage opportunities may be more limited in some other markets. Nevertheless, even when transactions between offshore and onshore markets are not involved, arbitrage opportunities may arise from deviations from CIP. For example, in Colombia, a regulatory restriction on negative foreign liquid net positions8 appears to have led to frictions in the forward market that cause deviations from CIP. When the supply of USD in the forward market exceeds the demand, Foreign Exchange Market Intermediaries (FEMIs) accommodating this supply cannot hedge their long USD contracts with foreign borrowing. Therefore, they have to sell their liquid position in order not to increase their foreign exposure. When the liquid position is low, FEMIs that take the long USD position will do so, but at a lower price, ie at a market price that is lower (cheaper) than that implied by CIP. As a result, in Colombia, the real resident sector has taken advantage of these frictions to take long USD forward positions, and to borrow in foreign currency.9
Positions taken in derivatives markets may alternatively reflect expected changes in the yield curve. During periods of stress in foreign exchange markets, short-term yields may rise above long-term yields, a situation described as yield curve inversion. Investors may take advantage of the resulting inverted forward curve, taking a long (short) position in the destination (funding) currency at short horizons, and a short (long) position at longer horizons. Investors make profits from the interest rate differential and short-term domestic currency appreciation, and forward curve flattening as well (this has been observed, for example in the PEN market). Alternatively, foreign investor positions may reflect expected shifts in the derivatives-implied yield curve due to expected differences in the direction of monetary policy in different countries.
8 In Colombia, the central bank requires that Foreign Exchange Market Intermediaries (FEMIs, mainly
banks) do not hold a negative foreign liquid (without derivatives) net position. This is meant to limit the ability of FEMIs to intermediate large flows of leveraged bets on the COP, in order to control the volatility in the exchange rate that they can generate and the mismatches in maturity, liquidity and credit quality in local balance sheets.
9 An analysis by Colombia’s Bank of the Republic reveals that there is a strong correlation between external disbursements and the frictions in the forward market (measured by implicit devaluation minus theoretical devaluation). Furthermore, even firms with a natural hedge (exporters) take out foreign loans and buy USD forward.

12 BIS Papers No 81
C. Portfolio carry trades
The present report focuses on currency carry trade strategies based on pairs of funding and destination currencies. However, it is known that portfolio carry trades are also relevant. An investor will choose between a pair or a portfolio based on his or her investment thesis. One might choose a pair trade if he has a specific view on a single currency/economy/central bank relative to the funding currency, whereas a portfolio approach might be more appropriate, for example, if one thinks advanced economy liquidity provision will flow to a number of different EM currencies. A portfolio approach also smooths out idiosyncratic shocks affecting individual currency pairs. Among the most popular indices related to portfolio carry trades involving emerging market economies are the Barclays Capital World Carry Index and Deutsche Bank’s Carry Trade Harvest indices.
III. Market characteristics relevant for carry trades
There are several important elements that influence how carry trades are implemented and their possible implications. These include the types of foreign investor, their local counterparties and the types of instrument they invest in, as well as other relevant market characteristics. Central bank responses to a questionnaire shed some light on these factors.
A. Foreign investors, counterparties and positions
Official monitoring of foreign investors sheds light on the extent of market coverage, counterparties or specific positions taken. The information available by country varies significantly. We discuss types of investor and their positions and counterparties. However, it is not necessarily known if investors are taking positions on their own behalf or if positions are indeed carry trades. Examples of types of position taken by investor type and counterparties include the following:
Position-taking by non-residents and foreign banks. In Brazil, foreign banks operating in Brazil are the main counterparties of leveraged fast money accounts implementing unfunded carry trades through offshore NDFs. These banks typically hedge their BRL exposure in offshore NDFs by taking a short position in USD futures at BM&FBovespa, which is settled in BRL. Domestic banks, and to a lesser extent corporates, are also active in the derivatives markets and carry trades. Non-residents hold around 18% of domestic sovereign debt, and most are real money investors. This share has increased steadily since 2006 (see discussion referring to Graph A3 below).
Formal foreign exchange market or recognised intermediaries. In Chile and in Colombia, all foreign exchange market transactions take place in the Formal Exchange Market (FEM in Chile, accounting for 94% of total transactions) or via officially recognised foreign exchange market intermediaries (Colombia). FEM participants must report all spot and derivative transactions. This excludes operations between non-residents (foreign investors) or between local firms that do not belong to the FEM. In Colombia, foreign exchange market intermediaries comprise mainly national banks, while in Chile pension funds, mutual funds, stock brokers, companies and some other entities also play an important role. Officially

BIS Papers No 81 13
recognised participants in the foreign exchange market have local and external counterparts, whereas other firms operating outside this market implement derivatives transactions with external counterparts.
Types of foreign investor. In Colombia, foreign investor derivatives transactions are classified according to whether they are with local financial intermediaries that belong to the same global financial group (“intragroup”, typically foreign headquarters with local affiliates) or not (“offshore”). For intragroup operations, net foreign investor purchases have reached a peak of close to USD 6,000 million and about half a dozen counterparties recently accounted for 50% of total offshore forward volume reported by foreign exchange intermediaries. Data from custodian accounts reveal the types of foreign investor in domestic sovereign debt: funds, 60%; broker-dealers and banks, 15%; sovereign wealth funds, 9%; central banks, 7%; pension funds, 6%; and other institutions, 3%. In Mexico monitoring indicates that: (i) hedge funds and other short-horizon investors with few restrictions in their benchmark implement carry trades via FX swaps; (ii) institutional investors invest in CETES government securities (some are not allowed to invest in non-government securities); and (iii) FX dealers, algorithmic traders, and to a lesser extent non-financial enterprises with inflows in USD also invest in CETES (short-term government notes).
Domestic carry trade counterparties or investors. In Colombia and Peru, foreign financial institutions can take positions in the domestic market through several channels. One is to trade with foreign banks in the NDF market, which in turn trades with local banks. Another is to implement transactions through local and foreign banks in the domestic fixed income market. According to local banks, foreign investors in Peru’s fixed income market are mainly real money managers and institutional investors. Peruvian domestic banks act as counterparties in all trades with local and foreign institutions in the local market. In particular, banks are counterparties to local, as well as foreign investors. Local carry trade participants are institutional investors (pension funds, mutual funds and insurance companies) and corporates from a wide range of economic sectors. Some domestic firms in Peru make investments that resemble carry trades by issuing debt abroad. Such transactions are not regular but are large (they may also invest in their local businesses or repay expensive local debt). Such firms usually go short USD versus PEN and hedge foreign exchange exposure (when the PEN is depreciating) through FX derivatives. In Peru, local institutions (pension funds) account for 55% of arbitrage swaps.
B. Maturities, hedging, leverage and funding currencies
Available information on maturities is generally limited, but market intelligence suggests that carry trades are generally short term (not more than a year) and that maturities will vary according to the type of investor and instrument. For example, as noted earlier, in Mexico carry trades are generally implemented in FX swap markets, the maturities of which are generally seven days or less. Carry trade positions have maturities of between one and six months in Chile, about 34 days in Colombia and one week to two months in Peru. In Peru, foreign investors conduct carry trades through one-month NDF positions (short USD, long PEN) that are

14 BIS Papers No 81
usually rolled over at maturity (or before). Carry trades with short-term government bonds are short to medium term and unhedged.10 Carry trades from domestic banks could range from overnight (FX swap) to 10 years (asset swaps). FX positions (long or short local currency) would depend on market conditions. As for arbitrage swaps, the maturity of these trades depends on the term structure of FX-implied PEN rates. They concentrate on the short term (overnight to one month) but they could also trade up to one year.
Exchange rate risks in carry trades are by definition unhedged. Notwithstanding the limited availability of data on actual trading, the evidence on whether hedging is present is mixed. The earlier discussion suggested that indicators of hedging would involve short domestic currency positions, in which payment is received by the investor when the domestic currency depreciates. In Colombia, there are no clear signs of hedging: foreigner net purchases of USD long positions in the derivatives (typically forward) market are not correlated with foreign investment in local currency government bonds. In contrast, in Peru the forward purchases balance in PEN-currencies (short PEN long USD, suggestive of a hedge) are a significant proportion of the USD value of public debt portfolio; the coverage ratio is positive and significant. This may mean that holders of Peruvian government securities are engaged in investment strategies that are not carry trades.
There are little or no publicly available data on leverage associated with carry trade investments. However, discussions with the private sector (see below) suggest that, globally, financing for leveraged investments (including carry trades) has declined. In this setting one would expect cross-border investments to reflect strategies that do not rely on leverage. For example, in Peru, local institutions engaging in arbitrage trades do not leverage these positions. They rather replace cash investments with synthetic instruments for a fully hedged arbitrage investment.
C. Funding currencies in Latin America
In general, the USD appears to be the main funding currency for carry trades, given the ease of access of residents in the region to USD financing, and the limited foreign exchange market for crosses not involving the USD (eg this applies to the PEN). In some markets (eg MXN), JPY played a role as a funding currency some years ago but this role has diminished because of the lower USD interest rates. CLP has had a minor role as a funding currency but this is not profitable when CLP interest rates rise. During the periods when the CLP is a funding currency, the USD may occasionally emerge as a destination or target currency. This is usually associated with a carry trade operation with an active position in BRL (ie the BRL is the ultimate destination currency), because the non-residents that wish to take an active position in BRL with the CLP as a funding currency need to buy USD to acquire the BRL. Discussions with market participants indicate that CAD is usually neither a funding nor a destination currency for carry trades in the Americas region. On occasion, a position might be taken that is short CAD and long a Latin America currency (say MXN) but that might reflect a view on the expected economic performance of the two countries, not a carry trade. However, some market
10 Arbitrage trades with short- and medium-term government bonds are short term and are usually
hedged as part of the asset-swap arbitrage strategy. Long or short local currency positions depend on market conditions,

BIS Papers No 81 15
participants suggest that tightening US monetary conditions imply a shift towards other funding currencies (eg the euro).
D. Regulations and policies affecting carry trades
Discussions with private investors indicate that the feasibility or profitability of carry trades is affected by lack of development of domestic financial markets (eg undeveloped repo markets), regulations that may favour the development of derivatives markets (eg in Brazil only banks are allowed to operate in the spot market, and derivatives markets are open to non-banks financial institutions and corporates). Limits on banks’ FX net open positions have also led banks to explore arbitrage opportunities between spot and derivatives markets. Regulations or taxes may also increase the cost of access to the local market for foreign financial institutions with no local presence, different types of mandate and restriction such as the inability to hold certain positions in Euroclear may also have a bearing on strategies selected. Several investors mentioned the importance of foreign exchange policy (eg intervention in the foreign exchange market, which could lower volatility) as an important variable in determining the attractiveness of carry trades.
Over the medium term, regulations and taxes have played an important role in the types of market used by foreign investors, for example, by stimulating development of the offshore non-deliverable forward markets, which non-residents may use freely to implement carry trade strategies. As a result of regulations, non-deliverable derivative transactions with foreigners in some currencies appear to be conducted largely offshore, while those between residents are conducted onshore. This is in contrast to the MXN, where the onshore deliverable forward market and the FX swap market are very liquid, and appear to be important channels for any carry trade activity. Examples of regulations that may limit foreign access to onshore markets, or create incentives for foreign residents to transact offshore include: (i) lack of full convertibility or of direct access to local market; (ii) capital flow management policies; (iii) interbank fees.
Lack of full convertibility or of direct access to local market. Examples in Latin America include some restrictions on BRL convertibility and the requirement that non-resident investors need to have a local (2689) account to hold domestic bonds. In Chile, non-residents are not allowed to implement transactions in the spot market (foreign agents would need to hold a current account with a special code in local banks and this is no longer allowed).11 In Colombia, restrictions on transactions in the deliverable forward market may limit arbitrage opportunities. Foreign residents must also implement transactions in the foreign exchange market through Foreign Exchange Market Intermediaries (FEMIs). Furthermore, FEMIs by regulation can only take out a loan in foreign currency if they are going to lend in foreign currency or hedge a derivative position. Therefore they are not allowed to do a carry
11 However, non-residents can take a position in local assets (deposits, mutual funds etc) through a
custodian bank, which accepts their dollars or any other foreign currency and converts it to CLP. These transactions allow authorities to track the spot transactions of non-residents. Since 2007, these transactions have risen (from less than USD 1,000 million to around USD 4,000 million), and purchases and sales of CLP are evenly balanced. Nevertheless, one effect of the regulation is that foreign residents typically take positions in the forward market because they are not allowed directly to take positions in the spot market.
16 BIS Papers No 81
trade in which they borrow in a funding currency and invest in government securities denominated in the destination currency.
Capital flow management policies. These appear to have had a significant impact on cross-border capital flows and the development of offshore and derivatives markets. In some cases, the effects have persisted even after restrictions were lifted. In Brazil, IOF taxes on foreign inflows to the domestic fixed income market and a long history of regulatory restrictions on capital flows stimulated the development of the very liquid offshore NDF market in BRL. Earlier restrictions on the spot FX market (which have been removed since the 1990s) also contributed to the development of a more liquid derivatives market. In Colombia, in May 2007, the government imposed an unremunerated reserve requirement (URR) on foreign portfolio investments, which had the intended effect of reversing them. The URR was removed in October 2008 but, as a result of the global financial crisis, foreign portfolio investments in Colombia did not recover until 2010. In Peru, up to 2008, primary dealers (local financial and public institutions) could access the central bank auctions to buy CDBCRP for themselves or for third parties. However, the introduction of a 4% commission for registering secondary market transfers (in the central bank registration system) outside the universe of primary dealers directly reduced the expected return on these instruments for a range of institutions (among them foreign investors). Currently there are no foreign investor holdings of CDBCRP. In order to avoid hot money inflows into local banks, in 2008 the central bank increased reserve requirements on foreigners’ local currency deposits to 120%. This prompted a shift to alternative carry trade vehicles such as NDF PEN, eventually generating arbitrage opportunities. In 2010, the government introduced an income tax on gains from short-term (up to two months) forward transactions involving foreign investors. As a result, forward contracts of up to two-month maturity are negotiated mainly offshore and partly through a few local banks that, due to tax exemptions from trade agreements, are not affected by this tax locally. Finally, local banking prudential regulation includes limits on FX net open positions and net FX derivatives positions. Due to the restrictions on FX exposure by banks, it is estimated that daily volumes of forward transactions in the local market are about a third of the total amount of NDF USD/PEN negotiated globally.
Interbank fees. In Mexico, since 1999, the bank savings protection law requires that interbank lending pay a protection, a cost that banks incur when they use national financial institutions to fund carry trade strategies. However, if the funding is made outside Mexico, financial institutions do not incur this cost.
IV. Investor perspectives: has the importance of carry trades declined?
On 6–7 October 2014, members of the BIS CCA study group on currency carry trades met in New York with a range of FX and EM market participants, including traders, strategists, and investment professionals from banks, global macro hedge funds, dedicated currency funds, and real money asset managers. The aim of the meetings was to deepen the study group’s understanding of developments and trends in FX carry trade activity in Latin America. The discussions focused on trends in strategies and instrumentation, market participants, and factors impacting carry trade activity, such as policy and liquidity. The discussions also focused on the

BIS Papers No 81 17
measurement and monitoring of carry trade activity as well as trends in FX basis trades.
Discussions with investors active in Latin America suggest that there have been significant changes in market structure relevant for portfolio investments: the role of different investors has changed and the relative importance of carry trades has declined. A number of features relevant for the financing of cross-border investments may be highlighted: (i) liquidity shortages; (ii) increases in proxy hedging; (iii) increased role for real money investors; (iv) unexploited arbitrage opportunities; (v) investment strategies and carry trades.
Liquidity shortages. There is a shortage of liquidity or capital to finance leveraged transactions. For example, it is hard to implement repo transactions. Balance sheets are smaller and leverage is more selective (with some receiving a lot of leverage and others no leverage at all). However, leverage is needed for carry trades or small arbitrage opportunities to be profitable. Market participants attributed the decline in FX liquidity since the 2008 crisis to a number of factors. Most importantly, regulation and risk aversion have reduced dealer willingness to warehouse FX risk. Dealer contacts noted that before the crisis they would be more willing to conduct large FX transactions and gradually unwind their risk exposure via offsetting trades. They would also be more willing to take directional views or “prop risk” – eg stepping in to buy or sell a currency they viewed as mispriced. The evolution of dealers toward purely transactional, client flow business has weighed on liquidity, leading to smaller transactions that take longer to execute. It was observed that buying or selling MXN 200 million used to be a two-minute transaction involving one or two dealers. Now it requires breaking the trade into many pieces and involving “20 different banks”. The transaction now can take anywhere from “two hours to two days”. In this setting USD liquidity risk could in some cases reduce financing (leading to localised USD squeezes) for offshore non-deliverable forwards, particularly in those cases where the offshore NDF market is segmented from the onshore market. There may be more systemic implications during periods of stress. More generally, as discussed further below, some investors expressed concern that during periods of stress, liquidity may be less available than in the past (eg due to the more limited presence of banks), it may be difficult to exit positions, and overshooting may be larger than in the past.
Increases in proxy hedging. Poorer liquidity conditions across EM assets have supported an increase in proxy hedging across countries and instruments via FX trades. In particular, while FX liquidity conditions have deteriorated, participants observed that they are still better than in bond markets. Accordingly, during periods of synchronised currency and fixed income stress, real money investors increasingly “over-hedge” in FX markets, insulating them from FX losses, while absorbing part of their fixed income losses. (This is particularly the case in markets that lack liquid interest rate derivative markets). A consequence of this behaviour is to dampen outflows as investors use FX markets to hedge stocks, rather than liquidate positions. In some cases, policy has played a role in supporting this type of behaviour – eg the Brazilian central bank’s provision of currency protection helped to stabilise foreign investment amid the “taper tantrum” and during subsequent sell-offs. Participants also noted that in some cases, rather than taking positions in less liquid or non-convertible currencies, they would prefer to transact in more liquid, highly correlated proxy currencies. A currency overlay manager emphasised that proxy hedging was an important part of the job; given high hedging costs for

18 BIS Papers No 81
some currencies, a common currency overlay strategy is to “over-hedge” with highly correlated, lower-cost currencies.
Increased role for real money investors. While the reduction of risk retention by dealers has diminished their role in the price formation process, other risk-taking market participants – such as hedge funds and Commodity Trading Advisors (CTAs) – have also declined in importance. The hedge fund and CTA community has shrunk in part because new regulation has imposed meaningful fixed compliance costs, which has effectively conditioned viability on scale. In addition, the availability of financing from prime brokers has declined, while margins have increased. Participants noted that the diminished involvement of dealers, hedge funds, CTAs and other opportunistic risk-taking participants has created a lopsided market prone to “liquidity mirages” – ie liquidity appears abundant when risk appetite is healthy but declines markedly during episodes of risk aversion. An upshot is a more challenging environment for investors to unwind positions during downturns. In this setting, real money investors (eg institutional investors such as pension funds, insurance companies and mutual funds or retail investors) now play a larger role in portfolio investment flows to emerging market economies, including in Latin America. The preferences of these investors differ from those of hedge funds or other investors that traditionally engage in carry trades. First, there is a growing focus on fixed income investments. Second, these investors typically face investment and leverage constraints. Third, real money investors prefer longer investment horizons. This implies that borrowers may face reduced rollover risks, but investors may face higher duration risks. Fourth, at least one source suggested that real money investors may not hedge FX risk, wanting exposure in a destination currency asset (which is consistent with trying to maximise carry returns). Others said that there was some hedging, which might be warranted if the intention was to hold the position over a longer period while keeping returns closer to a benchmark, or if the investor wanted to retain the ability to close a position at short notice. Some might hedge by taking options, but others might instead resort (due to mandates or regulation) to over-hedging (buying and selling USD). In any case, it appears that the portfolio investments from institutional investors do not match the traditional carry trade definition.
Unexploited arbitrage opportunities. Market contacts noted that divergences in rate differentials between cash and derivative markets as well as between onshore and offshore markets remained common, and have become more persistent in recent years due to limits on the ability or willingness of participants to arbitrage away the differences. Rates on local currency government paper often exceed forward implied yields of the same tenor, reflecting stronger investor demand for exposure via forward markets. This tends to occur for several reasons. First, establishing local custody – required for foreigners’ purchase of securities – can be challenging and expensive, especially for smaller investors. Second, forward markets tend to be more liquid (for short horizons) than local currency securities. Finally, it is easier and typically less costly to get leverage in the FX forward market as repo markets for local currency securities are often undeveloped or limited usually involve higher transaction costs (master contracts, custody accounts etc). Policy – eg withholding taxes, capital controls, lack of currency convertibility etc – usually plays a key role in driving divergences between yields in onshore and offshore markets. For example, limits on the ability of foreign investors to access the onshore market tends to push demand for FX carry to the offshore NDF space, compressing NDF forward points beyond what onshore rate differentials would indicate. In the past, local or global
BIS Papers No 81 19
banks – with access to both markets – would play key roles in arbitraging this basis away (eg by intermediating the offshore demand and hedging their exposures onshore). However, basis trades require scale and, given recent constraints on balance sheet expansion, banks – and other opportunistic players – have been less inclined to pursue these opportunities.
Investment strategies and carry trades. Cross-border investment strategies are much less focused on carry trades than in the past. FX carry trade strategies and participants have changed notably since the global financial crisis due to shifts in market structure and more frequent spikes in currency volatility. While FX carry trade activity from leveraged accounts has diminished, carry remains a key factor behind uptrends in foreign investment in local currency securities and in corporate external issuance.
• In the half-decade prior to the 2008 global financial crisis, FX carry trades were commonly conducted by leveraged accounts taking short-term positions in FX derivative markets. Market participants noted that this type of “pure” carry trade activity has since declined significantly. Lower interest rate differentials, the 2008 crisis – and more recent spikes in currency volatility – have reduced the attractiveness of the strategy, while new financial regulation and shifts in market structure have further contributed to its decline.
• However, FX carry trades, more broadly defined, remain common, especially with yields in core markets historically low. In an EM context, their manifestation has largely shifted toward unleveraged real money investment in local currency fixed income instruments, especially at longer horizons. Although these investments are not strictly carry-motivated – views on duration, credit risk, and term premia also influence investor positioning – carry accounts for the bulk of long-term returns. It was noted that once transaction costs have been incurred, investing in bonds is better than owning a position in the foreign exchange market (eg one investor said that in Colombia they used to own a position in swaps, but they moved to bonds once Colombia was included in JP Morgan indices). Market participants also noted that the episodic spikes in currency volatility have supported longer investment horizons insofar as cumulative carry gains can absorb the sporadic but often large drawdowns from exchange rate moves. In contrast, for short-term leveraged investors, carry trade strategies have become less attractive as volatility-driven drawdowns have become more frequent than in the half decade prior to the 2008 crisis.
• Participants also observed that FX borrowing by corporates and households has remained a common FX carry strategy. Latin American corporate issuance in particular has been very strong in recent years, with contacts observing that a meaningful (though difficult to estimate) share of the new issuance has been unhedged. In countries with large unhedged corporate exposures, central banks may face pressure to limit currency weakness. Contacts noted that, while country authorities have been largely successful in limiting the build-up of unhedged currency exposures in banks, oversight and regulation of external corporate issuance remain limited.
20 BIS Papers No 81
V. Indicators of carry trade activity
As noted earlier, data in the public domain (or even data that are accessible to central banks) generally do not allow direct measurement of carry trades. For this reason, analysts and policymakers focus on a variety of indicators that shed light on possible carry trade activity. Three types of indicator are briefly discussed in this section: (i) indicators of incentives for carry trades (returns, volatility and related variables); (ii) indicators of market liquidity and of arbitrage opportunities; and (iii) indicators of position-taking.
A. Indicators of incentives for carry trades (returns and risks)
An important indicator of incentives for carry trades is total returns (Graph A1). The data show extended periods of positive returns with occasional sharp declines in 2008, 2011 and 2013 in a number of currencies. This is broadly in line with the studies cited in the introduction which suggest that currency carry trades may be associated with currency crash risks because they are funded by debt, so that a shock that produces losses can be amplified by so-called liquidity spirals.
As also noted earlier, carry trade positions are unhedged so that exchange rate risk is relevant. Central banks report that both they and market participants with whom they have spoken also monitor the carry-to-risk ratio – the interest rate differential divided by the option-implied volatility of the exchange rate – which has been traditionally viewed as an ex ante Sharpe ratio metric for carry trades.12 This ratio is reportedly the most common indicator used by market participants to evaluate the attractiveness of a carry trade (Graph A1). Although the “carry-to-risk” (or “carry-to-vol”) was widely cited by the private sector investors interviewed by the Study Group, there were mixed views about whether it was really an accurate gauge for the attractiveness of carry strategies. One market participant saw the carry-to-risk as largely a lagging indicator, and said that investors should seek carry when volatility is high and declining, not when volatility is low and rising.
As can be seen carry-to-risk ratios have exhibited less of an upward trend than total returns in recent years. In general, these indicators suggest that, after rebounding in the wake of the global financial crisis, carry-to-risk ratios have fallen from their recent peaks. Discussions with private sector investors cited earlier suggest that, particularly given the limited supply of financing for leveraged investments, carry returns are in a number of cases so low that the relative importance of carry trades in cross-border portfolio investments has declined.
The preceding are among the main indicators monitored by central banks to assess carry trade attractiveness, although each central bank may assess additional elements not shown in Graph A1. These include:
• Alternative time horizons (eg one month, three months and one year may be monitored).
12 For a discussion of the carry-to-risk ratio see Díaz, Gonzalez and Sotz (2013) and Carreño and Cox
(2014).

BIS Papers No 81 21
• Alternative measures of risk and volatility associated with carry trades. These include implied volatilities, risk reversals, the Vix and the five-year CDS sovereign spread (which, in at least one case, is used to adjust the interest rate differential when computing the carry-to-risk ratio).
• The exchange rate (nominal or real effective exchange rate) as an indicator of whether carry trade gains are at risk. In particular, signs of real exchange rate misalignment could suggest a greater likelihood of a sudden currency crash that could adversely affect the profitability of carry trade positions.
• Indicators for a wider set of markets, both advanced and emerging. For example, some central banks monitor alternative funding currencies (USD, CHF, CAD, JPY and EUR) or baskets of currencies, or the performance of indices representing carry trade portfolios.13 Carry trade returns based on implied rates in the offshore NDF or derivatives market may be monitored as well as onshore rates in fixed income markets when there are restrictions or market segmentation (see discussion of Graph A2 below).
• Combinations of indicators. One central bank reports that, in general, indicators are analysed in combination, depending on their frequencies. Thus, implied volatilities, implied interest rates and risk reversals are monitored daily, and CFTC non-commercial positions weekly. The carry-to-risk index is evaluated monthly and is generally compared with those of other countries to see how local developments compare with those in other markets.
B. Indicators of arbitrage opportunities and market liquidity
The discussion earlier in this report suggests that it may also be useful to estimate the implied interest rates from derivatives markets (possibly offshore) and compare them to interest rates in fixed income markets. Graph A2 provides such a comparison, showing relatively large gaps in BRL and PEN and over certain periods for COP and CLP. Discrepancies may give insights on liquidity conditions and arbitrage opportunities which may provide alternatives to carry trades. The specific variables monitored may vary. The Central Bank of Brazil looks at indicators of dollar liquidity in the Brazilian market and of convertibility risk, respectively the short-term cupom cambial (derivatives-implied onshore US dollar interest rate), and the onshore/offshore spread implied in USD futures/NDFs offshore. Another example is the Bank of Mexico, which monitors MXN-implied interest rates in MXN (overnight, one and three months and one year). Implied yields are annualised interest rates for the given currency and tenor derived from CIP. In Peru, the Central Reserve Bank of Peru monitors (i) spreads between local currency interest rates and implied rates from the NDF curve; and (ii) the spread between the local currency risk-free yield curve and the cross-currency swaps (CSS) local currency fixed rate curve.
13 One example is the Deutsche Bank carry trade index, which is a dynamic index designed to
systematically represent a long carry portfolio within the G10 (see db Currency Harvest publications for a discussion of other indices). It is a geometric average of long the three highest-yielding currencies against short the three lowest-yielding currencies. Another example is the Barclays World Carry Index.

22 BIS Papers No 81
C. Indicators of position-taking
Many central banks are able to track foreign investor positions relevant for carry trades as long as they are onshore or involve transactions with the domestic financial sector. For example, in Brazil positions in FX derivatives and spot markets are recorded, and data provided by foreign exchange dealers and other institutions operating in offshore markets are available. For another example, in Chile and Colombia all foreign exchange market transactions must be channelled via certain institutions that implement transactions in the foreign exchange market (see above). In Mexico, authorities follow the daily positions of foreigners in the swap market and in CETES (short-term government securities), asking the participants about the final investor. They also follow non-commercial positions in MXN in CFTC. Commercial data providers are also important sources. For example, some US institutional investors publish quarterly reports of their holdings of Latin American securities.
However, as noted previously, while the activity of foreign portfolio investors and their counterparties may to some extent be tracked, it is not necessarily possible to determine whether such activity reflects carry trades, or whether institutions are trading on their own account or on behalf of a client.
The earlier discussion suggests that long positions taken by investors in destination currencies, combined with indicators of incentives for carry trades, may suggest the presence or absence of carry trade activity.14 To illustrate, we may begin with foreign investor holdings of domestic government debt. In a number of cases, central banks have the capacity to monitor these because they can obtain information reported by a custodian.15 Graph A3 shows such holdings in US dollars and as a percentage of total debt outstanding. With the exception of Chile, these holdings are significant and in general have risen considerably in recent years. For example, in Colombia, foreign investor holdings of domestic bonds are monitored actively. They have risen from less than USD2,000 million in 2006 to almost USD12,000 million in mid-2014, ie from 2.5% to 15% of total issuance. The bulk of these bonds are in COP (a small proportion is inflation-linked), and long-term (five to 15 years).16 Foreign shares of domestic sovereign debt are close to 19% in Brazil, 37% in Mexico and 42% in Peru. However, in part because of regulatory restrictions, such shares are small in Chile. It is not clear how far such large medium-term increases in foreign asset purchases may be attributed entirely to carry trades, as they may reflect growing financial market integration. Also, the discussions with investors cited above suggests that in recent years a large proportion of these
14 Quantity indicators (speculative positioning in key currency pairs, inflows into carry-oriented ETFs)
are probably more useful than price indicators, but the challenge in tracking carry trade activity (which is largely an unobservable intention) underscores the importance of relying on multiple indicators.
15 However, such data in at least one case do not reveal counterparty names, but only economic or financial sector classification. Data assessment is then further validated by calling local market participants. Data on corporate bond issuance, in jurisdictions where publicly available, can provide information on foreign holdings of private debt.
16 In Colombia, foreign investors also hold some liquidity management public bonds used for sterilisation purposes, although the amount declined from around $16 million in 2013 to less than $10 million in July 2014.

BIS Papers No 81 23
foreign purchases reflect medium-term positions by real money investors rather than carry trades.
The very large trend increases in foreign holdings of domestic debt securities mask fluctuations at the shorter horizons that are relevant for carry trades. To illustrate such fluctuations, Graph A4 shows how foreign holdings vary around these trend increases (actual holdings detrended using an HP filter) in a number of Latin American countries. If foreign holdings of domestic sovereign bonds reflected carry trades, we would expect them to rise when the incentives for carry trades (eg as indicated by a higher carry-to-risk ratio) increase. On the contrary, Graph A4 shows that cyclical foreign holdings of domestic debt are not highly correlated with carry-to-risk ratios. An example is given by Colombia, where the carry-to-risk ratio has remained well below its 2012 levels after declining in 2014. Purchases by investors of Colombian domestic debt nevertheless surged in 2014, following the inclusion of Colombia in the JP Morgan indices. In line with the preceding, market intelligence suggests that domestic debt in the destination currency is not a popular carry trade vehicle in Latin America (except perhaps in Brazil over certain periods). Instead, foreign purchases of domestic debt appear to reflect longer-term investment by real money investors.
A second indicator is positions in derivatives markets. Latin American central banks can directly monitor positions if derivatives markets involve transactions with residents or are onshore. Monitoring is facilitated because foreign investors are in a number of cases required to channel investments or foreign exchange market transactions through financial institutions that are required to report their transactions to the authorities (eg the Foreign Exchange Market in Chile, FEMI in Colombia). In Chile and Colombia, the most common instrument in derivatives markets is the forward, so that positions taken in the forward market are monitored (in particular, Colombia monitors USD short positions in the forward market, which as discussed earlier, would be consistent with carry trades). Growth in these positions has been significant.17 In Mexico, the central bank monitors FX operations of financial and non-financial corporations transacted through the Mexican financial system on the spot and forward markets. Large positions taken in derivatives (eg options structures) by non-financial corporations, as well as the traded volume in these instruments are monitored closely to avoid systemic risks. In Peru, the central bank monitors data reported daily by local banks. These banks are market-makers in all local currency assets (ex-equity). This information includes all FX transactions and positions (spot and derivatives) with local and foreign clients as well as interbank FX operations. In particular, authorities monitor negotiations, term and outstandings of full deliverable forwards associated with arbitrage, and of non-deliverable forwards of local banks with non-residents.
The relationship between carry trade incentives and non-resident positions in forward markets is illustrated in Graph A5. If interest rates tend to rise in the destination currency relative to the funding currency, non-residents would have an incentive to take a long forward position in the destination currency (and the destination currency would tend to appreciate). The reverse would be true if the
17 For example, in Colombia, net purchases of forwards reached a high of USD 7,000 million in January
2014, up from close to zero in mid-2007, or 16% of total domestic debt outstanding), followed by options and swaps (net purchases less than USD 1,000 million). For forwards, the majority of contracts have the shortest average maturity (34 days).

24 BIS Papers No 81
destination currency rate tends to fall. In the graph this relationship is apparent in a number of jurisdictions over certain time periods.
Once again, it is not entirely clear that these forward positions involve currency carry trades. For example, a major market participant describes foreign investor portfolios in the Colombian market as plain vanilla, with most investors buying and holding. Also, during “risk-on” periods, foreigners buy USD in the forward market, which might be consistent with a fully hedged swap or an arbitrage transaction rather than a carry trade. As described earlier, in Colombia there appears to be little or no correlation between forward contract purchases and foreign acquisition of domestic bonds. Foreign holdings of Colombian bonds are bigger than USD sales in the forward market, but the latter are more volatile. This suggests derivatives may be used more as an instrument to implement carry trades in comparison with bonds.
Some central banks report that they monitor other indicators which refer to foreign position-taking or cross-border financing to their residents. These include (i) destination currency and funding currency deposits from local and foreign institutions in the local banking system; and (ii) issuance of international bonds by destination currency corporates and their operations in the local foreign exchange market.
Still another indicator of positions taken offshore is data published by the CFTC that show positive speculative net positions in destination currencies (eg MXN and BRL) and negative positions in funding currencies (eg JPY, Graph A6). A breakdown by type of investor in Graph A6 reveals that leveraged investors are particularly important for these types of position. A number of central bank respondents noted that they monitor this indicator and it has been used in some research as a proxy for carry trades (eg Brunnermeier, Nagel and Pedersen (2009)). The indicator could be used to investigate more broadly the flow of capital through international money markets denominated in the main carry trade and funding currencies. However, these positions could be used for other speculative purposes, and may not reflect carry trades. Also the coverage of CFTC data for Latin American currencies appears to be limited. Positions are reported only for the BRL and MXN, and for BRL only a small proportion of position-taking is captured. This can be seen by comparing the BRL activity reported by the CFTC to the activity related to the BM&FBovespa (Graph A7 and Graph A8).
D. Additional investor perspectives on indicators of carry trade activity
Investors interviewed by the Study Group agreed that FX carry trade activity was difficult to measure with any precision, although they highlighted several sources of information that were usually indicative of trends. Anecdotal colour from dealer contacts, especially in conjunction with observed moves in spot rates and forward points, tends to be a useful high-frequency gauge of FX conditions, including FX carry trade activity.
Market participants cited widely used FX positioning data, including from the CFTC’s weekly International Monetary Market (IMM) report, which represents a small fraction of activity but tends to be indicative of the trend. They also identified a variety of positioning models from dealers and custodians, with State Street
BIS Papers No 81 25
singled out as offering a particularly useful platform given its ability to capture large amounts of flows via its custody business.
Given the migration of carry activity from the FX market to the local currency securities market, fund flows were increasingly viewed as a relevant indicator. However, contacts noted that the high-frequency flow data that are widely used generally come from retail-oriented funds, which represent a small subset of the investor base and provide a skewed representation of the overall trend, given the propensity for retail flows to follow returns. While tracking institutional flows would be a more useful gauge, monitoring those trends on a high-frequency basis would require talking with large investment managers, such as Pimco and Blackrock.
A key drawback of positioning and flow data is that they do not reveal much about investor intentions – ie whether investment decisions are underpinned by carry motivations or by directional, capital gains-oriented views. In order to deduce “intention”, contacts recommended analysing currency returns – eg conducting a principal component analysis on the factors (including carry) that drive currency returns, or examining the co-movement of common carry currencies with other thematically grouped currency baskets (eg commodity-linked currencies). Investor motivations might also be inferred by examining DTCC data on currency options; a higher percentage of way out-of-the-money options would suggest that investors are seeking mainly capital gains, not carry.
More information on positioning indicators can be found in Annex II.
VI. Conclusion: what have we learned about carry trades in Latin America?
This report has drawn on central bank information, discussions with market participants and some selected data to shed light on the characteristics of currency carry trades in Latin America. Carry trades typically involve borrowing, or taking a short position, in a funding currency (in Latin America, the US dollar) to invest, or take a long position, in a destination currency. Partly reflecting the degree of financial market integration and development, as well as the effects of regulation, carry trades have typically been implemented by taking long forward positions in foreign exchange derivatives markets (offshore or onshore), or in some cases through the acquisition of domestic debt securities in destination currencies. Carry trades have traditionally been implemented at short investment horizons by highly leveraged investors such as hedge funds.
However, interviews with market participants have indicated that currency carry trade strategies and investor composition have changed significantly in Latin America since the global financial crisis. One reason is that narrowing interest rate differentials between destination and funding currencies have reduced the attractiveness of carry trades. Another is that there is a shortage of financing for risky, highly leveraged investments that underpin typical carry trade investments. Finally, regulation both in the funding and destination countries have played a role in shaping the evolution of carry trades. Partly as a result, in recent years real money investors (eg pension funds, insurance companies and open end mutual funds) who rely less on leverage and who have longer investment horizons have reportedly

26 BIS Papers No 81
played a larger role in cross-border portfolio investment, while the relative importance of hedge funds has been declining.
A number of possible implications of recent developments may be highlighted. On the one hand, the decline in the traditional currency carry trades is reassuring, given evidence that they are associated with currency crash risks because of their leverage and amplification of shocks by liquidity spirals. On the other hand, the limitations in our ability to precisely measure carry trades suggest that authorities need to continue monitoring this activity and to look for ways to improve our understanding of possible macroeconomic and financial stability challenges that carry trades could pose. In addition, the relative predominance of portfolio investments by real money investors over carry trade investments by highly leveraged investors, and related risks, may warrant further examination.

BIS Papers No 81 27
Annex I. Some research on carry trades
Indicators. The implementation of a carry trade strategy often involves transactions in the financial markets of at least two different jurisdictions as well as proprietary information on debt incurred or positions taken. This makes the measurement and monitoring of carry trade activity a challenging task for central banks and financial market supervisors. Curcuru, Vega and Hoek (2012), Galati, Heath and McGuire (2007) and McGuire and Tarashev (2007) discuss price and volume indicators of carry trade activity.
Failure of uncovered interest parity. A body of empirical evidence suggests that uncovered interest rate parity (UIP) usually fails, ie that carry trade strategies actually yield positive payoffs. A large number of papers have referred to a set of statistical indicators (mean, standard deviation, skewness, kurtosis, Sharpe ratio etc) for the returns of carry trade portfolios to conclude that one can earn a positive return by just going short in a low-yielding currency portfolio and long in a high-yielding currency portfolio (Hansen and Hodrick (1980) and Fama (1984)). Looking at differences between developed and emerging markets, Bansal and Dahlquist (2000) reported that the forward premium puzzle, ie the negative correlation between expected exchange rates and interest rates differentials, does not seem to be present in the latter. Gilmore and Hayashi (2011) find the contrary: that investors have earned excess returns by taking a short position in USD and a long position in EM currencies.
Explanations for carry trade excess returns. A variety of explanations are suggested in the literature.
• High-yielding carry trade currencies are vulnerable to shocks that may lead to sudden depreciations, and thus carry trade excess returns can be seen as a premium for the risk of currency crashes (Brunnermeier, Nagel and Pedersen (2009), Burnside, Eichenbaum, Kleshchelski and Rebelo (2011), Jurek (2014)), or compensation to speculators for providing market liquidity when it dries up (Brunnermeier, Nagel and Pedersen (2009)). However, see Burnside, Eichenbaum and Rebelo (2011) and a recent study by Hassan and Mano (2014) for different conclusions.
• Other authors have emphasised the primary role played by market frictions such as the adverse selection in foreign exchange markets and transaction costs (Burnside, Eichenbaum and Rebelo (2009)).
• Berge, Jordà and Taylor (2010) show that risk factor-based models are unable to explain the excess return of certain carry trade strategies holding the feature that the weight assigned to each currency is based on past and present information on interest rates, exchange rates and macroeconomic fundamentals of the countries’ currencies.
• Darvas (2009) has shown that carry trade returns are an inverted U-shape function of the leverage, give that leveraged investors may lose all their collateral during bad times, making a later recovery impossible, even if high returns are observed. Doukas and Zhang (2013) have examined the return of deliverable and non-deliverable forward carry trades separately. Using multivariate regressions for a large sample of countries, they concluded that the better performance of the NDF carry trade reflects a compensation for currency convertibility and capital controls risks, while carry trade funding
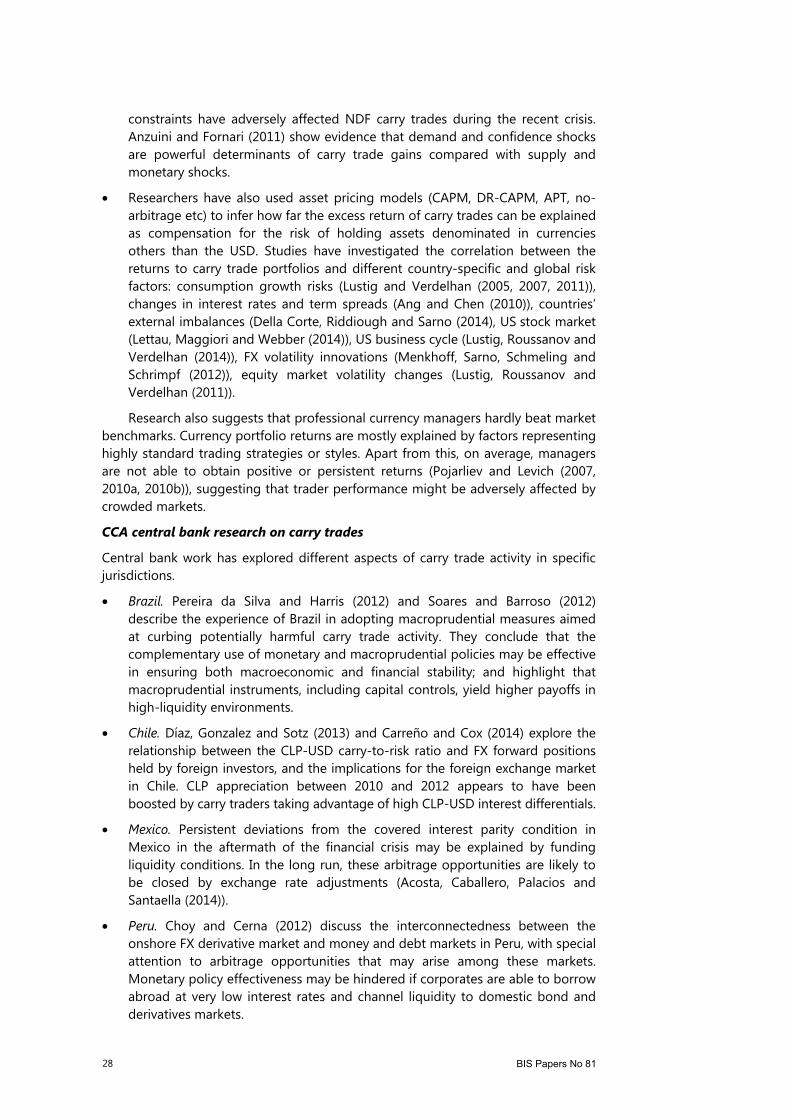
28 BIS Papers No 81
constraints have adversely affected NDF carry trades during the recent crisis. Anzuini and Fornari (2011) show evidence that demand and confidence shocks are powerful determinants of carry trade gains compared with supply and monetary shocks.
• Researchers have also used asset pricing models (CAPM, DR-CAPM, APT, no-arbitrage etc) to infer how far the excess return of carry trades can be explained as compensation for the risk of holding assets denominated in currencies others than the USD. Studies have investigated the correlation between the returns to carry trade portfolios and different country-specific and global risk factors: consumption growth risks (Lustig and Verdelhan (2005, 2007, 2011)), changes in interest rates and term spreads (Ang and Chen (2010)), countries’ external imbalances (Della Corte, Riddiough and Sarno (2014), US stock market (Lettau, Maggiori and Webber (2014)), US business cycle (Lustig, Roussanov and Verdelhan (2014)), FX volatility innovations (Menkhoff, Sarno, Schmeling and Schrimpf (2012)), equity market volatility changes (Lustig, Roussanov and Verdelhan (2011)).
Research also suggests that professional currency managers hardly beat market benchmarks. Currency portfolio returns are mostly explained by factors representing highly standard trading strategies or styles. Apart from this, on average, managers are not able to obtain positive or persistent returns (Pojarliev and Levich (2007, 2010a, 2010b)), suggesting that trader performance might be adversely affected by crowded markets.
CCA central bank research on carry trades
Central bank work has explored different aspects of carry trade activity in specific jurisdictions.
• Brazil. Pereira da Silva and Harris (2012) and Soares and Barroso (2012) describe the experience of Brazil in adopting macroprudential measures aimed at curbing potentially harmful carry trade activity. They conclude that the complementary use of monetary and macroprudential policies may be effective in ensuring both macroeconomic and financial stability; and highlight that macroprudential instruments, including capital controls, yield higher payoffs in high-liquidity environments.
• Chile. Díaz, Gonzalez and Sotz (2013) and Carreño and Cox (2014) explore the relationship between the CLP-USD carry-to-risk ratio and FX forward positions held by foreign investors, and the implications for the foreign exchange market in Chile. CLP appreciation between 2010 and 2012 appears to have been boosted by carry traders taking advantage of high CLP-USD interest differentials.
• Mexico. Persistent deviations from the covered interest parity condition in Mexico in the aftermath of the financial crisis may be explained by funding liquidity conditions. In the long run, these arbitrage opportunities are likely to be closed by exchange rate adjustments (Acosta, Caballero, Palacios and Santaella (2014)).
• Peru. Choy and Cerna (2012) discuss the interconnectedness between the onshore FX derivative market and money and debt markets in Peru, with special attention to arbitrage opportunities that may arise among these markets. Monetary policy effectiveness may be hindered if corporates are able to borrow abroad at very low interest rates and channel liquidity to domestic bond and derivatives markets.

BIS Papers No 81 29
Annex II. Positioning indicators
A variety of official and private foreign exchange positioning indicators are available, and are often interpreted by market participants as a potential proxy for carry activity. The most commonly-cited indicator is the CFTC’s weekly Commitment of Traders (CoT) report from the CME’s IMM division, which breaks down the trader groups into commercial and non-commercial entities, with the former typically viewed as hedgers and the latter as speculators. Though the report only contains futures and options positions and represents a small fraction of the overall market, it remains popular as it tends to be indicative of broader positioning trends.
A number of dealers publish positioning indicators as well, often combining their own proprietary flows data with other publicly available metrics. These indicators often include a wider set of currencies than the CoT report, thus making them more useful in analysing Latin American and emerging market currencies more broadly. Deutsche Bank and Citi are among the leaders in market share in foreign exchange trading activity, thus making their indicators particularly popular. State Street’s positioning indicator is also widely favoured due to its custody business, which captures large amounts of flows.

30 BIS Papers No 81
Annex III. Graphs
Indicators of incentives for carry trades
Strategies with US dollar as funding currency and local currency as target currency
Graph A1
Brazil Chile
Colombia Mexico
Peru
1 Defined as the three-month interest rate differential divided by the implied volatility derived from three-month at-the-money exchange rate options. 2 Index 2000M1=100. The daily carry trade return is the difference between the return on investing in the high-yield currency denominated assets (adjusted to exchange rate variation) and the daily cost of borrowing in the low-yield currency.
Sources: Bloomberg; Datastream; JP Morgan; BIS calculations.
0.0
0.5
1.0
1.5
2.0
0
100
200
300
400
2000 2002 2004 2006 2008 2010 2012 2014
–0.2
0.0
0.2
0.4
0.6
60
80
100
120
140
2000 2002 2004 2006 2008 2010 2012 2014
0.0
0.3
0.6
0.9
1.2
75
100
125
150
175
2000 2002 2004 2006 2008 2010 2012 2014
0.0
0.3
0.6
0.9
1.2
80
100
120
140
160
2000 2002 2004 2006 2008 2010 2012 2014
0.0
0.1
0.2
0.3
0.4
80
100
120
140
160
2000 2002 2004 2006 2008 2010 2012 2014
Carry-to-risk ratio (lhs)1
Total returns of carry trade (rhs)2

BIS Papers No 81 31
Non-deliverable forward implied yields vs government bond yields
In per cent Graph A2
Brazil Chile
Colombia Mexico
Peru
1 Series are a combination of BVAL government yields with generic or Bloomberg fair value (BFV) sovereign yields. BVAL yields are usedafter the following dates: for Colombia, 4 April 2012; for Mexico and Peru, 13 January 2012. Prior to these dates, for Mexico, generic government yields are used; for Colombia and Peru, BFV sovereign yields are used. For Brazil, generic government yields are used for the whole period. For Chile, swap rate is used instead. For Mexico, 1–year government yield is used instead. 2 Offshore NDFs. For Mexico, deliverable forward implied yield for a tenor of 1–year.
Source: Bloomberg.
2
4
6
8
10
12
2009 2010 2011 2012 2013 2014
–5.0
–2.5
0.0
2.5
5.0
7.5
2009 2010 2011 2012 2013 2014
–15
–10
–5
0
5
2009 2010 2011 2012 2013 2014
1.5
3.0
4.5
6.0
7.5
2009 2010 2011 2012 2013 2014
–2
0
2
4
6
8
2009 2010 2011 2012 2013 2014
3–month government bonds yield1
3–month NDF implied yield2

32 BIS Papers No 81
Foreign investors’ holdings of domestic sovereign debt Graph A3
Brazil Colombia
Mexico Peru
1 Share of foreign investors stock local currency sovereign bonds as a share of total domestic sovereign bonds.
Source: National data.
0
30
60
90
120
150
180
0
3
6
9
12
15
18
07 08 09 10 11 12 13 14
0
2
4
6
8
10
12
0.0
2.5
5.0
7.5
10.0
12.5
15.0
07 08 09 10 11 12 13 14
0
30
60
90
120
150
0
7
14
21
28
35
00 02 04 06 08 10 12 14
In billions of USDLeft-hand side:
0.0
2.5
5.0
7.5
10.0
12.5
0
10
20
30
40
50
02 04 06 08 10 12 14
As a percentage of total domestic debt1
Right-hand side:

BIS Papers No 81 33
Cyclical component of foreign investors’ holdings of domestic sovereign debt and carry trade incentives Graph A4
Brazil Colombia
Mexico Peru
Numbers indicate the share of foreign investors’ domestic sovereign debt holding as a percentage of total domestic sovereign debt at the beginning of January 2007 and at the end of July 2014 (for Peru: end-March 2007 and end-June 2014).
1 Defined as the three-month interest rate differential divided by the implied volatility derived from three-month at-the-money exchange rate options. 2 Hodrick-Prescott filter applied to get cyclical component using a lambda of 14,400 (monthly data) and a lambda of 1,600in the case of Peru (quarterly data). Data are in percentage points.
Source: National sources.
1.6 18.5
0.2
0.4
0.6
0.8
1.0
1.2
–2
–1
0
1
2
3
07 08 09 10 11 12 13 14
2.5
15.6
0.00
0.25
0.50
0.75
1.00
1.25
–3.0
–1.5
0.0
1.5
3.0
4.5
00 02 04 06 08 10 12 14
7.7
37.3
0.00
0.25
0.50
0.75
1.00
1.25
–6
–4
–2
0
2
4
00 02 04 06 08 10 12 14
28.0
42.10.00
0.07
0.14
0.21
0.28
0.35
–15
–10
–5
0
5
10
06 07 08 09 10 11 12 13 14
Carry-to-risk ratio1Left-hand side:
Foreign investors’ domestic sovereign debt holding2
Right-hand side:
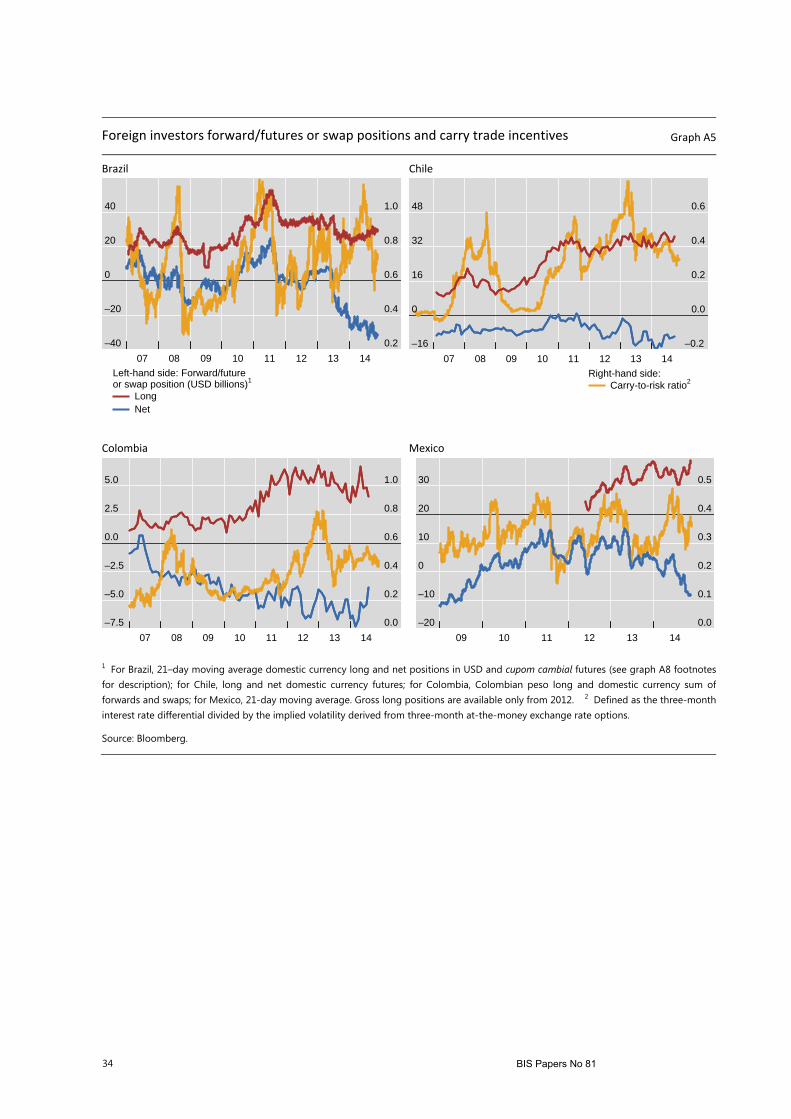
34 BIS Papers No 81
Foreign investors forward/futures or swap positions and carry trade incentives Graph A5
Brazil Chile
Colombia Mexico
1 For Brazil, 21–day moving average domestic currency long and net positions in USD and cupom cambial futures (see graph A8 footnotes for description); for Chile, long and net domestic currency futures; for Colombia, Colombian peso long and domestic currency sum of forwards and swaps; for Mexico, 21-day moving average. Gross long positions are available only from 2012. 2 Defined as the three-month interest rate differential divided by the implied volatility derived from three-month at-the-money exchange rate options.
Source: Bloomberg.
–40
–20
0
20
40
0.2
0.4
0.6
0.8
1.0
07 08 09 10 11 12 13 14
LongNet
Left-hand side: Forward/futureor swap position (USD billions)1
–16
0
16
32
48
–0.2
0.0
0.2
0.4
0.6
07 08 09 10 11 12 13 14
Carry-to-risk ratio2Right-hand side:
–7.5
–5.0
–2.5
0.0
2.5
5.0
0.0
0.2
0.4
0.6
0.8
1.0
07 08 09 10 11 12 13 14
–20
–10
0
10
20
30
0.0
0.1
0.2
0.3
0.4
0.5
09 10 11 12 13 14
BIS Papers No 81 35
FX futures open positions
Net non-commercial positions on the Chicago Mercantile Exchange Graph A6
In billions of US dollars
In billions of US dollars
Sources: CFTC; Bloomberg.
–20
–15
–10
–5
0
5
2006 2007 2008 2009 2010 2011 2012 2013 2014
Net non-commercial MXN Net non-commercial JPY
–20
–10
0
10
2006 2007 2008 2009 2010 2011 2012 2013 2014
Net non-commercial BRL Net non-commercial JPY

36 BIS Papers No 81
FX futures positions
Reportable positions on the Chicago Mercantile Exchange; in millions of US dollars Graph A7
Brazil Mexico
Net positions1
Long positions2
Short positions3
1 Long positions minus short positions. 2 Residual long positions after offsetting long and short positions held by eachtrader. 3 Residual short positions after offsetting long and short positions held by each trader.
Source: US Commodity Futures Trading Commission (CFTC).
–500
–250
0
250
500
2011 2012 2013 2014
–4,000
–2,000
0
2,000
4,000
2007 2008 2009 2010 2011 2012 2013 2014
0
250
500
750
2011 2012 2013 2014
0
2,000
4,000
6,000
2007 2008 2009 2010 2011 2012 2013 2014
0
100
200
300
2011 2012 2013 2014
Asset managersLeveraged funds
0
1,500
3,000
4,500
2007 2008 2009 2010 2011 2012 2013 2014

BIS Papers No 81 37
BRL/USD futures and swaps positions of institutional investors1
Net positions on the Brazilian Mercantile and Futures Exchange Graph A8
In billions of USD
1 Local and foreign institutional investors are considered. 2 ID x US Dollar Spread Futures Contract. This contract has as underlying assetthe spread between the interest rate and the exchange rate variation: the interest rate calculated from the difference between the capitalised ID rates verified in the period between the trade date and the last trading day, and the exchange rate variation verified in the period between the business day preceding the trade date and the last trading day. The exchange rate variation is measured by the exchange rate of Brazilian reals per US dollar for cash delivery, calculated and published by the Central Bank of Brazil. The ID rate is the Average One-day Interbank Deposit Rate (ID), calculated by CETIP–Custody and Settlement and expressed as a percentage per annum compounded daily based on a 252-day year. 3 ID x US Dollar Swap with Reset. This contract has as underlying asset the spread betweenthe interest rate (capitalised Average One-Day Interbank Deposit Rate (ID) and the exchange rate variation. The long (short) position for thiscontract is the right to receive the updated value of the Spread Rate leg (Final Value leg) and the obligation to pay the value of the Final Value leg (Spread Rate leg) on the settlement date of the series. The Final Value leg is defined as the net balance of the Final Values (theInitial Value indexed by the ID rate. The Spread Rate leg is the net balance of the Current Spread Rate Values (the Initial Value indexed by the positions of each customer shall be reset daily based upon the BM&F reference rate for ID x US dollar spread trades (specially created for the daily reset) adjusted to the time to maturity of the series. The corresponding values shall be settled on the following business day. Should the reset value be positive, it shall be credited to the buyer, and debited to the seller. Should the opposite occur, the reset value shall be credited to the seller and debited to the buyer.
Sources: Bloomberg; BIS calculations.
–60
–40
–20
0
20
2005 2006 2007 2008 2009 2010 2011 2012 2013 2014
USD futuresCupom Cambial - DDI2
Swap cambial - SCC3
Total net positions

38 BIS Papers No 81
References
Acosta, J, E Caballero, O Palacios and J Santaella (2014): “Analyzing the failure of interest parities: arbitrages and carry trade attractiveness in Mexico and Latin America”, mimeo.
Ang, A and J Chen (2010): “Yield curve predictors of foreign exchange returns”, paper for the American Finance Association 2011 Denver Meetings, March.
Anzuini, A and F Fornari (2012): “Macroeconomic determinants of carry trade activity”, Review of International Economics, vol 20, no 3, pp 468–88.
Baba, N, F Packer and T Nagano (2008): “The spillover of money market turbulence to FX swap and cross-currency swap markets”, BIS Quarterly Review, March.
Baba, N and F Packer (2009): “Interpreting deviations from covered interest parity during the financial market turmoil of 2007–08”, Journal of Banking and Finance, November.
Baba, N and I Shim (2014): “Dislocations in the won-dollar swap markets during the crisis of 2007–09”, International Journal of Finance and Economics, March.
Bansal, R and M Dahlquist (2000): “The forward premium puzzle: different tales from developed and emerging economies”, Journal of International Economics, vol 51, no 1, June, pp 115–44.
Berge, T, O Jordà and A Taylor (2010): “Currency carry trades”, NBER Working Paper Series, no 16491, October.
Brunnermeier, M, S Nagel and L Pedersen (2009): “Carry trades and currency crashes”, Chapter 5 in D Acemoglu, K Rogoff and M Woodford (eds), NBER Macroeconomics Annual 2008, vol 23, pp 313–47.
Brunnermeier, M and L Pedersen (2009): “Market liquidity and funding liquidity”, Review of Financial Studies, vol 22, no 6, June, pp 2201–38.
Burnside, C, M Eichenbaum and S Rebelo (2009): “Understanding the forward premium puzzle: a microstructure approach”, American Economic Journal: Macroeconomics, vol 1, no 2, pp 127–54.
Burnside, C, M Eichenbaum and S Rebelo (2011): “Carry trade and momentum in currency markets”, NBER Working Paper Series, no 16942, April.
Burnside, C, M Eichenbaum, I Kleshchelski and S Rebelo (2011): “Do peso problems explain the returns to the carry trade?”, Review of Financial Studies, Society for Financial Studies, vol 24, no 3, pp 853–91.
Carreño, J and P Cox (2014): “Carry trade y turbulencias cambiarias con el peso chileno”, Working Papers Series 733, Central Bank of Chile.
Choy, M and J Cerna (2012): “Interrelación entre los mercados de derivados y el mercado de bonos soberanos del Perú y su impacto en las tasas de interés”, Working Papers, no 2012-021, Central Reserve Bank of Peru.
Curcuru S, C Vega and J Hoek (2011): “Measuring carry trade activity”, Bank for International Settlements, Proceedings of the IFC Conference on “Initiatives to address data gaps revealed by the financial crisis”, vol 34, August, pp 436–53.

BIS Papers No 81 39
Darvas, Z (2009): ”Leveraged carry trade portfolios”, Journal of Banking and Finance, vol 33, no 5, pp 944–57.
Della Corte, P, S J Riddiough and L Sarno (2014): “Currency premia and global imbalances”, Winner of the Kepos Capital Award for the Best Paper on Investments at the 2013 WFA Meeting.
Díaz, S A, P González and C Sotz (2013): “Carry-to-risk ratio como medida de carry trade”, Studies in Economic Statistics, Central Bank of Chile, no 94, February.
Doukas, J and H Zhang (2013): “The performance of NDF carry trades”, Journal of International Money and Finance, vol 36, September, pp 172–90.
Duarte, A and T Romero (2014): “Recent failure of UIP in Latin American markets”. Manuscript.
Ehlers, T and F Packer (2013): “FX and derivatives markets in emerging economies and the internationalisation of their currencies”, BIS Quarterly Review, December.
Fama, E (1984): “Forward and spot exchange rates”, Journal of Monetary Economics, vol 14, no 3, November, pp 319–38.
Feroli, M, A Kashyap, K Schoenholtz and H S Shin (2014): “Market tantrums and monetary policy”, Chicago Booth Research Paper, no 14-09.
Galati, G, A Heath and P McGuire (2007): “Evidence of carry trade activity”, BIS Quarterly Review, September, pp 27–41.
Gilmore, S and F Hayashi (2011): “Emerging market currency excess returns”, American Economic Journal: Macroeconomics, American Economic Association, vol 3, no 4, October, pp 85–111.
Hansen, L and R Hodrick (1980): “Forward exchange rates as optimal predictors of future spot rates: an econometric analysis”, Journal of Political Economy, vol 88, no 5, October, pp 829–53.
Hassan, T and R Mano (2014): “Forward and spot exchange rates in a multi-currency world”, NBER Working Paper Series, no 20294, July.
Jurek, J (2014): “Crash–neutral currency carry trades”, Journal of Financial Economics, vol 113, no 3, September, pp 325–47.
Lettau, M, M Maggiori and M Weber (2014): “Conditional risk premia in currency markets and other asset classes”, Journal of Financial Economics, vol 114, no 2, July, pp 197–225.
Lustig, H and A Verdelhan (2005): “The cross–section of currency risk premia and US consumption growth risk”, NBER Working Paper Series, no 11104, February.
——— (2007): “The cross section of foreign currency risk premia and consumption growth risk”, American Economic Review, vol 97, no 1, pp 89–117.
——— (2011): “The cross–section of foreign currency risk premia and consumption growth risk: reply”, American Economic Review, vol 101, no 7, pp 3477–500.
Lustig, H, N Roussanov and A Verdelhan (2011): “Common risk factors in currency markets”, Review of Financial Studies, vol 24, no 11, November, pp 3731–77.
——— (2014): “Countercyclical currency risk premia”, Journal of Financial Economics, vol 111, no 3, pp 527–53.
40 BIS Papers No 81
McGuire, P and N Tarashev (2007): “Tracking international bank flows”, BIS Quarterly Review, December, pp 27–40.
Menkhoff, L, L Sarno, M Schmeling and A Schrimpf (2012): “Carry trades and global foreign exchange volatility”, Journal of Finance, vol 67, no 2, April, pp 681–718.
Plantin, G and H S Shin (2011): “Carry trades, monetary policy and speculative dynamics”, CEPR Discussion Paper, no 8224, February.
Pereira da Silva, L and R Harris (2012): “Sailing through the global financial storm: Brazil’s recent experience with monetary and macroprudential policies to lean against the financial cycle and deal with systemic risks”, Banco Central do Brasil Working Papers Series, no 290, August, pp 1–59.
Pojarliev, M and R Levich (2007): “Do professional currency managers beat the benchmark?”, NBER Working Paper Series, no 13714, December.
——— (2010a): “Trades of the living dead: Style differences, style persistence and performance of currency fund managers”, Journal of International Money and Finance, vol 29(8),pp 1752-75.
——— (2010b): “Detecting crowded trades in currency funds”, NBER Working Paper Series, no 15698, January.
Soares, A and J Barroso (2012): “Coping with a complex global environment: a Brazilian perspective on emerging market issues”, Banco Central do Brasil Working Paper Series, no 292, October, pp 1–27.

BIS Papers No 81 41
Glossary of selected terms used in this report
ISO codes BR – Brazil
BRL – Brazilian real
CAD – Canadian dollar CL – Chile
CLP – Chilean peso
CO – Colombia COP – Colombian peso
MX – Mexico
MXN – Mexican peso PE – Peru
PEN – Peruvian nuevo sol
USD – United States dollar
Acronyms, abbreviations and other terms
BM&FBovespa – Sao Paulo Securities, Commodities and Futures Exchange
CDBCRP – Certificate of Deposit of the Central Reserve Bank of Peru
CETES – Treasury Certificates CFTC – US Commodity Futures Trading Commission
CRA – Agribusiness Receivables Certificates
CRI – Real State Receivables Certificates CTA – Commodity Trading Advisors
NTN-F – Federal Treasury Notes-F Series
Pips – Price interest points

42 BIS Papers No 81
CCA/CGDO Study Group on Carry Trades
Name Affiliation Designation
Julio Santaella Bank of Mexico Chair
Marcio Araujo Central Bank of Brazil Member
Antonio Diez de los Rios Bank of Canada Member
Claudia Sotz Central Bank of Chile Member
Pamela Cardozo Bank of the Republic, Colombia Member
Raul Alvarez Bank of Mexico Member
Alberto Humala Central Reserve Bank of Peru Member
Seth Searls Federal Reserve Bank of New York Member
Ramon Moreno BIS Secretariat
Angelo Duarte BIS Secretariat