Curacao Economic Outlook 2011
138
-
Upload
hubcuracao -
Category
Economy & Finance
-
view
1.859 -
download
0
Transcript of Curacao Economic Outlook 2011

Curaçao Economic Outlook 2011En route towards the strengthening of the economic structure of new country Curaçao
Contents
PREFACE . . . . . . . . . . . . . . . . . . . . . . . . . . . . . . . . . . . . . . . . . . . . 3
EXECUTIVE SUMMARY . . . . . . . . . . . . . . . . . . . . . . . . . . . . . 4
CHAPTER 1: MACROECONOMIC DEVELOPMENTS . . . . 10
1.1 International and Regional Developments
and their Consequences for Curaçao . . . . . . . . . . . . . . . . . . . . . 10
1.2 Macro Economic Indicators for Curaçao . . . . . . . . . . . . . . . . . . . 26
1.3 Labor Market Developments . . . . . . . . . . . . . . . . . . . . . . . . . . . . 34
1.4 Public Finances . . . . . . . . . . . . . . . . . . . . . . . . . . . . . . . . . . . . . . . 40
1.5 Monetary Developments in Curaçao . . . . . . . . . . . . . . . . . . . . . . 45
1.6 Balance of Payments . . . . . . . . . . . . . . . . . . . . . . . . . . . . . . . . . . 49
1.7 SEI Program . . . . . . . . . . . . . . . . . . . . . . . . . . . . . . . . . . . . . . . . . . 53
CHAPTER 2: SECTORAL DEVELOPMENTS . . . . . . . . . . . . 58
2.1 Production Sectors: . . . . . . . . . . . . . . . . . . . . . . . . . . . . . . . . . . . . 58
2.1.1 Agriculture, Livestock and Fisheries . . . . . . . . . . . . . . . . . . . . . . 58
2.1.2 Oil Sector . . . . . . . . . . . . . . . . . . . . . . . . . . . . . . . . . . . . . . . . . . . 62
2.1.3 Utilities . . . . . . . . . . . . . . . . . . . . . . . . . . . . . . . . . . . . . . . . . . . . . 69
2.1.4 Manufacturing . . . . . . . . . . . . . . . . . . . . . . . . . . . . . . . . . . . . . . . 72
2.2 Construction . . . . . . . . . . . . . . . . . . . . . . . . . . . . . . . . . . . . . . . . . 75
2.3 Trade Sectors: . . . . . . . . . . . . . . . . . . . . . . . . . . . . . . . . . . . . . . . . 79
2.3.1 Wholesale and Retail Trade . . . . . . . . . . . . . . . . . . . . . . . . . . . . . 79
2.3.2 Economic Zones and E-commerce . . . . . . . . . . . . . . . . . . . . . . . 83
2.4 Transportation Sector: . . . . . . . . . . . . . . . . . . . . . . . . . . . . . . . . . 88
2.4.1 Air Transport . . . . . . . . . . . . . . . . . . . . . . . . . . . . . . . . . . . . . . . . . 88
2.4.2 Harbor . . . . . . . . . . . . . . . . . . . . . . . . . . . . . . . . . . . . . . . . . . . . . . 96
2.5 Tourism . . . . . . . . . . . . . . . . . . . . . . . . . . . . . . . . . . . . . . . . . . . . .101
2.6 Financial and Business Services: . . . . . . . . . . . . . . . . . . . . . . . .106
2.6.1 Commercial Banks . . . . . . . . . . . . . . . . . . . . . . . . . . . . . . . . . . . .106
2.6.2 International Financial and Business Services . . . . . . . . . . . . .109
2.6.3 Insurance Companies . . . . . . . . . . . . . . . . . . . . . . . . . . . . . . . . .113
2.7 Healthcare . . . . . . . . . . . . . . . . . . . . . . . . . . . . . . . . . . . . . . . . . .117
CHAPTER 3: ENHANCING BUSINESS CLIMATE . . . . . . .123
APPENDICES . . . . . . . . . . . . . . . . . . . . . . . . . . . . . . . . . . . . . .129
Appendix I: Methodology . . . . . . . . . . . . . . . . . . . . . . . . . . . . . . . . . . . . .129
Appendix II: List of Tables and Figures . . . . . . . . . . . . . . . . . . . . . . . . . .131
Appendix III: List of Abbreviations . . . . . . . . . . . . . . . . . . . . . . . . . . . . .133
2
Conte
nts
Preface
The Ministry of Economic Development, on behalf of the Government
of Curaçao, is proud to present the Curaçao Economic Outlook 2011.
This publication provides an overview of Curaçao’s macroeconomic and
sectoral performance in 2010 and 2011, the latter based on the devel-
opments up to the first nine months of the year, and in addition dis-
cusses the prospects for the whole economy in 2012, underlining some
key policy intentions for the near future to strengthen Curaçao’s eco-
nomic structure.
The Curaçao Economic Outlook 2011 was prepared by a team of policy
advisors at the Ministry of Economic Development, with contributions
from several government institutions, the private sector and sector-spe-
cific associations, which shared their latest data and knowledge with
the Ministry.
Through these words, the Ministry would like to thank all who, in one
way or the other, contributed to the realization of this publication.
Ing. Luelo Girigorie, CPC, MSc.
Head of the Directorate of Economic Policy
3
Prefac
e
Executive Summary
Macroeconomic developmentsThe world economy continued to recover in 2010. As fears of global re-
cession receded in 2009, businesses regained confidence and indus-
trial production and trade boomed. The extent of growth differs per
region: in the major advanced economies growth was modest while
many emerging and developing countries saw robust growth rates. Un-
employment remained high, particularly in advanced economies, while
commodity prices increased sharply in 2010.
The global economy is anticipated to continue growing, and again, ad-
vanced economies are projected to grow at a slower rate in 2011 than
emerging and developing economies.
Commodity prices continued increasing at the beginning of 2011 but
energy prices have receded. Food prices, however, have fallen to a
much lesser extent. As a consequence inflationary pressure is lower in
advanced economies than in emerging and developing economies.
According to preliminary macroeconomic indicators, Curaçao’s econ-
omy grew by a mere 0.1 percent in 2010. Growth was led by a moderate
increase in public and private consumption but was mitigated by shrin -
king public investments and exports. The consumer price index re-
mained moderate at 2.8 percent in 2010.
For 2011, an expansion of 0.3 percent of the real economy is expected.
Growth is led, mainly, by foreign demand, which stimulates local de-
mand. Inflation is estimated at approximately 2.4 percent in 2011.
Traditionally, the CBS provides the relevant labor-market statistics
through their Labor Force Survey. However, as the CBS was preparing
intensely for the Census that took place in March and April of 2011,
the Labor Force Survey was not conducted in 2010. Hence, the usual
overview on participation, employment and unemployment is not avai l-
able in this edition. Some other indicators are used to describe the
latest developments.
4
Exec
utive Su
mmar
y
Preliminary figures on public finances up to October 10, 2010 indicate
a surplus of NAF 32.3 million for the treasury of the Island Territory of
Curaçao.
The revenue and expenditure projections were based on a forecasted
economic growth rate higher than the rate registered in 2010. Never-
theless, the actual revenues turned out to be slightly higher than bud-
geted, at NAF 911.4 million, while total expenditures turned out lower
than budgeted, at NAF 879.1 million.
Despite the extra liquidity in the domestic money market, the Central
Bank conducted a passive monetary policy in 2010, owing to a slo w-
down in economic activities. The aggregate money supply of the Nether-
lands Antilles decreased by NAF 241.7 million in 2010, while the net
foreign assets improved by NAF 582.6 million. The official lending rate
of the Central Bank remained unchanged at 1.00 percent in 2010.
As per October 10, 2010, Curaçao and St. Maarten form a monetary
union with a common currency, which at the moment is still the Nether-
lands Antilles guilder, and a common Central Bank, the Central Bank
of Curaçao and St. Maarten. The Central Bank’s monetary policy has
remained directed at the promotion of a stable external value of the
Netherlands Antilles guilder in 2011 and has been a common policy
supported by both countries.
The current account of Curaçao’s balance of payments deteriorated
during 2010, reaching a deficit of NAF 1,633.4 million, mainly because
of the worsening of the trade and the service balance and lower current
transfers received from abroad. Capital transfers increased by NAF 10.7
million, linked to increased capital inflows from Dutch development-aid
funds. The deterioration of the current account in 2010 as compared
to the year before resulted in a drop in the net foreign wealth of the
private sector.
For 2011, the current account deficit is anticipated to stay at approxi-
mately the same level as in 2010.
The execution of the SEI program reached its peak during the last quar-
ter of 2010, as the last day of the year was set as deadline to commit
5
Exec
utiv
e Summar
y
the projects’ budget. By January 1, 2011, 97 percent of the budget was
committed to 85 projects. The rest of the projects’ funds should have
been committed by September 30, 2011 at the latest, to avoid under-
spending of the SEI budget. At the moment of writing, negotiations are
being prepared for a new deadline, because some projects have not
been committed yet.
The USONA approved a total of 110 projects for an amount of approxi-
mately NAF 121 million, 33 of which are economic projects. Up to the
end of 2010, not much of the budget for the economic projects had
been touched. In 2011, however, the pace of these economic projects
increased considerably, putting the execution of the projects in full
swing.
Sectoral developmentsAn abnormally high level of rainfall brought the agriculture sector to its
knees during the last months of 2010 and first months of 2011, result-
ing in the import of fruits and vegetables that are otherwise grown lo-
cally. Greenhouse initiatives are being tested to increase the local
supply of fruits and vegetables.
The livestock sector did not show remarkable developments.
The growing lionfish population is threatening the fisheries industry.
Policies to prevent overfishing are being prepared, while actions to com-
bat the lionfish population have already started.
Equipment malfunctions at the BOO plant resulted in a shutdown of the
oil refinery for several months in 2010. The refinery started operating
again in December 2010, but environmental groups are putting pres-
sure on the refinery to reduce pollution, which leads to uncertainties
with regard to its future.
The distribution market was also affected by the shutdown of the refin-
ery: traffic in the harbor diminished and, as a consequence, bunkering
activities for the distributor decreased. Prospects are positive, however,
and there are plans to expand the bunkering and aviation market.
6
Exec
utive Su
mmar
y
During 2010, the international energy-price developments were not -
incorporated into local energy prices. In 2011, two additional players
have been allowed to enter the production market in the utilities sector.
Furthermore, policies are being prepared to reduce utility prices and
dependence on oil supply.
Besides the oil refinery and the shipyard company, business by other
players in the manufacturing sector remained the same or decreased
slightly in 2010 as compared to 2009, owing to increased competition
from imported products and high utility costs. The sector is positive
about the future due to the planned policy measures, such as a reform
of the tax structure and energy production.
Sale of important raw materials for the construction sector decreased
by between 8 and 22 percent in 2010 compared to 2009, since several
major projects were completed in the course of 2010. The number of
buildings completed in 2010 was slightly higher compared to 2009.
The number of building permits issued in 2010 decreased, however,
compared to the previous year.
There are, nevertheless, many projects being planned and prepared,
but the contracting portfolios are not known yet.
Sales in the wholesale sector remained the same or decreased slightly,
while sales in the retail sector increased slightly in 2010 compared to
the year before. Challenges for the sector lie in remaining competitive
and increasing the quality of the products supplied.
There are 10 service e-zones in operation on Curaçao and 2 free-zones
for international trading of goods. The total number of visitors to the
free-zones decreased by approximately 16 percent in 2010 compared
to 2009.
It is expected that at least two additional service e-zones will be insti-
tuted soon, but fewer e-zone license applications have been seen in
2011. The number of free-zone visitors is expected to increase.
7
Exec
utiv
e Summar
y
Passenger traffic at the Hato International Airport dropped by 3.54 per-
cent in 2010 compared to 2009. The economic crisis was largely to
blame for this drop. Moreover, some airlines deleted routes to lower
costs. Passenger traffic is predicted to increase slightly in 2011 be-
cause the number of flights connected to Curaçao has increased.
Harbor activities in terms of mooring ships (freighters, tankers and
cruise ships) declined by almost 14 percent in 2010 compared to the
year before. The volume of freight also decreased accordingly, from
97,913 TEUs in 2009 to 93,603 TEUs in 2010.
Preliminary figures indicate that cruise-ship calls have increased to 249
in 2011, but will decline to 219 in 2012. The number of cruise visitors
is expected to have increased in both years, despite the decline in calls
in 2012, as bigger ships are expected to anchor.
Tourism arrivals dropped by almost 7 percent in 2010 compared to
2009. Together with the increase in the room stock during recent years,
this resulted in a 3 percentage point decline of the hotel occupancy
rate.
The number of cruise arrivals decreased to almost 390,000 in 2010,
while the number of calls fell from 234 in 2009 to 221 in 2010.
The decline in tourist arrivals is mainly caused by the substantial drop
in arrivals from Venezuela. Arrivals from other South-American countries
increased but were not enough to offset the decrease from Venezuela.
In the first eight months of 2011, arrivals from Venezuela increased
compared to the same period in 2010. Arrivals from North-America in-
creased in 2010 and continue to be extremely positive in 2011. Arrivals
from other Caribbean islands increased in 2010 and continued to in-
crease in the first eight months of 2011. The Netherlands continue to
be the largest market and contributed to the strong growth in arrivals
from Europe in 2010. Growth has declined, however, in 2011.
Lending rates at commercial banks were reduced to approximately
3 to 5 percent and saving rates were reduced to approximately 0.75 to
2 percent in 2010. Most banks experienced an increase in net income
and loan portfolios expanded, stimulated by the lower lending rates.
8
Exec
utive Su
mmar
y
Increased competition on the local market will continue increasing the
volatility of interest rates while depreciation of the Euro will decrease
investments and higher imported inflation will mitigate consumer
spending.
The international financial and business services sector is considered
important for the local economy. It is perceived that this sector con-
tributed mostly to the slight economic expansion in 2010. Therefore,
concrete actions are being taken to maintain the country’s position on
the OECD white list, to take Curaçao off Brazil’s black list, sign tax
treaties with Brazil very soon and with other countries in the near future.
Local insurance companies faced increased operational costs in 2010
because of the aftermath of tropical storm Tomas, but this had a mini-
mum effect on their results.
However, falling interest rates, the new constitutional status of the BES
Islands and the anticipated introduction of a general healthcare insur-
ance are threats to insurance companies.
A number of healthcare coverage measures were proposed in 2009
which should have led to structural savings on healthcare spending.
Some have been put on hold for further analysis while others will be in-
troduced shortly. The definite location of the new hospital has been
stipulated and the construction is planned to start in the second quarter
of 2012.
9
Exec
utiv
e Summar
y
1.1 International and Regional Developments and Their Consequences for Curaçao
Global DevelopmentsThe world economy continued to recover in 2010. World economic
growth was estimated by the IMF at 5.1 percent in 2010 after the con-
traction of 0.7 percent in 2009. As fears of global recession receded in
2009, businesses regained confidence and industrial production and
trade boomed in the first half of 2010, accelerating in the second half.
The reduced excess capacity, accommodative policies and further im-
provement in confidence and financial conditions encouraged invest-
ments and sharply reduced the rate of job destruction.
The extent of growth experienced differs per region. In the major ad-
vanced economies, growth was modest, reaching an average of 3.1 per-
cent in 2010. Many emerging and developing countries, on the other
hand, saw robust growth rates, averaging 7.3 percent in 2010.
Despite these growth rates, unemployment remained high, since the
increase in unemployment in advanced economies was very severe du -
r ing the crisis years. Youth unemployment is a particular concern in
emerging and developing countries, despite the low national overall un-
employment rates.
Following the collapse during the crisis, global capital flows rebounded
sharply in 2010, but are still below pre-crisis averages of 2006/2007
in many countries. Strong growth prospects and relatively high yields
are attracting capital flows into emerging markets, while sluggish ac-
tivity and damaged financial systems continue hampering flows be-
tween advanced economies. As a consequence, stock markets and
credit have rebounded from the falls during the crisis, particularly fast
in emerging markets, reaching or surpassing average pre-crisis levels
in some of the larger markets.
The robust capital flow to emerging markets may continue, even though
10
Chapter 1: M
acroec
onomic Developm
ents
questions about macroeconomic policies and geopolitical uncertainties
could slow flows on the short run. The difference between advanced and
emerging economies is not expected to diminish significantly, however.
Furthermore, advanced economies face the challenge of preserving or
regaining fiscal credibility owing to high public deficits and debts. Most
of the advanced countries are planning to tighten fiscal policy. Most
G20 advanced economies have made it their target to halve deficits by
2013 compared to the levels in 2010. However, well-specified medium-
term measures to reduce debt remain absent in many advanced coun-
tries, putting upward pressure on interest rates and lowering potential
output and slowing economic recovery as a consequence. The eventual
increase in interest rates would affect emerging economies also by
destabilizing global bond markets, which would slow investments in
general and thus in the developing economies in particular.
Commodity prices increased sharply in 2010, especially in the second
half of the year, owing to a combination of strong increase in demand
(oil and food) and supply shocks (food), e.g. lower agricultural produc-
tion because of unfavorable weather conditions. Commodity prices con-
tinued increasing at the beginning of 2011 because of lower oil
production, owing to unrest in the Middle-East and North-Africa, which
resulted in increased overall marginal costs and thus higher costs of
production in the agricultural sector. Nevertheless, in the last months
of 2011, energy prices have receded to levels far below their peaks in
that same year. Food prices, however, have fallen to a much lesser ex-
tent. As a consequence inflationary pressure is lower in advanced
economies than in emerging and developing economies, because food
and fuel account for a higher share of consumption in the latter.
In advanced economies, inflation is projected to be approximately 2.5
percent in 2011 and then recede to approximately 1.5 percent in 2012,
while in emerging and developing countries inflation is likely to be
around 7.5 and 6 percent in 2011 and 2012 respectively. The high ex-
pected inflation in the emerging and developing economies is led by
demand pressures (core inflation)1.
11
Chapter
1: Mac
roec
onomic Develo
pmen
ts
1 Excluding food and energy prices
The global economy is expected to continue growing. For 2011, the
world economy is expected to grow by 4.0 percent and this same growth
rate is expected in 2012. However, in advanced economies, again
growth is expected to be lower in 2011–at 1.6 percent– than in emer g-
ing and developing economies–at 6.4 percent. Output in advanced
economies remains below potential, resulting in persistent high unem-
ployment, and the situation is expected to remain so considering the
low growth rate owing to pre-crisis excesses and crisis wounds. Further-
more, consumer and business confidence has deteriorated and
stronger activities are expected to be delayed. This makes the outlook
point to low growth in 2012 also–at 1.9 percent.
In emerging economies the crisis left no lasting wounds. Hence exports
have recovered and shortfalls in external demand are compensated by
domestic demand. Capital outflows turned into capital inflows because
of better growth prospects and higher interest rates than in advanced
economies. Growth in emerging and developing economies is estimated
to decline from an average of 6.4 percent in 2011 to 6.1 percent in
2012, as capacity constraints, policy tightening and slowing foreign de-
mand are expected to dampen growth.
Latin America and the CaribbeanAccording to estimates of the Economic Commission for Latin America
and the Caribbean (ECLAC), the economy of the Latin American and
Caribbean region grew by an estimated 6 percent in 2010. The upturn,
however, has been uneven among the sub regions.
Growth in 2010 firmed up the recovery that began in most of the re-
gion’s economies in the second half of 2009, thanks to actions to coun-
terbalance the impacts implemented by many of the countries in the
region combined with improving conditions in the global economy. The
stronger economic growth boosted demand for labor, thanks to which
the region’s unemployment rate eased back to around 7.6 percent and
the quality of new jobs improved. Economic growth was coupled with a
slight rise in inflation, from 4.7 percent in 2009 to around 6.2 percent
in 2010, basically reflecting the behavior of prices for a number of in-
ternational commodity prices including food and fuel. Labor market per-
12
Chapter 1: M
acroec
onomic Developm
ents
formance, more readily available credit and brightening expectations
boosted private consumption which, along with a significant increase
in investment in machinery and equipment, became the engine of de-
mand in 2010.
Commodity exporting countries (agricultural, mineral and petroleum
goods) benefited from terms-of-trade gains and higher export values.
However, most of the Central American and Caribbean countries, once
more, sustained net losses in terms of trade owing to higher import
values, which worsened the current-account position. These adverse
effects were partially offset by a slight upturn in tourism and in remit-
tances sent home from developed countries by migrant workers.
ECLAC projects a slight fall in the region’s growth rate to 4.2 percent in
2011 owing to the slightly dampened global economic outlook and the
easing off of public spending as a stimulus in many countries because
excess idle capacity has been used up.
According to the IMF, the pace of expansion in Latin America and the
Caribbean has begun to moderate because many economies have fully
recovered from the global crisis and macroeconomic policies are being
tightened. Growth remains above potential, at 4.5 percent in 2011 and
4.0 percent in 2012, with indicators suggesting that mainly exporting
economies (in South America) may be overheating. Economic growth is
projected to slow as domestic demand growth moderates, in response
to less accommodative macroeconomic policies, and external demand
weakens.
The outlook for commodity exporting countries (e.g. Argentina, Chile,
Paraguay, Peru and Uruguay) is positive with growth rates of approxi-
mately 6 percent in 2011. Growth in South America is projected average
4.9 and 4.1 percent in 2011 and 2012 respectively.
In Central America and the Caribbean, economic activity remains
subdued, reflecting stronger trade linkages with the U.S. and other
advanced economies and, in some cases, high levels of public debt.
Growth will continue to be constrained by slow recovery of remittances
and tourism at between 3.3 and 3.9 percent in 2011 and increase to
between 4.0 and 4.3 percent in 2012.
13
Chapter
1: Mac
roec
onomic Develo
pmen
ts
Inflation is projected to increase from 6 percent in 2010 to 6.7 percent
in 2011, because of the overheating and as commodity prices in-
creased in 2011, but to recede to 6 percent in 2012 as activity moder-
ates and commodity prices stabilize.
The region faces some downside risks, however: sharper slowdown in
advanced economies would dampen growth, especially in economies
dependent on trade, tourism spending and remittances. Moreover, the
strong presence of Spanish banks in the region could raise some risks
while potential spillovers from China could show up through trade
dampening the outlook for the commodity exporting countries. However,
domestic demand growth could exceed expectations if global risks un-
wind quickly, resuming the strong wave of capital flows to the region,
which is an upside risk. The risk pattern is reinforced by the region’s in-
ternal and external integration. An eventual slowdown in global growth
would cause a drop in the region’s commodity export.
Furthermore, many neighboring countries are profiting from strong
growth in Brazil. Consequently, an abrupt slowdown in activities in Brazil
would adversely affect the region. The challenge that lies ahead is to
maintain the region’s resilience to potential problems.
North AmericaAccording to the IMF, the US economy grew in 2010 by almost 3 percent
in real terms, after contracting by 2.6 percent in 2009. This recovery
was mainly supported by private demand. By the last quarter of 2010,
consumer demand was rising at its fastest pace in five years. Low cor-
porate borrowing rates and the easing tightness of lending conditions
reflected improved financial conditions resulting in a pickup of eco-
nomic activities. This has helped to rebuild consumer confidence
despite poor performing labor and housing markets.
After shredding more than 8.5 million jobs during crisis years, the labor
market has managed to add 1.5 million jobs, which was barely suffi-
cient to keep up with growth of the work-age population. A large part of
the decline in the unemployment rate is attributable to a decline in par-
ticipation. The unemployment rate reached 9.6 percent in 2010.
14
Chapter 1: M
acroec
onomic Developm
ents
According to forecasts of the IMF, the real GDP of the US will increase
by 1.5 percent in 2011 and in 2012 by 1.8 percent with a large number
of unsold properties and high mortgages repressing consumption.
House prices in the US have been declining, with harmful effects on
household and financial balance sheets, deteriorating household and
business confidence. Unemployment is high at approximately 9.1 per-
cent in 2011 and is expected to remain so in 2012, holding back wages.
The fiscal deficit and debt have resulted in a decreased solvency rating
for the US, and financial turmoil in the Euro area has tightened financial
conditions and weakened global demand with consequences for the
US also.
Inflation is moderate at 3 percent in 2011, but up from 1.6 percent in
2010. In 2012, the inflation rate is predicted to drop back to 1.3 per-
cent, in line with the pullback of commodity prices.
There are, however, some downside risks to the projected economic
growth in the US: growth will suffer if the temporary payroll tax cuts and
increased unemployment insurance are discontinued in 2012 and if
political consensus on the design of debt reduction is not reached soon.
Furthermore, prolonged delay in recovery of house prices, sustained
losses in equity markets and upside risks on commodity prices would
further repress consumer spending.
Sooner-than-expected restored financial stability and consumer and
business confidence could strengthen growth on the short run.
The main challenge for the US lies in reducing the structural deficit and
public debt in an environment of weak growth and high unemployment.
Economic developments in Canada in 2010 mirrored developments in
the U.S.A. The deceleration reflected the drag on Canadian export from
weak US activity, strong import growth from investment spending and
cooling of domestic activities.
Canada’s GDP is estimated to have increased by 3.3 percent in 2010
and is projected to expand by 2.1 percent in 2011 and by 1.9 percent
in 2012, with domestic demand being the force behind the growth. Job
creation has rebounded at a faster pace compared to the U.S.A., but a
slower pace of recovery over the near term is expected to keep unem-
15
Chapter
1: Mac
roec
onomic Develo
pmen
ts
ployment at approximately 7.5 percent in 2011 and 2012.
US risks are expected to shape Canada’s outlook through real and
financial spillovers.
EuropeThe IMF estimates that GDP in Europe grew by 2.2 percent in 2010,
despite financial turbulence in peripheral countries of the Euro area
during the last quarter of 2010. Concerns about banking sector losses
and fiscal sustainability caused sovereign spreads to widen in the Euro
area. The situation was controlled by strong policy responses at national
and EU level with measures to improve fiscal balances and to push for-
ward with structural reforms in the affected areas, liquidity support and
security purchases by the ECB. Therefore, the damage to economic
activity was limited to affected areas only and did not spread to the rest
of Europe.
Nevertheless, the ongoing fiscal tightening and the effect of the crisis
on consumer and business confidence are repressing growth this year,
especially after the first quarter. The year 2011 is predicted to show a
real expansion of 2.0 percent in Europe while for 2012 a 1.5 percent
growth is estimated.
Growth in emerging countries was higher in 2010 at 4.5 percent, com-
pared to 1.8 percent in the advanced economies, and is predicted to
be higher at 4.3 percent in 2011. In 2012, however, growth in emerging
countries is expected to decline to 2.7 percent as domestic and external
demand moderates. In advanced countries, GDP growth of 1.6 and 1.1
percent in 2011 and 2012 respectively is expected. Prospects across
regions are likewise divergent, reflecting differences in the state of
public and private balance sheets and the stance of macroeconomic
policies.
Germany for instance, which has been the continent’s growth locomo-
tive, grew by 3.6 percent in 2010, but growth is expected to slow down
to 2.7 percent in 2011 and to 1.3 percent in 2012. The expected slow-
down is due to the withdrawal of fiscal support and an expected slow-
down in external demand growth.
16
Chapter 1: M
acroec
onomic Developm
ents
Retrenchment of fiscal stimulus, which is expected to reduce consump-
tion growth and weaken export growth as consequence of slower exter-
nal demand, will cause France’s growth rate in 2011 and 2012 to be
in line with the 1.5-percent growth rate of 2010.
In advanced economies outside the Euro area, activity growth is like-
wise differentiated. The UK’s economy, for instance, grew by 1.4 per-
cent in 2010 and is projected to grow by 1.1 percent in 2011 and 1.6
percent in 2012 as fiscal consolidation dampens domestic demand.
In Sweden, real activity grew by 5.7 percent in 2010, but the growth
rate is expected to decelerate to 4.4 and 3.8 percent in 2011 and 2012
respectively amid improving financial conditions and signs of over-
heating in the real-estate sector.
In emerging Europe, recovery is expected to continue, boosted by inter-
nal demand, owing to credit growth accompanied by accommodative
macroeconomic policies. Growth is expected to remain more subdued
in countries that experienced unsustainable domestic booms.
In general, countries that avoided major imbalances and have benefit-
ted from the strong rebound in global manufacturing are close to pre-
crisis growth rates in 2011. Some others are below pre-crisis rates
because of sharp economic adjustments as consequence of the finan-
cial crises while others are recuperating from recent crises while ad-
dressing a number of challenges, such as weak banking systems and
high unemployment. The rest of the European countries are likely to
grow at less than pre-crisis averages as some are shaken by contagion
from the Euro area periphery while others are less affected.
Inflation has remained subdued in advanced Europe at 1.9 and at 2.5
percent in 2010 and 2011 respectively, and is expected to remain low
at 1.5 percent in 2012 in the absence of inflation expectations and be-
cause there is still excess capacity. In emerging Europe, inflation has
been higher at 5.3 percent in 2010 and 2011 but is expected to decline
to 4.5 percent in 2012.
17
Chapter
1: Mac
roec
onomic Develo
pmen
ts
The uncertain environment dominated by tension from the euro area
debt crisis imply downside risks to growth in Europe, as well as negative
spillovers from slower US growth. Securing debt sustainability and
strengthening the financial systems remain a priority for most European
countries. The largest economies are already implementing measures
to reduce their deficits.
Commonwealth and Independent StatesRecovery in CIS has been proceeding at a steady pace, supported by
higher commodity prices that have been boosting production and em-
ployment in the region’s exporting countries. The rebound in real activity
in Russia is also benefiting other countries through trade, remittances
and investment. On the other hand, dependence on external financing
and lingering banking sector vulnerabilities are holding back growth in
several CIS economies.
Real activity in CIS increased by 4.6 percent in 2010 and is projected
to expand by 4.6 percent in 2011 and by 4.4 percent in 2012, but
growth prospects differ within the region.
In Russia and other energy exporters, growth is estimated to pick up
modestly with growth rates at approximately 4.5 percent in 2011 and
2012. Growth is expected to slow down slightly in 2012 compared to
2011 as energy prices decline somewhat. Energy importers are ex-
pected to benefit from the rebound in remittances from Russia and oth-
ers from the return of financial stability.
Inflation in the region has been on the rise, led by higher commodity
prices, especially in the first half of 2011, the high share of food in the
consumption basket and demand pressure.
For most countries in the region, prospects depend highly on the economic
development in Russia, the rest of the world and commodity prices. Higher
commodity prices represent an upside risk to commodity exporting coun-
tries. But global slowdown would reduce commodity prices, dampening
the prospects for the region. Furthermore, lower external demand from
advanced economies represents a downside risk.
The key challenge is to abort crisis-related macroeconomic and financial
18
Chapter 1: M
acroec
onomic Developm
ents
policies in a way that provides sufficient support to the incomplete re-
covery without jeopardizing price stability, reduce external vulnerability
and raise potential growth through a more diversified pattern of eco-
nomic development.
AsiaReal GDP growth in Asia is moderating after a sharp rebound from the
global crisis, with a GDP growth of 8.2 percent in 2010 and a projected
growth of 6.2 and 6.6 percent in 2011 and 2012 respectively. The strong
rebound is supported by a strong export performance, private domestic
demand and in some cases rapid credit growth. Asia continues to outpace
other regions but external demand in emerging Asia has dampened
recently because of slowdown in the US and the Euro area.
Inflation in Asia averaged 4.1 percent in 2010 and is projected to ave rage
5.3 and 4.0 in 2011 and 2012 respectively. Inflation was higher in
developing Asia than in advanced Asia in 2010, and the difference is
likely to remain. Inflation pressures are higher in economies with
sustained credit growth, positive output gaps, and/or relatively accom-
modative policies.
China, today the world’s second largest economy and its leading ex-
porter and manufacturer, will remain a powerful source of external de-
mand for Asian producers in the foreseeable future. Growth in China is
projected to remain robust at 9.5 percent in 2011 and 9.0 percent in
2012 after growing by 10.3 percent in 2010, driven by private demand
caused by rapid investment growth, favorable labor market conditions
and continued policies to increase disposable income of households.
Inflation pressure in China remains, but efforts to withdraw credit stimu-
lus and to restrain property price inflation have been gaining ground.
India’s economic growth slowed down in the last quarter of 2010 as the
manufacturing sector was held back in the wake of multiple interest-rate
increases by the central bank amid rising prices. The Reserve Bank of India
raised its benchmark lending rates in seven equal installments of 0.25
percentage points since the beginning of 2010 to control rising prices.
19
Chapter
1: Mac
roec
onomic Develo
pmen
ts
The Indian economy grew by 10.1 percent in 2010, led by infrastructural
investments, and is forecasted to grow by 7.8 and 7.5 percent in 2011
and 2012 respectively, driven by private consumption.
After a rapid growth at 8.4 percent in 2010, growth in the newly indus-
trialized Asian economies is projected to moderate at 4.7 percent in
2011 and 4.5 percent in 2012 as activity moderates to close positive
output gaps. Both the internal and external private demand remain
important drivers behind growth.
ASEAN economies grew by 6.9 percent in 2010 and are projected to
grow by 5.3 and 5.6 percent in 2011 and 2012 respectively, driven by
domestic demand. ASEAN economies are led by Indonesia, where
strong consumption and recovery in investments are projected to raise
growth to 6.4 percent in 2011 and 6.3 percent in 2012.
Japan, the third largest economy in the world after the US and China,
grew by 3.9 percent in 2010 and was one of the highest among the
advanced economies. Japan’s growth was driven by significant fiscal
stimulus and a rebound in exports. Forecasts for 2011 are somewhat
pessimistic, because of damages caused by the Tohuku earthquake.
Japan’s economy is projected to contract by 0.5 percent in 2011, de-
spite an expected vigorous expansion in the second half of 2011.
Growth is projected to increase to 2.3 percent in 2012, with activity
sharply rebounding on reconstruction investment. Japan experienced
deflation of 0.7 percent in 2010 and further deflation is projected of
approximately 0.5 percent in 2011 and 2012.
In Australia, flooding in key mining and agricultural regions subtracted
from growth in 2010. The economy grew by 2.7 percent in 2010 and
for 2011 and 2012 the economy is projected to grow by 1.8 and
percent respectively.
In New Zealand, despite the recent earthquakes, growth is projected to
pick up. In 2011 a 2.0-percent growth rate is projected after already
increased economic activities of 1.7 percent in 2010. In 2012 growth
is expected to rise to 3.8 percent supported by strong terms of trade
and positive trade spillovers from the region.
20
Chapter 1: M
acroec
onomic Developm
ents
The financial turbulence in the Euro area and the US pose downside
risks for the region, since these would affect export in Asia through
trade linkages. Despite increase in intraregional trade in Asia, two-third
of the final demand comes from outside the region.
The Middle East and North Africa According to the Economist Intelligence Unit (EIU), economic growth in
the Middle East and North Africa (MENA) picked up in 2010, boosted
by the increase in oil prices, a stronger global economy and loose do-
mestic policy conditions. According to estimates of the IMF, GDP in
MENA grew by 4.4 percent in 2010.
Production in many countries in the region has been boosted by higher
commodity prices and external demand. In addition, government spen d-
ing programs have been fostering recovery in many oil-exporting coun-
tries.
In contrast, political discontent and high unemployment are causing
social unrest in a number of countries, which might dampen short-term
economic growth as these factors weigh heavily on tourism receipts,
capital flows and investment. Based on the above mentioned factors,
the IMF forecasts that economic activities in the region will increase by
4 percent in 2011 and by 3.6 percent in 2012.
Growth in oil-exporting countries is projected to pick up to almost 5 per-
cent in 2011, slightly higher than the 4.4 percent in 2010. In Qatar, for
instance, economic activity is projected to increase by 18.7 percent
boosted by continued expansion in natural gas production and large in-
vestment expenditures. In Saudi Arabia, growth is forecasted to be 6.5
percent, supported by public infrastructural investments. In the Repu b-
lic of Iran, growth is anticipated to stall temporarily as subsidies for en-
ergy and other products are phased out. This reform is expected to yield
benefits on the longer run. Disruptions of oil production in Libya in-
creased oil supply by other OPEC suppliers.
In oil-importing countries, growth in economic activity is more subdued,
down to 1.4 percent in 2011 compared to 2010 (4.5 percent).
21
Chapter
1: Mac
roec
onomic Develo
pmen
ts
Activity in some countries will be constrained by domestic social unrest
and an associated slow recovery in tourism receipts and remittances.
Growth in oil-importing countries is projected at 2.6 percent in 2012,
harmed by a slow recovery in investment.
Inflation is high in the MENA region, reaching almost 10 percent in 2011,
but is expected to decline somewhat in 2012, reflecting receding
commodity prices. For oil-exporters, inflation is forecasted to fall from 10.8
percent in 2011 to 7.6 percent in 2012 while for oil-importing countries,
inflation is anticipated to stay below 8 percent during 2011 and 2012.
Downside risks are the domestic effects of political and social unrest
that could be larger than expected, especially if unrest spills over to
additional countries in the region. In addition, financial markets have
not stayed immune, and as these developments on the financial market
continue, higher funding costs for governments and firms could be the
result. Moreover, weak performance of advanced economies, mainly
the US and Europe, could adversely affect the region’s export earnings,
fiscal and external imbalances and growth.
The MENA region is challenged to raise growth and tackle high unem-
ployment, mainly among young people. Oil exporters should strengthen
or develop financial systems and promote economic diversification.
Sub-Saharan AfricaSub-Saharan Africa has recovered well from the financial crisis. The
region grew rapidly in 2010 by 5.4 percent. Growth in domestic demand
remained robust, trade and commodity prices rebounded and macro-
economic policies remained accommodative.
Terms of trade gains are supporting the region’s external balances and
gradual reorientation of export towards fast-growing regions such as
Asia is being sustained. As a consequence, according to the IMF, real
activity in Sub-Saharan Africa is projected to expand by 5.2 and 5.8
percent in 2011 and 2012 respectively.
22
Chapter 1: M
acroec
onomic Developm
ents
However, prospects differ considerably within the region. Growth is
being led by the low-income countries which are projected to grow by
approximately 6 percent in 2011 and by 6.5 percent in 2012, stimu-
lated by launching of oil production (Ghana) and infrastructural invest-
ment and improved agricultural production (Kenya and Ethiopia).
The prospect of oil-exporting countries is likewise positive, with a fore-
casted growth rate of almost 6 percent in 2011 and over 7 percent in
2012, sustained by continued strength in domestic public investment
spending and strong rebound in oil production in Angola following the
disruption in 2011.
Middle-income countries are more vulnerable to the crisis as they are
more integrated with the global market, hence recovery is delayed. In
South Africa, the region’s largest economy, recovery is projected to remain
relatively modest at approximately 3.5 percent in 2011 and 2012,
because of an increase in unemployment, high household debt, low
capacity utilization, the slow down in advanced countries and substantial
real exchange rate appreciation. Growth is driven by private consumption
and investment supported by a low interest rate environment.
The region is vulnerable to some external forces, however. Europe is
the main trading partner for the region’s non-oil exporting countries.
Consequently a slowdown in Europe hurts manufacturing exporters in
the region.
Implications for CuraçaoAfter contracting by 0.5 percent in 2009, activities in Curaçao increased
by 0.1 percent in 2010, lagging far behind the Latin American and
Caribbean region in general and the Caribbean in particular. The slight
increase in economic activities is attributable to increased public
consumption of goods and services with regards to the dismantling
activities and the SEI program and increased private consumption.
These increases were offset by decreased public and private invest-
ments and export.
23
Chapter
1: Mac
roec
onomic Develo
pmen
ts
Curaçao is largely dependent on the import of goods from its main
tra ding partners, Venezuela, the U.S.A. and the Netherlands. Hence,
inflationary pressure in these regions leads to increased inflation in
Curaçao. Inflation remained subdued in the main trading countries and
as a consequence inflation in Curaçao remained moderate at 2.8
percent.
For 2011, the economy is expected to expand by 0.3 percent and inflation
to be slightly lower than the year before.
However, since Curaçao’s export of principally (tourism) services is largely
to the main trading countries, the risks of decreased growth in these coun-
tries pose risks to the island’s medium-term macroeconomic perfor -
mance. Any slowdown in growth in these countries would negatively affect
demand for the island’s tourism services.
Curaçao has achieved a sustainable level of public debt and this poses
prospects for stable long-term economic growth in general where
investments in infrastructure and socio-economic projects can be
improved. A compulsory balanced budget rule has been set, aimed at
avoiding the unrestrained buildup of public debt in the future.
On the downside, development aid from the Netherlands is planned to
stop by 2013, threatening the infrastructural and socioeconomic invest-
ments.
Sources:
Deloitte: 4th Quarter 2010: Global Economic Outlook. Multi Speed Recovery.
Economist Intelligence Unit, (The Economist) May 2011
International Monetary Fund: World Economic Outlook, April 2011
International Monetary Fund: World Economic Outlook Update, June 2011
International Monetary Fund: World Economic Outlook, September 2011
United Nations: Economic Development in Africa 2010 south – south Coopera-
tion: Africa and the new forms of Development Partnership
World Bank: East Asia and Pacific Economic Update 2011, Vol.1
World Bank: Global Economic Prospects; Crisis, Finance and Growth 2010.
24
Chapter 1: M
acroec
onomic Developm
ents

Websites:
http://www.unctad.org
http://www.nytimes.com
http://www.blogjaviervega.blogspot.com
http://www.cfr.org/refugees-and-the-displaced/eu-concerns-over-mideast-mi-
grants/p24672
http://www.eclac.org/cgi-
bin/getProd.asp?xml=/publicaciones/xml/4/41974/P41974.xml&xsl=/de/tpl-
i/p9f.xsl&base=/tpl-i/top-bottom.xslt
25
Chapter
1: Mac
roec
onomic Develo
pmen
ts
1.2 Macroeconomic Indicators for Curaçao
IntroductionThis section presents preliminary figures on Curaçao’s macroeconomic
performance in 2010, and a macroeconomic analysis for a short-term
forecast. The figures presented for past years are actual figures com-
piled by Curaçao’s Central Bureau of Statistics (CBS). The macroeco-
nomic analysis of the forecast is carried out with the help of the
macroeconomic model Curalyse and is based on expected develop-
ments in the main sectors and implementation of planned economic
reforms.
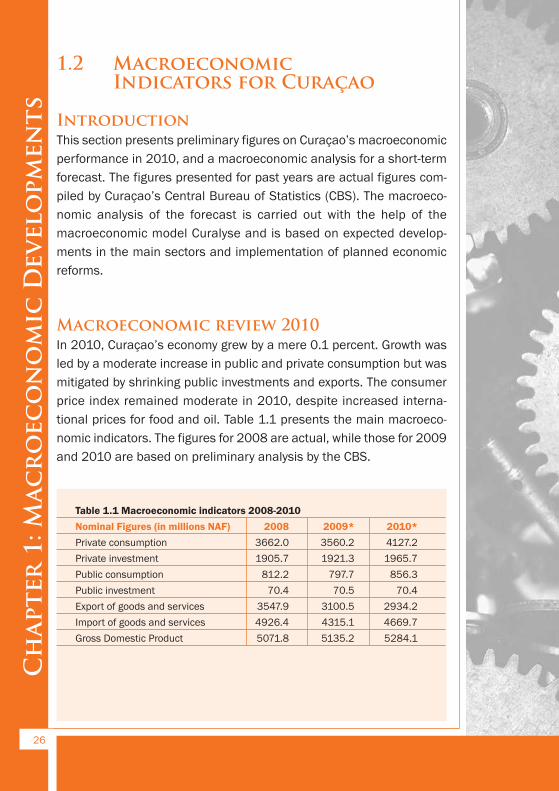
Macroeconomic review 2010In 2010, Curaçao’s economy grew by a mere 0.1 percent. Growth was
led by a moderate increase in public and private consumption but was
mitigated by shrinking public investments and exports. The consumer
price index remained moderate in 2010, despite increased interna-
tional prices for food and oil. Table 1.1 presents the main macroeco-
nomic indicators. The figures for 2008 are actual, while those for 2009
and 2010 are based on preliminary analysis by the CBS.
Table 1.1 Macroeconomic indicators 2008-2010
Nominal Figures (in millions NAF) 2008 2009* 2010*
Private consumption 3662.0 3560.2 4127.2
Private investment 1905.7 1921.3 1965.7
Public consumption 812.2 797.7 856.3
Public investment 70.4 70.5 70.4
Export of goods and services 3547.9 3100.5 2934.2
Import of goods and services 4926.4 4315.1 4669.7
Gross Domestic Product 5071.8 5135.2 5284.1
26
Chapter 1: M
acroec
onomic Developm
ents
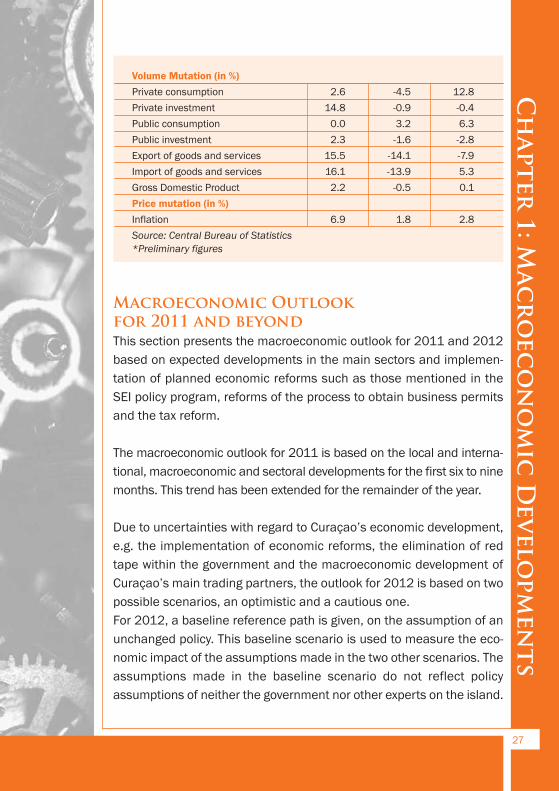
Volume Mutation (in %)
Private consumption 2.6 -4.5 12.8
Private investment 14.8 -0.9 -0.4
Public consumption 0.0 3.2 6.3
Public investment 2.3 -1.6 -2.8
Export of goods and services 15.5 -14.1 -7.9
Import of goods and services 16.1 -13.9 5.3
Gross Domestic Product 2.2 -0.5 0.1
Price mutation (in %)
Inflation 6.9 1.8 2.8
Source: Central Bureau of Statistics
*Preliminary figures
Macroeconomic Outlook for 2011 and beyondThis section presents the macroeconomic outlook for 2011 and 2012
based on expected developments in the main sectors and implemen-
tation of planned economic reforms such as those mentioned in the
SEI policy program, reforms of the process to obtain business permits
and the tax reform.
The macroeconomic outlook for 2011 is based on the local and interna-
tional, macroeconomic and sectoral developments for the first six to nine
months. This trend has been extended for the remainder of the year.
Due to uncertainties with regard to Curaçao’s economic development,
e.g. the implementation of economic reforms, the elimination of red
tape within the government and the macroeconomic development of
Curaçao’s main trading partners, the outlook for 2012 is based on two
possible scenarios, an optimistic and a cautious one.
For 2012, a baseline reference path is given, on the assumption of an
unchanged policy. This baseline scenario is used to measure the eco-
nomic impact of the assumptions made in the two other scenarios. The
assumptions made in the baseline scenario do not reflect policy
assumptions of neither the government nor other experts on the island.
27
Chapter
1: Mac
roec
onomic Develo
pmen
ts
Outlook 2011This section presents the assumptions which are used to forecast the
macroeconomic developments in 2011. The assumptions mentioned
below occur autonomously and, as mentioned previously, are based on
indications of the developments in the first six to nine months of 2011:
· An increase in the number of stay-over arrivals, especially from the
North-American and South-American market, mitigated by a slow-
down of arrivals from the European market. This is reflected by a
7-percent increase in stay-over nights in 2011 compared to 2010;
· A 1-percent decline in private investments. The incentives to invest
remain withheld owing to, among other factors, the lower occupancy
rate of hotels in the past years and international economic and
financial turmoil. The previous decline in occupancy rates resulted
in postponement of planned investments in room inventory to 2012;
· NAF 20 million in total investments related to SEI projects;
· Public finances show no deficit, in accordance with the agreements
with College financieel toezicht (Cft). Real public consumption
declines by approximately 10 percent, as it picks up in the third and
the fourth quarter of 2011. Public investments increase by 20
percent in 2011 compared to 2010 as they slow down in the second
half; and
· Non-tourism exports show no real growth in 2011 compared to
2010.
The results based on the abovementioned assumptions are presented
in table 1.2. The increase in exports in the form of tourism services
results in a higher demand for local products and services. No invest-
ments to handle the increased demand are shown, because there
already is sufficient inventory to deal with the increased demand of the
tourism sector. As business production increases to accommodate the
higher local demand, employment by enterprises grows. However, this
growth in employment is not sufficient to stimulate a decrease in the
number of unemployed. The increased employment of businesses,
combined with the increased wage rate, results in an increased con-
sumption of 0.2 percent. This increased consumption can be derived
28
Chapter 1: M
acroec
onomic Developm
ents
from the 1.4-percent increase in the number of 210-feet containers en-
tering in the first nine months of 2011 compared to the same period of
20102 and from the slight increase in the amount of consumer loans
and mortgages in the first nine months3 of 2011 compared to the same
period in 2010.
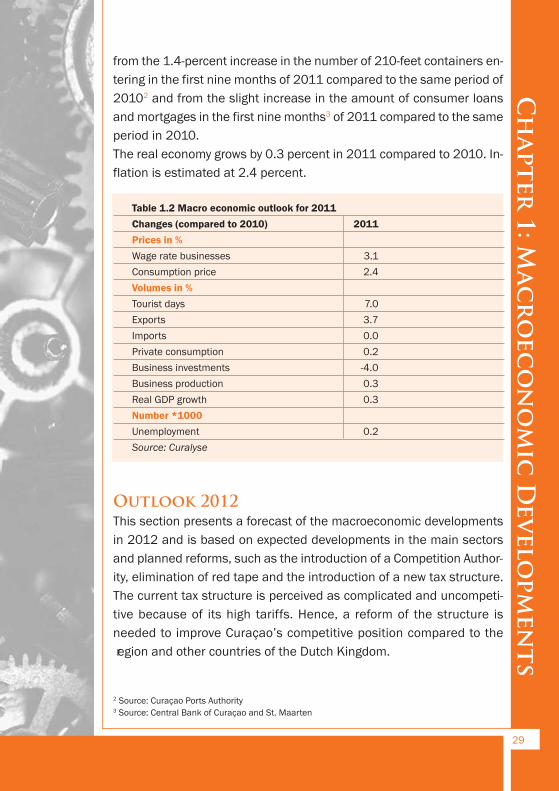
The real economy grows by 0.3 percent in 2011 compared to 2010. In-
flation is estimated at 2.4 percent.
Table 1.2 Macro economic outlook for 2011
Changes (compared to 2010) 2011
Prices in %
Wage rate businesses 3.1
Consumption price 2.4
Volumes in %
Tourist days 7.0
Exports 3.7
Imports 0.0
Private consumption 0.2
Business investments -4.0
Business production 0.3
Real GDP growth 0.3
Number *1000
Unemployment 0.2
Source: Curalyse
Outlook 2012This section presents a forecast of the macroeconomic developments
in 2012 and is based on expected developments in the main sectors
and planned reforms, such as the introduction of a Competition Author-
ity, elimination of red tape and the introduction of a new tax structure.
The current tax structure is perceived as complicated and uncompeti-
tive because of its high tariffs. Hence, a reform of the structure is
needed to improve Curaçao’s competitive position compared to the
region and other countries of the Dutch Kingdom.
29
Chapter
1: Mac
roec
onomic Develo
pmen
ts
2 Source: Curaçao Ports Authority3 Source: Central Bank of Curaçao and St. Maarten
Baseline scenarioFor the purpose of measuring the impact of the possible scenarios, first
the baseline scenario is given. The assumptions of the baseline
scenario are:
· A 2-percent increase in stay-over nights, which is the average over
the past 15 years;
· The amount of private and public consumption and investment will
remain at the same level in 2012 as in 2011;
· The investments and reforms within the framework of the SEI will
be neglected; and
· Exports in the non-tourism sectors show zero growth in 2012
compared to 2011.
The macroeconomic effect of the baseline scenario is presented in
table 1.3. In this scenario, growth in 2012 is led by the increase in
tourism arrivals which manifests itself in a 2-percent increase in the
number of stay-over nights. This slight increase in tourism demand
encourages a slight (0.1%) increase in business production and, as a
consequence, in real GDP also of 0.1 percent. The increased demand
is not enough to increase the number of jobs available and accommo-
date citizens that are entering the labor market. Hence, the number of
unemployed persons increases by 300.
Inflation is estimated to follow the trend in 2011 at 2.3 percent.
Optimistic scenarioFor the optimistic scenario, the following assumptions are made:
· Stay-over nights will increase by 10 percent in 2012 compared to
2011 owing to intensified marketing efforts in existing markets and
the tapping of new markets such as Canada and Germany;
· The new fiscal structure is introduced as of January 1, 2012 and
includes:
o a decrease in profit tax, from 34.5 percent to 27.5 percent;
o a reform of the structure of wage and income taxation;
o an increase of turnover tax from 5 to 6 percent; and
o a decrease of the excise duty on gasoline of NAF 15.75 per
100 liter and on Low Sulfur Diesel of NAF 8.50 per 100 liter.
30
Chapter 1: M
acroec
onomic Developm
ents

· Private investments increase by NAF 38 million as investments in
room inventory are continued. The hotel occupancy rate reaches
the level of 75 percent, which will encourage new investments in
the tourism sector;
· Investments within the framework of the SEI amount to
NAF 40 million in 2012; and
· The Competition Authority and Red Carpet instead of Red Tape are
fully introduced implying an increase of labor productivity of
0.25 percent.
· Other assumptions remain the same as in the baseline scenario.
The macroeconomic impact of the optimistic scenario is given in table
1.3. In the optimistic scenario, growth in 2012 is led by an increase in
the number of stay-over nights, increased private investments and
increased labor productivity. Stay-over nights increase by 10 percent in
2012 owing to, among other factors, increased marketing efforts in the
North-American market, especially in the North-Eastern part of North
America and the new air connection established with Air Berlin in the
last quarter of 2011.
The higher number of tourists in 2011 and the first months of 2012
gives a boost to private investments in 2012 with a NAF 38-million
expansion of the room inventory as planned, according to the Curaçao
Tourist Board (CTB).
Most of the remaining SEI budget is used. Hence, SEI investments are
for an amount of NAF 40 million. The SEI investments accelerate public
consumption and investment as several SEI projects are co-financed
by the government.
The higher tourism demand, public consumption and public and private
investments boost economic growth by increasing business production,
which on its turn boosts job creation. Unemployment is reduced by 200
persons, contributing to an increased real private consumption of 0.2
percent. The growth of private consumption is mitigated by the higher
turnover tax, which causes an increase in prices. The interaction
between increased local demand and supply results in an increased
real GDP of 0.9 percent.
The wage rate is increased because of the increase in productivity.
31
Chapter
1: Mac
roec
onomic Develo
pmen
ts
The increase in turnover tax and wages results in an inflation of 3.4
percent in 2012.
Cautious scenarioThe cautious scenario is based on the following assumptions:
· The marketing efforts are less intense compared to the optimistic
scenario, resulting in a 6-percent increase in stay-over nights in
2012 compared to 2011;
· The new fiscal structure is introduced per January 1, 2012 as men-
tioned in the optimistic scenario;
· Private investments increase by NAF 20 million compared to 2011;
· Investments within the framework of the SEI are for NAF 20 million;
and
· The introduction of the Competition Authority and Red Carpet in-
stead of Red Tape is delayed, implying an increase in labor produc-
tivity of only 0.1 percent.
· Other assumptions remain the same as in the baseline scenario.
For the cautious scenario, a 6-percent increase in stay-over nights is
considered in 2012. The increase in tourism demand of the previous
and current year induces investments in room inventory by NAF 20 mil-
lion. SEI investments are for another NAF 20 million, boosting public
consumption and investments.
The higher tourism demand, public consumption and private and public
investments give a boost to economic growth through an increase in
demand for local products and services. However, due to increased
labor productivity, the demand for labor remains idle. The lack of job
creation has a negative impact on consumption as the purchasing
power of households decrease because of the increased consumption
prices and is not compensated by an increase in wages.
Business production and real GDP increase by 0.3 percent each, lack-
ing force to increase employment. Unemployment increases by 200 per-
sons due to migration and demographic developments. Inflation is at
3.3 percent, as the turnover tax is raised and wage rates are increased.
32
Chapter 1: M
acroec
onomic Developm
ents
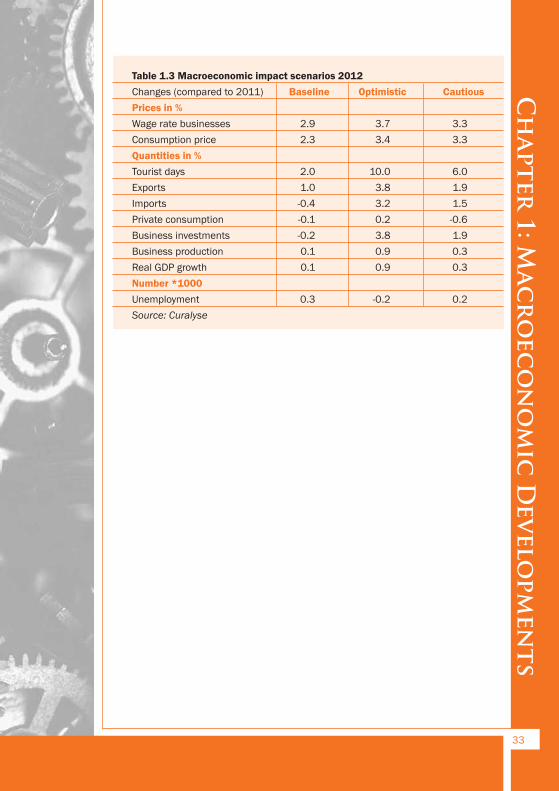
Table 1.3 Macroeconomic impact scenarios 2012
Changes (compared to 2011) Baseline Optimistic Cautious
Prices in %
Wage rate businesses 2.9 3.7 3.3
Consumption price 2.3 3.4 3.3
Quantities in %
Tourist days 2.0 10.0 6.0
Exports 1.0 3.8 1.9
Imports -0.4 3.2 1.5
Private consumption -0.1 0.2 -0.6
Business investments -0.2 3.8 1.9
Business production 0.1 0.9 0.3
Real GDP growth 0.1 0.9 0.3
Number *1000
Unemployment 0.3 -0.2 0.2
Source: Curalyse
33
Chapter
1: Mac
roec
onomic Develo
pmen
ts
1.3 Labor-Market Developments
IntroductionThis section will give a summary of important developments regarding
the labor market in Curaçao. Unfortunately, the labor market statistics4
for 2010 are not available because the CBS did not conduct the Labor
Force Survey. As a consequence, a different approach is used this time.
Based on some other useful indicators, an approximation of the
develop ments is discussed. These indicators are:
o the number of requests for dismissal;
o the number of new registrations for assistance in finding a job; and
o the number of vacancies and placements into these vacancies.
The statistics were collected from the Ministry of Social Affairs, Labor
and Welfare (the former DirAZ and DWI).
An overview from 2006 on is given for the purpose of comparing the
developments in 2010 to those of previous years.
Local Developments
Dismissal RequestsTable 1.4 provides an overview of different developments related to dis-
missals in Curaçao.
In certain cases, when an employer wants to terminate a contract with
an employee, the approval of the former Directorate of Labor Affairs
(DirAZ, now a section of the Ministry of Social Affairs, Labor and Wel-
fare) is needed. The dismissal legislation is primarily meant to protect
the weaker party of the labor market, the employee, from unreasonable
and arbitrary dismissal, but also keeps the interests of the employer in
mind. Since proper functioning of the business comes first to the
employer, the possibility should exist to discharge employees within a
relatively short period of time depending on the business results.
34
Chapter 1: M
acroec
onomic Developm
ents
4 Traditionally, the Central Bureau of Statistics (CBS) provides the relevant statistics through their
Labor Force Survey. However, CBS was preparing intensely for the Census that took place in March
and April 2011.
A dysfunctional employee may also hamper the company’s operation,
so in such cases too it should be possible for the employer to terminate
the work relation with such an employee.
The dismissal ordinance is not applicable to:
· employees of public corporations (civil servants, as well as laborers
and employees working for the government on labor contracts);
· educational personnel and teachers;
· clergymen (priests and ministers, for example);
· employees that perform domestic labor in private households (do-
mestic personnel);
· directors’ labor contracts;
· fixed-term labor contracts, except fixed-term contracts that are di-
rectly or indirectly preceded by a contract without a fixed term or
contracts in which the same worker has successively worked for dif-
ferent employers, who can reasonably be considered to be each
other’s successors with regard to the work performed; and
· in cases of bankruptcy.
In some other cases approval from the Directorate is not required, e.g.
dismissal “on the spot” (in case of theft, gross neglect of duties, drunk-
enness or debauchery during work by the employee), dismissal by mu-
tual consent, the expiring of a fixed-term labor contract, dismissal within
the trial period or dissolution of the labor contract by court.
As can be seen in table 1.4, a total of 128 collective requests for dis-
missal were made in 2010 involving a total of 319 employees. The Di-
rectorate approved 230 of these individual dismissal requests. These
employees lost their jobs. An additional 24 employees also lost their
jobs when they agreed to terminate the labor agreement without going
through the dismissal evaluation process (mutual consent). A total of
24 individual requests were declined by the Directorate.
The number of submitted requests for dismissal was higher in 2010
compared to the previous years. The number of employees involved in
the requests almost doubled compared to 2009 and the number of re-
quests consented was more than double the number in 2009. A total
35
Chapter
1: Mac
roec
onomic Develo
pmen
ts
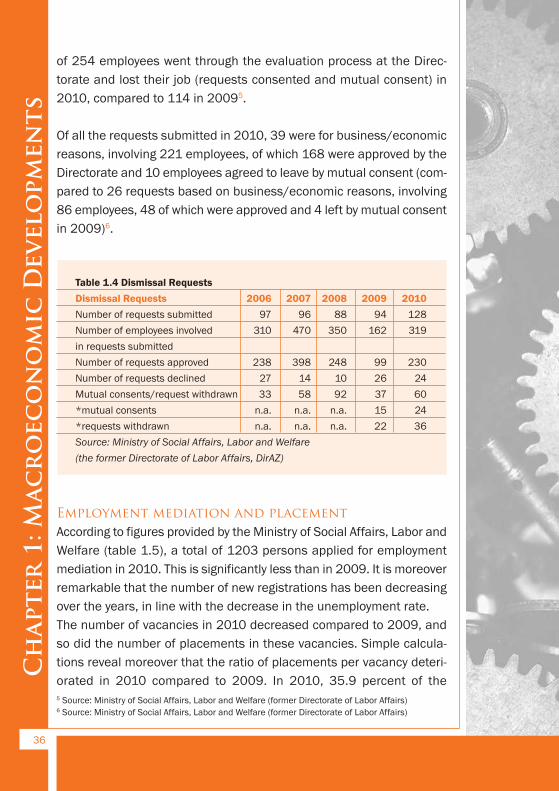
of 254 employees went through the evaluation process at the Direc-
torate and lost their job (requests consented and mutual consent) in
2010, compared to 114 in 20095.
Of all the requests submitted in 2010, 39 were for business/economic
reasons, involving 221 employees, of which 168 were approved by the
Directorate and 10 employees agreed to leave by mutual consent (com-
pared to 26 requests based on business/economic reasons, involving
86 employees, 48 of which were approved and 4 left by mutual consent
in 2009)6.
Table 1.4 Dismissal Requests
Dismissal Requests 2006 2007 2008 2009 2010
Number of requests submitted 97 96 88 94 128
Number of employees involved 310 470 350 162 319
in requests submitted
Number of requests approved 238 398 248 99 230
Number of requests declined 27 14 10 26 24
Mutual consents/request withdrawn 33 58 92 37 60
*mutual consents n.a. n.a. n.a. 15 24
*requests withdrawn n.a. n.a. n.a. 22 36
Source: Ministry of Social Affairs, Labor and Welfare
(the former Directorate of Labor Affairs, DirAZ)
Employment mediation and placementAccording to figures provided by the Ministry of Social Affairs, Labor and
Welfare (table 1.5), a total of 1203 persons applied for employment
mediation in 2010. This is significantly less than in 2009. It is moreover
remarkable that the number of new registrations has been decreasing
over the years, in line with the decrease in the unemployment rate.
The number of vacancies in 2010 decreased compared to 2009, and
so did the number of placements in these vacancies. Simple calcula-
tions reveal moreover that the ratio of placements per vacancy deteri-
orated in 2010 compared to 2009. In 2010, 35.9 percent of the
36
Chapter 1: M
acroec
onomic Developm
ents
5 Source: Ministry of Social Affairs, Labor and Welfare (former Directorate of Labor Affairs)6 Source: Ministry of Social Affairs, Labor and Welfare (former Directorate of Labor Affairs)
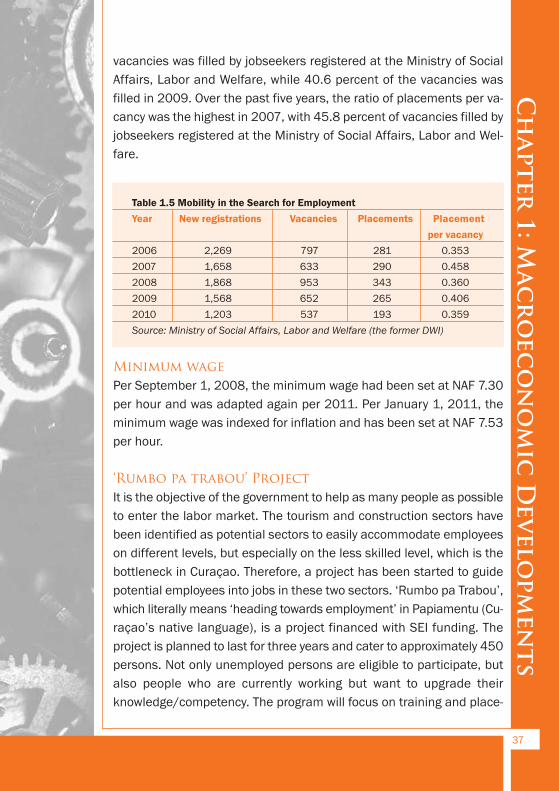
vacancies was filled by jobseekers registered at the Ministry of Social
Affairs, Labor and Welfare, while 40.6 percent of the vacancies was
filled in 2009. Over the past five years, the ratio of placements per va-
cancy was the highest in 2007, with 45.8 percent of vacancies filled by
jobseekers registered at the Ministry of Social Affairs, Labor and Wel-
fare.
Table 1.5 Mobility in the Search for Employment
Year New registrations Vacancies Placements Placement
per vacancy
2006 2,269 797 281 0.353
2007 1,658 633 290 0.458
2008 1,868 953 343 0.360
2009 1,568 652 265 0.406
2010 1,203 537 193 0.359
Source: Ministry of Social Affairs, Labor and Welfare (the former DWI)
Minimum wagePer September 1, 2008, the minimum wage had been set at NAF 7.30
per hour and was adapted again per 2011. Per January 1, 2011, the
minimum wage was indexed for inflation and has been set at NAF 7.53
per hour.
‘Rumbo pa trabou’ ProjectIt is the objective of the government to help as many people as possible
to enter the labor market. The tourism and construction sectors have
been identified as potential sectors to easily accommodate employees
on different levels, but especially on the less skilled level, which is the
bottleneck in Curaçao. Therefore, a project has been started to guide
potential employees into jobs in these two sectors. ‘Rumbo pa Trabou’,
which literally means ‘heading towards employment’ in Papiamentu (Cu-
raçao’s native language), is a project financed with SEI funding. The
project is planned to last for three years and cater to approximately 450
persons. Not only unemployed persons are eligible to participate, but
also people who are currently working but want to upgrade their
knowledge/competency. The program will focus on training and place-
37
Chapter
1: Mac
roec
onomic Develo
pmen
ts
ment of people on the local labor market. Participants are guaranteed
a job after finishing the program and will be assisted during the first six
months of their new job.
OutlookCurrently, citizens are allowed to retire at the age of 60. At this age,
each legal citizen is entitled to a social pension (AOV). The amount of
the pension varies according to the number of years a person has been
in Curaçao during his/her adult life (from age 15 to 60)7. The pension
structure is based on a social system in which the active working pop-
ulation pays a premium according to their salary to support the fund
that pays the current retired population.
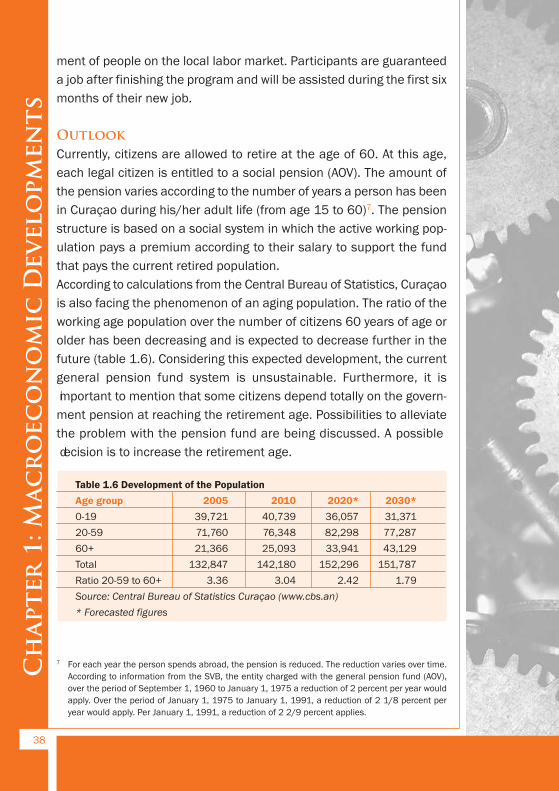
According to calculations from the Central Bureau of Statistics, Curaçao
is also facing the phenomenon of an aging population. The ratio of the
working age population over the number of citizens 60 years of age or
older has been decreasing and is expected to decrease further in the
future (table 1.6). Considering this expected development, the current
general pension fund system is unsustainable. Furthermore, it is
important to mention that some citizens depend totally on the govern-
ment pension at reaching the retirement age. Possibilities to alleviate
the problem with the pension fund are being discussed. A possible
decision is to increase the retirement age.
Table 1.6 Development of the Population
Age group 2005 2010 2020* 2030*
0-19 39,721 40,739 36,057 31,371
20-59 71,760 76,348 82,298 77,287
60+ 21,366 25,093 33,941 43,129
Total 132,847 142,180 152,296 151,787
Ratio 20-59 to 60+ 3.36 3.04 2.42 1.79
Source: Central Bureau of Statistics Curaçao (www.cbs.an)
* Forecasted figures
38
Chapter 1: M
acroec
onomic Developm
ents
7 For each year the person spends abroad, the pension is reduced. The reduction varies over time.
According to information from the SVB, the entity charged with the general pension fund (AOV),
over the period of September 1, 1960 to January 1, 1975 a reduction of 2 percent per year would
apply. Over the period of January 1, 1975 to January 1, 1991, a reduction of 2 1/8 percent per
year would apply. Per January 1, 1991, a reduction of 2 2/9 percent applies.

Considering the pool of unemployed and in an effort to stimulate
among locals, a new act has been proposed to the Executive Council.
This proposal sets a quota on the number of foreigners working in the
firms in Curaçao. A ratio of 1 foreigner per 5 locals (20% foreigners and
80% locals) in each firm has been proposed. In the proposal, locals are
defined as persons born in Curaçao or whose mother or father, with
Dutch citizenship, was born in Curaçao, or persons born on one of the
other islands of the former Netherlands Antilles and living in Curaçao
by October 10, 2010.
The proposal has been approved by the Council and is awaiting legisla-
tion. It can be expected that some businesses will have difficulty to with
this act.
39
Chapter
1: Mac
roec
onomic Develo
pmen
ts
1.4 Public Finances
IntroductionThe year 2010 marked a transition year for Curaçao and the public
finances of Curaçao. On October 10, 2010, Curaçao became an
autonomous country within the Dutch Kingdom and the two govern-
ment levels (the government of the Netherlands Antilles and of the
Territory Curaçao) were merged into one for the government of Curaçao,
including the civil servants and ongoing projects.
Preliminary figures on actual revenues and expenditures up to October
10, 2010 indicate a surplus for the treasury of the Island Territory of
Curaçao. The differences between the budgeted and actual amounts
will be analyzed based on the financial report of the Government of the
Island Territory of Curaçao. In addition, the debt position at the end of
2010 and the future fiscal policy will be discussed.
Financial ReportTable 1.7 provides an overview of the revenues and expenditures for
2010, up to October 10. All actual figures included in the financial report
are on cash basis and all projected figures are on transaction basis. The
projection of the revenues and expenditures were based on a forecasted
economic growth of 1.5 percent in 2010, while a lower growth rate has
been registered. Nevertheless, the actual revenues turned out slightly
higher than budgeted while total expenditures turned out lower than
budgeted. A total of NAF 908.9 million was budgeted in revenues, whereas
actual revenues amounted to NAF 911.4 million. Total expenditures were
estimated at NAF 893.4 million but only a total of NAF 879.1 was actually
spent. This resulted in an operational balance of NAF 32.3 million, higher
than the NAF 15.5 initially estimated.
The slight increase in revenues is owed to improved profit-tax revenues,
but disappointing non-tax revenues compared to the amounts initially
budgeted. Up to October 10, 2010, the government collected NAF 193
40
Chapter 1: M
acroec
onomic Developm
ents
million in profit tax, which is NAF 25.6 million more than the amount
initially estimated. This improvement in the amount collected in profit
tax indicates a fortunate 2009, especially for local businesses, but also
improved compliance to remittance.
Up to October 10, 2010, non-tax revenues amounted to NAF 152.1
million, which is more than NAF 30 million lower than estimated. The
disappointing items were the dividends and other income from govern-
ment-owned limited liability companies.
With regard to the expenditures, mainly the lower expenditures on per-
sonnel costs, goods and services and interest payments contributed to
the lower than estimated total expenditures, as can be seen in the
table. The lower expenditure on personnel costs is partly because the
amount to be paid in wages, especially to teachers, was overestimated.
Moreover, the payments to the pension fund of public employees
(APNA) lagged behind the amount initially estimated due to payments
in connection with early retirements. It is expected that APNA will charge
these costs in a later stage.
With regard to the goods and services, there was less money spent on
temporary personnel and housing. Consultancy costs were invoiced for
less than budgeted, but more invoices over this period are expected in
a later stage. On the other hand, the amount spent on medical costs
turned out higher than the amount budgeted. It is important to mention
that medical costs is the largest category of goods and services and
consists mainly of medical costs of pro-pauper patients and civil
servants. Medical costs were underestimated because of pending
measures with regard to the costs of medication. However because the
measures were not executed, the expected reduction in costs of
medication was not effectuated.
Interest payments were NAF 3.5 million lower than estimated because
of payments received from the Netherlands in connection with the debt-
relief program.
41
Chapter
1: Mac
roec
onomic Develo
pmen
ts
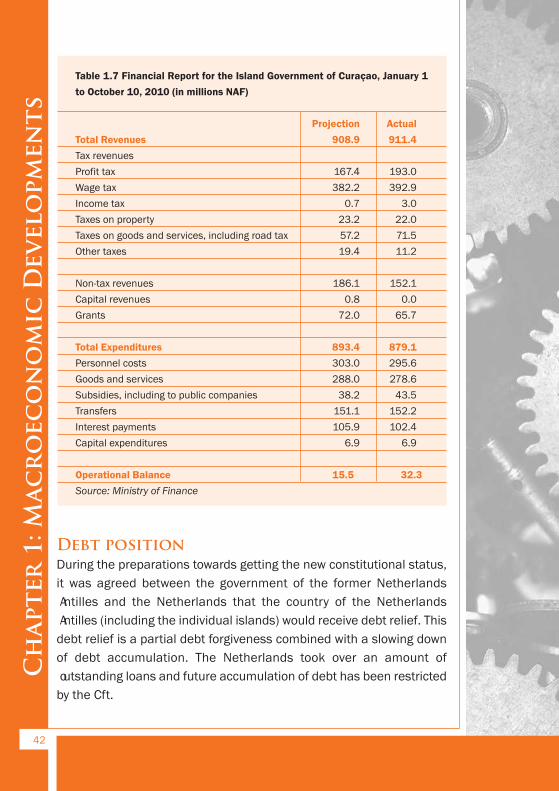
Table 1.7 Financial Report for the Island Government of Curaçao, January 1
to October 10, 2010 (in millions NAF)
Projection Actual
Total Revenues 908.9 911.4
Tax revenues
Profit tax 167.4 193.0
Wage tax 382.2 392.9
Income tax 0.7 3.0
Taxes on property 23.2 22.0
Taxes on goods and services, including road tax 57.2 71.5
Other taxes 19.4 11.2
Non-tax revenues 186.1 152.1
Capital revenues 0.8 0.0
Grants 72.0 65.7
Total Expenditures 893.4 879.1
Personnel costs 303.0 295.6
Goods and services 288.0 278.6
Subsidies, including to public companies 38.2 43.5
Transfers 151.1 152.2
Interest payments 105.9 102.4
Capital expenditures 6.9 6.9
Operational Balance 15.5 32.3
Source: Ministry of Finance
Debt positionDuring the preparations towards getting the new constitutional status,
it was agreed between the government of the former Netherlands
Antilles and the Netherlands that the country of the Netherlands
Antilles (including the individual islands) would receive debt relief. This
debt relief is a partial debt forgiveness combined with a slowing down
of debt accumulation. The Netherlands took over an amount of
outstanding loans and future accumulation of debt has been restricted
by the Cft.
42
Chapter 1: M
acroec
onomic Developm
ents
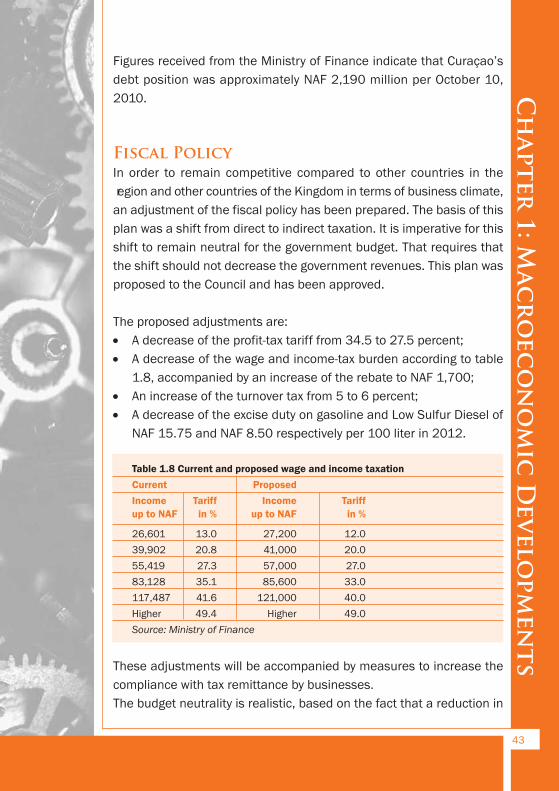
Figures received from the Ministry of Finance indicate that Curaçao’s
debt position was approximately NAF 2,190 million per October 10,
2010.
Fiscal PolicyIn order to remain competitive compared to other countries in the
region and other countries of the Kingdom in terms of business climate,
an adjustment of the fiscal policy has been prepared. The basis of this
plan was a shift from direct to indirect taxation. It is imperative for this
shift to remain neutral for the government budget. That requires that
the shift should not decrease the government revenues. This plan was
proposed to the Council and has been approved.
The proposed adjustments are:
· A decrease of the profit-tax tariff from 34.5 to 27.5 percent;
· A decrease of the wage and income-tax burden according to table
1.8, accompanied by an increase of the rebate to NAF 1,700;
· An increase of the turnover tax from 5 to 6 percent;
· A decrease of the excise duty on gasoline and Low Sulfur Diesel of
NAF 15.75 and NAF 8.50 respectively per 100 liter in 2012.
Table 1.8 Current and proposed wage and income taxation
Current Proposed
Income Tariff Income Tariff
up to NAF in % up to NAF in %
26,601 13.0 27,200 12.0
39,902 20.8 41,000 20.0
55,419 27.3 57,000 27.0
83,128 35.1 85,600 33.0
117,487 41.6 121,000 40.0
Higher 49.4 Higher 49.0
Source: Ministry of Finance
These adjustments will be accompanied by measures to increase the
compliance with tax remittance by businesses.
The budget neutrality is realistic, based on the fact that a reduction in
43
Chapter
1: Mac
roec
onomic Develo
pmen
ts
profit and income tax will lead to increased expenditures by households
and businesses while the increased turnover tax will mitigate the spen d-
ing pattern. Based on calculations made by the Ministry of Economic
Development, the proposed fiscal policy will have a positive economic
effect.
44
Chapter 1: M
acroec
onomic Developm
ents
1.5 Monetary Developments in Curaçao
Introduction8
The new constitutional relations within the Dutch Kingdom became
effective on October 10, 2010. In this respect, the Netherlands Antilles
was dismantled and the islands that were parts of this constitutional struc-
ture obtained a new status. Curaçao and St. Maarten became auton-
omous countries within the Dutch Kingdom while Bonaire, St. Eustatius
and Saba opted for direct ties with the Netherlands.
The new constitutional setting had its effects on the monetary policy
framework. As of October 10, 2010, Curaçao and St. Maarten formed
a monetary union with a common currency and a common central
bank. The common central bank is the Central Bank of Curaçao and
St. Maarten, which is the legal successor of the former Central Bank of
the Netherlands Antilles. For the time being, the Netherlands Antilles
guilder will remain legal tender in both Curaçao and St. Maarten.
A monetary union with one common currency and one central bank
requires a synchronized monetary policy and budget policy, sound
finances and uniform legislation. Therefore, close policy coordination
between Curaçao and St. Maarten is a precondition for the monetary
union between Curaçao and St. Maarten.
The main objectives of the new monetary authority, the Central Bank
of Curaçao and St. Maarten, are:
· to promote a stable external value of the legal currency of Curaçao
and St. Maarten;
· to promote a sound financial system in Curaçao and St. Maarten;
and
· to promote safe and efficient money transfer in the monetary union.
45
Chapter
1: Mac
roec
onomic Develo
pmen
ts
8 Source: Press Release 2010-010, Central Bank of Curaçao and St. Maarten, 2010
To realize the abovementioned objectives, the Central Bank of Curaçao
and St. Maarten (hereafter: the Central bank) is in charge of among
other things:
· safeguarding the soundness of the financial system;
· managing the foreign exchange reserves;
· formulating and implementing the monetary policy;
and advising the government on financial and economic matters.
Monetary developments in 20109
Monetary policyThe objective of the monetary policy is to safeguard the stability of the
external value of the Netherlands Antilles guilder at a fixed exchange
rate of NAF 1.79 for 1 USD. To preserve the confidence in the exchange
rate, the Central Bank aims at maintaining a level of official reserves
(excluding gold) worth three months of merchandise imports. Conse-
quently, the developments in the aggregate money supply, the private
credit extension and the foreign asset position of all commercial banks
are the most important indicators for the Central Bank in considering
policy adjustments.
The Central Bank’s most important instruments to conduct monetary
policy are the reserve requirement on the domestic liabilities, combined
with a bi-weekly tender system of Certificates of Deposit (CDs) and the
requirement of a positive Net Foreign Assets position of all commercial
banks. These monetary instruments influence the domestic money
market.
In 2010, the Central Bank conducted a passive monetary policy as a
consequence of the extra liquidity in the domestic money market and
a slowdown in economic activities in that year. The surplus of liquidity
in the domestic money market during 2010 was mainly attributed to
the inflow of debt relief funds by the Dutch government and the risk
46
Chapter 1: M
acroec
onomic Developm
ents
9 Source: Quarterly Bulletin, Central Bank of Curaçao and St. Maarten, 2010
aversion of investors10. Under normal conditions, a surplus of liquidity
in the domestic money market will lead to excessive credit expansion
by commercial banks. However, the slowdown in economic activities
impeded an excessive credit expansion by the commercial banks. Con-
sequently, the official reserves exceeded the adequate level and the
domestic credit expansion remained at an adequate level.
Based on the abovementioned developments in the domestic money
market, the Central Bank deployed only one of the monetary instru-
ments, in this case the reserve requirement combined with a bi-weekly
tender system of CDs. During 2010, the Central Bank lowered the per-
centage of the reserve requirement by 2.5 percent, reaching a percent-
age of 7.75 percent in December 2010. In addition, the Central Bank
offered only the amount of maturing CDs at the biweekly auctions, im-
plying that no extra CDs were offered in 2010.
Monetary indicators11
The aggregate money supply decreased by NAF 241.7 million (3.2%) in
2010. This was attributable to a substantial drop in net domestic assets
(36.2%) mitigated by an increase in net foreign assets.
The significant decline in net domestic assets can be ascribed to the
decrease in the domestic assets (debt) of the government as a conse-
quence of the implementation of the debt relief program, through which
the Dutch government acquired the outstanding government paper of
the former central government.
Net foreign assets12 improved by NAF 582.6 million (18.0%) in 2010 as
a result of the increase in the official reserves. The increase in the
official reserves was mostly due to the transfer of dividend tax by the
Netherlands related to the Kingdom tax arrangement (BRK).
47
Chapter
1: Mac
roec
onomic Develo
pmen
ts
10 Investors prefer to keep their funds domestically as a result of the risks of international securities
markets.11 Due to the constitutional changes per October 10, 2010, the figures of the last quarter of 2010 do
not lend themselves to a comparison with the figures of the previous year. Therefore, the figures
of the last quarter have been excluded from the comparison with the figures of year 2009.12 The net foreign assets comprise the official reserves and the commercial banks’ net foreign as-
sets.
This dividend tax is from subsidiaries of Dutch companies on the island.
The central bank’s net foreign assets increased by 21 percent and the
net foreign assets of commercial banks increased by 11.5 percent.
Developments in domestic interest ratesThe Official lending rate of the Central Bank remained unchanged
at 1.00 percent in 2010. During 2010, interest rates related to the
treasury papers and government bonds increased slightly.
The interest rates of the domestic commercial banks, with the exception
of the average interest rate on current-account overdrafts, declined
further during 2010. The average interest rate on mortgages dropped
to 6.69 percent. In addition, the average interest rate on passbook
savings and 12- month time deposit declined to 1.11 and 1.65 percent
respectively.
OutlookThe Central Bank’s monetary policy will remain directed at the promo-
tion of a stable external value of the Netherlands Antilles guilder. In this
regard, the monetary policy will also be a common policy supported by
Curaçao and St. Maarten.
In the first half of 2011, for instance, the Central Bank saw a strong
decrease in foreign reserves. Despite this decrease, the reserves
remained well above the norm of at least three months’ worth of
imports. However, to prevent further decreases to dangerous levels that
could put pressure on the Netherlands Antilles guilder, the Central Bank
increased the reserve requirement for commercial banks from 7.75 to
9.75 percent.
48
Chapter 1: M
acroec
onomic Developm
ents
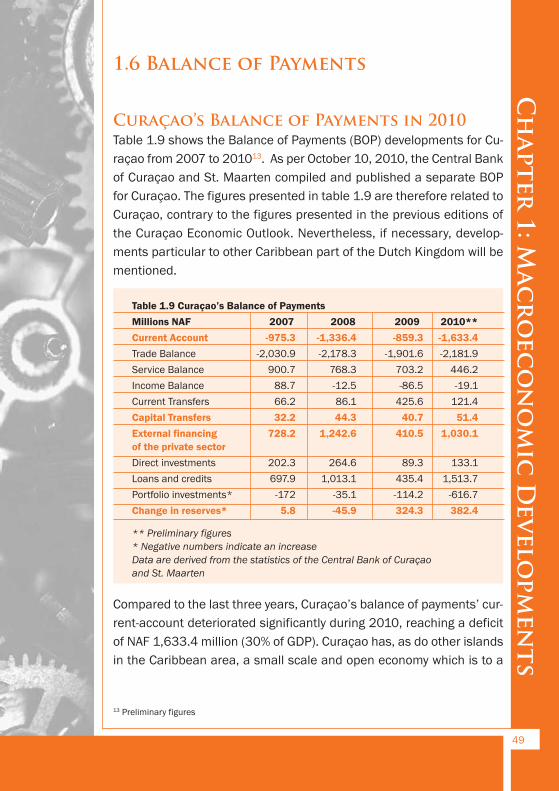
1.6 Balance of Payments
Curaçao’s Balance of Payments in 2010Table 1.9 shows the Balance of Payments (BOP) developments for Cu-
raçao from 2007 to 201013. As per October 10, 2010, the Central Bank
of Curaçao and St. Maarten compiled and published a separate BOP
for Curaçao. The figures presented in table 1.9 are therefore related to
Curaçao, contrary to the figures presented in the previous editions of
the Curaçao Economic Outlook. Nevertheless, if necessary, develop-
ments particular to other Caribbean part of the Dutch Kingdom will be
mentioned.
Table 1.9 Curaçao’s Balance of Payments
Millions NAF 2007 2008 2009 2010**
Current Account -975.3 -1,336.4 -859.3 -1,633.4
Trade Balance -2,030.9 -2,178.3 -1,901.6 -2,181.9
Service Balance 900.7 768.3 703.2 446.2
Income Balance 88.7 -12.5 -86.5 -19.1
Current Transfers 66.2 86.1 425.6 121.4
Capital Transfers 32.2 44.3 40.7 51.4
External financing 728.2 1,242.6 410.5 1,030.1
of the private sector
Direct investments 202.3 264.6 89.3 133.1
Loans and credits 697.9 1,013.1 435.4 1,513.7
Portfolio investments* -172 -35.1 -114.2 -616.7
Change in reserves* 5.8 -45.9 324.3 382.4
** Preliminary figures
* Negative numbers indicate an increase
Data are derived from the statistics of the Central Bank of Curaçao
and St. Maarten
Compared to the last three years, Curaçao’s balance of payments’ cur-
rent-account deteriorated significantly during 2010, reaching a deficit
of NAF 1,633.4 million (30% of GDP). Curaçao has, as do other islands
in the Caribbean area, a small scale and open economy which is to a
49
Chapter
1: Mac
roec
onomic Develo
pmen
ts
13 Preliminary figures
large extent dependent on imported goods, which is generally reflected
in a deficit in the current account balance.
The current account’s deterioration was due mainly to the worsening
of the trade balance, service balance and lower current transfers re-
ceived from abroad. According to the developments on the current ac-
count, the capital and financial account worsened in 2010.
Current accountDevelopments in the trade and service balance will usually determine
developments in the current account. These are basically the main com-
ponents and have a significant effect on the current account. In con-
trast with the traditional surplus on the service balance, the trade
balance of Curaçao has been deteriorating continuously due to increas-
ing imports over exports. Compared to 2007, the trade balance deficit
expanded reaching 40 percent of the GDP in 2010.
Both the import and export of merchandise grew slightly in 2010 com-
pared to 2009. The higher import is related to higher commodities im-
port bills, surging demand for imported goods driven by tourism
spending, increased domestic spending and imports from e-zone com-
panies to stock up inventory. In 2010, the import of goods was valued
at NAF 3,404.6 million, up 10 percent from NAF 3,109.8 million in
2009. The higher export of goods can be ascribed to, among other
things, higher income received from bunkering activities at the airport.
Compared to 2009, the service balance earnings received from the ex-
port of services shrank by 10 percent in 2010, mainly as a conse-
quence of the 56-percent decline in the refining fee. The lower refining
fee was a result of the shutdown of the Isla refinery due to power fail-
ures at the Build Own and Operate (BOO) power plant from March 2010
up to December. Contrary to the decline in the refining fee, revenues
from the tourism sector rose slightly (7%) in 2010 compared to 2009.
While overall stay-over arrivals declined by 6.8 percent, stay-over nights
grew by 5 percent reflecting the higher average spending in 2010 com-
pared to 2009.
50
Chapter 1: M
acroec
onomic Developm
ents
Furthermore, the income balance improved slightly in contrast to the cur-
rent transfers balance, which deteriorated by more than NAF 300 million
due to less debt relief grants transferred by the Dutch government.
Capital and Financial AccountIn 2010, capital transfer increased by NAF 10.7 million. This increase
is related to an increased capital inflow received from Dutch govern-
ment development aid.
The deterioration of the current account deficit in 2010 as compared
to the year before resulted in a drop in the net foreign wealth of the pri-
vate sector. The change in the financing of the private sector was due to
a deterioration of the direct investments balance (NAF 133.1 million) and
the loans and credits balance (NAF 1,513.7 million), partially mitigated by
the improvement in the portfolio investment balance (NAF 616.7 million,
see table 1.9). The worsening of the direct investment balance is due to
increased foreign direct investments in Curaçao. Regarding the loans and
credits balance, the net trade credit balance worsened because trade
credits received on imports exceeded repayments on trade credits.
Foreign Currency Reserve in 2010Deterioration of the current account resulted in a decline of NAF 433.1
million in net foreign assets held by the commercial banks, which was
offset by NAF 50.7 million in net foreign assets held by the central bank.
Balance of Payments in 2011For 2011, it is expected that the current account deficit will stay at
approximately the same level as in 2010. The expected slower
economic activities, in the construction sector for instance, is expected
to partially offset the higher import expenses, reflecting both fluctuating
commodities prices on the international market as well as the increase
in the volume of imported goods related to the expected growth in
tourism14 and private spending.
51
Chapter
1: Mac
roec
onomic Develo
pmen
ts
14 In the first quarter of 2011 stay over arrivals to Curaçao grew by 16 percent compared to the same
period in 2010.
Furthermore, the service balance surplus is expected to grow slightly
as a result of the expected growth of the export of services and the con-
tinuation of the activities of the Isla Refinery.
Regarding exports of goods, a small decrease in volume is expected,
driven by lower demand due to the expected economic performance of
the main trading partners.
Furthermore, capital inflow related to Dutch development aid funds is
expected, resulting partially in upward pressure on the foreign reserves.
Considering the investments in the tourism sector (Tourism Master Plan
2010-2014), the direct investment balance is expected to worsen in
2011. The loans and credits balance is expected to worsen in 2011
due to, among other things, a decline in net trade credits.
Sources:
Quarterly Bulletin 2010-III, Bank of Curaçao and St. Maarten
Statistical tables, Balance of Payments Curaçao, Bank of Curaçao and
St. Maarten
Strategic Tourism Master plan for the Island of Curaçao 2010 – 2014,
December 2009
Historic Overview, Stay-over Arrivals, Curaçao Tourist Board, July 2011
Overview , Visitor Nights Overview, Curaçao Tourist Board, July 2011
52
Chapter 1: M
acroec
onomic Developm
ents
1.7 SEI Program
IntroductionThe long-term objective of the Social Economic Initiative (SEI) program
is to provide Curaçao with a sustainably improved social and economic
perspective by creating:
· A sound government finance;
· A reformed economic structure;
· A reorganized public administration;
· An investment program; and
· A social safety net.
After a slow start in drafting and submitting financial proposals by
project owners in 2008, a sharp increase was seen in 2009 and 2010,
in proposals being submitted to USONA for review, approval and signing
of the financial agreements. Very ambitious goals were set at the start
of this process, as the government believed that it was possible to have
all the project proposals drafted and submitted to USONA by November
2009. Later this target date was extended to June 2010 and more pro-
longations followed. During this period, some critics identified some
serious hurdles in reaching this ambitious goal, e.g. capacity issues,
different priorities and limited number of contractors for the infrastruc-
tural projects.
In the final report on the progress of the SEI projects for 2010, USONA
was positive with regard to the number of project proposals being
signed into financial agreements. The execution of the SEI program
reached its peak during the last quarter of 2010, particularly in Decem-
ber, as December 31 was set as deadline to commit to the budget by
awarding the project to a consultancy firm/contractor for execution. The
result was an approval of 97 percent of the SEI fund in projects.
In the annual consultation round held at the end of 2010, it was decided
that an addendum would be attached to the proposal of May 23, 2008
53
Chapter
1: Mac
roec
onomic Develo
pmen
ts
that expired on December 31, 2010. This consultation round resulted
in an agreement in January 2011 between the government of Curaçao
and the Dutch government to guarantee spending of the total budget
and a new deadline to commit the projects. Three objectives were
agreed on:
1. All development aid will be terminated by 2012.
2. Projects and reforms important to reach SEI objectives that had en-
countered delays will be addressed with high priority
3. The future of the oil refinery must be analyzed in accordance with
an agreed planning.
The new deadline to commit all resources for the pending projects had
been set on September 30, 2011. The expected result was that all pro-
jects on the Ministry of Economic Development’s list would be commit-
ted. Reaching this goal is very important to avoid underspending of the
SEI funds.
The following section gives an overview of the status of selected
projects submitted to USONA by the former Island Territory of Curaçao,
now the government of Curaçao. The focus will be on economic and in-
frastructural projects.
Status of selected economic and infrastructural SEI projects15During the period of 2008 to 2010, there were a total of 110 projects for
which an agreement has been signed between the government of Cu-
raçao and the government of the Netherlands through USONA. Of these
110 projects, 33 belong to the economic sector of the government. The
remaining projects belong to the educational and social sector.
The contribution of the Dutch government to these 110 projects has
been estimated at NAF 121 million. A total of 85 projects have been
committed by USONA, for an amount of NAF 118.5 million.
The government of Curaçao contributes with NAF 68,664,831 to 13
54
Chapter 1: M
acroec
onomic Developm
ents
15 Source: PMU Progress Report, March 2011; USONA Progress Report, December 2010.
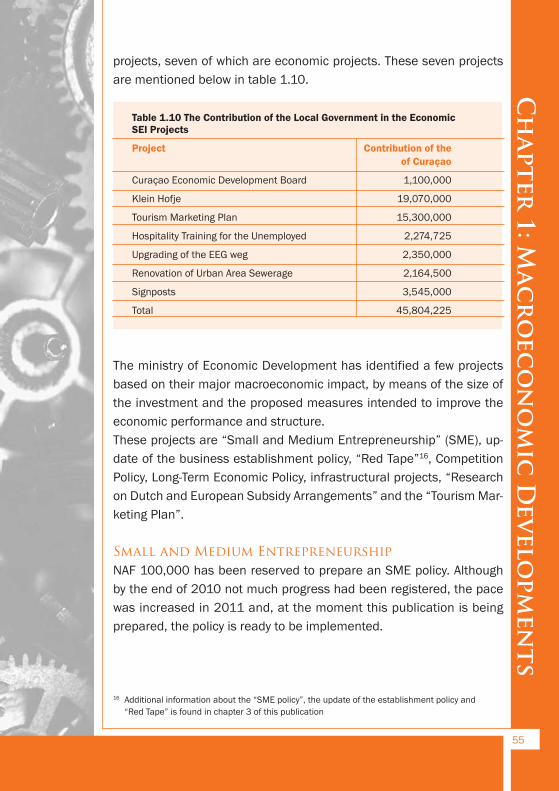
projects, seven of which are economic projects. These seven projects
are mentioned below in table 1.10.
Table 1.10 The Contribution of the Local Government in the Economic
SEI Projects
Project Contribution of the
of Curaçao
Curaçao Economic Development Board 1,100,000
Klein Hofje 19,070,000
Tourism Marketing Plan 15,300,000
Hospitality Training for the Unemployed 2,274,725
Upgrading of the EEG weg 2,350,000
Renovation of Urban Area Sewerage 2,164,500
Signposts 3,545,000
Total 45,804,225
The ministry of Economic Development has identified a few projects
based on their major macroeconomic impact, by means of the size of
the investment and the proposed measures intended to improve the
economic performance and structure.
These projects are “Small and Medium Entrepreneurship” (SME), up-
date of the business establishment policy, “Red Tape”16, Competition
Policy, Long-Term Economic Policy, infrastructural projects, “Research
on Dutch and European Subsidy Arrangements” and the “Tourism Mar-
keting Plan”.
Small and Medium EntrepreneurshipNAF 100,000 has been reserved to prepare an SME policy. Although
by the end of 2010 not much progress had been registered, the pace
was increased in 2011 and, at the moment this publication is being
prepared, the policy is ready to be implemented.
55
Chapter
1: Mac
roec
onomic Develo
pmen
ts
16 Additional information about the “SME policy”, the update of the establishment policy and
“Red Tape” is found in chapter 3 of this publication
Update of the business establishment policyAn amount of NAF 150,000 has been reserved for this project. The
policy is being prepared in order for the implementation to start by
January 2012. Considering the importance of this policy for the island,
the project is being closely monitored by USONA.
Red TapeAn amount of NAF 90,000 has been reserved for this project. Up to
December 31, 2010, this amount had not been drawn on. The financial
agreement with USONA was signed in March 2011, and at the moment
of preparing this publication the project has been committed and
tendered and ready to be executed.
Competition PolicyAlthough the budgeted amount of NAF 750,000 had not been touched
yet by the end of 2010, the project is in full execution and in its last
phase. It is expected that the policy will be ready by the beginning of
2012. This project also gets extra attention from USONA, considering
the expected impact.
Long-term Economic PolicyAn amount of NAF 1,000,000 has been reserved for the preparation of
a long-term economic policy. Because of the delay in the preparations,
this project is being intensively monitored by USONA. The execution of
the project has been entrusted to the Ministry of General Affairs. At the
time of this writing, the project is about to be committed.
Infrastructural ProjectsThe selected projects are “Weg naar Fuik” (the Road to Fuik), “Weg naar
Rondeklip” (the Road to Rondeklip), Caracasbaaiweg, signposts,
upgrading of the EEG weg, improvement of the Rif area, renovation of
the sewage system in the urban area and Piscadera. Several of these
infrastructural projects have been undergoing scrutiny due to proce-
dural errors that were detected.
56
Chapter 1: M
acroec
onomic Developm
ents
All these bottlenecks that had to be addressed contributed to delays in
execution, which, for a number of the projects, has started in 2011.
Research on Dutch and European subsidy arrangementsThe development aid to Curaçao from the Netherlands is running down
and it is unclear whether there will be any sequel to the 10th European
Development Fund. The government of Curaçao wants to search for
other subsidy arrangements for public and private initiatives on the
island. An amount of NAF 150,000 has been reserved for research on
subsidy-fund options. Phase one, which is the research phase, will be
finished by the beginning of December 2011. The results of the
research phase will determine the course of phase two.
Tourism Marketing PlanAn amount of NAF 24,300,000 was earmarked for the Tourism Market-
ing Plan. The marketing plan was completed in July of 2010.
New Agreements After 2010An agreement had been signed between the governments of the
Netherlands and Curaçao with the following focal points:
· All pending projects, including three economic projects, had to be
committed/awarded to a contractor by September 30, 2011 at the
latest.
· In the new government departments, project coordinators were
assigned to guaranty that progress/sense of urgency is maintained.
Red flags were raised for projects that would need extra project/
process management.
· A Program Mandate Unit was established with a far-reaching man-
date to give direct instructions to project owners with regard to the
execution of the projects.
At the moment, negotiations are being prepared for another deadline to
commit projects, because some projects have not been committed yet.
57
Chapter
1: Mac
roec
onomic Develo
pmen
ts
2.1 PRODUCTION SECTORS
2.1.1. Agriculture, Livestock andFisheries
Introduction The Agriculture, Livestock and Fisheries sector’s contribution to the
GDP is small.
Compared to previous years, the figures do not show many new devel-
opments. Approximately 92 percent of food products in Curaçao is im-
ported, while the rest, like cucumbers, sweet potatoes, bell peppers,
pumpkin, West-Indian gherkin and okra, is produced domestically. The
main reason for this high level of imports is that the climate does not
allow for favorable production factors without high production costs (e.g.
high price for water and electricity). Local producers can therefore
barely make a significant profit in this sector.
International Developments and TrendsMost of the fruit and vegetable imports come from the US. In 2010,
that country faced a relatively bad crop season because of the long win-
ter. This development had a negative impact on a large section of the
export-ready food supply, which led to higher prices. Moreover, in-
creases in food prices are a global trend that has been discussed ex-
tensively by the UN, among others.
The FAO’s food index, a measure of food prices, averaged 232 points
in May—37 percent above its level the same time a year earlier. While
the index was down slightly from a revised figure of 235 points in April,
it was still only six points off the record hit in February17.
Since the last quarter of 2010, international developments have played
a big role in the Food Price Index; not only the weather and climate but
58
Chapter 2: Secto
ral Developm
ents
17 Source: Food and Agriculture Organization of the United Nations: www.fao.org
also oil prices, due to the unrest in North Africa, have been impacting
global food prices negatively.
Bad crops also led to cost increases for livestock farmers. The prices
for meat and dairy products suffer from the same impact mentioned
above. The FAO also mentions that pork and poultry prices are rising
steadily to an all-time high due to an imbalance between supply and
demand. An increase in supply takes 2 to 3 years, so the upward trend
in prices should be expected to continue for the coming years.
The global overfishing trend continues to be a big problem for the food
security sector. The EU has set quotas for fishing vessels, but progress
is slow and the EU is not receiving accurate data from the member
states. This makes it difficult to describe the situation accurately.
According to EU fisheries Chief Maria Damanaki18, there could be a well-
enforced system in place by 2015, if all member states cooperate.
Regionally (the Caribbean), there is an added threat to the waters: the
lionfish population has exploded since the first ones were spotted in
2009 off the coast of the US. The lionfish is not native to the Atlantic
and the Caribbean Sea and has no natural enemies. As a result, young
coral fish do not stand a chance against the lionfish. If no action is
taken, the islands in the Caribbean will suffer economically from an
explosion of the lionfish population, both directly—no fish left over for
fishermen—and indirectly, since coral reefs will be affected negatively
and the clear blue Caribbean waters will turn foggy from the dead coral,
which will have a huge impact on tourism.
Development in CuraçaoIn the second half of 2010 and the first quarter of 2011, Curaçao was
confronted with an abnormally high level of rainfall. This brought about
75 percent of the local agricultural sector to its knees. The most com-
mon fruits and vegetables grown on the island were not available
59
Chapter
2: Secto
ral D
evelo
pmen
ts
18 Interview Business Week May 25, 2011, there could be a well-enforced system in place by 2015,
if all member states cooperate.

anymore and needed to be imported, which usually means higher
prices. This continued into 2011 up until March. The rainfall gave a
chance to other, lately less common, crops (e.g. soursop, caju) to flour-
ish, but not in enough quantities to be sold to the public. Moreover,
most of these were grown in private household yards.
The lessons learned from 2010 are carried into 2011, so farmers are
better prepared for unusual weather conditions.
There are several private initiatives to grow crops in greenhouses to com-
bat the high prices of imported fruits and vegetables. These initiatives are
still in their pilot phases, so it is difficult to predict their success. If these
projects do turn out to be successful, the number of greenhouses will have
to be increased and strategically placed throughout the island. It will take
a couple of years to measure the success rate.
The Ministry of Public Health, Environment and Nature is also working
on a number of policies to decrease overproduction of certain products,
like bell peppers, and work on a more varied supply. There are also pro-
posals to lower taxes on imported fruits and vegetables and raise taxes
on less healthy products. This is more from a healthcare point of view,
but is expected to have a positive long-term effect on economic devel-
opment.
The very small livestock sector did not experience many developments
in 2010 compared to 2009. One significant change which could have
an impact on public health was in the procedure for slaughtering. The
new procedure might make it less attractive for farmers/individuals to
have a professional handle the slaughtering in a clean and sterile envi-
ronment. The Ministry of Public Health, the Environment and Nature is
trying to adjust the procedures so that public health will not be affected.
The local fish industry has been suffering from over-fishing for years
now, and the rapid growth of the lionfish population makes the situation
even worse. The Ministry of Public Health, Environment and Nature had
a number of special harpoons made so volunteers (mostly professional
divers) can hunt this predator down.
60
Chapter 2: Secto
ral Developm
ents
The Ministry is also working on policies to designate certain areas as
”no fishing zones” around the island in an effort to combat over-fishing
and also to try to attract back the grouper, which is the only known fish
that preys on the lionfish. There have also been private initiatives to
hunt the lionfish on a daily basis.
The former Agriculture, Livestock and Fisheries department imple-
mented a ban on certain fish traps and fishing techniques. The fishing
of the ‘mustang’ is also illegal without a permit. This is a measure to
control the population and prevent (regional) extinction. It is safe to say
that more measures will be taken to protect the waters around Curaçao
against both man and nature.
With regard to the high production costs, studies are being undertaken
on the possibility of using cold-water pipes in agriculture. The cold water
going through the pipe generates moisture around it, providing the soil
with the necessary humidity for agriculture. The quantity, quality and
variety of local agricultural products could improve by using this tech-
nique.
61
Chapter
2: Secto
ral D
evelo
pmen
ts
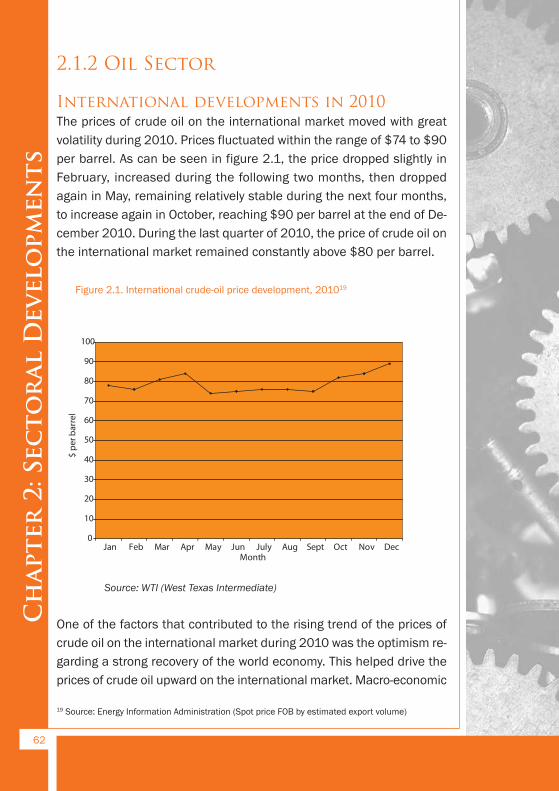
2.1.2 Oil Sector
International developments in 2010The prices of crude oil on the international market moved with great
volatility during 2010. Prices fluctuated within the range of $74 to $90
per barrel. As can be seen in figure 2.1, the price dropped slightly in
February, increased during the following two months, then dropped
again in May, remaining relatively stable during the next four months,
to increase again in October, reaching $90 per barrel at the end of De-
cember 2010. During the last quarter of 2010, the price of crude oil on
the international market remained constantly above $80 per barrel.
Figure 2.1. International crude-oil price development, 201019
Source: WTI (West Texas Intermediate)
One of the factors that contributed to the rising trend of the prices of
crude oil on the international market during 2010 was the optimism re-
garding a strong recovery of the world economy. This helped drive the
prices of crude oil upward on the international market. Macro-economic
62
Chapter 2: Secto
ral Developm
ents
19 Source: Energy Information Administration (Spot price FOB by estimated export volume)
0
10
20
30
40
50
60
70
80
90
100
Jan Feb Mar Apr May Jun July Aug Sept Oct Nov Dec Month
$ pe
r bar
rel
growth indicators from China and India were fabulous, whereas growth
rates for the Euro-zone and the USA were respectively disappointing
and fragile. The Energy Information Administration (EIA) stated20 that
China has overtaken the US as the largest consumer of energy. Auto-
mobile sales in China surpassed the world’s biggest auto market, the
US, for the first time.
Furthermore, due to the escalating debt crisis in the Euro-zone, several
investors sought refuge in the oil and financial markets, driving up oil
prices. Investors and economists feared that Greece’s public-finance
problems would spill over to Spain, Portugal and Germany.
Moreover, the escalating political tensions in Iran, Nigeria and Iraq, com-
bined with fears concerning oil disruptions, pushed the prices of crude oil
and distillates upward.
Also the fact that many countries of the Northern Hemisphere experi-
enced exceptionally cold weather during January and February 2010,
leading to a high demand for crude oil during the winter period, helped
drive up the prices during these months. However, according to the Or-
ganization of Petroleum Exporting Countries (OPEC), the inventories of
crude oil and distillates were sufficient to deal with the winter demand.
OPEC assures that the high oil prices on the international market should
be attributed to speculation. Analysis from Nymex figures21 indicates
that the number of oil speculators has risen in recent years. Oil in-
vestors were optimistic, believing that crude oil would get more expen-
sive during 2010. Consequently, the price of crude oil on the
inter national market was influenced by the oil speculators.
The world was shocked by the Deepwater Horizon spill in the Gulf of
Mexico, which could be categorized as an ecological disaster. As known,
the Deepwater Horizon spill will have a long-lasting impact on the envi-
ronment, as water, marine fauna and wildlife have been contaminated.
The Deepwater Horizon event can without any doubt be considered the
worst offshore spill in US history. Despite this, it had little direct impact
on the world oil market22.
63
Chapter
2: Secto
ral D
evelo
pmen
ts
20 July 201021 Source: http://www.cba.ca/news/business/story/201022 Source: http:// June 18, 2010
International developments in 2011Both EIA and OPEC were optimistic about the recovery of the world
economy in 2011. Both organizations were convinced that in 2011 the
world economy would show a slightly positive growth but were uncertain
about the pace of the world’s economic recovery. Several economists
anticipated that in 2011 the OECD economies would have face the
dilemma of introducing austerity measures in most of the economies
at a time of continued low growth23 , while the government of developing
countries such as China, India and Brazil would probably have taken
actions to avoid overheating of their economies.
According to EIA24 , the demand for crude oil and distillates in the near
future will increase and consequently push up prices on the interna-
tional market.
In 2011, the price for crude oil fluctuated within the range of $85 to $110
per barrel. The price continued to increase, reaching $110 in April,
dropped to $86 in October to increase to $97 a barrel in November25.
The Curaçao refinery in 2010The oil sector can be considered as an important pillar of the local
economy. There are approximately 1000 people directly employed at the
oil refinery. Besides these, there are between 300 and 500 jobs created
through maintenance work done by private contractors. The harbor and
the refinery are, furthermore, interrelated. So a shutdown of the oil refinery
implies little activity or income for the harbor. Moreover, the Isla Refinery’s
contribution to GDP was estimated at approximately 8.5 percent over the
period of 2006 to 200926 and the government receives almost NAF 400
million per year in fixed income from refinery fees.
The Isla refinery, owned by the Refineria di Korosu (RdK), has a maxi-
mum production capacity of 320,000 barrels per day. The refinery is
able to process a variety of crudes ranging form light to heavy and from
various sources.
64
Chapter 2: Secto
ral Developm
ents
23 Source: OPEC Monthly Oil Report December 201024 Energy Information Administration25 Source: http://www.economagic.com/em-cgi/data.exe/var/west-texas-crude-long26 Source: Ministry of Economic Development (MEO),

The oil refinery is being operated by Petroleos de Venezuela (PdVSA)
on a lease contract between PdVSA and RdK that expires in 2019.
Environmental activists are currently putting tremendous pressure on
the Isla refinery to operate in conformance with the environmental
nuisance permit. Because of this, there is currently some uncertainty
regarding the refinery’s future. The ‘Schoon Milieu Op Curaçao’ (SMOC)
foundation strives to achieve a reduction in the pollution caused by the
Isla refinery and supports the idea to shut it down if the aforementioned
cannot be attained. On the other hand, some other organizations and
individuals are convinced of the added value of the Isla refinery to the
local economy and that efforts should be made to maintain the
refinery’s operations. Another option being considered is to move the
Isla refinery to another location on the island. The government has
appointed an international agency to map the future vision of the Isla
refinery.
The Build Own and Operate (BOO) energy plant was built in 2003 and its
primary aim was to produce electricity, steam, desalinated water and com-
pressed air for the Isla refinery and Aqualectra. The Isla refinery’s opera-
tions are fully dependent on the energy supplied by the BOO.
Unfortunately, due to malfunctions of equipment such as air compressors,
gas turbines and steam boilers, Curaçao Utilities Company, which
manages the BOO plant, has failed to supply the refinery with the
necessary level of utilities. This led to several outages at the refinery and
has hampered the refinery from reaching it desired production level.
The BOO’s malfunctioning is due to poor and untimely maintenance of
the equipment. In order to solve this problem, there is an urgent need
to invest in the BOO. Moreover, special attention should be given to the
timing and the sum needed to invest in the BOO to guarantee the oil
refinery’s operation.
The oil refinery restarted its operations in mid December 2010, and its
operating loss has been estimated at almost NAF 300 million27.
To meet the demand of both the local and foreign markets, the Isla
refinery was forced to import oil derivatives28 from abroad.
65
Chapter
2: Secto
ral D
evelo
pmen
ts
27 Source: http://www.zakelijkcuracao.com: Strubbelingen bij weer opstarten van Isla raffinaderij 01-01-2011
28 Mogas 95, jet fuel, LPG-20 and LPG-100
At the moment of this writing, the official figures concerning the
imported and exported oil derivates have not yet been audited.
Developments in 20112011 is an interesting year for the oil refinery. The Isla Refinery is under
immense pressure at the moment due to the need for significant
investments to upgrade, maintain and replace installations, to be able to
deliver products that meet the more stringent specifications in the
marketplace and at the same time compete adequately with oil refineries
in the region and the American Gulf Coast. As mentioned earlier, environ-
mental pressure is mounting on the refinery to reduce its emissions to
levels in accordance with the nuisance permit.
Distribution (Curoil N.V.) in 2010Curoil N.V. is a 100 percent state-owned enterprise and the sole
distributor of oil products on Curaçao and Bonaire, including oil
products for the Aqualectra and Ecopower production units. For strate-
gic reasons, Curoil operates four gas stations. Currently, Curoil N.V. is
largely dependent on the local oil refinery, which is the main supplier
of oil products for Curoil N.V.
Curoil’s fuel distribution consists of two main market segments, namely
the local market (including Bonaire) and the international market. The
local market consists of fuel supply for local transportation, commercial
users and utilities. The international market consists mainly of aviation
and (on- and offshore) bunkering.
With regard to the aviation market, jet fuel is sold mainly to commercial
airplanes that visit our island. However, there are some airlines making
technical stops for refueling. By the end of 2009, Valero terminated its
operation in Bonaire. At that point, Curoil N.V. took over its clientele,
which resulted in a significant market-share increase in aviation for
2010. Besides that, the year 2010 was also characterized by the
recruitment of several (cargo) airlines that use Curaçao or Bonaire as
their home or hub port for refueling.
66
Chapter 2: Secto
ral Developm
ents
The results from bunkering activities in 2010 were severely affected by
the 9-month shutdown of the Isla Refinery in 2010. The shutdown of
the refinery resulted in a reduction of vessel traffic in the harbor and
consequently also in a drastic reduction of bunkering sales activities.
By December 2010, the refinery started up again and Curoil N.V.
expects to build up the bunkering business again in the year ahead.
Final sales-volume figures are not available to the public. However, table
2.1 provides an overview of the preliminary sales figures for 2010.
Table 2.1: Overview of Sales Volumes 2010 Compared to 2009
Market change
Local-Curaçao (excl. utilities) -3%
Bonaire (excl. utilities) +10%
Bunkering -24%
Aviation-Curaçao +2%
Aviation Bonaire +136%
Source: Curoil N.V.
Curoil N.V. encountered some financial liquidity problems in 2010, be-
cause the government entity that regulates local fuel prices had not ad-
justed these prices since April of 2010, despite the fact that oil prices had
increased substantially during that year29. Due to the aforementioned cir-
cumstance, 2010 can be considered as a challenging year for Curoil N.V.
According to Curoil N.V., despite the above-mentioned developments
they are still a fierce regional competitor based on:
· Curoil’s reputation as a reliable supplier that consistently delivers
quality oil derivatives;
· Its compliance with international standards (ISO 9001 and ISO-
8217);
· Its diversity of oil products that can be blended to the specific de-
mands of the customers;
· The availability of on- and off-shore services; and
· The fact that it offers all of the above at prices which are competitive
for the region.
67
Chapter
2: Secto
ral D
evelo
pmen
ts
29 Per July 2011, the local fuel prices are being adjusted on a monthly basis.

Curoil’s limited storage capacity makes it still highly dependent on one
sole supplier for the major products, and this is something that can be
considered as a challenge.
It is worth mentioning that Curoil N.V. is working on expanding its storage
capacity by constructing more tanks. Recently, the members of the Board
of Supervisory Directors gave their approval for the continuation of the
construction plans.
Curoil N.V.’s management is aware of the importance of an interna-
tional presence and globalization, and is looking into possibilities to
expand its market share accordingly through strategic alliances with
other players in the international market. Specific actions are being
taken to achieve this objective.
Prospects for the near futureThe expectations for the near future are excellent. Since July 2011, local
fuel prices are being adjusted on a monthly basis. Furthermore, Curoil
has specific plans to:
1) attract more (cargo) planes to choose Curaçao as their home or hub
refueling port;
2) explore new markets for bunkering and aviation;
3) expand into new markets through strategic alliances with other
players in the international market;
4) keep pace with international environmental developments by
opening the first green gas station and introducing biodiesel.
It is, however, worth to say that the above-mentioned plans are contin-
gent on the unobstructed supply of fuel products and the expansion of
Curoil N.V.’s storage capacity, which will enable Curoil to store larger
volumes of oil derivatives and thereby increase sales opportunities.
68
Chapter 2: Secto
ral Developm
ents
2.1.3 Utilities
International DevelopmentsRising oil prices and political turmoil throughout the Middle East, in Egypt,
Syria, Tunisia, Bahrain, Libya and surrounding countries only give rise to
the prospect of significant and sustained instability. This region is home
to two-thirds of the world’s known crude oil reserves30. This Middle-East
crisis has sent tremors through the international energy sector. The civil
unrests in the Middle East continue to push oil prices higher as oil
production is being shutdown, threatening oil export. This has put oil prices
on the march. Both volatility and uncertainty are driving up prices.
Another important international development is the constant and
ongoing discussion about the oil peak. The alarm bells have started
ringing as surveys indicate that, at the present rate of consumption, oil
will become increasingly scarce beyond 2030. Oil explorations are going
on all over the world and there appears to be small pockets of
suspected oil reserves, but representing only a fraction of what is
needed to offset the anticipated shortage—a shortage caused also by
the economic growth in countries like China and India. In addition,
energy statistics show that the approximate oil reserves are Saudi
Arabia with 19.5%, Canada with 13%, Iraq with 9.9%, Iran with 8.3%,
Kuwait, the United Arab Emirates and Russia with 7% each, Venezuela
with 5.6%, Mexico, USA, Norway and Indonesia with 5% each, and
Nigeria, Libya, China, Kazakhstan and Algeria, with 2 percent each31
The quake that, among other things, hit the Fukushima nuclear power
plant in Japan has definitely renewed the debate about the safety of
atomic energy. Fears of a nuclear disaster, explosion and meltdown
have gained importance once again. The emergency situation at
Japan’s nuclear power plant has cast a shadow of doubt on the future
of nuclear power as a source of renewable/clean energy. Many coun-
tries already have, or are busy cancelling the building of new nuclear
power plants.
69
Chapter
2: Secto
ral D
evelo
pmen
ts
30Source: moneymorning31 Source: www.nationmaster.com
This will only put more pressure on the demand for oil, with high prices
as a result.
As the price of oil continues to rise, all sources of unconventional and
synthetic oil and alternative energy (wind, sun and others) become at-
tractive. In China, for example, pollution (CO2) is causing serious health
problems, crop damage and acid rain, all of which are taking a social
and economic toll. China has chosen wind power as an important al-
ternative source in order to rebalance the energy mix, combat global
warming and ensure energy security.
Gas prices have taken off, and were predicted to climb substantially in
2011 because of rising oil prices. The events that unfolded in the Mid-
dle East and North Africa were expected to induce energy users to tran-
sition from crude oil to natural gas.
Local DevelopmentsIn October 2010, a new public administration formed by three political
parties took office. The Prime Minister decided to give priority to, among
other things, the energy sector and energy policy. There were no addi-
tional energy-price adjustments during 2010 after April. International
energy-price developments were not incorporated into local energy
prices.
In February 2011, a new energy policy, prepared by the Bureau
Telecommunicatie & Post (BT&P), was approved by the Council of
Ministers. The goal of this new policy is to bring down the price of energy
and raise the dependability of the energy supply. The government will
also be looking into the possibility of making more use of renewable
energy.
In February of 2011, BT&P, which was already the regulator for the
telecommunication sector, was awarded the additional role of regulator
for the energy sector. The government had been intending to create a
regulator for the energy sector for some years now, and this goal has
finally been realized.
70
Chapter 2: Secto
ral Developm
ents

In February 2011, the government also awarded a concession to two
other companies, Build-Own-Operate (BOO) and NuCapital (wind power
developer), besides Aqualectra NV, for the production of water and elec-
tricity.
Since the operational and financial problems experienced in 2010,
several actions have been taken to improve the reliability of the BOO’s
operation. The process started with the transfer of BOO’s ownership
(stocks) to the government-owned Refineria di Kòrsou, which is the
owner of the refinery. This will open the doors for the government to
make the necessary investments and upgrading in the BOO to be able
to make the switch from the pitch fuel currently used to gas, thus
guaranteeing energy stability for the refinery and Aqualectra.
In March 2011, the Prime Minister reached an understanding with
Trinidad & Tobago by which, in the future, Curaçao could purchase gas
as fuel for its energy production—This in an effort to counterbalance
the rising price of oil and reduce the population’s energy costs.
Aqualectra (Holding) is currently executing a merger between the two
companies under its (holding) management. These companies are the
former KAE (production) and the former Kodela (distribution). This
merger should bring down operational costs, increase efficiency and
make the company more competitive.
71
Chapter
2: Secto
ral D
evelo
pmen
ts
2.1.4 Manufacturing
International developments in 201032
World manufacturing is showing the first signs of recovery from the re-
cent financial crisis, according to the International Yearbook of Indus-
trial Statistics 2011 of the United Nations Industrial Development
Organization (UNIDO). In this publication, UNIDO estimates that the
world manufacturing value added (MVA) grew by 5.3 percent in 2010.
Since 2006, this was the first year in which industrialized countries had
a growth trend for industrial production. The MVA for industrialized
countries grew by 3.4 percent in 2010. However, developing economies
were the major force behind world industrial growth. In 2010, the MVA
of developing countries grew by 9.4 percent. Leading developing
economies such as Brazil, China and India showed strong economic
growth performance in 2010. The MVA of all three countries grew by
more than 10 percent in 2010. Thanks to the high growth rates
achieved by developing countries, their share in world manufacturing
output reached 32 percent, compared to 20 percent 10 years ago.
According to the World Bank Group, global industrial production growth
peaked at 15.6 percent in February 2010 after plunging at annualized
rates of nearly 25 percent in early 2009, then declined moderately in
the first and second quarters, slowing abruptly during the third quarter,
with growth effectively stalling by October 2010. Notwithstanding the
sharp rebound in activity during the first half of 2010, by October 2010,
global industrial production was 1 percent above its pre-crisis levels
(August 2008).
Due to the pre-crisis boom, plants in developing countries were operating
at levels significantly above “trend”. Although developing countries’ indus-
trial production was already decelerating (and moving back to trend), it
was still some 1.5 percent above full capacity in August 2008—just before
the onset of the crisis. At that point, industrial production in high-income
countries was already operating at some 2.6 percent below trend, while
72
Chapter 2: Secto
ral Developm
ents
32 Source: International Yearbook of Industrial Statistics 2011 of UNIDO
overall global production (reflecting the weighted share of developing
and high-income countries’ industrial production) was marginally below
trend. Because of the fact that the financial crisis originated directly in
high-income countries, and because of very strong North-North trade
linkages, industrial production in these economies plunged sharply and
more steeply than in developing countries. The global recovery was to
a large extent driven by the turnaround in China, where output growth
reached 27.2 percent in May 2009. Despite slowing thereafter to more
sustainable rates, by November 2010, Chinese industrial production
was 32.8 percent higher than its August 2008 level and exceeded its
pre-crisis trend levels by 0.5 percent. Output in India followed a similar
pattern, with output exceeding its pre-crisis level by 21.1 percent in
October 2010.
Developments in 2010 in Curaçao33
Although Curaçao’s manufacturing sector consists mainly of small and
medium-sized enterprises, there are at least two big actors: the Isla
refinery (see Oil Refinery) and the ship-repair company. These industries
have an impact on the activities of the small and medium-sized enter-
prises and thus also have the biggest influence on the economic output
in that sector of Curaçao’s economy.
In general, 2010 recorded a drop in the manufacturing sector’s value
added to the GDP of Curaçao. The drop in output of the manufacturing
sector was particularly caused by the prolonged shutdown of the Isla
refinery. But a downturn in man-hours sold in the ship-repair industry
also added to the poor contribution of the manufacturing sector.
With regard to the smaller players on the market, business remained
approximately the same in 2010 compared to 200934 .
The constitutional changes and dismantling process have dominated
the policy agenda for the past couple of years according to the Asso -
ciation of Industrialists of the Netherlands Antilles (ASINA). This affected
the activities of the manufacturing sector. Most enterprises remained
73
Chapter
2: Secto
ral D
evelo
pmen
ts
33 Source: Interviews with ASINA, VBC, ADECK, CURINDE34 Source: Interviews (incl. questionnaire) with a selection of companies
idle concerning their activities and waited for the constitutional changes
to take place before taking any definite decisions on deploying new
activities. ASINA is of the opinion that for the manufacturing sector the
high utility costs are an important obstruction to get out of the slump.
These utility costs contribute to the high local production costs and
therefore decrease the competitiveness of Curaçao’s manufacturing
sector compared to the region.
It is expected that the implementation of the policy plan on utility costs35
will contribute positively to the reduction of the production costs for the
manufacturing sector.
Also the Curaçao Industrial & International Trade Development Com-
pany (CURINDE), which manages, among others, the Business Park
Brievengat, where some manufacturing businesses are established,
has indicated that the activities of Curaçao’s industrial sector have
decreased significantly. Local manufacturing companies are facing
competition from imported products and the high energy costs were
mentioned as a factor that hampers progress.
Outlook for the near futureFor 2011, the interviewed representatives of the industrial sector were
expecting positive results from the initiatives to modernize Curaçao’s
tax structure, turning it into a more competitive one. The tax reform
encompasses a shift from direct to indirect taxes, the introduction of
competitive rates for income and profit taxes, and a simplification of
the system. As mentioned before, the implementation is postponed to
January 2012.
A challenge for the future is the introduction and implementation of the
new policy on energy generation. Some manufacturing companies that
can generate their own energy may benefit by having their production
costs lowered and therefore becoming more competitive.
74
Chapter 2: Secto
ral Developm
ents
35 “Beleidsnota Regulering Elektriciteitsvoorziening Curacao 2011-2015”
2.2. CONSTRUCTION
International developments: US36
and the Netherlands
For the United States economy, 2010 was a year of recovery, but it was
sputtering and many questioned whether the recovery was real and if
it could be sustained.
Even though the economy in the United States is slowly recovering, the
construction sector is still facing difficulties. Especially the residential
construction sector was hit hard, and after years of decline the recovery
is slow.
According to the American Institute of Architects (AIA), US nonresidential
construction activity will fully recover in 2012 after declining further in
2011. The hotel and retail sectors will lead the charge, according to the
AIA. Industrial construction will fall by 11.8 percent in 2011, with
smaller decreases in office, hotel and retail construction. However, the
AIA expects construction spending on healthcare, religious and recre-
ational facilities to improve slightly this year.
The year 2010 has also been tough on the Dutch construction sector
and the outlook for 2011 is even worse, according to CBS figures37.
While the Dutch economy is picking up, the construction sector is still
performing badly. In 2009, turnover in the construction sector de-
creased by 4 percent, with another 9-percent drop recorded in 2010.
These figures indicate that the turnover in the construction sector
slumped even more in 2010 than in 2009. The economic crisis spread
further last year and, after residential and non-residential building com-
panies, civil-engineering companies were also struck. As a result of the
weakening demand, many workers were laid off and for the next two
years employment is projected to decline further by 8.5 percent.
75
Chapter
2: Secto
ral D
evelo
pmen
ts
36 Source: http://www.aia.org/37Source: http://www.cbs.nl/en-bouwen-wonen/publicaties/artikelen/archief/wm.htm
The Dutch government introduced special legislation, including a tem-
porary reduction of the value-added tax, to aid the sector‘s recovery.
The forecast is that, starting 2012, the Dutch construction sector will
begin to recover and employment in this sector will increase again.
Local developments 2010In general, the construction sector did not register significant growth in
2010. On the contrary, sales of important raw materials declined and
competition remained stiff. Several major projects were completed in
2010, including hotel expansions, new hotels, social and commercial
housing, etc. The majority of construction activities in the last couple
of years were tourism-related, as the hospitality sector expanded rap-
idly. Usually, the development of tourism areas triggers other infrastruc-
tural works, which was also the case in 2010. There were also
infrastructural works implemented in combination with residential
housing projects. With respect to the Social Economic Initiative (SEI)
and also with the European Development Fund (9th EDF), preparations
were made for several (infrastructural) projects to be implemented in
the course of 2011 and up to 2014.
Based on the number of building permits issued, it can be concluded
that the demand for new developments decreased in 2010 as com-
pared to the previous year. This had to do with the constitutional
changes. The numbers of permits issued was somewhat lower com-
pared to 2009. The number of buildings completed in 2010 was slightly
higher than in 200938.
There are several specializations in the contractors’ group. These can
be clustered into three categories: Civil and Utility Building, Infrastruc-
ture Builders and Mechanical works.
For the Civil and Utility Building category, as indicated in table 2.2, it
can be concluded that the demand for cement decreased by almost 9
percent in 2010 compared to 2009.
76
Chapter 2: Secto
ral Developm
ents
38Source: DROV and CBS
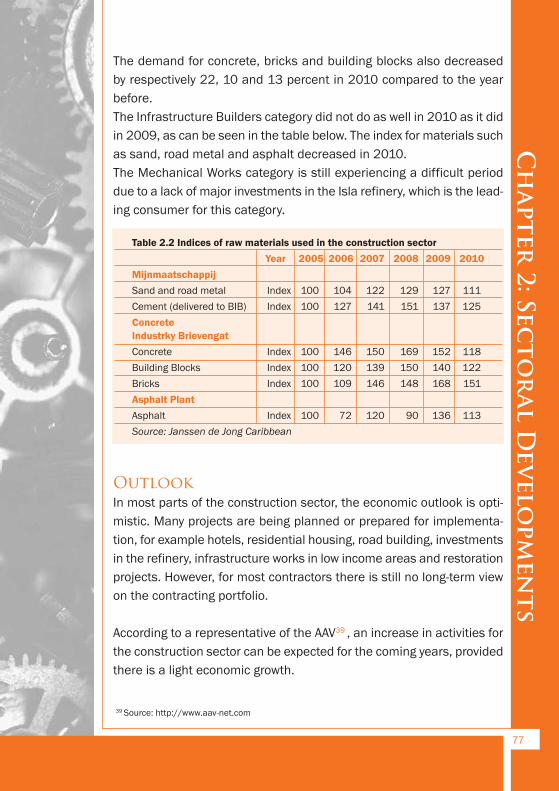
The demand for concrete, bricks and building blocks also decreased
by respectively 22, 10 and 13 percent in 2010 compared to the year
before.
The Infrastructure Builders category did not do as well in 2010 as it did
in 2009, as can be seen in the table below. The index for materials such
as sand, road metal and asphalt decreased in 2010.
The Mechanical Works category is still experiencing a difficult period
due to a lack of major investments in the Isla refinery, which is the lead-
ing consumer for this category.
Table 2.2 Indices of raw materials used in the construction sector
Year 2005 2006 2007 2008 2009 2010
Mijnmaatschappij
Sand and road metal Index 100 104 122 129 127 111
Cement (delivered to BIB) Index 100 127 141 151 137 125
Concrete
Industrky Brievengat
Concrete Index 100 146 150 169 152 118
Building Blocks Index 100 120 139 150 140 122
Bricks Index 100 109 146 148 168 151
Asphalt Plant
Asphalt Index 100 72 120 90 136 113
Source: Janssen de Jong Caribbean
OutlookIn most parts of the construction sector, the economic outlook is opti-
mistic. Many projects are being planned or prepared for implementa-
tion, for example hotels, residential housing, road building, investments
in the refinery, infrastructure works in low income areas and restoration
projects. However, for most contractors there is still no long-term view
on the contracting portfolio.
According to a representative of the AAV39 , an increase in activities for
the construction sector can be expected for the coming years, provided
there is a light economic growth.
77
Chapter
2: Secto
ral D
evelo
pmen
ts
39 Source: http://www.aav-net.com

Given this development, a shortage of local employees to carry out the
tasks is anticipated. That is why the AAV is now working in close
cooperation with ‘Plataforma Korsou na Trabou’40. This platform strives
to provide local people with adequate training to fill the vacancies.
78
Chapter 2: Secto
ral Developm
ents
40 For more information, see: www.korsounatrabou.com

2.3 TRADE SECTORS
2.3.1 Wholesale and Retail Trade
International DevelopmentsHistorically, wholesalers used to be located near to their target market.
However, with the increasing importance of the internet, wholesalers
can more often be found near the actual point of manufacturing. Con-
sequently, nowadays, mainland China, South-East Asia and Taiwan are
all becoming popular as wholesaler locations. China is fast becoming
the world leader in electronics wholesale, overtaking Russia and the
United States. Several factors contribute to this. First, China has the
biggest manufacturing industry in the world. Second, China can manu-
facture products cheaper than most companies based elsewhere. Third,
China has for a long time enjoyed access to the global market, particu-
larly the United States and the European Union. Fourth, China buys
Japanese high technology so it can compete with the other distributors.
And finally, the internet allows a smoother transition of goods and servi-
ces, leading to the rise of the internet .
The retail sector includes two main types of retailers: store (operating
fixed point-of-sale locations) and non-store retailers (reaching cus-
tomers and market merchandise through infomercials, paper and/or
electronic catalogues, etc.). Globally, the growing influence of the inter-
net is making this last aspect of retail a fast growing one, especially in
the first world. This is putting pressure on non-food retailers to redirect
their potential clients’ shopping experience in order to retain these cus-
tomers. According to retail-trend analysts, non-food stores will have to
concentrate on ‘fun shopping’ and will need to sell more name brands.
79
Chapter
2: Secto
ral D
evelo
pmen
ts
Local developments in the wholesale sector41
The year 2010 did not represent a stronger performance when compared
to 2009. There was either no growth or a slight drop in sales. Several fac-
tors contributed to this phenomenon. Besides the lingering aftereffects
of the world financial crisis, locally there were also two elections held.
According to local wholesalers, elections tend to influence customers’
buying behavior negatively. They also tend to make businesses take on a
‘wait-and-see’ approach before continuing with business as usual, thereby
putting investments on hold.
Mother Nature also contributed negatively to an already weak perfor -
mance in this sector by unleashing tropical storm Tomas in November of
2010. As a consequence, in the last months of 2010, record high levels
of rainfall were recorded, causing flooding that created great public
discomfort and financial losses, discouraging consumer spending during
the last two months of last year, a period which is otherwise one of those
with the highest consumer spending.
In the past, wholesalers were guaranteed exclusivity by their suppliers.
This is, however, no longer the case. New actors can (and do) easily enter
the market through so-called parallel imports, which grew substantially
during the last decade. Consequently, there is a lot of pressure on whole-
salers to remain competitive, while also fostering a good employee
environment to prevent workers from switching employers.
Another hurdle wholesalers are facing is the accumulation of the sales
tax, which ends up making the product too expensive for the final con-
sumer, and hence less attractive. This has led to creative ways by the
wholesalers to maintain a market while bypassing the so called three-
tier-system. Wholesalers now have the international supplier bill the
retailer directly for the sales tax, while the wholesalers collect simply a
commission.
While having had to deal with the previously mentioned hurdles, local
wholesalers have also had to adjust to an increased demand for high-
quality products and services as a result of an influx of demanding
80
Chapter 2: Secto
ral Developm
ents
41 Source: Interview with selected representatives from the sector

retirees from the Netherlands who, having purchased a second home
in Curaçao, spend a couple of months each year living here.
Local developments in the retail sector42
The local retail sector is represented by car dealerships, grocery stores,
pharmacies, clothing stores, computer stores, hardware stores and
“mini markets” (smaller grocery and convenience stores). Sales in this
sector increased slightly last year as compared to the year before,
although some areas performed better than others. Several factors
explain these differences. Grocery stores have seen their share drop
because of new stores that have entered the market. However, the
pinch is also being felt due to the large number of mini markets/con-
venience stores opening on the island. Hardware stores tend to do fairly
better, as there is not as much competition as in the case of groceries
stores. The positive results experienced by hardware stores can mostly
be attributed to the purchase of hardware and household appliances,
and less to building-material purchases.
A new labor law has been approved by the Parliament, according to
which at least 80 percent of each business’s employees will have to be
local, and only the remaining 20 percent or less can be imported em-
ployment. Because of this law (referred to as the 80/20 law), some of
the actors in this field, specifically mini markets, will have to make
adjustments to comply with the new regulation.
OutlookThe outlook for wholesalers is positive, as long as they continue
focusing on being competitive and continue raising their standards for
products and services. For most of the actors in the wholesale and retail
sector, the 80/20 law will not present a headache.
The number of wholesalers/importers will most likely not increase.
Possibly, the existing ones will consolidate and try to increase their volume.
81
Chapter
2: Secto
ral D
evelo
pmen
ts
42 Source: Interview with selected representatives from the sector

On the retail level, no dramatic increase in the number of stores is likely
(except for mini markets). However, an improvement of the quality and
services rendered is likely.
82
Chapter 2: Secto
ral Developm
ents
2.3.2 Economic Zones and E-commerce
IntroductionAn E-Zone is a specific appointed area where, among other things, in-
ternational trade and trade supportive services may be performed,
whether or not supported by electronic communication and information
equipment (e-commerce). E-Zone companies benefit from a very
favorable tax regime in Curaçao as regards corporate profit tax, custom
duties, turnover taxes and expatriate tax incentives, as long as they are
actually located and officially admitted in an E-zone.
The profit of E-Zone companies will be taxed at 2 percent (surtax
included) up to January 1, 2026. This 2-percent rate is not applicable
to profits of E-Zone companies generated through the sale of goods or
services to clients residing in Curaçao.
No import duties and turnover taxes are due on goods entering the
E-Zone and services rendered by local companies to an E-Zone com-
pany. Furthermore, no import duties and turnover taxes are due on
products delivered or services rendered to other companies located in
the E-Zone or outside Curaçao.
Employees who work for an E-Zone company can, if certain conditions
are met, qualify for the so-called expatriate status. An E-Zone company
is then allowed to calculate the wage tax on the net salary of employees
without being required to gross up the salary. Furthermore, E-Zone com-
panies can grant certain tax-free benefits to their employees.
In an E-zone, limited liability companies may perform activities that
must primarily be focused on trading goods or providing services to
clients which do not reside in Curaçao. However, conducting business
with other companies in an E-Zone in Curaçao is also allowed. To
conduct business with companies residing in Curaçao, the company
has to file a request with the competent authorities.
A company will be admitted to the E-Zone only if it carries out activities
as described above and, furthermore, if its business activities
contribute to the economical growth of Curaçao by generating either
83
Chapter
2: Secto
ral D
evelo
pmen
ts

foreign currency or employment. The local authorities will see to it (also
through the manager of the E-zone) that E-Zone companies meet the con-
ditions as stated in the E-Zone legislation. If it appears that a company is
located in the E-Zone whilst not fulfilling the conditions, penalties can be
imposed on the respective company and/or its license can be revoked.
Local E-zone and Free-zone developments There are 13 E-zones established on the island, of which 11 are
focused on (trade) services by electronic means, like internet
gaming/gambling, auctions, delivery of IT services and call-center
activities, like hotel & car reservations. The other two Free-zones focus
on the international trading of goods.
Service E-zonesCuraçao currently has 10 e-zones in operation43 with approximately
460 established e-zone companies. The e-service sector directly
employs some 400 persons, mostly call-center operators and IT
specialists. The indirect employment is much higher, of course, if the
required administration, the need for (IT) utilities, etc. are included.
Table 2.3 Established service e-zones
E-zone E-zone operator Surface Established
E-Commerce Park Exploitatie Maatschappij 2,700 m2 2001
E-zone Vredenberg NV 995 m2 2002
E-Powerhouse E-Powerhouse NV
New Haven E-zone I-Management NV 1,170 m2 2003
E-Trading House E-Trading Suites NV 1,200 m2 2003
E-zone Van Engelen E-zone Beheer Van Engelen NV 160.2 m2 2005
EOCG E-zone EOCG Offshore Services NV 820 m2 2006
E-zone Landhuis Joonchi United Trust Company NV 298 m2 2006
E-zone Hoogstraat Exploitatie Maatschappij
E-zone Curaçao NV 1,094 m2 2007
E-zone Scharlooweg E-zone Scharloo NV 854.2 m2 2009
E-zone Annaschool Exploitatie Maatschappij 207 m2 2009
E-zone Vredenberg NV
Source: Curinde N.V.
84
Chapter 2: Secto
ral Developm
ents
43 Air Side Office Park (HASCO) is not in operation
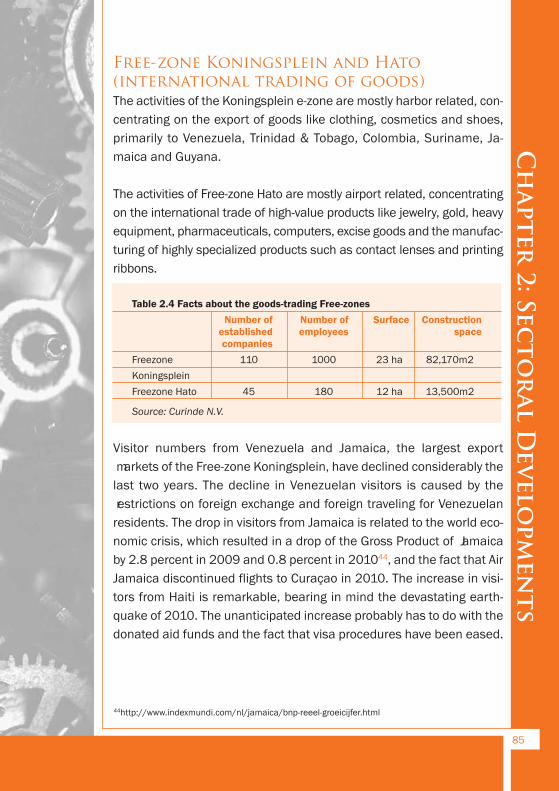
Free-zone Koningsplein and Hato (international trading of goods)The activities of the Koningsplein e-zone are mostly harbor related, con-
centrating on the export of goods like clothing, cosmetics and shoes,
primarily to Venezuela, Trinidad & Tobago, Colombia, Suriname, Ja-
maica and Guyana.
The activities of Free-zone Hato are mostly airport related, concentrating
on the international trade of high-value products like jewelry, gold, heavy
equipment, pharmaceuticals, computers, excise goods and the manufac-
turing of highly specialized products such as contact lenses and printing
ribbons.
Table 2.4 Facts about the goods-trading Free-zones
Number of Number of Surface Construction
established employees space
companies
Freezone 110 1000 23 ha 82,170m2
Koningsplein
Freezone Hato 45 180 12 ha 13,500m2
Source: Curinde N.V.
Visitor numbers from Venezuela and Jamaica, the largest export
markets of the Free-zone Koningsplein, have declined considerably the
last two years. The decline in Venezuelan visitors is caused by the
restrictions on foreign exchange and foreign traveling for Venezuelan
residents. The drop in visitors from Jamaica is related to the world eco-
nomic crisis, which resulted in a drop of the Gross Product of Jamaica
by 2.8 percent in 2009 and 0.8 percent in 201044, and the fact that Air
Jamaica discontinued flights to Curaçao in 2010. The increase in visi-
tors from Haiti is remarkable, bearing in mind the devastating earth-
quake of 2010. The unanticipated increase probably has to do with the
donated aid funds and the fact that visa procedures have been eased.
85
Chapter
2: Secto
ral D
evelo
pmen
ts
44http://www.indexmundi.com/nl/jamaica/bnp-reeel-groeicijfer.html
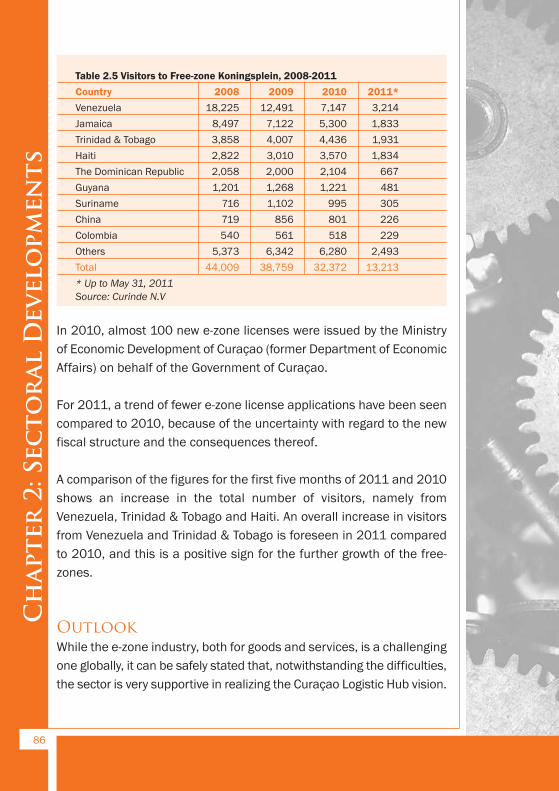
Table 2.5 Visitors to Free-zone Koningsplein, 2008-2011
Country 2008 2009 2010 2011*
Venezuela 18,225 12,491 7,147 3,214
Jamaica 8,497 7,122 5,300 1,833
Trinidad & Tobago 3,858 4,007 4,436 1,931
Haiti 2,822 3,010 3,570 1,834
The Dominican Republic 2,058 2,000 2,104 667
Guyana 1,201 1,268 1,221 481
Suriname 716 1,102 995 305
China 719 856 801 226
Colombia 540 561 518 229
Others 5,373 6,342 6,280 2,493
Total 44,009 38,759 32,372 13,213
* Up to May 31, 2011
Source: Curinde N.V
In 2010, almost 100 new e-zone licenses were issued by the Ministry
of Economic Development of Curaçao (former Department of Economic
Affairs) on behalf of the Government of Curaçao.
For 2011, a trend of fewer e-zone license applications have been seen
compared to 2010, because of the uncertainty with regard to the new
fiscal structure and the consequences thereof.
A comparison of the figures for the first five months of 2011 and 2010
shows an increase in the total number of visitors, namely from
Venezuela, Trinidad & Tobago and Haiti. An overall increase in visitors
from Venezuela and Trinidad & Tobago is foreseen in 2011 compared
to 2010, and this is a positive sign for the further growth of the free-
zones.
OutlookWhile the e-zone industry, both for goods and services, is a challenging
one globally, it can be safely stated that, notwithstanding the difficulties,
the sector is very supportive in realizing the Curaçao Logistic Hub vision.
86
Chapter 2: Secto
ral Developm
ents

The E-zone is a good and marketable economic activity for Curaçao and,
with all the competitive advantages Curaçao has, its potential is
enormous. Its location at an interchange of submarine fiber optic
cables, its political stability, the establishment of the Caribbean Internet
Exchange and the traditionally strong international financial sector are
just some of the advantages that make Curaçao a perfect place to
conduct (e-)business.
Another interesting development is the plan from the company Curaçao
Technology Exchange (CTEX) to establish a state-of-the-art datacenter
on the island. The facility will be connected to the five existing sub -
marine cables, while two additional cables will land directly within the
facilities of the datacenter, thus providing absolute redundancy. This
facility, in combination with an e-zone status (only 2% profit tax), will
give Curaçao another competitive advantage in the region.
The sector is also awaiting the new fiscal structure.
The two free-zones are managed by the government-owned agency
Curinde N.V. (Curaçao Industrial and International Trade Development
Company). Curinde formulated a strategic plan in line with the local
government’s aim to make Curaçao an international trade center by the
year 2016.
One of the challenges with regard to Free-Zone Koningsplein is that
there are no possibilities to expand it, so further growth will have to
come from an expansion at Free-Zone Hato. Some bottlenecks for both
free-zones are their dependence on adequate airlift, the high utility
costs, and red tape in obtaining business licenses and in customs
handling.
Surely, great news in solving the airlift bottleneck is the announcement
that air carrier Exec Direct started flying twice a week to and from
Jamaica in June 2011, with a freight capacity of 4 metric tons on each
flight. The intention is to extend the route schedule in short term with
Nassau (Bahamas), Port-au-Prince (Haiti), Grand Cayman (Cayman
Islands) and Miami (USA) as new destinations.
87
Chapter
2: Secto
ral D
evelo
pmen
ts
2.4 TRANSPORTATION SECTOR
2.4.1 Air Transport
IntroductionFor a small, open island economy like Curaçao, reliable air connections
to key markets are vital for economic development and growth. Also, to
fulfill the ambition to become a ‘logistical hub’ in the Caribbean, the
aviation industry, which includes airlines, the airport and air cargo busi-
nesses, enables international trade flow as it facilitates the movement
of people and goods and is the backbone of our economic growth.
As of January 2009, Curaçao Airport Holding (CAH)—as the airport’s
owner—approved the takeover of Alterra’s 51-percent share in Curaçao
Airport Investment (CAI) by A-port. A-port is comprised of Unique (Zurich
Airport), the Brazilian Camargo Correa and the Chilean IDC.
International developments in 201045
The International Air Transport Association (IATA) reported that the full-
year 2010 demand statistics for international scheduled air traffic
showed an 8.2 percent increase in the passenger business and a 20.6
percent increase in freight. Demand growth outstripped capacity in-
creases of 4.4% for passenger and 8.9% for cargo. The average pas-
senger load factor for that year was 78.4 percent, which is a 2.7
percentage-point improvement compared to 2009. The freight load
factor saw a 5.2 percentage-point improvement to 53.8%.
Compared to the pre-recession levels of early 2008, December air
travel volumes were 4 percent higher. Airfreight traffic was 1 percent
higher than pre-recession levels; however, volumes have fallen by 5
percent since the peak of the post-recession inventory re-stocking boom
in early 2010.
“The world is moving again. After the biggest demand decline in the
history of aviation in 2009, people started to travel and do business
again in 2010. Airlines ended the year slightly ahead of early 2008
88
Chapter 2: Secto
ral Developm
ents
45 Source: www.iata.org

volumes, but with a pathetic 2.7-percent profit margin. The challenge
is to turn the demand for mobility into sustainable profits,” said
Giovanni Bisignani, IATA’s Director General and CEO.
Severe weather in Europe and North America in December put a dent
in the industry’s recovery. It is estimated that this shaved 1 percent off
of total traffic demand for that month. As a result, passenger demand
dipped to a 4.9-percent growth compared to December 2009 levels,
significantly lower than the 8.2-percent growth recorded in November
2010, as compared to November 2009. Europe was hit the hardest,
with a slowdown in growth in December to 3.3 percent.
Developments in the local aviation industryThe latest developments with regard to the national carriers of Curaçao
are that DAE added Panama to its schedule and Insel Air added
Medellin, Caracas, Charlotte and additional flights to Puerto Rico to
theirs.
With regard to the foreign carriers, it is worth mentioning that American
Airlines increased flights between Miami and Curaçao to twice daily.
Continental Airlines increased the frequency of flights between Curaçao
and Newark to twice a week. Moreover, GOL started with its flights to
Brasilia and Sao Paolo once a week and Blue Panorama flies between
Curaçao and Milan once a week on a seasonal basis. Avianca expanded
their flight schedule and flies to Curaçao daily from Bogota and Air
Berlin started with weekly flights between Curaçao and Dusseldorf.
Unfortunately, Air Jamaica discontinued flights to Curaçao in 2010, but
these were later on taken over by Insel Air. Martinair stopped flying in
November of 2011 but KLM took over the majority of its flights.
Curaçao can still count on a stable number of flights from the region
and Europe. The Amsterdam-Curaçao route is now served at least twice
daily. This has a positive effect for Curaçao, since the obviously stronger
euro (as compared to the NAF) lures Europeans to our island.
89
Chapter
2: Secto
ral D
evelo
pmen
ts
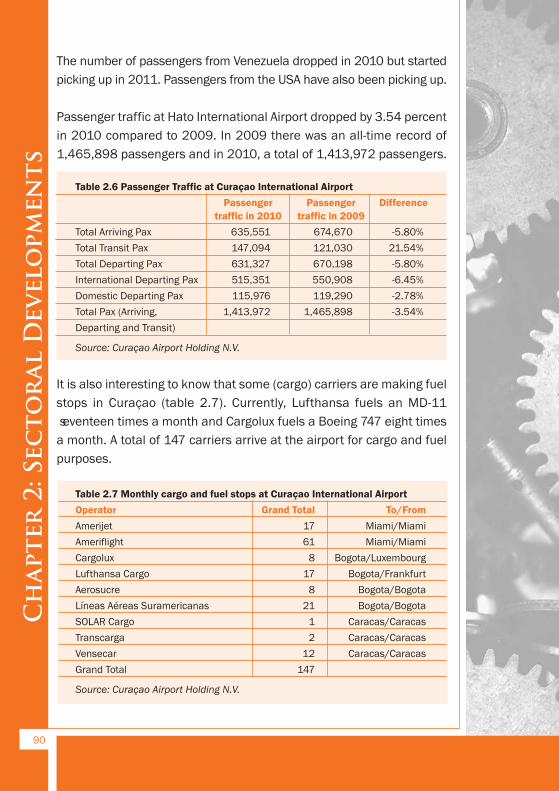
The number of passengers from Venezuela dropped in 2010 but started
picking up in 2011. Passengers from the USA have also been picking up.
Passenger traffic at Hato International Airport dropped by 3.54 percent
in 2010 compared to 2009. In 2009 there was an all-time record of
1,465,898 passengers and in 2010, a total of 1,413,972 passengers.
Table 2.6 Passenger Traffic at Curaçao International Airport
Passenger Passenger Difference
traffic in 2010 traffic in 2009
Total Arriving Pax 635,551 674,670 -5.80%
Total Transit Pax 147,094 121,030 21.54%
Total Departing Pax 631,327 670,198 -5.80%
International Departing Pax 515,351 550,908 -6.45%
Domestic Departing Pax 115,976 119,290 -2.78%
Total Pax (Arriving, 1,413,972 1,465,898 -3.54%
Departing and Transit)
Source: Curaçao Airport Holding N.V.
It is also interesting to know that some (cargo) carriers are making fuel
stops in Curaçao (table 2.7). Currently, Lufthansa fuels an MD-11
seventeen times a month and Cargolux fuels a Boeing 747 eight times
a month. A total of 147 carriers arrive at the airport for cargo and fuel
purposes.
Table 2.7 Monthly cargo and fuel stops at Curaçao International Airport
Operator Grand Total To/From
Amerijet 17 Miami/Miami
Ameriflight 61 Miami/Miami
Cargolux 8 Bogota/Luxembourg
Lufthansa Cargo 17 Bogota/Frankfurt
Aerosucre 8 Bogota/Bogota
Líneas Aéreas Suramericanas 21 Bogota/Bogota
SOLAR Cargo 1 Caracas/Caracas
Transcarga 2 Caracas/Caracas
Vensecar 12 Caracas/Caracas
Grand Total 147
Source: Curaçao Airport Holding N.V.
90
Chapter 2: Secto
ral Developm
ents
Curaçao Airport Holding NV (CAH) CAH went through some interesting events in 2010. In June 2010, CAP
and CAH agreed on a ”financial support agreement.” This agreement
involves that CAH will provide support to CAP in the coming years with
regard to bus services on the airport premises, the demolition of the old
ALM building, hospitality training for airport employees and the acquisition
of loans against favorable conditions for necessary equipment, the
parking lot and new passenger loading bridges. A total of approximately
NAF 1.1 million has been budgeted for this in 2011.
The collaboration with CTB has been intensified to further expand airlift.
In 2010, passenger numbers dropped—the economic crisis being largely
to blame—and airlines deleted some routes to lower costs. In general,
routes can be maintained if more seats are guaranteed and marketing
help is given. For 2009, NAF 750,000 was budgeted to maintain certain
routes. In consultation with the CTB, CAH has agreed to account for a
greater share in 2011, approximately NAF 1.7 million.
A-port presented the master plan for areas B and C and terminated the
previous agreement with HASCO. The master plan was completed in July
2010 and A-port informed HASCO that the agreement negotiated in 2009
would not be continued. A-port indicated, however, that it is still willing to
work together with HASCO to develop the B and C areas. Future coopera-
tion between A-port and HASCO is currently being discussed. Over the
years 2011 to 2013, CAH will invest approximately NAF 20 million in areas
B and C.
Outlook International Developments46The International Air Transport Association (IATA) downgraded its airline
industry outlook for 2011 from a net profit of $9.1 billion forecasted in
December 2010 to $8.6 billion. This is a 46-percent fall in net profit
compared to the $16 billion earned by the industry in 2010. On ex-
pected industry revenues of $594 billion, the $8.6 billion profit in 2011
equates to a net profit margin of 1.4 percent.
91
Chapter
2: Secto
ral D
evelo
pmen
ts
46 Source: www.iata.org
“Political unrest in the Middle East has sent oil over $100 per barrel.
That is significantly higher than the $84 per barrel that was the
assumption in December. At the same time, the global economy is now
forecasted to grow by 3.1 percent this year—a full 0.5 percentage point
better than predicted just three months ago. But stronger revenues will
provide only a partial offset to higher costs. Profits will be cut in half
compared to last year and margins are a pathetic 1.4 percent,” said
Giovanni Bisignani, IATA’s Director General and CEO.
Forecast highlightsIATA raised its 2011 average-oil-price assumption to $96 per barrel of
Brent Crude (up from $84 in December), in line with market forecasts.
Including the impact of fuel hedging, which is roughly 50 percent of
expected consumption, this will increase the industry fuel bill by $10
billion to a total of $166 billion. Fuel is now estimated to represent 29
percent of total operating costs (up from 26% in 2010).
Growing economies give airlines the opportunity to recover some of
these added costs with additional revenues. For example, since early
2009, rising oil prices added 25 percent to unit costs, while average
fares (excluding surcharges) rose by 20 percent. But in 2011, higher
revenues are not expected to be sufficient to prevent the rise in oil
prices from causing profits to shrink by 46 percent from 2010 levels.
An increase in global GDP forecasts to 3.1 percent (from 2.6% in
December) bodes well for continuing strong demand for air transport.
In line with this, IATA revised its passenger-demand growth forecast to
5.6 percent (from 5.2%) and its cargo growth forecast to 6.1 percent
(up from 5.5%). Overall, this will generate a 5.7 percent expansion in
ton-kilometers flown.
Published airline schedules indicate a capacity increase of 6 percent,
slightly lower than the 6.1 percent previously forecasted. Of this, 5
percent will come from the 1,400 new aircraft being introduced to the
fleet in 2011. The additional 1 percent is expected to come from the
normalization of underutilized capacity in the twin-aisle fleet.
92
Chapter 2: Secto
ral Developm
ents

With capacity expected to increase by 6 percent in 2011 and demand
by 5.7 percent, the gap is 0.3 percentage points. This has narrowed
from the previously forecast gap which was 0.8 percentage points.
IATA also highlighted the risk of increasing taxation, particularly in price-
sensitive leisure markets. In 2010, the industry saw new and increased
taxes in the range of 3-5 percent of ticket prices in the UK, Germany
and Austria. Recently, Iceland, India and South Africa have joined with
plans for additional taxation. “This is a price-sensitive business. Aviation
has the power to stimulate economies. But that ability is being compro-
mised by adding taxes at a time when we are struggling to cope with
high fuel prices just to maintain anemic margins,” said Bisignani.
Local developmentsCuraçao Airport Holding EstimatesCAH estimated an amount of NAF 0.7 million in revenues for 2011. This
is NAF 1.7 million lower than the estimated revenue in 2010. The lower
estimated revenue in 2011 compared to 2010 is based on:
· higher earnings of NAF 0.2 million expected in 2011, based on the
concession fees for areas A, B and C. With regard to the concession
fee for area A, the assumption is a slight increase in earnings com-
pared to the forecast of 2010. Because of the financial crisis,
tourism is expected to increase only slightly compared to 2010,
despite increased hotel capacity and extra marketing efforts. With
regard to the concession fee for areas B and C, Curinde’s lease fee
and some smaller returns have been taken into account;
· higher financial returns/lower exceptional charges of NAF 0.6
million expected, also affecting the revenues positively. Higher
financial returns/lower exceptional charges are expected in 2011 com-
pared to 2010 because in 2010 a financial settlement with the former
director had taken place, an item that is not expected in 2011;
· higher expenses of NAF 2.3 million and higher depreciation of
of NAF 0.2 million are expected. Compared to 2010, the expenses
and depreciation in 2011 are expected to increase significantly
based on the additional costs from the financial support agreement
and additional costs to guarantee seat and marketing contributions
93
Chapter
2: Secto
ral D
evelo
pmen
ts

agreed with the CTB, as mentioned earlier, and the assumption of
hiring additional manpower.
Revenues from new projects have not been taken into account.
The estimated revenue for 2012 is derived from the 2011 estimate and
is expected to amount to NAF 1.4 million. This higher revenue compared
to 2011 is based on higher expected passenger numbers, taking higher
costs for the hospitality training into consideration because of inflation.
For the coming years, CAH, as an essential partner in the local aviation
industry, will focus on the runway, which needs to be renovated to com-
ply with international standards, and busses to drive the passengers
from the terminal to the aircraft and vice versa.
As part of the logistical hub vision, CAH has committed itself to align
its strategies as much as possible with the objectives agreed upon with
other local stakeholders of the aviation industry. These objectives are:
· Alignment and commitment of strategic partners to the long-term
Logistical Hub vision, with clear roles and responsibilities for imple-
mentation;
· Development of Airport City to stimulate and facilitate the growth of
the airport, the hub and the island’s economy;
· Development and upgrade of the airport complex and its infrastruc-
ture, based on mutually agreed strategies that support the airlift
services necessary for a competitive logistical hub;
· Ensure high-quality services for airlift, cargo and services within the
airport complex; and
· Create an airlift development strategy that is supported by all strate-
gic partners.
Air TrafficNow that Curaçao has become autonomous, it is responsible for its own
policies, regulations, air-traffic control, agreements and granting of
94
Chapter 2: Secto
ral Developm
ents

licenses to air carriers. This creates the opportunity to re-structure the
island’s aviation policy, giving the island the opportunity to become an
attractive regional and international origin and destination traffic and
transshipment hub for both passengers and cargo between the conti-
nents of North and South America, Europe and possibly Asia.
95
Chapter
2: Secto
ral D
evelo
pmen
ts
2.4.2 Harbor
IntroductionCuraçao’s main port, the Port of Willemstad, is accessible trough the
St. Anna Bay harbor via which vessels can access the Schottegat Bay
inlet. The Port of Willemstad offers most port related services and
activities, including cargo docks, a dry dock, the refinery and other
services. Curaçao’s other commercial ports are Bullen Bay, Caracas
Bay, Fuik Bay, St. Michiels Bay and Spanish Waters.
Important stakeholders in the harbor include the Curaçao Ports Authority,
Curaçao Ports Services, the Curaçao Drydock Company and the Kompania
di Tou Korsou.
Local developments in 2010
Curaçao Ports AuthoritiesThe harbor activities in Curaçao and its facilities are managed by the
Curaçao Ports Authorities (CPA) on behalf of the local government.
In 2009, the harbor’s overall performance showed a decline in compari-
son to 2008, in terms of the number of ships that moored in the harbor.
For 2010, a further decline of 14 percent was noticed compared to 2009.
Freighters and transshipmentsThe number of freighters and transshipment containers has been
decreasing from 2008 on, by 5 percent in 2008, 9 percent in 2009 and
16 percent in 2010 compared to the respective previous years (see
table 2.8). This decrease is due to the still fierce and growing competi-
tion from harbors like Colon and Jamaica, which have upgraded their
harbor infrastructure and activities to accommodate post-Panama con-
tainer ships. Harbors in St. Maarten, Cartagena, Trinidad and Man-
zanillo have also been investing in post-Panama infrastructure.
The international financial and economic crisis also affected the growth
rate of the world trade with negative consequences for local harbor
activities still felt in 2010.
96
Chapter 2: Secto
ral Developm
ents
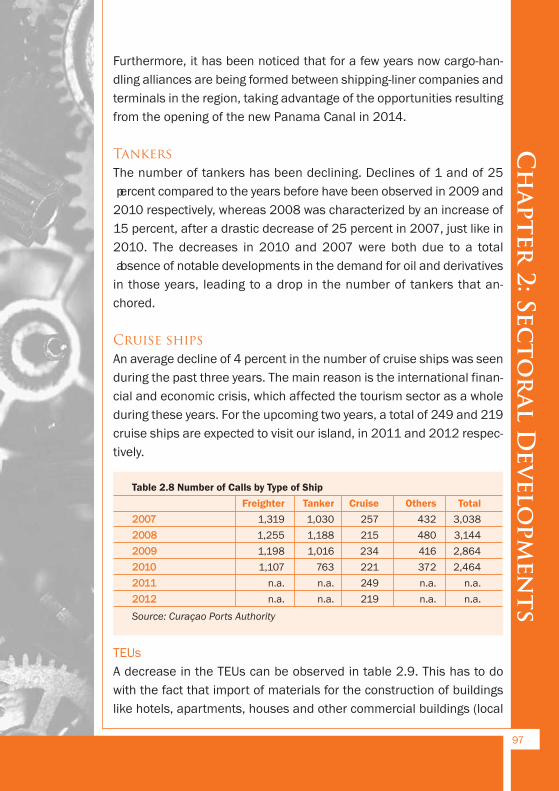
Furthermore, it has been noticed that for a few years now cargo-han-
dling alliances are being formed between shipping-liner companies and
terminals in the region, taking advantage of the opportunities resulting
from the opening of the new Panama Canal in 2014.
TankersThe number of tankers has been declining. Declines of 1 and of 25
percent compared to the years before have been observed in 2009 and
2010 respectively, whereas 2008 was characterized by an increase of
15 percent, after a drastic decrease of 25 percent in 2007, just like in
2010. The decreases in 2010 and 2007 were both due to a total
absence of notable developments in the demand for oil and derivatives
in those years, leading to a drop in the number of tankers that an-
chored.
Cruise shipsAn average decline of 4 percent in the number of cruise ships was seen
during the past three years. The main reason is the international finan-
cial and economic crisis, which affected the tourism sector as a whole
during these years. For the upcoming two years, a total of 249 and 219
cruise ships are expected to visit our island, in 2011 and 2012 respec-
tively.
Table 2.8 Number of Calls by Type of Ship
Freighter Tanker Cruise Others Total
2007 1,319 1,030 257 432 3,038
2008 1,255 1,188 215 480 3,144
2009 1,198 1,016 234 416 2,864
2010 1,107 763 221 372 2,464
2011 n.a. n.a. 249 n.a. n.a.
2012 n.a. n.a. 219 n.a. n.a.
Source: Curaçao Ports Authority
TEUs
A decrease in the TEUs can be observed in table 2.9. This has to do
with the fact that import of materials for the construction of buildings
like hotels, apartments, houses and other commercial buildings (local
97
Chapter
2: Secto
ral D
evelo
pmen
ts
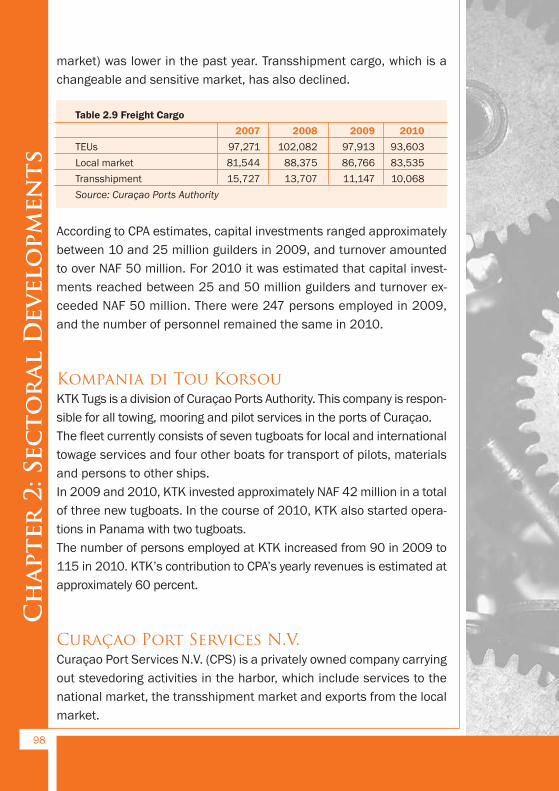
market) was lower in the past year. Transshipment cargo, which is a
changeable and sensitive market, has also declined.
Table 2.9 Freight Cargo
2007 2008 2009 2010
TEUs 97,271 102,082 97,913 93,603
Local market 81,544 88,375 86,766 83,535
Transshipment 15,727 13,707 11,147 10,068
Source: Curaçao Ports Authority
According to CPA estimates, capital investments ranged approximately
between 10 and 25 million guilders in 2009, and turnover amounted
to over NAF 50 million. For 2010 it was estimated that capital invest-
ments reached between 25 and 50 million guilders and turnover ex-
ceeded NAF 50 million. There were 247 persons employed in 2009,
and the number of personnel remained the same in 2010.
Kompania di Tou KorsouKTK Tugs is a division of Curaçao Ports Authority. This company is respon-
sible for all towing, mooring and pilot services in the ports of Curaçao.
The fleet currently consists of seven tugboats for local and international
towage services and four other boats for transport of pilots, materials
and persons to other ships.
In 2009 and 2010, KTK invested approximately NAF 42 million in a total
of three new tugboats. In the course of 2010, KTK also started opera-
tions in Panama with two tugboats.
The number of persons employed at KTK increased from 90 in 2009 to
115 in 2010. KTK’s contribution to CPA’s yearly revenues is estimated at
approximately 60 percent.
Curaçao Port Services N.V.Curaçao Port Services N.V. (CPS) is a privately owned company carrying
out stevedoring activities in the harbor, which include services to the
national market, the transshipment market and exports from the local
market.
98
Chapter 2: Secto
ral Developm
ents

In the years 2009 and 2010, CPS’s investments were between NAF
100,000 and NAF 250,000, and revenues were between NAF 25 and
50 million.
CPS experienced a slight decrease in its volume of freight cargo in 2010
because most large construction projects in Curaçao had been finished
in 2009, and the Venezuelan tourism sector and transshipment market
declined.
Curaçao Drydock Company N.V.CDM’s core business is to provide ship-repair services. The company
has three docks: one large dry-dock (Antiya-dock) where repairs and
maintenance are done to large ships, a second dry-dock (Beatrix-dock)
where medium to large repairs are carried out, and a third dock (Cu-
raçao-dock), which is a floating dock. The majority of the stocks is in
hands of the government.
Due to the international economic decline, which started late in 2008
but only started affecting the CDM six months later, orders for new ships
were being postponed and repairs were only done if really necessary.
The floating dock is currently inoperative and other facilities such as
cranes, generators and other machinery are also obsolete. This will
affect the turnover for 2011. Turnover is expected to be approximately
NAF 65 million in 2011, whereas in 2010 turnover was NAF 76 million.
An investment of approximately 10 to 11 million dollars is required to
upgrade the floating dry-dock. As regards other possible investment
projects, the CDM has currently no means to finance them. Negotia-
tions are taking place between the CDM and international companies
that are interested in becoming its strategic partners. However,
currently there is no official information about these negotiations.
OutlookCPA expects 249 cruise-ship calls in 2011 and 219 calls in 2012. The
number of passengers is expected to increase from 383,036 in 2010
to about 419,000 in 2011, and in 2012 that number is expected to
99
Chapter
2: Secto
ral D
evelo
pmen
ts
increase by 13 percent. These increases are because larger cruise
ships are expected to anchor.
Moreover, CPA is looking into investing in long-term projects that will
raise the interest of cruise corporations in the island, as it is expected
that very large vessels will become the norm in Caribbean waters once
the expansion of the Panama Canal is finished in 2014. This is an
opportunity for Curaçao’s ports to evolve and grow in capacity to
accommodate these larger vessels. Possible large construction projects
in the Caracas Bay area, a new cruise terminal at the existing Mega
Pier, the possibility for a second mega pier, and waterfront develop-
ments at the Scharloo and Otrabanda wharfs may increase the number
of cruise ships, cruise- and stay-over passengers, the volume of freight
cargo as well as other operational activities for the CDM in later years.
For 2011 and 2012, a decline is expected in CDM’s operations. The
reason, as mentioned earlier, is obsolete equipment. A forecast for
2012 is difficult to give because, besides the fact that investments
need to be done, CDM is also dependent on developments in the inter-
national economy and the shipping sector.
The KTK currently does not have any investment plans, but the com-
pany is looking into future possibilities to increase their turnover and
profits in the coming years.
100
Chapter 2: Secto
ral Developm
ents
2.5 TOURISM
International Developments According to the World Tourism Barometer47, in 2010 world tourism
recovered more strongly than expected. Worldwide, international tourist
arrivals increased by 6.7 percent in 2010, reaching 935 billion. This is far
more than the growth forecast of between 3 and 4 percent made about a
year ago. This growth is remarkable given the many disasters that oc-
curred in 2010, including the devastating Haiti earthquake, severe flood-
ing in a number of countries and the oil spill in the Gulf of Mexico. Even
though all regions reported positive growth, emerging economies
performed exceptionally well. On a sub-regional level there are some
destinations with double digit growth, but also some that are still affected
by the global economic crisis. Tourist arrivals may have reached, or in
some cases surpassed, pre-crisis levels, but tourist expenditures are still
lagging behind.
Asia and the Pacific, as well as the Middle East, registered double-digit
growth in 2010. Africa’s tourism was boosted by the positive exposure of
the World Football Cup, reporting a 6-percent growth in 2010. Europe
reported a modest growth of 3 percent as the region is still recovering
from the economic crisis. UNWTO remains positive about the global
tourism development, as the tourism sector has proven to be very resilient,
even during crises. The growth forecast for 2011 is expected to range
between 4 and 5 percent.
For the Caribbean region, recovery from the global crisis started in 2010
with tourist arrivals increasing by 4.2 percent according to the
Caribbean Tourism Organization. All sub-regions of the Caribbean reg-
istered growth except for the Dutch Caribbean, which was influenced
by Curaçao’s negative growth. Just like other regions, the Caribbean
also noticed the trend of less spending per trip by tourists compared to
the period before the economic crisis. Hotels and other businesses are
still under pressure because of the lower level of spending. Luckily,
tourist expenditure is expected to pick up soon, albeit at a slower pace
101
Chapter
2: Secto
ral D
evelo
pmen
ts
47 World Tourism Barometer is a publication of the UNWTO
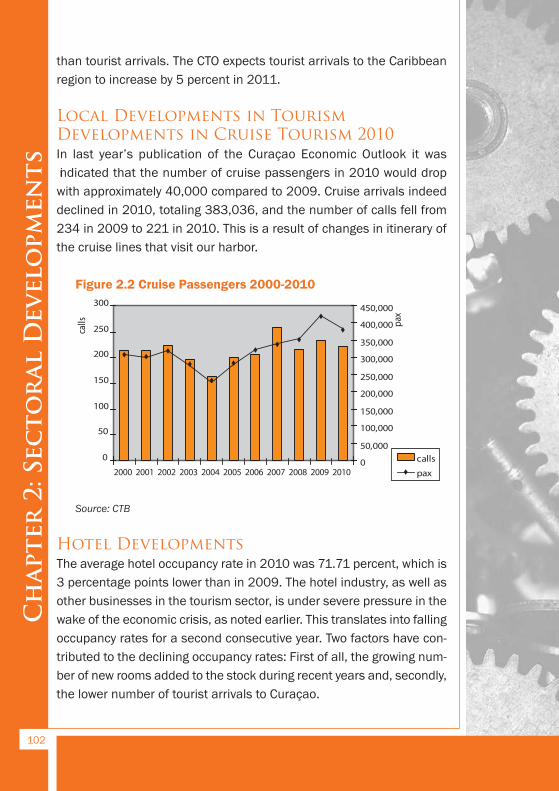
than tourist arrivals. The CTO expects tourist arrivals to the Caribbean
region to increase by 5 percent in 2011.
Local Developments in TourismDevelopments in Cruise Tourism 2010In last year’s publication of the Curaçao Economic Outlook it was
indicated that the number of cruise passengers in 2010 would drop
with approximately 40,000 compared to 2009. Cruise arrivals indeed
declined in 2010, totaling 383,036, and the number of calls fell from
234 in 2009 to 221 in 2010. This is a result of changes in itinerary of
the cruise lines that visit our harbor.
Figure 2.2 Cruise Passengers 2000-2010
Source: CTB
Hotel DevelopmentsThe average hotel occupancy rate in 2010 was 71.71 percent, which is
3 percentage points lower than in 2009. The hotel industry, as well as
other businesses in the tourism sector, is under severe pressure in the
wake of the economic crisis, as noted earlier. This translates into falling
occupancy rates for a second consecutive year. Two factors have con-
tributed to the declining occupancy rates: First of all, the growing num-
ber of new rooms added to the stock during recent years and, secondly,
the lower number of tourist arrivals to Curaçao.
102
Chapter 2: Secto
ral Developm
ents
0
10
20
30
40
50
60
70
80
90
100
Jan Feb Mar Apr May Jun July Aug Sept Oct Nov Dec Month
$ pe
r bar
rel
0
50
100
150
200
250
300
2000 2001 2002 2003 2004 2005 2006 2007 2008 2009 2010
calls
0
50,000
100,000
150,000
200,000
250,000
300,000
350,000
400,000
450,000
pax
calls
pax
2005
2006
2007
2008
2009
2010
2011
65
70
75
80
85
90
Average Occupancy Rate
Occupancy Rate
North America
Latin America
and the Carib
bean
Oceania/Australia
EuropeAsia
Africa
Seas/Space
0
4000
8000
12000
16000
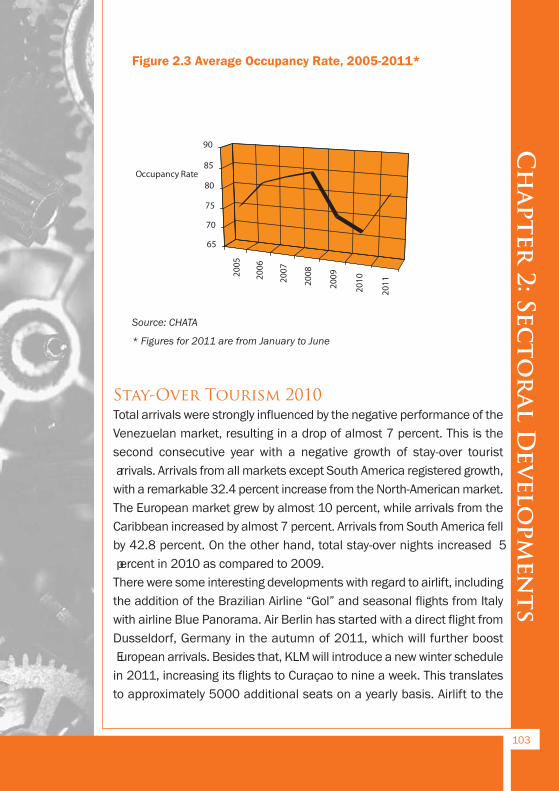
Figure 2.3 Average Occupancy Rate, 2005-2011*
Source: CHATA
* Figures for 2011 are from January to June
Stay-Over Tourism 2010Total arrivals were strongly influenced by the negative performance of the
Venezuelan market, resulting in a drop of almost 7 percent. This is the
second consecutive year with a negative growth of stay-over tourist
arrivals. Arrivals from all markets except South America registered growth,
with a remarkable 32.4 percent increase from the North-American market.
The European market grew by almost 10 percent, while arrivals from the
Caribbean increased by almost 7 percent. Arrivals from South America fell
by 42.8 percent. On the other hand, total stay-over nights increased 5
percent in 2010 as compared to 2009.
There were some interesting developments with regard to airlift, including
the addition of the Brazilian Airline “Gol” and seasonal flights from Italy
with airline Blue Panorama. Air Berlin has started with a direct flight from
Dusseldorf, Germany in the autumn of 2011, which will further boost
European arrivals. Besides that, KLM will introduce a new winter schedule
in 2011, increasing its flights to Curaçao to nine a week. This translates
to approximately 5000 additional seats on a yearly basis. Airlift to the
103
Chapter
2: Secto
ral D
evelo
pmen
ts
0
10
20
30
40
50
60
70
80
90
100
Jan Feb Mar Apr May Jun July Aug Sept Oct Nov Dec Month
$ pe
r bar
rel
0
50
100
150
200
250
300
2000 2001 2002 2003 2004 2005 2006 2007 2008 2009 2010
calls
0
50,000
100,000
150,000
200,000
250,000
300,000
350,000
400,000
450,000
pax
calls
pax
2005
2006
2007
2008
2009
2010
2011
65
70
75
80
85
90
Average Occupancy Rate
Occupancy Rate
North America
Latin America
and the Carib
bean
Oceania/Australia
EuropeAsia
Africa
Seas/Space
0
4000
8000
12000
16000
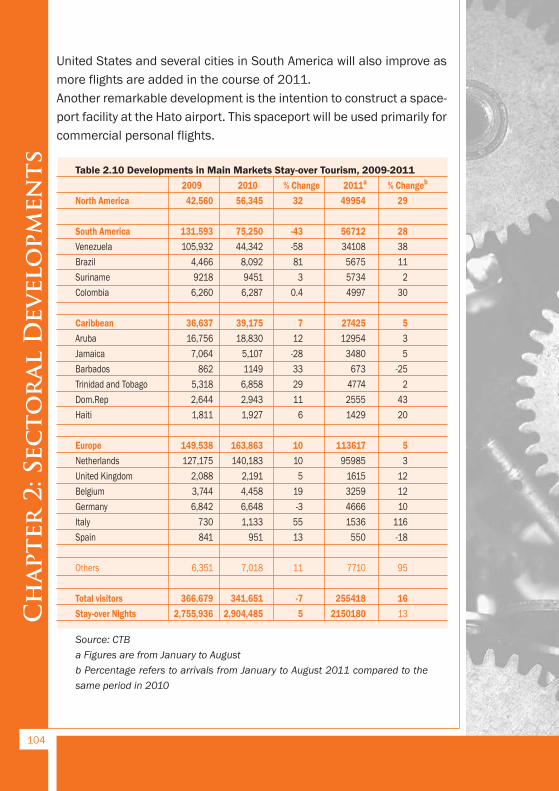
United States and several cities in South America will also improve as
more flights are added in the course of 2011.
Another remarkable development is the intention to construct a space-
port facility at the Hato airport. This spaceport will be used primarily for
commercial personal flights.
Table 2.10 Developments in Main Markets Stay-over Tourism, 2009-2011
2009 2010 % Change 2011a % Changeb
North America 42,560 56,345 32 49954 29
South America 131,593 75,250 -43 56712 28
Venezuela 105,932 44,342 -58 34108 38
Brazil 4,466 8,092 81 5675 11
Suriname 9218 9451 3 5734 2
Colombia 6,260 6,287 0.4 4997 30
Caribbean 36,637 39,175 7 27425 5
Aruba 16,756 18,830 12 12954 3
Jamaica 7,064 5,107 -28 3480 5
Barbados 862 1149 33 673 -25
Trinidad and Tobago 5,318 6,858 29 4774 2
Dom.Rep 2,644 2,943 11 2555 43
Haiti 1,811 1,927 6 1429 20
Europe 149,538 163,863 10 113617 5
Netherlands 127,175 140,183 10 95985 3
United Kingdom 2,088 2,191 5 1615 12
Belgium 3,744 4,458 19 3259 12
Germany 6,842 6,648 -3 4666 10
Italy 730 1,133 55 1536 116
Spain 841 951 13 550 -18
Others 6,351 7,018 11 7710 95
Total visitors 366,679 341,651 -7 255418 16
Stay-over Nights 2,755,936 2,904,485 5 2150180 13
Source: CTB
a Figures are from January to August
b Percentage refers to arrivals from January to August 2011 compared to the
same period in 2010
104
Chapter 2: Secto
ral Developm
ents
North AmericaIn 2010, arrivals from the North-American continent soared by an
astonishing 32 percent after years of negative performance. The year
2010 has finally marked the end of the economic crisis and leisure
travel from especially the American tourist is picking up again. Perfor -
mance from this market in the eight months of 2011 continued to be
extremely positive, with double-digit growth rates. Airlift from this region
has increased significantly with the twice-weekly non-stop flights from
New Jersey with Continental Airlines.
South AmericaGrowth figures for this region (-43%) were negatively influenced by the
numbers for Venezuela (-58%). Arrivals from several other South American
countries that registered growth include Brazil (81%), Ecuador (33%) and
Suriname (3%). Brazil’s remarkable growth can be ascribed to the addi-
tional marketing efforts and the availability of direct flights with Gol
Airlines. It is worth mentioning that arrivals from Venezuela were positive
for the first months of 2011. This is the first time since July of 2009 that
an increase in arrivals from this country has been seen.
CaribbeanIn 2010, arrivals from the Caribbean region increased by 7 percent.
Despite the developments in Haiti, arrivals from that country still grew
by 6 percent while arrivals from Jamaica continue to plummet as a
result of lack of direct airlift. Other countries in this region performing
well in terms of arrivals include Aruba and the Dominican Republic. This
positive trend in arrivals from the region is expected to continue
considering the figures of the first eight months of 2011.
EuropeEurope and especially the Netherlands continue to be the largest and
strongest market. Overall growth from this region was 10 percent in
2010, but some countries performed well while others registered
negative growth. Arrivals in the first months of 2011 show a modest
growth from this region.
105
Chapter
2: Secto
ral D
evelo
pmen
ts
2.6 FINANCIAL AND BUSINESS SERVICES
2.6.1 Commercial Banks
Local DevelopmentsConstitutional changesThe year 2010 marked the dissolution of the Netherlands Antilles on
October 10, and the establishment of two new autonomous countries
in the Dutch Kingdom, namely St. Maarten and Curaçao, while the BES
islands—Bonaire, St. Eustatius and Saba—joined the mother country,
the Netherlands, as Dutch municipalities.
The larger banks with subsidiaries on the BES islands are subject to
Dutch fiscal policies and regulations as per October 10, 2010. On the
other hand, St. Maarten and Curaçao adopted the former Antillean rules
and regulations. The BES islands opted for dollarization of their
economies and introduced the American dollar as their official currency
as of January 1, 2011. Consequently, it was necessary for the banks to
convert their banking systems in order to adapt to the new require-
ments. This also has a negative impact on the number of currency-
exchange transactions, since the BES islands will not be exchanging
guilders to dollars anymore. Since January 1, 2011, the prudential
supervisor for the BES banks is the Dutch Central Bank (DNB), while
for branches in St. Maarten and Curaçao, the supervising authority is
the Central Bank of Curaçao and St. Maarten (CBCS).
Interest ratesThe cash surplus the banks accumulated as a result of the collection
of matured government bonds in 2009 and 2010, together with the
global economic crisis, lead to a downward pressure on interest rates.
Lending rates for personal and corporate loans, car loans and mort-
gages were reduced to levels of approximately 3 to 5 percent. Interest
on savings and deposits were also reduced to approximately 0.75 to
2 percent at the major banks. Interest rates have remained stable in
106
Chapter 2: Secto
ral Developm
ents
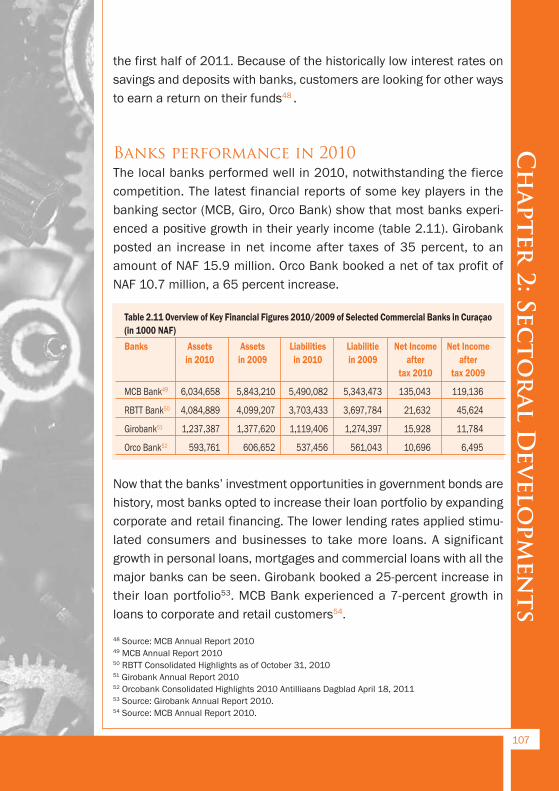
the first half of 2011. Because of the historically low interest rates on
savings and deposits with banks, customers are looking for other ways
to earn a return on their funds48 .
Banks performance in 2010The local banks performed well in 2010, notwithstanding the fierce
competition. The latest financial reports of some key players in the
banking sector (MCB, Giro, Orco Bank) show that most banks experi-
enced a positive growth in their yearly income (table 2.11). Girobank
posted an increase in net income after taxes of 35 percent, to an
amount of NAF 15.9 million. Orco Bank booked a net of tax profit of
NAF 10.7 million, a 65 percent increase.
Table 2.11 Overview of Key Financial Figures 2010/2009 of Selected Commercial Banks in Curaçao
(in 1000 NAF)
Banks Assets Assets Liabilities Liabilitie Net Income Net Income
in 2010 in 2009 in 2010 in 2009 after after
tax 2010 tax 2009
MCB Bank49 6,034,658 5,843,210 5,490,082 5,343,473 135,043 119,136
RBTT Bank50 4,084,889 4,099,207 3,703,433 3,697,784 21,632 45,624
Girobank51 1,237,387 1,377,620 1,119,406 1,274,397 15,928 11,784
Orco Bank52 593,761 606,652 537,456 561,043 10,696 6,495
Now that the banks’ investment opportunities in government bonds are
history, most banks opted to increase their loan portfolio by expanding
corporate and retail financing. The lower lending rates applied stimu-
lated consumers and businesses to take more loans. A significant
growth in personal loans, mortgages and commercial loans with all the
major banks can be seen. Girobank booked a 25-percent increase in
their loan portfolio53. MCB Bank experienced a 7-percent growth in
loans to corporate and retail customers54.
107
Chapter
2: Secto
ral D
evelo
pmen
ts
48 Source: MCB Annual Report 201049 MCB Annual Report 201050 RBTT Consolidated Highlights as of October 31, 201051 Girobank Annual Report 201052 Orcobank Consolidated Highlights 2010 Antilliaans Dagblad April 18, 201153 Source: Girobank Annual Report 2010.54 Source: MCB Annual Report 2010.
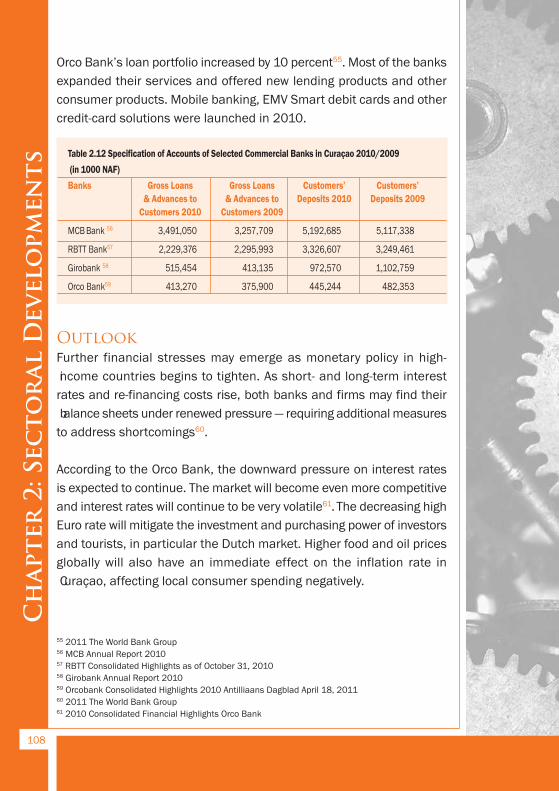
Orco Bank’s loan portfolio increased by 10 percent55. Most of the banks
expanded their services and offered new lending products and other
consumer products. Mobile banking, EMV Smart debit cards and other
credit-card solutions were launched in 2010.
Table 2.12 Specification of Accounts of Selected Commercial Banks in Curaçao 2010/2009
(in 1000 NAF)
Banks Gross Loans Gross Loans Customers’ Customers’
& Advances to & Advances to Deposits 2010 Deposits 2009
Customers 2010 Customers 2009
MCB Bank 56 3,491,050 3,257,709 5,192,685 5,117,338
RBTT Bank57 2,229,376 2,295,993 3,326,607 3,249,461
Girobank 58 515,454 413,135 972,570 1,102,759
Orco Bank59 413,270 375,900 445,244 482,353
OutlookFurther financial stresses may emerge as monetary policy in high-
income countries begins to tighten. As short- and long-term interest
rates and re-financing costs rise, both banks and firms may find their
balance sheets under renewed pressure — requiring additional measures
to address shortcomings60.
According to the Orco Bank, the downward pressure on interest rates
is expected to continue. The market will become even more competitive
and interest rates will continue to be very volatile61. The decreasing high
Euro rate will mitigate the investment and purchasing power of investors
and tourists, in particular the Dutch market. Higher food and oil prices
globally will also have an immediate effect on the inflation rate in
Curaçao, affecting local consumer spending negatively.
108
Chapter 2: Secto
ral Developm
ents
55 2011 The World Bank Group56 MCB Annual Report 201057 RBTT Consolidated Highlights as of October 31, 201058 Girobank Annual Report 201059 Orcobank Consolidated Highlights 2010 Antilliaans Dagblad April 18, 201160 2011 The World Bank Group61 2010 Consolidated Financial Highlights Orco Bank

2.6.2 International Financial and Business Services
IntroductionInternational financial services (IFS) include off-shore financial institu-
tions specialized in international banking, (tax) lawyers, insurance com-
panies, maritime services, fund management companies and those
specializing in security dealings. The business services sector includes
onshore companies engaging in advisory and consulting services to
clients on all aspects of business, legal affairs, financial management,
logistics and technological issues.
In Curaçao, the IFS sector consists of the following stakeholders:
· the Curaçao International Financial Services Association (CIFA)
· the Curaçao Bankers Association (CBA)
· the Central Bank of Curaçao and St. Maarten (CBCS)
· the Ministry of Finance
· the Tax Department
· the Netherlands Antilles Tax Advisors (VAB)
The IFS can be considered an important pillar of the island’s economy,
based on the number of people employed (approximately 1000 profes-
sionals are employed in the sector), the sector’s contribution to GDP
(according to the Central Bureau of the Statistics, on average, the
financial mediation sector62 contributes with 19% to the GDP), its
generation of foreign exchange earnings and its contribution to the
public treasury.
The island’s inclusion on the OECD white list contributes to the sector’s
good reputation. The OECD is a leading international organization that
acts as the established order in the international financial world. Their
rankings are respected throughout the world and often determine the
rankings of jurisdictions and play an important role in the ratification
109
Chapter
2: Secto
ral D
evelo
pmen
ts
62 The financial mediation sector consists of the domestic banks, insurance companies, pension
funds, international financial services and other financial services
of treaties. The sector is furthermore FATF63, EU and AML64 compliant.
The local government is aware of the importance of the IFS sector to
the local economy and therefore efforts are being made to maintain
the acquired position on the OECD white list. It is moreover worth men-
tioning that the (13) TIEAs65 signed by the Government of the former
Netherlands Antilles are also applicable to the new Country of Curaçao.
At the time of this writing, the government is taking concrete actions to
convince the authorities of Brazil that their perception of the local IFS
sector is based on erroneous facts. Brazil seems to have blacklisted
Curaçao based on outdated information. The government’s aim is to
sign a TIEA with Brazil on short term.
The government supports the international laws and guidelines on
money laundering and terrorism financing. Therefore, pursuant to
Recommendation number 26 of the Financial Action Task Force (FATF),
the government established an elaborative system to scrutinize external
and internal financial flows, the Financial Intelligence Unit or, as it is
called in Curaçao, the Unusual Transactions Reporting Center (MOT, by
its Dutch acronym)66. All banks, both offshore and onshore, including
the Central Bank, trust companies and investment institutions, credit
card companies, life insurance companies, casino’s, money remittance
companies and customs authorities have the obligation to report
unusual transactions to the MOT.
Some non-financial businesses and professionals, such as lawyers, no-
tary offices, accountants, tax consultants, jewelers, real-estate agents,
car dealerships, administrative offices and insurance companies—both
life and non-life—also have a reporting obligation.
It is important to mention that the international financial crisis had little
impact on the local IFS sector. This can be attributed to the strict regu-
lation and supervision on the sector carried out by the Central Bank.
110
Chapter 2: Secto
ral Developm
ents
63 Financial Action Taskforce64 Anti Money Laundering65Tax Information Exchange Agreements66 Meldpunt Ongebruikelijke Transacties

According to the Central Bank of Curaçao and St. Maarten67, the IFS
and the domestic banks were the main contributors to the slight
economic expansion in 2010.
Development in 2010On October 10, 2010, Curaçao became an autonomous country within
the Dutch Kingdom. According to the constitutional agreements, Curaçao
and St. Maarten form a monetary union with a common Central Bank and
a common currency. This implies that the Central Bank of Curaçao and
St. Maarten is in charge of the monetary and financial supervision of
Curaçao and St. Maarten. Curaçao and St. Maarten need therefore to
harmonize legislation in the monetary area, as well as in the areas of
finance and financial and integrity supervision68.
OutlookAccording to the CIFA, an image shift is needed, from tax haven to in-
vestment haven. The CIFA’s ultimate aim is to bring Curaçao into the
world’s top five financial centers in the near future. In order to achieve
this goal, the government of Curaçao must remain aware of the impor-
tance of the financial sector and take concrete actions to formulate
policy for the sector, create more incentives to attract international
offshore banks and investors, expand the current number of tax treaties
by signing more treaties with other countries, sign more double tax
treaties, give priority to making and implementing the corresponding
laws, make the labor market more flexible by making the immigration
laws more flexible, implement tax reforms, reduce or eliminate red tape,
develop a strong and professional labor force and shorten the time it
takes to apply for establishment permits.
Expectations for 2011 are high. The CIFA’s members are optimistic
about the rest of the year. The Dutch Caribbean Securities Exchange
111
Chapter
2: Secto
ral D
evelo
pmen
ts
67 Press release 2011-00168 Press release 2011-001.
(DCSX) was officially launched in January 2011, marking the beginning
of further developments in the local capital market.
Moreover, in 2011, the government started taking initiative actions to
sign a TIEA with Brazilian authorities. This shows that the government
is aware of the need to expand the current list of tax treaties and com-
mitted to doing so. It is expected that more negotiations with other
countries will soon follow.
The FAFT evaluation took place ending of August/beginning of Septem-
ber 2011 and the financial sector is pending for the results of the
evaluation. A good evaluation by the FAFT is essential to obtain an
outstanding reputation and positioning on the OECD white list.
Concluding, it is important to mention that the proposed 80/20 labor
law has been approved. The CIFA is somewhat concerned about this
labor law due to the shortage of professionals for some specific
positions on the island.
112
Chapter 2: Secto
ral Developm
ents
2.6.3 Insurance Companies
IntroductionThe insurance sector in Curaçao consists of life insurance companies,
non-life insurance companies, funeral-service insurance companies,
captives (life and non-life) and professional reinsurance companies.
Captive insurance companies insure risks which exclusively or predom-
inantly result from the execution of a business or profession outside of
Curaçao (and St. Maarten, or the Netherlands Antilles up to October
10, 2010) by shareholders or members of enterprises combined in a
group or of participants in a co-operative relationship69. Professional
reinsurance companies conduct business exclusively as reinsurers. The
majority of life and non-life insurance companies in Curaçao are either
subsidiaries or branches of foreign insurance companies. However,
independent local insurance companies are found predominantly
among non-life insurance companies.
International Developments in 2010The year 2010 could be characterized as one of many catastrophes,
both natural and man-made. These resulted in economic losses
(damages) of almost USD 218 billion, but total costs to insurance
companies were calculated at approximately USD 43 billion.
In terms of insured losses, 2010 ranks as the seventh highest year
since 1970. Compared to 2009, insured losses were over 60 percent
higher in 2010, but still below insured losses in 2005, the year in which
losses soared after hurricane Katrina, Wilma and Rita struck the USA70.
Insured losses are depicted per region in figure 2.4. In 2010, North
America ranked as the region with the highest insured losses, with over
USD 15 billion, followed by Latin America and the Caribbean with al-
most USD 9 billion each, and Europe with over USD 6 billion. Though
Asia experienced the highest economic loss compared to other regions
in 2010—almost USD 75 billion—insured losses amounted to approxi-
113
Chapter
2: Secto
ral D
evelo
pmen
ts
69 Source: Central Bank of Curaçao and St. Maarten70 Source: Swiss Re, Sigma, Natural Catastrophes and Man-Made Disasters in 2010
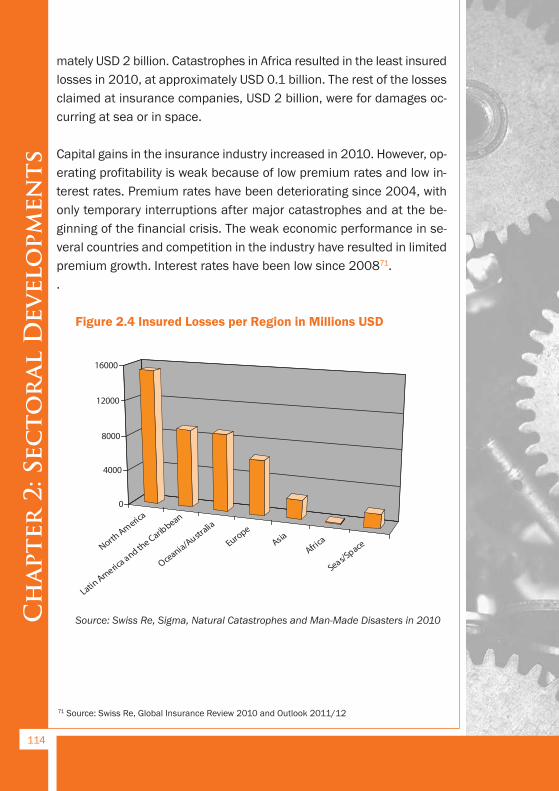
mately USD 2 billion. Catastrophes in Africa resulted in the least insured
losses in 2010, at approximately USD 0.1 billion. The rest of the losses
claimed at insurance companies, USD 2 billion, were for damages oc-
curring at sea or in space.
Capital gains in the insurance industry increased in 2010. However, op-
erating profitability is weak because of low premium rates and low in-
terest rates. Premium rates have been deteriorating since 2004, with
only temporary interruptions after major catastrophes and at the be-
ginning of the financial crisis. The weak economic performance in se-
veral countries and competition in the industry have resulted in limited
premium growth. Interest rates have been low since 200871.
.
Figure 2.4 Insured Losses per Region in Millions USD
Source: Swiss Re, Sigma, Natural Catastrophes and Man-Made Disasters in 2010
114
Chapter 2: Secto
ral Developm
ents
71 Source: Swiss Re, Global Insurance Review 2010 and Outlook 2011/12
0
10
20
30
40
50
60
70
80
90
100
Jan Feb Mar Apr May Jun July Aug Sept Oct Nov Dec Month
$ pe
r bar
rel
0
50
100
150
200
250
300
2000 2001 2002 2003 2004 2005 2006 2007 2008 2009 2010
calls
0
50,000
100,000
150,000
200,000
250,000
300,000
350,000
400,000
450,000
pax
calls
pax
2005
2006
2007
2008
2009
2010
2011
65
70
75
80
85
90
Average Occupancy Rate
Occupancy Rate
North America
Latin America
and the Carib
bean
Oceania/Australia
EuropeAsia
Africa
Seas/Space
0
4000
8000
12000
16000
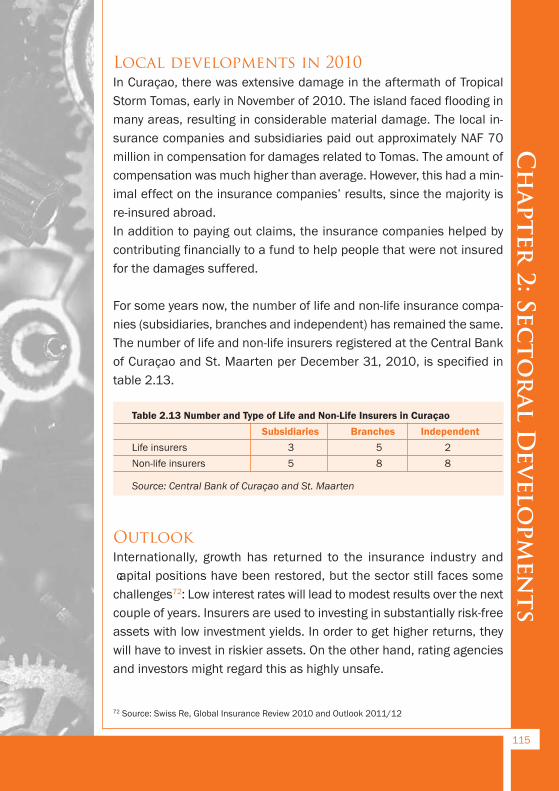
Local developments in 2010In Curaçao, there was extensive damage in the aftermath of Tropical
Storm Tomas, early in November of 2010. The island faced flooding in
many areas, resulting in considerable material damage. The local in-
surance companies and subsidiaries paid out approximately NAF 70
million in compensation for damages related to Tomas. The amount of
compensation was much higher than average. However, this had a min-
imal effect on the insurance companies’ results, since the majority is
re-insured abroad.
In addition to paying out claims, the insurance companies helped by
contributing financially to a fund to help people that were not insured
for the damages suffered.
For some years now, the number of life and non-life insurance compa-
nies (subsidiaries, branches and independent) has remained the same.
The number of life and non-life insurers registered at the Central Bank
of Curaçao and St. Maarten per December 31, 2010, is specified in
table 2.13.
Table 2.13 Number and Type of Life and Non-Life Insurers in Curaçao
Subsidiaries Branches Independent
Life insurers 3 5 2
Non-life insurers 5 8 8
Source: Central Bank of Curaçao and St. Maarten
OutlookInternationally, growth has returned to the insurance industry and
capital positions have been restored, but the sector still faces some
challenges72: Low interest rates will lead to modest results over the next
couple of years. Insurers are used to investing in substantially risk-free
assets with low investment yields. In order to get higher returns, they
will have to invest in riskier assets. On the other hand, rating agencies
and investors might regard this as highly unsafe.
115
Chapter
2: Secto
ral D
evelo
pmen
ts
72 Source: Swiss Re, Global Insurance Review 2010 and Outlook 2011/12
Many regional insurers face the issue of falling credit ratings for
government bonds. The bonds of these OECD member countries, which
had previously been reviewed as sound investments, are now considered
junk bunds. This might lead to a rethinking of the risk-free-asset concept
that has been an important pillar of insurance assets in most regulatory
jurisdictions.
Moreover, increased regulatory capital requirements for riskier assets
and products with guarantees will affect savings and pension products,
which are the main pillar of the life industry’s earnings. Insurers are
responding by designing new products and re-pricing guarantees
embedded in products.
Curaçao also faces the issue of falling interest rates. Because of the
partial repayment of the national debt by the Netherlands, banks and
insurance companies have a liquidity surplus. Some life insurances are
based on higher yields and, in the current situation, insurance compa-
nies facing this problem are losing money.
Furthermore, insurance companies are expecting to lose more market
share as a consequence of the anticipated introduction of a general
healthcare insurance. The general healthcare insurance is expected to
make the social insurance (SVB) accessible to more people, since the
maximum salary to be eligible for this insurance will be raised. As a con-
sequence, fewer people will need a private insurance.
Moreover, on the BES islands, insurance companies have already lost
a piece of the market because of the new constitutional structure on
these islands.
116
Chapter 2: Secto
ral Developm
ents
2.7 HEALTHCARE
IntroductionIn Curaçao, total healthcare spending has been rising for the last couple
of years and this requires measures to achieve at least a manageable
system for the future. For example, the total medical costs of the Social
Insurance Bank increased from NAF 91.8 million in 2005 to NAF 123.2
million in 2008. Healthcare institutions are also faced with higher costs.
For example, in 2010 the total costs of the three hospitals, namely the
Dr. J. Taams Clinic, the St. Elisabeth Hospital and the Antillean Adventist
Hospital, were NAF 181.5 million. For the year 2011, these three hos-
pitals expect an increase in their costs of between NAF 6.2 million and
NAF 10.5 million73.
A recent actuarial calculation by the Social Insurance Bank (SVB) shows
that, if policies remain unchanged, in the next 20 years large deficits
will emerge within the collective National Health Services. Intervention
is therefore inevitable. The introduction of a basic health insurance, in-
cluding increased contributions, is one of the most essential measures
to manage the risk of unpayable healthcare in the future.
The government’s budgetThe budget of the government of Curaçao for 2011 shows an amount
of NAF 312.4 million set aside for healthcare, compared to NAF 297.6
million in 2010. The difference in the total amounts budgeted for 2010
and 2011 is mainly the increase of NAF 11.8 million in the contribution
to the fund for healthcare costs of retired civil servants (FZOG). Almost
half of the total healthcare budget (namely NAF 146.3 million) is allocated
to the Health Cost Bureau (BZV) for the contribution for Pro- Pauper (PP)
patients74. According to the Ministry of Finance, healthcare is one of the
largest budgetary risks because of its share in the total public budget and
external uncontrollable factors such as an ageing population, the increase
of the frequency of chronic disorders, the high costs of the technology, a
117
Chapter
2: Secto
ral D
evelo
pmen
ts
73 Source: Annual report and budgets of the three hospitals74 Pro-Pauper or PP patients receive free health care from the government.
rising price index and the rise in the costs of the different healthcare
institutions75.
Coverage measures and current projectsPartly at the request of the Board of Financial Supervision (College
Toezicht), a number of coverage measures were determined in 2009
which should lead to a balanced public healthcare budget in the future.
The most important measures are on the cost of medications, the
restructuring of cure, the Integrated Medical Specialists Company and
a New Remuneration Structure for Public Healthcare. These measures
should result in a structural saving of approximately NAF 25 million,
the savings from the Integrated Medical Specialists Company (GMSB).
The savings from the GMSB will be used directly in healthcare.
Cost of medications The cost of pharmaceutical care in Curaçao has been roughly estimated
at NAF 130 million per year. Two measures have been identified that
should result in savings on the government’s budget. The first one is
the implementation of the Medicine Reimbursement System Vergoe -
dingssysteem, GVS). GVS is a method to regulate the prices of medica-
tion. The principle behind the GVS is to create groups of drugs, called
clusters, that have the same therapeutic effect and are thus
interchangeable. Such a cluster, “antacids” for instance, includes brand
names (spécialités) and generics (drugs for which the patent has
expired) at different prices. An average fixed price is determined for all
the medicines in that cluster using a mathematical model. The SVB and
the BZV will only pay the maximum average price of the drugs within a
cluster. Drugs that are more expensive may still be sold, but the insured
will have to pay the difference between the actual price and the average
price.
The introduction of the GVS was delayed several times, for various
reasons.
118
Chapter 2: Secto
ral Developm
ents
75 Source: Ministry of Finance
In 2010, the government decided to postpone the introduction and to
ask the SVB and the Health Cost Bureau (BZV) to present an alternative
proposal with comparable savings. In July 2010, the Island Council of
Curaçao accepted SVB and BZV’s alternative proposal, but its financial
effects have not been adequately calculated.
The second measure to reduce the costs of medications is the intro-
duction of a fixed prescription fee (Receptregelvergoeding, RRV). This
system requires that pharmacies be paid a fixed fee or tariff for the
service of providing medication to patients, instead of a margin above
the purchase price. This way, the pharmacist has no financial interest
in delivering expensive drugs and therefore has a more unbiased in
the choice of drugs. The introduction of the RRV was also postponed
several times. In August 2010, the Island Council of Curaçao decided
to postpone the RRV’s introduction until the results of the objective
study “Research Standard Cost Pharmacies” (onderzoek normkosten
apotheekhouders, ONA) becomes available. ONA focuses primarily on
the method to determine the amount of the fixed prescription fee, but
also contains recommendations about managing costs for the entire
drugs chain. At this time, the ONA study has been completed and by
the Council of Ministers.
Restructuring of CureRestructuring of cure is another important coverage measure and of
the following components:
a. Clearing out the PP-base. At the end of 2010, the number of PP-
insurance card holders had already decreased by 1,500 persons
compared to 2009.
b. Providing regulation. A policy regulating the establishment of
medical specialists and other facilities is essential to manage the
costs and should be in line with the new general healthcare insur-
ance and the New Remuneration Structure for Public Healthcare
(NBG). On the supply side, there is an estimate of the number of
individual healthcare providers up to 2016. An analysis needs to be
done to get an estimate for the demand side, and with that purpose
a committee will be established soon.
119
Chapter
2: Secto
ral D
evelo
pmen
ts
c. Introducing a basic healthcare insurance for the BZV and SVB
insured. The BZV and SVB have already handed in their advice to
both the Minister of Healthcare and the Minister of Finance. The
aim is to implement the basic health insurance in 2012.
d. Efficiencies through the integration of the BZV and the SVB. This
merger will result in economies of scale and cost reductions through
better coherency and efficiency in tariffs. With the new basic health
insurance and the implementation of the NBG, the work processes
will cost less time.
Introduction of the Integrated Medical Specialists Company (GMSB) This concept forms the basic principle behind the new hospital. GMSB
implies that hospital care and care provided by medical specialists are
integrated and that the current structure of numerous private clinics,
the so-called “ofisinas”, will disappear. Besides a reduction in costs,
GMSB will stimulate cooperation between the specialists, which is
expected to result in a better quality of healthcare.
Prior to the construction of the new hospital, the government will start the
GMSB concept by renovating the existing policlinic at the St. Elisabeth
Hospital and building a new policlinic (poli nobo76 ) to accommodate some
specialists. This should lead to a faster and smoother adoption of GMSB
in the new hospital. The total investment for the “Poli Nobo” is estimated
at NAF 15 million. The renovation of the current policlinic, with facilities to
accommodate 20 specialists, is ready. It was originally the intention to
demolish the St. Thomas College and construct a new temporary policlinic
at that location. However, at this moment the definite location of the new
temporary policlinic is still being discussed.
A consultant was contracted to push the project for the construction of
the new hospital forward. In June 2011, the government took some
important decisions and announced the location of the new hospital,
namely a piece of land next to the University of Curaçao (formerly the
UNA)77.
120
Chapter 2: Secto
ral Developm
ents
76 This implies renovating the existing policlinic, demolishing the St. Thomas College and constructing
a new, temporary policlinic at the present location of the St. Thomas College 77 More information about the new hospital and a description of all the important decisions is avail-
able at http://www.dewegnaaronsnieuweziekenhuis.org/

The tender process for the construction is meant to start in January
2012.
Introduction of the New Remuneration Structurefor Public Health (NBG) A precondition for the GMSB is the revision and modernization of the
tariff structure for specialists. NBG makes a better cost containment
possible. The new tariff structure will consist of three components
which together make up the remuneration. The care provider receives
(a share of) one or more components according to the degree in which
conditions are met. The three components are a basic component, an
organization component (based on a rating of the specialist’s office,
level of expertise and services rendered) and a quality-and-production
component. The size and proportions of the different components vary
for each professional.
The aim was to start with the implementation of the NBG as of Septem-
ber 1, 2011. However, the medical specialists opposed to some parts
of NBG and its implementation. In April 2011, the Prime Minister put
the project temporarily on hold to create room for proper discussions
about this topic.
Other current developmentsBesides the above-mentioned policy measures to achieve an affordable,
efficient and high-quality healthcare system, there are some other
develop ments that took or will take place in the healthcare sector:
Ÿ The government issued a permit to the Pain Clinic to open a medical
center offering 24-hour pain control.
Ÿ One hospital invested in medical devices to start offering treatments
for sleep problems, e.g. sleep apnea. This means that fewer patients
will need to be sent abroad, thus reducing costs.
Ÿ An organization will start offering specialized heart-and-lung revali-
dation courses. The twice-a-week courses last for 12 weeks and a
multidisciplinary team of five professionals will support the partici-
pants.
121
Chapter
2: Secto
ral D
evelo
pmen
ts
Ÿ For the last couple of years, more and more healthcare institutions
have been having financial problems, not being able to cover all their
costs. A number of them submitted a request for a tariff increase to
the Ministry of Economic Development. At the moment, these are
being evaluated.
122
Chapter 2: Secto
ral Developm
ents
3. ENHANCING BUSINESS CLIMATE
Creating a good business climate is one of the measures to improve
Curaçao’s economic structure. A good business climate is crucial for
any country, especially if that country wants to stimulate entrepreneur-
ship and attract investors.
The investment climate in Curaçao is in need of improvement and, as
a result, foreign investments have slowed down considerably in recent
years.
The requirements for sustainable economic development according to
the Social Economic Initiative (SEI) include:
- Sufficient capital availability at acceptable rates;
- A good balance between supply and demand on the capital and
labor market;
- Cultivating trust from investors by transparent and consistent
handling on the part of the government;
- Avoiding unnecessary administrative burdens and red tape;
- Promoting Curaçao internationally as a location for doing business.
The government has embarked on a few projects to improve and/or
make the economic structure more competitive and stimulate eco-
nomic development. Some important projects include:
· Red Tape Reduction within the Economic Column
· Centralization of Economic Permits
· Updating the Business Establishment Policy
· Putting a call centre for permits into operation
· Developing an SME (Small and Medium Enterprise) and Entrepre-
neurship Policy
· Promoting the viability of SMEs
· Restructuring the tax regime
· Establishing a Curaçao Economic Development Board, a Regulatory
board and a Competition Authority.
123
Chapter
3: Enhan
cing Busin
ess Clim
ate
The Ministry of Economic Development aims to complete three of these
projects soon, specifically: Developing an SME and Entrepreneurship
Policy, Updating the Business Establishment Policy and Centralizing
Economic Permits.
Developing an SME and EntrepreneurshipPolicy for the next four yearsOne of the Ministry of Economic Development’s focal points for the
years 2011-2014, derived from the current government’s strategic
points and themes, is entrepreneurship development. Improved
government services to businessmen (e.g. permits) is of great impor-
tance in this perspective, as is the improvement of the quality of
businesses on the island (business sophistication), so businesses can
increase productivity and competitiveness, grow, innovate, export,
internationalize, form alliances with and/or deliver goods and services
to international companies.
Micro, small and medium-sized enterprises comprise more than 95 per-
cent of businesses on the island of Curaçao. They are an important
share of the business community, generating jobs (± 56% in 2006,
CBS), income, export (foreign exchange), economic growth (invest-
ments) and innovations. No wonder they are called the backbone of
our economy.
In order to get the most out of these enterprises, it is important to have
an SME and Entrepreneurship Policy in place. With the formulation of
an SME and Entrepreneurship policy, the Ministry aims at increasing
the chances of small entrepreneurs to succeed, measured by the net
number of new companies, promotion of employment, the increase of
added value of the SMEs as a sector, and investments by SMEs.
Requirements for a successful SME and Entrepreneurship Policy
include entrepreneurship development, performance-oriented subsi-
dies and reinforcement of the SME structure.
124
Chapter 3: Enhan
cing Business Climate

The SME and Entrepreneurship Policy vision is directed towards market
capitalization, facilitation and promotion support in general to new and
existing businesses, activating entrepreneurship for the general com-
munity (young and old), promoting and supporting entrepreneurs who
want to grow through innovation and encouraging and supporting en-
trepreneurs who want to grow by being export-oriented, thus contribut-
ing to the ideal of Curaçao as hub-nation in the Caribbean.
The policy should stimulate entrepreneurship throughout the education
system, have the proper balance between startup requirements and
support given to enterprises, and include performance and impact
measurement (productivity) of SMEs.
Some of the proposed adjustments include a Small Business Administra-
tion Unit within the Ministry which would be responsible for all executive
and coordinating SME-related functions of the government, the develop-
ment of an organized process for scouting, mentoring, training, consulting
and coaching to SMEs, and a single new, simplified incentive scheme for
both starting and existing businesses.
The Ministry aims to achieve this by promoting active participation
(combined efforts) by relevant interest groups.
This project is a SEI project worth a total of NAF 100,000, sponsored
by Dutch funds and the government of Curaçao. The policy has been
completed and approved by the Council and the Ministry will start with
the execution of this policy in 2012. The timeframe for the policy is four
years, which should suffice for the activation of existing SME and start-
ing SMEs, but a longer policy horizon is desired when it comes to the
development of entrepreneurship, which involves the new generation
of potential entrepreneurs on the island, including those that are
currently still in school.
125
Chapter
3: Enhan
cing Busin
ess Clim
ate
Updating the Business Establishment PolicyThe business establishment law dates from 1946. The law was initially
created to protect local trade on the Islands of the Netherlands Antilles.
The current business establishment tool consists of the business estab-
lishment permit and the director’s permit. The business-establishment
permit deals with the location of the establishment and the nature of the
enterprise, while the director’s permit determines whether the concerning
position can be filled by a foreigner. Hence, basically, the business esta b-
lishment regulation is being used as a tool for spatial development and
foreign policy, instead of economic policy.
The business establishment policy should focus on economic develop-
ment with equal opportunities for all entrepreneurs. Undesirable acti v-
ities and/or persons (danger to the public order, criminal or doubtful
background) should be kept outside. The establishment of foreign-
exchange generating, export-oriented and employment-creating activi-
ties should be stimulated. The policy has to be efficient and must be
enforced.
The efficiency of the current business establishment policy is question-
able, considering the relatively long application processing time, red
tape (intricate and unnecessary measures or procedures) lack of trans-
parency, deficient alignment with other permits, and inadequate service
to clients.
Moreover, due to lack of supervision, the establishment permit policy
is not being enforced properly.
The Ministry of Economic Development wants to create an updated busi-
ness establishment policy and a coherent legislation to stimulate activity
in Curaçao in connection with optimal and sustainable economic growth.
126
Chapter 3: Enhan
cing Business Climate
Much attention is given to reducing the inefficiencies perceived by on-
and off-shore clients, specific sectors, notary offices, small interme -
diation offices and the individual investor or entrepreneur.
This project is a SEI project. The legislation has been prepared and is
reviewed by the legal department of the public administration. Currently
it is awaiting approval by the Council of Ministers, which will be advised
by the Social and Economic Council (SER) and the Advisory Council. In
the mean time, a new guideline has been introduced to facilitate the
process of obtaining a business permit.
Centralization of Economic PermitsCurrently, the issuance of economic permits is fragmented among
several government agencies including the Ministry of Economic
Develop ment, the Sector Regulatory and Legal Affairs, which falls under
the Ministry of General Affairs, and the Special Laws Bureau of the
Curaçao Police Force. This means that the related procedures for both
local and foreign (potential) investors can be perceived as a somewhat
unclear and cumbersome experience. This lack of transparency and
red tape can even scare off (potential) entrepreneurs.
Creating clarity regarding the economic licensing process is a simple
measure to facilitate and stimulate local and foreign investors and is
therefore of great importance for the economic development of the
island of Curaçao.
The new government entity will include a “one-stop window service”
where the whole permit process can be facilitated. This has a series of
advantages, such as improved customer service, uniformity, trans-
parency, centralization of information and faster processing.
This “one-stop window” refers to the front-office. The process of gran t-
ing a permit (authorization) and assessing the content (back-office) will
remain the responsibility of the concerning government agencies.
127
Chapter
3: Enhan
cing Busin
ess Clim
ate
The Ministry of Economic Development has started working towards an
implementation plan for the Centralization of Economic Permits. This
implies that the back office for business-establishment and director
permits, e-Zone permits (Ministry of Economic Development), permits
for trade in food and beverages and permits for offering accommoda-
tions (Sector Regulatory and Legal Affairs under General Affairs) as well
as permits for snack bars, mobile canteens and stands (Special Laws
Bureau of the Curaçao Police Force) will be concentrated in one point,
taking into consideration staff, organization, finance, information and
operations.
With the centralization of the back office for economic licenses, the
Ministry of Economic Development expects to achieve more efficiency
in the processing of permits, place core activities where they belong,
attain effectiveness, more efficient monitoring and more efficient su-
pervision by the relevant authorities (including Economic Investigation).
This project is financed with government funds. The implementation
plan has been completed and has been sent to the Human Resources
department of the public administration for advice. The Ministry of Eco-
nomic Development expects to start with a tendering process for the
administrative operations in the first quarter of 2012.
ConcludingWith these policies, laws and plans in place, the Ministry will be on its
way to enhance the business climate on Curaçao. Of course, the effects
of these measures will depend on their implementation and on their
continuous monitoring and evaluation. Moreover, the Ministry has to
start, carry on and promote projects to enhance the business climate,
as well as other projects it has committed itself to, in order to warrant
groundbreaking improvements in our economic structure for the period
to come.
128
Chapter 3: Enhan
cing Business Climate
Appendix I Methodology
The different sections were assigned to policy advisors at the Ministry
of Economic Development based on their expertise on particular eco-
nomic sectors or topics.
The articles are based on:
• Information provided by agencies such as the Central Bureau of Sta-
tistics, the Central Bank of the Netherlands Antilles, the Chamber
of Commerce, the Curaçao Tourist Board, etc.
• Information provided by other government departments
• Interviews, discussions and surveys among stakeholders
• Information provided by international organizations such as the
ECLAC, the IMF, the OECD, the UN, the World Bank etc.
Combining this information with their own knowledge, the authors for-
mulated their analysis of specific economic sectors or topics as neu-
trally and objectively as possible. Information gained through interviews
with stakeholders was used with caution, keeping in mind their poten-
tial subjectivity. The draft articles were discussed with the stakeholders
to avoid any possible misinterpretation of the information provided.
The quantitative macroeconomic calculations and projections were
carried out with the aid of Curalyse, a macroeconomic model for
Curaçao. The Curalyse model consists of two parts: a dataset with the
national accounts (Government, households, businesses and “rest of
the world”), monetary figures, labor market figures, balance of
payments and behavioral and exogenous variables (such as interna-
tional inflation and government policy measures). The Curalyse model
can be used to analyze past economic performance, make projections
of selected variables and calculate the effect of policy measures by the
government as well as actions by labor organizations or the business
community.
Another model used for this publication was Turistika. The Turistika
model is designed especially for the tourism sector and can be used to
129
APPEN
DIC
ES

calculate the tourist industry’s impact on various economic variables.
130
APP
ENDIC
ES
Appendix II List of Table and Figures
Chapter 1
Table 1.1 Macroeconomic indicators 2010
Table 1.2 Macroeconomic outlook for 2011
Table 1.3 Macroeconomic impact scenarios 2012
Table 1.4 Dismissal Requests
Table 1.5 Mobility in the search for employment
Table 1.6 Development of the population
Table 1.7 Financial report of the Island Government of
Curaçao, January 1 to October 10, 2010
Table 1.8 Current and proposed income taxation
Table 1.9 Curaçao's Balance of Payment
Table 1.10 The contribution of the local government in the
economic SEI projects
Chapter 2
Figure 2.1 International crude-oil price development, 2010
Figure 2.2 Cruise passengers 2000-2010
Figure 2.3 Average occupancy rate, 2005-2011*
Figure 2.4 Insured losses per region in millions USD
Table 2.1 Overview of sales volumes 2010 compared to
2009
Table 2.2 Indices of raw materials used in the construction
sector
Table 2.3 Established service e-zones
Table 2.4 Facts about the goods-trading free-zones
Table 2.5 Visitors to free-zone Koningsplein, 2008-2011
Table 2.6 Passenger traffic at Curaçao International Airport
Table 2.7 Monthly cargo and fuel stops at Curaçao Interna-
tional Airport
Table 2.8 Number of calls by type of ship
Table 2.9 Freight cargo
Table 2.10 Developments in main markets stay-over tourism,
2009-2011
131
APPEN
DIC
ES

Table 2.11 Overview of key financial figures 2009-2010 of se-
lected commercial banks in Curaçao
Table 2.12 Specification of accounts of selected commercial
banks in Curaçao, 2009-2010
Table 2.13 Number and type of life and non-life insurers Cu-
raçao
132
APP
ENDIC
ES

Appendix III List of Abbreviations
AAV Antillean contractors' association
ADECK Curaçao's association of small and medium entrepreneurs
AIA American Institute of Architects
ALM Former Antillean aviation company
AML Anti Money Laundering
AOV Social pension fund managed by SVB
APNA Pension fund for civil servants
ASEAN Association of Southeast Asian Nations
ASINA Association of Industrialists of the Netherlands Antilles
BES New Dutch municipalities in the Caribbean consisting of the
islands Bonaire, St. Eustatius and Saba
BOO Build Own and Operate
BOP Balance of Payments
BRK Regulation for fiscal arrangements between the countries of
the Dutch Kingdom
BT&P Bureau Telecommunication & Post: regulatory agent for
telecommunications, post and utilities in Curaçao
BZV Health insurance agency for civil servants
CAH Curaçao Airport Holding
CAI Curaçao Airport Investment
CAP Curaçao Airport Partners
CBA Curaçao Bankers Association
CBCS Central Bank of Curaçao and St. Maarten
CBS Central Bureau of Statistics
CD Certificates of Deposit
CDM Curaçao Dry-dock Company
CEO Chief Executive Operation
Cft Board of Financial Supervision
CHATA Curaçao Hospitality and Tourism Association
CIFA Curaçao International Financial Services Association
CIS Commonwealth and Independent States
CPA Curaçao Ports Authorities
CPS Curaçao Port Services
133
APPEN
DIC
ES

CTB Curaçao Tourist Board
CTEX Curaçao Technology Exchange
CTO Caribbean Tourism Organization
CURINDE Curaçao Industrial & International Trade Development
Company
DAE Dutch Antillean Express
DCSX Dutch Caribbean Securities Exchange
DirAZ Former Netherlands Antilles' directorate of labor affairs
DNB Dutch Central Bank
DROV Government department charged with spatial and housing
development
DWI Former Curaçao's department of social affairs
ECB European Central Bank
ECLAC Economic Commission for Latin America and the Caribbean
EDF European Development Fund
EIA Energy Information Administration
EIU Economist Intelligence Unit
EU European Union
FAO Food and Agriculture Organization
FATF Financial Action Taskforce
FZOG Fund to cover health costs of retired civil servants
GDP Gross Domestic Product
GMSB Integrated Medical Specialists Company
GOL Brazilian aviation company
GVS Medicine reimbursement system
HASCO Hato Assets Company N.V.
IATA International Air Transport Association
IDC Chilean airport operator that maintains and exploits airports
and airport related businesses in South America
IFS International Financial Services
IMF International Monetary Fund
ISO International Organization for Standardization
KLM Royal Dutch Airlines
KTK Curaçao Tugboat Company
KvK Chamber of Commerce
LPG Liquefied Petroleum Gas
134
APP
ENDIC
ES
MCB Maduro and Curiel's Bank
MENA Middle East and North Africa
MOT Unusual Transactions Reporting
MVA Manufacturing Value Added
NAF Netherlands Antilles Guilder
NBG New Remuneration Structure for Public Healthcare
OECD Organization for Economic Co-operation and
Development
ONA Research Standard Cost Pharmacies
OPEC Organization of Petroleum Exporting Countries
PAWA Dominican Republic airline
PdVSA Petroleos de Venezuela S.A.
PP Pro-Pauper
RBTT Royal Bank of Trinidad & Tobago
RdK Curaçao Refinery
RRV Fixed prescription fee for pharmacies
SEI Social Economic Initiative
SME Small and Medium Entrepreneurship
SMOC Foundation advocating a cleaner environment in
Curaçao
SVB Social Insurance Bank
TEU Twenty-foot Equivalent Unit
TIEA Tax Information Exchange Agreement
UN United Nations
UNA Former University of the Netherlands Antilles in
Curaçao
UNIDO United Nations Industrial Development Organization
UNWTO World Tourism Barometer
USONA Executive entity of the Foundation that manages the Devel-
opment Fund of the former Netherlands Antilles
VAB Netherlands Antilles Tax Advisors
VBC Association of businesses in Curaçao
WTI West Texas Intermediate
135
APPEN
DIC
ES

Economic Development Ministry of
PublisherGovernment of Curaçao
For further information
Ministry of Economic Development
Molenplein z/n
Curaçao
Phone: (+5999) 462 14 44
Fax: (+5999) 462 75 90
E-mail: [email protected]
Web: http://www.gobiernu.an
English language correctionA Translation Studio
Design and Layout Dajo Graphics N.V.
PrintingHi Printing N.V.
Material from this publication may be reproduced without prior
permission, provided that the source is acknowledged
136