Cue Utilization in Communication of Emotion in Music Performance: Relating Performance...
16
Journal of Experimental Psychology: Copyright 2000 by the American Psychological Association, Inc. Human Perception and Performance 0096-1523/00/$5.00 IX)I: 10.1037//0096-1523.26.6.1797 2000, Vol. 26, No. 6, 1797-1813 Cue Utilization in Communication of Emotion in Music Performance: Relating Performance to Perception Patrik N. Juslin Uppsala University This study describes the utilization of acoustic cues in communication of emotions in music performance. Three professional guitarists were asked to perform 3 short melodies to communicate anger, sadness, happiness, and fear to listeners. The resulting performances were analyzed with respect to 5 acoustic cues and judged by 30 listeners on adjective scales. Multiple regression analysis was applied to the relation- ships between (a) the performer's intention and the cues and (b) the listeners' judgments and the cues. The analyses of performers and listeners were related using C. J. Hm'~h, K. R. Hammond, and J. L. Hursch's (1964) lens model equation. The results indicated that (a) performers were successful at communicating emotions to listeners, (b) performers' cue utilization was well matched to listeners' cue utilization, and (c) cue utilization was more consistent across different melodies than across different performers. Because of the redundancy of the cues, 2 performers could communicate equally well despite differences in cue utilization. Both biographical accounts (e.g., Blum, 1977; Kennedy, 1990; Schumacher, 1995) and empirical studies (e.g., Persson, 1995; Persson, Pratt, & Robson, 1996; Woody, in press) suggest that music performers often intend to convey emotions to listeners. Can performers communicate emotions to listeners? What means do they use to accomplish this task? These are issues of paramount importance to musical behavior. Unfortunately, knowledge is still scarce on these matters. One reason for this may be that researchers lack the necessary tools to capture the complete communicative process. The chief objec- tive of this article is to describe how performers communicate emotions to listeners. In addition, I try to illustrate how aspects of performance and perception can be quantitatively related to each other. First, I outline a theoretical framework for studies of emotional communication in music performance (see also Jus- lin, in press-b). Then, I present data from acoustic analyses and listeners' judgments of 72 performances. Finally, I discuss the implications of these results for future research on music performance. Studies of Music Performance Studies of music performance have a long history (Gabrielsson, 1999). One of the main findings from this research is that the actual performance of a piece of music practically never corre- sponds to the nominal values of the notation. In all performances, there are deviations or systematic variations from what seems This resea~h was supported by the Bank of Sweden Tercentenary Foundation. I am grateful to Carol Fowler, Alf Gabrielsson, Andreas Lehmarm, Bruno Repp, and John Sloboda for many useful comments on a preliminary version of this article. Correspondence concerning this article should be addressed to Patrik N. Justin, Department of Psychology, Uppsala University, Box 1225, SE-751 42 Uppsala, Sweden. Electronic mail may be sent to patrik. [email protected]. prescribed by the notation. This phenomenon is referred to as performance expression and concerns "the small and large varia- tions in timing, dynamics, timbre, and pitch that form the micro- structure of a performance and differentiate it from another per- formance of the same music" (Palmer, 1997, p. 118). There are considerable differences among different performers' renditions of the same piece of music, and it has been shown that interpretative aspects of performance influence listeners' perception of the mu- sical structure (e.g., Bengtsson & Gabrielsson, 1983; Clarke, 1989; Palmer, 1989; Sloboda, 1983). Such expressive variations are not random. For instance, performers are able to replicate their own timing microstrncture for a given piece of music with great pre- cision (e.g., Gabrielsson, 1987; C. E. Seashore, 1938; Shaffer & Todd, 1987). One important goal of studies of music performance has therefore been to explain the functions of these expressive variations. One function may be to clarify the structural content of the music to the listener (Clarke, 1988; Drake & Palmer, 1993; Palmer, 1989; Todd, 1989). Timing, in particular, has a strong tendency to be determined by the phrase structure. Phrase endings, for example, are often marked with decreases in tempo. Thus, expressive variations can function as syntactic markers, much in the same way as modifications of syllable durations and micropauses do in speech (Carlson, Friberg, Fryd6n, GranstrOm, & Sundberg, 1989). However, the functions of expressive variations are probably manifold (Clarke, 1995). A number of authors have therefore suggested that expressive variations also may contribute to the emotional impact of a music performance (e.g., Gabrielsson, 1995; Juslin, 1997b; Shaffer, 1992). One of the great pioneers of music psychology, Carl Seashore, noted that "deviation from the ex- act.., is the medium for the creation of the beautiful--for the conveying of emotion" (quoted in H. G. Seashore, 1937, p. 155). However, Seashore did not propose any theory to explain why such deviations should give rise to emotional reactions. Perhaps 1797
Transcript of Cue Utilization in Communication of Emotion in Music Performance: Relating Performance...
Journal of Experimental Psychology: Copyright 2000 by the American Psychological Association, Inc. Human Perception and Performance 0096-1523/00/$5.00 IX)I: 10.1037//0096-1523.26.6.1797 2000, Vol. 26, No. 6, 1797-1813
Cue Utilization in Communication of Emotion in Music Performance: Relating Performance to Perception
Patrik N. Juslin Uppsala University
This study describes the utilization of acoustic cues in communication of emotions in music performance. Three professional guitarists were asked to perform 3 short melodies to communicate anger, sadness, happiness, and fear to listeners. The resulting performances were analyzed with respect to 5 acoustic cues and judged by 30 listeners on adjective scales. Multiple regression analysis was applied to the relation- ships between (a) the performer's intention and the cues and (b) the listeners' judgments and the cues. The analyses of performers and listeners were related using C. J. Hm'~h, K. R. Hammond, and J. L. Hursch's (1964) lens model equation. The results indicated that (a) performers were successful at communicating emotions to listeners, (b) performers' cue utilization was well matched to listeners' cue utilization, and (c) cue utilization was more consistent across different melodies than across different performers. Because of the redundancy of the cues, 2 performers could communicate equally well despite differences in cue utilization.
Both biographical accounts (e.g., Blum, 1977; Kennedy, 1990; Schumacher, 1995) and empirical studies (e.g., Persson, 1995; Persson, Pratt, & Robson, 1996; Woody, in press) suggest that music performers often intend to convey emotions to listeners. Can performers communicate emotions to listeners? What means do they use to accomplish this task? These are issues of paramount importance to musical behavior.
Unfortunately, knowledge is still scarce on these matters. One reason for this may be that researchers lack the necessary tools to capture the complete communicative process. The chief objec- tive of this article is to describe how performers communicate emotions to listeners. In addition, I try to illustrate how aspects of performance and perception can be quantitatively related to each other. First, I outline a theoretical framework for studies of emotional communication in music performance (see also Jus- lin, in press-b). Then, I present data from acoustic analyses and listeners' judgments of 72 performances. Finally, I discuss the implications of these results for future research on music performance.
Studies of Music Performance
Studies of music performance have a long history (Gabrielsson, 1999). One of the main findings from this research is that the actual performance of a piece of music practically never corre- sponds to the nominal values of the notation. In all performances, there are deviations or systematic variations from what seems
This resea~h was supported by the Bank of Sweden Tercentenary Foundation. I am grateful to Carol Fowler, Alf Gabrielsson, Andreas Lehmarm, Bruno Repp, and John Sloboda for many useful comments on a preliminary version of this article.
Correspondence concerning this article should be addressed to Patrik N. Justin, Department of Psychology, Uppsala University, Box 1225, SE-751 42 Uppsala, Sweden. Electronic mail may be sent to patrik. [email protected].
prescribed by the notation. This phenomenon is referred to as performance expression and concerns "the small and large varia- tions in timing, dynamics, timbre, and pitch that form the micro- structure of a performance and differentiate it from another per- formance of the same music" (Palmer, 1997, p. 118). There are considerable differences among different performers' renditions of the same piece of music, and it has been shown that interpretative aspects of performance influence listeners' perception of the mu- sical structure (e.g., Bengtsson & Gabrielsson, 1983; Clarke, 1989; Palmer, 1989; Sloboda, 1983). Such expressive variations are not random. For instance, performers are able to replicate their own timing microstrncture for a given piece of music with great pre- cision (e.g., Gabrielsson, 1987; C. E. Seashore, 1938; Shaffer & Todd, 1987).
One important goal of studies of music performance has therefore been to explain the functions of these expressive variations. One function may be to clarify the structural content of the music to the listener (Clarke, 1988; Drake & Palmer, 1993; Palmer, 1989; Todd, 1989). Timing, in particular, has a strong tendency to be determined by the phrase structure. Phrase endings, for example, are often marked with decreases in tempo. Thus, expressive variations can function as syntactic markers, much in the same way as modifications of syllable durations and micropauses do in speech (Carlson, Friberg, Fryd6n, GranstrOm, & Sundberg, 1989).
However, the functions of expressive variations are probably manifold (Clarke, 1995). A number of authors have therefore suggested that expressive variations also may contribute to the emotional impact of a music performance (e.g., Gabrielsson, 1995; Juslin, 1997b; Shaffer, 1992). One of the great pioneers of music psychology, Carl Seashore, noted that "deviation from the ex- a c t . . , is the medium for the creation of the beautiful--for the conveying of emotion" (quoted in H. G. Seashore, 1937, p. 155). However, Seashore did not propose any theory to explain why such deviations should give rise to emotional reactions. Perhaps
1797
1798 JUSLIN
for this reason, his statement did not stimulate further research on emotional expression in performance.
This might explain a paradox in the literature. Studies of emo- tional expression in music have almost exclusively been concerned with the impact of particular pieces of music, whereas they have ignored the impact of specific performances. Performance studies, on the other hand, have almost exclusively been concerned with structural aspects of performance, whereas they have ignored emotional aspects (for a review, see Gabrielsson & Justin, in press). As a result, researchers know a lot about how different aspects of a musical composition might influence listeners' emo- tional responses to music (Bruner, 1990; Gabriel, 1978; Gundiach, 1935; Hevner, 1935, 1936; Maher, 1980; Nielz~n & Cesarec, 1981; Rigg, 1964; Scherer & Oshinsky, 1977; Schoen & Gate- wood, 1927; Thompson & Robitaille, 1992; Wedin, 1972) but know less about how different performances might influence lis- teners' responses. Clearly, the same notated structure can be per- formed in many different ways, and the precise way it is performed may influence the listener's impression of the music in profound ways. Therefore, it is important to study how the performance contributes to the emotional impact of music.
A series of recent studies has suggested that music perform- ers are able to communicate specific emotions (e.g., sadness, anger, happiness, fear) to listeners (Behrens & Green, 1993; Gabrielsson, 1995; Gabrielsson & Juslin, 1996; Juslin, 1997b, 1997c; Juslin & Laukka, in press; Juslin & Madison, 1999). The reliability of the communicative process has been explored in listening experiments using a variety of response formats, such as quantitative ratings, forced choice, or free labeling (e.g., Juslin, 1997a). Moreover, by means of analysis and synthesis of music performances, researchers have demonstrated that per- formers use a number of variables in the performance (e.g., tempo, sound level, articulation) to express specific emotions (e.g., Justin, 1997b, 1997c). Even children (4-12 years old) seem to be able to use some of these variables to express emotions in song (Adachi & Trehub, 1998).
The present study focuses on two aspects of this communicative process. First, previous studies have indicated that there are large individual differences among performers regarding the code (i.e., the acoustic means) used to express and recognize emotions. This finding seems to present something of a puzzle. How can the communicative process be successful if there are such large indi- vidual differences in cue utilization? This study suggests a possible explanation of these contradictory findings.
Second, both expression and recognition of emotion have been studied in previous studies, but no systematic attempt has been made to relate the two aspects. However, it may be argued that to understand the meaning of performance data, they must be con- sidered in relation to the performer's intention and the listener's experience--particularly if researchers are to take seriously that music is a form of communication. Accordingly, an important goal of performance studies is to develop a means of relating music performance to perception (Palmer, 1997; Repp, 1998; Todd, 1989). In the present context, I want to relate expression of emotion to recognition of emotion to acquire a deeper understand- ing of the communicative process. In the following, I describe a theoretical framework that may contribute to this goal.
A Theoretical Framework: The Lens Model
As shown by Justin (1995, 1997b, 1998), the communicative process may be described in terms of a modified version of Egon Brunswik's (1956) lens model (see Figure 1). This model is meant to illustrate how performers encode (i.e., express) emotions by means of a number of probabilistic (i.e., uncertain) but partly redundant cues (i.e., sources of information). The emotions are decoded (i.e., recognized) by listeners who use these same cues to judge the emotional expression. The cues are probabitistic in the sense that they are not perfectly reliable indicators of the intended emotional expression. Therefore, listeners have to combine the cues in flexible ways to arrive at reliable judgments of the expression.
Intereorrelafions among cues partly reflect how sounds are pro- duced on instruments. For instance, hitting a string harder on the electric guitar generates a tone with an increased sound level, but it also generates more high-frequency energy in the spectrum of the tone. However, intercorrelatiuns also reflect how performers use the cues to accomplish different expressions. The redundancy of the cues makes the communicative process relatively robust. On the other hand, the redundancy limits the information capacity of the communicative process because the same information is con- veyed by many of the cues (Shannon & Weaver, 1949).
In the lens model, the relationship between the performer's expressive intention and a cue in the performance (e.g., tempo) describes the ecological validity of that cue (see Figure 1). Eco- logical validity is a measure of the validity of that cue in predicting the performer's intention. The functional validity of the same cue is indexed by the relationship between the cue and the listener's judgment. Functional validity is a measure of the validity of the cue in predicting the listener's judgment. Achievement refers to the accuracy of the communication, as measured by the relationship between the performer's intention and the listener's judgment. Finally, matching refers to the extent to which ecological and functional validities are matched to each other, that is, whether performer and listener use the same code (the measurement of each of these quantities is described below).
This version of the lens model differs from Brunswik's original in two ways. First, the original model describes the relationship between an organism and its ecology. In the present version, however, the model describes the relationship between two organ- isms-the performer and the listener. Second, in the original model Brunswik used the concepts of ecological validity and cue utilization to denote the cue relationships on the two sides of the lens (the central rectangle in Figure 1), whereas I have chosen the terms ecological validity and functional validity to denote the cue validities on the two sides of the lens (Juslin, 1997b).
l i t should be noted that there are two different uses of the term expression in the literature on music performance. The use of the term to refer to systematic variations in the microstmcture of a performance should be distinguished from the use of the term to refer to the emotional contents that performers express and listeners perceive in performances. The re- mainder of this article uses the term in the latter sense. However, the two senses of the term are related because performers may use systematic variations in the microstrucmre of the performance to express specific emotions.

COMMUNICATION OF EMOTION IN MUSIC PERFORMANCE 1799
Achievement
ThePm'former I ,onn.in_n ITheP'°rmancel . ~ . . a , . . i Tm'ueten=r Expr" intenti°ns I I ex 'e"ive°ue' I I Judgment
e.g. < ~ . : : . : . ............ Anger ,~,,...,.~ . . . . . . . . . . . . . . . . . . . . . .
? Ecological validities
I
tempo
loudness
spectrum
erticul.
etc.
Matching
? F u n c a o ~ l ~ l i ~ t i e s
I
Anger
Figure 1. A modified lens model for emotional communication in music performance. Expr. = expressive; articul. = articulation. From "Emotional Communication in Music Performance: A Functionalist Perspective and Some Data," by P. N. Juslin, 1997, Music Perception, 14, p. 394. Copyright 1997 by the Regents of the University of California. Adapted with permission.
The lens model has a number of important implications. First, because the cues are only probabilistically related to the perform- er's expressive intention, the achievement cannot be more than probabilistic. Second, in order to understand why the communica- tion is successful or not in a particular situation, researchers must describe both performers and listeners in terms of the same con- cepts. Third, because the cues are intercorrelated, many different cue utilization strategies may lead to a similarly high level of achievement--there is no pressure toward uniformity in cue utili- zation (e.g., Dawes & Corrigan, 1974). This situation makes it possible for performers to communicate successfully with listeners without compromising their unique styles of playing. Brunswik's (1956) notion of vicarious functioning may be used to describe how listeners use many partially interchangeable cues in flexible ways, sometimes shifting from one cue that is unavailable to another that is available (Juslin, in press-a).
One problem in studying cue utilization in musical communi- cation is that the strategies used by performers and listeners are mainly implicit in nature (e.g., Juslin & Laukka, in press; Kendall & Carterette, 1990; Sloboda, 1994). Thus, researchers need to somehow externalize their strategies. One promising approach to this problem is to use multiple regression analysis (MRA) to describe the relationships among (a) the performer's expressive intention and the cues (i.e., ecological validities) and (b) the listener's judgment and the cues (i.e., functional validities). MRA is a method flexible enough to handle the complexity (e.g., mul- tiple cues, uncertainty, cue intercorrelations) of the communicative process. Furthermore, MRA permits researchers to describe both performers and listeners in terms of the same concepts, so their cue utilization can be directly compared.
Lens Model Equation
As demonstrated by Juslin (1998), regression models of per- formers and listeners can be mathematically related to each other
by means of the lens model equation CLME). The LME was originally presented in an influential article by Hursch, Hammond, and Hursch (1964) in the context of studies of human judgment. In such studies, the goal was to relate the judge's cognitive system to a statistical description of the judgment task (for a review, see Brehmer, 1994). However, the LME can also be used to describe emotional communication in music.
As noted above, achievement refers to the accuracy of the communicative process. In the present study, achievement is in- dexed by the point-biserial correlation between the performer's expressive intention and the listener's judgment. The performer's expressive intention is coded dichotomously for each emotion, such that all performances intended to express a given emotion are coded 1, whereas all remaining performances are coded 0. The listener's judgment is coded continuously on the basis of the listener's ratings of the performances on the corresponding emo- tion scale. High achievement for a certain emotion, say anger, means that there is a high correlation between a performer's intention to communicate anger and a high rating of anger by the listener.
The LME (Equation 1) embodies the fact that achievement (re) is a function of two additive components. The first component is usually called the linear component because it represents that component of the achievement that can be attributed to the linear regression models of the performer and the listener. The linear component shows that achievement is a function of performer consistency (Re), listener consistency (Rs), and matching (G). Performer consistency refers to the multiple correlation of the performer model (i.e., performer's intention and cues), whereas listener consistency refers to the multiple correlation of the listener model (i.e., listener's judgment and cues). Both indices reflect the extent to which the regression models fit the cue utilization and are usually interpreted as measures of consistency of cue utilization. If R = 1.0, then cue utilization is perfectly consistent (Cooksey,
1800 JUSLIN
1996). Matching is a measure of the extent to which the beta weights of performers and listeners are matched to each other, that is, whether performers and listeners use the same code. This index is obtained by correlating the predicted values of the performer's regression model with the predicted values of the listener's regres- sion model. The resulting correlation is interpreted as the extent to which the performer's beta weights and the listener's beta weights would agree if both regression models were perfect (i.e., R e = Rs = 1.0). G is thus independent of R e and R s because it is corrected for inconsistency (Stewart, 1988).
ro = 6R~R~ + C~ / ( i - R~) ~ - R 2) ~1)
If the emotional communication under study is unsuccessful, researchers may ask whether this is because (a) the performers use a different code than the listeners (indicated by a low G value), (b) the performers apply their code inconsistently (indicated by a low R e value), or (c) the listeners apply their code inconsistently (indicated by a low R s value). These three factors set the upper limit of achievement (Hursch et al., 1964). By analyzing each of them separately, it becomes possible to see how the communica- tive process could be improved.
The second component of the LME is usually called the unmod- eled component of the communicative process. It includes both unsystematic and systematic variance not accounted for by the linear component. This includes effects of inconsistent cue utili- zation, order effects, distractions, memory intrusions, omission of relevant cues, or configural cue utilization (i.e., the use of partic- ular patterns of cue values). (1 - R 2) and (1 - R 2) refer to the residual variance of the regression models of the performers and listeners, respectively. C, or unmodeled matching, represents the correlation between the residuals of the performer's model and the residuals of the listener's model. If C is high, it indicates (a) a common reliance on cues not included in the regression models, (b) chance agreement between random model errors, (c) cue in- teractions common to both models, or (d) nonlinear cue function forms common to both models (Cooksey, 1996).
Rationale of This Study
For practical reasons, most performance studies include only a small number of melodies and performers. Studies of performance tend to generate a wealth of data, particularly if many dependent variables are measured at the same time (Palmer, 1997). Thus, previous studies of emotional communication in music perfor- mance have frequently relied on the data from only one performer and melody (e.g., Sundberg, Iwarsson, & Hageg/trd, 1995). One problem with such studies can be that it is difficult to know whether the obtained results for a performance can be generalized to other performers or melodies.
A thorough understanding of the communicative process re- quires that a larger body of data is analyzed so that general principles can be established or the lack thereof be explained. In this study, I analyzed 72 music performances on the electric guitar. A small portion Of these data--the mean values for tempo, sound level, and articulation of 12 performances of one melody ("When the Saints")--was first presented in Justin (1997b). However, these data were reanalyzed in this study, along with a set of new data.
In the present study, performers were asked to play short pieces of music to communicate the following four emotions to an imag- ined listener: anger, sadness, happiness, and fear. These emotions were selected because they are among the most commonly pro- posed basic emotions in the literature (e.g., Ekman, 1992; Oatley, 1992; Plutchik, 1994). I analyzed the resulting performances with regard to their acoustic characteristics. I also used the perfor- mances in a listening experiment in which participants were asked to judge the emotional expression of each performance. MRA was applied to the relationships between (a) the performer's intention and the cues (to obtain the ecological validities) and (b) the listener's judgment and the cues (to obtain the functional validi- ties). The performer and listener analyses were then related to each other using the LME. To my knowledge, this study is the first attempt to mathematically relate expression and recognition of emotion in music performance.
The success of a lens model analysis, in terms of generalizability and representativeness, depends to a large extent on whether the most appropriate set of cues has been incorporated. The most objective method is to base the selection of cues on a prior analysis of the ecology, that is, the natural environment (e.g., Cooksey, 1996). I analyzed five cues in this study: tempo, sound level, frequency spectrum, articulation, and articulation variability. I selected these cues on the basis of past results showing that they vary consistently as a function of the performer's expressive intention and are used by listeners to judge emotional expressions (Gabrielsson & Juslin, 1996; Justin, 1993, 1997b, 1997c).
I hypothesized that (a) performers would be successful in com- municating specific emotions to their listeners, (b) the achievement of the communicative process would depend primarily on the extent to which performers' cue utilization matched the cue utili- zation of listeners, and (c) different performers would be able to reach a similar level of achievement, despite slight differences in their cue utilization. In addition, I thought it would be useful to study how achievement and cue utilization are affected by the particular melody performed.
On the basis of previous studies of electric-guitar playing (Ga- brielsson & Juslin, 1996; Justin, 1993, 1997c), I predicted that both performers and listeners would associate (a) anger with fast tempo, high sound level, legato articulation, little articulation variability, and much high-frequency (HF) energy in the spectrum; (b) sadness with slow tempo, low sound level, legato articulation, little artic- ulation variability, and tittle I-IF energy in the spectrum; (c) hap- piness with fast tempo, high sound level, staccato articulation, much articulation variability, and some HF energy in the spectrum; and (d) fear with slow tempo, low sound level, staccato articula- tion, much articulation variability, and little I-IF energy in the spectrum. The results of the experiments are presented in terms of correlations, regression models, and LME statistics.
Method
Encoding Experiment
Performers. Three professional guitar players (all men), aged 25--45 years, participated. They mainly performed rock, blues, jazz, and folk music, and their experience of playing the guitar ranged from 10 to 30 years. They were paid for their anonymous participation and used their own guitars for the recording to ensure that they were familiar with the instrument.
COMMUNICATION OF EMOTION IN MUSIC PERFORMANCE 1801
Apparatus and recording conditions. The recording took place in a laboratory room (about 6 x 3 m) made to resemble a living room with tables, sofas, and a large carpet on the floor. The performances were recorded by means of a microphone placed close to the speaker of a guitar amplifier (Peavey Classic 50). The amplifier was placed about 2.5 meters from the performer, who was able to monitor the sound directly from the amplifier.
The guitar sound was devoid of any external effects. However, because electric guitarists rarely play with a completely "dry" sound, I used a small amount of reverberation to add a realistic ambience to the guitar sound. Settings on the equipment were the same for all performers. The recordings were made on a Revox B88 tape recorder (19 cm/s speed) and on a Yamaha MT 120 cassette recorder.
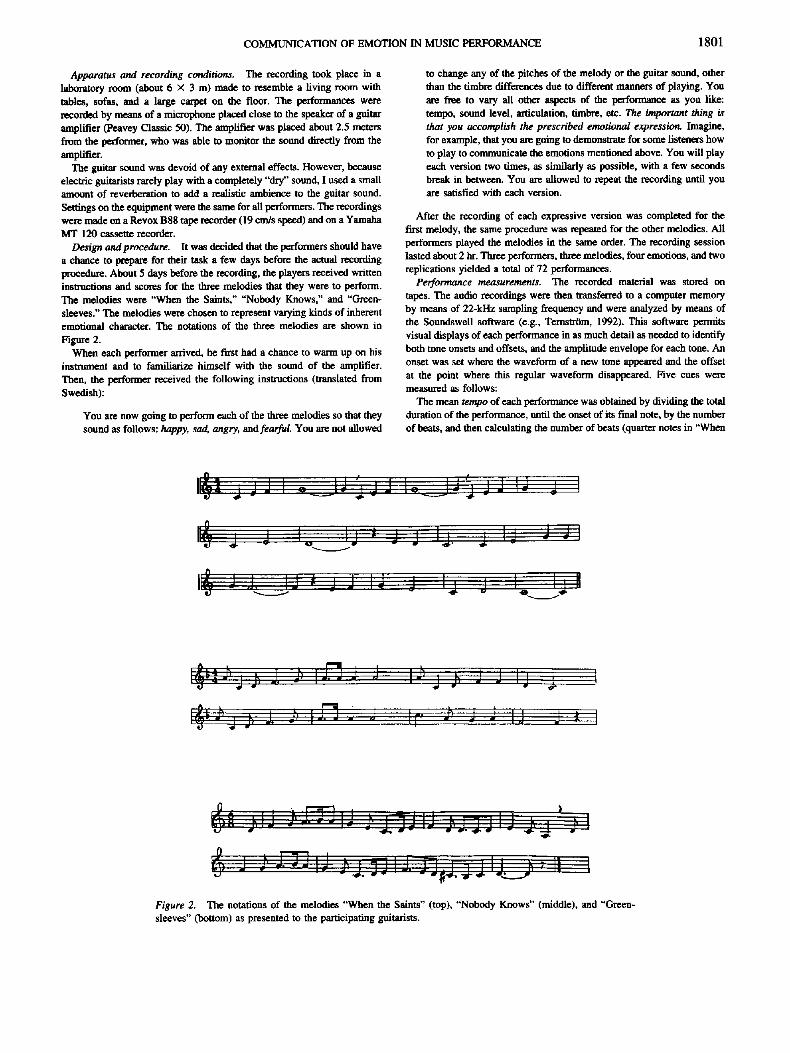
Design and procedure. It was decided that the performers should have a chance to prepare for their task a few days before the actual recording procedure. About 5 days before the recording, the players received written instructions and scores for the three melodies that they were to perform. The melodies were "When the Saints," "Nobody Knows," and "Green- sleeves." The melodies were chosen to represent varying kinds of inherent emotional character. The notations of the three melodies am shown in Figure 2.
When each performer arrived, he first had a chance to warm up on his instrument and to familiarize himself with the sound of the amplifier. Then, the performer received the following instructions (translated from Swedish):
You are now going to perform each of the three melodies so that they sound as follows: happy, sad, angry, and fearful. You are not allowed
to change any of the pitches of the melody or the guitar sound, other than the timbre differences due to different manners of playing. You are free to vary all other aspects of the performance as you like: tempo, sound level, articulation, timbre, etc. The important thing is that you accomplish the prescribed emotional expression. Imagine, for example, that you are going to demonstrate for some listeners how
to play to communicate the emotions mentioned above. You will play
each version two times, as similarly as possible, with a few seconds
break in between. You are allowed to repeat the recording until you
am satisfied with each version.
After the recording of each expressive version was completed for the first melody, the same procedure was repeated for the other melodies. All performers played the melodies in the same order. The recording session lasted about 2 hr. Three performers, three melodies, four emotions, and two replications yielded a total of 72 performances.
Performance measurements. The recorded material was stored on tapes. The audio recordings were then transferred to a computer memory by means of 22-kHz sampling frequency and were analyzed by means of the Soundswell software (e.g., Ternstr6m, 1992). This software permits visual displays of each performance in as much detail as needed to identify both tone onsets and offsets, and the ampfitude envelope for each tone. An onset was set where the waveform of a new tone appeared and the offset at the point where this regular waveform disappeared. Five cues were measured as follows:
The mean tempo of each performance was obtained by dividing the total duration of the performance, until the onset of its final note, by the number of beats, and then calculating the number of beats (quarter notes in "When
v ~ _ . - , - " . ~ , , I ~ . . . _ . ~ -
Figure 2. The notations of the melodies "When the Saints" (top), "Nobody Knows" (middle), and "Green- sleeves" (bottom) as presented to the participating guitarists.
1 8 0 2 JUSLIN
the Saints" and "Nobody Knows," dotted quarter notes in "Greensleeves") per minute (bpm; cf. Bengtsson & Gabrielsson, 1980).
The mean sound level of each performance was obtained by measuring the loudness equivalent level of the amplitude across the entire perfor- mance (TemstrOm, 1992).
The frequency spectrum of each performance was obtained by measur- ing the long-term average spectrum. The dependencies between the energy values that constitute the frequency spectrum and the experience o f timbre are not well understood. However, one index cited as a correlate of perceived timbre is high-frequency energy (Grey, 1977). This refers to the relative proportion of energy found above a certain cutoff frequency. In this study, the cutoff frequency was heuristically set to 3000 Hz. The amount of energy in the higher regions of the frequency spectrum is one of the main correlates of perceived timbre. Increases of I-IF energy in the spec- trum of a tone yield a sharper timbre, whereas decreases yield a softer timbre (e.g., von Bismarck, 1974; Gabrielsson & SjSgren, 1979).
The mean articulation of each performance was obtained by measuring two durations for each tone: The duration from the onset of a tone until the onset of the next tone (dii), and the duration from the onset of a tone until its offset (dio) if the offset preceded the next tone onset. These durations were used to calculate the dio:d~i ratio, that is, the articulation of the tone (Bengtsson & Gabrielsson, 1983; Gabrielsson, 1999). 2 The articulation values of all tones in the performance were used to calculate the mean articulation across the performance. Articulation close to 100% may be referred to as legato articulation, whereas articulation close to 70% or lower may be referred to as nonlegato. Guitar strings have a limited amount of sustain, but the electric guitar offers markedly longer sustain than the acoustic guitar. Legatissimo articulation (i.e., values larger than 100%) may thus be achieved if successive notes are played on different strings. However, there were no cases of legatissimo articulation in the present data.
The articulation variability was obtained by calculating the standard deviation of all articulation values across the entire performance. Note that because the performers were given full freedom in their interpretation of the melodic structure, their use of nonlegato articulation was not restricted to notes preceding rests (see Figure 2).
Correlations and regression models. To measure the relationships between performers' expressive intentions and cues, I calculated the point- biserial correlations (rpb) between the performer's expressive intention and each of the five cues. The performer's intention was coded dichotomously for each emotion analyzed so that all performances made with this partic- ular intention were coded 1, whereas all other performances were coded 0. All cues were coded continuously using the raw data from the acoustic analyses. Thus, for example, the point-biserial correlation between anger intention and mean tempo indexes the extent to which the tempo tends to increase or decrease when the performer intends to express anger (1) as opposed to other emotions (0).
The performance data were subjected to one regression analysis for each emotion. All regression analyses were carried out by means of a simulta- neous (as opposed to a stepwise) regression approach (Cohen & Cohen, 1983). The performer's expressive intention was the dependent variable, and the cues were the independent variables. The analyses were designed to reveal how well the intended expression could be predicted from a linear combination of the cues. The performer intention was coded dichoto- mously, and cues were coded continuously using the raw data from the acoustic analyses.
Decoding Exper iment
Listeners. Thirty university students, aged 21-52 years (M = 26), participated on a voluntary basis. The majority (24) of the listeners were musically trained, having played an instrument for at least two years (M = 7.2 years, range = 2-20 years). The musically trained listeners included 11 pianists, 6 guitarists, 4 singers, 2 flute players, and 1 violinist.
The participants were evenly distributed with regard to gender and were paid for their anonymous participation.
Design and procedure. The participants were instructed to rate the emotional expression of each version of each melody on four adjective scales: happy, sad, angry, and fearful. The ratings were collected by means of a specially designed computer program for quantitative judgments of auditory stimuli. The instructions were given as follows (translated from Swedish):
You will now hear many different versions of three well-known melodies. Your task is to judge the emotional expression of each version of these melodies by indicating a value (using the mouse) on each of the four adjective scales that you see in front of you. The more of a certain emotion you think that a particular version is expressing, the higher value you shouM indicate on the corresponding adjective scale. Ten represents maximum of this emotion and zero represents minimum. Note that you do not have to hurry. The important thing is that you are satisfied with your ratings of each version before you move on to the next. When you have completed the ratings of a certain version, you simply click on the next-button: This will start the next version. It may happen that you find it difficult to complete the ratings of a particular version after its playback has come to an end. You can then repeat this version by cricking on the repeat-button. To famil- iarize yourself with the procedure, you will first be given a pre-test with five examples. The procedure is the same throughout the exper- iment. Do you have any questions?
Each listener rated all 72 performances. The pretest featured five exam- ples from these performances that were randomly drawn for each partici- pant. The participants listened to the stimuli over a loudspeaker (Audio Pro A 4-14). The sound level was adjusted such that it would correspond to the level at the recording session. The order of the stimuli was randomized for each participant. The order in which the adjective lists appeared on the computer screen was randomized for each participant but remained the same throughout the experimental session. The experimental session lasted about 1 hr.
Correlations and regression models. To measure the relationships between cues and listeners' judgments, I calculated the Pearson correla- tions (r) between each of the five cues and the listener's judgment. The listener's judgment was coded continuously for each emotion using the ratings on the adjective scale. The cues were coded continuously using the raw data from the acoustic analyses. Thus, for example, the correlation between mean tempo and anger judgment indexes the extent to which the rating of anger tends to increase or decrease when the tempo increases.
The listeners' judgments were subjected to one regression analysis for each emotion. The mean rating on the respective adjective scale was the dependent variable, and the cues were the independent variables. That is, the analyses were designed to reveal how well listeners' judgments on each adjective scale could be predicted from a linear combination of the cues.
L M E Statistics
Achievement (ra) was measured for each emotion by the point-biserial correlation (rob) between the performer's expressive intention (dichoto- mously coded) and the listener's rating on the adjective scale (continuously
2 This measure may be contrasted with a measure of articulation in terms of overlap, that is, the overlapping time of two adjacent notes' amplitude envelopes calculated as the offset of note event N minus the onset of note event N + 1 (Palmer, 1989). Both measures yield high values for legato articulation and low values for staccato articulation. Because correlational statistics are used to present the articulation data in the present study, differences between the two measures are not critical to an understanding of the results.
COMMUNICATION OF EMOTION IN MUSIC PERFORMANCE 1803
coded). Matching (G) was measured by the correlation (r) between the predicted values of the perfonne~' regression model and the predicted values of the listeners' regression model. Unmodeled matching (C) was measured by the correlation (r) between the residuals of the performers' regression model and the residuals of the listeners' regression model (all of these indices can be interpreted as regular correlations).
Performer consistency (R,) was measured by the multiple correlation of the performers' regression model, and listener consistency (R,) was mea- sured by the multiple correlation of the listeners' regression model. Stan- dard procedures for statistical tests of Pearson correlations (r), point- biserial correlations (rpb), and multiple correlations (R) are found in Howell (1992).
Resul ts
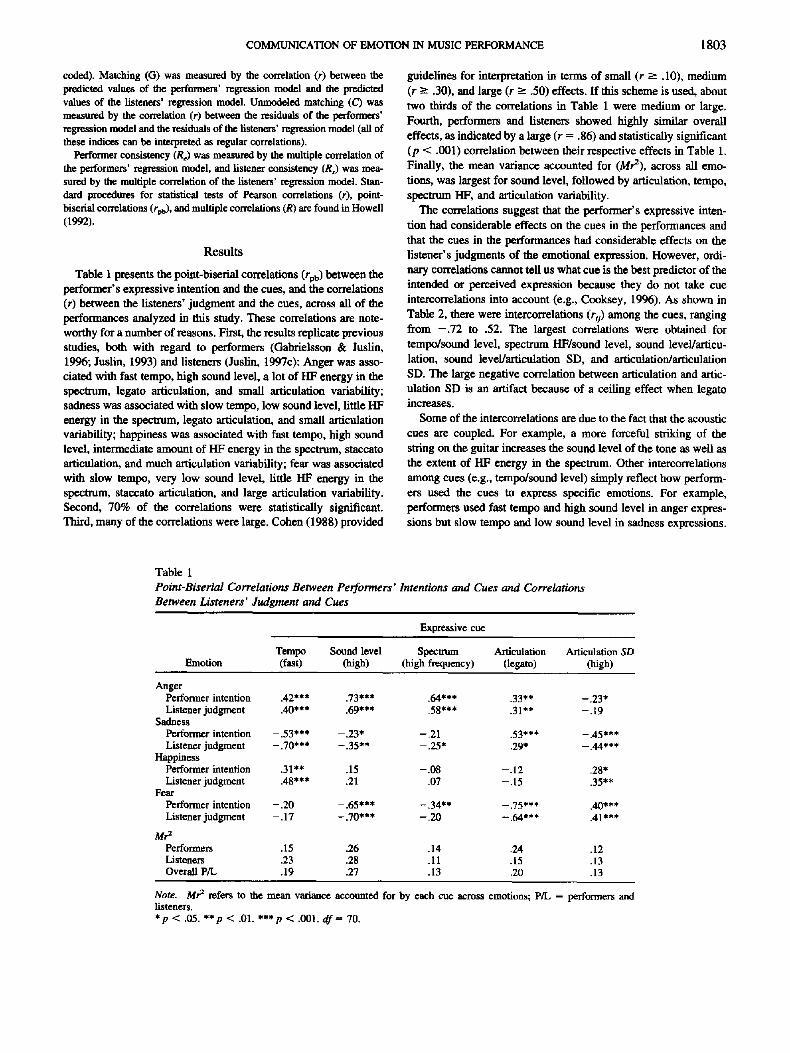
Table 1 presents the point-biserial correlations (rpb) between the performer's expressive intention and the cues, and the correlations (r) between the listeners' judgment and the cues, across all of the performances analyzed in this study. These correlations are note- worthy for a number of reasons. First, the results replicate previous studies, both with regard to performers (Gabrielsson & Justin, 1996; Justin, 1993) and listeners (Justin, 1997c): Anger was asso- ciated with fast tempo, high sound level, a lot of HF energy in the spectrum, legato articulation, and small articulation variability; sadness was associated with slow tempo, low sound level, tittle I-IF energy in the spectnml, legato articulation, and small articulation variability; happiness was associated with fast tempo, high sound level, intermediate amount of HF energy in the spectrum, staccato articulation, and much articulation variability; fear was associated with slow tempo, very low sound level, tittle I-IF energy in the spectrum, staccato articulation, and large articulation variability. Second, 70% of the correlations were statistically significant. Third, many of the correlations were large. Cohen (1988) provided
guidelines for interpretation in terms of small (r -> .10), medium (r -> .30), and large (r >-- .50) effects. If this scheme is used, about two thirds of the correlations in Table 1 were medium or large. Fourth, performers and listeners showed highly similar overall effects, as indicated by a large (r = .86) and statistically significant (p < .001) correlation between their respective effects in Table 1. Finally, the mean variance accounted for (Mr2), across all emo- tions, was largest for sound level, followed by articulation, tempo, spectrum HF, and articulation variability.
The correlations suggest that the performer's expressive inten- tion had considerable effects on the cues in the performances and that the cues in the performances had considerable effects on the listener's judgments of the emotional expression. However, ordi- nary correlations cannot tell us what cue is the best predictor of the intended or perceived expression because they do not take cue intercorrelations into account (e.g., Cooksey, 1996). As shown in Table 2, there were intercorrelations (r0) among the cues, ranging from - . 7 2 to .52. The largest correlations were obtained for tempo/sound level, spectrum HF/sound level, sound level/articu- lation, sound level/articulation SD, and articulation/articulation SD. The large negative correlation between articulation and artic- ulation SD is an artifact because of a ceiling effect when legato increases.
Some of the intercorrelations are due to the fact that the acoustic cues are coupled. For example, a more forceful striking of the string on the guitar increases the sound level of the tone as well as the extent of HF energy in the spectrum. Other intercorrelations among cues (e.g., tempo/sound level) simply reflect how perform- ers used the cues to express specific emotions. For example, performers used fast tempo and high sound level in anger expres- sions but slow tempo and low sound level in sadness expressions.
Table 1 Point-Biserial Correlations Between Performers' Intentions and Cues and Correlations Between Listeners' Judgment and Cues
Expressive cue
Tempo Sound level Spectrum Articulation Articulation SD Emotion (fast) (high) (high frequency) (legato) (high)
Anger Performer intention .42*** .73*** .64*** .33** -.23" Listener judgment .40*** .69*** .58*** .31"* -.19
Sadness Performer intention -.53*** -.23* -.21 .53*** -.45*** Listener judgment -.70*** -.35** - .25" .29* -.44***
Happiness Performer intention .31"* .15 -.08 -.12 .28* Listener judgment .48 * * * .21 .07 - . 15 .35 * *
Fear Performer intention - .20 -.65*** -.34** -.75*** .40*** Listener judgment -.17 -.70*** - .20 -.64*** .41"**
Mr 2 Performers .15 .26 .14 .24 .12 Listeners .23 .28 .11 .15 .13 Overall P/L .19 .27 .13 .20 .13
Note. Mr 2 refers to the mean variance accounted for by each cue across emotions; P/L = performers and listeners. *p < .05. **p < .01. ***p < .001. d f = 70.
1804 JUSLIN
Still, the moderate size of the intercorrelations suggests that the cues covered reasonably different aspects of the acoustic signal.
Regression Models and L M E Statistics
MRA was used to model the relationships between (a) the performer's intention and the cues and (b) the listener's judgment and the cues. Seven regression models are presented in this sec- tion. First, I present a model including all performers and melo- dies. Then, I present models for each of the 3 performers. Finally, I present models for each of the three melodies. By varying the selection of performances included in the regression analyses, I was able to study the effects of individual performers or melodies on the communicative process.
Both performer and listener analyses describe relationships be- tween cues and a criterion (i.e., whether a particular emotion was intended/perceived or not), which means that the two kinds of analyses can be interpreted in a similar fashion. Statistical tests are only reported for the LME statistics, however. The regression analyses of the performers involve violations of distribution as- sumptions associated with statistical tests because of the dichoto- mous nature of the criterion variable (i.e., the performer's inten- tion). 3 However, both beta weights and multiple correlations are legitimate measures independent of any distribution assumptions. Thus, they are used here for descriptive purposes (Howell, 1992).
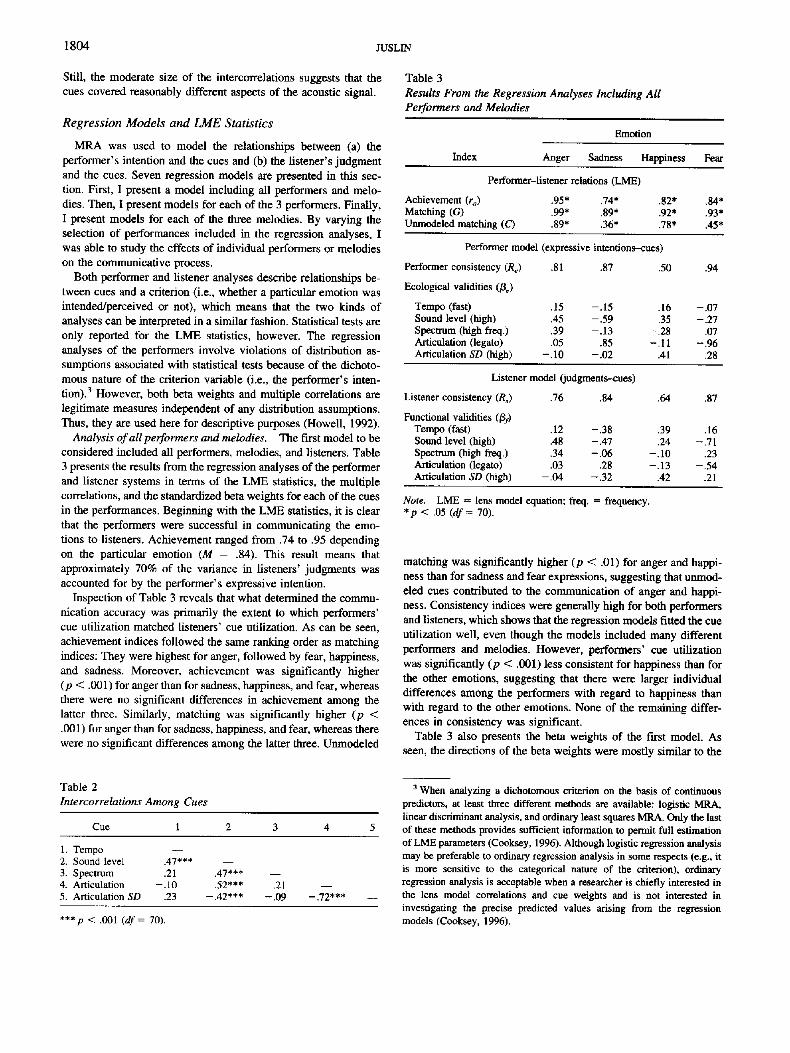
Analysis of aU performers and melodies. The first model to be considered included all performers, melodies, and listeners. Table 3 presents the results from the regression analyses of the performer and listener systems in terms of the LME statistics, the multiple correlations, and the standardized beta weights for each of the cues in the performances. Beginning with the LME statistics, it is clear that the performers were successful in communicating the emo- tions to listeners. Achievement ranged from .74 to .95 depending on the particular emotion (M = .84). This result means that approximately 70% of the variance in listeners' judgments was accounted for by the performer's expressive intention.
Inspection of Table 3 reveals that what determined the commu- nication accuracy was primarily the extent to which performers' cue utilization matched listeners' cue utilization. As can be seen, achievement indices followed the same ranking order as matching indices: They were highest for anger, followed by fear, happiness, and sadness. Moreover, achievement was significantly higher (p < .001) for anger than for sadness, happiness, and fear, whereas there were no significant differences in achievement among the latter three. Similarly, matching was significantly higher (p < .001) for anger than for sadness, happiness, and fear, whereas there were no significant differences among the latter three. Unmodeled
Table 3 Results From the Regression Analyses Including All Performers and Melodies
Emotion
Index Anger Sadness Happiness Fear
Performer-listener relations (LME)
Achievement (ra) .95* .74* .82* .84* Matching (G) .99* .89* .92* .93* Unmodeled matching (C) .89* .36* .78* .45*
Performer model (expressive intentions-cues)
Performer consistency (Re) .81 .87 .50 .94
Ecological validities (/3e)
Tempo (fast) .15 -.15 .16 -.07 Sound level (high) .45 -.59 .35 -.27 Spectrum (high freq.) .39 -.13 -.28 .07 Articulation (legato) .05 .85 - . 11 -.96 Articulation SD (high) - .10 -.02 .41 .28
Listener model (judgments--cues)
Listener consistency (R,) .76 .84 .64 .87
Functional validities (/3y) Tempo (fast) .12 -.38 .39 .16 Sound level (high) .48 -.47 .24 -.71 Spectrum (high freq.) .34 - .06 -.10 .23 Articulation (legato) .03 .28 -.13 -.54 Articulation SD (high) -.04 -.32 .42 .21
Note. LME = lens model equation; freq. = frequency. *p < .05 (df = 70).
matching was significantly higher (p < .01) for anger and happi- ness than for sadness and fear expressions, suggesting that unmod- eled cues contributed to the communication of anger and happi- ness. Consistency indices were generally high for both performers and listeners, which shows that the regression models fitted the cue utilization well, even though the models included many different performers and melodies. However, performers' cue utilization was significantly (p < .001) less consistent for happiness than for the other emotions, suggesting that there were larger individual differences among the performers with regard to happiness than with regard to the other emotions. None of the remaining differ- ences in consistency was significant.
Table 3 also presents the beta weights of the first model. As seen, the directions of the beta weights were mostly similar to the
Table 2 Intercorrelations Among Cues
Cue 1 2 3 4 5
1. Tempo 2. Sound level .47*** - - 3. Spectrum .21 .47*** - - 4. Articulation -.10 .52*** .21 - - 5. Articulation SD .23 -.42*** -.09 -.72*** - -
*** p < .001 (df = 70).
3 When analyzing a dichotomous criterion on the basis of continuous predictors, at least three different methods are available: logistic MRA, linear discriminant analysis, and ordinary least squares MRA. Only the last of these methods provides sufficient information to permit full estimation of LME parameters (Cooksey, 1996). Although logistic regression analysis may be preferable to ordinary regression analysis in some respects (e.g., it is more sensitive to the categorical nature of the criterion), ordinary regression analysis is acceptable when a researcher is chiefly interested in the lens model correlations and cue weights and is not interested in investigating the precise predicted values arising from the regression models (Cooksey, 1996).
COMMUNICATION OF EMOTION IN MUSIC PERFORMANCE 1805
correlations presented in Table 1. However, what is readily appar- ent from the beta weights, as compared with the correlations, is that the beta weights were much smaller in several instances. This result is a consequence of the intercorrelations among cues. When intercorrelations among cues are taken into account (i.e., through the partial regression coefficients of the regression analyses), fewer cues turn out to be really useful as predictors of the intended expression. For instance, Table 3 shows that sound level and spectrum remained useful predictors of anger intentions in the regression analyses, whereas articulation turned out to be less useful as a predictor of anger intentions than Table 1 would suggest.
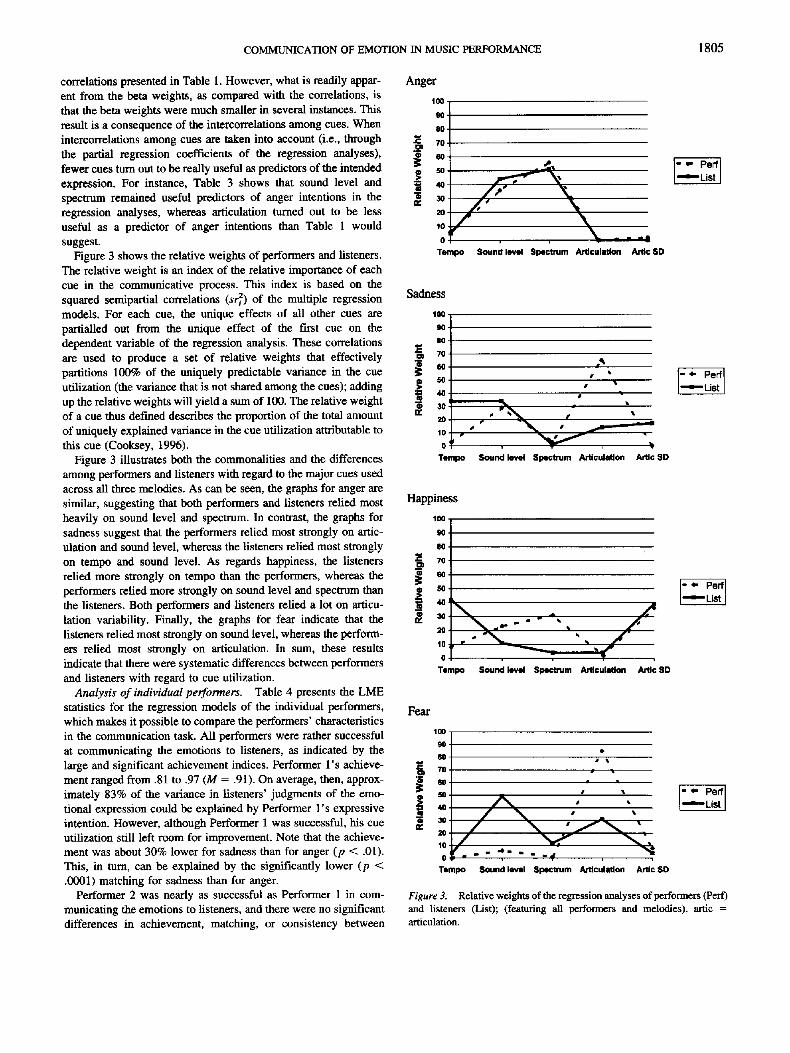
Figure 3 shows the relative weights of performers and listeners. The relative weight is an index of the relative importance of each cue in the communicative process. This index is based on the squared semipartial correlations (s~) of the multiple regression models. For each cue, the unique effects of all other cues are partialled out from the unique effect of the first cue on the dependent variable of the regression analysis. These correlations are used to produce a set of relative weights that effectively partitions 100% of the uniquely predictable variance in the cue utilization (the variance that is not shared among the cues); adding up the relative weights will yield a sum of 100. The relative weight of a cue thus defined describes the proportion of the total amount of uniquely explained variance in the cue utilization attributable to this cue (Cooksey, 1996).
Figure 3 illustrates both the commonalities and the differences among performers and listeners with regard to the major cues used across all three melodies. As can be seen, the graphs for anger are similar, suggesting that both performers and listeners relied most heavily on sound level and spectrum. In contrast, the graphs for sadness suggest that the performers relied most strongly on artic- ulation and sound level, whereas the listeners relied most strongly on tempo and sound level. As regards happiness, the listeners relied more strongly on tempo than the performers, whereas the performers relied more strongly on sound level and spectrum than the listeners. Both performers and listeners relied a lot on articu- lation variability. Finally, the graphs for fear indicate that the listeners relied most strongly on sound level, whereas the perform- ers relied most strongly on articulation. In sum, these results indicate that there were systematic differences between performers and listeners with regard to cue utilization.
Analysis of individual performers. Table 4 presents the LME statistics for the regression models of the individual performers, which makes it possible to compare the performers' characteristics in the communication task. All performers were rather successful at communicating the emotions to listeners, as indicated by the large and significant achievement indices. Performer l ' s achieve- ment ranged from .81 to .97 (M = .91). On average, then, approx- imately 83% of the variance in listeners' judgments of the emo- tional expression could be explained by Performer l ' s expressive intention. However, although Performer 1 was successful, his cue utilization still left room for improvement. Note that the achieve- ment was about 30% lower for sadness than for anger (p < .01). This, in turn, can be explained by the significantly lower (p < .0001) matching for sadness than for anger.
Performer 2 was nearly as successful as Performer 1 in com- municating the emotions to listeners, and there were no significant differences in achievement, matching, or consistency between
Anger
111 8O
~ 4o- ® 3 0 -
1 0 - I
O -
T e m p o Sound level Spectrum Articulation Artic SD
Sadness
1 0 0 .
9 0 .
8 0 .
~OI 7 0 -
| 6o , " 5 0 . • - - i
4 0 • L m " - t ~ 3 0 :
2 0 " • • •
100i , , F
Tempo Sound level Spectrum Articulation ArUc SD
Happiness
100
">
i~ 30. 20,
10: 0.
Tempo Sound level Spectrum Articulation Attic SD
Fear
1 i m
5 0 • •
o f . . - . . . . . Tempo Sound level Spectrum Articulation Attic SD
Figure 3. Relative weights of the regression analyses of performers (Per0 and listeners (List); (featuring all performers and melodies), artic = articulation.
1806
Table 4 Lens Model Equation Statistics From the Regression Analyses of the Individual Performers
Emotion
Performer and index Anger Sadness Happiness Fear
Performer 1 Achievement (ra) .97* .81" .93* .94* Matching (G) .99* .85* .95* .94* Unmodeled matching (6") .92* .67* .93* .95* Performer consistency (Re) .85 .86 .73 .88 Listener consistency (Rs) .80 .88 .82 .91
Performer 2 Achievement (ra) .96* .82* .89* .92* Matching (G) .96* .87* .95* .95* Unmodeled matching (C) .97* .82* .81" .74* Performer consistency (Re) .84 .92 .74 .95 Listener consistency (Rs) .80 .77 .75 .91
Performer 3 Achievement (ra) .95* .62* .74* .74* Matching (G) .99* .86* .71" .82* Unmodeled matching (C) .81" -.23 .78* .43 Performer consistency (Re) .93 .84 .74 .90 Listener consistency (Rs) .89 .92 .73 .88
*p < .05 (df = 22).
Performer 1 and Performer 2. In contrast, Performer 3 was less successful than the other two performers. Thus, for example, Performer 3's achievement for happiness and fear was signifi- cantly lower (p < .05) than Performer l ' s achievement for the same two emotions. Further, Performer 3's achievement for fear was significantly lower (p < .05) than Performer 2's achievement for the same emotion. These differences were accompanied by differences in matching: Performer 3's matching for fear and happiness was lower (p < .05) than Performer 2's matching for the same two emotions. Similarly, Performer 3's matching for happiness was lower (p < .05) than Performer 2's matching for the same emotion. In contrast, there were no significant differences in consistency between the performers. Together, these results suggest that Performer 3's lower achievement is explained by lower matching of cue utilization rather than lower consistency of cue utilization.
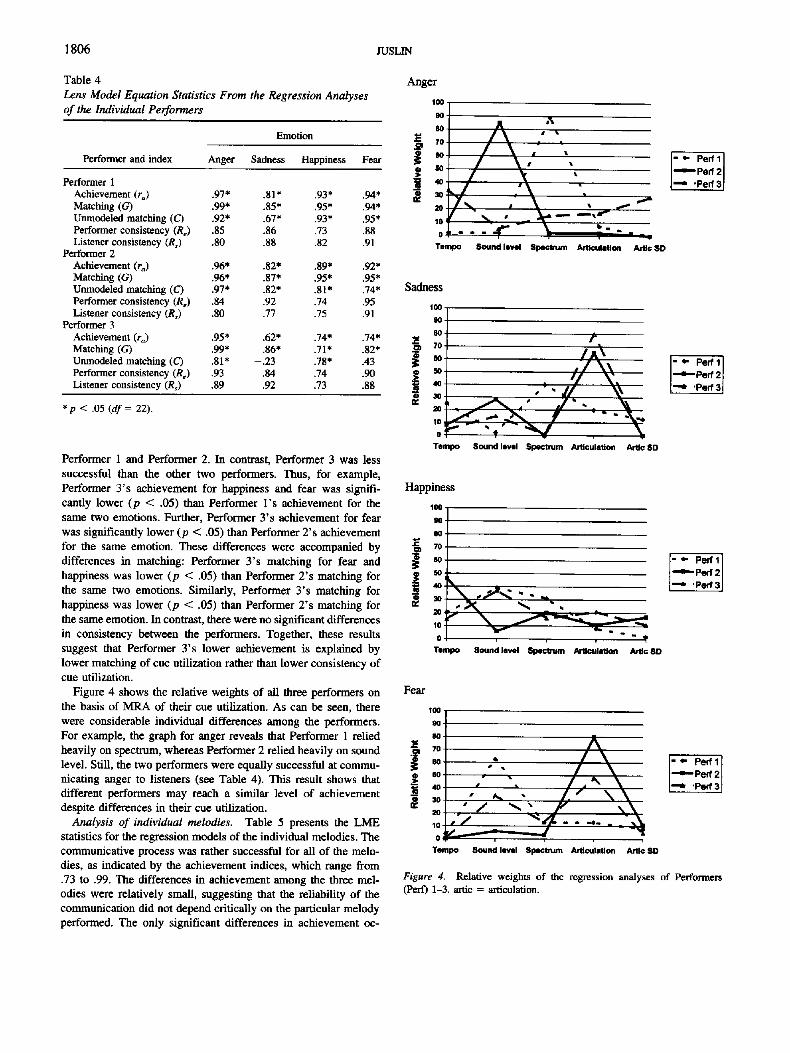
Figure 4 shows the relative weights of all three performers on the basis of MRA of their cue utilization. As can be seen, there were considerable individual differences among the performers. For example, the graph for anger reveals that Performer 1 relied heavily on spectrum, whereas Performer 2 relied heavily on sound level. Still, the two performers were equally successful at commu- nicating anger to listeners (see Table 4). This result shows that different performers may reach a similar level of achievement despite differences in their cue utilization.
Analysis of individual melodies. Table 5 presents the LME statistics for the regression models of the individual melodies. The communicative process was rather successful for all of the melo- dies, as indicated by the achievement indices, which range from .73 to .99. The differences in achievement among the three mel- odies were relatively small, suggesting that the reliability of the communication did not depend critically on the particular melody performed. The only significant differences in achievement oc-
JUSLIN
Anger
100
9 0
8 0
1~ 7 0
~, so, ~ S0,
_~ ,w.
~ 3O :
10J
0: Tempo Sound level Spectrum Aniculttlon ArUc SD
- o - P ~ I 1
I - - , , - -Perf2 [,-a, 'Perf 3
Sadness
108
9O
~ 70
$ 50
• 3O
2O
10 O,
Tempo Sound level Spectrum ArticuleUon Artlc SD
= 9" Perf 1
- ,e , - - Per f 2
- " 'Per f 3
Happiness
100
'iJ ~ P e r f 2
1 " ' ' ?
Tempo Sound level Spectrum Articulation Artic SD
Fear
100
1~ to .
> o 50.
40- 30,
20-
10-
0; Tempo Sound level Spectrum Articulation Attic SD
- o. P e r f l [
I---P~21
Figure 4. Relative weights of the regression analyses of Performers (Pert') 1-3. attic = articulation.
COMMUNICATION OF EMOTION IN MUSIC PERFORMANCE 1807
Table 5 Anger Lens Model Equation Statistics From the Regression Analyses t oo
of the Individual Melodies Emotion ~ ! [
Song and index Anger Sadness Happiness Fear • ~ so
"When the Saints" ~ 4o Achievement (ra) .96* .92* .95* .85* ~, ao Matching (G) .97* .96* .99* .95* 2o Unmodeled matching (C) .95* .88* .93* .29 1o Performer consistency (Re) .81 .83 .57 .92 o Listener consistency (R s) .81 .92 .65 .93 Tempo
"Nobody Knows" Achievement (ra) .99* .79* .89* .87* Matching (G) .99* .90* .77* .92* Sadness Unmodeled matching (C) .96* .37 .91" .58* Performer consistency (Re) .92 .88 .43 .91 1oo Listener consistency (Rs) .94 .89 .42 .92
"Greensleeves" Achievement (ra) .95* .73* .75* .80* ~ 7o. Matching (G) .98* .87* .77* .91" ~ 6o. Unmodeled matching (C) .85* -.33 .83* .38 Performer consistency (Re) .89 .92 .52 .91 :>° 40-s°" Listener consistency (Rs) .93 .96 .81 .88 30. at
• p < .05 (df = 22). ;to. 1o 1 0,
Tempo curred with regard to happiness and sadness. More specifically, achievement for happiness was significantly higher (p < .01) for "When the Saints" than for "Greensleeves," and achievement was accompanied by a higher (p < .001) matching for happiness for "When the Saints" than for "Greensleeves." Further, achievement for sadness was higher (p < .05) for "When the Saints" than for "Greensleeves." The difference in matching for sadness between the same melodies did not quite reach significance (p < .06), but the difference in unmodeled matching did (p < .001; remaining ps were not significant). Lower achievement for happiness and sad- ness in the case of "Greensleeves" may perhaps be explained by the minor mode of this melody. A large number of studies of emotional expression in musical compositions have shown that listeners associate the minor mode with sadness (for a review, see Gabrielsson & Juslin, in press). Therefore, it is possible that listeners' ratings of happiness and sadness in performances of "Greensleeves" were confounded by the minor mode. Finally, i t
should be noted that performers' cue utilization was less consistent (p < .01) for happiness than for the other emotions, regardless of the melody.
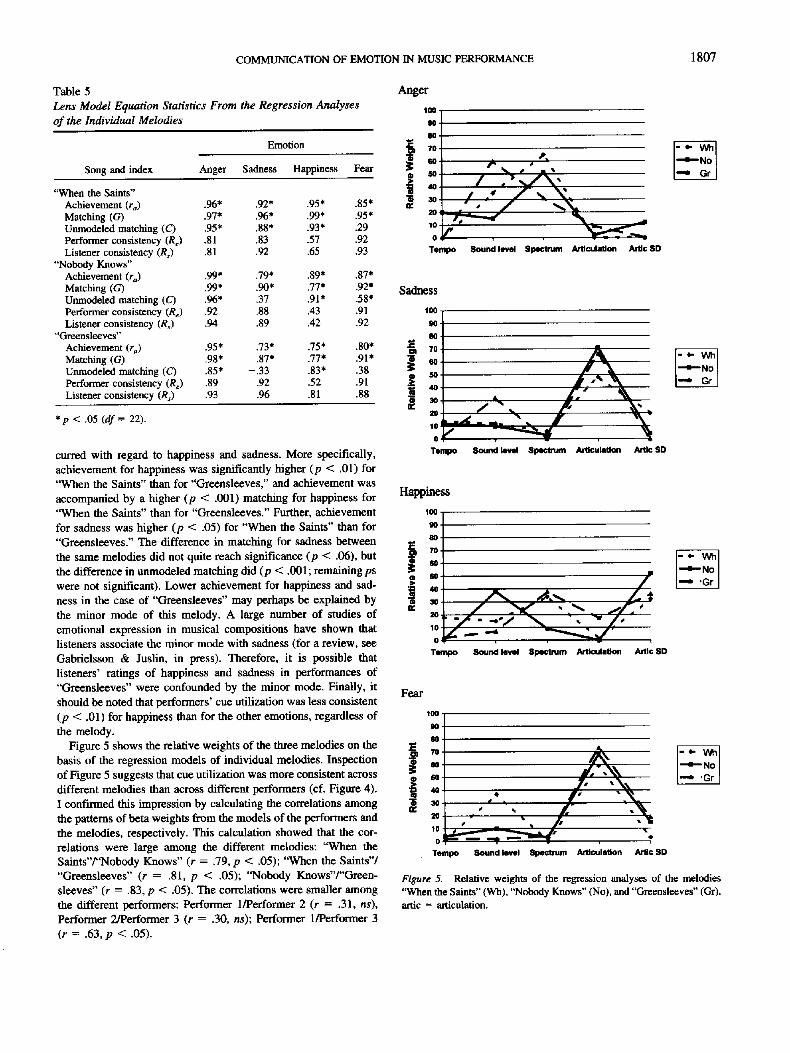
Figure 5 shows the relative weights of the three melodies on the basis of the regression models of individual melodies. Inspection of Figure 5 suggests that cue utilization was more consistent across different melodies than across different performers (cf. Figure 4). I confhrned this impression by calculating the correlations among the patterns of beta weights from the models of the performers and the melodies, respectively. This calculation showed that the cor- relations were large among the different melodies: "When the Saints"/"Nobody Knows" (r = .79, p < .05); "When the Saints"/ "Greensleeves" (r = .81, p < .05); "Nobody Knows"/"Green- sleeves" (r = .83, p < .05). The correlations were smaller among the different performers: Performer 1/Performer 2 (r = .31, ns), Performer 2/performer 3 (r = .30, ns); Performer 1/Performer 3 (r = .63, p < .05).
Sound level Spectrum Articulation ArUc SD
Sound level Spectrum Articulation Attic SO
Happiness
'iL Tempo Sound level Spectrum Articulation Anic SD
Fear
100 90 80 • 7O
i " 4O
i 3o 2o
lO o
Tempo Sound level Spectrum Articulation Artic SD
Figure 5. Relative weights of the regression analyses of the melodies "When the Saints" (Wh), "Nobody Knows" (No), and "Greensleeves" (Gr). attic = articulation.
1808 JUSLIN
However, although the cue utilization was less consistent across different performers than across different melodies, there were nonetheless some differences among the melodies. It may seem reasonable that some of these differences reflect structural char- acteristics of the melodies, which constrained the use of some cues in the performance. This theory could explain the differences between the melodies with regard to the relative weights for mean articulation and articulation variability. However, closer inspection of Figure 5 suggests that the largest differences among the three melodies occurred for sound level and spectrum, cues that are not directly tied to the structure of particular melodies.
Summary Analysis
One main finding from the regression models is that the achievement was generally high. Approximately 70% of the vari- ance in listeners' judgments of emotional expressions could be explained by the performer's expressive intention. However, achievement tended to be higher for anger than for sadness, hap- piness, and fear. The consistency indices obtained are typical of those obtained in studies of cognitive judgment, that is, between .70 and .90 (Stewart, 1988), which means that the linear compo- nent of the LME explained most of the cue utilization of both performers and listeners. About 70% of the variance was ac- counted for across the regression models, indicating that the mod- els fitted the cue utilization rather well. It should be noted that more variance was accounted for with respect to anger, sadness, and fear than with respect to happiness. Part of the inconsistency associated with happiness is explained by large individual differ- ences among the performers for this particular emotion. This result is brought home by the fact that the consistency indices for happiness were noticeably higher in the regression analyses of individual performers. However, this can only be part of the explanation because the consistency was still lower for happiness than for the other emotions (cf. Table 4).
As already noted, the LME embodies the fact that achievement is dependent on both the degree of matching between performers' and listeners' cue utilization and the consistency of cue utilization of performers and listeners. It is clearly of interest, then, whether the variability in achievement observed here should be explained in terms of matching or consistency. There was a large (r = .76) and statistically significant (p < .0001) correlation between matching and achievement across all regression models. Similarly, there was a large (r = .77) and statistically significant (p < .0001) correlation between unmodeled matching and achievement. In contrast, there were no significant correlations between achieve- ment and performer consistency (r = .05, ns) or between achieve- ment and listener consistency (r = - .07, ns). In other words, matching explained about 60% of the variance in achievement, whereas consistency explained only 0.3% (Re) and 0.5% (R,), respectively. This result shows that what determined the achieve- ment was mainly the extent to which performers' and listeners' cue utilization was matched.
The fact that roughly 70% of the variance in cue utilization was captured by the regression models means that roughly 30% of the variance was unexplained. The residual variance reflects both unsystematic and systematic variance not accounted for by the various regression models, including the effects of measurement error, order effects, memory intrusions, or configural effects in cue
utilization. Figures 3-5 also show that a large part of the residual variance was due to inconsistency in cue utilization across per- formers and melodies.
However, inconsistency does not tell the whole story. The unmodeled matching (i.e., the shared residual variance of perform- ers' and listeners' regression models) was high, suggesting that one or more unmodeled cues contributed to the residual variance of the regression models. This contribution was perhaps most important for happiness because the largest residual variance oc- curred for this emotion. Across all regression models, roughly 50% of the residual variance was shared among performers and listen- ers. However, given that about 70% of the variance in cue utili- zation was explained by the regression models, that part of the unmodeled component that was shared by performers and listeners constituted only 15% of the total variance.
Which cue had the highest ecological validity? Averaged across all regression models and correlations (1) sound level had the highest ecological validity, followed by (2) articulation, (3) spec- tntm, (4) articulation variability, and (5) tempo. Notably, a differ- ent ranking order applied to the functional validities: (1) sound level had the highest functional validity, followed by (2) tempo, (3) articulation, (4) articulation variability, and (5) spectrum. This result indicates that there were some systematic differences in the cue utilization among performers and listeners. Most notably, listeners attributed greater importance to tempo than performers, whereas performers attributed greater importance to articulation than listeners.
Discussion
The primary goal of this article was to describe how performers communicate emotions to listeners. A secondary goal was to illustrate how aspects of music performance and perception may be quantitatively related to each other so that relationships among performers' expressive intentions, acoustic cues in performances, and listeners' judgments of emotional expression can be described within a unified framework. The results reported here offer a number of important insights concerning the communicative process.
First, it is clear that the performers were highly successful at communicating emotions to listeners. Approximately 70% of the variance in listeners' judgments of emotional expression could be explained by the performer's expressive intention. This result highlights the powerful influence of the performance on the emo- tional expression of the music and supports anecdotal evidence about the expressive skills of music performers (e.g., Hudson, 1994).
Second, different emotions were associated with different pat- terns of cues. Although the relationships were only probabilistic, the present results replicate previous studies by showing that-- across different pieces of music--both performers and listeners tended to associate (a) anger with fast tempo, very high sound level, legato articulation, small articulation variability, and a lot of HF energy in the spectrum; (b) sadness with slow tempo, low sound level, legato articulation, small articulation variability, and little HF energy in the spectrum; (c) happiness with fast tempo, high sound level, staccato articulation, much articulation variabil- ity, and intermediate amount of HF energy in the spectrum; and (d) fear with slow tempo, very low sound level, staccato articulation,
COMMUNICATION OF EMOTION IN MUSIC PERFORMANCE 1809
much articulation variability, and little HF energy in the spectrum (Gabrielsson & Juslin, 1996; Juslin, 1993). Note that the relative importance of the cues varied depending on the emotion. There- fore, the variance explained by each cue across all emotions was modest.
Third, there were individual differences among the performers concerning their abilities to communicate particular emotions. Decomposition of the communicative process indicated that indi- vidual achievement depended mainly on the extent to which the performer's cue utilization matched the listeners' cue utilization. In contrast, there were no significant differences among the per- formers with regard to their consistency. On average, 70% of the variance in their cue utilization could be explained by regression models. The lack of differences in consistency may reflect the fact that only professional performers were included in the present study. A related study of amateur guitarists has suggested that their cue utilization is less consistent than that of professional guitarists (Juslin & Lankka, in press). Taken together, these findings suggest that amateur performers vary among themselves with respect to both consistency and matching, whereas professional performers acquire such a high degree of control over their cue utilization that they vary among themselves only with regard to matching.
Fourth, the results showed that the communicative process was successful regardless of the particular melody performed. In fact, cue utilization was more consistent across different melodies than across different performers. Nonetheless, the results also suggested that certain aspects of the melodic structure might influence the reliability of the communicative process, either by confounding listeners' judgments or by constraining performers' uses of partic- ular cues. An important problem for future research is therefore to explore how the performance interacts with local features of the melodic structure in determining the emotional expression.
Fifth, the results indicated that two performers could reach a similar level of achievement despite differences in their cue utili- zation. This finding is reminiscent of the paradox mentioned in the introduction, namely that the communicative process is successful despite variability in cue utilization across different performers or melodies. These seemingly contradictory results can be understood in terms of the lens model described earlier: High accuracy despite large variability in cue utilization can be explained by the fact that the communicative process relies on several probabilistic but partly interchangeable (i.e., redundant) cues that listeners combine in flexible ways to arrive at reliable judgments of the intended emotional expression. Because of the redundancy of the cues, there is no pressure toward uniformity in cue utilization; more than one cue utilization strategy may lead to the same level of achievement.
Finally, there were systematic differences between performers and listeners with regard to their cue utilization. Thus, for example, listeners attributed greater importance to tempo than performers did, whereas performers attributed greater importance to articula- tion than listeners did. The reasons for these differences are not known. However, it is possible that some of the differences reflect differences between performers and listeners with respect to their expertise. For example, more expertise is probably needed to appreciate differences in articulation than differences in tempo. The importance of tempo for listeners' judgments is consistent with the results from previous studies (e.g., Hevner, 1936; Juslin, 1997c; Scherer & Oshinsky, 1977). The fact that tempo was not equally important as a predictor of performers' intentions could
reflect the fact that the performers selected different tempi depend- ing on the melody.
Limitations of the Findings
The present study is limited in several respects. First, only a small number of performers and melodies were included in the study. Obviously, further experiments should be conducted using different instruments, melodies, performers, and listeners. Only then can the generalizability of the present findings be evaluated. One complicating factor in this study was that the structures of the melodies themselves carded particular emotional expressions, which presumably made it more or less difficult to communicate other emotions. Furthermore, all of the melodies were well known, with lyrics that refer to birth, death, or being saved, which are emotionally charged topics. It is possible that the performers and the listeners were influenced by the emotional connotations of the remembered lyrics and that the communicative process would be more reliable for less well known or less emotionally charged pieces. Also, by not analyzing structural variables, this study left out effects on listeners' judgments associated with the melodic structure. It is conceivable that some of the inconsistency in cue utilization across different melodies reflected structural constraints of the melodies. Future studies should focus on the complex interaction between the emotional expression of the melody and the emotional expression of the performance (Lindstr0m, 2000). One way of doing this could be to expand the lens model so as to also include acoustic cues associated with the structure of partic- ular pieces, such as rhythm, mode, melodic contour, and tonal progression (Juslin, in press-b).
Another limitation of this study is that it included only summary measures of cues. From an intuitive point of view, it would seem that much of the expressiveness in performances lies in continu- ously changing patterns of tempo and dynamics. The uumodeled matching of the cue utilization of performers and listeners in this study suggests that there are yet unidentified cues involved in this communicative process, even if their contribution would appear to be small. It is quite possible that part of this variance reflects the use of continuously changing patterns of tempo and dynamics across the performance. A recent study has indicated that timing patterns can convey emotional information to listeners (Juslin & Madison, 1999). The characteristics of the patterns are still un- known, which explains why timing patterns were not considered in this study. However, if we were to include timing patterns in future analyses, we would expect the unmodeled matching between per- formers and listeners to decrease.
In this study, performers were highly successful at communi- cating specific emotions to listeners. However, given that the present task (i.e., to perform the same piece of music with several different expressions) is somewhat artificial, an important question is whether similar effects would be obtained under natural circum- stances, such as a concert. Only a few studies have studied emo- tional expression in natural music performances. However, ways of getting closer to ecologically valid settings may be to analyze existing recordings of performances or to observe performers, from the preparation of a piece to the actual performance in a concert.
Siegwart and Scherer (1995) studied emotional expression in opera singing by analyzing existing recordings by well-known
1810 JUSLIN
artists. They found that (a) different interpretations elicited differ- ent listener ratings of emotional expressiveness, (b) voice samples differed substantially with respect to acoustic cues, and (c) listen- ers' judgments could be successfully predicted on the basis of the acoustic cues. These are important findings, indeed, because they suggest that the results reported in the present study are not confined to the laboratory.
Main Factors Influencing Cue Utilization
What are the main factors influencing cue utilization? More specifically, what is the origin of the nonverbal code used by performers to communicate emotions to listeners? Juslin (1998, in press-b) has suggested that the code largely reflects two factors. The first factor influencing communication of emotion in music performance is brain programs for vocal expression of emotions. Studies of monkeys and humans with brain lesions have uncovered the neurological substrates underlying spontaneous vocalizations. These studies have yielded evidence of brain programs that func- tion to initiate and organize "prewired" vocal expressions (JiJrgens &von Cramon, 1982; Ploog, 1986). Thus, it can be hypothesized that music performers communicate emotions to listeners by using the same acoustic code as is used in vocal expression. The idea that there is an intimate relationship between music and the human voice has a long history (Rousseau, 1761/1993; von Helmholtz, 1863/1954). However, it is only recently that empirical evidence supporting this idea has surfaced. A systematic review of the cue utilization in vocal expression and music performance has revealed a large number of similarities between the two modalities (Juslin, 1999).
The second factor governing emotional expression in perfor- mance is social learning or specific memories. This is a lifelong process that begins with the interaction between mother and infant (e.g., Papousek, 1996) and continues throughout life, with accu- mulated experience. Performers learn links between acoustic cues and extramusical aspects (e.g., body language, motion) through analogies. This fact implies that extramusicai life experiences are of importance to learning expressivity in performance (cf. Woody, in press). Because different performers will tend to have different life experiences, this factor explains why there are individual differences in cue utilization among performers.
Possible Applications for Music Education
The type of knowledge gained from the lens model paradigm might lead to a number of important applications. Thus, for ex- ample, computer algorithms that can encode and decode emotions could play an important role in modem information technology, as envisaged in the area of affective computing: computing that relates to, arises from, or deliberately influences emotions (Juslin, 1996; Heard, 1997).
One application of the lens model paradigm that could be particularly important for the music domain concerns the training of music performers' expressive skills in music education. A large number of studies have suggested that expressive aspects of music performance are neglected in music education (e.g., Persson et al., 1996; Tait, 1992). One reason for this may be that communication of emotion involves implicit knowledge that is difficult to convey from teacher to student. The lens model may be useful in this
context because it makes it possible to directly compare perform- ers' cue utilization with listeners' cue utilization. This is a neces- sary requirement if one wants to improve the communicative process.
One potentially useful method for improving emotional com- munication on the basis of the lens model paradigm is so-called cognitive feedback (CFB). Originally developed in studies of cognitive judgment (Hammond & Boyle, 1971), CFB means that we should give performers a chance to compare their own cue utilization to an optimal model for emotional communication on the basis of listeners' cue utilization. This process would involve the same procedures that were used in the present study (i.e., acoustic analyses, listening tests, regression modeling, lens mod- eling), with the addition that the performers also receive feedback regarding how their cue utilization compares to listeners' cue utilization. For example, a performer might discover that he or she uses legato articulation to express happiness, whereas listeners associate staccato articulation with happiness. The performer could then be instructed to change his or her cue utilization to increase its similarity with listeners' cue utilization (Juslin & Persson, in press).
A preliminary test of the CFB method was conducted by Juslin and Laukka (in press). The results showed that CFB yielded a 50% increase in communication accuracy after only a single feedback session. Therefore, an important goal for future research could be to develop user-friendly computer applications that provide aspir- ing performers with feedback to improve their expressive skills. Applications of computer feedback for performers have been around for some time, concerning, for instance, piano technique (e.g., Tucker et al., 1977), conducting (Schwaegler, 1984), and pitch in singing (e.g., Wilson, 1982). However, none of these earlier applications has concerned expressive aspects of perfor- mance. CFB programs would require (a) algorithms for automatic analysis of acoustic characteristics of performances and (b) algo- rithms that simulate judgments of the relevant listener populations. The lens model advocated in this article provides the kind of detailed knowledge about the communicative process that is re- quired to create such algorithms.
Concluding Remarks
Viewing communication of emotion in music performance through a Brunswikian lens has a number of important implica- tions. First, previous studies have tended to focus on either ex- pression or recognition of emotion. However, Brunswik's lens model provides the tool for an ultimately more interesting enter- prise--how to relate expression to recognition. Each of these aspects can only be fully understood in relation to the other, and knowledge about the probabilistic relationships between perform- ers and listeners is crucial if one wants to improve the communi- cative process. Second, future studies should consider a whole range of cues in order to deal with the complete code used and thereby permit both performers and listeners to demonstrate their flexibility in cue utilization. This study may uncover a communi- cative process that is not perfect but probabilistic, not rich but robust. Hopefully, the ideas presented in this article will stimulate further research on emotional communication in music perfor- mance. This issue is without doubt of fundamental importance to the understanding of musical behavior.
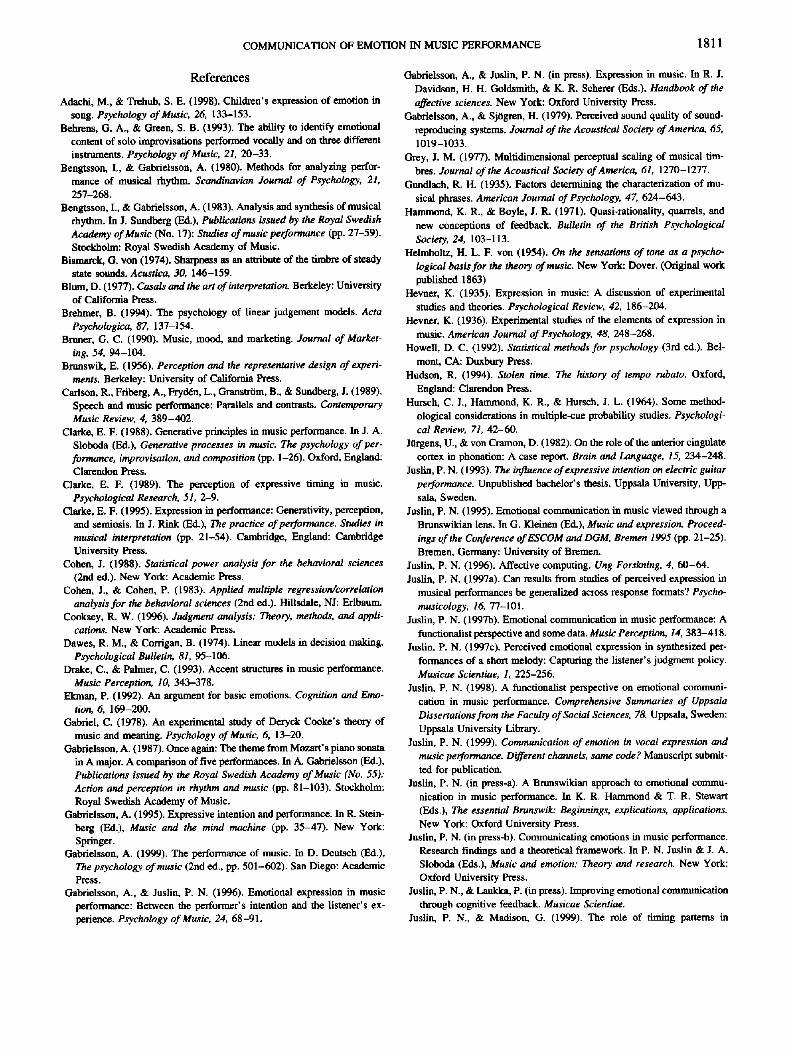
COMMUNICATION OF EMOTION IN MUSIC PERFORMANCE 1811
References
Adachi, M., & Trehub, S. E. (1998). Children's expression of emotion in song. Psychology of Music, 26, 133-153.
Behreus, G. A., & Green, S. B. (1993). The ability to identify emotional content of solo improvisations performed vocally and on three different instruments. Psychology of Music, 21, 20-33.
Bengtsson, I., & Gabrielsson, A. (1980). Methods for analyzing perfor- mance of musical rhythm. Scandinavian Journal of Psychology, 21, 257-268.
Bengtsson, I., & Gahrielssun, A. (1983). Analysis and synthesis of musical rhythm. In J. Sundberg (Ed.), Publications issued by the Royal Swedish Academy of Music (No. 17): Studies of music performance (pp. 27-59). Stockholm: Royal Swedish Academy of Music.
Bismarck, G. von (1974). Sharpness as an attribute of the timbre of steady state sounds. Acustica, 30, 146-159.
Blum, D. (1977). Casals and the art of interpretation. Berkeley: University of California Press.
Brehmer, B. (1994). The psychology of linear judgement models. Acta Psychologica, 87, 137-154.
Bruner, G. C. (1990). Music, mood, and marketing. Journal of Market- ing, 54, 94-104.
Brunswik, E. (1956). Perception and the representative design of experi- ments. Berkeley: University of California Press.
Carlson, R., Friberg, A., Fryd~n, L., Granstr6m, B., & Sundberg, J. (1989). Speech and music performance: Parallels and contrasts. Contemporary Music Review, 4, 389-402.
Clarke, E. F. (1988). Generative principles in music performance. In J. A. Sloboda (F_xl.), Generative processes in music. The psychology of per- formance, improvisation, and composition (pp. 1-26). Oxford, England: Clarendon Press.
Clarke, E. F. (1989). The perception of expressive timing in music. Psychological Research, 51, 2-9.
Clarke, E. F. (1995). Expression in performance: Generativity, perception, and semiosis. In J. Rink (Ed.), The practice of performance. Studies in musical interpretation (pp. 21-54). Cambridge, England: Cambridge University Press.
Cohen, J. (1988). Statistical power analysis for the behavioral sciences (2rid ed.). New York: Academic Press.
Cohen, J., & Cohen, P. (1983). Applied multiple regression~correlation analysis for the behavioral sciences (2nd ed.). Hillsdale, NJ: Erlbaum.
Cooksey, R. W. (1996). Judgment analysis: Theory, methods, and appli- cations. New York: Academic Press.
Dawes, R. M., & Corrigan, B. (1974). Linear models in decision making. Psychological Bulletin, 81, 95-106.
Drake, C., & Palmer, C. (1993). Accent structures in music performance. Music Perception, 10, 343-378.
Ekman, P. (1992). An argument for basic emotions. Cognition and Emo- tion, 6, 169-200.
Gabriel, C. (1978). An experimental study of Deryck Cooke's theory of music and meaning. Psychology of Music, 6, 13-20.
Gabrielsson, A. (1987). Once again: The theme from Mozart's piano sonata in A major. A comparison of five performances. In A. Gabrielssun (Ed.), Publications issued by the Royal Swedish Academy of Music (No. 55): Action and perception in rhythm and music (pp. 81-103). Stockholm: Royal Swedish Academy of Music.
Gabrielsson, A. (1995). Expressive intention and performance. In R. Stein- berg (Ed.), Music and the mind machine (pp. 35-47). New York: Springer.
Gabrielsson, A. (1999). The performance of music. In D. Deutscti (Ed.), The psychology of music (2nd ed., pp. 501-602). San Diego: Academic Press.
Gahrielsson, A., & Justin, P. N. (1996). Emotional expression in music performance: Between the performer's intention and the listener's ex- perience. Psychology of Music, 24, 68-91.
Gabrielsson, A., & Justin, P. N. (in press). Expression in music. In R. J. Davidson, H. H. Goldsmith, & K. R. Scherer (F_As.), Handbook of the affective sciences. New York: Oxford University Press.
Gabrielsson, A., & Sjtgren, H. (1979). Perceived sound quality of sound- reproducing systems. Journal of the Acoustical Society of America, 65, 1019-1033.
Grey, J. M. (1977). Multidimensional perceptual scaling of musical tim- bres. Journal of the Acoustical Society of America, 61, 1270-1277.
Gundlach, R. H. (1935). Factors determining the characterization of mu- sical phrases. American Journal of Psychology, 47, 624-643.
Hammond, K. R., & Boyle, J. R. (1971). Quasi-rationality, quarrels, and new conceptions of feedback. Bulletin of the British Psychological Society, 24, 103-113.
Helmholtz, H. L. F. von (1954). On the sensations of tone as a psycho- logical basis for the theory of music. New York: Dover. (Original work published 1863)
Hevner, K. (1935). Expression in music: A discussion of experimental studies and theories. Psychological Review, 42, 186-204.
Hevner, K. (1936). Experimental studies of the elements of expression in music. American Journal of Psychology, 48, 248-268.
Howell, D. C. (1992). Statistical methods for psychology (3rd ed.). Bel- mont, CA: Duxbury Press.
Hudson, R. (1994). Stolen time. The history of tempo rubato. Oxford, England: Clarendon Press.
Hursch, C. J., Hammond, K. R., & Hursch, J. L. (1964). Some method- ological considerations in multiple-cue probability studies. Psychologi- cal Review, 71, 42-60.
Jtirgens, U., & vun Cramon, D. (1982). On the role of the anterior cingulate cortex in phonation: A case report. Brain and Language, 15, 234-248.
Justin, P. N. (1993). The influence of expressive intention on electric guitar performance. Unpublished bachelor's thesis, Uppsala University, Upp- sala, Sweden.
Juslin, P. N. (1995). Emotional communication in music viewed through a Brunswikian lens. In G. Kleinen (Ed.), Music and expression. Proceed- ings of the Conference of ESCOM and DGM, Bremen 1995 (pp. 21-25). Bremen, Germany: University of Bremen.
Justin, P. N. (1996). Affective computing. Ung Forskning, 4, 60-64. Justin, P. N. (1997a). Can results from studies of perceived expression in
musical performances be generalized across response formats.'? Psycho- musicology, 16, 77-101.
Justin, P. N. (1997"o). Emotional communication in music performance: A functionalist perspective and some data. Music Perception, 14, 383-418.
Juslin, P. N. (1997c). Perceived emotional expression in synthesized per- formances of a short melody: Capturing the listener's judgment policy. Musicae Scientiae, I, 225-256.
Juslin, P. N. (1998). A functionalist perspective on emotional communi- cation in music performance. Comprehensive Summaries of Uppsala Dissertations from the Faculty of Social Sciences, 78. Uppsala, Sweden: Uppsala University Library.
Justin, P. N. (1999). Communication of emotion in vocal expression and music performance. Different channels, same code? Manuscript submit- ted for publication.
Justin, P. N. (in press-a). A Brunswikian approach to emotional commu- nication in music performance. In K. R. Hammond & T. R. Stewart (Eds.), The essential Brunswik: Beginnings, explications, applications. New York: Oxford University Press.
Justin, P. N. (in press-b). Communicating emotions in music performance. Research findings and a theoretical framework. In P. N. Justin & J. A. Sloboda (Eds.), Music and emotion: Theory and research. New York: Oxford University Press.
Juslin, P. N., & Laukka, P. (in press). Improving emotional communication through cognitive feedback. Musicae Scientiae.
Justin, P. N., & Madison, G. (1999). The role of timing patterns in
1812 JUSLIN
recognition of emotional expression from musical performance. Music Perception, 17, 197-221.
Juslin, P. N., & Persson, R. S. (in press). Emotional communication. In R. Parncutt & G. E. McPherson (Eds.), The science and psychology of music performance. Creative strategies for teaching and learning. New York: Oxford University Press.
Kendall, R. A., & Carterette, E. C. (1990). The communication of musical expression. Music Perception, 8, 129-164.
Kennedy, N. (1990). Always playing. London: Weidenfield and Nicolson. Lindstrtm, E. (2000). Interplay between music performance and melodic
structure in emotional expression of music. Manuscript submitted for publication.
Maher, T. F. (1980). A rigorous test of the proposition that musical intervals have different psychological effects. American Journal of Psy- chology, 93, 309-327.
Nielztn, S., & Cesarec, Z. (1981). On the perception of emotional meaning in music. Psychology of Music, 9, 17-31.
Oatley, K. (1992). Best laid schemes. The psychology of emotions. Cam- bridge, MA: Harvard University Press.
Palmer, C. (1989). Mapping musical thought to musical performance. Journal of Experimental Psychology: Human Perception and Perfor- mance, 15, 331-346.
Palmer, C. (1997). Music performance. Annual Review of Psychology, 48, 115-138.
Papousek, M. (1996). Intuitive parenting: A hidden source of musical stimulation in infancy. In I. Deli~ge & J. A. Sloboda (Eds.), Musical beginnings. Origins and development of musical competence (pp. 89- 112). New York: Oxford University Press.
Persson, R. S. (1995). Musical reality: Exploring the subjective world of performers. In R. Monelle & C. T. Gray (Eds.), Song and signification. Studies in music semiotics (pp. 58-63). Edinburgh, Scotland: University of Edinburgh, Faculty of Music.
Persson, R. S., Pratt, G., & Robson, C. (1996). Motivational and influential components of musical performance: A qualitative analysis. In A. J. Cropley & D. Dehn (Eds.), Fostering the growth of high ability: Euro- pean perspectives (pp. 303-320). Norwood, NJ: Ablex.
Picard, R. W. (1997). Affective computing. Cambridge, MA: MIT Press. Ploog, D. (1986). Biological foundations of the vocal expressions of
emotions. In R. Plutchik & H. Kellerman (Eds.), Emotion. Theory, research, and experience: Vol. 3. Biological foundations of emotion (pp. 173-197). New York: Academic Press.
Plutchik, R. (1994). The psychology and biology of emotion. New York: Harper-Collins.
Repp, B. H. (1998). Variations on a theme by Chopin: Relations between perception and production of timing in music. Journal of Experimental Psychology: Human Perception and Performance, 24, 791-811.
Rigg, M. G. (1964). The mood effects of music: A comparison of data from earlier investigations. Journal of Psychology, 58, 427-438.
Rousseau, J.-J. (1993). Essai sur l'origine des langues. Paris: GF- Flammarion. (Original work published 1761)
Scherer, K. R., & Oshinsky, J. S. (1977). Cue utilization in emotion attribution from auditory stimuli. Motivation and Emotion, 1, 331-346.
Schoen, M., & Gatewood, E. L. (1927). The mood effects of music. In M. Schoen (Ed.), The effects of music (pp. 131-151). New York: Harcourt Brace & Company.
Schumacher, M. (1995). Crossroads. The life and music of Eric Clapton. New York: Hyperion.
Schwaegler, D. G. (1984). A computer-based trainer for music conducting:
The effects of four feedback modes. Unpublished doctoral dissertation, University of Iowa, Iowa City.
Seashore, C. E. (1938). The psychology of music. New York: McGraw- Hill.
Seashore, H. G. (1937). An objective analysis of artistic singing. In C. E. Seashore (Ed.), University of Iowa studies in the psychology of music: Vol. IV~Objective analysis of musical performance (pp. 12-157). Iowa City: University of Iowa.
Shaffer, L. H. (1992). How to interpret music. In M. R. Jones & S. Holleran (Eds.), Cognitive bases of musical communication (pp. 263-278). Wash- ington: American Psychological Association.
Shaffer, L. H., & Todd, N. (1987). The interpretative component in musical performance. In A. Gabrielsson (Ed.), Publications issued by the Royal Swedish Academy of Music (No. 55): Action and perception in rhythm and music (pp. 139-152). Stockholm: Royal Swedish Academy of Music.
Shannon, C. E., & Weaver, W. (1949). The mathematical theory of com- munication. Urbana: University of Illinois.
Siegwart, H., & Scherer, K. R. (1995). Acoustic concomitants of emotional expression in operatic singing: The case of Lucia in Ardi gli incensi. Journal of Voice, 9, 249-260.
Sloboda, J. A. (1983). The communication of musical metre in piano performance. Quarterly Journal of Experimental Psychology, 35, 377- 396.
Sloboda, J. A. (1994). Music performance: Expression and the develop- ment of excellence. In R. Aiello & J. A. Sloboda (Eds.), Musical perceptions (pp. 152-169). New York: Oxford University Press.
Stewart, T. R. (1988). Judgment analysis: Procedures. In B. Brehmer & C. R. B. Joyce (Eds.), Human judgment: The SJT view (pp. 41-74). Amsterdam: North-Holland Elsevier.
Sundberg, J., Iwarsson, J., & HagegArd, H. (1995). A singer's expression of emotions in sung performance. In O. Fujimura & M. Hirano (Eds.), Vocal fold physiology: Voice quality control (pp. 217-229). San Diego: Singular Press.
Tait, M. (1992). Teaching strategies and styles. In R. Colwell (Ed.), Handbook of research on music teaching and learning (pp. 525-534). New York: Schirmer Books.
Ternstrtm, S. (1992). Swell user's guide. Stockholm, Sweden: Soundswell Music Acoustics HB.
Thompson, W. F., & Robitaille, B. (1992). Can composers express emo- tions through music? Empirical Studies of the Arts, 10, 79-89.
Todd, N. (1989). A computational model of rubato. Contemporary Music Review, 3, 69-88.
Tucker, W. H., Bates, R. H. T., Frykberg, S. D., Howarth, R. J., Kennedy, W. K., Lamb, M. R., & Vaughan, R. G. (1977). An interactive aid for musicians. International Journal of Man-Machine Studies, 9, 653-661.
Wedin, L. (1972). A multi-dimensional study of perceptual-emotional qualities in music. Scandinavian Journal of Psychology, 13, 1-17.
Wilson, J. (1982). An electronic instrument for conditioning the singing formant. Journal of Research in Singing, 5, 18-32.
Woody, R. (in press). Learning expressivity in music performance: An exploratory study. Research Studies in Music Education.
Received May 11, 1999 Revision received March 15, 2000
Accepted March 15, 2000 •