Cubic law with aperture-length correlation: implications
12
Cubic law with aperture-length correlation: implications for network scale fluid flow Christian Klimczak & Richard A. Schultz & Rishi Parashar & Donald M. Reeves Abstract Previous studies have computed and modeled fluid flow through fractured rock with the parallel plate approach where the volumetric flow per unit width normal to the direction of flow is proportional to the cubed aperture between the plates, referred to as the traditional cubic law. When combined with the square root relation- ship of displacement to length scaling of opening-mode fractures, total flow rates through natural opening-mode fractures are found to be proportional to apertures to the fifth power. This new relationship was explored by examining a suite of flow simulations through fracture networks using the discrete fracture network model (DFN). Flow was modeled through fracture networks with the same spatial distribution of fractures for both correlated and uncorrelated fracture length-to-aperture relationships. Results indicate that flow rates are significantly higher for correlated DFNs. Furthermore, the length-to-aperture rela- tions lead to power-law distributions of network hydraulic conductivity which greatly influence equivalent permeability tensor values. These results confirm the importance of the correlated square root relationship of displacement to length scaling for total flow through natural opening-mode fractures and, hence, emphasize the role of these correlations for flow modeling. Keywords Fractured rocks . Fluid flow . Cubic law . Displacement to length scaling . Numerical modeling Introduction Dilitant fractures in rock (Fig. 1) are the most abundant structures in the brittle part of the Earth’ s crust. Their size can range from microscopic to regional scales, e.g. microcracks, joints, large-scale joints and joint networks. Wherever bedrock lacks interconnected pore space, as in crystalline or highly consolidated sedimentary rocks, fractures govern the hydraulic properties of these rocks (e.g. Bear et al. 1993; National Research Council 1996). Hence, a study of fractured rock and fracture networks in terms of their hydraulic conductivity is of central importance to the petroleum industry as well as to hydrogeology and geo- logical engineering with implications for contaminant migration through fractured rock masses and petroleum extraction from fractured reservoirs. Accordingly, many studies have put emphasis on the characterization of fractures (e.g. Cowie and Scholz 1992a; Dawers et al. 1993; Dawers and Anders 1995; Rubin 1995; Vermilye and Scholz 1995; Clark and Cox 1996), and modeling of fluid flow through fractures and fracture networks (e.g. Long et al. 1985; Brown 1987; Taylor et al. 1999; Rivard and Delay 2004). So far, however, both fields have mainly been studied independently from each other with relatively few attempts being made to connect the disciplines of fracture mechanics and fracture hydrology with theoretical considerations (de Dreuzy et al. 2001, Baghbanan and Jing 2006; Masihi and King 2007; Neuman 2008) or by matching results of numerical modeling around fracture data from a single borehole (Hartley et al. 2004). In this study, it is shown that fluid flow through fractures can be directly correlated to recently established relationships of fracture scaling that previously have not been exploited by fracture hydrology. Flow through fractures In most studies, fluid flow through fractures is concep- tualized by using the assumption of laminar flow between parallel plates (Boussinesq 1868; Snow 1965). The parallel-plate solution for the Navier-Stokes equations leads to the commonly used “cubic law” (Lomize 1961; Snow 1965; Louis 1969; Krantz et al. 1979; Tsang and Witherspoon 1981): Q ¼rg 12m ð Þ 1 b 3 rh; ð1Þ Received: 1 May 2009 / Accepted: 15 December 2009 * Springer-Verlag 2010 C. Klimczak ()) : R. A. Schultz Geomechanics-Rock Fracture Group, Department of Geological Sciences and Engineering, University of Nevada, Mail Stop 172, Reno, NV 89557, USA e-mail: [email protected] Tel.: +1-775-8133528 Fax: +1-775-7841833 R. Parashar : D. M. Reeves Division of Hydrological Sciences, Desert Research Institute, 2215 Raggio Parkway, Reno, NV 89512, USA Hydrogeology Journal DOI 10.1007/s10040-009-0572-6
Transcript of Cubic law with aperture-length correlation: implications

Cubic law with aperture-length correlation: implications for networkscale fluid flow
Christian Klimczak & Richard A. Schultz &
Rishi Parashar & Donald M. Reeves
Abstract Previous studies have computed and modeledfluid flow through fractured rock with the parallel plateapproach where the volumetric flow per unit width normalto the direction of flow is proportional to the cubedaperture between the plates, referred to as the traditionalcubic law. When combined with the square root relation-ship of displacement to length scaling of opening-modefractures, total flow rates through natural opening-modefractures are found to be proportional to apertures to thefifth power. This new relationship was explored byexamining a suite of flow simulations through fracturenetworks using the discrete fracture network model (DFN).Flow was modeled through fracture networks with the samespatial distribution of fractures for both correlated anduncorrelated fracture length-to-aperture relationships.Results indicate that flow rates are significantly higher forcorrelated DFNs. Furthermore, the length-to-aperture rela-tions lead to power-law distributions of network hydraulicconductivity which greatly influence equivalent permeabilitytensor values. These results confirm the importance of thecorrelated square root relationship of displacement to lengthscaling for total flow through natural opening-mode fracturesand, hence, emphasize the role of these correlations for flowmodeling.
Keywords Fractured rocks . Fluid flow . Cubic law .Displacement to length scaling . Numerical modeling
Introduction
Dilitant fractures in rock (Fig. 1) are the most abundantstructures in the brittle part of the Earth’s crust. Their size canrange from microscopic to regional scales, e.g. microcracks,joints, large-scale joints and joint networks. Whereverbedrock lacks interconnected pore space, as in crystallineor highly consolidated sedimentary rocks, fractures governthe hydraulic properties of these rocks (e.g. Bear et al. 1993;National Research Council 1996). Hence, a study offractured rock and fracture networks in terms of theirhydraulic conductivity is of central importance to thepetroleum industry as well as to hydrogeology and geo-logical engineering with implications for contaminantmigration through fractured rock masses and petroleumextraction from fractured reservoirs. Accordingly, manystudies have put emphasis on the characterization offractures (e.g. Cowie and Scholz 1992a; Dawers et al.1993; Dawers and Anders 1995; Rubin 1995; Vermilye andScholz 1995; Clark and Cox 1996), and modeling of fluidflow through fractures and fracture networks (e.g. Long et al.1985; Brown 1987; Taylor et al. 1999; Rivard and Delay2004). So far, however, both fields have mainly been studiedindependently from each other with relatively few attemptsbeing made to connect the disciplines of fracture mechanicsand fracture hydrology with theoretical considerations(de Dreuzy et al. 2001, Baghbanan and Jing 2006; Masihiand King 2007; Neuman 2008) or by matching results ofnumerical modeling around fracture data from a singleborehole (Hartley et al. 2004). In this study, it is shown thatfluid flow through fractures can be directly correlated torecently established relationships of fracture scaling thatpreviously have not been exploited by fracture hydrology.
Flow through fracturesIn most studies, fluid flow through fractures is concep-tualized by using the assumption of laminar flow betweenparallel plates (Boussinesq 1868; Snow 1965). Theparallel-plate solution for the Navier-Stokes equationsleads to the commonly used “cubic law” (Lomize 1961;Snow 1965; Louis 1969; Krantz et al. 1979; Tsang andWitherspoon 1981):
Q ¼ �rg 12mð Þ�1b3rh; ð1Þ
Received: 1 May 2009 /Accepted: 15 December 2009
* Springer-Verlag 2010
C. Klimczak ()) :R. A. SchultzGeomechanics-Rock Fracture Group,Department of Geological Sciences and Engineering,University of Nevada,Mail Stop 172, Reno, NV 89557, USAe-mail: [email protected].: +1-775-8133528Fax: +1-775-7841833
R. Parashar :D. M. ReevesDivision of Hydrological Sciences,Desert Research Institute,2215 Raggio Parkway, Reno, NV 89512, USA
Hydrogeology Journal DOI 10.1007/s10040-009-0572-6
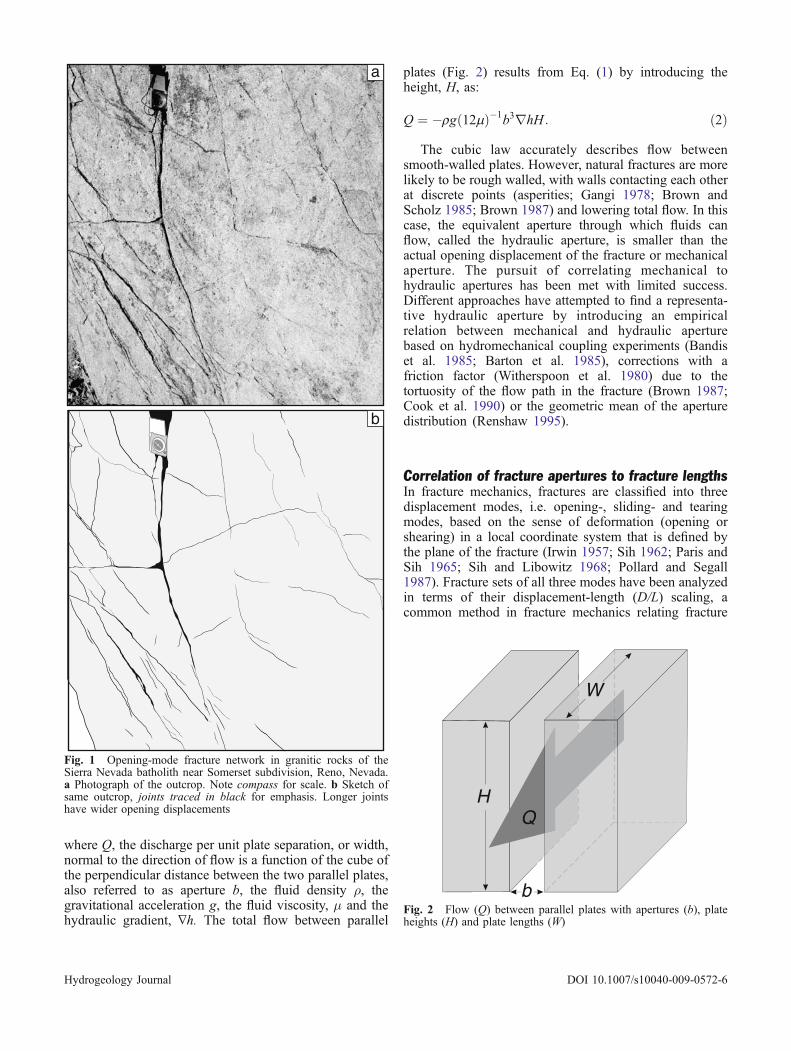
where Q, the discharge per unit plate separation, or width,normal to the direction of flow is a function of the cube ofthe perpendicular distance between the two parallel plates,also referred to as aperture b, the fluid density ρ, thegravitational acceleration g, the fluid viscosity, μ and thehydraulic gradient, ∇h. The total flow between parallel
plates (Fig. 2) results from Eq. (1) by introducing theheight, H, as:
Q ¼ �rg 12mð Þ�1b3rhH : ð2ÞThe cubic law accurately describes flow between
smooth-walled plates. However, natural fractures are morelikely to be rough walled, with walls contacting each otherat discrete points (asperities; Gangi 1978; Brown andScholz 1985; Brown 1987) and lowering total flow. In thiscase, the equivalent aperture through which fluids canflow, called the hydraulic aperture, is smaller than theactual opening displacement of the fracture or mechanicalaperture. The pursuit of correlating mechanical tohydraulic apertures has been met with limited success.Different approaches have attempted to find a representa-tive hydraulic aperture by introducing an empiricalrelation between mechanical and hydraulic aperturebased on hydromechanical coupling experiments (Bandiset al. 1985; Barton et al. 1985), corrections with afriction factor (Witherspoon et al. 1980) due to thetortuosity of the flow path in the fracture (Brown 1987;Cook et al. 1990) or the geometric mean of the aperturedistribution (Renshaw 1995).
Correlation of fracture apertures to fracture lengthsIn fracture mechanics, fractures are classified into threedisplacement modes, i.e. opening-, sliding- and tearingmodes, based on the sense of deformation (opening orshearing) in a local coordinate system that is defined bythe plane of the fracture (Irwin 1957; Sih 1962; Paris andSih 1965; Sih and Libowitz 1968; Pollard and Segall1987). Fracture sets of all three modes have been analyzedin terms of their displacement-length (D/L) scaling, acommon method in fracture mechanics relating fracture
a
b
Fig. 1 Opening-mode fracture network in granitic rocks of theSierra Nevada batholith near Somerset subdivision, Reno, Nevada.a Photograph of the outcrop. Note compass for scale. b Sketch ofsame outcrop, joints traced in black for emphasis. Longer jointshave wider opening displacements
QH
b
W
Fig. 2 Flow (Q) between parallel plates with apertures (b), plateheights (H) and plate lengths (W)
Hydrogeology Journal DOI 10.1007/s10040-009-0572-6

lengths (L) to the corresponding amounts of displacement(D). D/L scaling of sliding- (or tearing-) mode disconti-nuities, i.e. faults, for example, is well documented andunderstood. Maximum shearing displacements of faultpopulations are proportional to fault lengths; they scale asa linear function (e.g. Cowie and Scholz 1992a,b; Clarkand Cox 1996; Scholz 2002; Schultz et al. 2008a):
Dmax ¼ gL; ð3Þ
where Dmax is the maximum (shearing) displacementalong the fault, L the length and g a proportionalitycoefficient related to the rock mechanical properties of thesurrounding rock. In Fig. 3 (after Schultz et al. 2008a), thecompiled fault data includes a total of 14 fault populationsscaling linearly in displacement and length. Values of grange between 10−1 and 10−3 (dotted lines) for the entirecompilation of faults, with smaller ranges of g forindividual fault populations.
Early studies of opening-mode fractures, i.e. joints,veins, and dikes, also suggested a linear relationshipbetween maximum fracture displacements and lengths(Vermilye and Scholz 1995). By linking the general D/Lscaling relationship for fractures (Eq. 3) with critical stressintensity factor (fracture toughness) KIc associated withthe growth of joints and other opening-mode fractures,Olson (2003) obtained, instead, a non-linear, square rootpower-law distribution:
Dmax ¼ aL0:5; ð4Þ
where α, the proportionality coefficient:
a ¼ KIc 1� nð Þ2E
ffiffiffi8
pffiffiffip
p ð5Þ
includes the fracture toughness KIc, Poison’s ratio ν, andYoung’s modulus E, all material specific constants of thehost rock. Olson (2003) further showed that mechanicalinteraction between closely spaced fractures can lead tovariability in scaling exponents depending on the fracturespacing and suggested that exponents greater than n=0.5could result from post-jointing relaxation or other secon-dary effects.
The exponent of n=0.5 is related to a constant fracturetoughness, which describes the ability of a rock containinga fracture to resist further fracturing (Olson 2003; Schultzet al. 2008a). This relationship is supported by a total of10 field datasets composed of up to 46 individualmeasurements of dikes, veins and joints (Fig. 4), including7 previously reported fracture sets (Olson 2003; Schultz etal. 2008a; Schultz et al. 2008b) and 3 sets newly acquiredfor this study. The new data consist of Dmax/L measure-ments of 2 sets of dikes and 1 set of veins from outcropswithin the Sierra Nevada batholith (see Appendix 2 fordescription). All of these datasets are consistent withsquare-root scaling relationships with exponents rangingfrom 0.22 to 0.69 and an average of 0.5 (Table 1). Thegiven variability in exponents as reported in the literatureand noted here, as well as the intrinsic scatter ofmeasurements (Fig. 4), are explained by several factorsincluding fracture orientation, joint network geometry,mechanical interactions, three-dimensional (3D) shape,and the location along the structure’s surface where thedisplacement was measured.
In the following, the square-root D/L scaling relation-ship of opening-mode fractures is combined with thecubic law and a relationship for flow between parallelplates with correlated apertures to lengths is derived. Thenit is shown that this relationship is important for theprediction of flow rates through fracture networks.Equivalent hydraulic permeability tensors for fracturenetworks with and without correlated apertures to lengthsare computed, compared and interpreted.
Cubic law with correlated aperture to length
Flow through fractured rock is commonly determined withthe cubic law Eq. (1), in which fracture length andaperture are uncorrelated. Previous studies modeled flowrates through fracture networks where apertures wererandomly assigned to fracture lengths. Moreover, labo-ratory experiments on fluid flow through either artificiallycreated fractures (e.g. Watanabe et al. 2008) or naturalfractures (e.g. Raven and Gale 1985) involved samplingonly a subset of a fracture. Hence, these results were in
10-4
10-3
10-2
10-1
100
101
102
103
104
105
10 -3 10-2 10-1 100 101 102 103 104 105 106
Schlische et al. [1996] NF
Elliot [1976] TF
Villemin et al. [1995] SSF
Krantz [1988] NFPeacock & Sanderson [1991] NFWalsh & Watterson [1987] NF
Peacock [1991] SSF
Muroaka & Kamata [1983] NFOpheim & Gudmundsson [1989] NFDawers et al. [1996] NFCartwright et al. [1995] NF Gudmundsson [1992] NF Shaw et al. [2002] TFDavis et al. [2005] TF
0.01
0.001
= 0.1
L, m
D
, mm
ax
Fig. 3 Compilation of D/L scaling of faults after Schultz et al.(2008a,b). Normal faults (NF), color symbols; strike slip faults(SSF), gray symbols; thrust faults (TF), black symbols. Lines ofconstant slope (power-law exponent n=1, dotted lines) are shownfor different �
Hydrogeology Journal DOI 10.1007/s10040-009-0572-6

accord with the traditional cubic dependence of apertureson flow rates but do not represent total flow through wholenatural opening-mode fractures.
Olson (2003) related the maximum opening-modedisplacement Dmax to the average displacement Davg as:
Davg ¼ p4Dmax: ð6Þ
Combining Dmax from Eq. (4) with Eq. (6) and solvingfor L, yields
L ¼ 16Davg2
pað Þ2 : ð7Þ
This relationship establishes a correlation betweenlength and the average distance between the walls of asmooth-walled fracture with an elliptical displacement
profile. It allows for an elliptical fracture to be modeled astwo parallel plates separated by Davg. In this case, Davg isequal to aperture b in the cubic law (Eqs. 1 and 2). Sincethe propagation of isolated fractures in homogenous mediaproduce equidimentional crack geometries, called ‘penny-shaped’ cracks in the fracture mechanics literature (e.g.,Lawn 1993 p. 32), where L equals the fracture height H(Jaeger 1969; Timoshenko and Goodier 1970; Jaeger andCook 1979; Fig. 5), the Davg/L relationship in Eq. (7) canbe substituted for H in the cubic law (Eq. 2) resulting in:
Q ¼ � 4rg
3m pað Þ2 b5rh: ð8Þ
Total flow through an aperture to length correlatedfracture set is proportional to b5, implying a greater non-linearity between flow rate and aperture than predicted bythe cubic law. We refer to the previously mentioned formof the cubic law for total flow in a natural fracture withcorrelated aperture to length as the “quintic law”.
The quintic law contains the primary assumptions of thetraditional cubic law (Eq. 1) that describes laminar,incompressible fluid flow between two smooth-walledparallel plates separated by distance b. Consequently, thesame limitations associated with the parallel-plate assump-tion apply. This pertains in particular to the effect of fracturewall roughness. Despite a lack of agreement of explicitdetails, all applications accounting for the roughness of thefracture walls (e.g. Bandis et al. 1985; Barton et al. 1985;Witherspoon et al. 1980; Brown 1987; Cook et al. 1990;Renshaw 1995) show that the hydraulic and mechanicalapertures of the fracture are related and do not affect thecubic and, hence, quintic exponents (Eqs. 1, 2 and 8).
Using field measurements of apertures and lengths ofnatural opening-mode fractures (Fig. 4) for flow ratecalculations between parallel plates demonstrates that
10-2 10-1 100 101 102 103
L, m
D
,
m
10-5
10-4
10-3
10-2
10-1
100
101
D = L0.5
D = L0.5D = L0.5
D = L0.5
D = LD = 10 L
D = L D = Lm
ax
104 105
102
-1 10-2 10-3
10-2
10-310-1
Shiprock dikesFlorence Lake veinsCulpeper veinsMoros jointsLodeve veinsDonner Lake dikesEmerald Bay veinsEmerald Bay dikesEthopian DikesSudan Dikes
Fig. 4 Compilation of D/L scaling of 10 opening-mode fracturesets. Fracture lengths scale to fracture apertures as power-lawfunctions with exponents n∼0.5. For reference, several square rootfunctions indicate power-law dependence (black dashed lines). Forcomparison linear functions (gray dashed lines) are also shown
Table 1 Values of exponents and proportionality coefficients foropening-mode fracture sets
Fractures Exponent α
Shiprock dikes 0.4325 0.4435Florence Lake veins 0.4916 0.0007Culpeper veins 0.3941 0.0010Ethiopia dikes 0.5542 0.0527Moros joints 0.4789 0.0025Lodève veins 0.4703 0.0102Sudan dikes 0.2191 1.1645Emerald Bay veins 0.5521 0.0009Emerald Bay dikes 0.6759 0.0066Donnor Pass dikes 0.6915 0.0094Average 0.4960 -
H
LDmax
Fig. 5 ‘Penny-shaped’ opening-mode fracture model with ellip-tical opening displacement profile showing fracture length L,maximum displacement Dmax and fracture height, H
Hydrogeology Journal DOI 10.1007/s10040-009-0572-6
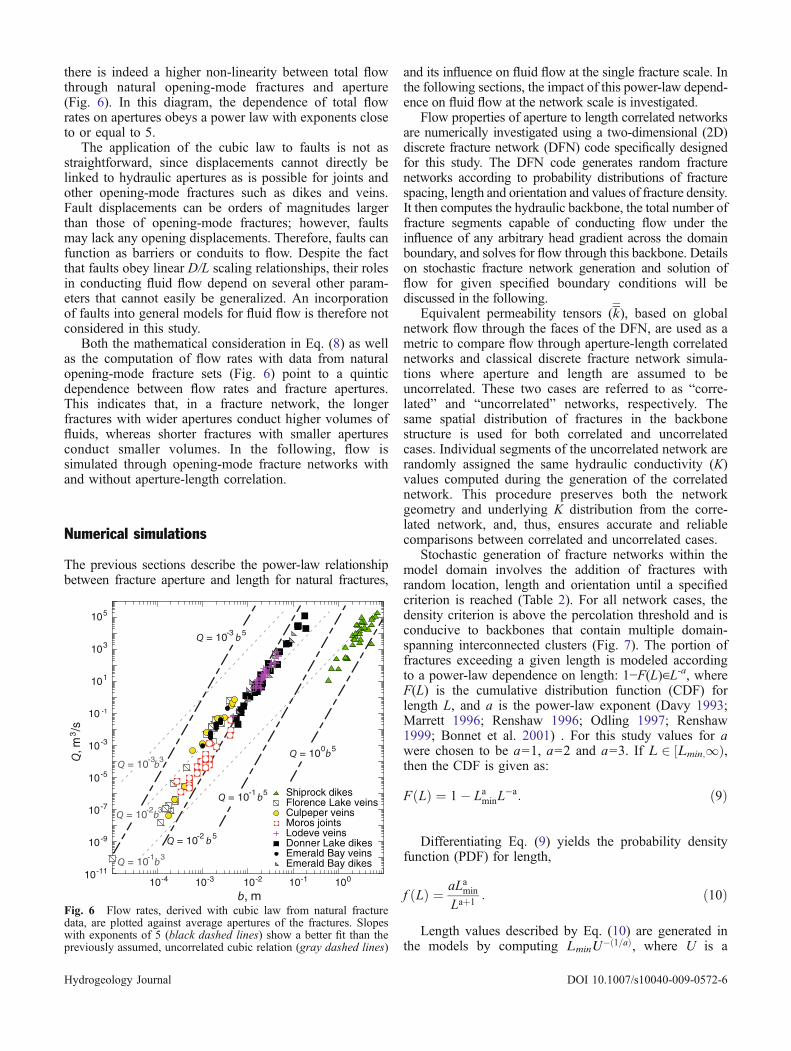
there is indeed a higher non-linearity between total flowthrough natural opening-mode fractures and aperture(Fig. 6). In this diagram, the dependence of total flowrates on apertures obeys a power law with exponents closeto or equal to 5.
The application of the cubic law to faults is not asstraightforward, since displacements cannot directly belinked to hydraulic apertures as is possible for joints andother opening-mode fractures such as dikes and veins.Fault displacements can be orders of magnitudes largerthan those of opening-mode fractures; however, faultsmay lack any opening displacements. Therefore, faults canfunction as barriers or conduits to flow. Despite the factthat faults obey linear D/L scaling relationships, their rolesin conducting fluid flow depend on several other param-eters that cannot easily be generalized. An incorporationof faults into general models for fluid flow is therefore notconsidered in this study.
Both the mathematical consideration in Eq. (8) as wellas the computation of flow rates with data from naturalopening-mode fracture sets (Fig. 6) point to a quinticdependence between flow rates and fracture apertures.This indicates that, in a fracture network, the longerfractures with wider apertures conduct higher volumes offluids, whereas shorter fractures with smaller aperturesconduct smaller volumes. In the following, flow issimulated through opening-mode fracture networks withand without aperture-length correlation.
Numerical simulations
The previous sections describe the power-law relationshipbetween fracture aperture and length for natural fractures,
and its influence on fluid flow at the single fracture scale. Inthe following sections, the impact of this power-law depend-ence on fluid flow at the network scale is investigated.
Flow properties of aperture to length correlated networksare numerically investigated using a two-dimensional (2D)discrete fracture network (DFN) code specifically designedfor this study. The DFN code generates random fracturenetworks according to probability distributions of fracturespacing, length and orientation and values of fracture density.It then computes the hydraulic backbone, the total number offracture segments capable of conducting flow under theinfluence of any arbitrary head gradient across the domainboundary, and solves for flow through this backbone. Detailson stochastic fracture network generation and solution offlow for given specified boundary conditions will bediscussed in the following.
Equivalent permeability tensors (k), based on globalnetwork flow through the faces of the DFN, are used as ametric to compare flow through aperture-length correlatednetworks and classical discrete fracture network simula-tions where aperture and length are assumed to beuncorrelated. These two cases are referred to as “corre-lated” and “uncorrelated” networks, respectively. Thesame spatial distribution of fractures in the backbonestructure is used for both correlated and uncorrelatedcases. Individual segments of the uncorrelated network arerandomly assigned the same hydraulic conductivity (K)values computed during the generation of the correlatednetwork. This procedure preserves both the networkgeometry and underlying K distribution from the corre-lated network, and, thus, ensures accurate and reliablecomparisons between correlated and uncorrelated cases.
Stochastic generation of fracture networks within themodel domain involves the addition of fractures withrandom location, length and orientation until a specifiedcriterion is reached (Table 2). For all network cases, thedensity criterion is above the percolation threshold and isconducive to backbones that contain multiple domain-spanning interconnected clusters (Fig. 7). The portion offractures exceeding a given length is modeled accordingto a power-law dependence on length: 1−F(L)∈L-a, whereF(L) is the cumulative distribution function (CDF) forlength L, and a is the power-law exponent (Davy 1993;Marrett 1996; Renshaw 1996; Odling 1997; Renshaw1999; Bonnet et al. 2001) . For this study values for awere chosen to be a=1, a=2 and a=3. If L 2 ½Lmin;1Þ,then the CDF is given as:
F Lð Þ ¼ 1� LaminL�a: ð9Þ
Differentiating Eq. (9) yields the probability densityfunction (PDF) for length,
f Lð Þ ¼ aLamin
Laþ1: ð10Þ
Length values described by Eq. (10) are generated inthe models by computing LminU
� 1=að Þ, where U is a
Shiprock dikesFlorence Lake veinsCulpeper veins Moros joints Lodeve veins Donner Lake dikes Emerald Bay veinsEmerald Bay dikes
Q, m
/s
3
10-11
10-9
10-7
10-5
105
101
10 -1
10-3
103
Q = 10 5-2
Q = 10 3-2
Q = 10 3-1
Q = 10 b-3
Q = 10 5-1
Q = 10 5
Q = 10 5-3
0
10-2 10-1 10010-310-4
Fig. 6 Flow rates, derived with cubic law from natural fracturedata, are plotted against average apertures of the fractures. Slopeswith exponents of 5 (black dashed lines) show a better fit than thepreviously assumed, uncorrelated cubic relation (gray dashed lines)
Hydrogeology Journal DOI 10.1007/s10040-009-0572-6

uniform random variable between zero and one. Thelocations of fracture centers are assumed to be uniformlydistributed over the computational domain. The fractureorientations are modeled according to von Mises-Fisherdistribution functions which may be thought of as acircular (or spherical in 3D) analogue of the normaldistribution. The PDF for von Mises-Fisher distributionfor the angle θ is given as:
f qjw; kð Þ ¼ ek cos q�wð Þ
2pI0 kð Þ ð11Þ
where I0(κ) is the modified Bessel function of order zero.The parameter ω is the measure of location around whichthe distribution is clustered and is analogous to the meanin the normal distribution. The parameter κ is an inversemeasure of the dispersion around a mean orientation, ω, i.e., if κ is small, the distribution becomes close to uniform,whereas if κ is large, the distribution becomes concen-trated about the mean orientation, ω. To generate randomvariables for the von Mises-Fisher distribution, thealgorithm given by Best and Fisher (1979) is used.
The fracture networks each contain two sets offractures (differing only in their mean orientation, ω) forthree length distribution functions with power-law expo-nent values of 1, 2, and 3, respectively (Table 2). Themean orientations of the fracture sets in all cases areorthogonal according to values of 0° and 90° with κ equalto 30 to allow for significant deviation in orientation fromthe mean. The orthogonal orientation is intended tosimplify the computation of the hydraulic conductivitytensor by effectively restricting the non-diagonal compo-nents to zero. Fractures are generated until the 2D fracturedensity satisfies the value given in Table 2. Note thatlower values of the power-law exponent leads to thegeneration of longer fractures (Fig. 8), and consequently ahigher degree of connectivity between the fractures. As aresult, density values required to establish a hydraulicbackbone sufficiently above the percolation threshold areless for lower exponent values (Table 2).
Hydraulic conductivity values for the correlated net-works are computed first using Eq. (7) to relate fracturelength to average (hydraulic) aperture b, and then usingthe classical cubic law to compute K, where K=ρg(12µ)−1b2. Note that the simulations in this study are in
2D; hence the quintic relationship described by Eq. (8)does not directly apply since fracture height in thesimulations is set to unity. The dependence of fracturelength on aperture, given the power-law distribution offracture length, results in power-law distributions of K.Specifically, the distribution of K within the fracturenetworks is proportional to K-a, where a is the fracturelength exponent; note that the square root dependence of
0
20
40
60
80
100
20 40 60 80 100
0
20
40
60
80
20 40 60 80
0
20
40
60
20 40 60
a
b
c
Domain width, m
Dom
ain
leng
th, m
Fig. 7 Typical hydraulic backbones for power-law length expo-nents of a a=1.0, b a=2.0 and c a=3.0 and associated parameters(Table 2)
Table 2 Parameters used for the generation of the fracture networks
Power-law exponent, a 1.0 2.0 3.0
Fracture density, m/m2 0.7 1.2 2.0Domain width, m ≤100 ≤80 ≤60Domain length, m ≤100 ≤80 ≤60Mean orientation, ω, of set 1 0˚ 0˚ 0˚Variation in orientation, κ, set 1 30 30 30Probability, set 1 50% 50% 50%Minimum fracture length, set 1, m 2 2 2Mean orientation, ω, of set 2 90˚ 90˚ 90˚Variation in orientation, κ, set 2 30 30 30Probability, set 2 50% 50% 50%Minimum fracture length, set 2, m 2 2 2
Hydrogeology Journal DOI 10.1007/s10040-009-0572-6

length on aperture and the squared dependence of apertureon K cancel each other. This results in K distributions thatbecome less broad as values of a increase from 1 to 3.This observation could possibly influence the domain sizeat which a representative elementary volume (REV) isestablished. Values of K computed from the correlatednetworks are randomly shuffled and then assigned toindividual fracture segments of the uncorrelated network,thereby preserving the distribution of K between thecorrelated and uncorrelated cases.
Isolated fractures, isolated clusters, and dead-endsegments are eliminated next to determine the configu-ration of the hydraulic backbone. Typical configurationsof hydraulic backbone for parameters listed in Table 2 areshown in Fig. 7. As is evident from the backbone, thecases of a=1 and a=3 are dominated by very long andvery short fractures respectively. The case of a=2represents an even mix of longer and shorter fractures.One would expect an increased flow heterogeneity forfracture networks with longer fractures than for the caseswith shorter fractures. Hence, the maximum domain width
and domain length (Table 2) used in the simulationdecreases with increasing a.
Instead of computing equivalent k at a fixed domainsize (e.g. Zhang et al. 1996), changes in k with the scaleof the domain are examined to identify the scale at whichan REV is established (Kulatilake and Panda 2000;Baghbanan and Jing 2006; Chen et al. 2008). Previousstudies were restricted to a few thousand nodes (i.e.,fracture intersections) distributed according to either smalldomain sizes with higher fracture density (Kulatilake andPanda 2000; Min et al. 2004; Baghbanan and Jing 2006;Chen et al. 2008) or larger domains with smaller networkdensity (Zhang et al. 1996). However, the numericalmethods employed by the DFN code in this study havedramatically reduced simulation times as compared toprevious studies. This allows investigation of both agreater number of domain length scales and statisticallyequivalent realizations for each network type. Ten domainsizes are considered, starting at 10% of the maximum sizeand increment in multiples of 10%, for each value of a.The net flow rate through the domain is composed of theprincipal flow rates in the x-direction (qxx) and y-direction(qyy), and the cross flow rates (qxy and qyx). Suitable headboundary conditions are imposed on the networks (Fig. 9)and flow rate components are computed for all domainsizes by using the techniques of a discrete fracturenetwork (DFN) model as elucidated in Priest (1993).The process is repeated for cases with an uncorrelatedpermeability field and the corresponding flow rate com-ponents are obtained. By assigning mean orthogonalfracture sets with orientations aligned with the principaldirections of a Cartesian coordinate system (Table 2),comparable values of flow rates in the principal directionsare ensured. The principal and off-diagonal components ofK can be determined from the matrix form of Darcy’s law(Zhang et al. 1996):
qxx qxyqyx qyy
� �¼ Kxx Kxy
Kyx Kyy
� � rHx 00 rHy
� �ð12Þ
a=1a=2
a=3
a=1a=2
a=3
Length (L), m
U
Lmin
Num
ber
of fr
actu
res
low
high
0
0.2
0.4
0.6
0.8
1
1 10 100 1000
Fig. 8 Computed length distributions for exponents of a=1, a=2and a=3 showing the different ranges of fracture lengths for thedifferent exponents
qxxqxy
yyq yxq
Fig. 9 Principal flow directions for a 2D domain with linear head boundary conditions shown in the x-direction (qxx), y-direction (qyy), andthe cross flow directions (qxy and qyx)
Hydrogeology Journal DOI 10.1007/s10040-009-0572-6

where ∇Hx and ∇Hy are the head gradients in the x- and y-directions respectively. Components of equivalent k caneasily be computed by inverting Eq. (12). In thesimulations, a unit head gradient in both directions forall domain sizes is used, so that the value of the componentsof flow rate and the components of equivalent k arenumerically equal. Therefore, the four components ofhydraulic conductivity tensor are computed for the corre-lated case for all ten domain sizes and each value ofexponent a. This process is then repeated for the uncorre-lated case. Final values of k represent the ensemble-averagefrom 100 Monte Carlo simulations. On a computationalcluster with 32 CPUs, the efficacy of the code wasdemonstrated by a simulation time of about 15 min forcase with power-law exponent of 1, a simulation time ofabout 2 h for case with power-law exponent of 2, and asimulation time of about 10 h for case with power-lawexponent of 3. The increase in simulation times is caused bythe higher fracture densities required to reach a suitablebackbone, where the number of unknowns (fractureintersections) within the interior of the DFN for the largestsizes for the above exponents is approximately around1,200, 2,200 and 4,000, respectively.
Results and discussion
Information on flow rates calculated from natural fracturedata sets (Fig. 6) and the derivation of the quintic law (Eq. 8)both indicated a higher non-linearity between flow rates andfracture apertures. The effects of this quintic relationshipwere explored by modeling the permeability tensor (k) andan investigation in the establishment of an REVof identicalfracture networks with either correlated or uncorrelatedapertures to lengths. Due to the correlation of aperture tolength and, hence, correlation of the hydraulic conductivity(K) to fracture lengths, the K-distribution becomes directlylinked to the power-law fracture length distribution. Model-ing flow through fracture networks is, in this study, thereforebased on a power-law K distribution as opposed to morecommonly used lognormal distributions.
Results of the numerical simulations indicate thatcorrelated fracture networks of all fracture length distri-butions have a significantly higher permeability than theuncorrelated networks (Fig. 10). In addition, k displays achange from an upward trend for fracture length distribu-tions with exponents of a=1 to a downward trend for a=3.Only for a=2 an REV is established in the range of modeledDFN sizes (Fig. 10).
Fig. 10 Ensemble averaged values for the principal componentsof k for correlated and uncorrelated networks. The black curvesrepresentKxx and the red curves represent Kyy. Solid lines indicate k forcorrelated fracture networks and dashed lines show k for theuncorrelated fracture networks, respectively. a Values of principal kcomponents Kxx and for a=1.0. Note the consistent difference by afactor of about two in principal k values for the correlated anduncorrelated cases, and the upward trend in principal k values withDFN size. b Values of principal components Kxx and Kyy for a=2.0.Note the consistent difference by a factor of about six in principal kvalues for the correlated and uncorrelated cases, and the relatively flattrend in principal k values with DFN size. c Values of principal kcomponents Kxx and Kyy for a=3.0. Note the consistent difference by afactor of about two in principal k values for the correlated anduncorrelated cases, and the downward trend in principal k values withDFN size
b
10-14
10-13
10-12
0 20 40 60 80 100
10-14
10-13
10-12
0 10 20 30 40 50 60 70
10-13
10-12
0 20 40 60 80 100 120
10-11
DFN size, m
K KKK
xx
yy
correlated
uncorrelatedcorrelated
uncorrelatedxx
yy
a=1
a=2
a=3
Per
mea
bilit
y (k
), m
2
a
b
c
Hydrogeology Journal DOI 10.1007/s10040-009-0572-6

Differences in principal permeability values between thecorrelated and uncorrelated cases are a direct result of theproposed correlation. Again, it is emphasized that both caseshave the same power-law K distributions. For correlatednetworks, each fracture gets assigned the appropriateK valueaccording to the square root aperture-to-length relationship.Therefore, the longest fractures have the widest aperturesand as a result of that they have the highest conductivities.Hence, they also have the highest impact on the permeabilityof the fracture network in terms of greatest amount of flowgiven their role in linking otherwise isolated clusters in thenetwork. For uncorrelated networks, however, this same Kdistribution is shuffled and randomly assigned to fractures ofany length. Consequently, the longer fractures can have lowK values, whereas shorter fractures can have high K values.Neither the long fractures with low K values nor the shortfractures with possible high K values significantly increasenetwork fluid flow resulting in the lower equivalentpermeability values for the uncorrelated fracture networks.
Differences in principal k values between the corre-lated and uncorrelated networks are relatively constant(Fig. 10). For length distributions with exponents of a=1and a=3, the principal k values for the correlatednetworks are more than twice as high when compared tothe uncorrelated ones (Fig. 10a,c). Principal k values forcorrelated networks with length distributions of a=2 areeven higher; they differ by a factor of 6 when compared tothe principal k values of uncorrelated networks (Fig. 10)b.
There is an upward trend in permeability tensor values forlower exponents of length distributions, whereas downwardtrends are present for higher exponents (Fig. 10). Inparticular, length distribution exponents of a=1 lead to kvalues that increase with DFN size (Fig. 10)a. For lengthdistribution exponents of a=1, the probability of longerfractures in larger DFN sizes is increased (Fig. 8), alsoresulting in the generation of higher K values. This broad-ening of the K distribution yields, regardless of thecorrelation, higher permeability values with increasingdomain size. Here, the impact of the longer fractures ismaximized with the increase in size of the fracture network.
In contrast, fracture networks with length distributionexponents of a=3 produce values of k that decrease withDFN size (Fig. 10c) for both correlated and uncorrelatedDFN. As apparent in Fig. 8 the downward trend of thefracture length distribution is rather steep, indicating thatshorter fractures occur far more often than longerfractures. The probability of shorter fractures less thanthe size of the DFN is much greater than for longerfractures causing an increasing ratio of short to longfractures. Consequently, the probability of lower K-valuesis also increased, minimizing the impact of the longerfractures with increasing DFN size and, therefore, reduc-ing the permeability for larger domain sizes.
A transitional behavior of the k trends of the curveexists for fracture length distributions around a=2.Whereas the uncorrelated DFN simulations result in adownward curve, similar to curves for a=3, the k tensor
for the correlated case is almost constant for all DFN sizes(Fig. 10b). For a=2, the fracture length distribution isintermediate (Fig. 8), with an even mixture of long andshort fractures exists. This even mixture also controls theK distribution and most likely explains why the downwardand upward trends of the tensor are effectively balancedwith changes in DFN size.
As mentioned previously, the power-law distributionsused to computeK values for individual fractures are directlylinked to fracture length. Accordingly, the heterogeneity inthe K distribution decreases as the length distributionexponent increases from a=1 to a=3. Based on this quality,one would expect an REV to be established in the order ofless heterogeneity. However, results of this study show thatan REV only exists for networks with fracture-lengthdistribution exponents of a=2 where an REV is establishedaround a DFN size of 50 m (Fig. 10b). In contrast, values ofthe k tensor for networks with length distribution exponentsof a=1 and a=3 display an ongoing upward trend ordownward trend respectively (Fig. 10a,c). This shows thatthere is no REV established within the modeled range ofDFN sizes. In addition, the ongoing upward (a=1) anddownward (a=3) trends suggest that these networks may notsatisfy REV conditions within scales at which DFN arecomputationally feasible.
The lack of the formation of an REV is closely relatedto the length distribution. Backbones with length distri-butions where the exponent is low (a=1) are dominatedby long fractures (Fig. 7a), where the longest fractures areconstantly truncated by the domain size. As DFN sizeincreases, fractures become longer and can furtherpromote fluid flow through enhanced connectivity. Theopposite is true for fracture networks with lengthdistributions where exponents are high (a=3). Here, thebackbone is dominated by short fractures (Fig. 7c). Theimportance of longer domain spanning fractures is con-stantly diminished with increasing domain size resultingin the observed decrease of permeability for increasingnetwork sizes. Again, for networks with fracture lengthdistributions around a=2, the even mixture of short andlong fractures promotes the establishment of an REV.
De Dreuzy et al. (2002) previously investigated theinfluence of a power-law aperture distribution on thepermeability of fracture networks. Based on the use of apower-law length distribution for their modeling experi-ments and linear aperture to length scaling relationships(e.g. Vermilye and Scholz 1995), they concluded that theaperture distribution must also obey a power law. Whencombining their proposed aperture distribution with thecubic law, they also obtained a power-law permeabilitydistribution for their fracture networks. Results show that,for low exponents, flow is channeled independent ofsystem size, whereas higher exponents cause the flow tobe much more distributed over the fracture network.Observations by de Dreuzy et al. (2002) are, in general,consistent with this study. However, our simulations showan intensification of the observed effects with increasingscale (Fig. 10). Secondly, our simulations are consistent
Hydrogeology Journal DOI 10.1007/s10040-009-0572-6

with more recently determined square root aperture tolength scaling (Olson 2003), where each individualfracture length is correlated to its appropriate aperture sothat power-law distributions of K are proportional to K-a
with a being the fracture length exponent. Our resultsemphasize the importance of the choice of aperture tolength scaling function (i.e., Eq. 4).
Renshaw (1999) compiled estimates of power-lawexponents and obtained a mean exponent of a=1.8 with astandard deviation of 0.4. This suggests that fracture-lengthdistribution exponents for the majority of natural fracturesshould range between 1.4 and 2.2. For this range results, ofthis study (a=2) exhibit a difference in principal k valuesbetween correlated and uncorrelated networks of a factor of6. Hence, modeling flow through fracture networks withcorrelated fracture length to aperture, as observed in nature,indicates that volumetric flow rates are likely underestimatedwith conventional modeling approaches where fracturelength and permeability are uncorrelated. Higher volumetricflow rates also suggest that volume estimates of jointedpetroleum and groundwater reservoirs are higher thanpreviously assumed. Furthermore, the correlation betweenlength and aperture of fracture sets shows that inversemeasures of hydraulic apertures (e.g. Watanabe et al. 2008)were overestimated with the traditional cubic law. Obtaininghydraulic apertures from measured flow rates using thequintic relationship would yield lower values.
Fracture sets with correlated aperture to length and afracture length distribution exponents of a=2 most closelyreflect flow characteristics of natural fracture sets in thisstudy. For this case, results show relatively constant kvalues throughout all DFN sizes. However, simulationshere only investigated DFN with fracture densities slightlyabove the percolation threshold. Further studies in thisrange of distribution exponents with different fracturedensities could provide a better understanding of thepermeability for natural fracture sets.
Conclusions
Given the square root correlation of fracture apertures tolengths with flow between parallel plates, total flow ratesthrough natural opening-mode fractures are shown to beproportional to apertures to the fifth power. The correla-tion also demonstrates that the hydraulic conductivity ofthe network is directly related to the power-law lengthdistribution applied to the fracture sets. For DFN flowmodeling, this quintic law is reflected in usage of a power-law K distribution, where each fracture of a network wasassigned the appropriate K value. Results were comparedto networks with the same spatial distribution of fracturesbut K values were arbitrarily assigned to fractures. Resultsindicate that correlated fracture networks have up to 6times higher principal k values than uncorrelated net-works. In addition, results show that the power-law Kdistribution exerts a significant impact on the tensor curve
and the associated establishment of an REV. Curves fornetworks with length distributions where the exponents areeither low (a=1) or high (a=3) have ongoing upward ordownward trends respectively and, within the tested range,the REV is not established. The intermediate example fornetworks with an exponent of the length distribution of a=2shows relatively constant values for the k tensor throughoutall DFN sizes, also an REV is established.
Results of the simulations are consistent with observa-tions and calculations of flow rates through naturalfractures and they point out the importance of the squareroot correlation. Consequently, these results indicate thatthe quintic law should be taken into account for thecomputation and simulation of flow rates through naturalopening-mode fracture sets and networks.
Acknowledgements We thank J. Johnson, an anonymous referee,and the Associate Editor for their detailed and thoughtful commentsthat sharpened the final paper. This work was supported by a grantfrom NASA’s Planetary Geology and Geophysics Program to R.A.S.; R.P. and D.M.R. were partially supported by funding providedby the Desert Research Institute.
Appendix 1: Notation
a Fracture length distribution exponentα Proportionality coefficient
(opening-mode fractures), m1/2
b Aperture, mD Displacement, mDavg Average opening displacement, mDmax Maximum opening displacement, m∆ σI Opening-mode driving stress, PaE Young’s modulus, Paθ Fracture orientationg Acceleration of gravity, m/s2
g Proportionality coefficient (faults)H Height of parallel plates, fracture height, m∇h Hydraulic head gradient∇Hx Head gradient in x-direction∇Hy Head gradient in y-directionI0(ĸ) Modified Bessel function of order zeroKIc Fracture toughness, MPa m1/2
K Hydraulic conductivity, m/sk Permeability tensor, m2
Kxx Principal direction of permeability tensor, m2
Kxy Principal direction of permeability tensor, m2
Kyx Cross direction of permeability tensor, m2
Kyy Cross direction of permeability tensor, m2
κ Variation in fracture orientationL Fracture length, mLmin Minimum fracture length, mμ Viscosity, Pa sQ Volumetric discharge, m3/sqxx Principal direction of specific discharge, m/sqyx Cross direction of specific discharge, m/sqyx Cross direction of specific discharge, m/sqyy Principal direction of specific discharge, m/s
Hydrogeology Journal DOI 10.1007/s10040-009-0572-6

ρ Fluid density, kg/m3
U Random variable for fracture length computationVf Fracture volume, m3
ν Poisson’s ratioW Length of parallel platesω Mean fracture orientation
Appendix 2
The fault datasets presented in Fig. 3 are taken from Schultzet al. (2008a) and references therein. The opening-modefracture datasets in Fig. 4 consist of seven previously reporteddatasets from Olson (2003) and Schultz et al. (2008a, b).Three newly acquired datasets were measured in outcrops ofthe Sierra Nevada batholith around Lake Tahoe, CA.
A set of NW/SE striking vertical dikes was carefullymeasured in terms of their length and opening displace-ment in exposures of glacially polishedMesozoic granitoidsof the Donner Summit Pluton, near Donner Pass, CA. Twotypes of dikes were observed. Simple dikes comprise themajority of dikes in this region and are of granodioriticcomposition. The second type of dikes, referred to ascomplex dikes consist of two phases, an outer pegmatiticphase and an inner phase of a more mafic composition (Ward1993). This dataset consists of a total of 28 D/L measure-ments ranging from 1.13 to 50.5m in length.
Glacially polished granitoids are also present west ofEmerald Bay State Park, CA. Here, a set of E/W strikingdikes of pegmatitic composition and another set of steeplyNE\SW striking quartz-filled veins was measured betweenCascade Lake and Granite Lake. Both sets each include 14individual measurements of fracture length and openingdisplacement. Measured dike lengths range between 1.38and 48m. Measured veins have lengths between 2.06 and11.42m. Measurements were taken with a 30-m steel tape,displacements and lengths have measurement uncertain-ties of ±0.5 and ±10mm, respectively.
References
Baghbanan A, Jing L (2006) Hydraulic properties of fractured rockmasses with correlated fracture length and aperture. Int J RockMech Min Sci 44:704–719
Bandis SC, Makurat A, Vik G (1985) Predicted and measuredhydraulic conductivity of rock joints. Proceedings of theInternational Symposium on Fundamentals of Rock Joints,Bjorkliden, Sweden, 15–20 September, pp 269–280
Barton NR, Bandis SC, Bakhtar K (1985) Strength, deformation andconductivity coupling of rock joints. Int J Rock Min SciGeomech Abstr 22(3):121–140
Bear J, Tsang CF, de Marsily G (1993) Flow and contaminanttransport in fractured rock. Academic, San Diego, CA
Best DJ, Fisher NI (1979) Efficient simulation of the von Misesdistribution. Appl Stat 28(2):152–157
Bonnet E, Bour O, Odling NE, Davy P, Main I, Cowie P, BerkowitzB (2001) Scaling of fracture systems in geologic media. RevGeophys 39(3):347–383
Boussinesq J (1868) Memoire sur l’influence des frottements dansles mouvements reguliers des fluids [Thesis about the influence
of friction within the steady flow of fluids]. J Math Pures Appl13:377–424
Brown SR (1987) Fluid flow through rock joints: the effect ofsurface roughness. J Geophys Res 92:1337–1347
Brown SR, Scholz CH (1985) The closure of random elasticsurfaces in contact. J Geophys Res 90:5531–5545
Chen SH, Feng XM, Isam S (2008) Numerical estimation of REV andpermeability tensor for fractured rock masses by composite elementmethod. Int J Numer Anal Meth Geomech 32:1459–1477
Clark RM, Cox SJD (1996) A modern regression approach todetermining fault displacement-length scaling relationship. JStruct Geol 18:147–152
Cook AM, Myer LR, Cook NGW, Doyle FM (1990) The effect oftortuosity on flow through a natural fracture. In: Hustrulid WA,Johnson WA (ed) Rock mechanics contributions and challenges,Proceedings of the 31st US Symposium on Rock Mechanics.Golden, CO, June 1990
Cowie PA, Scholz CH (1992a) Physical explanation for thedisplacement-length relationship of faults using a post-yieldfracture mechanics model. J Struct Geol 14:1133–1148
Cowie PA, Scholz CH (1992b) Displacement-length scalingrelationship for faults: data synthesis and discussion. J StructGeol 14:1149–1156
Davy P (1993) On the frequency-length distribution of the SanAndreas fault system. J Geophys Res 98:12141–12151
Dawers NH, Anders MH (1995) Displacement-length scaling andfault linkage. J Struct Geol 17:607–614
Dawers NH, Anders MH, Scholz CH (1993) Growth of normalfaults: displacement-length scaling. Geology 21:1107–1110
De Dreuzy J-R, Davy P, Bour O (2001) Hydraulic properties oftwo-dimensional random fracture networks following a powerlaw length distribution 2: permeability networks based onlognormal distribution of apertures. Water Resour Res37:2079–2095
Dreuzy D, Davy P, Bour O (2002) Hydraulic properties of two-dimensional fracture networks following power law distribu-tions of length and aperture. Water Resour Res 38, W06412.doi:10.1029/2001WR001009
Gangi AF (1978) Variation of whole and fractured porous rockpermeability with confining pressure. Int J Rock Min SciGeomech Abstr 15:249–257
Hartley L, Cox L, Holton D, Hunter F, Joyce S, Gylling B, LindgrenM (2004) Groundwater flow and radionuclide transport model-ling using CONNECTFLOW in support of the SR Canassessment. SKB Rapport R-04-61, Svensk Kärnbränslehanter-ing AB. Swedish Nuclear Fuel and Waste Management Co,Stockholm
Irwin GR (1957) Analysis of stresses and strains near the end of acrack. J Appl Mech 24:361–369
Jaeger JC (1969) Elasticity, fracture and flow: with engineering andgeological applications. Chapman and Hall, London
Jaeger JC, Cook NGW (1979) Fundamentals of rock mechanics.Chapman and Hall, London
Krantz RE, Frankel AD, Engelder T, Scholz CH (1979) Thepermeability of whole and jointed Barre granite. Int J Rock MinSci Geomech Abstr 16:225–234
Kulatilake PHSW, Panda B (2000) Effect of block size and jointgeometry on jointed rock hydraulics and REV. J Engrg Mech126(8):850–858
Lawn B (1993) Fracture of brittle solids. Cambridge UniversityPress, Cambridge
Lomize GM (1961) Filtrarsiia v Treshchinovatykh Porod [Waterflow in jointed rock]. Gosenergoizdat, Moscow
Long JCS, Gilmour P, Witherspoon PA (1985) A model for steadyfluid flow in random three-dimensional networks of disc-shapedfractures. Water Resour Res 21:1105–1115
Louis CA (1969) A study of groundwater flow in jointed rock andits influence of the stability of rock masses. Rock MechanicsResearch Report 10. Imperial College, London
Marrett R (1996) Aggregate properties of fracture populations. JStruct Geol 18:169–178
Hydrogeology Journal DOI 10.1007/s10040-009-0572-6

Masihi M, King PR (2007) A correlated fracture network: modelingand percolation properties. Water Resour Res 43, W07439.doi:10.29/2006WR005331
Min KB, Jing L, Stephansson O (2004) Determining the equivalentpermeability tensor for fractured rock masses using a stochasticREV approach: method and application to the field data fromSellafield, UK. Hydrogeol J 12:497–510
Neuman SP (2008) Multiscale relationships between fracture length,aperture, density and permeability. Geophys Res Lett 35,L22402. doi:10.1029/2008GL035622
National Research Council (1996) Rock fractures and fluid flow:contemporary understanding and applications. National Acad-emy Press, Washington, DC
Odling NE (1997) Scaling and connectivity of joint systems insandstones from western Norway. J Struct Geol 19:1257–1271
Olson JE (2003) Sublinear scaling of fracture aperture versuslength: an exception or the rule? J Geophys Res 108(B9), 2413.doi:10.1029/2001JB000419
Paris PC, Sih GC (1965) Stress analysis of cracks. In: Fracturetoughness testing and its applications. Special TechnicalPublication, vol. 381, American Society for Testing andMaterials, West Conshohocken, PA, pp 30–83
Pollard DD, Segall P (1987) Theoretical displacements and stressesnear fractures in rock: with applications to faults, joint, veins,dikes and solution surfaces. In: Atkinson BK (ed) Fracturemechanics of rock. Academic Press, San Diego, CA
Priest SD (1993) Discontinuity analysis of rock engineering.Chapman and Hall, London
Raven KG, Gale JE (1985) Water flow in a natural rock fracture as afunction of stress and sample size. Int J Rock Mech Min SciGeomech Abstr 22(4):251–261
Renshaw CE (1995) On the relationship between mechanical andhydraulic apertures in rough-walled fractures. J Geophys Res100:24629–24636
Renshaw CE (1996) Influence of subcritical fracture growth on theconnectivity of fracture networks. Water Resour Res 32(6):1519–1530
Renshaw CE (1999) Connectivity of joint networks with power lawlength distributions. Water Resour Res 35(9):2661–2670
Rivard C, Delay F (2004) Simulations of solute transport infractured porous media using 2D percolation networks with
uncorrelated hydraulic conductivity fields. Hydrogeol J 12:613–627
Rubin AM (1995) Propagation of magma-filled cracks. Annu RevEarth Planet Sci 23:287–336
Scholz CH (2002) The mechanics of earthquakes and faulting.Cambridge Univ Press, Cambridge
Schultz RA, Soliva R, Fossen H, Okubo CH, Reeves DM (2008a)Dependence of displacement-length scaling relations for frac-tures and deformation bands on the volumetric changes acrossthem. J Struct Geol 30:1405–1411
Schultz RA, Mège D, Diot H (2008b) Emplacement conditions ofigneous dikes in Ethiopian Traps. J Volc Geotherm Res 178(4):683–692
Sih GC (1962) On singular character of thermal stresses near acrack tip. J Appl Mech 29:587
Sih GC, Libowitz H (1968) Fracture. Academic, New YorkSnow DT (1965) A parallel plate model of fractured permeable
media. PhD Thesis Univ. of Calif., Berkeley, USATaylor WL, Pollard DD, Aydin A (1999) Fluid flow in discrete joint
sets: field observations and numerical simulations. J GeophysRes 104:28983–29006
Timoshenko SP, Goodier JN (1970) Theory of elasticity. McGraw-Hill, New York
Tsang YW, Witherspoon PA (1981) Hydromechanical behavior of adeformable rock fracture subject to normal stress. J GeophysRes 86:9287–9298
Vermilye JM, Scholz CH (1995) Relation between vein length andaperture. J Struct Geol 17:423–434
Ward KA (1993) Dike emplacement and deformation in the DonnerSummit pluton, central Sierra Nevada, California. MSc Thesis,Univ. of Nev., USA
Watanabe N, Hirano N, Tsuchia N (2008) Determination of aperturestructure and fluid flow in a rock fracture by high-resolutionnumerical modeling on the basis of a flow-through experimentunder confining pressure. Water Resour Res 44, W06412.doi:10.1029/2006WR005411
Witherspoon PA, Wang JSY, Iwai K, Gale JE (1980) Validity ofcubic law for fluid flow in a deformable rock fracture. WaterResour Res 16:1016–1024
Zhang X, Sanderson DJ, Harkness RM, Last NC (1996) Evaluationof the 2-D permeability tensor for fractured rock masses. Int JRock Mech Min Sci Geomech Abstr 33(1):17–37
Hydrogeology Journal DOI 10.1007/s10040-009-0572-6