
Cu ulltturree,, hDDeemmooggrra apphyy caanndd ... · vi Author’s Declaration I, Muhammad Sharif...
397
Culture, Demography and Individuals’ Technology Acceptance Behaviour: A PLS Based Structural Evaluation of an Extended Model of Technology Acceptance in South-Asian Country Context A thesis submitted in fulfilment of the requirement for the degree of Doctor of Philosophy By Muhammad Sharif Abbasi BCS (Hons) Computer Sciences Information Systems Evaluation and integration group (ISEing) Brunel Business School, Brunel University, London June, 2011
Transcript of Cu ulltturree,, hDDeemmooggrra apphyy caanndd ... · vi Author’s Declaration I, Muhammad Sharif...

CCuullttuurree,, DDeemmooggrraapphhyy aanndd IInnddiivviidduuaallss’’ TTeecchhnnoollooggyy AAcccceeppttaannccee
BBeehhaavviioouurr:: AA PPLLSS BBaasseedd SSttrruuccttuurraall EEvvaalluuaattiioonn ooff aann EExxtteennddeedd
MMooddeell ooff TTeecchhnnoollooggyy AAcccceeppttaannccee iinn SSoouutthh--AAssiiaann CCoouunnttrryy CCoonntteexxtt
AA tthheessiiss ssuubbmmiitttteedd iinn ffuullffiillmmeenntt ooff tthhee rreeqquuiirreemmeenntt ffoorr tthhee ddeeggrreeee ooff
DDooccttoorr ooff PPhhiilloossoopphhyy
BByy
MMuuhhaammmmaadd SShhaarriiff AAbbbbaassii BBCCSS ((HHoonnss)) CCoommppuutteerr SScciieenncceess
IInnffoorrmmaattiioonn SSyysstteemmss EEvvaalluuaattiioonn aanndd iinntteeggrraattiioonn ggrroouupp ((IISSEEiinngg))
BBrruunneell BBuussiinneessss SScchhooooll,,
BBrruunneell UUnniivveerrssiittyy,, LLoonnddoonn
JJuunnee,, 22001111

ii
Abstract
The models that predict the factors of individuals’ acceptance behaviour are predominantly
based on a technology acceptance model (TAM) or the TAM’s conceptualisation.
Although the TAM has a parsimonious structure and good explanatory power across the
time, population and context, it is still criticised by a number of researchers. Categorically,
it is criticised due to: inherent ‘cultural bias’ that limits its generalisability across cultures
(national to organisational level); its underlying conceptualisation of predicting acceptance
behaviour solely based on an ‘individual-based reactions’ that limits its applicability over
the group’s effect (normative and social influence); and finally, due to its presupposition to
examine the effect of ‘external variables’ through the only mediation effect of beliefs’
perceived ease of use (PEOU) and perceived usefulness (PU) that limits its ability to be
extended beyond its boundaries by adding further factors directly or indirectly affecting
intention behaviour (BI).
To overcome mentioned limitations, an extended technology acceptance model to suit a
developing country context is presented. The model attempted to delineate the direct
relationship between behavioural beliefs, normative and control beliefs, management
support beliefs, and task-specific beliefs towards acceptance intention and usage. In
addition, the model examined the overlooked moderating impact of demographic and
situational variables (age, gender, organisational type, academic position, educational
level, experience usage and voluntariness) and cultural dimensions (masculinity-
femininity, individualism-collectivism, power distance, and uncertainty avoidance) on
indirect relations predicting acceptance behaviour.
This study used a quantitative methodology to investigate the correlational paths. Using a
cross-sectional survey method, data was collected from 504 academics working in 25
public and private higher educational institutions in Pakistan. Overall response rate was
53.9% (i.e. 504 out of 935). After data-screening, the final model was tested with 380
subjects. Hypothetical relationships were examined using structural equation modelling
(SEM) based on the partial least squares (PLS) at the first stage, and with analysis of
moment structures (AMOS) at the second stage. The indirect exploratory effect of the
moderators was examined using multi-group analysis (MGA) method.
The study findings indicate that the extended model achieved an acceptable fit with the
data and most of the hypothetical paths were significant. Specifically, in the direct
iii
relationships, out of 20 paths representing 12 hypotheses, 11 were supported leaving 9 as
unsupported. The highest variance explained by the independent variables towards
dependent variables was quite similar in PU and BI (R2=26% in both using PLS; R2=34%
in BI and 33% in PU using AMOS). The highest significant path was perception of
usefulness, followed by academic tasks and resource facilitations towards intention; and
perception of ease of use, subjective norms, and institute support towards perception of
usefulness.
The findings of moderating factors i.e., demographics revealed that subjects younger in
age, female in gender and bachelor degree in education were influenced by the perception
of ease of use, and normative beliefs; control beliefs were influenced by the organisation
being private; management support at institute level was more influential in private
organisations with mandatory settings; and the effect of perception of usefulness and
normative beliefs was decreased with the increased experience. From the cultural
perspective, the highly sensitive path was between normative beliefs and the perception of
usefulness, so that the effect was stronger for subjects who were feminine in nature,
collectivist in society, and high on power distance. Demographic factor academic-position
and cultural dimension uncertainty avoidance did not produce any moderation effect.
Finally, based on the findings, limitations and implications for theory and practices are
devised.
iv
Dedication
This research which is accomplished with the only Grace of Al-Mighty Allah (swt), His
(swt) Prophet Muhammad (P.B.U.H) and Family of Prophet (P.B.U.H) is dedicated to my
parents, my grandmother, my three beloved brothers, three loving sisters, and a beautiful
wife. Without their encouragement and support I would not be able to achieve anything
today. Also, I dedicate my work to my dearly departed two uncles, two cousins and two
friends whom I sadly lost during my Ph.D. studies. May Allah (swt) rest their soul in
heaven (Amin).

v
Acknowledgements
First I thank to Allah swt giving me insight where and when I needed, and giving me
chance to finish what I started way back in the winter January 2007.
My special thanks to my supervisor, Professor Zahir Irani, without whom I would not have
been to complete this mammoth task. His valuable guidance, motivational support, and
encouragement were invaluable to me. Specifically, in last few months of PhD, where I
would have impetus to finish the study, I doubt without Prof. Irani support it would be not
possible to me to complete PhD in mean time. I feel fortunate and proud to be one of his
students and work under his auspicious supervision. I also like to thank my second
supervisor Professor Amir Sharif, who timely read my work with interest and discussed
feedback critically on all the aspects of my thesis.
I would like to thank my family for sticking by me in the days and nights that it took to
finish this work. I remember your prayers every day; I feel your love in expectations that
the work will one day be concluded. Specifically, my mother, grandmother and sister’s
prayers, my father and brother’s anxiety about my PhD completion, and my wife’s love
and encouragement at the time when I thought I wouldn’t be able to make it, are
unforgettable assets for me. You never gave up on me and Inshallah I will never give up
for you all.
I would also like to thanks to the all PhD students, friends and staff member at Brunel
Business School and, particularly friends: Fida Chandio, Jamshed Halepota, Adel Flici, Dr.
Yousra Assad, Matilda Chen, Dr. Raed, Dr. Selcuk, Abdullah Al-Ghamdi, Pantea Foroudi,
and school admin: Emma Sigsworth and Joanna Barry. My acknowledgement remains
incomplete without mentioning names of my housemates: Aslam Shani and his brothers,
Shahzad Memon, Ashique Jhatiyal, Karimullah, Gohar Saleem, Yasir Gill, and friends at
university and around: Adi Misbah Qureshi, Dr. Nafi-al-Hussani, Dr. Sarwar Shah, Sir
Hyder Nizamani, Sir Fattah Soomro, Sain Ghulam Hussain Shah, and friends from Gulf
country region. I remember some of friends’ questions: “Haven’t you finished it yet? How
much longer do you have to go?” thanks friends, truly great friends to have! Thank you all.
Finally, I would like to acknowledge my gratitude to The University of Sindh Jamshoro for
its sponsorship. My thanks go to my participants who were very keen to help me in
collecting the data and dedicated their time for the completion of this work.

vi
Author’s Declaration
I, Muhammad Sharif Abbasi, declare that the ideas, research work, analyses and
conclusions reported in my PhD thesis Culture, Demography and Individuals’ Technology
Acceptance Behaviour: A PLS Based Structural Evaluation of an Extended Model of
Technology Acceptance in South-Asian Country Context are entirely my effort, except
where otherwise acknowledged. Also, I certify that this thesis contains no material that has
been submitted previously, in whole or in part, for the award of any other academic degree
or diploma. Except where otherwise indicated, this thesis is my own work.
Publications associated with this thesis
1. Abbasi, M. S. (2009), Acceptance of Information Technology in Under-Developing
Countries: Empirical Evidence of Internet Usage within the Academics of Pakistan
Higher Education Commission (HEC) System, Brunel Business School Annual Symposium, Brunel University, 23-24 March.
2. Abbasi, M. S. (2010), Determinants of Social and Institutional Beliefs about
Internet Acceptance within Developing Country’s Context: A Structural Evaluation
of Higher Education System in Pakistan, Brunel Business School Annual Symposium, Brunel University (Best Overall Paper).
http://www.brunel.ac.uk/329/bbs%20documents/phd%20doctoral%20symposium%2010/sharifabbasi.pdf
3. Abbasi, M. S., Irani, Z. & Chandio, F.H. (2010), Determinants of social and
institutional beliefs about internet acceptance within developing country’s context:
A structural evaluation of higher education systems in Pakistan", (Revised version
of Brunel Business School Symposium), Proceedings of the European and
Mediterranean Conference on Information Systems, Abu Dhabi, UAE, 12-13 April
2010 (Best Overall Paper). http://bura.brunel.ac.uk/handle/2438/4304
4. Abbasi, M. S., Chandio F. H., Soomro A. F, Shah, F. (2011), Social influence,
voluntariness, experience and the internet acceptance: An extension of technology
acceptance model within a south-Asian country context, Journal of Enterprise
Information Management, Vol. 24 Iss: 1, pp.30 - 52.
5. Abbasi, M. S., Irani, Z., (2011), The Role of Gender Differences, Culture and Social
Influence in Technology Acceptance Behaviour, Management Sciences (under
review).
6. Abbasi, M. S., Irani, Z., (2011), Culture and individual’s acceptance behaviour: A
PLS based multi-group evaluation of Masculinity-Femininity and Uncertainty-
Avoidance, European Journal of Information Systems (paper submitted).
7. Abbasi, M. S., Irani, Z., (2011), Culture and individual’s acceptance behaviour: A
PLS based multi-group evaluation of Power Distance and Individualism-
Collectivism, Information and Management (paper submitted).

vii
Chapter 1 Table of Contents Abstract .............................................................................................................................................. ii
Dedication ..........................................................................................................................................iv
Acknowledgements ............................................................................................................................. v
Author’s Declaration ..........................................................................................................................vi
Publications associated with this thesis .............................................................................................vi
List of Tables .................................................................................................................................. xiii
List of Figures ..................................................................................................................................xiv
List of Appendix ..........................................................................................................................xiv
Chapter 1 ........................................................................................................................................... 16
Introduction ....................................................................................................................................... 16
1.1. Precursors and rationales of the research .......................................................................... 16
1.2. Aim of the research ........................................................................................................... 20
1.3. Objectives of the research ................................................................................................. 22
1.4. Research methodology ...................................................................................................... 23
1.5. Context of the study .......................................................................................................... 24
1.6. Organisation of the thesis .................................................................................................. 25
Chapter 2 ........................................................................................................................................... 28
Multitude theories of technology acceptance models and national culture ...................................... 28
Introduction ................................................................................................................................... 28
2.1. Theories and models of technology acceptance behaviour: A historical perspective ....... 29
2.2. Diffusion of Innovation theory ......................................................................................... 30
2.3. Social Cognitive Theory ................................................................................................... 36
2.4. Theory of Reasoned Action .............................................................................................. 40
2.5. Theory of Planned Behaviour ........................................................................................... 44
2.6. Decomposed Theory of Planned Behaviour ..................................................................... 46
2.7. Technology Acceptance Model ........................................................................................ 49
2.8. Revised Technology Acceptance Model 2 ........................................................................ 55
2.9. Augmented version of the TAM ....................................................................................... 58
2.10. Unified Theory of Acceptance and Use of Technology ................................................ 59
2.11. Comparison of models in the literature ......................................................................... 63
2.11.1. TAM vs. TPB ............................................................................................................ 64
2.11.2. TPB vs. DTPB .......................................................................................................... 67
2.11.3. TAM vs. TPB vs. DTPB ........................................................................................... 68
2.11.4. TPB vs. DTPB vs. TRA ............................................................................................ 70
2.11.5. TAM vs. TPB vs. TRA ............................................................................................. 71

viii
2.11.6. TAM2 vs. UTAUT and other models ....................................................................... 73
2.12. Cultural issues and IT acceptance ................................................................................. 84
2.12.1. Defining culture ........................................................................................................ 84
2.12.2. Layers of culture ....................................................................................................... 85
2.13. Cultural dimensions and Hofstede’s model .................................................................. 87
2.13.1. Power Distance ......................................................................................................... 89
2.13.2. Individualism and Collectivism ................................................................................ 90
2.13.3. PD vs. IC ................................................................................................................... 91
2.13.4. Masculinity\Femininity ............................................................................................. 91
2.13.5. MAS vs. IC, PD, Gender and Age ............................................................................ 92
2.13.6. Uncertainty Avoidance ............................................................................................. 93
2.13.7. UA vs. MAS .............................................................................................................. 94
2.13.8. Long-Term and Short-Term Orientation ................................................................... 94
2.14. Critiques of Hofstede’s cultural theory ......................................................................... 94
2.15. Hofstede’s cultural theory and IT acceptance ............................................................... 96
2.16. Modification and adoption of Hofstede’s dimensions in the present study .................. 99
2.17. Context of the study .................................................................................................... 100
2.17.1. Country profile ........................................................................................................ 101
2.17.2. Social and cultural characteristics of Pakistan ........................................................ 102
2.17.3. Internet usage in Pakistan and lower penetration rate ............................................. 103
2.17.4. Government IT policies and the higher educational system ................................... 106
Conclusion .............................................................................................................................. 109
Chapter 3 ......................................................................................................................................... 111
Conceptual framework .................................................................................................................... 111
3.1 Theoretical background....................................................................................................... 111
3.2 Direct relationships ............................................................................................................. 115
3.2.1. Behavioural beliefs ................................................................................................. 115
3.2.2. Normative beliefs .................................................................................................... 116
3.2.3. Control beliefs ......................................................................................................... 118
3.2.4. Task characteristics ................................................................................................. 121
3.2.5. Behavioural intention towards behaviour usage ..................................................... 123
3.2.6. Management support: institutional-level and governmental-level .......................... 123
3.3 Moderating impact .............................................................................................................. 125
3.4 Moderators: demographic variables .................................................................................... 126
3.4.1. Age .......................................................................................................................... 126
3.4.2. Gender and Masculinity-Femininity ....................................................................... 128
ix
3.5 Moderators: educational level, academic position and organisational type ........................ 133
3.5.1. Organisational type ................................................................................................. 133
3.5.2. Academic position................................................................................................... 135
3.5.3. Educational level ..................................................................................................... 136
3.6 Moderators: Situational variables ....................................................................................... 137
3.6.1. Experience usage..................................................................................................... 137
3.6.2. Voluntariness .......................................................................................................... 138
3.7 Moderators: cultural variables ............................................................................................ 140
3.7.1. Masculinity-Femininity ........................................................................................... 140
3.7.2. Individualism-Collectivism ..................................................................................... 141
3.7.3. Power Distance ....................................................................................................... 143
3.7.4. Uncertainty Avoidance ........................................................................................... 144
Conclusion .............................................................................................................................. 147
Chapter 4 ......................................................................................................................................... 148
Research methodology .................................................................................................................... 148
Introduction ................................................................................................................................. 148
4.1. Understanding epistemological and ontological considerations ..................................... 148
4.1.1. Selection of positivism research approach .............................................................. 151
4.2. Research strategy: quantitative and qualitative ............................................................... 152
4.3. Selection of survey research strategy .............................................................................. 154
4.3.1. Review of methods previously applied in information system research ................. 154
4.3.2. Rationales for selecting surveys as the preferred research approach ...................... 156
4.4. Research design .............................................................................................................. 157
4.4.1. Decisions to finalise research design ...................................................................... 159
4.4.2. Purpose of the study: Hypothesis testing ................................................................ 159
4.4.3. Type of investigation: Correlational study .............................................................. 159
4.4.4. Extent of researcher interference with study: minimal extent ................................. 160
4.4.5. Study settings: Non-contrived ................................................................................. 160
4.4.6. Unit of analysis: Individuals ................................................................................... 160
4.4.7. Time horizon: Cross-sectional ................................................................................ 161
4.5. Population and sampling ................................................................................................. 161
4.5.1. Choice of sample ..................................................................................................... 162
4.5.2. Target population .................................................................................................... 162
4.5.3. Sampling frame ....................................................................................................... 163
4.5.4. Sample unit ............................................................................................................. 165
4.5.5. Sample size ............................................................................................................. 166

x
4.6. Instrument development .................................................................................................. 169
4.6.1. Questionnaire content development and operational items..................................... 170
4.7. Scale used ........................................................................................................................ 179
4.8. Data collection procedure ............................................................................................... 179
4.9. Pilot study ....................................................................................................................... 181
4.10. Data analysis process .................................................................................................. 181
4.11. Ethical considerations ................................................................................................. 185
Conclusion .................................................................................................................................. 186
Chapter 5 ......................................................................................................................................... 187
Data Analysis .................................................................................................................................. 187
Introduction ................................................................................................................................. 187
5.1. Pilot Study ....................................................................................................................... 188
5.2. Main Survey Study ......................................................................................................... 191
5.2.1. Missing Data and Treatment ................................................................................... 191
5.2.2. Outliers Examination .............................................................................................. 193
5.2.3. Normality, Homoscedasticity and Non-Response Bias of data .............................. 195
5.2.3.1. Normality ............................................................................................................ 195
5.2.3.2. Homoscedasticity ................................................................................................ 199
5.2.3.3. Multicollinearity.................................................................................................. 200
5.2.3.4. Non- Response Biasness ..................................................................................... 203
5.3. Demographic details of the Respondents ........................................................................ 204
5.3.1. Background Information ......................................................................................... 204
5.3.2. Background of Internet usage experience ............................................................... 206
5.3.3. Impact of reforms initiated by Higher Education Commission of Pakistan............ 207
5.4. Reliability and Validity of the Instrument ...................................................................... 208
5.5. Factor Analysis ............................................................................................................... 211
5.5.1. Exploratory Factor Analysis (EFA) ........................................................................ 212
5.5.2. Exploratory Factor Analysis (EFA) of Cultural Dimensions .................................. 221
5.6. Structural Evaluation of the Model ................................................................................. 224
5.6.1. Basic concepts of Structural Equation Modelling (SEM) ....................................... 224
5.6.1.1. Introduction ......................................................................................................... 224
5.6.1.2. Types of models in SEM ..................................................................................... 224
5.6.1.3. Practical consideration for SEM ......................................................................... 225
5.6.2. Rational for selecting SEM with PLS approach compared to CBSEM approach ... 226
5.6.3. Basic Model Evaluation .......................................................................................... 227
5.6.3.1. Step-one: Measurement Model Results .............................................................. 228
xi
5.6.3.2. Step-Two: Structural Model Results ................................................................... 232
5.6.4. Testing Moderating Impact ..................................................................................... 238
5.6.4.1. Steps to examine the moderating impact using MGA......................................... 240
5.6.4.2. Results of MGA for Demographic moderating variables ................................... 241
5.6.4.2.1 Age ...................................................................................................................... 241
5.6.4.2.2 Gender ................................................................................................................. 245
5.6.4.2.3 Organisational type ............................................................................................. 248
5.6.4.2.4 Academic position............................................................................................... 252
5.6.4.2.5 Educational level ................................................................................................. 255
5.6.4.2.6 Experience usage................................................................................................. 262
5.6.4.2.7 Voluntariness ...................................................................................................... 265
5.6.4.3. Results of MGA for Cultural moderating variables ............................................ 269
5.6.4.3.1. Masculinity and Femininity ................................................................................ 269
5.6.4.3.2. Individualism-Collectivism ................................................................................. 272
5.6.4.3.3. Power Distance ................................................................................................... 276
5.6.4.3.4. Uncertainty Avoidance ....................................................................................... 279
5.6.5. Post-analysis using AMOS ..................................................................................... 283
Conclusion .................................................................................................................................. 286
Chapter 6 ......................................................................................................................................... 289
Discussion and Synthesis ................................................................................................................ 289
Introduction ................................................................................................................................. 289
6.1. Discussion of the results: Extended model ..................................................................... 291
6.1.1. Behavioural beliefs ................................................................................................. 292
6.1.2. Normative beliefs .................................................................................................... 294
6.1.3. Control beliefs ......................................................................................................... 296
6.1.4. Task characteristics ................................................................................................. 298
6.1.5. Behavioural intention towards behavioural usage .................................................. 299
6.1.6. Management support: institutional and governmental level ................................... 300
6.2. Discussion of the results: moderators ............................................................................. 302
6.2.1. Demographic characteristics ................................................................................... 302
6.2.2.1. Age ...................................................................................................................... 302
6.2.2.2. Gender ................................................................................................................. 304
6.2.2.3. Organisational type ............................................................................................. 306
6.2.2.4. Academic position............................................................................................... 307
6.2.2.5. Educational level ................................................................................................. 308
6.2.2.6. Experience usage................................................................................................. 310
xii
6.2.2.7. Voluntariness ...................................................................................................... 313
6.2.2. Discussion: Cultural moderating variables ............................................................. 314
6.2.2.1. Masculinity-Femininity ....................................................................................... 314
6.2.2.2. Individualism-Collectivism ................................................................................. 316
6.2.2.3. Power Distance ................................................................................................... 318
6.2.2.4. Uncertainty Avoidance ....................................................................................... 320
Conclusion .................................................................................................................................. 321
Chapter 7 ......................................................................................................................................... 324
Conclusions ..................................................................................................................................... 324
Introduction ................................................................................................................................. 324
7.1. Implications and Contributions ....................................................................................... 325
7.1.1. Theoretical contributions ........................................................................................ 325
7.1.2. Methodological contributions ................................................................................. 330
7.1.3. Managerial and practical implications .................................................................... 331
7.2. Limitations and directions for future research ................................................................ 335
7.2.1. Sample size ............................................................................................................. 335
7.2.2. Context and generalisation ...................................................................................... 335
7.2.3. Cross-sectional study .............................................................................................. 336
7.2.4. Normality of data and construct reliability ............................................................. 337
7.2.5. Predictive power of the model ................................................................................ 338
7.2.6. Lack of mediation, indirect effect and new relations .............................................. 338
7.2.7. Moderation effect .................................................................................................... 339
References ................................................................................................................................... 341
Appendix-A..................................................................................................................................... 373
Appendix-B ..................................................................................................................................... 392
Survey Questionnaire .................................................................................................................. 393
xiii
List of Tables
Table 1. 1: Cultural position of Pakistan . ......................................................................................... 24 Table 2-1: Comparative results of A-TAM. ...................................................................................... 59 Table 2.2: Comparison of various technology acceptance models based on constructs significance and explanatory power (R2) .............................................................................................................. 83 Table 2. 3: Levels of culture: ............................................................................................................ 86 Table 2. 4: Levels of cultural studies in IS research ......................................................................... 87 Table 2 5: Hofstede’s cultural dimensions score .............................................................................. 89 Table 2. 6: Broadband subscribers by technology .......................................................................... 104 Table 2. 7: World Internet and broadband comparison ................................................................... 105 Table 2. 8: Comparison of public sector spending on education: ................................................... 107 Table 4. 1: Underlying research philosophical paradigms .............................................................. 150 Table 4. 2: Research design steps ................................................................................................... 161 Table 4. 3: Number of full and part-time faculty members within public and private sector universities/DAIs in 2003-04 .......................................................................................................... 164 Table 4. 4: Full-time faculty members classified by their highest qualification in2003-04. .......... 165 Table 4. 5: Number of full and part-time faculty members by public and private universities/DAIs in 2003-04. ...................................................................................................................................... 166 Table 4. 6: Operationalisation of research variables ....................................................................... 177 Table 4. 7: Preliminary data analysis techniques using SPSS v.16.0.............................................. 183 Table 5.1: Measurement of sampling adequacy and total variance ................................................ 190 Table 5. 2: Mann-Whitney-U-test to observe difference between first-five and last-five questions within instrument. ........................................................................................................................... 191 Table 5. 3: Univariate outliers......................................................................................................... 194 Table 5. 4: Multivariate Outlier detection ....................................................................................... 195 Table 5. 5: K-S Test of Normality .................................................................................................. 197 Table 5. 6: The shape of data distribution based on Skewness and Kurtosis values....................... 199 Table 5. 7: Leven’s test of homogeneity of variances .................................................................... 200 Table 5. 8: Pearson correlation for observing multicollinearity ..................................................... 202 Table 5. 9: Regression for observing VIF and tolerance effect ...................................................... 203 Table 5. 10: Mann-Whitney-U-test observing non-response biasness ............................................ 204 Table 5. 11:Demographic details of the respondents ...................................................................... 206 Table 5. 12: Descriptive of Interne experience usage ..................................................................... 206 Table 5. 13: Descriptive results of e-reforms initiated by Gov. of Pakistan ................................... 208 Table 5. 14: Initial assumptions of EFA ......................................................................................... 213 Table 5. 15: Communalities shared by individual items ................................................................. 214 Table 5. 16: Eigenvalues and variance extracted by each component ............................................ 215 Table 5. 17: Parallel analysis for confirming the factors extracted using PCA .............................. 216 Table 5. 18: Pattern Matrix (factor loading) ................................................................................... 218 Table 5. 19: Eigenvalues and variance extracted by each component of cultural dimensions ....... 222 Table 5. 20: Pattern Matrix (cultural factors).................................................................................. 222 Table 5. 21: Criterion of assessment of the measurement model ................................................... 229 Table 5. 22: Outer/factor loading with cross-loadings .................................................................... 231 Table 5. 23: Inter-construct correlation and AVE for basic model ................................................. 232 Table 5. 24: Criterion of assessment of the Structural model ......................................................... 233 Table 5. 25: Structural relations and path significance of basic model........................................... 238 Table 5. 26: Overall overview of results and GoF of basic model.................................................. 238 Table 5. 27: Inter-construct correlation and AVE for moderator age ............................................. 242 Table 5. 28: Overall overview of results and GoF of moderator age .............................................. 243 Table 5. 29: Structural relations and path significance difference of moderator age ...................... 245 Table 5. 30: Inter-construct correlation and AVE for moderator gender ........................................ 246 Table 5. 31: Overall overview of results and GoF of moderator gender ........................................ 247 Table 5. 32: Structural relations and path significance difference of moderator gender ................ 248 Table 5. 33: Inter-construct correlation and AVE for moderator organisational type .................... 249

xiv
Table 5. 34: Overall overview of results and GoF of moderator organisation type ........................ 250 Table 5. 35: Structural relations and path significance difference of moderator organisation type 252 Table 5. 36: Inter-construct correlation and AVE for moderator academic position ...................... 252 Table 5. 37: Overall overview of results and GoF of moderator academic position ...................... 254 Table 5. 38: Structural relations and path significance difference of moderator academic position. ........................................................................................................................................................ 255 Table 5. 39: Inter-construct correlation and AVE for moderator educational level ....................... 256 Table 5. 40: Overall overview of results and GoF of moderator educational level ........................ 258 Table 5. 41: Structural relations and path significance difference of moderator educational level. ........................................................................................................................................................ 261 Table 5. 42: Inter-construct correlation and AVE for moderator usage experience ....................... 263 Table 5. 43: Overall overview of results and GoF of moderator usage experience ........................ 264 Table 5. 44: Structural relations and path significance difference of moderator usage experience 265 Table 5. 45: Inter-construct correlation and AVE for moderator voluntariness ............................. 267 Table 5. 46: Overall overview of results and GoF of moderator voluntariness .............................. 268 Table 5. 47: Structural relations and path significance difference of moderator voluntariness ...... 269 Table 5. 48: Inter-construct correlation and AVE for moderator MF ............................................. 270 Table 5. 49: Overall overview of results and GoF of moderator MF.............................................. 271 Table 5. 50: Structural relations and path significance difference of moderator MF ..................... 272 Table 5. 51: Inter-construct correlation and AVE for moderator IC ............................................... 273 Table 5. 52: Overall overview of results and GoF of moderator IC ............................................... 275 Table 5. 53: Structural relations and path significance difference of moderator IC ....................... 276 Table 5. 54: Inter-construct correlation and AVE for moderator PD ............................................. 277 Table 5. 55: Overall overview of results and GoF of moderator PD .............................................. 278 Table 5. 56: Structural relations and path significance difference of moderator PD ...................... 279 Table 5. 57: Inter-construct correlation and AVE for moderator UA ............................................. 280 Table 5. 58: Overall overview of results and GoF of moderator UA.............................................. 282 Table 5. 59: Structural relations and path significance difference of moderator UA ..................... 283 Table 5. 60: Structural path relations using AMOS ........................................................................ 284 Table 5. 61: Overall overview of results and model fitting using AMOS ...................................... 286 Table 6. 1: Number of men and women within psychological categorisation of gender. ............... 315
List of Figures Figure 2. 1: Innovation Diffusion Process ........................................................................................ 33 Figure 2. 2: Social Cognitive Theory ................................................................................................ 38 Figure 2. 3:Theory of Reasoned Action ............................................................................................ 42 Figure 2. 4: Theory of Planned Behaviour ........................................................................................ 45 Figure 2. 5: Decomposed Theory of Planned Behaviour .................................................................. 49 Figure 2. 6: Technology Acceptance Model ..................................................................................... 50 Figure 2. 7: Technology Acceptance Model2: .................................................................................. 56 Figure 2. 8: Augmented version of the TAM .................................................................................... 58 Figure 2. 9: Unified Theory of Acceptance and Use of Technology (UTAUT) ............................... 61 Figure 2. 10: Ratio of increase in higher education funding ........................................................... 108
Figure 3.1:Conceptual Model ........................................................................................................ 114 Figure 4. 1: Research Design .......................................................................................................... 158 Figure 5. 1: Box-Plot representing multivariate outliers ................................................................. 195 Figure 5. 2: Multivariate normal P-P plot of regression standardised residual ............................... 197 Figure 5. 3: Scree Plot of all the dimensions .................................................................................. 216 Figure 5. 4: Scree Plot (cultural dimensions) .................................................................................. 222 Figure 6.1: Final model………………………………………………………………….291
List of Appendix Table A. 1: Missing data examination at item-level ....................................................................... 374
xv
Table A. 2: Missing data examination at Construct-level ............................................................... 375 Table A. 3: Assessment of normality .............................................................................................. 378 Table A. 4: Multivariate normality ................................................................................................. 380 Table A. 5: Details of questionnaires distributed and response rate ............................................... 382 Table A. 6: Reliability and Validity of the survey questionnaire.................................................... 386 Table A. 7: Direct and In-direct path relations ............................................................................... 391
Figure A. 1: Normal probability Q-Q plot ...................................................................................... 377 Figure A. 2: PLS based Path diagram ............................................................................................. 387 Figure A. 3: PLS based t-values...................................................................................................... 388 Figure A. 4: Unstandardised path estimations using AMOS .......................................................... 389 Figure A. 5: Standardised path estimations using AMOS .............................................................. 390
16
Chapter 1
Introduction
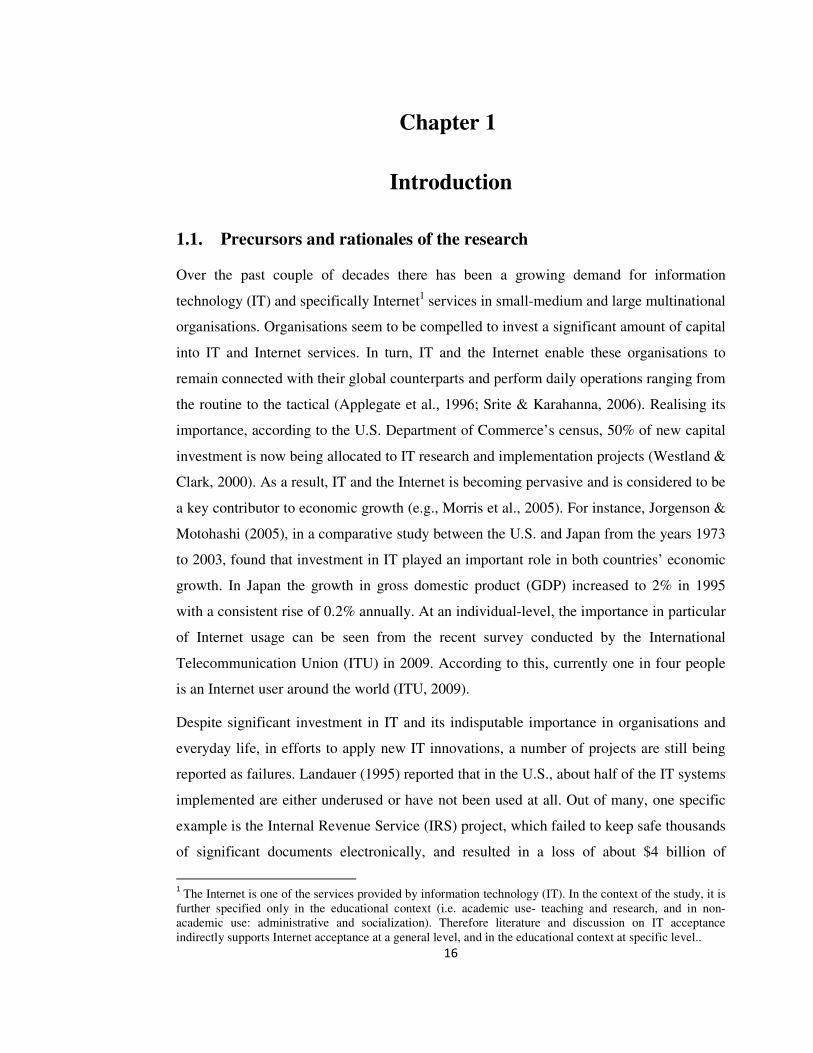
1.1. Precursors and rationales of the research
Over the past couple of decades there has been a growing demand for information
technology (IT) and specifically Internet1 services in small-medium and large multinational
organisations. Organisations seem to be compelled to invest a significant amount of capital
into IT and Internet services. In turn, IT and the Internet enable these organisations to
remain connected with their global counterparts and perform daily operations ranging from
the routine to the tactical (Applegate et al., 1996; Srite & Karahanna, 2006). Realising its
importance, according to the U.S. Department of Commerce’s census, 50% of new capital
investment is now being allocated to IT research and implementation projects (Westland &
Clark, 2000). As a result, IT and the Internet is becoming pervasive and is considered to be
a key contributor to economic growth (e.g., Morris et al., 2005). For instance, Jorgenson &
Motohashi (2005), in a comparative study between the U.S. and Japan from the years 1973
to 2003, found that investment in IT played an important role in both countries’ economic
growth. In Japan the growth in gross domestic product (GDP) increased to 2% in 1995
with a consistent rise of 0.2% annually. At an individual-level, the importance in particular
of Internet usage can be seen from the recent survey conducted by the International
Telecommunication Union (ITU) in 2009. According to this, currently one in four people
is an Internet user around the world (ITU, 2009).
Despite significant investment in IT and its indisputable importance in organisations and
everyday life, in efforts to apply new IT innovations, a number of projects are still being
reported as failures. Landauer (1995) reported that in the U.S., about half of the IT systems
implemented are either underused or have not been used at all. Out of many, one specific
example is the Internal Revenue Service (IRS) project, which failed to keep safe thousands
of significant documents electronically, and resulted in a loss of about $4 billion of
1 The Internet is one of the services provided by information technology (IT). In the context of the study, it is
further specified only in the educational context (i.e. academic use- teaching and research, and in non-academic use: administrative and socialization). Therefore literature and discussion on IT acceptance indirectly supports Internet acceptance at a general level, and in the educational context at specific level..
17
taxpayers’ money (Johnston, 1997). Such drastic cases in IT project alarmed organisations
to re-think and revise their policies to take decisions in IT investment. Researchers of
information system structures and acceptance greatly emphasised the need to understand
individuals’ inherent perceptual behaviour, which might appear differently across the
cultures (ranging from individuals to organisation, and organisations to national) (e.g.,
Srite & Karahanna, 2006; Karahanna et al., 2005; Straub et al., 1997) and/or across the
personal and demographic characteristics (e.g., Agarwal & Prasad, 1999; Venkatesh &
Morris, 2000). Morris et al. (2005, p.96) proposed that, for successful IT implementation,
project managers must prioritise individuals’ needs and expectations over and above the
system designers.
Realising the impact of an individual’s perceptual behaviour in successful IT
implementation, several intention-based theoretical models have been proposed to predict
cognitive acceptance behaviour. In this line of research, the technology acceptance model
(TAM) (Davis, 1989; Davis et al., 1989), TAM2 (Venkatesh & Davis, 2000), theory of
reasoned action (TRA) (Ajzen & Fishbein, 1980), the diffusion of innovation theory (DOI)
(Rogers, 1995), theory of planned behaviour (TPB) (Ajzen, 1991) and the unified theory of
acceptance and use of technology (UTAUT) (Venkatesh et al., 2003) are noteworthy
theoretical models that, in information system literature, predicted individuals’ acceptance
behaviour and persuaded them to adopt it. From this stream of theoretical models, the
TAM has emerged as a robust theoretical model due to its parsimonious structure and
acceptable explanatory fit (Venkatesh & Bala, 2008). The TAM posits that behavioural
beliefs, i.e., perceived usefulness (PU) and perceived ease of use (PEOU) affect acceptance
intention (BI) and usage behaviour (BU) (Davis, 1989; Davis et al., 1989).
However, through extensive replications of the original TAM and TAM’s extensions, the
literature suggests some limitations of both the TAM and the models based on its
conceptualisations (e.g., Venkatesh, 2000; Taylor & Todd, 1995a; Venkatesh et al., 2007)
with one of many being cultural bias (Straub et al., 1997; Abbasi et al., 2010; Rose &
Straub, 1998; Bagozzi, 2007). For instance, Straub et al. (1997) examined the TAM in the
context of three countries i.e., Japan, Switzerland and U.S, and found similar variance
(R2=10%) explained in behavioural usage in the U.S. and Swiss sample but very different
variance in the Japanese sample context i.e., only 1%. The results of Straub et al. (1997)
were expected because Davis et al. (1989), at the time of the TAM development, did not
considered cultural bias within the model.
18
It is noted that, generally, studies based on the TAM or its conceptualisations are restricted
to North America and Western countries and, more specifically, to a single country such as
the U.S. (e.g., Venkatesh & Morris, 2000; Venkatesh et al., 2004), which limits their
generalisablity and reliability across the different cultures. However, recognising the
ongoing drive of globalisation, a few notable studies have been carried out outside the U.S
on, for example: e-commerce and e-service (Pavlou & Chai, 2002; Choi & Geistfield,
2004; Jarvenpaa & Leidner, 1999), Internet banking (Shih & Fang, 2004; Alsajjan &
Dennis, 2010), broadband Internet use and adoption (Oh et al., 2003; Choudrie & Lee,
2004; Khoumbati et al., 2007), healthcare (Wu et al., 2007), and academic and email use
(Straub et al., 1997; Hu et al., 2003; McCoy et al., 2007). Previous studies outside the U.S.
tended to generalise their results by discoursing similarities and differences between the
native country’s cultural indices proposed by Hofstede (1980) with the studies conducted
in the U.S. Surprisingly, most of these studies did not directly incorporate and measure
cultural dimensions (e.g., Straub et al., 1997), and hence, this leaves a gap in understanding
country-level cultural differences2 and, more importantly, individual-level cultural
differences that, according to Srite & Karahanna (2006), are held differently even within
same country.
Apart from the cross-cultural differences at a national-level, diversities within intra-culture
(within the same nation, but in different organisations or groups) are also identified
(Hofstede, 1994; Srite & Karahanna, 2006), however, these have rarely been investigated
in IT acceptance literature (Honold, 1999). A reason behind the lack of research in this
domain is consistent with the underlying conceptualisation of the TAM and its extensions.
The TAM presupposes that decisions to accept and usage are initiated through the
‘individual reactions’ (Venkatesh et al., 2003, p.427), and hence apparently overlooks the
importance of the group, cultural and social aspects when making acceptance decisions. It
may be argued that, in a later extension of TAM normative beliefs ‘social pressure’ was
introduced to overcome these limitations and enhance the acceptance with reference to the
group influence (e.g., Moore & Banbast, 1991; Venkatesh & Davis, 2000). However, in
reality, examining this limited impact of social group on individuals’ interpersonal
intentions was not enough to predict the effect of the groups itself (Bagozzi, 2007). This is
the reason that most of the studies applying/relaying on the TAM showed mixed results
2 It is assumed that, with respect to the time elapsed (30 years), Hofstede’s dimensions score is not stable
enough to generalise the results to the present time (see McCoy et al., 2005; McSweeney 2002).

19
when normative beliefs were examined to predict the acceptance intentions (e.g.,
Venkatesh & Davis, 2000; Mathieson, 1991).
Partly because of the above limitation, the rationale behind incorporating the significance
of the group-level cultural influence3 in the present study is consistent with human
behaviour that cannot be best characterised by an individual’s isolated actions (Bagozzi,
2007). It is commonly accepted that individuals more often perform some act in response
to social pressure that might appear separately/jointly from friends, family members,
colleagues or agents of organisations (Bagozzi, 2007a; Kelman, 1958). In summary,
decisions to accept any technology need an equal consideration of the individual’s
prerequisites as well as the groups of which one is member. In this research, beside the
normative influence (widely recognised in previous literature), emphasis is specifically
given to the influence of organisational factors (management support at different levels).
The importance of these factors is imperative (e.g., Lewis et al., 2003). For instance,
Robey (1979) warned that management information systems (MIS) can and do fail in
situations where organisational factors are ignored by the system designer. In a similar line
of research, Tan & Toe (1998) found that organisational constructs (technology policies
and top management support), technological constructs (relative advantages and
compatibility), and environmental constructs (information intensity, competitive pressure
and government support) produced a significant impact on individuals’ Internet adoption
behaviour.
Finally, consistent with the argument at the start of the section which advocates that
successful IT implementation decisions need a user-centred approach (individuals’ or end-
users expectation-based), it is argued that models predicting individuals’ acceptance
behaviour (specifically the TAM and its extensions) remain futile to examine the effect of
external factors in establishing intention. Rationally, the TAM, to keep its parsimony
intact, postulates that an effect of external variable(s) on intentions is only possible with
the mediated impact of PU and PEOU (Davis et al., 1989), and thus overlooks the direct
link (predictor) or indirect link (moderator/mediator) between essential external beliefs and
intention to establish acceptance behaviour. Despite the fact that parsimony (favouring a
simple model), to some extent, is considered to be desirable if the model fails to predict
expected substance (Venkatesh et al., 2003; Taylor & Todd, 1995b), seemingly it attracted
a number of researchers (e.g. Venkatesh & Davis, 2000; Venkatesh & Bala, 2008; Lewis et
3 In the present study group-level cultural influence refers to the influence of organisational context which
might emanate at local institute-level or top-government level
20
al., 2003; Parboteeah et al., 2005) and models (e.g., TAM2, TAM3, TRA, TPB) to turn a
blind eye to examining valuable insights into individuals’ user acceptance that may be
manipulated or fostered by the inspection of external beliefs. Since the inception of the
TAM by introducing output quality as the first external factor, a wide range of external
factors are introduced in the technology acceptance models in an attempt to predict the
intention either through PEOU or PU (see meta-analysis, Sun & Zhang, 2006; Lee et al.,
2003). Sun & Zhang (2006) broadly categorised these variables into three groups as:
organisational factors, technological/system factors and individual factors. Overcoming the
limitations of previous models, in the present study only the effect of organisational and
individual factors is coherently incorporated with the indirect (moderator) link between
beliefs and intention to examine acceptance behaviour.
Thus, the discussion can conclude that development in IT and the Internet enhanced the
growth/interest in usage but equally presented (persistently inherent) challenges to
understanding the extent to which an individual accepts a specific technology. Given that,
in the line of research that suggests that behavioural models of technology acceptance
failed to serve equally across the cultures (national), within cultures (within groups), across
the individual’s personal and external factors (demographic and institutional factors), this
study positions the research question as follows in the next section.
1.2. Aim of the research
Based on the rationales presented in section (1.1), this study intended to present the
conceptual model that delineated the barriers and drivers of an individual’s acceptance
behaviour towards Internet usage within an academic context. Primarily, drawing upon
social cognitive theory (SCT) and the technology acceptance models (TAM), the study
integrated the predictors of acceptance belief from the theory of reasoned action (TRA),
TAM2, the decomposed theory of planned behaviour (DTPB) and the unified theory of
acceptance and usage technology (UTAUT). In addition, the model also incorporated the
theories of task technology fit (TTF), Bem’s Sex Role Inventory (BSRI), and Hofsted’s
theory of national culture. In doing so, the coherent model answered the research question
of the present study.
How do predictors of perceived behavioural beliefs, social and control beliefs,
management support at institutional and governmental level, and task characteristics
influence individuals’ behaviour towards acceptance of Internet technology? In addition,
how are basic beliefs of an individual’s acceptance behaviour influenced by the

21
moderating impact of demographic characteristics (age, gender, organisational type,
academic position, educational level, experience usage and voluntariness) and by native
cultural dimensions (masculinity-femininity, individualism-collectivism, power distance,
and uncertainty avoidance)?
Before explaining the objectives of the study, it is worth to clarify the
constraints/boundaries of the study from the perspective of culture and type of technology.
From the culture stance, this study aims to examine the impact of culture on an individual-
level and intra-organisational-level rather than cross-national level. Therefore, despite of
fact that results and discussion of the present study are logically incomparable with the
studies conducted in Western and North-American countries’ context4. However, for
comprehending whatever insights (e.g. differences and similarities) in terms of extending
current literature in the specific developing country context (i.e. Pakistan and specifically
educational institutes), the findings of the present study are supported with the established
literature in the developing country context. Given that, generalisability of the results with
the cautious interpretations is still applicable in the context (i.e. country and organization)
sharing similar to the current study’s context.
From the specific technology perspective, the aim of this study is to examine individual’s
acceptance behaviour towards Internet applications within the educational context.
Broadly, these applications are categorized into two groups5. First, use of the Internet in
applications supporting teaching and research tasks (i.e. academic tasks), and second use of
the Internet in the applications supporting administrative tasks and socialization (i.e. non-
academic tasks). More specifically, within the academic tasks, individuals’ acceptance
behaviour alike other ‘world wide web’ applications (e.g. internet-banking, e-commerce,
etc.) were examined based on their Internet usage for- preparing teaching material (e.g.
power point presentations, lectures, tests, tutorial, etc.) through downloading, to contact
with students (e.g. use of e-mail service), and to enhance their own research skills (e.g. use
of digital library, web-portal Google-scholar, e-learning, etc.). On other side, in non-
academic use of Internet applications, individuals acceptance behaviour was examined
based on their Internet usage for- the interaction with friends and family members using, e-
mail, messaging, and social networking sites (e.g. facebook, twitter, etc); and to perform
administrative tasks (e.g. attendance updates, time-tabling, assignments schedules, etc.).
4 This is the limitation of the present study and reported in detail in chapter 7, section 7.2.2
5 The use of the Internet applications into the two different categories in education sector is based on the
characteristics of the tasks. Details tasks characteristics are given in chapter 3, section 3.2.4.

22
1.3. Objectives of the research
Pertaining to the aim of the research presented in section (1.2), the following research
questions/objectives are formulated with expected solutions.
1. How are an individual’s intentions formed towards the acceptance of the
technology and to what extent are they related to future usage? To answer this
objective, a detailed review of the prominent theories and models in the technology
acceptance domain are inspected. In doing so, it developed the background
knowledge to the beliefs in the present study, their formation and factors that
facilitate/impede persistent usage.
2. Consistent with the first objective, the second objective is to select an appropriate
single/multiple theoretical model/constructs(s) to achieve the aim of the present
research. To answer this objective, a detailed comparison based on path
significance (β value) within the model, and explanatory power (R2) across the
models is inspected. In doing so, it helped to delineate the weakness and strengths
of each model/construct(s), which in turn lead to the development of the
conceptual model for the present study.
3. Based on the first two objectives, an extended model is formulated to
predict/examine the individuals’ acceptance behaviour.
4. The next step was to select an appropriate methodology, relevant constructs with
their measuring items, and operationlisation of instruments and demonstration of
their reliability and validity. This leads to the examination of the direct
hypothetical path relations proposed in the conceptual framework.
5. Based on the first three objectives, it is explored whether there is any perception of
difference between the segments of users (academics) towards acceptance of the
technology (the Internet) on the basis of their demographic characteristics. The
importance of the demographic variables, both direct (predictor) and indirect
(moderators), is reviewed in the technology acceptance literature. Based on the
substance of the review, exploratory relationships are proposed and, at a later stage,
the effect is examined using the multiple-group analysis (MGA) method.
6. Based on the first three objectives, it is explored whether there is any perception of
difference between segments of the users (academics) towards acceptance of the
technology (the Internet) on the basis of their individual cultural characteristics.
23
The importance of Hofstede’s cultural dimensions (masculinity-femininity,
individualism-collectivism, power distance, uncertainty avoidance), both direct
(predictor) and in-direct (moderators), is inspected in technology acceptance
literature. Based on the literature, exploratory relationships are established and, at a
later stage, are examined using PLS multiple-group analysis (MGA) method.
7. Finally, based on empirically validated results, implications for practices and
managerial policies are devised, so they may encourage users to accept the
technology. In addition, the potential limitations of the study are being highlighted,
which may be helpful for future researchers to extend or replicate the present study
in a different context.
1.4. Research methodology
In order to achieve the aims of the study, the selection of methodology is based on the
nature of the research question and previous literature that addresses similar problems.
From the philosophical perspective, this research applied the positivism approach with
quantitative strategy of analysis. The method for data collection is the survey. Rationally,
it is consistent with the argument that suggests selecting a research approach based on the
role of the researchers involved as part of the research being studied (Gilbert, 2001).
Therefore, within the current context of the study, which requires examining technology
acceptance behaviour of a large number of individuals working in higher educational
institutes, it is illogical for the researcher to be part of the research and conduct qualitative
interviews. From the perspective of overall research design, the purpose of this study is to
test the hypothetical relations, the type of investigation is correlational, the extent of the
researcher is minimal, the setting of study is non-contrived, the unit of analysis are
individuals, and finally, the time of examination is cross-sectional.
Based on quantitative methodology, the initial survey instrument is developed from the
pool of items widely accepted in the previous technology acceptance literature. Based on
the pilot study findings, the instrument is revised based on content validity and reliability
of the measures. After finalising the instrument, using a probability sampling approach,
data is collected through self-administrative and mail (postal and email) survey methods.
The targeted sample frame is 14,434 academics working in 57 public and private higher
educational institutes of Pakistan.
The completed questionnaires are screened using descriptive statistical techniques with
SPSS 16.0. The analysis with SPSS includes: coding, editing, checking missing data,
24
assumptions of normality, linearity, multi-collinearity, outliers, non-response bias and
factor analysis. In the next stage, using structural equation modelling (SEM), inferential
statistics is examined to validate the model-fitting and test the hypothetical relationships
suggested in the present study. The primary analysis technique within SEM is partial least
squares (PLS); however, to confirm the robustness of the model at a later stage, the results
are being re-examined with the analysis of moment structures (AMOS).
1.5. Context of the study
The present study intends to examine individuals’ technology (the Internet) acceptance
behaviour within higher educational institutes in Pakistan. From a country perspective,
there are two reasons to select Pakistan as a context for the study.
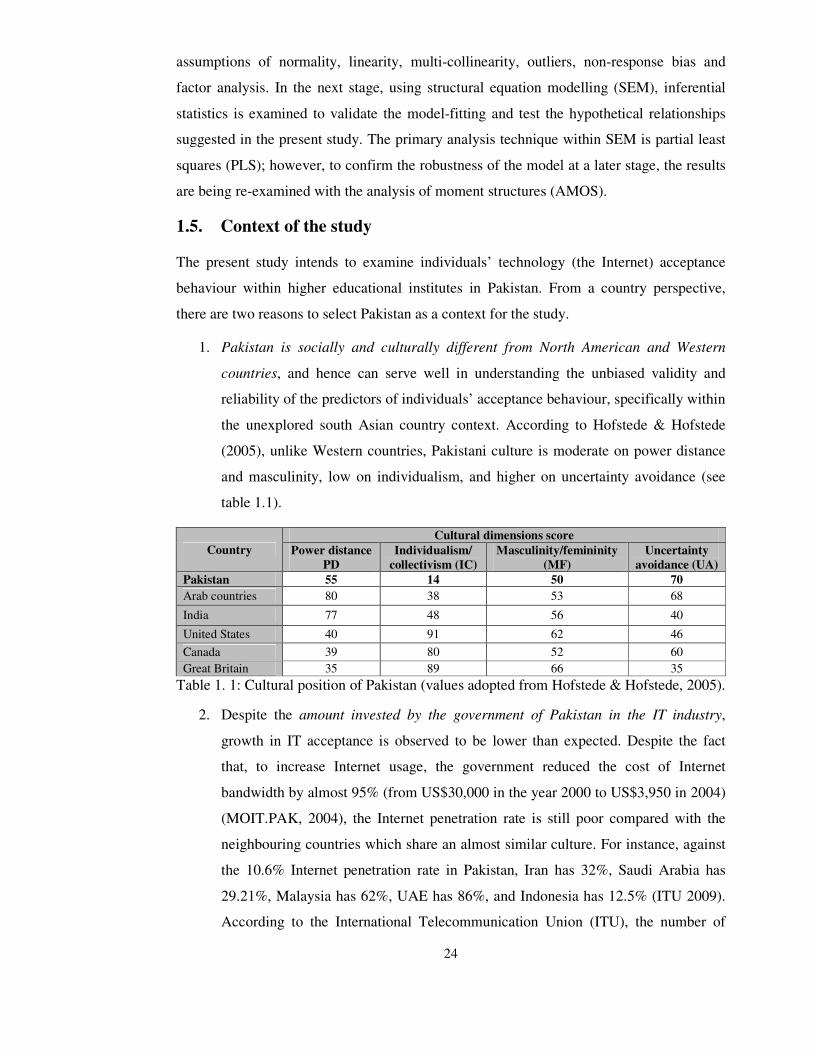
1. Pakistan is socially and culturally different from North American and Western
countries, and hence can serve well in understanding the unbiased validity and
reliability of the predictors of individuals’ acceptance behaviour, specifically within
the unexplored south Asian country context. According to Hofstede & Hofstede
(2005), unlike Western countries, Pakistani culture is moderate on power distance
and masculinity, low on individualism, and higher on uncertainty avoidance (see
table 1.1).
Country
Cultural dimensions score
Power distance
PD
Individualism/
collectivism (IC)
Masculinity/femininity
(MF)
Uncertainty
avoidance (UA)
Pakistan 55 14 50 70
Arab countries 80 38 53 68
India 77 48 56 40
United States 40 91 62 46
Canada 39 80 52 60
Great Britain 35 89 66 35
Table 1. 1: Cultural position of Pakistan (values adopted from Hofstede & Hofstede, 2005).
2. Despite the amount invested by the government of Pakistan in the IT industry,
growth in IT acceptance is observed to be lower than expected. Despite the fact
that, to increase Internet usage, the government reduced the cost of Internet
bandwidth by almost 95% (from US$30,000 in the year 2000 to US$3,950 in 2004)
(MOIT.PAK, 2004), the Internet penetration rate is still poor compared with the
neighbouring countries which share an almost similar culture. For instance, against
the 10.6% Internet penetration rate in Pakistan, Iran has 32%, Saudi Arabia has
29.21%, Malaysia has 62%, UAE has 86%, and Indonesia has 12.5% (ITU 2009).
According to the International Telecommunication Union (ITU), the number of

25
Internet users per 100 people in Pakistan reached only 11.4 in the year 2008 (ITU,
2009). The low Internet penetration rate raises the alarm that investing a significant
amount of capital is not enough to boost the IT and Internet industry, but it requires
a further exploration of factors that may help to encourage individuals to accept IT
and Internet technology.
The reason behind selecting higher educational institutes is consistent with the previous
literature in IT acceptance in the educational context (e.g., Lewis et al., 2003; Ma et al.,
2005; Lazinger et al., 1997). According to Lewis et al. (2003), in educational institutions
decisions regarding the introduction of technologies are often determined by top
management (head of institutes and/or higher government officials). Individuals
(academics within institutes) who are the real users of technologies are rarely considered
and communicated with about such decisions. In this way, individuals’ requirements,
willingness and causes of resistance are over-looked by higher management, a process that
often results in an unrealistic outcome regarding technology usage. Another reason
(specific to Pakistan) for selecting higher educational institutes is related to the influence
of government policies. For instance, compared with other organisations, the direct
influence of explicit government policies to promote research productivity is apparent in
the education sector. One example is the recent projects (Pakistan Education and Research
Network (PERN), Digital Library, Pakistan Research Repository (PRR), and Campus
Management Solution (CMS)) by the government of Pakistan to improve the usage of IT
and Internet within higher educational institutes (HEC PAK, 2009). Finally, with the
assumption that IT acceptance behaviour is related to educational qualifications (Agarwal
& Prasad, 1999), selecting the context of the study as higher educational institutes is the
most relevant choice rather than any other such as banks, SMEs, etc.
1.6. Organisation of the thesis
This study comprises seven chapters. A brief description of each chapter is given as
follows:
Chapter1 presents the introduction and background of the research. Specifically, it presents
the concise precursors, aims, objectives, expected research methodology.
Chapter 2 highlights gaps in the field relating to the aims and objectives of this research.
Based on the research question, this chapter is in three sections. The first section provides a
multidisciplinary analytical review of the prominent theories and approaches within the
technology acceptance domain, followed by a critical comparison between these models.
26
The substance of the review and comparisons of previous models enables the selection of
an appropriate model/construct(s) to develop the conceptual framework related to the
research question in the next chapter. The second section provides a review of culture, the
cultural theory of Hofstede, and its importance in IT acceptance domain. The outcome of
this section enables the integration of environmental and cultural factors in the conceptual
framework. Finally, section three presents the background review of the context of the
study, including issues of Internet usage and government initiatives.
Chapter 3 is the outcome of the gaps and theoretical underpinnings established in chapter
2. Specifically, this chapter, in the form of the conceptual framework, presents the testable
hypothetical relationships between the predictors of individuals’ acceptance behaviour. In
a broad perspective, chapter 3 presents rationales for the direct relationships between the
core predictors of acceptance behaviour, and rationales for the indirect moderating effect
of demographic and cultural variables on core predictors. The outcome of this chapter
leads to the selection of appropriate methodological approaches, discussed in the next
chapter.
Chapter 4 justifies the methodological approaches and data analytical techniques carried
out to examine the framework established in chapter 3. This chapter is based on
epistemological and ontological considerations and discusses the methodological strategies
(qualitative and quantitative) and design approaches (survey). It also discusses the data
collection procedures, data analysis tools and criterions, sample selection, and
development of the questionnaire. This then leads on to the results section in chapter 5.
Chapter 5 presents the in-depth analysis of the empirical assessment of the research model
proposed in chapter 3. Starting with the pilot study findings, it discusses the results of the
descriptive findings using SPSS statistical analytical tool. Afterwards, it delineates the
criterion for the structural equation modelling (SEM) and, based on these criteria, it
calculates inferential analysis with the help of partial least squares (PLS) analytical
method. Finally, chapter 5 ends with the post-hoc analysis based on AMOS analytical
method.
Chapter 6 presents the detailed synthesis and discussion about the findings obtained in
chapter 5. In doing so, the findings are rigorously complemented with the previous
literature to rationalise the aims and objectives proposed in the present study.
Chapter 7 summarises the study’s main findings in terms of contributions and limitations.
Specifically, it represents the theoretical, methodological, managerial implications, and

27
finally, offers future research recommendations based on the limitations of the present
study.

28
Chapter 2
Multitude theories of technology acceptance models and
national culture
Introduction
This chapter dissects the aim of the research presented in first chapter into three essential
parts to explore the background perspective and importance of the relevant literature,
which builds foundations for developing the conceptual framework in the next chapter. In
doing so, this chapter contributes a threefold perspective.
First, the chapter presents a review of the prominent theories and models in the domain of
information system research, which are widely accepted as predicting and explaining
human behaviour towards acceptance of technological innovations. Consequently, an
examination of the previous theories and models helps to select (an) appropriate
single/multiple theoretical models/constructs based on their strength(s) and weaknesses in
terms of explanatory power (i.e., R2) and path significance (i.e., β value). Generally, most
of the models and theories of technology acceptance are derived from two fundamental
theories: Diffusion of Innovation theory (DOI) and Social Cognitive Theory (SCT). Based
on DOI and SCT, section (2.1 to 2.10) presents a discussion of the widely accepted models
including DOI, SCT, and the Theory of Reasoned Action (TRA), Theory of Planned
Behaviour (TPB), Decomposed Theory of Planned Behaviour (DTPB), Technology
Acceptance Model (TAM), Revised Technology Acceptance Model (TAM2), Augmented
Technology Acceptance Model (A-TAM), and Unified Theory of Acceptance and Use of
Technology (UTAUT). Section (2.11) continues the discussion by comparing strengths
between the models: TAM x TPB, TPB x DTPB, TAM x TPB x DTPB, TPB x TRA, TAM
x TRA, TAM x TRA x TPB, and TAM2 x UTAUT x other models.
The second contribution of the present chapter is an exploration of the importance of the
various cultural theories that have a direct and indirect effect on an individual’s cognitive
behaviour. Specifically, section (2.12) presents introduction of culture, and section (2.13)
reviewed Hofstede’s cultural theory, which includes dimensions of power distance (PD),
individualism-collectivism (IC), masculinity-femininity (MF), and uncertainty avoidance

29
(UA). Section (2.14 to 2.16) presents the influence of the Hofstede’s theory in the
technology acceptance studies across cultures, with substantial criticism.
Finally, section (2.17) evaluates the importance of IT and the Internet in an educational
context. The discussion continues to examine the present Internet usage within the context
of the study (i.e., the developing country of Pakistan); specifically, the initiative introduced
by the government to promote IT and Internet usage in the educational sector are
discussed. Building on these sections, the gaps and needs in the current research are
identified to establish the conceptual framework and validate the formulated research
question and objectives presented in chapter 1.
2.1. Theories and models of technology acceptance behaviour: A
historical perspective
Even though research on the acceptance/adoption and usage of information technology
(IT) is considered to be one of the most mature areas within modern information system
literature (Hu et al., 1999; Benbasat & Zmud, 1999), still the selection of an appropriate
model or constructs from a number of multitude models is a persistent problem for
researchers in making decision to introduce new technologies in organisations (Venkatesh
et al., 2003). Rationally, over the years a variety of theoretical models have been applied,
modified and integrated from diverse disciplines such as social psychology, sociology and
marketing in order to provide an understanding and predict the validated determinants of
IT acceptance/adoption and usage (e.g., Benbasat & Zmud, 1999; Venkatesh et al., 2003).
Consequently, a large number of theories and models posed difficulties for researchers
when selecting an appropriate model for their objectives was required. For instance, if a
single model is selected for a specific objective/context then it seems to be ignorant of the
other models’ contribution and also it is not necessary for the constructs within the selected
model to perform equally as they were applicable in previous studies. Consequently,
selecting a specific model may produce overflow and underflow conditions within the
analysis process. Overflow conditions, which is opposite to parsimonious conditions
(Bagozzi, 1992), might occur when a model with all its constructs is applied and only a
few of them produce significant results leaving the others as useless; this also results in
difficulties of understanding path relationships within the model. On the contrary,
underflow conditions might occur when constructs within a single model are unable to
produce the desired significant outcome. One possible solution for this problem can be the
selection of various constructs from multitude models and integration of them into an

30
extended model. However, selecting a number of theories and constructs of interest with
warranted theoretical underpinnings is considered to be a challenging task (e.g., Venkatesh
et al., 2003). For establishing an extended model in the present study, the researcher has
deliberately reviewed a number of models and their constructs in the following sub-
sections and has adopted an approach to select a number of constructs that produced
significant results in previous literature.
2.2. Diffusion of Innovation theory
One of the earliest theories used to explain human acceptance behaviour and taken as
background for the recent technology acceptance models is the Diffusion of Innovation
theory (DOI), also known as the Innovation Theory of Diffusion (IDT) (Rogers, 1995).
The original concept of DOI is based on the work of the French sociologist Gabriel Trade
and the German sociologist George Simmel in 1903 (Rogers, 2003). Rogers (1995) defined
DOI with Gabriel Tarde’s (1903) Sigmoidal or S-shaped diffusion curve theory, which is
used to measure the rate of adoption in innovations. Furthermore, Rogers defined diffusion
as the process through which innovations are communicated by means of a communication
medium over the specific time period among members of social systems. Furthermore, she
defined ‘innovations’ (used as a synonym for new technologies) as ideas, practices or
objects that are perceived to be new by the individuals or groups adopting them; and
‘communication’ as the process through which participants produce and share information
with each other in order to benefit from mutual understanding (ibid). According to
Fichman (1992), DOI provides well-developed concepts and tools (both qualitative and
quantitative) to identify and assess the factors which facilitate/hinder the likely rate of
diffusion of technology evaluation/adoption/implementation. Broadly, factors involved in
the diffusion process can be categorised into three groups as: innovation decision process,
attributes of innovations, and attributes of innovators.
Rogers (1983; 1995) categorised the adoption process in five stages on the basis of the
distribution of adopters for an innovation approximated with the normal distribution of
time to adopt; whereas adoption or rejection of any innovation was based on the decision
process by individuals or groups. The stages are as follows:
Knowledge of innovation: an awareness process of an individual or other group (involved
in the decision-making process) towards the existence of the innovation. Furthermore,
knowledge can be viewed as: awareness-knowledge, which is seeking information that an
innovation really exists; how-to-knowledge, which is seeking information necessary to use

31
the innovation; and principles-knowledge, which is seeking information about the
underlying process as to how an innovation works. Out of these three, Rogers emphasised
the need for awareness-knowledge, which is also required at the persuasion and decision
stages and can easily be achieved through mass media.
Forming attitude/persuasion toward the innovation: this mobilises individual(s) or other
group unit’s positive interest towards innovation. At this stage the decision-maker becomes
psychologically involved and seeks credible information from their surroundings and peers
to reduce uncertainty levels and develop a general perception to adopt the innovation.
According to Rogers, developing a favourable or unfavourable attitude at this stage
towards innovations does not necessarily lead to directly adopting or rejecting the
innovation.
Decision to adopt or reject: the process of evaluation through which an individual(s) or
other group unit secures commitment to adopt or reject an innovation. According to
Rogers, the decision to reject can occur at any stage of the innovation decision process. For
instance, it can occur after adoption (i.e., active rejection) by considering trial adoption
(using how-to-knowledge); or it can occur prior to adoption (i.e., passive rejection) in
which new innovations are never considered based on personal knowledge (using
awareness-knowledge) or the confident opinions of peers/leaders, which drives
individual(s) to make a rejection decision.
Implementation of the new idea: an operationalisation process on a trial basis in which
individual(s) or group units start to use the innovation practically. Before this stage,
individuals were involved in the decision process based on mental thinking. According to
Rogers, at the implementation stage the original idea of innovation is re-invented based on
its complexity/difficulty to learn, and the inadequate presence of the change agent to
support technical assistance; alternatively, it is based on the simplification of the
application and facilitation of local conditions.
Confirmation of the decision: a process in which the positive response after usage of an
innovation by individual(s) or group units is taken to be final. It also reinforces the process
of diffusion from the start of the knowledge creation or at any stage during the process of
decision-making to adopt or reject innovation. According to Rogers, individual(s) might
discontinue the adoption process due to: replacement discontinuation, in which individuals
adopt a better innovation that supersedes the innovation in use; or disenchantment
32
discontinuation, in which individuals completely reject the innovation due to
dissatisfaction with its performance.
The second group of factors within the diffusion process is related to the attributes of the
innovations. According to Rogers (2003), the usage behaviour and diffusion of an
innovation is solely dependent upon attitude/persuasion to use, which is further based on
the differences of the innovations. Furthermore, she warned of the dangers of
oversimplifying the innovations, which regards all the innovations as an equivalent unit
from the viewpoint of analysis. Nevertheless, she classified perceived attributes of
innovations into five groups which were later widely replicated in theories of technology
acceptance; Rogers also recommended caution regarding context when generalising the
analysis (see figure 2.1).
Relative advantages (RA): is defined as the ‘degree to which an innovation is perceived as
being better than its precursor’ (Moore & Benbasat 1991, p.195). It has also been taken as
a variable of perceived usefulness (PU) in literature towards the effective and convenient
use of innovations (Taylor & Todd, 1995a; Davis, 1989). In the persuasion process RA
enables understanding of the effectiveness, efficiency, and satisfaction towards problem-
solving (Rogers, 1995).
Compatibility (COMP): is defined as ‘the degree to which an innovation is perceived as
being consistent with the existing values, needs and past experiences of potential adopters’
(Moore & Benbasat 1991, p.195). COMP is based on individual(s) and unit groups’
beliefs, requirements, cultural and structural needs and patterns that may change their
intention to adopt innovations over the traditional patterns of work. It is perceived that
individuals may vary in their choice and preferences as to whether to accept or reject the
innovations. Therefore it can be argued that COMP is related to the
satisfaction/dissatisfactions of one’s perception regarding the needs of the innovations.
Complexity (COLX): is defined as ‘the degree to which an innovation is perceived as
relatively difficult to understand and use’ (Thompson et al., 1991, p.128). In innovations
COLX is found to be an inherent factor because every innovation is based on a
learning/understanding process. COLX and adoptions are observed to be reciprocal to each
other. When a system is easy to understand, learn and use, it is adopted quickly and vice
versa. Generally, within innovations, COLX is considered to be part of the usability factor
(Sonnenwald et al., 2001) and has a negative impact on the perceived ease of use (PEOU)
(Davis, 1989).
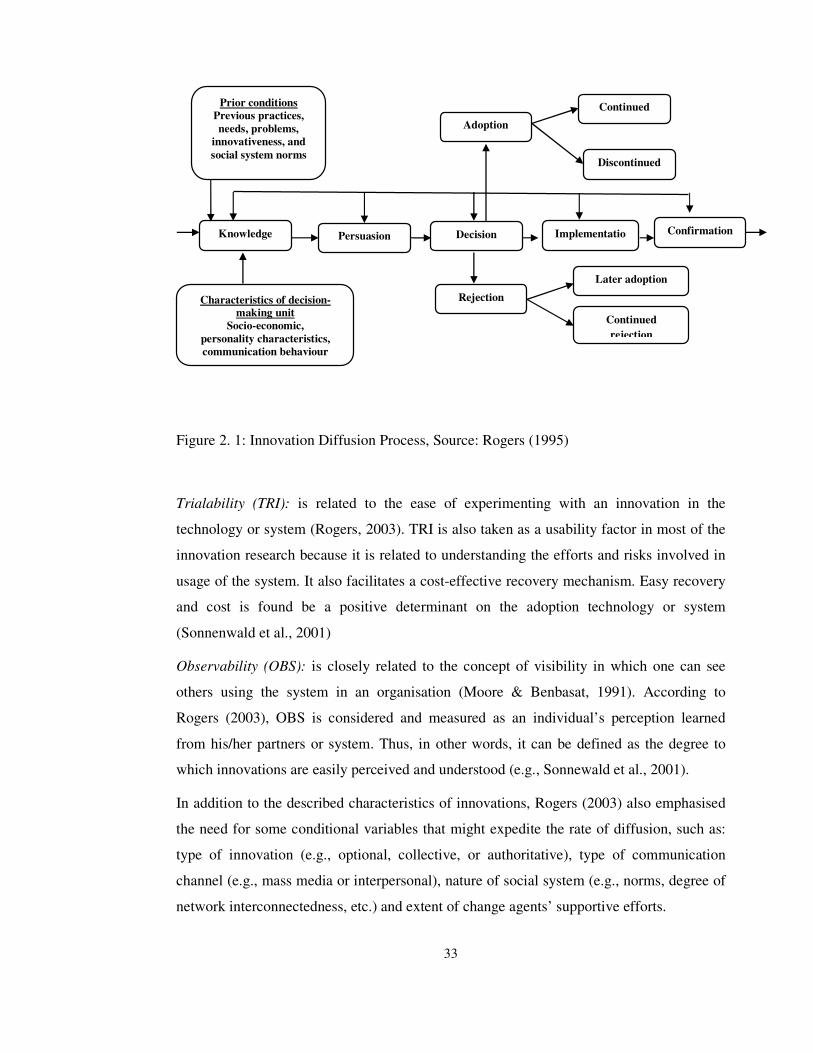
33
Figure 2. 1: Innovation Diffusion Process, Source: Rogers (1995)
Trialability (TRI): is related to the ease of experimenting with an innovation in the
technology or system (Rogers, 2003). TRI is also taken as a usability factor in most of the
innovation research because it is related to understanding the efforts and risks involved in
usage of the system. It also facilitates a cost-effective recovery mechanism. Easy recovery
and cost is found be a positive determinant on the adoption technology or system
(Sonnenwald et al., 2001)
Observability (OBS): is closely related to the concept of visibility in which one can see
others using the system in an organisation (Moore & Benbasat, 1991). According to
Rogers (2003), OBS is considered and measured as an individual’s perception learned
from his/her partners or system. Thus, in other words, it can be defined as the degree to
which innovations are easily perceived and understood (e.g., Sonnewald et al., 2001).
In addition to the described characteristics of innovations, Rogers (2003) also emphasised
the need for some conditional variables that might expedite the rate of diffusion, such as:
type of innovation (e.g., optional, collective, or authoritative), type of communication
channel (e.g., mass media or interpersonal), nature of social system (e.g., norms, degree of
network interconnectedness, etc.) and extent of change agents’ supportive efforts.
Confirmation Implementatio
n
Decision Persuasion Knowledge
Later adoption
Continued
rejection
Continued
Discontinued
Adoption
Rejection Characteristics of decision-
making unit
Socio-economic,
personality characteristics,
communication behaviour
Prior conditions
Previous practices,
needs, problems,
innovativeness, and
social system norms

34
The third category of factors involved in the diffusion process is related to the attributes of
the innovators. Rogers (2003) classified innovators based on the degree to which an
individual or group unit adoption is relatively earlier than other members of the system to
adopt the new ideas. Based on time-series Roger categorised five groups of innovators as:
1) Innovators: are known as ‘system gatekeepers’ i.e., those who have the capability to
understand and apply complex technical knowledge. Furthermore, they have the ability
to cope with a high degree of uncertainty about innovations at the time of the diffusion
process.
2) Early adopters: are known as ‘change agents’ because they are mostly leaders in the
adoption process. They are the role model for the potential adopters who are seeking
information and advice about innovations within a local social system.
3) Early majority: are known by their characteristic of ‘deliberation’ and they adopt an
innovation earlier than the average members of the system. Nevertheless, they usually
adopt the innovation with deliberate willingness but seldom lead; instead they work as a
mediator between the two categories of adopters, i.e., early adopters and the late
majority.
4) Late majority: are highly influenced by social pressure (e.g., peer pressure, economic
necessity), and they adopt an innovation just after the average members of the system.
In the late majority individuals are mostly sceptical and are highly uncertain about
innovations, therefore they only adopt the innovation when the system has already been
used and adopted by most of the individuals within the system.
5) Laggards: are the last to adopt the innovations. They rely on their own experience and
are known as ‘traditional users’. They are highly suspicious of change agents and
usually resist due to limited resources and information shared by traditional people like
themselves.
The DOI has remained as a focal point for many studies specifically in the area of the
decision-making process towards technological innovations (Venkatesh et al., 2003;
Tornatzky & Klein, 1982). In doing so, DOI has been refined and extended by many
researchers, including Rogers herself (1983; 1995), with sets of external constructs.
Specifically, in the acceptance of innovations, the work of Moore & Benbasat (1991) and
Agrawal & Prasad (1998) is noteworthy. Moore & Benbasat’s work is considered to be

35
pioneering with its extension of the theory by introducing two new variables, voluntariness
(VOL) and image (IMG) in the context of IT adoption. Additionally, they developed
parsimonious 34-item instruments to measure the seven dimensions of DOI including:
COMP, RA (used PU later on), result demonstrability (RD), visibility (VIS), PEOU
(opposite of COLX in DOI), TRI, and IMG. The author found that COMP, RA and PEOU
were the most influential constructs for actual usage and the decision to accept IT
innovations. In the same stream of research that extended and refined DOI theory, Agarwal
& Prasad (1998) extended the concept of moderation by adding constructs of personal
innovations of information technology (PIIT), which differentiated global innovation and
domain-specific innovation. The purpose was to reduce the risk-taking propensity
introduced by Rogers (1995) in respect to the early adopters who were more open to
uncertain conditions of innovations. Nevertheless, conceptualisation and extension of
moderators within DOI theory was marvellous work by the authors, but the moderator only
exhibited partial and shown significant effect on the relation between COMP and the
intention to use innovation. Last but not least, Karahanna et al.’s (1999) work is also
considered to be a great contribution to the domain of information system research,
combining DOI theory with attitudinal theories in a single framework that assesses the pre
and post-adoption beliefs and attitudes. The authors examined the constructs of Roger’s
(1995) DOI theory, i.e., RA and COLX with the replacement of PU and PEOU, and Moore
& Benbasat’s (1991) constructs, IMG and RD. Karahanna et al.’s (1999) findings revealed
that that individual’s intention to adopt an innovation is based on personal interest and
social influence. Personal interest refers to the attitude required to perform specific
behaviour that may be formed by reflecting information concerning past behaviour,
affective information, and cognitive information; while social influence refers to the social
pressure (i.e., subjective norms), which is similar to Roger’s DOI theory’s concept of ‘type
of communication network’. Furthermore, the authors classified social influence into two
categories: 1) information influence, when an individual accepts information as evidence
of reality, and 2) normative influence, the result of individuals confirming expectations of
others through either identification, internalisation and/or the compliance process. The
findings of Karahanna et al., (1999) are encouraging, that in the pre-adoption process
instrumentality (i.e., relative advantages) and non-instrumentality beliefs influence
attitude; however, in post-adoption (after gaining experience), only instrumentality beliefs
and perceived IMG influence attitude. Finally, despite the fact that one of the most cited
models i.e., the technology acceptance model (TAM) is driven from a different perspective
36
to DOI, to some extent it shares similar conceptualisations in its core constructs. For
instance, as reported earlier, the relative advantage in DOI is often considered to be PU and
COLX to be opposite to PEOU in the determinants of the TAM. Therefore, it can be
argued that the TAM to some extent confirms/compliments the theoretical foundations of
DOI (Chen et al., 2002).
Regardless of the wide application and extendibility of DOI theory in information system
research, it is limited in its provision of sound justifications about the process of
ascertaining particular attitudes, which in turn lead to the acceptance or rejection decision
process. Additionally, DOI remained unsuccessful in providing a process through which
innovation characteristics (described earlier) fit into the process of establishing the attitude
(Karahanna et al., 1999; Chen et al., 2002). Overcoming the limitations of DOI, theories
related to the individual’s cognitive process which defined process as developing attitude
were established; one of them is Social Cognitive Theory (SCT). The next section
discusses SCT, followed by its relationship with DOI.
2.3. Social Cognitive Theory
Social Cognitive Theory (SCT), proposed by Bandura (1986), is based on a view of
‘human agency’ in which individuals are agents proactively engaged in their own
development and can make things happen by their actions. SCT differs from DOI by
overcoming its limitations (discussed in the last paragraph of section 2.2). By referring to
DOI theory as the ‘social diffusion of innovation’, Bandura (2006, p.119) posits the
difference between the two as: ‘Social cognitive theory distinguishes among three
separable components in the social diffusion of innovation. The triadic model includes the
determinants and mechanisms governing the acquisition of knowledge and skills
concerning the innovation; adoption of that innovation in practice; and the social network
by which innovations are promulgated and supported’.
Originally, the conceptualisation of SCT was extracted from Miller & Dollard’s (1941)
Social Learning Theory (SLT), which asserts basic three principles: feedback (e.g.,
reward/punishment) which influences behaviour; vicarious learning (i.e., learning by
observation) which leads to an act; and identification, in which the model behaviour of
influential persons is likely to be adopted. Numerous researchers adopted and extended
SLT in their relevant context, but in the present study only the extension of Bandura (1986)
is discussed due to its contribution to current concepts of reciprocal determinants, self-

37
efficacy, and temporal variation (variation in the long term due to experience and other
social circumstances) between causal relationships.
From the perspective of reciprocal determinants, Bandura (1986) explained SCT with three
sets of factors: environmental factors, people/personal factors, and behaviours that are
constantly influencing each other. Bandura explained this triadic relationship as people
interpreting the results of their own behaviour through personal expectation, beliefs, and
self-perception; which are developed and modified by environmental factors (social and
physical influence); in turn, both personal factors and the environment alters the
subsequent behaviour (see figure 2.2.). In other words, behaviour determines which of the
possible environmental factors come into play in what shape; in turn, the environment
determines how the shape of individual’s behaviour is developed and activated (Bandura,
1989). It is important to state that SCT contrasts with human functioning theory, which has
overemphasised the role of environmental factors in human learning and behavioural
change.
Human learning and behaviour are observed to be positive determinants on the adoption
and acceptance of innovations (Compeau & Higgins, 1995a). Emphasising the relation of
learning and behaviour, SCT aims to explain how people acquire and maintain certain
behavioural patterns, while also providing the basis for intervention strategies (Bandura,
1997). Here it is needed to clarify that behaviour is not simply the consequence of the
environment and the person, just as the environment is not simply the result of the person
and the behaviour (ibid). Bandura (1986, p.25) defined behaviour as ‘what people think,
believe, and feel affects how they behave’. Whereas LaRose & Eastin (2004, p.360)
defined behaviour as ‘an observable act and the performance of behaviour is determined, in
large part, by the expected outcomes of behaviour, expectations formed by our own direct
experience or mediated by vicarious reinforcement observed through others’.
Here, vicarious reinforcement refers to the observational learning which an individual
develops through the process of attention, retention, motor reproduction and motivational
process. Individuals are not required to perform particular behaviours prior to the adoption
decision (e.g., Bandura, 1989). From the experience point of view, social factors such as
economic conditions, socioeconomic status, and educational and familial structures do not
affect human behaviour directly but they affect it to the degree that they influence people’s
aspirations, self-efficacy beliefs, personal standards, emotional states, and other self-
regulatory influences (Pajares, 2002).

38
Figure 2. 2: Social Cognitive Theory: Source: Pajares (2002)
The second most important contribution of SCT is introducing the concept of self-efficacy
(SE) and temporal variation (i.e., variation due to experience gained). Bandura described
this contribution as individuals’ self-regulatory capability which describes the sense of
experience by human cognition to explore their own beliefs. In other words, individuals
sense the possible control over their own thoughts, feelings, motivations and actions.
According to Bandura (1986, p.391), SE can be defined as ‘peoples’ judgement of their
capabilities to organise and execute courses of action required to attain designated types of
performance. It is concerned not with the skills one has but with the judgement of what one
can do with whatever skills one possess’.
Later on Bandura (1997) re-examined the concept of SE and explained it as the level of
human motivation, effective states, and actions that are more based on their own beliefs in
comparison to what is objectively true. In his work Bandura states that SE is altered by the
individual’s self-reflective capability (i.e., experience), which is characterised by analysing
the experience and scrutinising thoughts to modify behaviour accordingly. Further he state
that individuals with time and experience develop skills to deal with problems, and once
they feel they are capable (habitual), SE no longer remains as a factor of interest to develop
additional skills until significant change is observed in the tasks performed. This point
highlights the important argument that SE varies across activities and situations, and thus
cannot be generalised for all tasks. This assumption was also supported by Marakas et al.,
(1998) who found that SE influence is stronger and more accurate when it is determined
through domain-specific measures rather than general measures.
Like DOI, the applicability of SCT in information system research is mostly as a focal
point for extending other theories and models to measure the behaviour of acceptance and
Environmental factors
Behaviour
Personal factors
(cognitive, affective, and
biological events)
39
the adoption process. Usually these theories and models were focused on the concept of
self-efficacy. For instance, Compeau & Higgins (1995a) developed and examined
measures of SE through magnitude, strength and generalisability. The authors developed
the model based on determinants of SE with its facilitators, encouragement by others and
actual use by others; outcome expectations; affective response based on enjoyment and
anxiety; and finally, usage of computing technology. The authors’ findings were very
supportive of the applicability of SCT, and showed that SE was an important construct
towards shaping individuals’ behaviour. For example, individuals with high SE had higher
computer usage and experienced less anxiety compared with individuals with low SE.
Additionally, the mediating impact of SE between outcome expectations (e.g., job
performance) and social factors (i.e., encouragement by others and actual usage) was a
ground-breaking finding by the authors. Later on, by removing SE’s facilitators (i.e.,
encouragement by others and usage of others), Compeau et al., (1999) re-examined their
model (Compeau & Higgins, 1995a) using a longitudinal study for a year. Yet again SE
was found to be a strong determinant of computer usage, anxiety and enjoyment. Apart
from the determinant SE, Compeau & Higgins (1995b) also investigated the role of
training programmes in developing skills and their impact on SE. They found that training
programmes and prior experience exhibited a significant effect on SE.
In examining the importance of SE the meta-analysis of Marakas et al., (1998) and
Agarwal et al., (2000) are remarkable pieces of work. Marakas et al., (1998) reviewed 40
papers published during 1987-1996 to differentiate between the concept of general purpose
SE and task-specific SE. The authors came up with the argument that both types of SE
showed distinct results in the reviewed literature, and hence, cannot be treated
interchangeably with the measurement perspective. Furthermore, the authors found a
reciprocal relationship between SE and outcome performance i.e., if one increased, the
other decreased and so on. The concept proposed by Markes et al., (1998) was employed
by Johnson & Marakas (2000) and confirmed the findings of previous conceptualisations.
The authors found that SE played an important role in outcome (i.e., acquisition of
computer skills) and needs to be considered as a critical variable when multiple training
methods are employed for measuring any change in developed skills. In the same line of
research, Agarwal et al., (2000) reviewed papers published during 1986-1996 and
established a model that examined the concept of SE within the software training
environment with a longitudinal study. The authors developed a framework with the
determinants of SE as: social influence, demographic variables (i.e., computer experience
40
and prior performance), and beliefs related to self-perception. The outcome impact of SE
on: outcomes (i.e., actual performance, satisfaction and learning), outcome beliefs (i.e.,
anxiety, outcome expectation, ease of use, perceived behaviour control); and finally,
impact on behaviour such as system usage and adoption. The findins revealed that prior
experience played an important role in general purpose SE but not in task-specific SE
beliefs, which was unexpected and contrary to the previous studies.
Within the widely accepted model of technology acceptance (TAM), Igbaria & Iivari
(1995) incorporated SE and its determinants i.e., experience and organisational support as
external variables affecting computer anxiety. The study supported the importance of SCT
within the TAM and confirmed that SE can play a vital role in shaping individuals’ beliefs
and behaviour. The authors found that experience along with organisational support
affected SE, which in turn, showed a significant effect on computer anxiety and PEOU. In
an attempt to add SE to the TAM, similar findings were found by Chau (2001), who
examined the possible effect of attitude and SE on beliefs of the TAM. Nevertheless, the
author didn’t found an impact of attitude on behaviour intention and little negative
significant impact of SE on PU, but study contributed in overall variance explained in
dependent variable i.e., behaviour intentions.
In spite of that, SCT provided ground-breaking concepts of SE, experience, time to study,
training, and social influence (later on used as subjective norms), but the theory itself
cannot be generalised easily. SCT can be used as an umbrella to extend its concepts and
constructs into a specific model and purpose but applying the theory itself is a very
difficult task (e.g., Agarwal et al., 2000). As described earlier, SCT is not a theory
specifically designed for observing human behaviour in specific areas but it is general and
broad in context so it can be widely applied in many diverse areas, such as computer
utilisation (e.g., Compeau et al., 1999), Internet usage and gratification (e.g., LaRose &
Eastin, 2004), etc.
2.4. Theory of Reasoned Action
The third fundamental theory, which has remained a focal point for other theories and
models to extend, is the theory of reasoned action (TRA). Originally TRA was introduced
by Fishbein & Ajzen (1975) and Ajzen & Fishbein (1980). According to Bagozzi (1992),
TRA from a theoretical perspective is the most intuitive and parsimonious theory capable
of explaining insights into behaviour. Similar to DOI and SCT, TRA is also derived from
social psychological settings, however, contrary to the previous two theories where attitude

41
was the main predictor of the behaviour, TRA assumes intention to be the most important
determinant of individuals’ behaviour. In TRA beliefs influence attitude to shape intention,
which in turn guides or dictates behaviour to perform i.e., action (Chau & Hu, 2001).
According to Ajzen & Fishbein (1980, p.5), TRA is based on the assumption that
individuals are usually rational and make systematic consideration of their actions’
implications ‘before they decide to engage or not engage in a given behaviour’. Whereas
the process of behaviour establishment based on intention’s significance is defined as:
‘most behaviours of social relevance are under volitional control and are thus predictable
from intention’ (ibid, p.41). TRA is based on three major constructs and their relation to
each other as follows:
Behavioural intention (BI): is an immediate antecedent of behaviour (Ajzen, 2002). It is a
cognitive process of an individual’s readiness to perform a specific behaviour. Whereas
behaviour is an observable action performed by an individual on his/her experience or
mediated by some vicarious observations to a given target (LaRose & Eastin, 2004). This
implies that BI is the extent to which an individual formulates a conscious plan to perform
or not perform some specified future behaviour towards a target (Warshaw & Davis,
1985). According to TRA, BI, which is an individual’s relative strength to perform a task,
is dependent upon a person’s attitude towards the behaviour and/or the subjective norms
(Ajzen & Fishbein, 1980; Fishben & Ajzen, 1975).
Attitude (A): this explains human actions (Ajzen & Fishbein, 1980, p.13) and is defined as,
‘individual’s positive or negative evaluation of performing the behaviour’ (Fishbein &
Azjen, 1975, p.216). It is determined by a person’s evaluated beliefs about the performed
behavioural consequences. Therefore, if past experience about targeted behaviour is
positive then A will also have a positive impact on BI or else it will have a negative effect.
Attitude is the product of important behavioural beliefs and the individual’s outcome
evaluation (Fishbein & Azjen, 1975); whereas behavioural beliefs are a subjective
probability that behaviour leads to a particular outcome. In an extension of TRA known as
the TAM, Davis et al., (1989) defined these behavioural beliefs with the perception of
usefulness (PU) and perception of ease of use (PEOU) by which one evaluates differently
(explained in detail in section 2.7).
Subjective norms (SN): defined as ‘the person’s perception that most people who are
important to him or her think he should or should not perform the behaviour in question’
(Azjen & Fishbein, 1975, p.302). In SCT it is considered with the concept of social
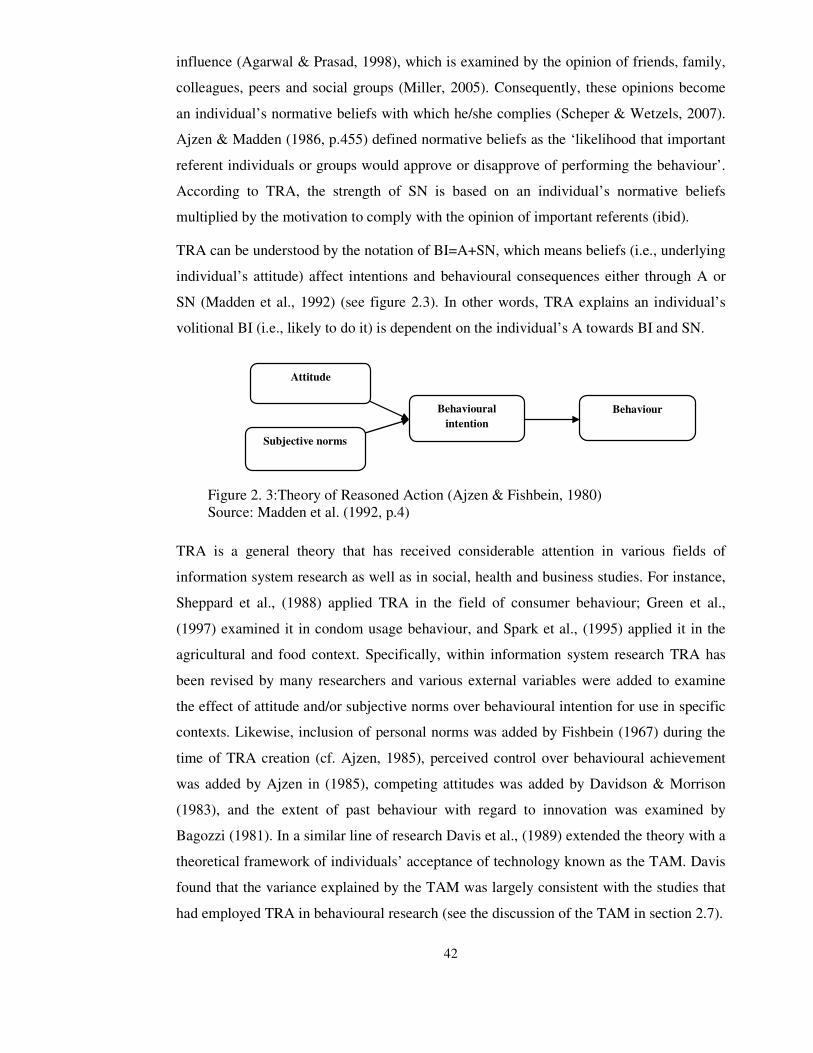
42
influence (Agarwal & Prasad, 1998), which is examined by the opinion of friends, family,
colleagues, peers and social groups (Miller, 2005). Consequently, these opinions become
an individual’s normative beliefs with which he/she complies (Scheper & Wetzels, 2007).
Ajzen & Madden (1986, p.455) defined normative beliefs as the ‘likelihood that important
referent individuals or groups would approve or disapprove of performing the behaviour’.
According to TRA, the strength of SN is based on an individual’s normative beliefs
multiplied by the motivation to comply with the opinion of important referents (ibid).
TRA can be understood by the notation of BI=A+SN, which means beliefs (i.e., underlying
individual’s attitude) affect intentions and behavioural consequences either through A or
SN (Madden et al., 1992) (see figure 2.3). In other words, TRA explains an individual’s
volitional BI (i.e., likely to do it) is dependent on the individual’s A towards BI and SN.
TRA is a general theory that has received considerable attention in various fields of
information system research as well as in social, health and business studies. For instance,
Sheppard et al., (1988) applied TRA in the field of consumer behaviour; Green et al.,
(1997) examined it in condom usage behaviour, and Spark et al., (1995) applied it in the
agricultural and food context. Specifically, within information system research TRA has
been revised by many researchers and various external variables were added to examine
the effect of attitude and/or subjective norms over behavioural intention for use in specific
contexts. Likewise, inclusion of personal norms was added by Fishbein (1967) during the
time of TRA creation (cf. Ajzen, 1985), perceived control over behavioural achievement
was added by Ajzen in (1985), competing attitudes was added by Davidson & Morrison
(1983), and the extent of past behaviour with regard to innovation was examined by
Bagozzi (1981). In a similar line of research Davis et al., (1989) extended the theory with a
theoretical framework of individuals’ acceptance of technology known as the TAM. Davis
found that the variance explained by the TAM was largely consistent with the studies that
had employed TRA in behavioural research (see the discussion of the TAM in section 2.7).
Behaviour Behavioural
intention
Attitude
Subjective norms
Figure 2. 3:Theory of Reasoned Action (Ajzen & Fishbein, 1980) Source: Madden et al. (1992, p.4)

43
Despite its wide applicability and extendibility, including its conceptualisation of the
TAM, TRA possesses many limitations. Out of many, one major limitation is its
assumption of measuring the behaviour under volitional control. That is, beliefs depend
upon the will of the individual to perform the behaviour (Ajzen, 1985). Thus, in situations
when volitional control is low (i.e., individual’s will is difficult to know), TRA was
unsuccessful at predicting the expected significant relationship between BI and BU. Apart
from volitional control limitation, Foxall (1997) highlighted three more perspectives where
TRA failed to explain the expected behaviour. Firstly, TRA limits from the perspective of
beliefs that establish the A. For instance, TRA was too general a model and does not
specify the beliefs that are in operation for any specific behaviour. In other words, the
model fails to include the non-attitudinal personal and situational beliefs that are likely to
influence the strength of A�BI relation or increase the prediction of usage behaviour. This
limitation suggests that, prior to applying TRA, it is essential to examine the individuals’
salient beliefs about the behaviour under investigation (Davis et al., 1989), which in some
situations seems impractical or expensive due to time and cost constraints. Secondly, TRA
limits from the perspective of predicting future usage behaviour (Foxall, 1997). For
instance, TRA was developed to examine the predicted BI rather than the outcome of the
behaviour itself (ibid). According to Davis et al., (1989) in order to examine TRA, actual
usage behaviour should be measured objectively and unobtrusively, so there should be a
clear distinction between prior and present BI towards the usage behaviour. Contrary to
Davis’ caution, originally in TRA conceptualisation, behaviour is a direct determinant of
BI and both (BI and behaviour (B)) are measured at the same time. That is, the outcome of
the behaviour itself or predicting models’ power to measure future usage is not true, rather
than the model is predicting only the power for the current usage behaviour (i.e., similar to
intention). Put simply, TRA limits its predictability in situations when BI and behaviour
are highly correlated or measured at the same interval of time. This limitation was also
reported by Ajzen & Fishbein (1980) who acknowledged that explaining future usage
behaviour was difficult to achieve, due to the time interval which might invite unforeseen
events. This in turn may affect the factors and disturb the relationship proposed. Thirdly,
TRA limits from the perspective of BI (Foxall, 1997). That is, BI completely mediate the
effect of the A on behaviour (ibid). According to Bagozzi & Yi (1989), the degree to which
intentions are well-formed affects the way in which attitude influences the behaviour.
Thus, the conceptualisation of TRA (i.e., A�BI�B) is ill-equipped to predict situations

44
when intentions are ill-formed (i.e., partial or no mediation effect). Consequently, attitude
produces a direct effect on behaviour (i.e., A�B).
2.5. Theory of Planned Behaviour
Overcoming the limitations of TRA to predict behaviour under condition where individuals
have a low level of violation control, Ajzen (1988, 1991) proposed a revised succession of
TRA known as the Theory of Planned Behaviour (TPB). Ajzen (1991) incorporated an
additional exogenous construct, namely perceived behaviour control (PBC), in previous
TRA’s constructs (i.e., A to BI and SN) to predicate planned and deliberate behaviour.
This inclusion was made to account for certain conditions when individuals intend to carry
out some behaviour but the original behaviour was not satisfied because of a lack of
confidence or control over behaviour (Miller, 2005 p.127). The affect of PBC in TPB was
added by Ajzen (1985) as a direct determinant of behaviour and indirect through BI to
behaviour. Ajzen (1991, p.188) defined the additional variable PBC as the ‘perceived ease
or difficulty of performing the behaviour’. Later on, specifically in the context of
information system research, Taylor & Todd (1995a, p.149) defined PBC as the
‘perception of internal and external constraints on behaviour’. Behavioural control is
defined as beliefs about the presence of some factors that may facilitate/impede the
performance of behaviour. It is different from SN, which is perceived social pressure or
normative expectations from others and also has an impact on BI to use.
Ajzen (1988, 1991) incorporated the additional construct in TRA because of the
assumption that most human social behaviour is under volitional control that can be
predicated from intentions alone. However, argument was not effective in many cases and
has been challenged by many researchers (e.g., Eagly & Chaiken, 1993; Taylor & Todd,
1995a), even by Ajzen himself (2002). It is a general observation that in some situations
even people wish to deal with some favourable behaviour but fails due to lack volitional
control e.g., the intention to visit a doctor to get positive results about disease symptoms is
not completely under an individual’s control but is based on others’ actions and produces a
lack of control over their own actual behaviour. This argument was also highlighted by
Sheppard et al., (1988) who accepted TRA but differed on volitional control, which he
defined as: ‘behavioural intention will predict the performance of any voluntary act, unless
intent changes prior to performance or unless the intention measure does not correspond to
the behavioural criterion in terms of action, target, context, time-frame and/or specificity’
(p.325).

45
As with TRA, in TPB an individual’s behaviour is examined by his or her BI, which is
affected by A toward BI, SN and additional construct of PBC. Furthermore these
constructs are influenced by a human’s individual beliefs, namely as behavioural beliefs
(i.e., likely consequences or others’ attributes of behaviour), normative beliefs (i.e.,
normative expectations of other people’s beliefs) and control beliefs (i.e., presence of
factors that may support or hinder behaviour) respectively (Ajzen, 2002) (see figure 2.4).
Ajzen (1991) predicted that if A�BI and SN�BI have a favourable effect, then the PBC
will be greater and an individual’s BI to perform the behaviour will be higher/stronger.
Like TRA, TPB is a general theoretical model that has been adopted in many diverse fields
and produced significant results. For example, Chau & Hu (2001) and Conner & Sparks
(1996) used it in healthcare settings, Nguyen et al., (1997) used it in exercise purpose, and
Conner et al., (2003) used it in diet control settings. Within information system research, a
number of studies examined TPB and emphasised the importance of the construct PBC in
determining BI and usage (e.g., Chau & Hu, 2001; Mathieson, 1991; Taylor & Todd,
1995a; Foxall, 1997; Madden et al., 1992).
Besides widespread replication and generalisibility, TPB has been refined by a number of
research studies. Specifically, there has been work on the modification of the additional
construct PBC. For instance, instead of PBC, Warshaw & Davis (1985) suggested that
behavioural expectations can be a potential predictor of behaviour; Conner & Armitage
(1998) and Elliott et al., (2003) suggested that in the case of routinised behaviour, instead
of BI, habit may be the most important driver of behaviour. In addition to that, a number of
Intention Behaviour
Behavioural
beliefs
Attitude towards
the behaviour
Normative beliefs Subjective norms
Perceived behavioural
control
Control beliefs Actual
behavioural
control
Figure 2. 4: Theory of Planned Behaviour: Source: Ajzen (1991)
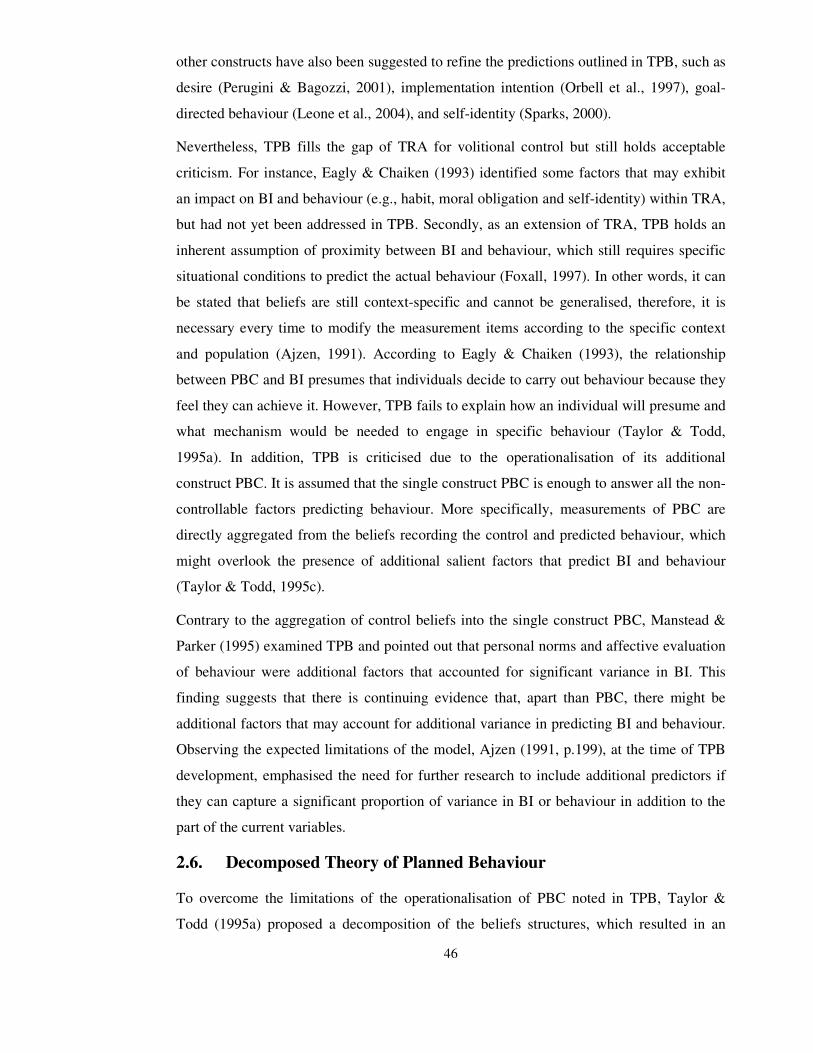
46
other constructs have also been suggested to refine the predictions outlined in TPB, such as
desire (Perugini & Bagozzi, 2001), implementation intention (Orbell et al., 1997), goal-
directed behaviour (Leone et al., 2004), and self-identity (Sparks, 2000).
Nevertheless, TPB fills the gap of TRA for volitional control but still holds acceptable
criticism. For instance, Eagly & Chaiken (1993) identified some factors that may exhibit
an impact on BI and behaviour (e.g., habit, moral obligation and self-identity) within TRA,
but had not yet been addressed in TPB. Secondly, as an extension of TRA, TPB holds an
inherent assumption of proximity between BI and behaviour, which still requires specific
situational conditions to predict the actual behaviour (Foxall, 1997). In other words, it can
be stated that beliefs are still context-specific and cannot be generalised, therefore, it is
necessary every time to modify the measurement items according to the specific context
and population (Ajzen, 1991). According to Eagly & Chaiken (1993), the relationship
between PBC and BI presumes that individuals decide to carry out behaviour because they
feel they can achieve it. However, TPB fails to explain how an individual will presume and
what mechanism would be needed to engage in specific behaviour (Taylor & Todd,
1995a). In addition, TPB is criticised due to the operationalisation of its additional
construct PBC. It is assumed that the single construct PBC is enough to answer all the non-
controllable factors predicting behaviour. More specifically, measurements of PBC are
directly aggregated from the beliefs recording the control and predicted behaviour, which
might overlook the presence of additional salient factors that predict BI and behaviour
(Taylor & Todd, 1995c).
Contrary to the aggregation of control beliefs into the single construct PBC, Manstead &
Parker (1995) examined TPB and pointed out that personal norms and affective evaluation
of behaviour were additional factors that accounted for significant variance in BI. This
finding suggests that there is continuing evidence that, apart than PBC, there might be
additional factors that may account for additional variance in predicting BI and behaviour.
Observing the expected limitations of the model, Ajzen (1991, p.199), at the time of TPB
development, emphasised the need for further research to include additional predictors if
they can capture a significant proportion of variance in BI or behaviour in addition to the
part of the current variables.
2.6. Decomposed Theory of Planned Behaviour
To overcome the limitations of the operationalisation of PBC noted in TPB, Taylor &
Todd (1995a) proposed a decomposition of the beliefs structures, which resulted in an

47
improvement in model prediction. In addition, decomposition was advantageous in
eliciting the underlying dimensions of belief structures which were presented by TPB with
a single uni-dimensional construct, and makes the model difficult to generalise across
various settings. Taylor & Todd (1995a) named this alternative model of TPB as the
Decomposed Theory of Planned Behaviour (DTPB). DTPB decomposes the attitudinal,
normative, and control beliefs derived from TPB into multidimensional belief constructs
that were generalisable across the situations and not specialised to each context (see figure
2.5). A brief overview of each decomposition is given as follows:
Decomposing attitudinal beliefs structures: attitudinal beliefs (e.g.,
advantages/disadvantages or perceived usefulness, ease of use and facilitation conditions)
are an individual’s favourable/unfavourable feelings about a particular behaviour (Fishbein
& Ajzen, 1975) (for more details see TRA in section 2.4). Attitudinal belief in previously
explained models TRA and TPB was found to be a problematic construct due to its
associated hidden sub-beliefs and their relationship to each other (Berger, 1993). Indeed,
this is the reason that the TAM did not explain the intended usage intentions as expected
(Taylor & Todd, 1995a). Taylor & Todd (1995a) decomposed attitudinal beliefs from the
literature of Diffusion of Innovation theory (DOI). According to this, RA, COLX and
COMP were incorporated due to their prevalence in IT usage and adoption literature (e.g.,
Moore & Banbasat, 1991). Whereas RA, analogous to PU in the TAM model (Chau and
Hu, 2001), is evaluated as perception of innovations improvement and performance to its
precursors, which might be moderated by economic benefits, convince and satisfaction
factors (e.g., Moore & Banbasat, 1991; Roger, 1983; Taylor & Todd, 1995); COLX,
reciprocal to the adoption process, is the measurement of perceived hardship and
difficulties in order to understand and use new innovations (Roger, 1983; Thompson et al.,
1991). COLX is also taken as inverse-analogous to PEOU in the TAM, (Chau & Hu,
2001); and finally, COMP is the measurement of satisfaction/dissatisfaction perception
through which innovations are adopted with current needs and past experience (Moore &
Benbasat, 1991; Roger, 1983).
In technology acceptance literature, an increase in perceived RA and use of information
technology with decrease COLX factor has generally been found to be a positive construct
on attitudinal belief (e.g., Taylor & Todd, 1995a; Moore & Benbasat, 1996, Davis, 1989).
Recently, Hsu & Chiu (2004), building upon Fishbein & Ajzen’s (1975) conceptualisation
of attitudinal beliefs as PU, perceived risk (PR) and perceived playfulness (PP), examined
DTPB in e-service satisfaction process. The strength of this model was similar to research

48
conducted by Moore & Benbasat (1991) and supported the argument that an increase in PU
and PP with a relative decrease in PR had a positive impact on satisfaction outcome.
Decomposing normative beliefs structures: normative beliefs are an individual’s
perceptions about a particular behaviour influenced by the judgment of others (Fishben &
Ajzen, 1975). Taylor & Todd (1995a) decomposed normative beliefs into relevant referent
groups that would likely exhibit a divergence of opinion and have a significant impact on
an individual’s decision to use/accept information systems. Three groups of referents,
peers, superiors, and subordinates, were categorised by the authors but only two were
examined, i.e., peers (other students) and superiors (professors) due to the sample of
students case study. More specifically, the authors hypothesised that if the difference in
opinion between referents is monolithic then it has no significant influence over SN.
Making a slight difference in referent groups but using similar concepts, Bhattacherjee
(2000) in a case study of the Internet and e-services adoption, examined the decomposition
of SN into two groups, interpersonal and external beliefs. According to the author, external
beliefs are the influence of non-personal people e.g., technology reports, expert opinions
etc; and interpersonal beliefs are the influence of friends, family, peers, superiors and
known adopters of services. Later on, the conceptualisation of SN proposed by
Bhattacherjee was examined by Hsu & Chiu (2004). The authors found a weak significant
impact of external factors within the e-service satisfaction context.
Decomposing perceived behavioural control structure: control beliefs are the measurement
of perceived factors that may support or impede the performance of particular behaviours
(Ajzen, 1985, 1991). Taylor & Todd (1995a) explained the decomposition of control
beliefs in two groups as: self-efficacy (SE), an individual’s internal control beliefs; and
facilitating conditions (FC), an individual’s external control beliefs. The construct SE
originated in Social Cognitive Theory (SCT) (Bandura, 1977), which helps to determine
the individual’s judgment process through which he/she becomes capable of managing
courses of action and achieving a targeted performance. Taylor & Todd (1995a)
categorised FC into two groups as: related control belief of resource factors (e.g., time,
money), and related technologies’ compatibility issues and usage. Compeaue & Higgins
(1991) posited that the higher level of SE has a positive impact on BI and behaviour usage,
while Taylor & Todd (1995a) hypothesised that the facilitation resources may or may not
have an impact on usage behaviour.
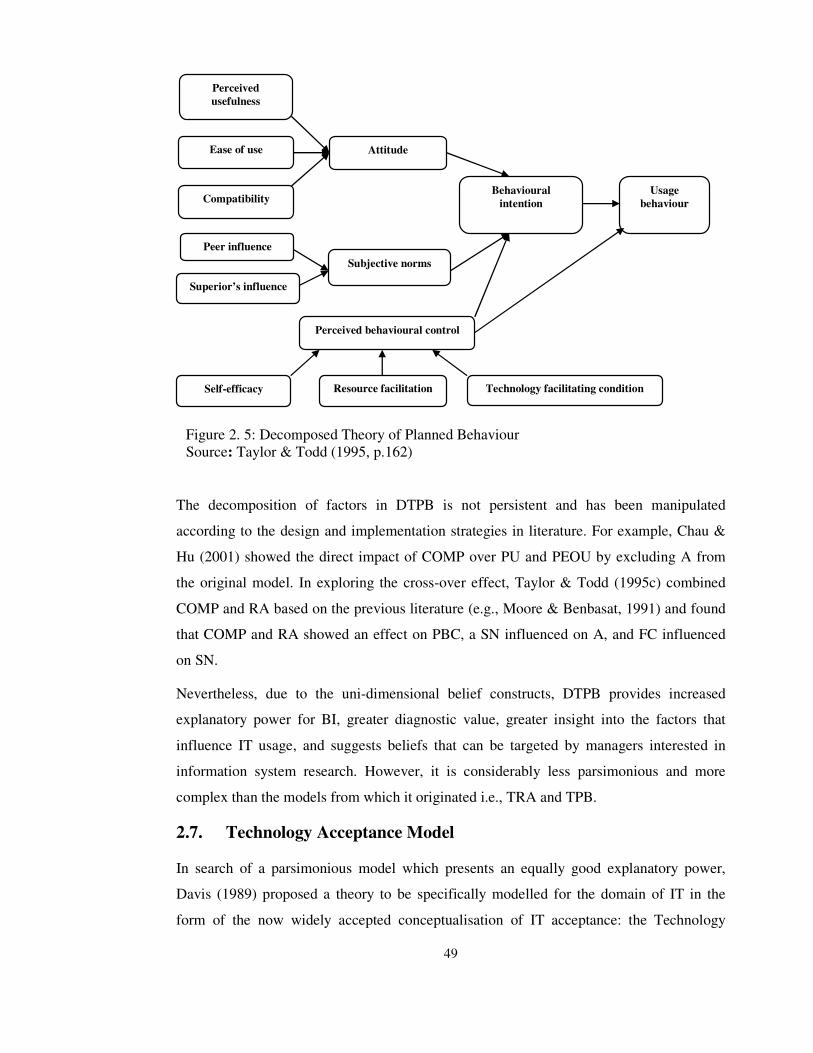
49
The decomposition of factors in DTPB is not persistent and has been manipulated
according to the design and implementation strategies in literature. For example, Chau &
Hu (2001) showed the direct impact of COMP over PU and PEOU by excluding A from
the original model. In exploring the cross-over effect, Taylor & Todd (1995c) combined
COMP and RA based on the previous literature (e.g., Moore & Benbasat, 1991) and found
that COMP and RA showed an effect on PBC, a SN influenced on A, and FC influenced
on SN.
Nevertheless, due to the uni-dimensional belief constructs, DTPB provides increased
explanatory power for BI, greater diagnostic value, greater insight into the factors that
influence IT usage, and suggests beliefs that can be targeted by managers interested in
information system research. However, it is considerably less parsimonious and more
complex than the models from which it originated i.e., TRA and TPB.
2.7. Technology Acceptance Model
In search of a parsimonious model which presents an equally good explanatory power,
Davis (1989) proposed a theory to be specifically modelled for the domain of IT in the
form of the now widely accepted conceptualisation of IT acceptance: the Technology
Perceived
usefulness
Ease of use Attitude
Subjective norms
Behavioural
intention
Usage
behaviour
Perceived behavioural control
Compatibility
Peer influence
Superior’s influence
Technology facilitating condition Resource facilitation Self-efficacy
Figure 2. 5: Decomposed Theory of Planned Behaviour Source: Taylor & Todd (1995, p.162)

50
Acceptance Model (TAM). Originally the TAM was an adoption of TRA where attitude
(A) predicts intention (BI), and intention predicts behaviour (BU). However, unlike TRA,
the TAM does not include subjective norms (SN) as a determinant of BI because of the
uncertain theoretical and psychometric properties (Davis et al., 1989). The use of SN in
TRA was also cautioned by Fishbein & Ajzen (1975) who posit that SN can create
theoretical and empirical problems due to the difficulty of differentiating the direct effect
of SN on BI from indirect effect via A. Another point of the TAM, which distinguishes it
from TRA is that, unlike expectancy formulation of beliefs within TRA, the TAM suggests
only two beliefs, perceived usefulness (PU) and perceived ease of use (PEOU), to predict
an individual’s A towards using technology. In addition to their indirect effect on BI via A,
PU is also expected to exhibit a direct effect on BI (see figure 2.6). A brief description of
the TAM predictors is given below:
Attitude (A): is defined as an individual’s positive or negative feelings (evaluated effect)
towards performing the targeted behaviour (Fishbein & Ajzen, 1975, p.216) (for more
details see TRA in section 2.4).
Behavioural intention (BI): is defined as the measure of the strength of one’s intention to
perform a specified behaviour (Fishbein & Ajzen, 1975, p.288) (for more details see TRA
in section 2.4).
Perceived usefulness (PU): is defined as the prospective user’s subjective probability that
using a specific application system will increase his or her job performance within an
organisational context (Davis et al., 1989, p.985). Taylor & Todd (1995a) during the
development of DTPB considered PU as analogous to RA within DOI, which is an
evaluation of the perception of innovations’ performance with comparison to its
Perceived
usefulness
Perceived
ease of use
Attitude
towards using
Behavioural
intention to
use
Actual system
use
External
variables
Figure 2. 6: Technology Acceptance Model (Davis et al., 1989, p.985)
51
precursors. Venkatesh et al., (2003) considered PU to the similar concept of extrinsic
motivation in motivational model (MM) and outcome expectation in SCT, and
performance expectancy in UTAUT.
Perceived ease of use (PEOU): is defined as the degree to which the prospective user
expects the target system to be free of effort (Davis et al., 1989, p.985). Taylor & Todd
(1995a) considered PEOU as an inverse of the construct COLX in DOI, which defines the
measurement of difficulties in order to understand and use new innovations. Venkatesh et
al., (2003) in UTAUT studied PEOU as similar to the effort expectancy.
External variables: are defined as the explicitly included factors in the model that have an
expected impact on BI and BU through the meditation of PU and PEOU (Davis et al.,
1989, p.987). According to the authors, external variables might include: system design
characteristics, training, documentation and support, and decision-making characteristics
(ibid). However, with the continued evaluation of the TAM, some more external variables
in the TAM were introduced, such as system quality, compatibility, computer anxiety, self-
efficacy, enjoyment, computing support, experience, and so on (e.g., Koufaris 2002; Moon
& Kim 2001; Agarwal & Karahanna 2000; Lee et al., 2003; I-F Lui et al., 2010).
According to the TAM, individuals adopt applications primarily because of their
functionality and performance, and secondarily due to the ease or difficulty involved in
making the system perform (Davis et al., 1989). In addition, the TAM also assumes that
individuals engage in behaviour because they evaluated the benefits of that behaviour
and/or expect a certain outcome performance (Dishawa & Strong, 1999). According to
Davis et al., (1989), PU is influenced by PEOU and suggests that, all things being equal,
the easier a technology is to use, the more useful it can be. The argument was supported by
Taylor & Todd (1995a), who posited that the easier the technology is to use has a positive
impact on belief i.e., PU that results in an increase in A and BI on towards technology
usage. Whereas, ease of technology is theorised to be determined by external variables, for
instance, system features e.g., menus, icons, touch screen, etc. may enhance usability
(Davis et al., 1989).
In the initial version of the TAM, like TRA, Davis et al., (1989) considered a two-step
process for the formulation of BI (also known as expectancy formulation of beliefs). At a
first step, important beliefs (PU and PEOU) were elicited from the target users for the
specific context; next, the strength of each belief was assessed and multiplicatively
weighted by the value assigned by users to the attributed behaviour. The expectancy was
52
criticised by numerous researchers (e.g., Bagozzi, 1984a; Schmidt, 1973), for instance, in
situations when beliefs were generally desirable (i.e., opposite to TRA and expectancy
formulation) it was unnecessary to evaluate the weight of the beliefs in multiplicative
measure. In simple words, it merits measuring the attitude and beliefs regarding use of the
technology rather than attitudes and beliefs directed towards the technology itself, e.g.,
individuals might hold a positive intention about technology without being favourably
disposed towards its use. This disaggregating of beliefs facilitates the researcher to
specifically separate the effect of each belief on attitude and examine the effect of other
external variables on the formation of beliefs.
Davis et al., (1989) noticed the inherent limitation of TRA in the TAM and modified the
model by un-weighting its core constructs PU and PEOU instead of eliciting PU and
PEOU for each specific technology and context. Nevertheless, omitting the multiplicative
evaluation of beliefs invites possible misleading results (e.g., in a single study some people
give a positive evaluation whereas other hold a negative evaluation of the same outcome),
but it facilitated the TAM to differentiate between A, BI, the two beliefs PU and PEOU
with the impact of external stimuli across different settings. After evaluating the TAM in
voluntary settings, Davis et al., (1989) found that the model predicted well expected
explanatory power in intention (i.e., 45% at the start and 57% after 14 weeks), except for
the partial mediation effect of construct A (i.e., weak relation between PU�A, and strong
at PU�BI). Hence, in revision, the authors removed the A construct and established a
direct link of beliefs over BI (ibid), which is also supported in social psychology research
and suggests that attitude can be omitted if the desired impact of beliefs on behaviour is
warranted (e.g., Ajzen, 1991).
In general, the TAM was specifically developed for predicating and explaining an
individual’s acceptance of computer technology in voluntary settings (Davis et al., 1989),
but since its creation it has evolved (replicated and extended) and proved to be
parsimonious beyond its originality, organisational context, computing technologies, and
user population (Agrawal & Prasad, 1999). For instance, it has measured intention in
email, voice mail, graphics (e.g., Adams et al., 1992; Karahanna & Straub, 1999), e-service
(e.g., Shish & Fang, 2004), personal computer usage (e.g., Igbaria et al., 1995), DBMS
(e.g., Szajna, 1994), manufacturing services (e.g., Lin & Wu, 2004), spreadsheets (e.g.,
Mathieson, 1991; Venkatesh & Davis, 1996) and outside the technology adoption domain,
like marketing (e.g., Dabholkar & Bagozzi, 2002; Gentry & Calantone, 2002), and
advertising (e.g., Rodgers & Chen, 2002), to name only a few.
53
From the voluntary use perspective, where the choice of technology is dependent upon an
individual’s beliefs, the TAM presented significant results even in non-voluntary
(mandatory) settings where individuals are influenced by the pressure of the organisation
and superiors (see Agrawal & Prasad, 1997; Moore & Benbasat, 1996). The mandatory
usage of the TAM is also referred to as compliance impact in some studies (e.g., Schepers
& Wertzels, 2007). According to recent figures, two journal articles on the TAM (Davis,
1989; Davis et al., 1989) are cited over 1,700 times in the social sciences citation index
(SSCI) and over 5,000 times in Google Scholar (Venkatesh & Bala, 2008; Venkatesh &
Davis, 2000). There may be many reasons for such extensive popularity of the TAM, but
the most prevalent could be its parsimonious structure, which provides an adequate
explanation and prediction within a diverse sample, technologies, contexts and expertise
level; theoretical framework supported by highly validated psychometric measurement
scales; and finally, contribution in strong empirical results to provide well-accepted
explanatory power (i.e., 40% since its creation) (Hu et al., 1999; Mathieson, 1991; Szajna,
1996; Venkatesh & Bala, 2008).
The evaluation of the TAM over the years can be easily understood by the two meta-
analytical studies of Han (2003) and Lee et al., (2003). According to Han (2003), the TAM
evolved in three stages, adoption, validation and extension. Within the adoption process,
the TAM was examined and adopted across the applications (e.g., spreadsheet, Word,
Excel), across the communication technologies (e.g., email, voice mail, Internet, online
service), across the tools (e.g., DBMS, microcomputers), and across the organisational and
cultural context (e.g., countries, financial institutes, universities, hospitals). Within
validation stage, the TAM was examined either by testing its core constructs’ psychometric
properties (i.e., PU and PEOU) or by testing the casual link between the determinants
proposed by Davis et al., (1989). Finally, within the extension stage, the possibility of
other relevant factors important to the TAM’s core construct (i.e., PU and PEOU) was
explored.
The meta-analysis of Lee et al., (2003) is comprehensive regarding understanding the
evaluation of the TAM. The author reviewed 101 articles published during 1986 to 2003 in
32 information system leading journals. According to this, the TAM evolved in four
periods: introduction, validation, extension, and elaboration. In the introduction period
(1986 to 1995) research on the TAM was either focused on examining its parsimonious
structure by replicating it with a diverse set of applications and technologies, or comparing
the TAM’s result with its predecessor TRA. In that era, two important studies were best at
54
this: Adams et al.’s (1992) study examined the TAM within five different applications;
second, Taylor & Todd’s (1995a) study, which compared results of the TAM study with
two other models rooted from TRA i.e., TPB and DTPB. According to Lee et al., (2003),
the second period (1992 to 1996) of validation research within the TAM was focused on
testing its core constructs measurement items under different technologies. In this era,
Segar & Grover’s study is noteworthy; it criticised the measurement proposed by Davis et
al., (1989) and was examined by Adam et al., (1992) in different settings. Later on, Chin &
Todd (1995) answered their criticism and empirically supported the validity and reliability
of the TAM’s core constructs (i.e., PU and PEOU). During the extension period (1994 to
2003), the research around the TAM was focused on the introduction of new variables
(direct and moderators) to increase its predictability. In doing so, Agrawal & Prasad (1999)
extended the TAM by adding the mediating effect of individual differences, such as, role
towards technology, tenure of workforce, level of education, prior experience. The
importance of moderators within the TAM was highly prevalent and was highlighted by
many researchers (see Venkatesh et al., 2003). Finally, within the elaboration period (2000
to 2003), studies were focused around developing newer versions of the TAM that
encompassed the external variables affecting PU and PEOU. For instance, Venkatesh &
Davis (2000) found additional constructs that predict BI with the mediation effect of PU.
Venkatesh & Davis (2000) named this new model as TAM2. Three years later Venkatesh
et al., (2003) examined eight theoretical models and proposed a new model called the
Unified Theory of Acceptance and Use of Technology (UTAUT).
Despite the widespread acceptability of the TAM within information system research, it is
not without its limitations. The most common limitation reported within TAM studies is its
self-reported usage (Lee et al., 2003, Davis, 1993). According to this, self-reported usage is
known to be subject to the common method bias, which either distorts or overstates the
casual relationship between independent and dependent variables (Agrwal & Karahanna,
2000). The second limitation of the TAM is that it has not been tested with actual measures
of usage behaviour but only various parts have been examined separately using
measurement of beliefs, attitude and intentions collected coincidently with linear-
regression, and hence, shown reasonable variance in BI and BU when examined in
different settings (Taylor & Todd, 1995a; Mathieson, 1991). For instance, Taylor & Todd
(1995a) examined the TAM and found that the model has reasonable explanatory power
but the tests between the relationships of the model did not produce consistent results in all
cases for validating its generalisibility. The third limitation within the TAM studies is
55
related to its explanatory power. Although the model has consistently produced a 40%
variance in BI, it fails to explain the reasons for the remaining unexplained 60% variance.
Finally, the TAM since creation has remained successful in predicting system acceptance
but has remained weak at explaining the design process which fosters the acceptance
behaviour (Venkatesh & Davis, 1996; 2000). The model offers feedback on PU and PEOU
but does not provide feedback about aspects of improvement, such as flexibility,
integration, completeness and currency of information (Taylor & Todd, 1995a; Venkatesh
et al., 2003).
2.8. Revised Technology Acceptance Model 2
Considering the consistent limitations of the TAM in terms of explanatory power, an
extension of the TAM was developed by Venkatesh & Davis (2000) and called the TAM2
(p.186). The aspiration for the TAM2 was to keep the original TAM constructs intact and
‘include additional key determinants of TAM’s perceived usefulness and usage intention
constructs, and to understand how the effect of these determinants changes with increasing
user experience over time with the target system’ (Venkatesh & Davis, 2000, p.187). The
inclusion of additional constructs, specifically external variables on BI mediated by PU
and PEOU, was also theorised by Davis et al., (1989). Similar to its predecessor the TAM,
the TAM2 is also derived from the TRA with additional constructs of SN that were omitted
by Davis et al., (1989) from the TAM due to weak psychometric properties with caution
that ‘further research is needed to address the generalisability of SN, to better understand
the nature of social influence, and to investigate conditions and mechanism governing the
impact of social influence on usage behaviour’ (ibid, p.999). Additionally, further
constructs are included in the TAM2 from Rogers’ DOI (1983).
Venkatesh & Davis (2000) described the new additions as: social influence processing
factors and 2) cognitive instrumental processing factors. They defined social influence
process as forces affecting an individual to adopt or reject innovations, which includes
factors such as SN, voluntariness (VOL), experience (EXP), and image (IMG); and
cognitive process is defined as judgement of the individuals in part by comparing what a
system is capable of doing with what they need to get done in their job, and includes
factors of job relevance (JR), output quality (OQ), result demonstrability (RD) and PEOU.
The graphical representation of the model is portrayed in figure 2.7, and a brief overview
of additional factors is given below:
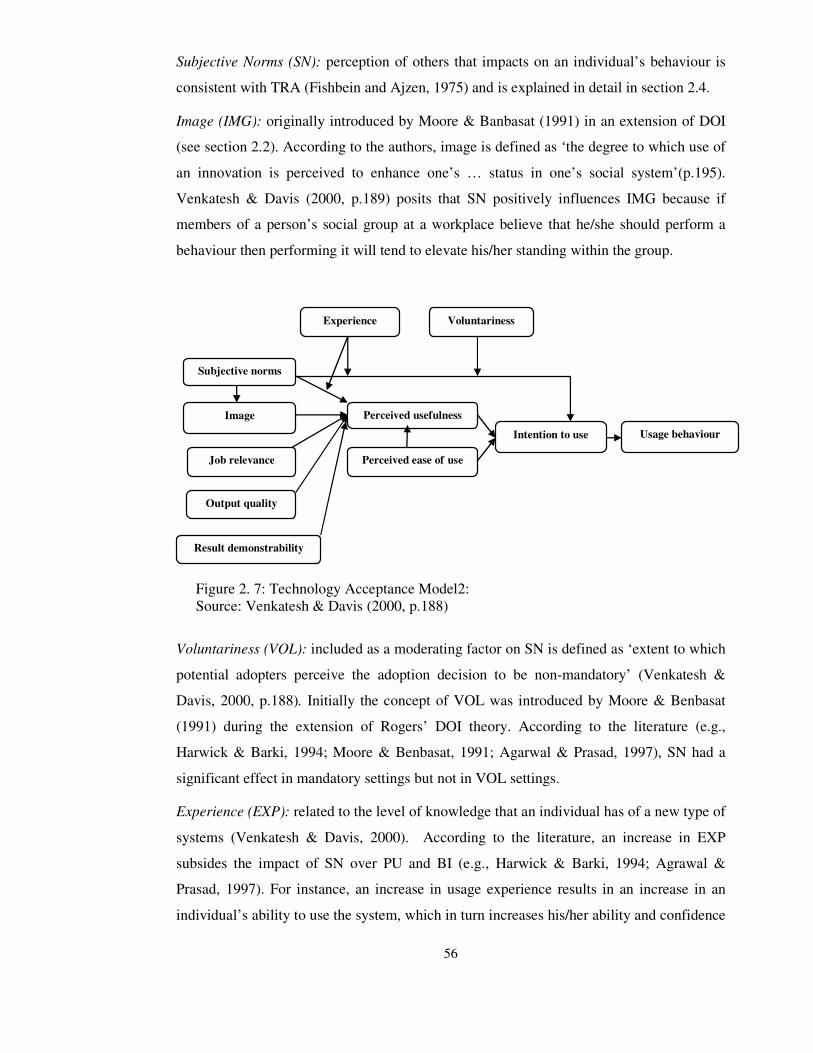
56
Subjective Norms (SN): perception of others that impacts on an individual’s behaviour is
consistent with TRA (Fishbein and Ajzen, 1975) and is explained in detail in section 2.4.
Image (IMG): originally introduced by Moore & Banbasat (1991) in an extension of DOI
(see section 2.2). According to the authors, image is defined as ‘the degree to which use of
an innovation is perceived to enhance one’s … status in one’s social system’(p.195).
Venkatesh & Davis (2000, p.189) posits that SN positively influences IMG because if
members of a person’s social group at a workplace believe that he/she should perform a
behaviour then performing it will tend to elevate his/her standing within the group.
Voluntariness (VOL): included as a moderating factor on SN is defined as ‘extent to which
potential adopters perceive the adoption decision to be non-mandatory’ (Venkatesh &
Davis, 2000, p.188). Initially the concept of VOL was introduced by Moore & Benbasat
(1991) during the extension of Rogers’ DOI theory. According to the literature (e.g.,
Harwick & Barki, 1994; Moore & Benbasat, 1991; Agarwal & Prasad, 1997), SN had a
significant effect in mandatory settings but not in VOL settings.
Experience (EXP): related to the level of knowledge that an individual has of a new type of
systems (Venkatesh & Davis, 2000). According to the literature, an increase in EXP
subsides the impact of SN over PU and BI (e.g., Harwick & Barki, 1994; Agrawal &
Prasad, 1997). For instance, an increase in usage experience results in an increase in an
individual’s ability to use the system, which in turn increases his/her ability and confidence
Perceived usefulness
Perceived ease of use
Subjective norms
Intention to use Usage behaviour
Image
Job relevance
Output quality
Result demonstrability
Experience Voluntariness
Figure 2. 7: Technology Acceptance Model2: Source: Venkatesh & Davis (2000, p.188)
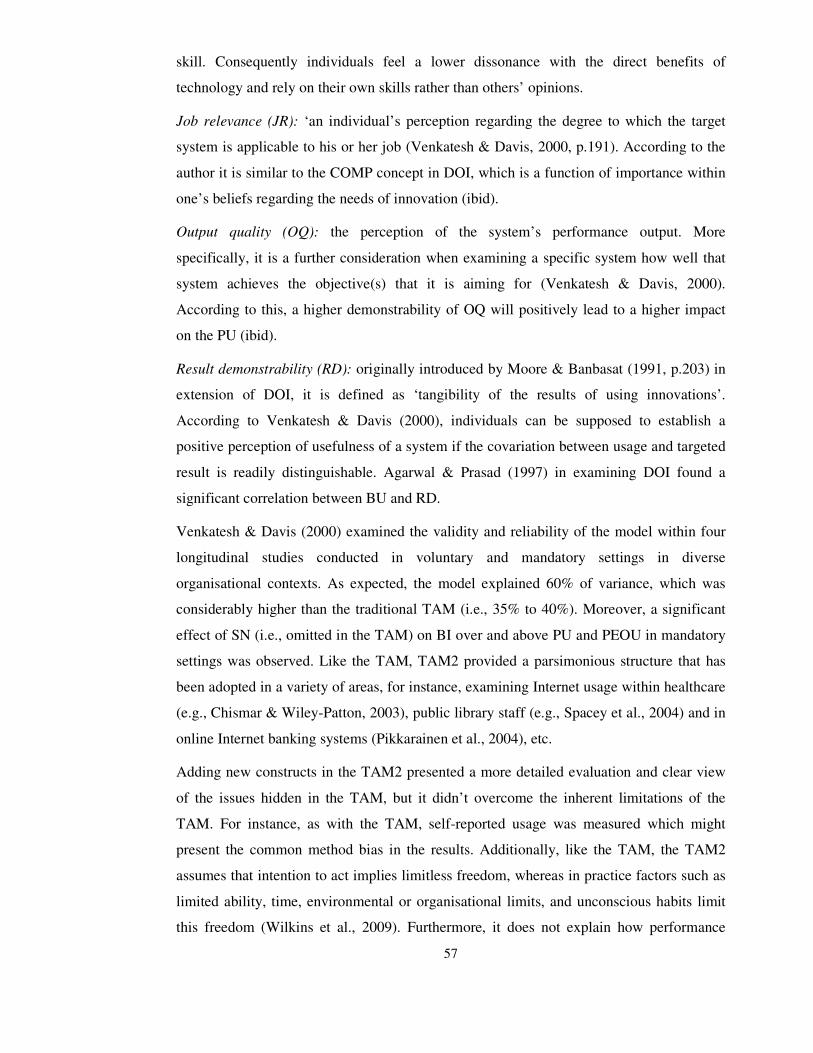
57
skill. Consequently individuals feel a lower dissonance with the direct benefits of
technology and rely on their own skills rather than others’ opinions.
Job relevance (JR): ‘an individual’s perception regarding the degree to which the target
system is applicable to his or her job (Venkatesh & Davis, 2000, p.191). According to the
author it is similar to the COMP concept in DOI, which is a function of importance within
one’s beliefs regarding the needs of innovation (ibid).
Output quality (OQ): the perception of the system’s performance output. More
specifically, it is a further consideration when examining a specific system how well that
system achieves the objective(s) that it is aiming for (Venkatesh & Davis, 2000).
According to this, a higher demonstrability of OQ will positively lead to a higher impact
on the PU (ibid).
Result demonstrability (RD): originally introduced by Moore & Banbasat (1991, p.203) in
extension of DOI, it is defined as ‘tangibility of the results of using innovations’.
According to Venkatesh & Davis (2000), individuals can be supposed to establish a
positive perception of usefulness of a system if the covariation between usage and targeted
result is readily distinguishable. Agarwal & Prasad (1997) in examining DOI found a
significant correlation between BU and RD.
Venkatesh & Davis (2000) examined the validity and reliability of the model within four
longitudinal studies conducted in voluntary and mandatory settings in diverse
organisational contexts. As expected, the model explained 60% of variance, which was
considerably higher than the traditional TAM (i.e., 35% to 40%). Moreover, a significant
effect of SN (i.e., omitted in the TAM) on BI over and above PU and PEOU in mandatory
settings was observed. Like the TAM, TAM2 provided a parsimonious structure that has
been adopted in a variety of areas, for instance, examining Internet usage within healthcare
(e.g., Chismar & Wiley-Patton, 2003), public library staff (e.g., Spacey et al., 2004) and in
online Internet banking systems (Pikkarainen et al., 2004), etc.
Adding new constructs in the TAM2 presented a more detailed evaluation and clear view
of the issues hidden in the TAM, but it didn’t overcome the inherent limitations of the
TAM. For instance, as with the TAM, self-reported usage was measured which might
present the common method bias in the results. Additionally, like the TAM, the TAM2
assumes that intention to act implies limitless freedom, whereas in practice factors such as
limited ability, time, environmental or organisational limits, and unconscious habits limit
this freedom (Wilkins et al., 2009). Furthermore, it does not explain how performance
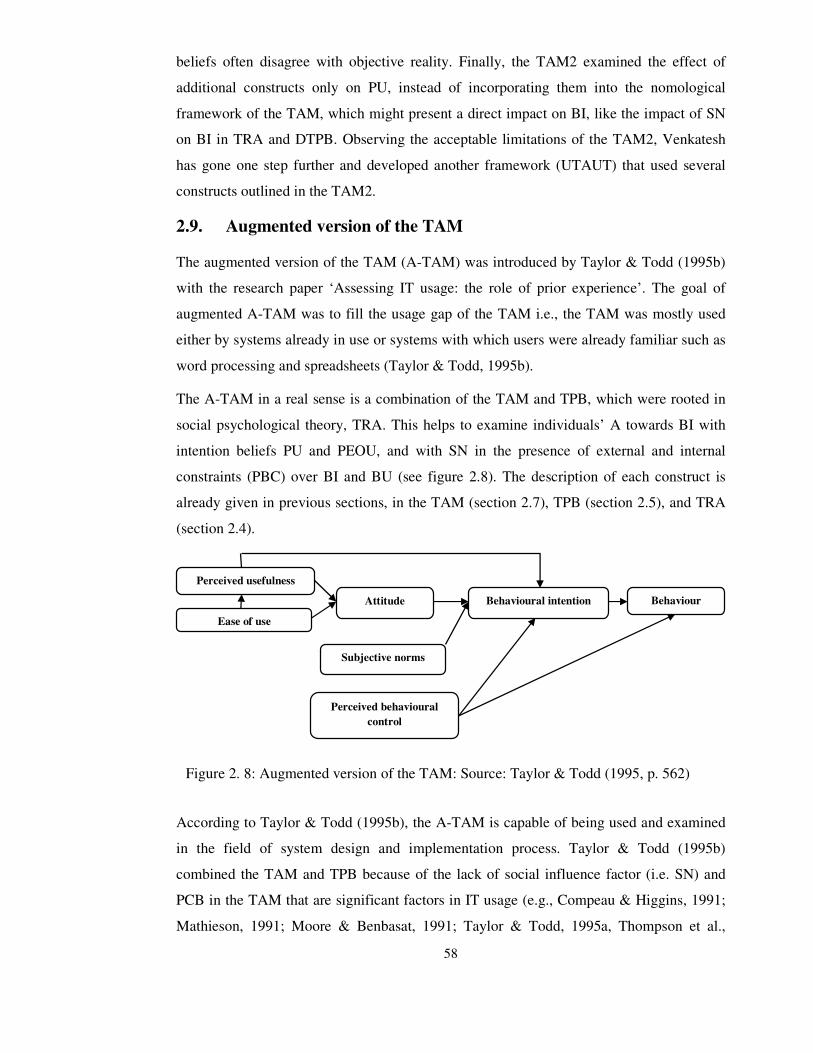
58
beliefs often disagree with objective reality. Finally, the TAM2 examined the effect of
additional constructs only on PU, instead of incorporating them into the nomological
framework of the TAM, which might present a direct impact on BI, like the impact of SN
on BI in TRA and DTPB. Observing the acceptable limitations of the TAM2, Venkatesh
has gone one step further and developed another framework (UTAUT) that used several
constructs outlined in the TAM2.
2.9. Augmented version of the TAM
The augmented version of the TAM (A-TAM) was introduced by Taylor & Todd (1995b)
with the research paper ‘Assessing IT usage: the role of prior experience’. The goal of
augmented A-TAM was to fill the usage gap of the TAM i.e., the TAM was mostly used
either by systems already in use or systems with which users were already familiar such as
word processing and spreadsheets (Taylor & Todd, 1995b).
The A-TAM in a real sense is a combination of the TAM and TPB, which were rooted in
social psychological theory, TRA. This helps to examine individuals’ A towards BI with
intention beliefs PU and PEOU, and with SN in the presence of external and internal
constraints (PBC) over BI and BU (see figure 2.8). The description of each construct is
already given in previous sections, in the TAM (section 2.7), TPB (section 2.5), and TRA
(section 2.4).
According to Taylor & Todd (1995b), the A-TAM is capable of being used and examined
in the field of system design and implementation process. Taylor & Todd (1995b)
combined the TAM and TPB because of the lack of social influence factor (i.e. SN) and
PCB in the TAM that are significant factors in IT usage (e.g., Compeau & Higgins, 1991;
Mathieson, 1991; Moore & Benbasat, 1991; Taylor & Todd, 1995a, Thompson et al.,
Perceived usefulness
Ease of use
Attitude
Subjective norms
Behavioural intention Behaviour
Perceived behavioural
control
Figure 2. 8: Augmented version of the TAM: Source: Taylor & Todd (1995, p. 562)

59
1991). Other reasons for developing a hybrid model was to examine the impact of models
on experienced and inexperienced potential IT users, which was missing in both the TAM
and TPB. After conducting a survey of 430 experienced and 356 inexperienced students in
a business school separately, the authors found comparative results between experienced
and inexperienced users as given in table 2.1. The authors found reasonable variance in all
determinants of BI except A on behaviour of IT usage for both experienced and
inexperienced users. This suggests that the model can be used to predict subsequent usage
behaviour prior to users having experience (Taylor & Todd, 1995b).
Constraints Experienced Inexperienced
BI to B Significant Less significant
A to BI Not significant Not significant
PU to BI Less significant Significant
PU to A Not significant Not significant
SN to BI Not significant Not significant
PBC to BI Significant Less significant
PEOU to A Less significant Significant
PEOU to PU Not significant Not significant
Table 2-1: Comparative results of A-TAM. Source: Adopted from Taylor & Todd (1995b)
Despite examining the effect of EXP as an unexplored factor, the A-TAM also possessed
some limitations. For instance, the sample selected for the study were students, therefore,
social factors such as SN and PBC might produce different results if examined in real
workplaces. Second, confiding variables which might influence experience e.g., age,
gender, were not examined in this model. Third, the model was examined with
homogenous technology and an organisational context which limits its generalisibility.
Finally, the impact of EXP was examined on a dichotomous scale (i.e., high and low
experience) which fails to generalise the results in situations where users evolve from
novice to expert in technology usage.
2.10. Unified Theory of Acceptance and Use of Technology
In a stream of research that intends to investigate the unexplored explanatory power in the
TAM, keeping its parsimonious structure stable, Ventakesh & Davis (2000) proposed
TAM2. The results of TAM2 were encouraging but it didn’t affect the limitations of the
TAM, which invited further research in this area. In doing so, Venkatesh and his team
(Morris, Davis G. & Davis F) in 2003 went one step further and developed a unified model
called the Unified Theory of Acceptance and Use of Technology (UTAUT). Based on the
rationale that opting a single model among a multitude of models disregards the
contribution from alternative models, the authors empirically compared eight models

60
including, TRA, TAM, TPB, DOI, SCT, Motivational Model (MM), Combined TAM and
TPB (C-TAM-TPB), and Model of PC utilisation (MPCU). Upon the review, test and
comparisons of prior models, Venkatesh et al., (2003) identified five major limitations as:
1) The technologies studied were relatively simple and individual-oriented as opposed
to more complex and sophisticated technologies.
2) Participants in these studies were mainly students.
3) Largely, the timing of measurement was general in nature. That is, most tests in
prior studies were conducted well after the participant’s acceptance or rejection
decisions rather than during the decision-making process.
4) Largely the nature of measurement in prior studies was cross-sectional.
5) Finally, most of the studies were conducted in voluntary settings, which makes
them difficult to generalise in mandatory settings.
Based on previously compared results, Venkatesh et al., (2003) incorporated four key
determinants in model: performance expectancy, effort expectancy, social influence and
facilitation conditions; and four key moderators: gender, age, voluntariness and experience
(see figure 2.9). Furthermore, the authors examined factors of A, SE and anxiety but didn’t
incorporate a direct determinant in the model due to less or having no significant effect on
BI and BU. For generalisablity and reliability purposes, the author examined results in six
different organisations for a six month longitudinal time period in voluntary and mandatory
conditions. The results were outperformed and the model showed a variance of 70% that is
comparatively better than the previously tested all eight models (17% to 53%). The core
constructs included in the model are briefly explained below:
Performance expectancy (PE): the degree to which an individual believes that using a
system will result in increased job performance (Venkatesh et al., 2003). The PE is similar
to PU in TAM/TAM2 and C-TAM-TPB, extrinsic motivation in MM, job-fit in MPCU,
RA in DOI and outcome expectation in SCT. According to the authors, PE is the strongest
predictor of intention among all other constructs. The effect of PE on intention was
moderated by gender and age, so it was stronger for younger men.

61
Effort expectancy (EE): the degree to which an individual perceives that a system will be
easy to use and is similar to PEOU in TAM/TAM2 and COLX in MPCU (Venkatesh et al.,
2003). The authors found that gender, age and experience were the moderating factors over
relationship of EE and BI, so that the effect was stronger for younger women with early
experience.
Social influence (SI): defined as the degree to which an individual perceives who are
important to him/her and who had influence on his/her work. The SI is studied as similar to
SN in TRA, TAM/TAM2, TPB/DTPB and C-TAM-TPB, social factors in MPCU, and
IMG in DOI (Venkatesh et al., 2003). The author found that gender, age, VOL and EXP
were moderating factors on the relationship of SI and BI, so that the effect was stronger for
older women with limited experience in mandatory settings of technology use.
Facilitating conditions (FC): defined as the degree to which an individual believes that
organisational and technical resources are present to facilitate the use of the system. The
FC is studied similar to PBC in TPB/DTPB, C-TAM-TPB, facilitating conditions in
MPCU and COMP in DOI. In UTAUT, Venkatesh et al., (2003) did not find a direct
impact of FC on BI, however, with the moderating impact of age and EXP they found a
significance of FC on BU. Specifically, the effect was only visible within older age and
increasing experience individuals.
Although published studies adopting or extending UTAUT are still scarce, this does not
undervalue the importance of this model compared with other models of technology
acceptance. Evidently, the model performed well in recent literature across the
Performance expectancy
Effort expectancy
Gender
Social influence
Behavioural intention Behaviour usage
Facilitating conditions
Age Experience Voluntariness of use
Figure 2. 9: Unified Theory of Acceptance and Use of Technology (UTAUT) Source: Venkatesh et al., (2003, p.447)
62
organisational context and culture. For instance, Koivimaki et al., (2008) using UTAUT
examined the perception of individuals in northern Finland towards mobile service;
Eckhardt et al., (2009) examined the social influence of workplace referent groups
(superiors and colleagues) in German companies; Curtis et al., (2010) examined the
adoption of social media in non-profit US organisations; and Verhoeven et al., (2010)
examined computer usage in Belgian universities. The results in the exemplified studies
showed that the model explained more than 60% variance in predicting intentions and
ascertaining the power of the model. Apart from the diverse context and applications
applicability, UTAUT has also been extended and modified by a number of researchers.
For instance, Wang et al., (2009) extended UTAUT with additional constructs of perceived
playfulness and self-management of learning within mobile learning in Taiwanese context.
The results show that both constructs were significant towards BI and BU. In another
study, Wang & Wang (2010) extended UTAUT with constructs of perceived playfulness,
perceived value, and computer SE, and omitted BU from the model. By examining in a
voluntary context, the authors found that perceived value and SE had a significant effect on
adoption, leaving no effect of perceived playfulness on BI. The results of both studies and
many others alike confirm the robustness of the model by extending it with additional
constructs.
Despite the argument that UTAUT is a powerful model due to its parsimonious structure
and higher explanatory power, it is also criticised due to its claims. For instance, regarding
its parsimony, Bagozzi (2007, p. 245) critiqued the model by stating that ‘the exposition of
UTAUT is a well-meaning and thoughtful presentation. But in the end we are left with a
model with 41 independent variables for predicting intention and at least eight independent
variables for predicting behaviour’. Furthermore, the model didn’t examine direct effects
which might reveal new relationships. According to Bagozzi (2007), UTAUT’s important
factors from the study were left out by subsuming under the existing predictors. Besides
the parsimonious structure, Raaij & Schepers (2008) critiqued the model by its explanatory
power. For instance, the authors argued that higher R2 (coefficient of determination) within
UTAUT was only achievable when moderating key variables (age, gender, EXP and VOL)
were included in the model, and hence, it makes the model less parsimonious than its
predecessors, the TAM and TAM2. Additionally, they critiqued the model due to its vague
grouping of items to measure the constructs. For instance, FC were measured by integrated
items from PBC, facilitations conditions, and COMP, and thus, invites complications to

63
comprehend how such a wide variety of items replicates one single construct of
psychometric properties.
2.11. Comparison of models in the literature
In the previous sections (2.1 to 2.10), the review of the multitude models revealed that the
inception of various theoretical models within technology acceptance has lasted more than
20 years, and researchers have attempted to constitute new models or derivatives from
already existing models (e.g., the TAM, TRA, and TPB). Also, it was earlier alluded to that
model development was mostly concentrated to increase the explanatory and predictive
power with a parsimonious structure. Nevertheless, at the beginning, each of the multitude
models was doing well in providing diverse perspectives on approaching the problem with
a specific theoretical stance; however, they were criticised at a later stage with some
common threads and limitations. Therefore, selecting an appropriate model that can guide
management to take action has always remained a critical task for information system
researchers. Venkatesh et al., (2003, p.426) sketched this problem as: ‘researchers are
confronted with a choice among a multitude of models and find that they must pick and
choose constructs across the models, or choose a favoured model and largely ignore the
contributions from alternative models’. Echoing Venkatesh et al.’s (2003) argument, the
following section presents an empirical comparison among the widely accepted models
already discussed in the previous section. The discussion enables the researcher to find
two unanswered questions that merits the establishment of foundations for the conceptual
framework in the next chapter. The questions posed are: what is the set of beliefs that is
consistently related to different operationalisations of technology acceptance models; and,
what are the causal paths that might exist among these beliefs within various technology
acceptance models.
There is general agreement in the existing information system research that an individual’s
behaviour is best measured by his/her attitudinal usage beliefs towards behaviour rather
than his/her attitudinal beliefs towards objects (i.e., characteristics of innovations) involved
in setting up the behaviour (Fishbein & Ajzen, 1975; Mathieson, 1991). Hence, there can
be two distinct streams of research in the information system acceptance domain.
According to Agarwal & Prasad (1999), one stream of the research within IT acceptance is
grounded in social psychological theory whereby individual differences are posited to
influence attitude, intentions and behaviour only through the mediating effect of the
beliefs. Predominantly models in this stream (e.g., TRA, TPB, and the TAM) are based on
64
Social Cognitive Theory (SCT), which asserts that user intentions are based on the
individual’s usage behaviour (e.g., Bandura, 1986; LaRose & Eastin, 2004; Ajzen &
Fishbein, 1980; Venkatesh & Davis, 2000; Chau & Hu, 2001; Taylor & Todd, 1995a).
In contrast, Agarwal & Prasad (1999) defined another stream of research that is grounded
in the Diffusion of Innovation Theory (DOI). According to DOI, there is systematic
disparity between early and late adopters of an innovation in three major areas of
socioeconomic status, personality traits, and communication behaviour (Rogers, 1995).
Additionally, a user’s intentions in DOI are influenced by the characteristics of innovation
itself (ibid). Unlike SCT, within information system research, no theory is directly/purely
extended DOI. However, a number of theories incorporated predictors or adopted its
conceptualisations within their nomological frameworks, e.g., UTAUT, TAM, TPB, DTPB
(e.g., Teo et al., 1995; Wu & Wang, 2005; Wu et al., 2007; Yi et al., 2006; Rogers, 1995;
Moore & Benbasat, 1991; Agarwal & Prasad, 1998). Keeping this divergence in
perspective and a review of the nine models discussed with contingencies in the prior
section, the research in this section presents a comparison of these models.
Unlike meta-analysis, where the results of various studies are gathered and analysed again,
the objective of the present section is to only synthesise and validate the constructs in the
past key citations. In doing so, comparison of the models is carried out using three
common criteria suggested by Mathieson (1991). First, models are compared by observing
their predictive power (i.e., R2 coefficient of determinant), which suggests that a model
higher in predictive power provides a more accurate picture of the issues required for
acceptability. Second, by examining the path significance (i.e., β value nomological
framework), which suggests how important information is gained from the model. And
finally, by examining the parsimonious structure, which suggests that the simpler the path,
the easier the model will be to understand. The comparisons and common criticism in the
literature provides key strengths for presenting the conceptual framework in the next
chapter and also facilitates the elaboration of the results of the current study with
limitations and future directions. Table 2.2 summarises the major predictors and key
citations in technology acceptance research.
2.11.1. TAM vs. TPB
Both the TAM and TPB are grounded in SCT and are immediate successors to the TRA.
The review of the previous relevant sections (sections 2.5 and 2.7) advocate that two
models share points of similarity due to a causal uni-dimensional view of relationships

65
among the constructs. Specifically, both models suggest that environmental beliefs
influence cognitive beliefs, which in turn influence attitude and targeted behaviour.
Conversely, two models differ in the perspective of beliefs, for example, the TAM believes
that A towards BI is the result of beliefs- PEOU and PU (Davis et al., 1989; Davis, 1989);
whereas TPB believes that BI is the result of the beliefs defined in the TAM as well as
explicit situational beliefs (i.e., SN) and control beliefs (i.e., PBC) (Ajzen, 1991;
Methieson, 1991).
This difference can be understood by the categorisation of beliefs factors as: external
control beliefs, which deal with the time, opportunity and cooperation constructs; and
internal control variables, which incorporate one’s skills and motivational strengths (Ajzen,
1985). Davis et al., (1989), within the TAM, did not explicitly examine both external and
internal beliefs; however, they considered them as part of the situational beliefs which
were measured by the PEOU. After examining the model in mandatory situations, Davis
found that the TAM produced significant explanatory variance in internal situational
beliefs (i.e., self-beliefs and skills) but remained less satisfactory in explaining variance
within external controlled beliefs. This suggests that the TAM, like its predecessor TRA, is
based on the assumption of volitional control, and performs less effectively in situations
where volitional control is perceived as low.
Contrary to this, TPB gains advantage over the TAM by including factor PBC which
explains a person’s perception of control over performing behaviour. Due to volitional
control TPB is empirically favoured in published literature. For instance the literature
suggests that, within mandatory settings, TPB, compared with the TAM, added about 4%
to 5% variance in explaining BI and 1% in explaining BU (e.g., Taylor & Todd, 1995a,
Mathieson, 1991). However, from generality perspective, TPB compared with TAM is less
applicable. The TAM assumes that beliefs about behaviour are measured in a similar way
in all situations, whereas TPB assumes that beliefs are context specific (Taylor & Todd,
1995a). Therefore, TPB requires an extra step (i.e., usually piloting) to identify those
situations specific to the particular organisational context, individuals’ needs, and hence
becomes more complex if different groups of individuals or situations exists within a
single context of the study.
Nevertheless, from the explanatory perspective (i.e., R2), both models remain successful at
their par. However, within voluntary settings the TAM had a slight advantage over TPB.
An illustration of this can be inferred from the studies of Mathieson (1991), Taylor & Todd

66
(1995a) and Chau & Hu (2002). Mathieson (1991) compared two models with the
objective of predicting the user’s intention to accept spreadsheet programmes within a
sample of students. The authors found that the TAM performed slightly better than the
TPB. For instance, the TAM explained 69% variance, whereas TPB explained 60%
variance. In addition, within TPB, the authors didn’t find a significant impact of SN over
BI (ibid). This supports the TAM’s framework which excludes SN and asserts that social
pressure is an inherent part of behavioural beliefs and its explicit inclusion in a model only
increases the model’s complexity rather than the explanatory power to predict the intention
(Davis et al., 1989). However, contrary to the TAM’s assumptions, as theoretically
supported in psychology literature, Mathieson (1991) found a significant impact of PBC on
BI. Mathieson’s results were echoed by Chau & Hu (2002) during the study of the
physicians to predict the acceptance of telemedicine technologies. The authors found the
TAM to be slightly better than the TPB at explaining BI, i.e., TAM=40% and TPB=32%.
Also, similar to Mathieson’s study, they found a significant impact of PBC and
insignificant impact of SN on BI (ibid). One major difference between the two studies was
the effect of beliefs of PEOU on A. Mathieson found a significant effect of PEOU and PU
on A in the TAM, whereas Chau & Hu found an insignificant effect of PEOU on A. This
result is contrary to the generality perception of the TAM and suggests that the TAM,
identical to TPB, produced differences in results when context/situations were different.
Contrary to these two studies, during the development of DTPB Taylor & Todd (1995a)
compared two models in the sample of students and found TPB to be better than the TAM.
The authors found that the TAM explained 52% variance in acceptance intention whereas
TPB explained 57% variance. Also, as theorised with TPB and contrary to the TAM, both
social beliefs (i.e., SN) and control beliefs (i.e., PBC) produced significant impact on BI.
Observing mixed results favouring two models, Taylor & Todd (1995b) combined two
models and presented an integrated model known as the augmented TAM. The authors
examined A-TAM within the context of both experienced and inexperienced users’ context
and found that the model produced 43% variance within BI for experienced users and 60%
variance for inexperienced users. Similar to the TAM, A-TAM produced an insignificant
impact of SN within the context of both experienced and inexperienced users. The merger
of two models within A-TAM suggests that either the TAM or TPB was not enough to
obtain the required objectives and leaves a gap for further exploration and extensions of
theoretical conceptualisations.

67
Observing studies and the discussion above, it is concluded that the TAM is easier to use
and is useful for predicting user intentions in situations where contextual information is not
needed. Additionally, due to its parsimonious structure and explanatory power it gained in
advantage over TPB. However, TPB remained advantageous over the TAM when
designing and predicating specific user behaviour was required in diverse situations.
However, context specification also undermines the TPB due to its complexity when
approaching comparative reference points between all individuals/organisational needs
during the implementation process.
2.11.2. TPB vs. DTPB
The two models share the point of similarity that both are derived from the TRA and aims
to predict an individual’s planned and deliberated behaviour. On the contrary, the two
models are different in the way that TPB is a direct successor of TRA with the assertion
that BU is a direct function of BI and PBC, and that BI is formed by one’s A, SN and PBC;
whereas, with DTPB, the direct successor to TPB decomposes the beliefs presented in TPB
from the literature of DOI theory that are generalisable across situations and not
specialised to a specific context. In addition to the context generality, another purpose of
decomposing the beliefs within TPB was its lack of explanatory power in BI during the
applications’ design and implementation process (Taylor & Todd, 1995a). The
decomposition of beliefs was also supported by Shimp & Kavas (1984) who suggested that
cognitive components of beliefs could not be organised into a single conceptual or
cognitive unit, therefore needs to be fragmented according to the context of the study.
According to the published literature, within a specific context TPB is more advantageous
over DTPB in explanatory power (Taylor & Todd, 1995a). In addition, due to its
parsimonious structure TPB is easier to implement compared with DTPB; however, the
reverse is not true (ibid). Usually a parsimonious model becomes desirable when the
explanatory power of one’s intention is required (Venkatesh et al., 2003). Therefore, within
a general context and situations that explore in-depth knowledge, DPTB is more
advantageous over TPB.
For taking decisions to select an appropriate model, there is a scarce amount of empirical
studies, out of which a few are discussed to clarify differences. The first pioneering study
was Taylor & Todd (1995a), which compared three models, the TAM, TPB and DTPB,
within a sample of business students. From the explanatory power perspective, the authors
found that DTPB was slightly better than TPB, in that DTPB explained 60% variance in BI

68
and 76% variance in A; whereas TPB explained 57% variance in BI and 58% within A. In
addition, the author concluded that DTPB provided greater diagnostic values, greater
insights into the factors that influence IT usage, and suggested beliefs that can be targeted
by designers or managers interested in implementation of information system (ibid).
Later on, similar results have been found by a few more studies recently. For instance,
Shish & Fang (2004), in the context of Internet banking in Taiwan, found that DTPB
explained 66% variance in BI and TPB explained 54%; Lin (2007), examining online
shopping acceptance within the context of Taiwanese customers, found that DTPB
explained 57% variance in BI and TPB explained 46%; finally, Huh et al., (2009),
examining information system acceptance within South Korean hotels, found that DTPB
explained 63% variance in BI and TPB explained 59%. Despite the higher explanatory
power within BI in all exemplified studies, it was noticed that the path between SN and BI
in all results pertaining to the DTPB was insignificant, which suggests that inclusion of SN
only increased model complexity rather than explanatory power. After observing the
examples above, it is inferred overall that, with the exception of the parsimonious structure
condition, DTPB, compared to the TPB, is more favoured and advantageous to explain and
identify the salient beliefs of the individual establishing acceptance behaviour towards new
technologies.
2.11.3. TAM vs. TPB vs. DTPB
In the previous two sections (2.13.1 & 2.13.2) three models theoretically rooted in social
psychological theory SCT, and derivatives of TRA were compared i.e., (i.e., TAM vs. TPB
and TPB vs. DTPB). From the parsimonious perspective it was noticed that the TAM
compared to TPB, and TPB compared to DTPB were better; however, from the perspective
of explaining BI, the TAM compared with TPB was still better, but TPB was less effective
than DTPB. Therefore, in line with the discussion in previous sections it can be inferred
that at some extent both the TAM and DTPB were more advantageous than the TPB. In
addition to the previous discussion, this section further examines the various issues which
are thought to be making a distinction among these models and helps to favour one over
another.
As discussed, the three models share points of similarity in that they all are derived from
TRA and postulate that individual differences are based on influence of A, BI and BU only
via the mediating construct of beliefs. However, later on, A was excluded from TAM but is
still part of TPB and DTPB. On the contrary, three models differ from each other in that
69
TAM does not include SN and PBC as determinants of BI. Exclusion of the SN within the
TAM at some extent is rational due to weak psychometric properties (e.g., Davis et al.,
1989) and mixed results in literature i.e., significant and insignificant (e.g., Taylor & Todd,
1995a; Lin, 2007). However, omission of PBC is considered to be a major limitation (e.g.,
Mathieson, 1991; Venkatesh et al., 2003). Despite the fact that on one side omission of
control beliefs within the TAM constrains its applicability to examine BI in situation when
individuals have low level of volitional control (e.g., mandatory situations), on the other
hand this is considered to be the favoured point because of its context-free generalisibility
and parsimony in structure. On the other side, inclusion of the SN and PBC within TPB
and DTPB makes them more favoured compared with the TAM to some extent due to
applicability within mandatory situations and explaining greater insights into factors of
individuals’ behaviour acceptance. At the same time this inclusion leads to them becoming
more context-specific and less in parsimonious structure (see discussion of TAM vs. TPB).
Specifically, inclusion of SN due to unstable results remains a topic of debate and
confusion in IT acceptance and favours TAM conceptualisation. For example, specifically
looking at the DTPB, which is favoured over the TAM due to its higher explanatory power
(Taylor & Todd, 1995a), some researchers found a significant effect of SN over BI (e.g.,
Taylor & Todd, 1995a; Huh et al., 2009) while others found no effect (e.g., Chau & Hu,
2002; Shish & Fang, 2004; Lin, 2007).
Another point which favours the TAM over TPB and DTPB is exclusions of A which
showed partial mediated effect at the time of creation (e.g., Davis et al., 1989). This
exclusion made the TAM more parsimonious, and avoided the possibility of a mediating
impact between behavioural beliefs and behaviour itself. However, on the other hand, TPB
and DTPB still examine behaviour through the mediating effect of BI between A and BU;
this might invite the risk of distorted results in situations where intentions are ill-formed
(i.e., partial or no mediation effect) (e.g., Bagozzi & Yi, 1989). In favour of omission of A,
Chau & Hu (2001) recently excluded A from DTPB and found a significant impact of
COMP on PU and PEOU. This result favours our argument that inclusion of A is a
limitation rather than an advantage of TPB and DTPB models.
Apart from the above rationales, the limitations of the TAM, which favours TPB and
specifically DTPB, include: its self-reported usage instrument (e.g., Davis, 1993);
construct BU not being examined with actual measures of usage behaviour (e.g.,
Matheision, 1991); inability to explain the explanatory variance more than 30% to 40%
(Venkatesh et al., 2003; Taylor & Todd, 1995a); and finally, lack of external variables

70
examination (e.g., Igbaria and Iivari, 1995). From the explanatory perspective, Taylor &
Todd (1995a) compared all three models and found that DTPB provided an increased
explanatory power for BI i.e., 60%; this compared with 57% of TPB and 52% of the TAM.
Similar results were also found for explaining intention by Lin (2007) i.e., TAM=0.41%,
TPB=0.46%, DTPB=0.57; and by Huh et al., (2009) i.e., TAM=0.61%; TPB=0.59%;
DTPB=0.63%.
In summary, the importance of all three models, specifically the TAM and DTPB, is clear
and indisputable. What is not clear, however, is the extent to which models need to be
parsimonious as well as capable of explaining individuals’ differences that matters in
establishing acceptance behaviour. Up to this point in the discussion, it is concluded that
TAM is the most favoured model over others if it is extended with situational and
volitional factors similar to TPB and external factors similar to DTPB. This argument can
be read in the literature that extended the TAM. For instance, Yi et al., (2006) developed
an integrated model based on the TAM, TPB and IDT to assess the acceptance and design
of hand-held devices in the health-care sector; it found a significant increase in explaining
BI (i.e., 57%) as compared to pure TAM-based studies’ variance (i.e., 30% to 40%).
2.11.4. TPB vs. DTPB vs. TRA
Up until this point in the discussion, the models compared were rooted in the social
psychological theory SCT and directly derived from TRA. Nevertheless, models and
theories are derived with the aim of overcoming the limitations of preceding one, but this
does not mean that they would be better in all aspects from their earlier versions. In
accordance with that assumption, the next few sections compare the models derived from
TRA (e.g., the TAM, TPB) and TRA itself. The comparison helps to comprehend the real
needs that were required at to be complete successive models.
The first extension of TRA was TPB. The two models were similar in that dependent
variable of interest was an overt and observable manifestation of the focal behaviour.
Specifically, both theories posit that such BU is influenced by an individual’s BI, which in
turn is determined by the individual’s A and SN towards BI (Ajzen, 1985). However,
unlike the TRA, TPB introduces an additional construct of PBC as a predictor of BI as well
as BU. The inclusion of this additional construct within TPB was to overcome the
limitation of TRA when predicting behaviour under conditions where individuals were
having low or no volitional control (e.g., Ajzen, 1991; Taylor & Todd, 1995a). According
to TPB, volitional control of individuals is unpredictable towards behaviour which needs to
71
be observed with external variable PBC (Ajzen 1985; Madden et al., 1992). Examining the
effect of newly added construct PBC within TRA, Madden et al., (1992) compared two
models within the student sample to examine the 10 behavioural activities. The authors
found that PBC presented a significant increase in the prediction of BI, on average, from
R2=48% to 59%, and within BU, R2=28% to 38% (ibid). These results suggest that
inclusion of PBC significantly enhances the prediction of BI as well as target behaviour.
Although TPB provided a solution for the TRA’s volitional control assumption, but it still
lacks a solution for the inherent assumption of the proximity between BI and BU, which
requires specific situations to predict the actual behaviour. In other words, beliefs to
measure were still context specific (Foxall, 1997). This limitation was acknowledged by
Taylor & Todd (1995a) in the model comparison study. The author decomposed beliefs of
TPB that were generalisable across the situations and named the model as DTPB. When
comparing the three models, the TAM, TPB and DTPB, Taylor & Todd found that DTPB
provide increased explanatory power compared with others, however, it had a less
parsimonious structure. Recently, Shish & Fang (2004) compared TRA with its two
extensions TPB and DTPB when examining the acceptance of Internet banking in Taiwan.
As expected, the author found that DTPB was the most successful model followed by TPB
and TRA respectively. Specifically, explaining BI and BU, the authors found that DTPB
explained 66% and 23% variance, TPB explained 54% and 24% variance, and TRA
explained 46% and 20% variance respectively. In summary, it is observed that DTPB was
more favoured over others from the perspective of the context generalisability as well as
explanatory power. Therefore, it can be argued that extending the model to understand the
in-depth knowledge is an essential requirement rather than just desirable.
2.11.5. TAM vs. TPB vs. TRA
In line with the discussion on comparing the extensions of TRA with its original
conceptualisation and empirical findings, this section aims to examine another extension
i.e., the TAM with TRA and its extension, TPB. Before commencing the discussion, it is
worth noting that a comparison of the TAM and TPB has already been discussed in section
(2.13.3), and a comparison of TRA and TPB is presented in section (2.13.4). Here, the
researcher only highlights the main differences between TRA and the TAM with some
empirical evidence.
TAM is an immediate succession of TRA. Two models, TRA and the TAM, share the
point of similarity that BI is the major determinant of BU. Both models share the limitation

72
of volitional control, where it is assumed that individuals are usually rational when making
the decision to engage in a specific behaviour (e.g., Fishbein & Ajzen, 1975; Davis et al.,
1989). The two models differ from each other due to two main reasons. First, unlike TRA,
the TAM does not include SN as a predictor of BI due to its uncertain theoretical and
psychometric properties (e.g., Davis et al., 1989). Second, unlike expectancy formulation
of beliefs examined in TRA, the TAM posits only two beliefs: PU and PEOU to predict an
individual’s A (however in the final TAM, A was removed due to partial mediaion effect)
and BI. The two differences elicited makes the TAM more advantageous compared with
TRA. For instance, it was noticed previously that SN remained an unstable predictor to
explain BI (e.g., Chau & Hu, 2002; Shish & Fang, 2004; Lin, 2007) therefore its inclusion
in a model only increases the complexity rather than explanatory power. The second
difference, the addition of normative beliefs (e.g., system design characteristics,
individuals’ characteristics, task characteristics, nature of development process, political
factors, and organisational factors) and their expectancy formulation with A is also
considered to be a limitation of TRA, because for each new context new beliefs need to be
elicited that are idiosyncratic in nature and cannot be generalised for other systems (Davis
et al., 1989).
Overall, the importance of the two models remains unarguable. Davis et al., (1989) in a
paper entitled ‘User acceptance of computer technology: a comparison of two theoretical
models’ compared two models in a longitudinal study with a sample of 107 MBA students.
Upon comparing the results of two models in voluntary settings the authors found the
TAM to be better than TRA in explaining BI. Specifically, at two time intervals TRA
explained 32% and 26% variance, whereas the TAM explained 47% and 51% variance.
Additionally, as theorised in TRA, Davis did not find a significant impact of SN on BI, and
hence supports the TAM’s conceptualisation.
Very little research is found in published literature on comparing the three models, TRA
and its two extensions, the TAM and TPB. One reason could be their dichotomous
differences in conceptualisation. For example, there are studies that compare the
conceptualisation of the TAM vs. TRA (e.g., Davis et al., 1989), TAM vs. TPB (e.g.,
Mathieson, 1991), or TRA vs. TPB (Madden et al., 1992), but studies that compare all the
models together are very scarce. Gentry & Calantone (2002) compared three models to
examine the buyer intention on the web and found that the TAM explained higher variance
in BI i.e., 91% followed by TPB with 85% and TRA with 57%. In another study Venkatesh
et al., (2003), during the development of UTAUT, compared the results of eight prominent
73
models including TRA, TAM, TPB and DTPB as well. The authors found that within
voluntary settings the TAM was better than the other two models. For instance, explaining
BI, the TAM explained 38% variance, whereas TRA explained 30% and TPB/DTPB
explained 37% variance. Also, in mandatory settings unexpectedly the TAM was better
than the other two. For example, TAM explained 39% variance, TRA explained 26%
variance, and TPB/DTPB explained 34% variance (ibid).
In conclusion, all three models have clear strengths over each other. However, the TAM
precedes the other two due to its simple structure and consistent explanatory power, while
in the design and implementation process, the other two models are considered to be better
than the TAM. Considering the advantages, Venkatesh & Davis (2000) integrated all three
models together and named it the TAM2. The authors’ integration approach was successful
and the model explained a 60% variance in BI within four different organisational contexts
(ibid). The lesson learned from Venkatesh & Davis’ (2000) findings suggest that selecting
constructs from the multitude models is the favoured approach to overcome the limitations
of earlier models and equally contributes to extending the present theoretical frameworks.
2.11.6. TAM2 vs. UTAUT and other models
Finally, in accordance to the previous section’s summary of that integrating approach (e.g.,
TRA, TAM, and TPB within the TAM2) and the more detailed view of the unexplored
issues in technology acceptance research, this section presents a comparison between two
widely accepted integrated models, the TAM2 and UTAUT, developed by Venkatesh &
Davis (2000) and Venkatesh et al., (2003) respectively. The two models share points of
similarity in that both are based on the integrating approach and the paths are examined
based on the cross-over effect (e.g., Venkatesh & Bala, 2008). Both models address
acceptance as well as usage by excluding the concept of A and assume that perceived
technological characteristics will directly influence the individuals’ BI to accept the
technology under consideration. Social norms (i.e., subjective norms in the TAM2 and
social influence in UTAUT) and voluntariness of use were re-entered in the models that
were previously omitted or were considered to be a limitation of the TAM. Finally, the
moderating impact of usage experience over social norms was also highlighted in both
models.
Contrary to the similarities, the two models differ in that the TAM2 applies the integrating
approach based on a stream of research which intends to examine the key determinants of
user acceptance due to the PU (e.g., Davis et al., 1989), rather than incorporating them into

74
the nomological framework; whereas UTAUT examines the additional constructs directly
as part of the framework. Second, unlike UTAUT, the TAM2 does not incorporate the
effect of the demographic variables (i.e., age and gender) that remain powerful moderators
in information system acceptance research (e.g., Venkatesh & Morris, 2000). And finally,
the TAM2 includes uni-dimensional constructs (i.e., singular in nature and cannot be
broken into further dimensions), whereas UTAUT incorporates multidimensional
constructs (i.e., constructs are developed by summing up more than one uni-dimensional
construct).
From the perspective of effectiveness, both models remain strong in explanatory power in
comparison with the earlier version, except providing a less parsimonious structure.
However, parsimony is not the only factor for the acceptance of a model. According to
Taylor & Todd (1995b), models need to be evaluated in terms of their explanatory power
as well as parsimony. Whereas Venkatesh et al. (2003), supporting Taylor & Todd, argued
that parsimony is desirable to the extent that it facilitates understanding. By looking at the
overall criticism of both models, the TAM2 and UTAUT, in sections (2.8 & 2.10)
respectively, it is argued that the TAM2 is better than UTAUT. Despite the fact that
UTAUT explained a higher variance in explaining BI (see Venkatesh et al.’s (2003)
comparison of eight models where UTAUT was better than the rest) but it was only
accounted due to moderating factors (Raaj & Schepers, 2006). Also, UTAUT’s approach
to integrate multidimensional constructs from the pool of uni-dimensional constructs is not
a valid approach to examining the effect of all the 41 independent variables for predicting
intention (Bagozzi, 2007). Therefore, apart from its approach to integrating the constructs
of interest to predict intended behaviour, the TAM2 is considered to be better than
UTAUT. The comparative results from the explanatory power perspective are not
presented in this section because, as far as the researcher is aware, there is no study that
compares the results of these models simultaneously in one single study, except for
Venkatesh et al., (2003). He found that TAM2 produced 38% variance in voluntary
settings and 39% in mandatory settings, whereas UTAUT explained 52% to 77% variance
in predicting behaviour intention. The findings of just Venkatesh et al., (2003) cannot be
taken as evidence of generalisation to explain the higher explanatory power due to the
chance of the researchers’ bias to support their own results compared with others.

75
Author Purpose of Study Context/Sample/
methodology Moderators Variable Model
Variance/
Explanatory
power (R2)
Significant Findings Non-Significant
findings
Mathieson (1991) Comparative study between TAM and TPB
Spread Sheet word processing program Students (262) Longitudinal Study
NA PEOU, PU, A, BI, SN,PBC
TAM A = 0.727 PU=0.442 BI=0.69
EOU�PU, EOU+PU�A A+PU�BI
TPB A= 0.388 BI= 0.60
PBC+A�BI SN�BI
Chau and Hu, (2002)
Comparative study between TAM, TPB, DTPB
Healthcare-Telemedicine technology- Hong Kong Physicians(400) Cross-sectional Study
NA PEOU, PU, A, BI, SN, PBC, COMP
TAM BI= 0.42 A= 0.36 PU=0.01
A�BI, PU�BI PU�A
PEOU�PU PEOU�A
TPB BI =0.32 A�BI, PBC�BI SN�BI(-ve)
DTPB
BI=0.42 A=0.37 PU=0.53 PEOU=0.01
A�BI, PBC�BI, PU�BI, PU�A, COMP�PU
SN�BI (-ve) PEOU�PU PEOU�A COMP�PEOU
Taylor and Todd (1995b)
Combined TAM and TPB and examination based on experience
Computing resources project Student (430 and 356) Longitudinal Study
EXP PU, PEOU, A, SN, PBC, BI, B
A-TAM
Experience B = 0.21 BI= 0.43
Experience BI�B, PBC�BI
Experience A�BI, PU�A SN�BI
Inexperience B = 0.17 BI= 0.60
Inexperience PU�BI, PBC�B, PEOU�A
Inexperience A�BI, PU�A SN�BI
Taylor and Todd (1995a)
Comparative study between three models TAM, TPB, DTPB
Computing resource project- Student(786) Longitudinal Study
NA PEOU, PU, A, BI, SN, PBC, COMP,BU,PI,SI,SE,RF,TF
TAM B=0.34 BI= 0.52 A= 0.73
PU�BI, PU�A PEOU�PU, PEOU�A BI�BU
A�BI (-ve)
TPB
B=0.34 BI =0.57 A=0.58 SN=0.50 PBC=0.84
A�BI, BI�BU PBC�BI, PBC�BU SN�BI
DTPB
B=0.36 BI =0.60 A=0.76 SN=0.57
PU�A, A�BI PI�SN, SI�SN SN�BI, SE�PBC RF�PBC, PBC�BI
PEOU�A COMP�A TF�PBC(-ve)
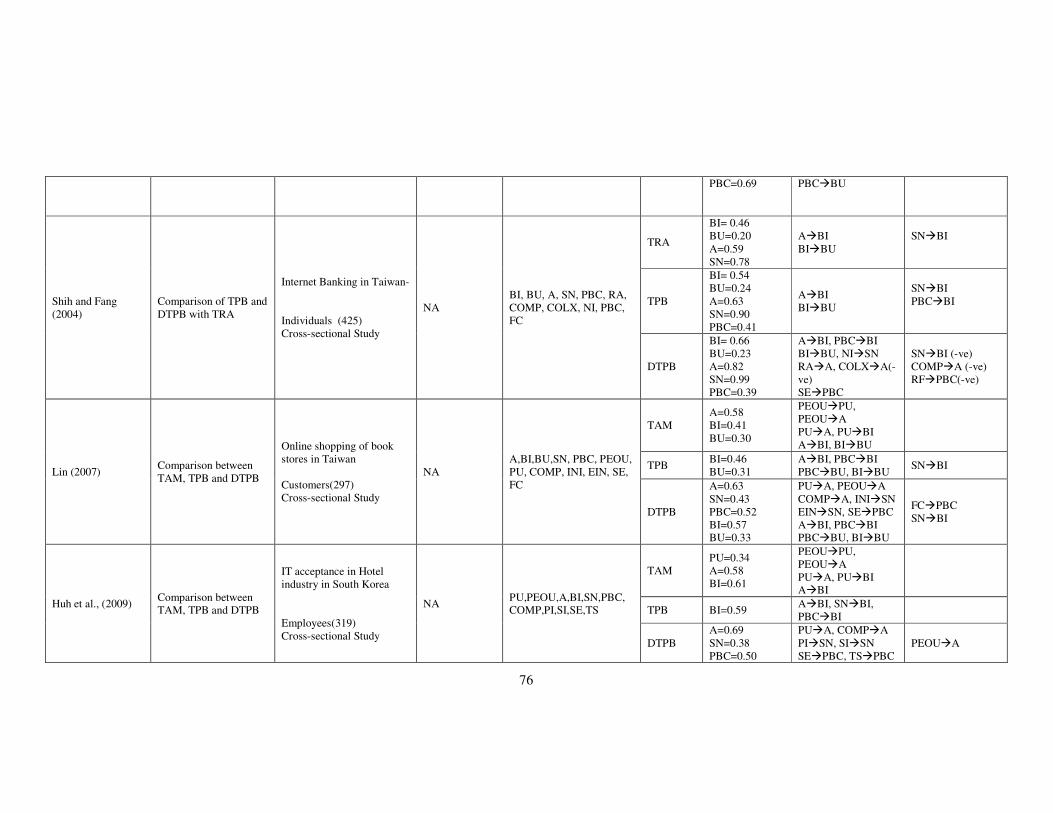
76
PBC=0.69 PBC�BU
Shih and Fang (2004)
Comparison of TPB and DTPB with TRA
Internet Banking in Taiwan- Individuals (425) Cross-sectional Study
NA BI, BU, A, SN, PBC, RA, COMP, COLX, NI, PBC, FC
TRA
BI= 0.46 BU=0.20 A=0.59 SN=0.78
A�BI BI�BU
SN�BI
TPB
BI= 0.54 BU=0.24 A=0.63 SN=0.90 PBC=0.41
A�BI BI�BU
SN�BI PBC�BI
DTPB
BI= 0.66 BU=0.23 A=0.82 SN=0.99 PBC=0.39
A�BI, PBC�BI BI�BU, NI�SN RA�A, COLX�A(-ve) SE�PBC
SN�BI (-ve) COMP�A (-ve) RF�PBC(-ve)
Lin (2007) Comparison between TAM, TPB and DTPB
Online shopping of book stores in Taiwan Customers(297) Cross-sectional Study
NA A,BI,BU,SN, PBC, PEOU, PU, COMP, INI, EIN, SE, FC
TAM A=0.58 BI=0.41 BU=0.30
PEOU�PU, PEOU�A PU�A, PU�BI A�BI, BI�BU
TPB BI=0.46 BU=0.31
A�BI, PBC�BI PBC�BU, BI�BU
SN�BI
DTPB
A=0.63 SN=0.43 PBC=0.52 BI=0.57 BU=0.33
PU�A, PEOU�A COMP�A, INI�SN EIN�SN, SE�PBC A�BI, PBC�BI PBC�BU, BI�BU
FC�PBC SN�BI
Huh et al., (2009) Comparison between TAM, TPB and DTPB
IT acceptance in Hotel industry in South Korea Employees(319) Cross-sectional Study
NA PU,PEOU,A,BI,SN,PBC, COMP,PI,SI,SE,TS
TAM PU=0.34 A=0.58 BI=0.61
PEOU�PU, PEOU�A PU�A, PU�BI A�BI
TPB BI=0.59 A�BI, SN�BI, PBC�BI
DTPB A=0.69 SN=0.38 PBC=0.50
PU�A, COMP�A PI�SN, SI�SN SE�PBC, TS�PBC
PEOU�A
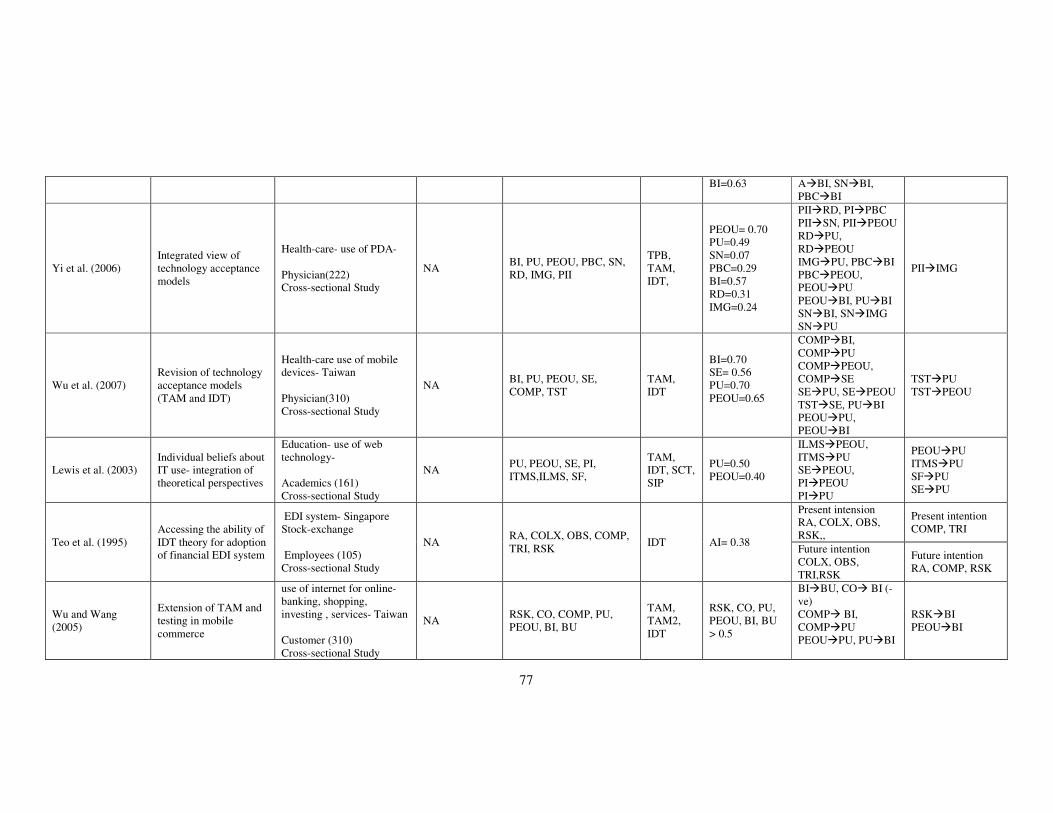
77
BI=0.63 A�BI, SN�BI, PBC�BI
Yi et al. (2006) Integrated view of technology acceptance models
Health-care- use of PDA- Physician(222) Cross-sectional Study
NA BI, PU, PEOU, PBC, SN, RD, IMG, PII
TPB, TAM, IDT,
PEOU= 0.70 PU=0.49 SN=0.07 PBC=0.29 BI=0.57 RD=0.31 IMG=0.24
PII�RD, PI�PBC PII�SN, PII�PEOU RD�PU, RD�PEOU IMG�PU, PBC�BI PBC�PEOU, PEOU�PU PEOU�BI, PU�BI SN�BI, SN�IMG SN�PU
PII�IMG
Wu et al. (2007) Revision of technology acceptance models (TAM and IDT)
Health-care use of mobile devices- Taiwan Physician(310) Cross-sectional Study
NA BI, PU, PEOU, SE, COMP, TST
TAM, IDT
BI=0.70 SE= 0.56 PU=0.70 PEOU=0.65
COMP�BI, COMP�PU COMP�PEOU, COMP�SE SE�PU, SE�PEOU TST�SE, PU�BI PEOU�PU, PEOU�BI
TST�PU TST�PEOU
Lewis et al. (2003) Individual beliefs about IT use- integration of theoretical perspectives
Education- use of web technology- Academics (161) Cross-sectional Study
NA PU, PEOU, SE, PI, ITMS,ILMS, SF,
TAM, IDT, SCT, SIP
PU=0.50 PEOU=0.40
ILMS�PEOU, ITMS�PU SE�PEOU, PI�PEOU PI�PU
PEOU�PU ITMS�PU SF�PU SE�PU
Teo et al. (1995) Accessing the ability of IDT theory for adoption of financial EDI system
EDI system- Singapore Stock-exchange Employees (105) Cross-sectional Study
NA RA, COLX, OBS, COMP, TRI, RSK
IDT AI= 0.38
Present intension RA, COLX, OBS, RSK,,
Present intention COMP, TRI
Future intention COLX, OBS, TRI,RSK
Future intention RA, COMP, RSK
Wu and Wang (2005)
Extension of TAM and testing in mobile commerce
use of internet for online-banking, shopping, investing , services- Taiwan Customer (310) Cross-sectional Study
NA RSK, CO, COMP, PU, PEOU, BI, BU
TAM, TAM2, IDT
RSK, CO, PU, PEOU, BI, BU > 0.5
BI�BU, CO� BI (-ve) COMP� BI, COMP�PU PEOU�PU, PU�BI
RSK�BI PEOU�BI

78
Venkatesh and Davis (2000)
Extension of TAM called TAM2 by integrating models TAM, TRA,TPB
Four different organisational systems. Employees (156) Longitudinal Study
EXP VOL
SN, IMG, JR, OQ,RD, PU, PEOU, BI, BU
TAM2 BI= 0.60
SN x EXP�BI SN x VOL�BI SN x EXP�PU (-ve) SN�IMG, IMG�PU JR x OQ�PU RD�PU, PEOU�PU PEOU�BI, PU�BI BI�BU
Venkatesh et al.(2003)
Unified view of acceptance of information technology: integrated view based on TRA, TAM, MM,TPB, C-TAM-TPB,MPUCU, IDT.SCT
Four different organisational systems. Employees (215) Longitudinal Study
G,AG, EXP, VOL
PE, EE, SI, FC, SE, CA, A, BI, BU
UTAUT BI= 0.70
PE x AG�BI PE x G�BI EE x AG�BI EE x G�BI EE x EXP�BI FC x AG�BI FC x EXP�BI
FC�BI SE�BI CA�BI A�BI, BI�BU
Venkatesh and Morris (2000)
Examination of Gender and social influence over TAM
Five different organisational context Employees (342) Longitudinal Study
G, Time PU, BI, PEOU, SN, TAM
Short-term effect BI=0.41
PU�BI (M>W) PEOU�BI(W>M) SN�BI(W>M)
PEOU�PU(M>W)
Long-term effect BI=0.41
PU�BI (M>W) PEOU�BI(W>M) SN�BI(W)
PEOU�PU(M>W) SN�BI(M)
Venkatesh (2000) Determinants of PEOU
Three different organisational context Employees (246) Longitudinal Study
Time PEOU, PU, BI, CA, SE, CPL, PEC, PEN, OBU
TAM
Time1 PEOU=0.40 BI=0.35
SE�PEOU, PEC�PEOU CA�PEOU(-ve) CPL�PEOU, PEOU�PU PEOU�BI, PU�BI
PEN�PEOU OBU�PEOU
Time2 PEOU=0.54 BI=0.34
SE�PEOU, PEC�PEOU CA�PEOU(-ve) CPL�PEOU, PEN�PEOU
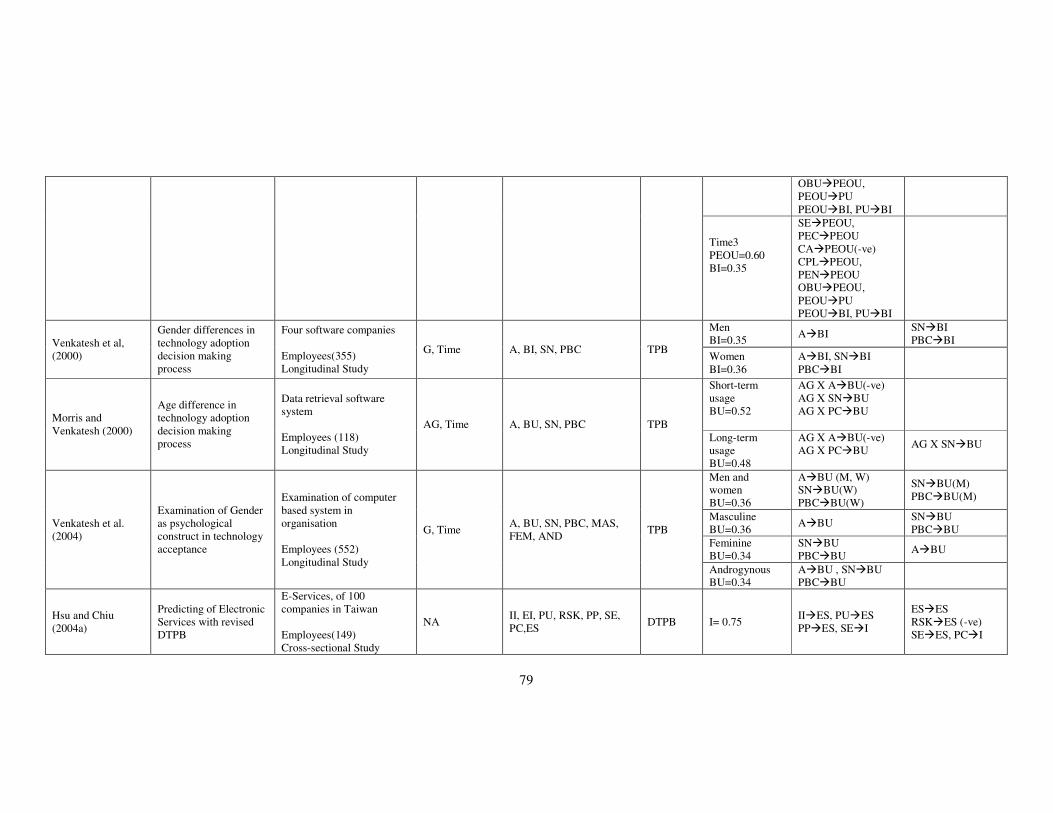
79
OBU�PEOU, PEOU�PU PEOU�BI, PU�BI
Time3 PEOU=0.60 BI=0.35
SE�PEOU, PEC�PEOU CA�PEOU(-ve) CPL�PEOU, PEN�PEOU OBU�PEOU, PEOU�PU PEOU�BI, PU�BI
Venkatesh et al, (2000)
Gender differences in technology adoption decision making process
Four software companies Employees(355) Longitudinal Study
G, Time A, BI, SN, PBC TPB
Men BI=0.35
A�BI SN�BI PBC�BI
Women BI=0.36
A�BI, SN�BI PBC�BI
Morris and Venkatesh (2000)
Age difference in technology adoption decision making process
Data retrieval software system Employees (118) Longitudinal Study
AG, Time A, BU, SN, PBC TPB
Short-term usage BU=0.52
AG X A�BU(-ve) AG X SN�BU AG X PC�BU
Long-term usage BU=0.48
AG X A�BU(-ve) AG X PC�BU
AG X SN�BU
Venkatesh et al. (2004)
Examination of Gender as psychological construct in technology acceptance
Examination of computer based system in organisation Employees (552) Longitudinal Study
G, Time A, BU, SN, PBC, MAS, FEM, AND
TPB
Men and women BU=0.36
A�BU (M, W) SN�BU(W) PBC�BU(W)
SN�BU(M) PBC�BU(M)
Masculine BU=0.36
A�BU SN�BU PBC�BU
Feminine BU=0.34
SN�BU PBC�BU
A�BU
Androgynous BU=0.34
A�BU , SN�BU PBC�BU
Hsu and Chiu (2004a)
Predicting of Electronic Services with revised DTPB
E-Services, of 100 companies in Taiwan Employees(149) Cross-sectional Study
NA II, EI, PU, RSK, PP, SE, PC,ES
DTPB I= 0.75 II�ES, PU�ES PP�ES, SE�I
ES�ES RSK�ES (-ve) SE�ES, PC�I

80
Gupta et al. (2008) Examining ICT adoption using UTAUT
E-Government within internet government organizations. Employees (102) Cross-sectional Study
G PE, EE, SI, FC, BI, G,BU UTAUT NA PE�BI, EE�BI SI�BI, FC�BU
BI�BU PE x G�BI EE x G�BI SE x G�BI`
Ma et al. (2005) Examining acceptance of technology in Education System
Computer technology- students and academics(84) Cross-Sectional Study
NA SN, PU, PEOU, BI TAM, TRA
BI=0.43 PU=0.11
PU�BI, PEOU�PU
SN�PU, SN�BI PEOU�BI
Hsu and Chiu (2004b)
Internet self-efficacy acceptance
e-services- Taiwan students(239) Cross-sectional Study
NA IN, SCN, WSE, PBC, PU, PEOU, RSK, ISE, BI, BU,A
TAM, TRA TPB DTPB
BI=0.50 BU=0.30
PU�A, PEOU�A RSK�A (-ve) ISE�A, ISE�WSE A�BI, WSE�BI WSE�BU
IN�BI, SCN�BI PBC�BI, PBC�BU
Seyal et al. (2002) Use of internet in academics
Internet in teaching- Brunei Darussalam Academics(166) Cross-sectional Study
NA EXP, OWN, PU, PEOU, TSK
TAM PU=0.38 PU�BU, PEOU�BU EXP�BU
OWN�BU, TSK�BU
Hu et al. (2003) Examination of technology acceptance in teaching
Micro soft word program- Academics(130) Longitudinal Study
Training PEOU, PU, SN, JR, COM, SE, BI
TAM, TRA, IDT
Prior-training BI=0.47
Prior-training JR�PU, COM�PEOU SE�PEOU, SE�BI SN�BI, SN�PU (-ve) PU�BI, PEOU�PU
Prior-training PEOU�BI COM�PU
Post-training BI=0.72
Post-training JR�PU, COM�PEOU COM�PU (-ve) SE�PEOU, SE�BI SN�BI, SN�PU (-ve) PU�BI, PEOU�PU
Post-training PEOU�BI SN�BI
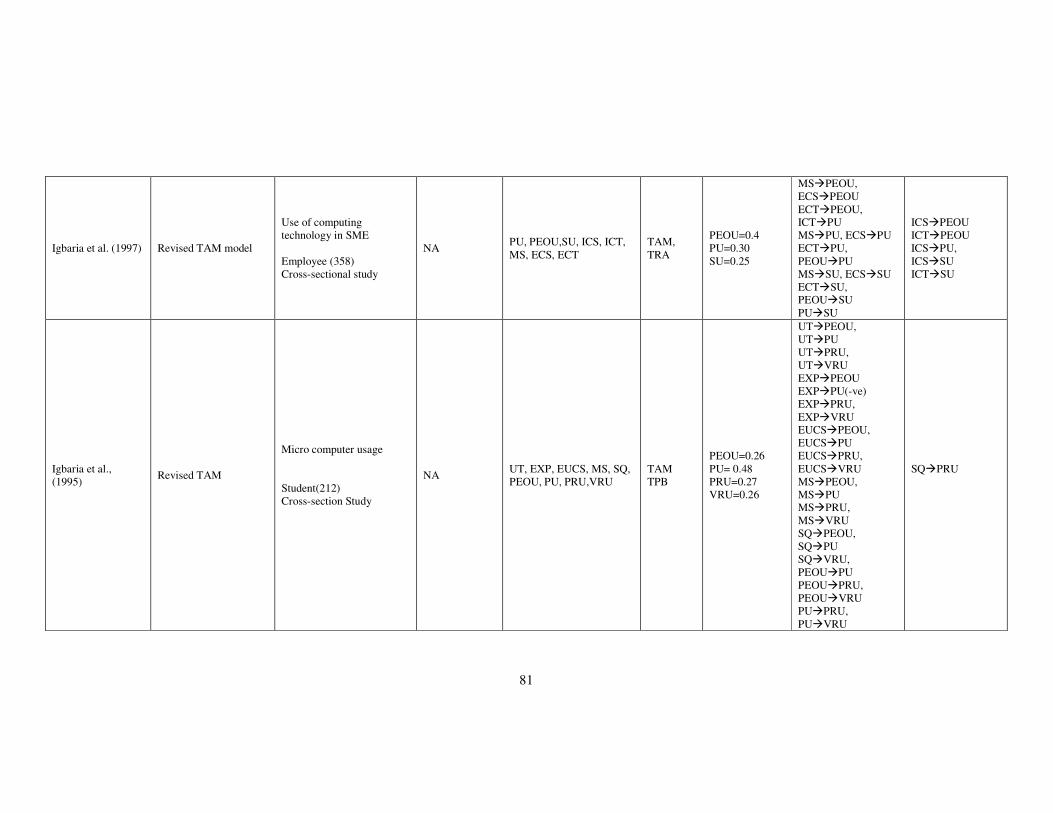
81
Igbaria et al. (1997) Revised TAM model
Use of computing technology in SME Employee (358) Cross-sectional study
NA PU, PEOU,SU, ICS, ICT, MS, ECS, ECT
TAM, TRA
PEOU=0.4 PU=0.30 SU=0.25
MS�PEOU, ECS�PEOU ECT�PEOU, ICT�PU MS�PU, ECS�PU ECT�PU, PEOU�PU MS�SU, ECS�SU ECT�SU, PEOU�SU PU�SU
ICS�PEOU ICT�PEOU ICS�PU, ICS�SU ICT�SU
Igbaria et al., (1995)
Revised TAM
Micro computer usage Student(212) Cross-section Study
NA UT, EXP, EUCS, MS, SQ, PEOU, PU, PRU,VRU
TAM TPB
PEOU=0.26 PU= 0.48 PRU=0.27 VRU=0.26
UT�PEOU, UT�PU UT�PRU, UT�VRU EXP�PEOU EXP�PU(-ve) EXP�PRU, EXP�VRU EUCS�PEOU, EUCS�PU EUCS�PRU, EUCS�VRU MS�PEOU, MS�PU MS�PRU, MS�VRU SQ�PEOU, SQ�PU SQ�VRU, PEOU�PU PEOU�PRU, PEOU�VRU PU�PRU, PU�VRU
SQ�PRU
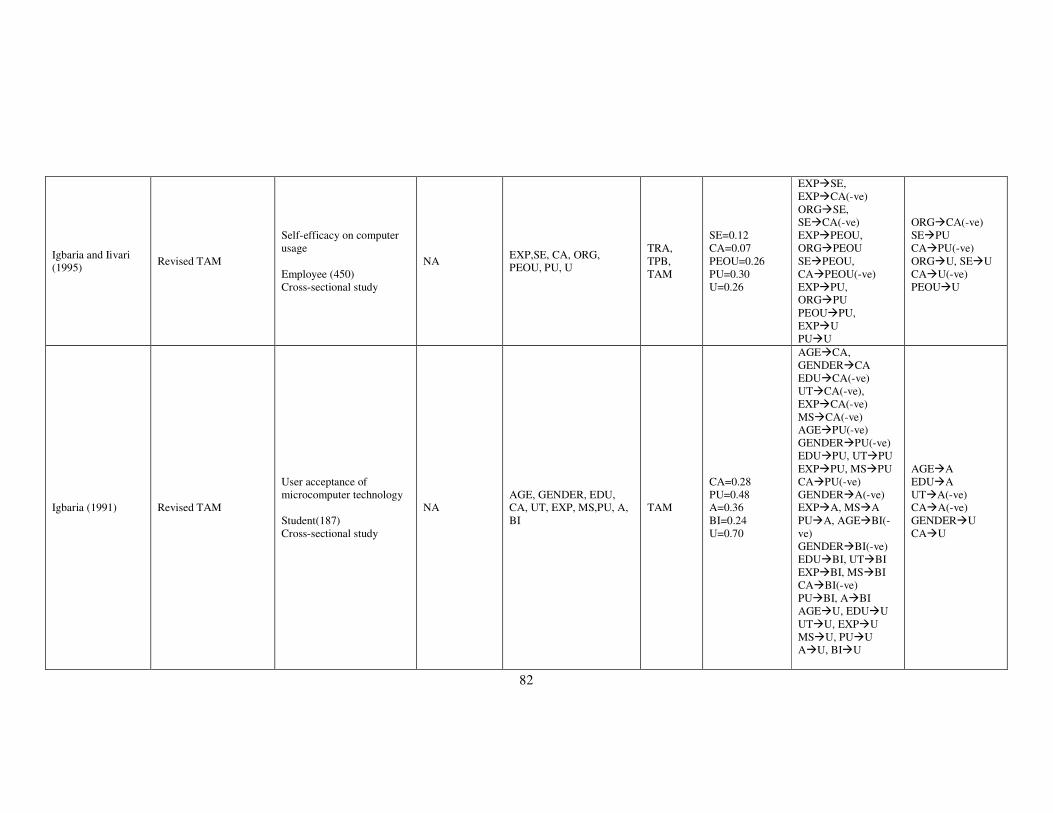
82
Igbaria and Iivari (1995)
Revised TAM
Self-efficacy on computer usage Employee (450) Cross-sectional study
NA EXP,SE, CA, ORG, PEOU, PU, U
TRA, TPB, TAM
SE=0.12 CA=0.07 PEOU=0.26 PU=0.30 U=0.26
EXP�SE, EXP�CA(-ve) ORG�SE, SE�CA(-ve) EXP�PEOU, ORG�PEOU SE�PEOU, CA�PEOU(-ve) EXP�PU, ORG�PU PEOU�PU, EXP�U PU�U
ORG�CA(-ve) SE�PU CA�PU(-ve) ORG�U, SE�U CA�U(-ve) PEOU�U
Igbaria (1991) Revised TAM
User acceptance of microcomputer technology Student(187) Cross-sectional study
NA AGE, GENDER, EDU, CA, UT, EXP, MS,PU, A, BI
TAM
CA=0.28 PU=0.48 A=0.36 BI=0.24 U=0.70
AGE�CA, GENDER�CA EDU�CA(-ve) UT�CA(-ve), EXP�CA(-ve) MS�CA(-ve) AGE�PU(-ve) GENDER�PU(-ve) EDU�PU, UT�PU EXP�PU, MS�PU CA�PU(-ve) GENDER�A(-ve) EXP�A, MS�A PU�A, AGE�BI(-ve) GENDER�BI(-ve) EDU�BI, UT�BI EXP�BI, MS�BI CA�BI(-ve) PU�BI, A�BI AGE�U, EDU�U UT�U, EXP�U MS�U, PU�U A�U, BI�U
AGE�A EDU�A UT�A(-ve) CA�A(-ve) GENDER�U CA�U

83
Davis et al., (1989) Development of TAM and comparison with TRA
Word processing Student(107) Longitudinal Study
NA PEOU, PU, A, BI, SN
TRA
BI=0.26 A=0.30
A�BI SN�BI
TAM BI=0.51 A=0.36 PU=0.05
PU�BI, PU�A PEOU�A, PEOU�PU
A�BI
Table 2.2: Comparison of various technology acceptance models based on constructs significance and explanatory power (R2)
PEOU=perceived ease of use, A=attitude=, BI= behavioural intention= B(U)= Behaviour (usage), PBC= perceived behavioural control, SN= subjective norms, EXP= experience, VOL= voluntariness, IMG= image, JR= job relevance,
RD= result demonstrability, OQ= output quality, G= gender, AG= age, PE= performance expectancy, EE= effort expectancy, SI= social influence, FC= facilitation conditions, SE= self efficacy, CA= computer anxiety, COMP=
compatibility, PI= peer influence, SI= superior influence, RF= resource facilitation, TF= technology facilitation, TS= technical support, PII= personal innovativeness in IT, RA= relative advantages, CPL= computer playfulness, PEN=
perceived enjoyment, OBU= objective usability, PEC= perception of external control, COLX= complexity, NI= normative influence, INI= interpersonal influence, EIN= external influence, MAS= masculinity, FAM= femininity, AND=
androgynous, M=Men, W=Women, EDU=educational level, ORG=, organisational support, UT= user training, ECUS= end user computing support, SQ= system quality, PRU= perceived usage, VRU= variety of use, MS= management
support, ICS= internal computing support, ICT= internal computing training, SU= system usage, ECS= external computing support, ECT= external computing training, PWN= PC owner ship, TSK= task characteristics, IN=
interpersonal norm, SCN= social norms, WSE= web self-efficacy, ISE= internet self-efficacy, TST= Technical support and training, SF= Social Factors, ITMS= Institutional factors top-management support, ILMS= institutional
factors local-management support, OBS= observability, TRI= trialability, RSK= Risk, AI= Adoption intention, CO= Cost, II= interpersonal influence, EI= External influence, PP= Perceived playfulness, PC= Perceived controllability ,
ES= e-service satisfaction.
84
2.12. Cultural issues and IT acceptance
In an attempt to answer the second research question, that is, ‘Is there any perception of
difference between segments of users (i.e., academics) towards acceptance of technology
(the Internet) due to their individual cultural differences’, this section discusses a number
of issues related to culture and its impact on theories to predict an individual’s acceptance
behaviour. In doing so, a review of culture enables more information about its role in the
theories of behavioural acceptance and answers questions such as why the theories and
models developed in one country have met with limited success when applied in another
context or rather, why theories and models are not found to be uniformly effective across
the cultures when the aim is to predict an individual’s acceptance of newer technologies.
To answer these questions, the discussion strives to define culture, cultural models and
dimensions, and their impact on the theories of IT acceptance in the literature.
2.12.1. Defining culture
A number of researchers have attempted to provide an acceptable definition of culture but
there has been very little agreement with respect to an appropriate definition. In an effort to
establish a consensus-based definition, Kroeber & Clyde Kluckhohn (1952) in their book
Culture: A critical review of concepts and definitions examined 164 definitions. Despite
these efforts, due to different levels and perspectives of understanding, there is little
agreement except on a few prominent definitions of culture within sociology, social
psychology and anthropology literature. From the anthropological perspective, where most
of the cultural studies are established, some definitions related to the purpose of the current
study are presented as follows.
According to Crane (1994), the term ‘culture’ can be defined as something that is an
observable or recordable act; whereas, according to Mead (1953), it is a shared pattern of
behaviour. These two definitions imply the single idea that culture is a group-level
construct that is situated between the personality of the individual and human nature. In
addition, it also implies that studying culture requires little more than observing and
describing behaviour. Consistent with and in support of the themes of these two
definitions, Hoecklin (1995, pp.24-25) defined culture as a “shared system of meanings;
relative, learned; (and) about groups”. A similar but more parsimonious definition was
proposed by Hofstede & Hofstede (2005, p.4) as “culture is the collective programming of
mind that distinguishes the members of one group or category of people from another”. In
85
addition, he named culture as “mental programming, software of the mind”. Hence,
without contentions, it is argued that culture is a learned way of life that shares and shapes
individuals’/groups’ attitudes, values and practices, and gives them a separate identity to
differentiate themselves from other member groups.
2.12.2. Layers of culture
According to Hofstede (1980), several layers of cultural programming exist which
encompass the range of cultures operative on an individual’s behaviour. Indeed,
establishing a precise definition of culture remains contentious due to lack of its
understandibility at different levels, ranging from individual to the national level
(Karahanna et al., 2005). The importance of different layers within cultures can be
understood from two famous definitions presented by Kroeber & Kluckholn (1952) and
Triandis (1972).
According to Kroeber and Kluckholn (1952, p.86), culture is defined as “patterned ways of
thinking, feeling and reacting, acquired and transmitted by symbols, constituting the
distinctive achievements of human groups, including their embodiments in artifacts; the
essential core of culture consists of traditional (i.e., historically derived and selected) ideas
and especially their attached values”.
Whereas according to Triandis (1972, p.4): “[subjective] culture is defined as individual’s
characteristic way of perceiving the man-mad part of one’s environment. It involves the
perception of rules, norms, roles, and values, is influenced by various levels of culture such
as language, gender, care, religion, place of residence, and occupation, and it influences
interpersonal behaviour”.
Based on the above two core assumptions, Hofstede & Hofstede (2005) described culture
as an onion that can be peeled, layer by layer, to reach the core. According to Hofstede, the
outer layer represents symbols such as words, colours and the behaviour of others that may
have special meaning; the second layer represents heroes who are example of admiration
and can be representative of model behaviour; the third layer represents rituals; and finally,
the fourth layer represents social values such as respect and greetings between people.
According to the author, symbols, heroes and rituals can be measured just by observations;
however, values are more difficult to understand due to higher invisibility/inconsistency
within society/groups (ibid). In a similar vein, specifically within information system
research, Karahanna et al. (2005) imparted five levels of culture as: supranational, national,
professional, organisational and group-level cultures (see Table 2.3). According to the
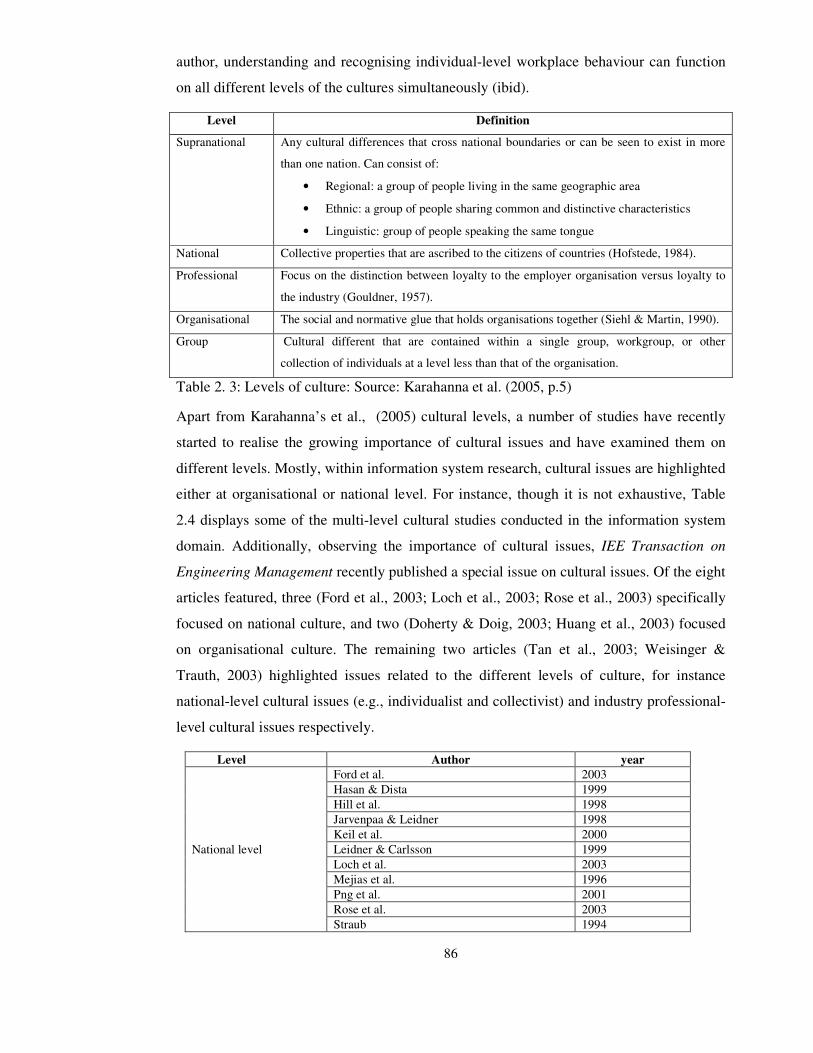
86
author, understanding and recognising individual-level workplace behaviour can function
on all different levels of the cultures simultaneously (ibid).
Level Definition
Supranational Any cultural differences that cross national boundaries or can be seen to exist in more
than one nation. Can consist of:
• Regional: a group of people living in the same geographic area
• Ethnic: a group of people sharing common and distinctive characteristics
• Linguistic: group of people speaking the same tongue
National Collective properties that are ascribed to the citizens of countries (Hofstede, 1984).
Professional Focus on the distinction between loyalty to the employer organisation versus loyalty to
the industry (Gouldner, 1957).
Organisational The social and normative glue that holds organisations together (Siehl & Martin, 1990).
Group Cultural different that are contained within a single group, workgroup, or other
collection of individuals at a level less than that of the organisation.
Table 2. 3: Levels of culture: Source: Karahanna et al. (2005, p.5)
Apart from Karahanna’s et al., (2005) cultural levels, a number of studies have recently
started to realise the growing importance of cultural issues and have examined them on
different levels. Mostly, within information system research, cultural issues are highlighted
either at organisational or national level. For instance, though it is not exhaustive, Table
2.4 displays some of the multi-level cultural studies conducted in the information system
domain. Additionally, observing the importance of cultural issues, IEE Transaction on
Engineering Management recently published a special issue on cultural issues. Of the eight
articles featured, three (Ford et al., 2003; Loch et al., 2003; Rose et al., 2003) specifically
focused on national culture, and two (Doherty & Doig, 2003; Huang et al., 2003) focused
on organisational culture. The remaining two articles (Tan et al., 2003; Weisinger &
Trauth, 2003) highlighted issues related to the different levels of culture, for instance
national-level cultural issues (e.g., individualist and collectivist) and industry professional-
level cultural issues respectively.
Level Author year
National level
Ford et al. 2003
Hasan & Dista 1999
Hill et al. 1998
Jarvenpaa & Leidner 1998
Keil et al. 2000
Leidner & Carlsson 1999
Loch et al. 2003
Mejias et al. 1996
Png et al. 2001
Rose et al. 2003
Straub 1994
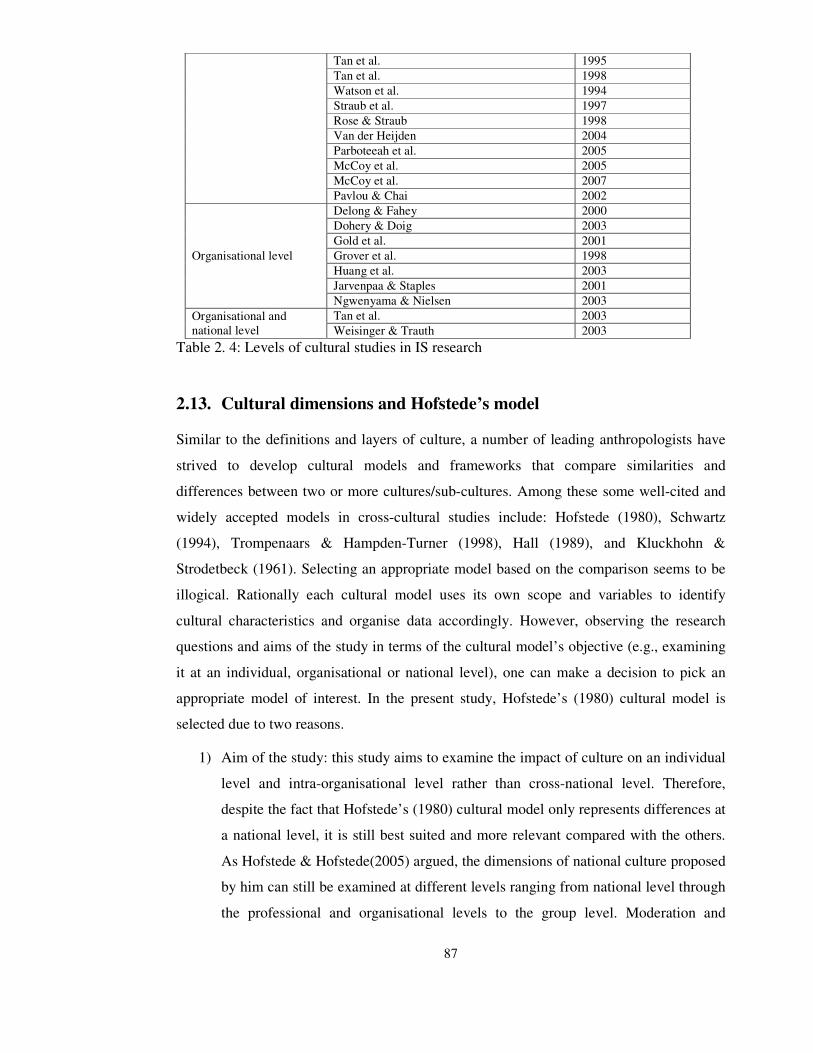
87
Tan et al. 1995
Tan et al. 1998
Watson et al. 1994
Straub et al. 1997
Rose & Straub 1998
Van der Heijden 2004
Parboteeah et al. 2005
McCoy et al. 2005
McCoy et al. 2007
Pavlou & Chai 2002
Organisational level
Delong & Fahey 2000
Dohery & Doig 2003
Gold et al. 2001
Grover et al. 1998
Huang et al. 2003
Jarvenpaa & Staples 2001
Ngwenyama & Nielsen 2003
Organisational and national level
Tan et al. 2003
Weisinger & Trauth 2003
Table 2. 4: Levels of cultural studies in IS research
2.13. Cultural dimensions and Hofstede’s model
Similar to the definitions and layers of culture, a number of leading anthropologists have
strived to develop cultural models and frameworks that compare similarities and
differences between two or more cultures/sub-cultures. Among these some well-cited and
widely accepted models in cross-cultural studies include: Hofstede (1980), Schwartz
(1994), Trompenaars & Hampden-Turner (1998), Hall (1989), and Kluckhohn &
Strodetbeck (1961). Selecting an appropriate model based on the comparison seems to be
illogical. Rationally each cultural model uses its own scope and variables to identify
cultural characteristics and organise data accordingly. However, observing the research
questions and aims of the study in terms of the cultural model’s objective (e.g., examining
it at an individual, organisational or national level), one can make a decision to pick an
appropriate model of interest. In the present study, Hofstede’s (1980) cultural model is
selected due to two reasons.
1) Aim of the study: this study aims to examine the impact of culture on an individual
level and intra-organisational level rather than cross-national level. Therefore,
despite the fact that Hofstede’s (1980) cultural model only represents differences at
a national level, it is still best suited and more relevant compared with the others.
As Hofstede & Hofstede(2005) argued, the dimensions of national culture proposed
by him can still be examined at different levels ranging from national level through
the professional and organisational levels to the group level. Moderation and
88
justification within Hofstede’s theory for examining differences at an individual
level are presented in section (2.16).
2) Wide acceptance of Hofstede’s dimensions: in the last two decades, Hofstede’s
(1980) cross-cultural research and dimensions gained an extensive and wide-
ranging audience across the diverse research context. For instance, a review of his
citation work published after 1994 reports that 274 citations used his dimensions as
a framework, 61 citations replicated his work, and more than 1,000 citations cited
his work (Sondergaard, 1994). According to Ford et al. (2003), Hofstede’s original
work (1980) ‘Cultures and Consequences’ has been cited more than 1,700 times in
the social sciences citation index (SSCI). Academic disciplines citing his work
range from international management to accounting, IT acceptance to information
system evaluation, organisational behaviour to marketing, education to health, and
economics to law (Baskerville, 2003). Therefore, the results obtained using
Hofstede’s cultural dimensions for the present study will be easier and more
reliable to generalise compared with other cultural theories and models.
Originally, Hofstede’s (1980) cultural work was based on the conceptualisation of
‘national culture’ which, according to Clark (1990), is the representation of patterns and
personality characteristics observed among people of the same nation. Hofstede (1980)
mentioned that culture is at the centre of human nature and personality. He argued that
human nature is different from culture because it is innate to oneself from its gene which is
the same universally. Additionally, Hofstede said that personality is different from culture
because it is a combination of characteristics innate in oneself and inherited from his/her
ancestors as well as those one has learned from the social environment that are related to
the single individual. In other words, Hofstede explained culture as a shared process
among a group of people learned from the social environment that is neither fully innate
from family, nor is specifically learned from society.
To develop the cultural theory, Hofstede (1980), from 1967 to 1973, while working for
IBM, conducted a very large-scale survey called the ‘value survey module’ (VSM). The
questionnaires were prepared in English and then translated into other languages as
needed. There were a total of 66 questions measuring the psychological characteristics of
people from different cultural groups working in IBM. Specifically, 44 questions were
related to personal goals and beliefs, 14 questions were related to awareness of the work
environment, one to satisfaction, and the rest related to demographic characteristics. He

89
distributed 116,000 questionnaires in 50 countries around the world and received 60,000
responses. From the data collected and analysed, Hofstede found that 32 questions were
loaded into four dimensions of factor analysis with representation of 40 countries’ mean
scores. Based on the results, Hofstede argued that differentiation between cultures should
be based on four dimensions: Power Distance (PD), Individualism/Collectivism (IC),
Uncertainty Avoidance (UA), and Masculinity/Femininity (MAS). A brief overview of
each dimension is given below, whereas some of the Western developed countries and
Asian developing countries’ comparative index scores are given in Table 2.5.
Country
Cultural dimensions score
Power Distance (PD) Individualism (IC) Masculinity (MAS) Uncertainty
Avoidance (UA)
Pakistan 55 14 50 70
Arab countries 80 38 53 68
India 77 48 56 40
Japan 54 46 95 92
Taiwan 58 26 45 69
Malaysia 104 17 50 36
United States 40 91 62 46
Canada 39 80 52 60
Great Britain 35 89 66 35
Israel 13 54 47 81
Austria 11 55 79 70
Table 2 5: Hofstede’s cultural dimensions score: Source: adopted from Hofstede & Hofstede (2005)
2.13.1. Power Distance
Power Distance (PD) is defined as “the extent to which the less powerful members of
institutions and organisations within a country expect and accept that power [is] distributed
unequally” (Hofstede & Hofstede, 2005 p.46). In essence, it is a way of evaluating a
subordinate’s perception of the power between him and his superior, or the perception of
the preferences/experiences perceived by an individual of their work environment (e.g.,
fear of problems occurring and sharing with colleague or autocratic nature of supervisor).
According to Hofstede (1980), in countries that scored low on PD, employees were less
dependent on their boss and colleagues. Consequently, there is a greater sense of freedom
and everyone is free to express and share in the decision-making process. The management
hierarchies in low PD countries are flatter and more open to questioning. Additionally,
privileges for the senior ranks are undesirable, and superiors are expected to be accessible
to subordinates. According to Hofstede (1980), countries that score low on PD included
Israel, Austria, Great Britain, USA, and Canada (13, 11, 35, 40, and 39 respectively).
On other hand, in countries that scored high on this dimension, employees were more
afraid of expressing disagreement with their higher level manager or boss (Hofstede &

90
Hofstede, 2005). Consequently, a wide emotional distance is established between
subordinate and boss, which in turn creates situations where either subordinates completely
obey their boss’ orders or, in the worst case, completely reject them. One of the reasons for
this emotional disparity is that people in higher PD cultures are more comfortable with
centralised power, and management and superiors are highly privileged and have the last
say (Pavlou & Chai, 2002). According to Hofstede (1980), countries that score higher on
PD include Malaysia, Arab countries, Guatemala, and Slovakia (104, 80, 95, and 104
respectively).
2.13.2. Individualism and Collectivism
Individualism and collectivism (IC) is defined as “Individualism pertains to societies in
which the ties between individuals are loose: everyone is expected to look after himself or
herself and his or her immediate family. Collectivism, as its opposite, pertains to the
societies in which people from birth onward are integrated into strong, cohesive in-groups,
which throughout people’s lifetimes continues to protect them in exchange for
unquestioning loyalty” (Hofstede & Hofstede, 2005 p.76). In simple words, individualism
is the degree to which people feel responsible for themselves and/or their immediate
family. In the context of working goals, individualism is associated with personal time,
freedom, challenges; whereas collectivism is associated with training, physical conditions,
and use of skills (Hofstede, 1980). Hofstede (1980) found that in countries that score high
on individualism such as US, Britain, and Canada (91, 89, and 80 respectively), people
were more disposed towards self-orientation, self-motivation and encouraged by their own
perceptions. Additionally, people in these countries were working for their own interest
and gave less/no importance to the organisation’s interest (Hofstede, 1984). McCoy et al.
(2007) reported that people with an individualist nature always make their decisions
according to their own choice and are less or not affected by others’ suggestions and
considerations. On the other hand, in countries which scored lower on individualism such
as Pakistan, Arab countries and Guatemala (14, 38 and 6 respectively), people gave a
higher interest to groups or organisations compared to their own personal beliefs
(Hofstede, 1984). In these societies decisions are not made on an individual basis but are
likely to be considered with the sharing and helping of other colleagues (McCoy et al.,
2007).
91
2.13.3. PD vs. IC
During the analysis, Hofstede & Hofstede (2005) noted an interesting point: the two
dimensions, PD and IC, shared points of similarities between the indexes scores culturally
allocated to each country. By plotting a graph, the x-axis represents the PD index from
small to large and the y-axis represents the IC from low to high. Hofstede found that
countries which scored high on the PD index were scored low on IC in the quadrant, e.g.,
Pakistan, India, Japan, and Bangladesh etc. On the contrary, countries with low PD were
largely found to be high on individualism in the quadrant, e.g., US, Australia, Britain and
Israel. Hofstede & Hofstede (2005, p.82) reported this relationship with caution in that two
dimensions of culture, PD and IC, are negatively correlated with each others, so that large-
PD countries are likely to be more collectivist, and small-PD countries are more likely to
be individualist on cultural indices.
2.13.4. Masculinity\Femininity
Hofstede & Hofstede (2005) differentiated masculinity and femininity (MAS) as separate
to the gender trait (male or female) on the basis of work goals and quality of life. For
instance, masculine values reflect more assertiveness and material success as opposed to
feminine values, which give more emphasis to quality of life goals, nurturing, and modesty
(Hofstede, 1980). Hofstede (1980) defined working goals as: emphasis on earnings,
recognition, advancement, challenge, greater work centrality, and achievements defined in
terms of wealth. In contrast, he defined quality of life as: placing greater focus on
cooperation, employment security, a friendly atmosphere, an environment where work is
less central, and finally, achievements as defined in terms of human contacts. According to
Hofstede (1980), the first set of values is related to masculine individuals, whereas the
second is related to feminine individuals. Based on these social roles, Hofstede & Hofstede
(2005, p.120) defined two groups of people forming two different cultures as:
“a society is called masculine when emotional gender roles are clearly distinct: men
are supposed to be assertive, tough, and focused on material success, whereas
women are supposed to be more modest, tender, and concerned with the quality of
life.” Whereas, “a society is called feminine when emotional gender roles overlap:
both men and women are supposed to be modest, tender, and concerned with the
quality of life.”
Hofstede (1980) found that countries like Japan, Austria and Mexico scored higher on the
MAS index (95, 79, and 69 respectively) and men were mostly found to be more assertive,
92
tough and materialistic at work, while women were found to be modest, tender and
concerned with quality of life. Hofstede found that countries like Sweden, Norway, and the
Netherlands scored lower on the MAS index (5, 8, and 14 respectively) and both men and
women were modest, tender and concerned with quality of life. Interestingly, he found that
most of the South Asian countries like Pakistan, India and Arab had a modest level of
masculinity (50, 56, and 35 respectively) where people learn how to avoid aggression
rather than how to defend against it. Hofstede (1984) argued that societies that scored high
on masculinity were usually families who encouraged their children towards competition
in society, while in feminine societies families train their younger generations in modesty
and solidarity.
2.13.5. MAS vs. IC, PD, Gender and Age
Despite the fact that the dimensions of masculinity and femininity are independent of
gender traits and both men and women can acquire a masculine/feminine nature (Hofstede,
1980), the literature suggests that men mostly have a masculine nature while women have
a feminine nature (e.g., Bem, 1981; Hofstede & Hofstede, 2005; Venkatesh et al., 2004).
For instance, Bem (1981) in the Sex Role Inventory (BSRI), during an examination of the
psychological characteristics of men and women, found that men displayed more
masculine traits (e.g., assertiveness) compared with women who exhibit more feminine
traits (e.g., nurturing). Related to gender, age is also considered to be part of the masculine
dimension (Venkatesh et al., 2004; Hofstede & Hofstede, 2005). For instance, Hofstede
(1980), during an examination of cultural dimensions, noticed a higher ratio of men
compared to women in countries which scored higher on the masculine index (e.g., Japan
and Austria). Similarly, from the perspective of age, Hofstede found that in early age
people were more focused on career development (a characteristic of masculinity) but as
they grew older they tended to exhibit more social and less ego-oriented (i.e., characteristic
of femininity) behaviour. Hofstede & Hofstede (2005) argued that, particularly in
masculine societies, mostly men are dominant and are pushed by society to work, while in
feminine societies both men and women are socialised to be ambitious.
To examine the interrelated effect of one dimension with another, Hofstede & Hofstede
(2005) plotted a graph between the MAS and IC indices, and the MAS and PD indices.
From the masculinity and individualism results, the author found that countries which
scored higher on the MAS index (e.g., Australia, Britain and the US) were found in the
quadrant with a higher value of IC. Similarly, within the masculine and power distance
93
plot, countries which scored higher on the MAS index (e.g., Japan, Venezuela and Mexico)
were found in the quadrant with a lower value of PD. Hence, from these two graphs it can
be inferred that cultures which are mostly higher on MAS also tend to be higher on IC and
PD. However, reporting results based on this assumption requires caution (Hofstede &
Hofstede, 2005) because this case is not generalised for all the countries examined by
Hofstede.
2.13.6. Uncertainty Avoidance
Uncertainty Avoidance (UA) is defined as “the extent to which the members of culture feel
threatened by ambiguous or unknown situations” (Hofstede & Hofstede, 2005 p.167). In
strong uncertainty avoidance cultures, individuals usually feel threatened by unknown or
uncertain situations (Srite & Karahanna, 2006). Consequently, to reduce the level of
uncertainty in these cultures, individuals tend to rely on certain rules and favour more
stability at work and in their lives in general (Parboteeah et al., 2005). In cultures that are
high on UA, employees working in organisations never consider breaking company rules
even if they know that doing this would be in the firm’s best interest (McCoy et al., 2007).
Hofstede (1980) related UA with the tolerance effect and stated that within cultures that are
high on UA, individuals possess less tolerance compared with cultures low on UA.
On the contrary, within cultures low on UA, individuals have higher levels of tolerance,
experimentation and/or innovative behaviour; consequently, they are more open to taking
risks. Additionally, he argued that feelings of uncertainty are not developed personally by
individuals, however, they are also partially shared by the other members of society. In the
workplace, job stress and anxiety (the state of being worried about what may happen) were
the main reasons for the creation of a higher UA culture (ibid). Hofstede (1980) found that
countries like Greece, Portugal and Japan scored high on UA (112, 104, and 92
respectively) and people in these cultures were mostly psychologically characterised by a
higher tendency to stay with the same employer, display higher average seniority in jobs,
and show higher loyalty to the organisation. On the contrary, in countries like Singapore,
Sweden and China, which scored low on UA (8, 29, and 30 respectively), mostly people
had less anxiety about future policies and outcomes, and less aggression and emotions
were displayed. Finally, countries like Pakistan, Taiwan and Arab nations were found to
have a medium to high level of UA (70, 69 and 68 respectively).
94
2.13.7. UA vs. MAS
During analysis, Hofstede & Hofstede (2005) also examined the interrelated effects of
masculinity and UA dimensions. By plotting a graph where the x-axis represents MAS
from low to high, and the y-axis represents UA from high to low, the author found that
countries which scored higher on the MAS index were found in a quadrant with lower UA
values (e.g., Sweden, Denmark, and Norway). On the other hand, countries which scored
low on MAS were found in the quadrant with low UA (e.g., Japan, Greece, and Poland).
Hence, with caution, it can be inferred that cultures representing high UA also present high
on MAS.
2.13.8. Long-Term and Short-Term Orientation
Based on recent research on Chinese culture, Hofstede & Hofstede (2005) introduced a
fifth dimension: long vs. short-term orientation (LTO). The new dimension has not been
widely adopted in recent literature due to unreliable and validated measures (Spector et al.,
2001). Therefore, this dimension is not added to the present study to evaluate the cultural
consequences of the adoption behaviour. However, for the purposes of knowledge-sharing,
a brief overview is presented. Hofstede & Hofstede (2005, p.210) defined long-term
orientation (LTO) as the “fostering of virtues oriented toward future rewards – in
particular, perseverance and thrift”. Its opposite is short-term orientation which is defined
as the “fostering of virtues related to the past and present- in particular, respect for
tradition, preservation of ‘face’, and fulfilling social obligations”.
According to Pavlou & Chai (2002), people in cultures with high LTO respect more and
feel free to put off decision-taking until they are comfortable with the results. Furthermore,
in LTO the future is represented by values, such as ordering a relationship by status and
observing that order, whereas in short-term orientation, the future culture is represented by
values such as personal steadiness and stability, saving face, respect for tradition,
reciprocation of greetings, favours and gifts (ibid).
2.14. Critiques of Hofstede’s cultural theory
As discussed in the previous section, Hofstede’s work is adopted in the present study due
to its acceptance by an extensive and wide-ranging audience across the diverse disciplines.
Part of this popularity may be due to the simplicity of the dimensions and their link with
management practices. In addition, Hofstede’s model is based on a short and easily
administrated questionnaire which provides scores for each of the dimensions he proposes.

95
Despite the fact that Hofstede’s research in culture studies is one of the paramount works,
it is criticised by a number of researchers (e.g., Spector et al., 2001; McCoy et al., 2005;
McSweeny, 2002; Triandis, 1993). Three criticisms which are overtly observed of
Hofstede’s work are given as follows.
First, Hofstede’s work has been criticised due to the lack of in-depth examination of
culture. For instance, Walsham (2002, p.373) criticised Hofstede’s approach as “rather
crude and simplistic”, which fails to examine or provide insights into the richness and
depth of culture. According to Walsham (2002), Hofstede’s model perceives culture as a
static phenomenon, whereas in reality the nature of culture is reflexive and changes with
the passage of time. This argument was levelled by Baskerville (2003), who proposed a
more qualitative or active theory based on approaches to examine the depths of the culture.
Relevant to the first criticism, Triandis (1993) criticised Hofstede’s work on a limited
number of dimensions and their tendency to generalise a whole culture. For instance, he
argued that dimensions like masculine-feminine in terms of egalitarianism need to be
avoided for the sake of gender neutrality and could be replaced with ‘communal/agenetic’
(ibid).
The second criticism observed of Hofstede’s work is based on its methodology, which
includes poor sample selection, single context of the study, and currency of findings to be
generalised. For instance, McSweeny (2002) criticised Hofstede’s work over its reliance on
a single organisation (i.e., IBM) with a very selective population. Similar criticism was
noted by Holden (2002) and Shanks et al. (2000), who argued that Hofstede’s study only
represents the culture of a single organisation, IBM, and can not necessarily be translated
into other organisations or work patterns. From the results of the currency perspective,
McCoy et al., (2005) argued that Hofstede’s data is out-dated, as it was collected more than
30 years ago and the world has changed significantly over that period, therefore it is likely
that values of national culture are stable no more.
Finally, Hofstede’s work is heavily criticised due to its measurement items and their
statistical validity. For instance, Walsham (2002) and McSweeny (2002) argued that
despite Hofstede’s claim that his work represents aggregated differences between social
and national cultural values, in reality he did not provide links between cross-cultural
contradictions and conflicts. Rationally, Hofstede’s indices were only measuring central
tendency (i.e., mean) in the sample (nation), which largely ignores divergence in individual
answers within the same culture (ibid). Statistically, the weaknesses of Hofstede’s scale
96
when examining individual-level differences were also revealed by Spector & Cooper
(2002) and McCoy et al. (2005). Both authors found that Hofstede’s scale produced poor
internal consistency and reliability when cultural differences were examined at individual
level or even at organisational level. In reply to the measurement items’ criticism, Hofstede
& Hofstede (2005) admitted that his scale might produce poor reliability scores at an
individual level because the scales were originally designed for comparing country-level
scores.
Despite the criticism of Hofstede’s work, it continues to be cited and replicated with
alternative ways of conceptualising the culture (Brwon & Buys, 2005). In doing so, the
alternative approach to overcoming the limitations of Hofstede’s theory and its adoption in
the present study is discussed in section (2.16).
2.15. Hofstede’s cultural theory and IT acceptance
With the assumption that cultural diversity is pervasive and can exert an effect on the
predictably of technology acceptance behaviour, a number of researchers within the
information system field have started to investigate and address the cultural issues which
might cause the failure of IT acceptance across the cultures (e.g., Straub et al., 1997; Rose
& Straub, 1998; McCoy et al., 2005; Alsajjan & Dennis, 2010). In this line of research, the
influence of Hofstede’s proposed dimensions of national culture is very common and
observable (Ford et al., 2003). Therefore, in order to assess the impact of Hofstede’s
cultural dimensions on the predictors of IT acceptance, this section categorises the
discussion of the previous citations into three groups:
1. Citations which incorporated and examined the impact of Hofstede’s dimensions
within the same culture.
2. Citations which incorporated and examined the impact of Hofstede’s dimensions
across the cultures.
3. Citations which did not incorporate Hofstede’s dimensions but examined their
results across the cultures with the help of Hofstede’s country-level cultural scores.
In the first group of citations, only a handful studies examined the impact of Hofstede’s
cultural dimensions on an individual’s acceptance behaviour. In this group, researchers are
specifically interested in examining an individual’s gender-based differences of technology
acceptance behaviour in relation to Hofstede’s masculinity-femininity (MAS) dimension.
Out of this few, one of the key studies is Venkestesh et al. (2004), who examined the
97
impact of gender in terms of MAS on the construct of TPB. Using Bem’s (1974) Sex Role
Inventory (BSRI) scale to measure the individuals’ differences, Venkatesh et al. (2004)
found that masculine-type individuals exhibited the same patterns as men in previous
research; however, feminine-type individuals were different from women in that they were
influenced only by SN and PBC. Even though Venkatesh et al. (2004) did not use
Hofstede’s cultural dimensions directly due to their limited applicability at individual level,
the results of the study were imperative in terms of highlighting cultural impact on
acceptance behaviour.
The second group of citations which directly incorporated Hofstede’s cultural dimensions
and examined them across the countries also includes a very limited number of studies
within the information system domain. Out of many, a discussion of a few noteworthy
studies (Parboteeah et al., 2005; Srite & Karahanna, 2006; Hasan & Dista, 1999; Pavlou &
Chai, 2002; McCoy et al., 2005) is presented due to their relevance to the present study. In
this line of research, using an interpretive case study, Hasan & Dista (1999) examined four
dimensions of Hofstede’s cultural theory (PD, IC, MAS, UA) within ten organisations
across the Middle East, Africa and Australia. Focusing on the technology transfer outcome,
authors found that: adoption of IT was slower in risk-hesitant countries i.e., with high UA
(e.g., Middle East and Africa); adoption was higher in cultures where IT staff and mangers
were in continuous sharing i.e., with low PD (e.g., Australia); specifically, the adoption of
group-oriented applications was favoured by collectivist cultures (e.g., Middle East and
Africa), and finally, patterns of IT adoptions were varied according to the level of
masculinity (technology focused) vs. femininity (people and end-user focused). Hasan &
Dista’s results were quantitatively echoed by Parboteeah et al. (2005), who examined the
impact of the three cultural dimensions (IC, UA, MAS) on the perception of usefulness
(PU) to accept the technology. Covering 24 nations with a sample of 26,999, Parboteeah et
al. (2005) found that there was a negative relationship between IC and UA on PU and a
positive relationship between MAS and PU.
Apart from the direct impact of culture on the individual’s technology acceptance
behaviour, fewer studies also examined the indirect impact (i.e., moderator). For instance,
using the US and Uruguay sample, McCoy et al. (2005) examined the impact of the four
cultural dimensions (IC, UA, MAS, PD) on the modified version of the TAM. The results
revealed that culture played an inchoate moderating impact so that the impact of PBC on
BI was strongly observed in the Uruguay sample as compared with the US sample.
However, contrary to expectations, the author did not find any significant difference
98
between the relationships of PU, PEOU, and SN on BI in both countries (ibid). In a similar
line of research, Srite & Karahanna (2006) examined the moderating impact of the four
cultural dimensions (IC, UA, MAS, PD) between the PU, PEOU and SN on BI. Using 30
countries and a sample of 223, the authors found a negative moderating impact of MAS
and PD between SN and BI, and a positive moderating impact of UA between SN and BI.
Similarly, Pavlou & Chai (2002) examined TPB in the US and China sample, and found
that cultural dimensions (PD, IC, UA, and long-term orientation) played a significant
moderating impact on the individual’s perception to accept the e-commerce behaviour.
Specifically, the model explained higher variance (77%) in Chinese culture (i.e.,
collectivist) compared with the US culture of 33% (i.e., individualist). Pavlou & Chai
(2002) found that beliefs such as SN and SI were strongly observed in Chinese culture
compared with the US, which in turn perceived higher importance of the PBC on
behavioural intention. In comparison with Korean and US culture, Choe & Geistfeld
(2004) examined the moderating impact of two cultural dimensions (IC and UA) on the
individual’s behaviour to adopt the e-commerce behaviour. The authors found that the
cultural dimension UA played a significant moderating impact, so that the impact of
perceived risk (PR) was strongly observed only in Korean culture, whereas SE was only
significant in US culture. The authors did not find any significant difference between the
two countries based on the moderating impact of IC (ibid).
The third group of the citations, which includes a very large number of the studies, aims to
examine the robustness of technology acceptance models across the context of two or more
countries. The core objective behind these studies is that studies predicating technology
acceptance behaviour have largely been conducted within North America and specifically
within a single country, that is, the US (e.g., Venkatesh & Morris, 2000; Venkatesh et al.,
2004). Therefore, their validity and reliability is questionable when re-examined outside
the US (Straub et al., 1997; Abbasi et al., 2010). In this stream of the research, the
replication of technology acceptance models is widely observed in a diversified context.
For instance, within e-commerce and e-service (e.g., Jarvenpaa et al., 1999; Seyal et al.,
2004; Hsu & Chiu, 2004), in Internet-banking (e.g., Shish & Fang, 2004), in broadband
Internet use and adoption (e.g., Oh et al., 2003; Choudrie & Lee, 2004; Khoumbati et al.,
2007; Seyal et al., 2002, 2003), in healthcare (e.g., Wu et al., 2007), and in email and
academic use (e.g., Struab et al., 1997; Hu et al., 2003). Predominantly, previous studies
outside the US justified their results by discovering similarities and differences between
the native country’s cultural indices proposed by Hofstede (1980), with the studies
99
conducted in a US context. Surprisingly, most of these studies did not directly measure
cultural dimensions (e.g., Straub et al., 1997), which leaves a gap in understanding
individual-level differences of acceptance behaviour. Despite the fact that most of these
studies found a significant difference between the models evaluated in a US and non-US
context, their discussion and importance is not relevant to the present context of the study.
Reasonably, the present study not only aims to examine the inherent cultural biasness
within models of technology acceptance behaviour but it also intends to examine the
individual-based differences that lie within the same culture. Therefore, the present study
only intends to focus on those studies which, directly or indirectly, incorporate Hofstede’s
dimensions.
The only study relevant to the discussion in the third group of citations is Straub et al.
(1997). Arguably, Straub et al.’s (1997) study is one of the pioneering studies which
explores inherent bias within the TAM and is one of the most widely cited studies within
cross-cultural research (449 on Google Scholar to date). It is one of the most important
studies that emphasises the need to incorporate Hofstede’s dimensions so that individual-
level cultural differences may be examined towards predicting technology acceptance
behaviour. Straub et al. (1997) examined the TAM in Japan, Switzerland and the US and
found that the TAM produced similar variance (R2) in the explanatory power of
behavioural usage in both the US and Switzerland (10%), but was very different in Japan
(only 1%). Straub et al. (1997) justified these results with Hofstede’s dimensions and
argued that Japanese culture tends towards greater power distance, collectivist sentiments
and higher uncertainty avoidance, which may limit their Internet usage and disassociate
from the intention to accept. Such results are justified because Davis, at the time of the
TAM development (Davis, 1989), did not consider its un-biased reliability in cross-cultural
settings.
2.16. Modification and adoption of Hofstede’s dimensions in the present
study
In contrast with the previous studies based on Hofstede’s conceptualisation (see previous
section 2.15 presenting three groups of citations), this study intends to examine cultural
differences at the individual-level using the Dorfman & Howell (1988) scale. It is argued
that prior research based on Hofstede’s conceptualisation and scores based on the value
survey module (VSM) were inadequate in explaining individual-level cultural differences.
The reasons are plausible. Hofstede defined culture as: “collective programming of mind
100
that distinguishes the members of one group or category of people from others” (Hofstede,
1994 p.4), thus, Hofstede’s theory is irreducible for representing individuals’ perceptions.
Also, the scores presented by Hofstede (1980) were based on the reflection of the mean
response at a country-level rather than individuals’ response. Hofstede himself warned that
his scores represent a country-level analysis that cannot be interpreted at individual level
(cf. McCoy et al., 2005). For example, when Hofstede examined the correlation between
three items measuring power distance (PD), they were significant at the country level but
at an individual level they were almost zero (Hofstede, 1984 p.76). In addition to the
individual-level analysis criticism of Hofstede’s scale (e.g., Dorfman & Howell, 1988) and
its dimensions (McSweeney 2002), it is also criticised for its appropriateness (in terms of
validity and reliability) with regard to the passage of time which elapsed, that is, more than
three decades (McCoy et al., 2005). For instance, when McCoy et al. (2005) re-examined
Hofstede’s dimensions in the US and Uruguay, they found differences at country-level
scores devised by Hofstede (1980) (see detailed critiques in section 2.14). Hence,
incorporating Hofstede’s measures direct into models of individual-level acceptance
behaviour is impractical and requires strong rhetorical justification as well as a re-
consideration of the measurement instrument.
2.17. Context of the study
Besides revisiting a variety of research models and theories within the IT acceptance
domain (see 2.1 to 2.11 sections), and the impact of cultural dimensions on predictors of IT
acceptance behaviour (see 2.12 to 2.16 sections), one of the objectives of this study is to
explore the non-cultural bias of the extended model within the context of developing
countries. Arguably, in the previous section, it was noticed that employing the original
TAM or models based on the TAM’s conceptualisation, proved to be reliable across the
technologies, context and time of evaluation, however, these models presented a weakness
of cultural bias and do not serve equally across the cultures (e.g., Straub et al., 1997; Rose
& Straub, 1998; McCoy et al., 2005; Baker, Al-Gahtani & Hubona, 2010). Furthermore,
these studies were largely constrained within the North American and Western cultural
context or a few Asian-Pacific developing countries (e.g., South Korea, Taiwan, China),
which limits their generalisability across the developing and IT-developing countries’
context e.g., South Asia. Finally, apart from the cross-cultural differences at national level,
it was noticed that few studies examined diversities at an intra-cultural level (within the
same nation or even in organisations) (e.g., Honold, 1999). Taking these limitations into
consideration in the present study, the diversity of an individual’s acceptance behaviour is

101
examined at an individual level within the context of a single South Asian developing
country (i.e., Pakistan) in a single organisational context level (i.e., the higher education
system). In doing so, a brief overview of the country profile with justifications for the
selection is discussed in the next few sections.
2.17.1. Country profile
In order to gather data and address the gaps above, the context of the study is selected as
Pakistan, which is located in South Asia and is also part of the greater Middle East (Gov.
Pak, 2009). Pakistan is the sixth most populous country in the world and third out of the
Muslim countries (World Bank, 2009). The country occupies 796,095sq.km with a
population of 132.35 million (population census 1998) (Gov. Pak, 2009). According to the
economic survey 2007-2008 published by the Ministry of Finance in Pakistan (Finance
Pak, 2010), the estimated population at present is 160.9 million with a growth rate of
1.80%; GDP is US$168.28 billion with an annual growth rate of 5.95%. The male and
female literacy rate is 67% and 42% respectively, and the life expectancy rate for men and
women is 64% and 66% respectively.
The dramatic rise in population resulted in the rapid growth of large urban areas such as
Karachi, Lahore and Islamabad. Overall, from an economic perspective, Pakistan is still
considered to be a developing country and its economic growth is poor. For instance,
Ministry of Finance statistics for the year 2007-2008 revealed that foreign investment in
the country declined by 32.2% and stood at US$3.6 billion as against US$5.3 billion in the
comparable period of last year. Domestic debt rose to RS. 2610.2 billion, inflation rate
increased 10.3% compared with 7.9% in previous year; the budget deficit increased to
US$11.6 billion (6.8% of GDP), and finally the Pakistan currency (rupee), after remaining
stable for more than 4 years, lost significance and depreciated 6.4% against the US dollar
(Finance Pak, 2010). There can be many reasons for poor economic growth, but one of the
most viable is the history of military dictatorship and influential bureaucracy inherited
from British colonial times, which resulted in higher corruption and nepotism in an
organisational context (Galliers et al., 1998). The choice of Pakistan as the context of the
study is due to two main reasons:
1. The social and cultural characteristics of Pakistan are different from North
American and Western countries. Therefore, it is justifiable to generalise the un-
biased validity and reliability of the predictors of individuals’ acceptance behaviour
102
successfully applied in North American and Western countries to a South-Asian
country context.
2. Despite leverage investment by the Pakistan government in IT and
telecommunications industry, compared with neighbouring countries, a lower
acceptance rate is observed. This lower acceptance indicates that just overcoming
the problems of traditional IT acceptance barriers e.g., price, last-mile access, and
lack of speed (e.g., Choudrie & Lee, 2004) are not enough, but there is still a need
to explore the additional factors which may help to encourage and foster Internet
acceptance in developing countries.
2.17.2. Social and cultural characteristics of Pakistan
From a cultural perspective, Pakistan differs from Western culture (see Table 1.1 chapter
1). Similar to other developing countries and Arab countries, Pakistan is moderate on PD
because of its education system, social and government systems, and national wealth
perspective. A higher education system is responsible for establishing middle-class society
(Hofstede & Hofstede, 2005), which in turn gives freedom to individuals to quit social
norms and participate in institutional, managerial and governmental systems. The literacy
rate according to the Pakistan Social and Living Standards Measurement (PSLM) survey
2008-2009 shows that the overall literacy rate (age above 10 years) was 57% (69% male
and 45% female)(Finance Pak, 2010). Therefore Pakistan’s moderate score on PD was to
be expected compared with the North American countries where the literacy rate is near to
100% (e.g., Canada). According to Hofstede & Hofstede (2005), in countries that score
higher on PD, superiors have more power and want to maintain it forcefully. Also their
autocratic nature allows them to implement policies in their interest without knowing the
opinions or ethical values of their subordinates. From the wealth perspective, individuals in
wealthy countries may have fewer dependencies on power to secure higher positions or
have fewer tendencies towards creating powerful groups. According to Hofstede (1980),
wealth is also considered to be a substitute for power satisfaction. In this case, a clear
difference between North American countries and Pakistan is observed. For instance, the
per capita income of Pakistan is only US$1085 of which 61% is paid into foreign debts
(Finance Pak, 2010). In this case, where people are so poor, there are fewer chances to
show reluctance for the unequal distribution of power at society level.
Based on IC, the cultural dimension of Pakistani society is considered to be collectivist
compared with most North American and Western countries. One possible reason is that

103
the country is highly influenced by the religion Islam (98% population) and most people
are conservative in nature. Similar to PD, Hofstede & Hofstede (2005) argued that
individualism and national wealth are correlated with each other. For instance, countries
with a higher per capita (e.g., Denmark and USA) were higher on individualist society
compared with Pakistan which, according to the author, was a poorer country (during 1968
to 1972) and tends to be a more collectivist society.
From the MAS dimension perspective, Pakistan is considered to be moderate on
masculinity. According to Hofstede & Hofstede (2005), age and gender are factors
associated with the nature of MAS culture. Generally, due to religion and lower literacy
rates, Pakistan is a male dominant society but due to the higher female population, it is
rated moderate on the masculine index. Due to this, people in Pakistan mostly resolve their
conflicts by compromise and negotiations rather than strong win egoism, rewards are
distributed on the basis of equality, and more leisure time is preferred over more money.
Finally, from the perspective of UA dimension, Pakistan is rated as middle to higher on the
UA index. According to Hofstede (1980), UA is highly correlated with feelings of stress
and anxiety. Compared to North American countries where a low unemployment ratio is
observed, in Pakistan almost 35% people are reported as unemployed after receiving their
higher level graduate degrees (ADB, 2007). The higher ratio of unemployment or
employment with low wages results in high levels of uncertainty among individuals in
society (Hofstede & Hofstede, 2005). Another reason for Pakistan to score higher on UA is
the influence of religion. For instance, usually people do not plan for the long-term and
avoid taking risks due to a belief in fortune, using the word ‘inshallah’ means ‘if God
wills’; whereas in North America or countries where individuals have less/no effect of
religion, they are more used to plan for decades even though they are not certain that they
will be alive at such a time.
Based on all four dimensions reported by Hofstede (1980), clearly Pakistan’s culture is
distinct from the culture of North American and Western countries. Therefore, within the
perspective of technology acceptance behaviour, expecting similar behaviour from
individuals in Pakistan and North American or Western countries seems to be uncertain,
and requires further study within a real context.
2.17.3. Internet usage in Pakistan and lower penetration rate
According to the Internet world stats, there are 6,767,805,208 Internet users in the world,
out of which 3,808,070,503 are in Asia i.e., 42.6%. Within the top ten Asian countries,

104
Pakistan is ranked eigth, which covers about 18.5% of the total Internet user population. In
2000 there were 133,900 Internet users which reached 18,500,000 in 2009 and the Internet
penetration rate was recorded at 10.6% (Internet World Stats, 2010). According to the
International Telecommunication Union (ITU), the number of Internet users per 100
people in Pakistan reached 11.4 in the year 2008 (ITU, 2009).
Recently the Pakistan Telecommunication Authority (PTA), which is also in charge of
licensing the private sector and foreign investors in the telecoms sector, published facts and
figures regarding current Internet users in Pakistan (PTA, 2010). According to this, by the
year 2007 there were about 3.5 million Internet subscribers, whereas total users crossed the
17 million mark, covering around 3,008 cities connected with base stand. Furthermore, the
PTA statistics shows that at the end of January 2010, broadband subscribers in Pakistan
reached 688,373 with a growth rate of 7% and net addition of 44,481. Compared to only
376,712 users in December 2008, the increase in growth rate is 141% which presents a
remarkable success in this sector. From the broadband penetration perspective, the growth
is also incredible. For instance, it steadily improved and stands at 0.42% from 0.16% in
December 2008 (ibid). According to the statistics of the Pakistan finance division (Finance
Pak, 2010), Pakistan has been ranked sixth in terms of quarterly growth and tenth in terms
of annual growth in the global broadband penetration rate. Table 2.6 depicts the growth
rate of broadband subscribers in Pakistan during 2006 to 2010. The Pakistan
Telecommunication Corporation ltd. (PTCL) and Wateen are the two major broadband
operators in Pakistan, while others like Worldcall, Link dot net, and Link direct are also
catching up fast to provide Internet services to common users at home, software exporters,
educational institutes, universities and corporate clients (Seyal et al., 2004; MOIT.PAK,
2004).
Technology DSL HFC WiMax FTTH EvDO Others Total
2005-06 26,611 26,611
2006-07 44,669 484 45,153
2007-08 102,910 42,760 19,612 2,800 168,082
2008-09 262,661 36,201 88,477 3,967 22,503 413,809
2009-10 476,722 49,110 257,616 5,002 111,194 1,004 900,648
Jul-10 486,409 39,529 261,864 5,255 134,927 1,077 950,594
Aug-10 482,086 39,546 275,490 5,525 146,834 1,113 950,594
Sep-10 488,946 40,127 292,599 5,690 166,407 1,142 950,594
Table 2. 6: Broadband subscribers by technology
Source: Pakistan Telecommunication Authority (PTA, 2010)

105
To increase Internet usage, the government dramatically reduced the costs of bandwidth by
almost 95% (from US$30,000 in the year 2000 to US$3,950 in 2004) specifically for
software companies, educational institutions and call centres (Mujahid, 2002; MOIT.PAK,
2004). However, in comparison with neighbouring countries which share almost the same
culture, the usage rate of the Internet is lower in Pakistan. For example, Iran has a 32%
Internet penetration rate, Saudi Arabia has 29.21%, Malaysia has 62%, UAE has 86% and
Indonesia has a 12.5% Internet penetration rate (ITU, 2009). Table 2.7 presents the PTA’s
comparative Internet and broadband indicators during 2003 between Pakistan and its
neighbours. According to a report (MOIT.PAK, 2004) by the Pakistani Ministry of
Information Technology, the major barriers inhibiting the widespread acceptance/diffusion
of broadband are price, last mile access, and content. For instance, considering only price,
despite the fact that the government reduced the larger costs, it is still higher than in
neighbouring countries. The subscription price for broadband in Pakistan is 60 times
higher than in Korea; if purchasing power is taken into consideration, it is 1,600 times
higher in Pakistan (i.e., in 2004 the per capita GDP of Korea was US $ 17,700 as compared
with $652 in Pakistan (Finance Pak, 2010; MOIT.PAK, 2004).
Parameters Korea Malaysia China India Pakistan
Access
& infrastructure
No. of PCs per 100 78.6 15 2.8 0.8 1.85
No. of cable TVs per 100 persons
43 0 9 6 4.28
No. of fixed telephone lines per 100 persons
49 18.5 16.7 4.5 2.8
No. of mobile phones per 100 persons
68 39.6 16.1 2.4 1.43
Cost of PC (USD) [500] 1,100 600 347
Cost of cable/DSL modem (USD)
60 100 90
Internet usage
GDP (USD Per capita) 10,000 4,000 965 465 480
No. of Internet connections per 100 persons
58 11 2 0.4 0.2
No. of users per 100 persons 59.4 33 5 1 1.4
Average revenue per user from an Internet customer per month (20 hrs, USD)
N/A 10 9 4.5
Broadband
No. of broadband connections per 100 persons
57.5 0.21 1 0.02 0.01
Charges for broadband per month (USD)
30 29 16 20 -
Charges per 100 Kbps per month (USD)
0.25 7.61 3.07 15.63 -
Table 2. 7: World Internet and broadband comparison: Source: PTA(2010)

106
2.17.4. Government IT policies and the higher educational system
After reviewing the country profile, its distinct position within Hofstede’s cultural
dimensions, and overall usage of the Internet, the present section is focused on reviewing
the core context of the study i.e., higher educational institutes of Pakistan and initiatives
introduced by the government of Pakistan to promote IT and the Internet within these
institutions. In doing so, it enables an understanding of the adoption/acceptance of Internet
technology within single organisational settings (i.e., intra-cultural settings that are
different from cross-cultural settings) that is rarely investigated in the literature of the
context of developing countries. The rationale behind selecting educational settings is
consistent with the study of Lewis et al., (2003). According to this, in educational
institutions, the decisions regarding the introduction of technologies and innovations are
determined by top management (e.g., head of institutes and/or higher government
officials). The individuals (i.e., academics within institutes) who utilise technologies in
these institutions are rarely considered and communicated with about such decisions. In
this way, individuals’ requirements, willingness and causes of resistance are over-looked
by higher management, a process which often results in an unrealistic outcome regarding
the usage of technology (ibid). Apart from that, another reason for selecting higher
educational institutes as the context for the study is related to the influence of government
policies. For instance, compared with other organisations, the direct influence of explicit
government policies to promote research productivity is apparent in the education sector.
Finally, with the assumption that IT acceptance behaviour is related to educational
qualifications (Agarwal & Prasad, 1999), selecting the context of the study as higher
educational institutes is the most relevant choice rather than any other e.g., banks, SMEs,
etc.
Given that, observing the overall growth of the Internet within the country (see section
2.17.3), it is obvious that the government of Pakistan started to realise that the Internet can
play a vital role in providing capabilities for organisations to become more productive.
Additionally, the government understands that investment in education and specifically
support of IT and the Internet within education can be a major source of income generation
and alleviation of poverty (MOIT.PAK 2004). However, even realising the importance of
education and IT, unfortunately Pakistan’s standing on investment in this sector is
historically very poor. Spending on education as a percentage of GDP is very low
compared with neighbouring countries, as can be seen in Table 2.8
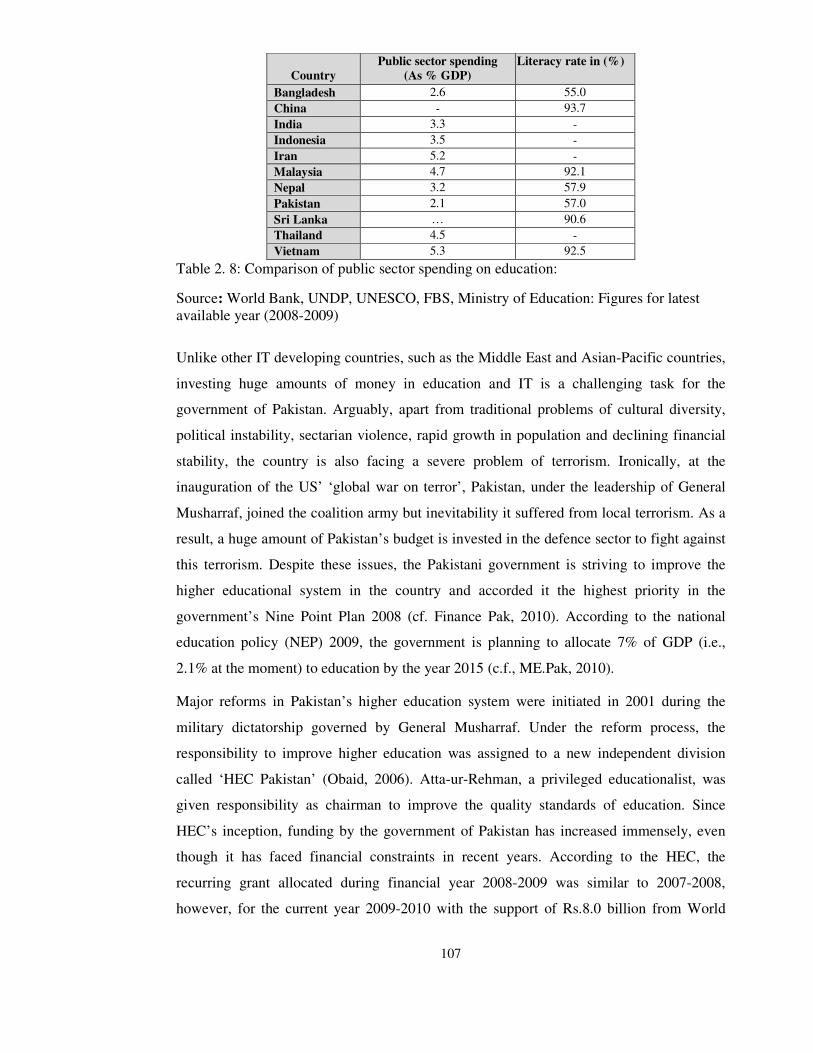
107
Country Public sector spending
(As % GDP) Literacy rate in (%)
Bangladesh 2.6 55.0
China ‐ 93.7
India 3.3 ‐
Indonesia 3.5 ‐
Iran 5.2 ‐
Malaysia 4.7 92.1
Nepal 3.2 57.9
Pakistan 2.1 57.0
Sri Lanka … 90.6
Thailand 4.5 ‐
Vietnam 5.3 92.5
Table 2. 8: Comparison of public sector spending on education:
Source: World Bank, UNDP, UNESCO, FBS, Ministry of Education: Figures for latest available year (2008-2009)
Unlike other IT developing countries, such as the Middle East and Asian-Pacific countries,
investing huge amounts of money in education and IT is a challenging task for the
government of Pakistan. Arguably, apart from traditional problems of cultural diversity,
political instability, sectarian violence, rapid growth in population and declining financial
stability, the country is also facing a severe problem of terrorism. Ironically, at the
inauguration of the US’ ‘global war on terror’, Pakistan, under the leadership of General
Musharraf, joined the coalition army but inevitability it suffered from local terrorism. As a
result, a huge amount of Pakistan’s budget is invested in the defence sector to fight against
this terrorism. Despite these issues, the Pakistani government is striving to improve the
higher educational system in the country and accorded it the highest priority in the
government’s Nine Point Plan 2008 (cf. Finance Pak, 2010). According to the national
education policy (NEP) 2009, the government is planning to allocate 7% of GDP (i.e.,
2.1% at the moment) to education by the year 2015 (c.f., ME.Pak, 2010).
Major reforms in Pakistan’s higher education system were initiated in 2001 during the
military dictatorship governed by General Musharraf. Under the reform process, the
responsibility to improve higher education was assigned to a new independent division
called ‘HEC Pakistan’ (Obaid, 2006). Atta-ur-Rehman, a privileged educationalist, was
given responsibility as chairman to improve the quality standards of education. Since
HEC’s inception, funding by the government of Pakistan has increased immensely, even
though it has faced financial constraints in recent years. According to the HEC, the
recurring grant allocated during financial year 2008-2009 was similar to 2007-2008,
however, for the current year 2009-2010 with the support of Rs.8.0 billion from World

108
Bank funding of HEC, it has increased to Rs.22.5 billion. Figure 2.10 shows how the ratio
of funding in millions increased during 2005-2010.
Figure 2. 10: Ratio of increase in higher education funding: Source: HEC (2009) * Gray portion represents the recurring funds and black portion represents released development funds.
In order to transform Pakistan from an agricultural-based economy into a ‘knowledge
economy’, the HEC in 2005 proposed a policy document for the next 5 years (i.e., 2010)
with the title of ‘medium term development framework 2005-2010’. There were a number
of reforms and strategic plans to improve the education system, but only those that are
relevant to the IT and Internet within the higher educational systems are being discussed
here. According to this report, the government realised the importance of the use of ICT
and the Internet within the higher education context and kept it as a key step for the
strategic vision 2005-10. For instance, according to the report (MTDF, 2005 p.13):
“Modern information and communications technologies (ICT) are key to enhancing
efficiency, efficacy and impact of programmes of development in the higher education
sector. Therefore, ICT must be effectively leveraged to deliver high quality teaching and
research support in higher education both on-campus and using distance education,
providing access to technical and scholarly information resources, and facilitating
scholarly communication between researchers and teachers.”
As part of the ICT strategy in higher educational institutes, HEC suggested four key
objectives:
• To improve the IT infrastructure development inside institutions as well as linkages
of institutions to each other and to the international teaching/research community.
50000
45000
40000
35000
30000
25000
20000 2005‐06 2006‐07 2007‐08 2008‐09 2009‐10 P

109
• To improve research-related services.
• To improve teaching-related services acquisition for provision of quality education
leveraged on technology.
• To improve the online library infrastructure development.
To accomplish these goals, HEC initiated a programme called the ‘Pakistan Education and
Research Network’ (PERN) through which 56 public and private universities were
connected with each other. PERN aims to provide an ideal platform to build an Internet
compatible with a high-speed network that allows real-time transfer of audio and video,
multimedia-enabled lectures, remote research partnerships, and many other applications
hitherto unknown. To bring the PERN into reality, HEC also initiated a computer and
networking programme called ‘e-reform’ for the public sector universities with funds to set
up a high-speed network environment by installing Local and Wide Area Networking
systems (LAN/WAN) (MTDF, 2005). With the help of PTCL, HEC planned to connect all
the universities with fiber-optics and access to at least 34MB Internet connectivity.
Apart from that, HEC also initiated a ‘digital library programme’ which aims to empower
the academics with technology to access high-quality peer-reviewed journals via online
delivery. Finally, HEC recently started one more programme with the title of ‘Pakistan
Research Repository (PRR)’ (HEC PAK, 2009). The PRR aims to promote the
international visibility of the research originated within the institutes of Pakistan. In doing
so PRR provides a facility to submit/download electronic theses published by Pakistani
universities.
Despite these initiatives, the current facts indicate that most of the academics in
educational institutes do not value skills associated with strategic use of the Internet in
their academic and research work. One reason for such an unhealthy improvement could be
the lack of empirical evidence to explore the questions of resistance and advantages of
Internet use within a teaching and research context.
Conclusion
This chapter presented a detailed description and critical review of the theoretical
background to this study. Specifically, in response to the research question posed in the
first chapter, the present chapter sought three main objectives. Firstly, to develop a strong
theoretical basis for the extended model, the most important theoretical models used in
technology acceptance research were reviewed and compared, their limitations and
110
advantages critically examined. The review revealed that predominantly models were
favoured either due to their parsimonious structure with acceptable predictive power (e.g.,
TAM) or their explanatory power (e.g. TBP). A review of the empirical comparisons
between these models showed that the TAM exhibited considerable advantages over others
due to persistent predictive power (i.e., 40%) and its parsimonious structure. The
parsimony of the TAM attracted a number of researchers to extend/replicate the TAM’s
conceptualisation in a diversified field of studies. However, this led to an inherent
limitation in the ability of TAM to extend it beyond its core constructs (PU and PEOU)
into specified fields of investigation. Considering these rationales, in the present study it
was decided to extend TAM beyond its conceptualisation with a number of the constructs
from various models that successfully produced significant results in published literature.
Secondly, this chapter scrutinised the importance of culture on the models predicting
individuals’ technology acceptance behaviour. In doing so, particular emphasis was placed
on Hofstede’s cultural theory (1980). Given that, the literature revealed that the predictors
of technology acceptance behaviour were culturally biased and failed to predict
individuals’ acceptance behaviour outside the context of North American and Western
countries. Surprisingly, it was noticed that most of these studies did not directly (i.e.,
predictor) or indirectly (i.e., moderator) measure the cultural dimensions of Hofstede, and
thus, there is a gap to establish certain links between cultural dimensions and their impact
on understanding individual-level differences of acceptance behaviour. To consider and
overcome this gap in the present study, the impact of cultural dimensions on individuals’
IT acceptance behaviour is examined at an individual-level within the context of a single
developing country.
Finally, this chapter reviewed the specific context of the study i.e., higher educational
institutes of Pakistan. Arguably, it was noted that Pakistan was culturally different from
American and Western countries context. Besides that, it was noted that, despite huge
investment by the government into IT to promote Internet usage, specifically within the
context of higher educational institutes, a very low acceptance/adoption rate was observed
compared with neighbouring countries. This shows that investing in the IT sector without
knowing/measuring individuals’ acceptance behaviour is a waste of resource. Therefore, to
develop better policies to increase the acceptance rate, in the present study it is decided to
examine the predictors of acceptance behaviour that are widely accepted in a US context
and apply them to a developing country context. Based on the review, conceptual
framework is presented in next chapter.

111
Chapter 4
Conceptual framework
Introduction
Achieving the aim of the study this chapter intends to develop the research hypotheses,
which are conceptually related to each other. In order to do so, a detailed review of various
models and the present research on individuals’ acceptance behaviour was undertaken in
the previous chapter. Some considerable differences and limitations were noticed between
the constructs and/or the relations in these models, but a few recurrent themes were
evident. Based on these themes, the theoretical background for the conceptual mode is
devised in section (3.1). Section (3.2) depicts the proposed direct hypothetical relationships
between the thirteen core constructs including: perceived ease of use, perceived usefulness,
behaviour intention, behaviour usage, peer influence, superior influence, resource
facilitation, technology facilitations, self-efficacy, academic tasks, non-academic tasks,
government support, and finally, institute support. With the introduction of moderating
factors in section (3.3), sections (3.4, 3.5, and 3.6) present the influence of seven
demographic and situational moderators (age, gender, education level, organisation type,
academic position, voluntariness and usage experience). Finally, section (3.7) presents the
moderating influence of the four cultural dimensions (power distance, masculinity-
femininity, individualism-collectivism, and uncertainty avoidance) on the predictors of
individuals’ acceptance behaviour.
3.1 Theoretical background
The conceptual framework developed for the present study (see figure 3.1) is drawn from
the various theoretical models explained in chapter 2. From a broad perspective, it is
primarily based on the conceptualisation of social cognitive theory (SCT) (Bandura, 1986).
Applying SCT is relevant to the research question posed in the present study: according to
SCT, there is a consistent reciprocal relationship between environmental factors, personal
factors, and behaviour. Dividing the research question into three parts, conceptualisation of
the first part of research question (examination of predictors that influence individuals’
acceptance behaviour) is consistent with the behaviour in SCT; the second part (exploring
the impact of the demographic characteristics on individuals’ acceptance behaviour) is

112
consistent with the personal factors in SCT; and finally, the third part (exploring the impact
of situational and cultural factors on individuals’ acceptance behaviour) is consistent with
the environmental factors in SCT.
Based on SCT, the framework integrates the determinants from the models: TRA (Fishbein
& Ajzen, 1975), DTPB (Taylor & Todd, 1995a), TAM2 (Venkatesh & Davis, 2000), task
technology fit (Goodhue & Thompson, 1995), and UTAUT (Venkatesh et al., 2003) into
an extended TAM. In addition, the model also incorporates the psychological theory of
gender, Bem’s Sex Role Inventory (BSRI) (Bem, 1981) and the cultural theory of Hofstede
(1980), to explore the moderating effect of demographic and cultural factors on
individuals’ acceptance behaviour. Creating a model based on a number of prior dominant
theoretical models is consistent with the rationales presented in the previous chapter.
According to this, every model holds some limitations (in terms of parsimony,
significance, and explanatory power), therefore, selecting a number of relevant constructs
from the various models is the most favoured approach.
The rationale for selecting the TAM as the foundation model for the theoretical framework
is based on the TAM’s consistency in explainatory power since its creation, i.e., 40%, and
its popularity as one of the most cited model in the social sciences citation index (SSCI)
(e.g., Venkatesh & Bala, 2008; Venkatesh & Davis, 2000). In doing so, perceived
usefulness (PU), perceived ease of use (PEOU), behavioural intention (BI), and
behavioural usage (BU) are incorporated with the conceptualisation of the TAM. Previous
literature (e.g., Venkatesh & Davis, 1996; 2000; Taylor & Todd, 1995a; Mathieson, 1991)
suggest that the TAM limits its ability to predict the influence of volitional, situational and
social conditions. In order to overcome such limitations, volitional effect (voluntariness)
and usage experience as moderators are incorporated with the conceptualisation of TAM2.
Both TAM and TAM2 theorise that the effect of external variables on intention can only be
viewed in terms of the mediating effects of PEOU and PU, and hence, this limits their
applicability to examine the direct effect of situational and social conditions on acceptance
intention. Based on this limitation, the normative beliefs (peer-influence (PI) and superior-
influence (SI)) are incorporated from TRA, and control beliefs (technology facilitation
(TF), resource facilitations (RF), and self-efficacy (SE)) are incorporated from DTPB.
None of these models explicitly conceptualised the importance of social influence (which
can be exerted subject to culture and specific interpersonal agreements (Thompson et al.,
1991)) on acceptance behaviour. Therefore, using a similar conceptualisation of UTAUT

113
in terms of social influence effect on BI, the effect of management support (government
support (GS) and institutional support (IS)) is incorporated in the extended model.
Additionally, consistent with the UTAUT, the effect of moderators (age, gender, education
level, organisation type, academic position) and cultural dimensions (PD, IC, MAS, UA)
are also integrated. Finally, specific to the present study’s context (educational institutes)
and nature of job (teaching and research), external belief of technology utilisation i.e., task
characteristics (academic tasks (AT) and non-academic task (NAT)) are incorporated with
the theoretical justifications of task-technology-fit (TTF). The hypothetical relationships
proposed can be seen in figure 3.1.

114
Behavioural Usage
(BU)
Perceived usefulness
(PU)
H1a
H1b
Perceived Ease of use
(PEOU)
H3
H2
Normative
Beliefs
Peer Influence (PI)
Superior Influence (SI)
H4a,b
H5a,b
H5c,d
Control Beliefs
Self-Efficacy (SE)
Technology Facilitation (TF)
Resources Facilitation (RF)
H6,7,8 (a) H6,7,8 (b)
Task
characteristics
Academic Tasks (AT)
Non-Academic Tasks (NAT)
H9a,b
Behavioural Intention
(BI)
H10
Management Support
Government Support (GS)
Institute Support (IS)
H11,12
(a)
H11,12 (b)
Dem
ogra
ph
ic Mod
eratin
g F
acto
rs
EX
P
Aca
de
mic
Po
sition
Ty
pe
of
Un
ive
rsity
Ge
nd
er
Ag
e
VO
L E
du
catio
n
lev
el
H1
3 (
a,
b, c,
d, e)
1
H1
4 (
a,
b)
1
H1
3 (
a,
b, c,
d, e)
3
H1
4 (
a,
b)
3
H1
3 (
a, b
, c,
d, e)
4
H1
4 (
a,
b)
4
H1
3 (
a,
b, c,
d, e)
2
H1
4 (
a,
b)
2
Nati
on
al
Cu
ltu
re M
od
era
tin
g F
act
ors
Mas
culi
nit
y/F
emin
init
y (
MA
S)
Unce
rtai
nty
Avoid
ance
(U
A)
Indiv
idual
ism
\ co
llec
tivis
m (
IC)
Pow
er
Dis
tance
(PD
)
H 1
5,1
6,1
7,1
8
(a)
H 1
5,1
6,1
7,1
8
(c)
H 1
5,1
6,1
7,1
8
(b)
H 1
5,1
6,1
7,1
8
(d)
Demographic Moderator
Cultural Moderator
PEOU, PU
BI
Control Beliefs
Task Characteristics
Normative Beliefs
Management Support
Figure 3.1: Conceptual Framework (Colour Represents
Specific paths)

115
3.2 Direct relationships
3.2.1. Behavioural beliefs
Behaviour, which is defined as an observable act, is related to the individuals’ persuasive
or attitudinal feelings (LaRose & Eastin, 2004); whereas attitude/attitudinal feelings are
defined as the ‘degree to which a person has favourable or unfavourable evaluation or
appraisal of the behaviour in question’ (Ajzen, 1991 p.188). In simple words, behaviour
can result in positive or negative feelings depending on the individual’s observations or
performance. Bandura (1977) is considered as a pioneer in introducing behavioural beliefs
in SCT which were later used as outcome variable of attitude in the models TRA, TAM, A-
TAM, TAM2, TPB, and DTPB.
In the original conceptualisation of the TAM, consistent with TRA, behavioural beliefs
were hypothesised over behavioural intention (BI) with the mediation effect of attitude
(A). However, in the subsequent study of the final TAM model, A was omitted due to
partial mediation effect between beliefs and intention (Davis et al., 1989 p.955). Given
that, in the present study, approaching the TAM’s conceptualisation and keeping the
parsimony of the model intact, A as a determinant of BI is also excluded. It is expected that
two beliefs- PEOU and PU, which have remained direct determinants of behaviour (e.g.,
Taylor & Todd, 1995a) will determine individuals’ BI to accept a specific technology.
Perceived usefulness (PU) is defined as the ‘degree to which a person believes that using a
particular system would enhance his/her job performance’, whilst perceived ease of use
(PEOU) is defined as ‘the degree to which a person believes that using a particular system
would be free of effort’ (Davis et al., 1989 p.320). In literature, PU, which is a reflection of
performance use (Venkatesh & Morris, 2000) has been closely studied as similar to
relative advantage in the model DOI, extrinsic motivation in motivational model (MM),
outcome expectations in SCT, and performance expectancy in UTAUT (see Venkatesh et
al., 2003); whereas PEOU has been studied for its similarity to the effort expectancy in
UTAUT and opposite to complexity in DOI (see also Venkatesh et al., 2003). Davis et al.
(1989), within the TAM, established the direct relationship of PU and PEOU on BI, as well
as the indirect (mediation) effect of PEOU through PU on BI. Subsequently, similar
relationships were also suggested in various other models, such as: TAM2, A-TAM and
DTPB (see the review of models in chapter 2). Persistently, relationships suggested in the
TAM are empirically supported in a wide range of technology acceptance literature (see
table 2.2, chapter 2). For instance, the literature supports the direct relationship of PEOU
116
and PU on BI (e.g., Davis, 1989; Davis et al., 1989; Venkatesh & Davis, 2000; Taylor &
Todd, 1995a; Taylor & Todd, 1995b; Mathieson, 1991; Subramanian, 1994; Szajna, 1996;
Venkatesh & Morris, 2000; Venkatesh & Davis, 1996); PU on BU (e.g., Davis et al.,
1989; Mathieson, 1991; Keil et al., 1995; Agarwal & Prasad, 1997; Agarwal & Prasad,
1999); and, PEOU as an indirect determinant of BI through PU (e.g., Wu et al., 2007;
Taylor & Todd, 1995a; Mathieson, 1991; Chau & Hu, 2001).
Despite of the fact that the exemption of multiplicative effect of beliefs facilitates the
examination of PU and PEOU across the different settings (e.g., Davis et al., 1989), in the
present context of the study their relevance is rational. For instance, in the academic
context, it is expected that behaviour among the individuals’ acceptance does not largely
vary from person to person. However, it is expected that individuals’ professional and
teaching practices will be influenced by their internal perception (through observing the
relative advantages of the Internet). Keeping in view the relative advantages of the
technology (i.e. the Internet) and, in line with the TAM, TRA, TPB studies, it is expected
that if behavioural beliefs are positive towards the acceptance of the Internet then it is more
likely to get positive effects on their behavioural intentions and use to accept the Internet
technology. Therefore, it is hypothesised:
H1a: Perceptions of the PU of technology have a positive significant influence on the BI to accept the
technology (PU����BI).
H1b: Perceptions of the PU of technology have a positive significant influence on the BU of the
technology (PU����BU).
H2: Perceptions of the PEOU of technology have a positive significant influence on the BI to accept
the technology (PEOU����BI).
H3: Perceptions of the PEOU of technology have a positive significant influence on the perception of
the PU of the technology (PEOU����PU).
3.2.2. Normative beliefs
Normative beliefs, originally introduced in TRA, are defined as individuals’ perceptions of
particular behaviour as influenced by the judgment of others (Fishbein & Ajzen, 1975).
Within TPB, it is a component of subjective norms (SN) which is defined as ‘the perceived
social pressure to perform or not to perform the behaviour’ by the individual (Ajzen, 1991
p.188). Having been introduced into TRA, normative beliefs have been closely
studied/employed as a construct of social influence in UTAUT, image in DOI, and as
subjective norms in the TAM, TAM2, TPB, DTPB and A-TAM (see Venkatesh et al.,
2003; also see the review of theoretical models in chapter 2).
117
The role of normative beliefs (SN in the present study) as a determinant of BI is
documented as situational variable, which is influenced by the opinion of friends, family,
colleagues, peers and social referents (e.g., Venkatesh & Davis, 2000). For instance,
individuals working in one organisation may feel reluctant to accept conditions in another
due to an unexpected and unfriendly environment or less support from superiors and peers.
Keeping the impact of such divergence in perspective, Taylor & Todd (1995a) within
DTPB decomposed normative beliefs into two groups: peer influence (PI) and superior
influence (SI). Despite this fact, the opinions of these two groups might differ from each
other, but they are still considered to be strong determinants of individuals’ acceptance
behaviour (e.g., Mathieson, 1991; Taylor & Todd, 1995a).
Mixed results presented in the literature show the direct impact of SN on BI and PU. For
instance, previous scholars (e.g., Hu et al., 2003; Taylor & Todd, 1995a; Venkatesh &
Davis, 2000; Yi & Yuandong, 2005) found a significant impact of SN on BI and PU in the
presence of certain moderating factors such as gender, training, experience and
voluntariness. On the contrary, other scholars (e.g., Mathieson, 1991; Taylor & Todd,
1995b; Chau & Hu, 2001; Lewis et al., 2003; Shih & Fang, 2004) did not find any
significant impact of SN either on BI or on PU (see table 2.2, chapter 2). The ambiguous
relation of SN can raise the question of its relevance within information system acceptance
literature, and thus merits additional empirical evidence to examine the hidden
relationships. Given that, the present study incorporates SN due to their importance
towards establishing behavioural intention (e.g., Hartwick & Barki, 1994; Moore &
Benbasat, 1996). In addition, rationales are assumed for those studies that did not find a
significance of SN, either due to highly relative human behaviour (compulsory situations)
towards technology (Davis et al., 1989) or due to an insufficient relevant sample (mostly
students) (e.g., Venkatesh & Davis, 2000). Davis, who did not include SN in the TAM
(1989), realised their importance and later in 2000, along with Venkatesh, demonstrated
the significant impact of SN on BI as well as PU in TAM2.
Unlike behavioural beliefs (PU and PEOU), the impact of SN on BI is operationalised as a
multiplicative construct in which the extent to which individuals believe that he/she should
perform behaviour is weighted by the extent to which he/she wishes to comply with the
source of the normative belief (Ajzen & Fishbein, 1980). In simple words, SN is a context
and situation-specific construct and cannot be measured independently. In the present
context of the study, the importance of the SN is highly relevant. Arguably, the present
context of the study (Pakistan) is moderately evaluated on the masculinity-femininity
118
cultural index as proposed by Hofstede (1980), which makes it difficult to explore the
exact impact of SN. According to the literature, feminine culture compared with masculine
culture shows a higher influenceablity due to intention towards agreeable desires,
maintaining social relationships and interaction, concern with the well-being of others and
greater interdependence (Srite & Karahanna, 2006; Gefen & Straub, 1997; Bem, 1981).
Therefore, based on the discussion that highlights the importance of SN, its ambiguous
relationship within information system research, and finally, relevance to the present
context of the study, it is hypothesised:
H4a: Perceptions of the PI of technology have a positive significant influence on the BI to accept the
technology (PI����BI).
H4b: Perceptions of the SI of technology have a positive significant influence on the BI to accept the
technology (SI����BI).
H5a: Perceptions of the PI of technology have a positive significant influence on the perception of the PU
of the technology (PI����PU).
H5b: Perceptions of the SI of technology have a positive significant influence on the perception of the PU
of the technology (SI����PU).
H5c: Perceptions of the PI of technology have a positive significant influence on the perception of the
PEOU of the technology (PI����PEOU).
H5d: Perceptions of the SI of technology have a positive significant influence on the perception of the
PEOU of the technology (SI����PEOU).
3.2.3. Control beliefs
By extending the boundary conditions of violation control in TRA, TPB introduced control
beliefs with the additional construct of perceived behavioural control (PBC). PBC is the
reflection of an individual’s perception regarding the possession of requisite resources and
opportunities to perform a given behaviour (Ajzen, 1991). The possession of abundant
resources and opportunities by an individual resulted in greater control over behaviour
(Madden et al., 1992). According to Ajzen (1991), PBC reflects the perception of internal
and external constraints on behaviour, which is defined as ‘perceived ease or difficulty of
performing behaviour’ (p.188), and ‘is assumed to reflect past experience as well as
anticipated impediments and consequences’ (p.122). In information system research,
Moore & Benbasat (1991) conceptualised PBC as similar to the construct compatibility in
DOI, whereas Venkatesh et al. (2003) regarded it as similar to the facilitation conditions in
UTAUT. The effect of PBC in TPB was included as a direct determinant of BU as well as
indirectly through BI (Ajzen, 1991). Similar to normative beliefs, the impact of PBC on BI
is influenced by the personal (age, gender, experience) and situational (Voluntariness and
Experience) characteristics (e.g., Mathieson, 1991). For example, researchers (e.g.
Venkatesh et al., 2000; Venkatesh et al., 2004) found a significant impact of BPC on BI in

119
women only, leaving men as insignificant. Additionally, similar to SN, they found a
diminishing impact of PBC on BI with respect to the usage experience (ibid).
Within information system research PBC has remained an important construct of BI and
BU. For instance, using TPB, DTPB, and A-TAM, researchers (e.g., Chau & Hu, 2001;
Shish & Fang, 2004; Yi et al., 2006; Mathesion, 1991; Taylor & Todd, 1995a; Puschel et
al., 2010) found a significant impact of PBC on BI, whereas using similar models, others
(e.g., Taylor & Todd, 1995; Taylor & Todd, 1995a; Madden et al., 1992) found a
significant impact of PBC on BU (see table 2.2, chapter 2). Apart from the IT acceptance
research domain, the importance of the PBC on the decision-making process is appreciated
in different contexts. For instance, within an academic context (the context of the present
study), Manstead & Van Eekelen (1998), using TPB, found that perceived controllability
(PBC) showed a significant impact on academics’ intention to select one course out of
three English courses.
For developing an in-depth understanding, the conceptualisation of construct PBC in the
present study is consistent with the model DTPB (Taylor & Todd, 1995), in which to
determine behaviour, PBC is treated in three partly separate beliefs i.e., self-efficacy (SE),
resource facilitation (RF) and technology facilitation (TF). Originally, Taylor & Todd
(1995a) followed the criteria of Ajzen (1985, 1991) to decompose the control beliefs.
According to Ajzen (1985, 1991), control beliefs can be an individual’s internal beliefs i.e.,
self-efficacy or can be external, similar to the Triandi’s (1971) notion of facilitation
conditions. This decomposition of PBC beliefs is also echoed by a number of subsequent
studies (e.g., Chau & Hu, 2002; Lin, 2007; Huh et al., 2009) and is briefly described next.
Self-efficacy (SE), which emerged from social learning theory (SLT) and social cogitative
theory (SCT), refers to an individual’s self-evaluation beliefs about their ability to perform
target behaviour (Bandura, 1977, 1986). Initially, within IT acceptance models, SE was
considered to be part or similar to the perception of ease use (PEOU). For instance, Davis
(1989) referred to PEOU as a similar concept of SE, whereas Malhotra (2002) defined
PEOU as the intrinsic motivation which is based on self-control and tacit knowledge
within context (i.e., SE). In the same line of research, Marakas et al. (1998) differentiated
two types of the SE beliefs as: general computer SE, and task-specific SE. The author
emphasised the need for caution before selecting any one of them (ibid). In the present
study, only task-specific SE is relevant due to the intention to examine an individual’s

120
judgement of efficacy to perform specific task (teaching and research-related) using only
the Internet.
The belief SE has been remain an important predictor of an individual’s perceived ability
towards task completion, intrinsic motivation in task, and task performance across the
versatile domains (e.g., Ellen et al., 1991; Martocchio and Webster, 1992). Within the IT
domain, studies reported the effect of SE as an important predictor of determining an
individual’s behaviour and performance using specific technology (e.g., Compeau &
Higgins, 1991, 1995, 1999; Hartwick & Barki, 1994; Moore & Benbasat, 1996; Igbaria &
Iivari, 1995). For instance, within PC adoption, the direct impact of SE on BI is reported
by a number of researchers (e.g., Compeaue & Higgins, 1991; Wu et al., 2007). A similar
effect within the context of Internet usage was found by other researchers (Hsu & Chiu,
2004; Eastin & LaRose, 2000; Eastin, 2002; Shih & Fang, 2004). The strong effect of SE
on BU is also reported in IT literature (e.g., Agarwal et al., 2000; Thompson et al., 1991;
Compeau & Higgins, 1995; Igbaria & Iivari, 1995). Finally, within studies consistent with
TAM conceptualisation (external factors can only affect behaviour through the mediation
effects of PEOU and PU), researchers (e.g., Compeau & Higgins, 1995; Lewis et al., 2003)
found an impact of SE on PU and image, whereas researchers (e.g., Venkatesh & Davis,
1996; Agarwal et al., 2000; Lewis et al., 2003) found an impact of SE on PEOU.
As described earlier, within the deconstruction of control beliefs, the second group is
related to facilitations conditions (FC) that is further divided into two sub-dimensions.
First, resource facilitations (RF) that are related to factors such as time and money; second,
technology facilitating (TF) that is related to the technology compatibility issues that may
restrain behavioural intention or usage (Taylor & Todd, 1995a). According to Taylor &
Todd (1995a, p.153), BI and BU are expected to be less likely as less time and money are
accessible and as technical compatibility decreases. RF and TF, as constructs of FC, were
examined together by Venkatesh et al. (2003) during the development of UTAUT.
Venkatesh et al. found that FC, neither in voluntary nor in mandatory settings, showed a
significant effect on BI. Contrary to this, within the model of PC utilisation (MPCU),
Thompson et al. (1991) found a significant impact of FC on BU. Similarly Venkatesh et al.
(2003) found that FC produced a significant impact on BU in the presence of some
moderating factors including age and experience. Rationally, the different results for FC
can be supported by the difference in importance in underlying constructs, i.e., RF and TF.
According to Taylor & Todd (1995a, p.153), the absence of RF represents barriers to usage
and may inhibit the formation of BI and BU; on the contrary, the presence of RF may not
121
be considered to encourage usage. To validate the argument, Taylor & Todd (1995a),
within DTPB, examined the direct impact of TF and RF without the mediation of PBC and
found that RF produced a significant effect on both BI and BU but the TF effect was
negative and insignificant.
In the present context of the study, consistent with the TAM conceptualisation of
parsimony (attitude was excluded due to partial mediation), PBC is omitted. This omission
is supported by the results of Taylor & Todd (1995a) where RF presented a direct effect on
BI and BU. Consequently, it provides a more parsimonious structure without the uncertain
results of FC. The relevance of these factors in the present study is consistent with the
initiatives taken by the government of Pakistan to improve technology (i.e., Internet)
acceptance specifically within the educational sector (see section 2.17.4). Hence, summing
up the discussion, it is hypothesised as:
H6a: Perceptions of the SE of technology have a positive significant influence on the BI to accept the
technology (SE����BI).
H6b: Perceptions of the SE of technology have a positive significant influence on the BU of the
technology (SE����BU).
H7a: Perceptions of the TF of technology have a positive significant influence on the BI to accept the
technology (TF����BI).
H7b: Perceptions of the TF of technology have a positive significant influence on the BU of the
technology (TF����BU).
H8a: Perceptions of the RF of technology have a positive significant influence on the BI to accept the
technology (RF����BI).
H8b: Perceptions of the RF of technology have a positive significant influence on the BU of the
technology (RF����BU).
3.2.4. Task characteristics
In the literature of information systems, the utilisation (in terms of acceptance/adoption) of
a technology is mostly studied in the theories of attitude, beliefs and behaviour (e.g.,
Bagozzi, 1982; Davis, 1989; Davis et al. 1989; Thompson et al., 1991) and characteristics
of tasks ( internal and external) are found to be the strongest construct of behavioural
beliefs towards behaviour intention (i.e., utilisation effect) (e.g., Goodhue & Thompson,
1995; Venkatesh, 2000; Davis, 1989; Davis et al., 1989; Dishaw & Strong, 1999). Even
though, theoretically, characteristics of tasks are found to be effective constructs of
motivation, only a very few researchers took them apart to examine as independent
determinants of usage behaviour (Goodhue & Thompson, 1995). In most situations, task
characteristics are considered to be a sub-part or internal factor of the core constructs. For
instance, Davis (1989) examined task characteristics as an implicit factor of PU, that is to
say, usefulness means useful for something, and hence, overlooked the explicit effect of

122
the task on BI. The importance of task characteristics as an external factor of technology
utilisation was introduced by Goodhue (1988) in a model known as ‘task-technology-fit’
(TTF). In later studies it was confirmed that explicit inclusion of task characteristics
provides a better IT utilisation and performance (e.g., Thompson & Higgin, 1994;
Goodhue & Thompson, 1995; Dishaw & Strong, 1999; Igbaria, 1990; Seyal et al., 2002).
Goodhue & Thompson (1995) defined ‘task’ as an action performed by an individual to
carry out output activity (i.e. behaviour according to LaRose & Eastin (2004)), whereas
task characteristics are an individual’s abilities that support both work and work- related
experience using a particular IT system utilisation. In addition, the authors state that
technology is only acceptable when it is consistent with the needs of an individual and
termed it as ‘fit of technology’. According to authors, fit of technology may be examined
at various levels, for example complexity (simple to difficult) and structure (routine to non-
routine).
Similar with the normative and control beliefs, the conceptualisation of task characteristics
in the present study (an academic context) is also situation-based (vary according to the
context). In part, based on the TTF structure (routine and non-routine), the characterisation
of tasks is divided into two groups, i.e., academic tasks (AT) and non-academic tasks
(NAT). This grouping is consistent with the conceptualisation in literature (Reynolds,
1992; Rosenfeld et al., 1992) and is supported by a number of studies within the literature
of computing in higher education systems (e.g., Harris, 1997; 1999; Chiero, 1997; Gilbert,
1996). According to this, within teaching, tasks can be pre-active (comprehending,
preparing, and adopting content, plans, and material), interactive (performed during
instructions), and post-active (includes both teacher’s action and student’s response,
interaction with colleagues, and professional development) (Raynolds, 1992). Similar tasks
were divided into six groups by Rosenfeld et al., (1992) as: planning and preparing for
instructions, managing the classroom, implementing instructions, evaluating student
learning and instructional effectiveness, administrative responsibilities, and additional
professional responsibilities. Due to the requirements of the teaching job, out of these six,
the first four are mostly considered as routine tasks (AT), while the remaining two are
considered to be non-routine tasks (NAT) (Kripanont, 2007). Assimilating the discussion
above and realising the importance of task characteristics towards BI within a utilisation
focus and the TTF research (e.g., Davis et al., 1989; Thompson, et al., 1991; Hartwick &
Barki, 1994; Goodhue, 1988; Goodhue & Thompson, 1995; Dishaw & Strong, 1999;
Igbaria, 1990; Igbaria & Iivary, 1995), it is hypothesised that:
123
H9a: Task characteristics related to the AT using technology has a positive significant influence on the
BI to accept the technology (AT����BI).
H9b: Task characteristics related to the NAT using technology has a positive significant influence on
the BI to accept the technology (NAT����BI).
3.2.5. Behavioural intention towards behaviour usage
Ajzen & Fishbein (1980) and Fishbein & Ajzen (1975) were the first to introduce
behaviour as a part of the TRA model. TRA played a key role in the development of the
TAM. According to TRA, beliefs influence attitudes, and attitude determines the nature of
intentions that guide behavioural usage (Ajzen & Fishbein, 1980). In other words, intention
is the cognitive process of individuals’ readiness to perform specific behaviour and is an
immediate antecedent of usage behaviour. In turn, behavioural usage is an observable act
performed by an individual based on their experience or mediated by some vicarious
observations on a given target/level (LaRose & Eastin, 2004). The impact of BI on BU
received strong support in literature (e.g., Venkatesh et al., 2003; Shih & Fang, 2004;
Davis, 1989; Venkatesh & Davis, 2000; Taylor & Todd, 1995a, Taylor & Todd, 1995b;
Szajna, 1996; Venkatesh & Davis, 1996; Davis et al., 1989; Wu & Wang 2005), listed
only few. Therefore, based on previous strong and undebateable findings, it is expected
that:
H10: The BI to accept technology has a positive significant influence on the BU of the technology
(BI����BU).
3.2.6. Management support: institutional-level and governmental-level
For the innovation of IT systems within an organisational context, management support
presumably influences which innovations are adopted and used by employees (Igbaria &
Chakrabarti, 1990). Decisions to promote technological changes and improvements are
mostly carried out by management. In turn, the employees of an organisation are expected
to learn new technological skills and perform tasks effectively. However, innovations and
required outcomes are only attainable when individuals within the organisation believe that
innovative behaviour is valued sufficiently. Generally, it is observed that, whenever IT
innovations are introduced in an organisation, changes in that organisation are inevitable.
In some cases, change resulted in resistance (Yoon et al., 1995). For instance, employee
resistance might be the result of the perception of learning and a lack of training support,
resources and facilitations to use the system effectively (Trevino & Webster, 1992).
Therefore, without prior knowledge of the individuals’ behaviour, the perception of a
management decision towards innovation might differentiate between the expected attitude
and the perceived impact of technological usage. Reasonably, several studies reported the

124
role of management support to be one of the key determinants in IT acceptance literature
(e.g., Igbaria, 1990, 1994; Igbaria et al., 1995; Igbaria et al., 1997; Purvis et al., 2001;
Lewis et al., 2003; Venkatesh & Balla, 2008; Rouibah et al., 2009).
In this study, it is believed that expected management influence on behaviour is based on
the personal characteristics possessed by an individual and may vary according to
organisational context and culture. To develop a proposition, researcher followed previous
research in information systems (Lewis et al., 2003), which conceptualised the influence of
management at top level (i.e. government-support (GS) in present study) and at a low level
(i.e. institution-support (IS) in the present study) in terms of commitment (future vision
and goals, instrumental rewards), general support (funding, cooperation and police
discussions) and specific support (resource allocation, facilitation conditions, technology
support) towards individuals’ PU and BU beliefs. Observing management support at a
hierarchal level is also supported by Leonard-Barton (1987) who warned that, without
observing management support at an appropriate level in the organisation, it will not be
effective in predicting technology acceptance behaviour. Management support may be
demonstrated in different ways. Specifically, for the present study, it is conceptualised that
the mechanism through which individuals are influenced by the management is perceived
through indirect message passing between the superior and the individual, or through
direct physical support from the superior to the individual.
In terms of the message or notification issued by the management authorities to adopt or
accept a particular innovation, Peabody (1961) identified four types of influence:
legitimacy, position, competence and person. Whereas Orlikowski (1992) categorised
management influence on individuals’ perception into three types: significance,
legitimisation and domination. Between Peabody and Orlikowski’s categorisations, the
common mechanism of influence is legitimisation, which is a process where a message is
passed from higher management to the subordinates in an organisation so they are
reassured about the beliefs and actions directed by the authorities (Scott, 1995). Thus, the
process of legitimisation is the intended attitude of top management in the form of a
persuasive message that is likely to affect individuals’ attitude and intention to accept a
particular behaviour. This is also consistent with Triandis’ (1971) term of ‘social norms’,
which posits that an individual’s behaviour is influenced by the message received from
others and reflects what individuals think they should do.
125
Unlike the message passing and legitimisation process, the influence of management
support can directly impact an individual’s perceptions of attitude and behaviour if they are
aware of that management commitment and support. A significant number of studies found
a positive effect of management support in a vast variety of dimensions, such as innovation
of products management (Chakrabarti, 1974) and change in innovation and management
(Leonard-Barton & Deschamps, 1988; Kanter, 1983). However, evaluating this direct
support from management is not as easy as evaluating the perception of the message
passing (Leonard-Barton & Deschamps, 1988). The reason for this is obvious as an
individual’s behaviour is not always similar and may alter by their desire for support in
innovations (Fishbein & Ajzen, 1975). In the context of IT and Internet acceptance, it
might be predicted that the provision of computers, the Internet and training from
management may be the types of facilitation conditions that can influence an individual’s
perception of system usefulness and acceptance intention.
In the current study, it is intended to observe top-level and low-level management
influence in terms of commitment, general support and specific support. It is expected that
individuals (academics working in higher educational institutes) will be equally influenced
by the attitudes of top-level (GS) and low-level (IS) management. Indeed, their daily or
short-term cognitive behaviour is expected to be influenced by the support from the IS
management depending on the provision of computers, training, and Internet access, whilst
their long-term sustained cognitive behaviour is expected to be influenced by the GS in
terms of funding allocation, encouragement and motivation through normative and
instrumental reward. Therefore, consistent with the assertion of Igbaria et al. (1997), that
management support is relevant with the greater system success and a lack of it is
considered to be a barrier, it is hypothesised:
H11a: Perceptions of low-level management i.e. IS, have a positive significant influence on the
perception of the PU of the technology (IS����PU).
H11b: Perceptions of low-level management i.e. IS, have a positive significant influence on the BU of
the technology (IS����BU).
H12a: Perceptions of top-level management i.e. GS, have a positive significant influence on the
perception of the PU of the technology (GS����PU).
H12b: Perceptions of top-level management i.e. GS, have a positive significant influence on the BU of
the technology (GS����BU).
3.3 Moderating impact
Baron and Kenny (1986, p.1174) defined a moderator as the ‘variable that affects the
direction and/or strength of the relation between independent or predictor variable and
dependent criterion variable’. In this research, two groups of moderating variables are

126
expected to show a significant impact on the direct relationships proposed in the previous
section (3.2). The first group includes seven demographic and situational variables: age,
gender, organisational type, academic position, educational level, experience usage and
voluntariness. The other group includes four moderators related to the cultural dimensions
suggested by Hofstede (1980): masculinity and femininity (MAS), individualism-
collectivism(IC), power distance (PD) and uncertainty avoidance (UA).
Before starting a brief discourse about the importance of each moderator, it is important to
remember that all the moderators are being examined on the basis of an exploratory
approach. In other words, their effect is examined using correlational investigation.
According to this, paths are identified, established and associated with certain predictors
(Sekaran, 2000). This approach is different from the paths proposed in previous section
(3.2) where casual investigation was used to examine the best or most appropriate cause
and effect between one variable directly or indirectly (mediation) over another6. The brief
importance of each moderator with the support of the literature is established below.
3.4 Moderators: demographic variables
3.4.1. Age
Despite the fact that age has been proven to be an important demographic predictor of
interest in organisational settings (Ford et al., 1996; Minton & Shneider, 1980), it has
received very little attention in IT acceptance research (Morris & Venkatesh, 2000). As a
result, a few studies recently started to examine its effect (direct and indirect) on
individuals’ acceptance and usage behaviour (e.g., Burton-Jones & Hubona, 2006; Morris
et al., 2005; Venkatesh et al., 2003; Carveth & Kretchmer, 2002; Porter & Donthu, 2006;
Wang et al., 2009; Chung et al., 2010).
The prior research on age difference reported that increasing age is correlated with higher
computer anxiety (reciprocal to behavioural and control beliefs PEOU and SE
respectively) (e.g., Raub, 1981), unfavourable to PU (e.g., Igbaria & Parasuraman, 1989),
lower attitude towards usage (e.g., Igbaria & Nachman, 1990) and acceptance behaviour
(e.g., Igbaria et al, 1989; Lee, 1986; Chung et al., 2010). The rationale for control beliefs
could be that older people are less likely to have computer experience, be less open to
change, and consequently, be more susceptible to computer anxiety (Igbaria, 1990). In
6 However, over all approach is correlation for both direct and indirect (moderators) examination. The
correlational results of direct relationships are presented with computation of ‘direct-effect’ but are not explicitly discussed (See table A-7 in appendix).
127
simple words, age is positively related to computer anxiety. Igbaria’s (1990) argument was
confirmed by Morris & Venkatesh (2000) who found that age reduced the impact of PBC
over BI and BU due to lower level of SE and cognitive skills.
The rationale for the reciprocal relationship of age and PU (lower age had a positive effect
on PU and vice versa) are consistent with the instrumentality effect and extrinsic
motivations. According to this, the literature shows that younger people placed a greater
importance of extrinsic motivational effects (job-related attitudes, opportunities for
promotion) and hence perceived a higher importance of PU (Morris & Venkatesh, 2000).
From the perspective of normative beliefs, age increased the positive effect of SN due to
greater need of affiliation (e.g., Igbaria, 1993; Morris & Venkatesh, 2000; Burton-Jones &
Hubona, 2006). For instance, Hall & Mansfield (1975) put that the importance of having a
friendly supervisor and peers increases with age. Finally, the literature suggests that age is
negatively related to the BI and BU due to an increased perception of habit (e.g., Burton-
Jones & Hubona, 2005, 2006; Igbaria, 1993).
Recent literature suggests that age together with gender can exhibit a simultaneous effect
on an individual’s acceptance behaviour (e.g., Morris et al., 2005; Wang et al., 2009).
Indeed, Levy (1988) cautioned that examining either gender or age without referencing
each other might mislead the expected outcome. In doing so, Venkatesh et al. (2003)
examined the combined moderating effect of age and gender in UTAUT. The author, in
terms of predicting intention, found that the affect of performance expectancy (similar to
PU) was stronger for younger men, and the effect of effort expectancy (similar to PEOU)
and social influence (similar to SN) was stronger for older women with limited experience
(ibid). In a similar line of research, Morris et al. (2005) recently examined the combined
effect of both moderators in TPB. Supporting the Venkatesh results, the authors found a
significant effect of attitude in younger men and PBC in older women towards predicting
the intention. Hence, despite clear evidence of the moderating impact of age in IT
acceptance literature, it is still hypothesised on an exploratory basis that:
H13a1: The influence of the predictors BI, PU, TF, RF, SE, IS, and GS towards BU is moderated by age,
or (BI, PU, TF, RF, SE, IS, GS) X Age����BU
H13a2: The influence of the predictors SN, PEOU, IS, and GS towards PU is moderated by age, or (SN,
PEOU, IS, GS) X Age����PU
H13a3: The influence of the predictors PU, PEOU, TF, RF, SE, AT, NAT, and SN towards BI is
moderated by age, or (PU, PEOU, TF, RF, SE, AT, NAT, SN)X Age����BI
H13a4: The influence of the predictor SN towards PEOU is moderated by age, or SN X Age����PEOU

128
3.4.2. Gender and Masculinity-Femininity
The significant body of literature across the domains revealed the differences between men
and women regarding the decision-making process. For instance, in academia, Wilson et
al. (1994) observed behavioural differences among male and female academics in the
decision-making process when selecting a particular course was examined. Powell & Ansic
(1997) explored differences on the level of risk perception among male and female
workers in the financial decision-making process. However, within the domain of
information systems research, surprisingly the role of gender as a direct or indirect
(moderating) construct on an individual’s behavioural acceptance has received very little
consideration (e.g., Venkatesh & Morris, 2000; Gefen & Straub, 1997; Porter & Donthu,
2006). So far, researchers have examined gender as a biological, dichotomous construct
(e.g., Venkatesh & Morris, 2000; Al-Jabri & Al-Khaldi, 1997; Venkatesh et al., 2003;
Gefen & Straub, 1997; He & Freeman, 2009; Wang et al., 2009) which constrains the
understanding of the real differences between men and women on the basis of cognitive
perceptions (cf. Venkatesh & Morris, 2000; Bem, 1981). Furthermore, the studies that
explored differences between the genders were based on the mean differences between
men and women in terms of abilities and psychological traits (Venkatesh & Morris, 2000).
In this section, the effect of gender is discussed on the basis of biological traits (male and
female) as well as on psychological traits (masculinity and femininity). In doing so,
parallel to gender, this section also covers the justification of the cultural dimension
masculinity-femininity (MAS). The rationale for looking at both moderators together is
based on Bem’s (1981) Sex Role Inventory (BSRI), which suggests that men tend to
display more masculine traits (e.g., assertiveness) and women more feminine traits
(nurturing).
An exploration of gender-based differences on behavioural beliefs (PU and PEOU)
requires understanding of their conceptualisation within the TAM. According to the TAM
(Davis et al. , 1989 p.112), PU is considered to be an extrinsic motivational effect, based
on outcome performance through instrumentality, and PEOU is considered to be an
intrinsic motivational effect based on the process of outcome performance. Support for this
argument is found in the literature, which echoes that PU towards behaviour is strongly
related to the effect of instrumentality, performance outcome and extrinsic motivations
(e.g., Davis, 1993; Venkatesh & Morris, 2000). In the context of gender, Taylor & Hall
(1982) in meta-analysis put that masculine traits were highly correlated with instrumental
behaviour. Rationally, their argument is consistent with recent literature in social

129
psychology, which asserts that individuals with masculine traits compared with feminine
traits possess instrumental behaviour because they place a greater emphasis on earnings,
recognition of the job, advancement and tackling challenging tasks (Hofstede & Hofstede,
2005). The effect of instrumentality, which asserts that men and masculinity, as compared
with women and femininity, are highly influenced by the PU to develop the intention is
also supported by a number of studies in IT acceptance literature (e.g., Srite & Karahanna,
2006; Venkatesh & Morris, 2000; Venkatesh et al., 2000; Venkatesh et al., 2004).
Contrary to the effect of instrumentality, which favours men and masculine individuals, a
number of reasons are positioned in literature, which suggests that women, compared with
men, tend to perceive a lower importance of PU. Out of many, one reason is the presence
of a higher level of computer anxiety and technophobia within women (e.g., Harrison &
Rainer, 1992; Parasuraman & Igbaria, 1990). Research indicates that the lower the
computer anxiety, the greater the experience, which indirectly increases self-efficacy (SE)
and in turn improves performance (Bandura, 1977; Rosen & Maguire, 1990; Brosan,
1998). From the gender perspective, the literature (e.g., Igbaria & Chakrabarti, 1990;
Brosnan & Lee, 1998; Schumacher & Morahan-Martin, 2001; Weil & Rosen, 1995) shows
that women tend to score higher on computer anxiety and are more computer-phobic than
men; consequently, women are more reluctant to interact with technology and perceive less
on usefulness. For example, Cooper & Weaver (2003) identified the hindrance factors for
women to acquire technological benefits and found computer anxiety to be one of the
major barriers. In a similar line of research, Whitley (1997), in a meta-analysis, found that
women possess higher anxiety and exhibit lower in sex-role stereotyping for computer and
computer self-efficacy.
In terms of gender-based differences between the relationship of PEOU on PU and BI, the
influence of women and feminine individuals is usually considered to be higher than men
and masculine individuals. Rationally, the essence of the statement is based on the
conceptualisation of PEOU. Davis (1989) referred to PEOU as a similar concept to
computer self-efficacy, whereas Malhotra (2002) defined it as an intrinsic motivation
which, in a later study by van der Heijden (2004), was examined as enjoyment effect.
Combining all these effects, Venkatesh (2000) proposed that PEOU is built upon
determinants of internal control (self-efficacy), external control (facilitation conditions),
intrinsic motivation (computer playfulness) and emotions (anxiety). Recalling the
discussion relevant to the PU, that feminine individuals and women were more
technophobic and higher on computer anxiety as compared with men, it is presumed that

130
women perceive a lower level of computer self-efficacy, which in turn results in a lower
level for the perception of PEOU. This proposition is also consistent with SCT, which
suggests that anxieties and expectancies (self-efficacy and ease of use) are reciprocal to
each other (Bandura, 1986). The determinant of PEOU is typically measured on the scale
of difficulties in user acceptance (Davis et al., 1989), therefore a lower evaluation of the
effect of computer SE will increase the importance of PEOU (Venkatesh & Morris, 2000).
Finally, from the perspective of external control (facilitation conditions (FC)), Hofstede &
Hofstede (2005) in cultural theory found that individuals with feminine traits compared
with masculine traits rated a higher importance of FC in terms of service aspects and
working environments. Hence, summing up the discussion, it is proposed that the belief PU
in terms of instrumentality and performance outcome will be strongly influenced by men
and masculine individuals; whereas, in terms of computer anxiety and facilitation
conditions belief, PEOU and SE will be strongly influenced by women and feminine
individuals.
The explanation of gender differences between the relationships of normative beliefs (SN)
on BI, PU and PEOU, is based on the degree of differences between an individual’s
understanding through which they comprehend the information and social pressure shared
by others. Originally, the direct impact of SN (which is a reflection of social pressure) on
BI was proposed in the TRA and TPB (Ajzen, 1991; Fishbein & Ajzen, 1975). This
relationship suggests that individuals’ behaviour is based on the opinions of the people in
their surroundings, even though they do not have any prior knowledge or positive feelings
about a particular behaviour. Literature in social psychology and information systems
research suggests that feminine individuals tend to be more tentative, socially oriented and
concerned about others’ feelings, whereas masculine individuals are more categorical,
independent in nature and concerned about their own feelings rather than others (Gefen &
Straub, 1997; Bem, 1981). Additionally, differences in biological traits suggest that women
compared with men are found to be more expressive in nature (Taylor & Hall, 1982) and
easily motivated by social pressure and affiliation needs (cf. Venkatesh & Morris, 2000),
whereas men are more oriented towards interpersonal goals, achievement needs, and have
high independence characteristics; moreover, men compared with women rarely rely on
others’ opinions (Venkatesh & Morris, 2000; Hofstede & Hofstede, 2005; Bem, 1981).
Hence, it is expected that the relationship between SN and BI will often be stronger for
women and feminine individuals.

131
The indirect effect of SN on BI intention through PU was introduced in TAM2 by
Venkatesh & Davis (2000). This relationship explains that when superior or working
colleagues suggest that usage of a particular system will be useful, then individuals start to
take it as evidence of fact, which in turn establishes the intention to use the system. Similar
to the impact of SN on BI, it is expected that the relationship between SN and BI through
PU will be stronger in women and feminine individuals compared with men and masculine
individuals, due to the high dependency on the internalisation effect ( similar to social
influence), interaction needs and being easily influenced by social circumstances
(Venkatesh et al., 2004). This argument can be supported by the study of Srite &
Karahanna (2006), who examined the impact of national culture on IT acceptance and
found that feminine individuals showed higher influenceablity because of the intention
towards agreeable desires, maintaining social relationships and interaction, and concern
with the well-being of others and greater interdependence. Further evidence of this
argument can also be inferred from Hofstede & Hofstede’s cultural theory (2005), which
suggests that for feminine individuals, relationships and quality of life possess a higher
importance in comparison with masculine individuals who place higher value on earnings,
achievements and job recognition.
Finally, like PU, the impact of SN on PEOU is based on the opinions of people. For
instance, if co-workers or superiors suggest that the system is easier to use and will be
useful, individuals start to take it as an argument of belief. The concept of ease/difficulty is
closely related to self-efficacy and is studied as a determinant of PEOU (e.g., Venkatesh &
Davis, 1996). A substantial amount of literature suggests that resource facilitation,
supportive staff and available training showed a positive effect on self-efficacy in the early
stages of system usage (e.g., Bergeron & Rivard, 1990). In this study, based on the
influence of interaction and dependency on service aspects, it is expected that the impact of
SN will be stronger for women and feminine individuals compared with men and
masculine individuals. The reason is obvious as women and feminine individuals rated
lower on SE (as discussed earlier in relation PEOU�BI) and are more dependent on
service aspects and the physical working environment (Hofstede & Hofstede, 2005);
consequently, they are less confident and highly people-oriented and largely value the
opinion of their peers regarding the ease of a particular system.
The discussions on understanding gender difference in the relationship of SN on BI
through PU and PEOU, and SN on BI through PU, also helps to understand the gender
differences in the importance of management support. The management influence

132
pertaining to message passing to inform about intended innovations is expected to be
higher in women and feminine individuals compared with men and masculine influence.
This reasoning is based on a review of SN, which suggests that feminine individuals are
more interdependent, expressive in nature, influenced by the internalisation/social norms
and sensitive to the needs of others. Additionally, empirical evidence indicated that women
and feminine individuals, as compared with men and masculine individuals, are flexible
towards compliance with orders and are most likely to accept behaviour if it is confirmed
by the majority of people (see also Gefen & Straub, 1997; Venkatesh & Morris, 2000,
Bem, 1981). Recently, in a computer-mediated communication, Guiller & Durndell (2006)
indicated that women, as compared with men, were more attenuated and express
agreement, whereas men were more authoritative and showed disagreement. The lower
reliance/compliance of men upon others’ opinions is related to masculine traits, which
shows them to be self-reliant and independent (Minton & Schneider, 1980). In fact,
Venkatesh et al. (2004) found that masculinity is not a significant moderator between SN
and BI.
The management influence pertaining to physical support is also expected to be higher in
women and feminine individuals. The explanation for this is based on the criteria of
personal characteristics and intrinsic motivations that an individual holds. Intrinsic
motivation means individuals tend to try and welcome innovations in an organisation. As
described earlier in the review of PEOU, intrinsic motivation is based on the concept of
ease of use which is perceived to be higher in women and feminine individuals as
compared with men and masculine individuals. It was also noticed that women and
feminine individuals were higher on technophobia and computer anxiety, and lower on
self-efficacy. Therefore, women may need stronger management support (e.g., training and
skills development) to improve their performance. This argument is also consistent with
Hofstede’s cultural theory (Hofstede & Hofstede, 2005), which suggests that feminine
individuals rated a higher importance towards facilitation conditions in terms of service
aspects and the working environment, in comparison with masculine individuals. On the
other hand, research in psychology suggests that men and masculine individuals endorse
analytical and competitive approaches to solving problems (Venkatesh et al., 2004) which
enables them to become highly skilled and score high on SE (e.g., Whitley, 1997; Gefen &
Straub, 1997). Therefore, men and masculine individuals may not require as much
management support as women and feminine individuals because they may formulate their
own opinions based on personal knowledge and experience.
133
Despite the conclusion of the discussion that men’s and masculine individuals’ perception
regarding acceptance behaviour is more strongly influenced by their behavioural belief
(PU), while feminine individuals and women are strongly influenced by behavioural belief
(PEOU), normative and control beliefs (SN, PBC, SE) and managerial beliefs (GS and IS),
it is still hypothesised on an exploratory basis that:
H13b1: The influence of the predictors BI, PU, TF, RF, SE, IS, and GS towards BU is moderated by
gender, or (BI, PU, TF, RF, SE, IS, GS) X Gender����BU
H13b2: The influence of the predictors SN, PEOU, IS, and GS towards PU is moderated by gender, or
(SN, PEOU, IS, GS) X Gender����PU
H13b3: The influence of the predictors PU, PEOU, TF, RF, SE, AT, NAT, and SN towards BI is
moderated by gender, or (PU, PEOU, TF, RF, SE, AT, NAT, SN) X Gender����BI
H13b4: The influence of the predictor SN towards PEOU is moderated by gender, or SN X
Gender����PEOU
3.5 Moderators: educational level, academic position and
organisational type
Unlike age and gender, which are noted as the most fundamental moderators, educational
level, academic position and organisation type had been given very little importance in
information system literature. Mostly, these factors are examined on the basis of
confounding variables (the effect is controlled) with age and gender (e.g., Morris &
Venkatesh, 2000; Minton & Schneider, 1980). For instance, it is assumed that people who
are older in age are overrepresented in higher occupational positions, higher educational
level, and higher income (Kite, 1996; Prager, 1986). Thus, in the present study, it was
important to either confound the impact of these variables or evaluate their distinct role as
moderators on the perception of individual’s acceptance behaviour. Given that, in contrast
with the previous literature (e.g., Morris & Venkatesh, 2000) the effect of these moderators
is examined on an independent basis. A brief conceptualisation of each is given as follows.
3.5.1. Organisational type
The relationship between organisational (ORG) structure and IT cannot be undervalued.
The previous research suggests that the innovation of technologies within an organisation
affects the organisational structure (e.g., Heintze & Bretschneider, 2000; Caudle et al.,
1991; Pinsonneault & Kraemer, 1993), and in reverse, an individual’s acceptance of IT
innovations is influenced by the organisational structure (e.g., Orlikowski, 2000; Lewis et
al., 2003). In other words, the effect is reciprocal. For instance, Heintze & Bretschneider
(2000) argued that the introduction of IT facilitates change in organisational structure from
a hierarchal to a flatter structure by reducing the number of managers and improving
134
communication channels. On the other hand, Orlikowski (2000) suggested that individuals’
usage behaviour is deeply influenced by the institutional context where that behaviour is
enacted. Similarly, Lewis et al. (2003) argued that an individual’s beliefs pertaining to the
specific technology are formed by the influence emanating from the institutional and social
context. Realising its importance, in the present study the effect of organisational type on
an individual’s acceptance behaviour is incorporated as a moderator.
Organisations are usually categorised into two groups, public and private. The difference
between public and private organisations was begun by Rainey et al. (1976) in the context
of organisational differences within US society. According to the author, the two sectors
can be differentiated on the basis of: environmental factors, organisational transactions,
and internal structures and processes. Following Rainey’s classification, Nutt (2000)
reported that private organisations value higher competition, readily available data, flexible
autonomy, indirect political influence, clear organisational goals that are open for
discussion, and clear and long-term policies are devised; whereas public organisations
place greater value on cooperation, data is often limited, autonomy is limited/ mandate,
political influence is direct, organisational goals are shifting/complex/ambiguous, and
vague and inconstant polices are devised.
Information systems research literature largely examines IT structures and performances
with relation only to private sector organisations, and hence, leaves a gap to examine the
effect within public sector organisations (Heintze & Bretschneider, 2000). In addition,
within a handful of studies, it is observed that acceptance of technology in the private
sector is reported to be higher than in the public sector (e.g., Caudle et al., 1991;
Pinsonneault & Kraemer, 1993). The possible explanation for such results can be
understood with relation to the differences suggested by Rainey et al. (1976). For instance,
structure within public organisations is reported to be more rigid compared with the private
sector, which is more flexible (Rainey et al., 1976). Technology facilitates more
organisational individuals to be involved in the decision-making process through improved
communication, which is difficult for public organisations to accept. Thus, based on the
likely differences between the two organisation’s structures (public and private universities
in the present study), it is hypothesised as:
H13c1: The influence of the predictors BI, PU, TF, RF, SE, IS, and GS towards BU is moderated by
organisational type, or (BI, PU, TF, RF, SE, IS, GS) X ORG����BU
H13c2: The influence of the predictors SN, PEOU, IS, and GS towards PU is moderated by organisational
type, or (SN, PEOU, IS, GS) X ORG����PU
135
H13c3: The influence of the predictors PU, PEOU, TF, RF, SE, AT, NAT, and SN towards BI is
moderated by the organisational type, or (PU, PEOU, TF, RF, SE, AT, NAT, SN) X ORG����BI
H13c4: The influence of the predictor SN towards PEOU is moderated by organisational type, or SN X
ORG���� PEOU
3.5.2. Academic position
Academic position (AC) in this study is examined differently from the perspective of
‘support’ in terms of facilitation conditions (top and low-level management support, see
section 3.2.6). This section intends to examine an individual’s acceptance behaviour on the
basis of their job tenure. So far, the effect of job position or tenure in the literature is
reported as a surrogate of age and experience (e.g., Agarwal & Prasad, 1999). From the age
perspective, it is noticed that senior individuals who have greater job tenure (assumed to be
higher on position) showed more resistance towards innovation compared with more junior
colleagues (e.g., Agarwal & Prasad, 1999; Majchrzak & Cotton, 1988). For instance,
Majchrzak & Cotton (1988), in the context of new production of technologies, found that
individuals with higher work experience showed a higher reluctance towards change.
Similar results were found by Igbaria (1990) who reported that older individuals, due to
less computer exposure and knowledge, were less flexible and more resistant to change
and, in turn, perceived a lower importance of behavioural beliefs and attitude.
Another possible explanation behind these results can be understood from the perspective
of an individual’s cognitive behaviour. For instance, it is noticed that individuals lower in
age (possibly lower on job position) are reported to be more interested in learning new
behaviour compared with older individuals, who may take extra time to perceive and
render the cues and learn the system (Morris & Venkatesh, 2000; Taylor & Todd, 1995a;
Kite, 1996; Porter & Donthu, 2006) (see section 3.4.1). Therefore, based on rationales
related to age, it is expected that individuals (academics in the present context) lower on
job position will be more open to accepting technology compared with senior individuals.
From the perspective of experience (higher experience means higher on job position), the
effect of job position is reported as opposite to the conceptualisation of age. For instance,
contrary to the previous discussion, the literature suggests that higher in experience has a
positive effect on usage behaviour through beliefs (PU and PEOU) and a negative effect
through normative beliefs (SN) (e.g., Igbaria et al., 1995; Venkatesh & Davis, 2000).
Rationally, it is noticed that computer experience is likely to improve an individual’s
usage behaviour by increasing their confidence in mastering challenging tasks and erasing
fear that may produce reluctance in acceptance behaviour (Gist et al., 1988, 1989; Igbaria
& Iivari, 1995) (see section 3.6.1). However, not all experience is necessarily related to age
136
(i.e., older in age will be higher on job position) and increased acceptance behaviour.
Morris & Venkatesh (2000) reported that older individuals were less experienced
compared with younger individuals. The authors argued that older individuals in their
twenties and thirties were less familiar with technology compared with the current younger
generation. The reason is obvious in that technology was less common, and individuals
were more accustomed to applying traditional methods. Hence, this leads to the perception
discussed previously, that individuals in higher job positions will be less open to accept
newer technologies in the workplace.
Finally, from the gender perspective, it is assumed that generally higher job positions
favour men and masculine individuals and hence, favour higher attitude and lower
normative beliefs. A possible explanation is related to the discussion in the gender section
(see section 3.4.2). According to this, men and masculine individuals compared with
women tend to be assertive and place higher importance on behavioural belief PU, whereas
women tend to be nurturing and place higher importance on normative, control, and
management support beliefs. Assimilating the discussion, it is noticed that academic
position is a situational variable that can provide mixed results according to the context.
Therefore, it is hypothesised on an exploratory basis:
H13d1: The influence of the predictors BI, PU, TF, RF, SE, IS, and GS towards BU is moderated by
academic position, or (BI, PU, TF, RF, SE, IS, GS) X AC����BU
H13d2: The influence of the predictors SN, PEOU, IS, and GS towards PU is moderated by academic
position, or (SN, PEOU, IS, GS) X AC����PU
H13d3: The influence of the predictors PU, PEOU, TF, RF, SE, AT, NAT, and SN towards BI is
moderated by academic position, or (PU, PEOU, TF, RF, SE, AT, NAT, SN) X AC����BI
H13d4: The influence of the predictor SN towards PEOU is moderated by academic position, or SN X
AC����PEOU.
3.5.3. Educational level
In DOI, Roger (1995) argued that innovators are most likely higher on education, income,
and leadership characteristics, and possess more a favourable attitude towards risky
decisions to accept new technologies. In addition, the author suggests that an innovation
without principle-knowledge might produce a misuse of new technology and results in
discontinuance. In relation, the literature shows that educational level (EL) is directly
related to knowledge skills, and thus shows a positive effect on beliefs pertaining to
behaviour (e.g., Agarwal & Prasad, 1999; Rogers, 2003; Igbaria & Parasuraman, 1989).
For instance, Rogers (1995) reported that in the category of ‘early adopter’, one reason is
their higher level of education, which reflects their ability to understand ‘how-to-
knowledge’ more quickly and easily compared those with a lower level of education. In the
137
same line of research, Agarwal & Prasad (1999) found a positive relationship between
educational level and belief PEOU, but not with PU. The authors argued that less educated
individuals tend to be more sensitive to effort expectancy, and hence this results in a
barrier to the adoption process (ibid). Agarwal’s findings are consistent with social
psychology literature (e.g., Hilgard & Bower, 1975), which asserts that low education
reflects less sophisticated cognitive structures that impede an individual’s ability to learn in
new environments. Contrary to Agarwal & Prasad’s findings, Burton-Jones & Hubona
(2006) recently found a positive effect of education on PU with the argument that
education increased PEOU, which in turn reduced anxiety and improved overall attitude in
terms of usefulness. In addition, based on the same argument, the authors also reported a
diminishing effect of social influence on behaviour with increased experience and
educational level. Similarly Lymperopoulos and Chaniotakis (2005) found that education
combined with experience affects attitude of individuals indirectly through the belief PU.
Despite mixed results, the importance of education on an individual’s acceptance
behaviour is indisputable (see meta-analysis of Mahmood et al., 2001 and Sun & Zhang,
2006). Therefore, based on previous research which suggests that education is negatively
related to computer anxiety and positively related to the perception of usefulness and
attitude towards behaviour intention and usage (e.g., Howard & Smith, 1986; Igbaria &
Parasuraman, 1989; Igbaria, 1993; Porter & Donthu, 2006; Davis & Davis, 1990), it is
hypothesised on an exploratory basis:
H13e1: The influence of the predictors BI, PU, TF, RF, SE, IS, and GS towards BU is moderated by
educational level, or (BI, PU, TF, RF, SE, IS, GS) X EL����BU
H13e2: The influence of the predictors SN, PEOU, IS, and GS towards PU is moderated by educational
level, or (SN, PEOU, IS, GS) X EL����PU
H13e3: The influence of the predictors PU, PEOU, TF, RF, SE, AT, NAT, and SN towards BI is
moderated by educational level, or (PU, PEOU, TF, RF, SE, AT, NAT, SN) X EL����BI
H13e4: The influence of the predictor SN towards PEOU is moderated by educational level, or SN X
EL����PEOU
3.6 Moderators: Situational variables
3.6.1. Experience usage
Experience (EXP) was introduced as a moderator in TAM2 and is defined as an
individuals’ involvement or action in something over a period of time (Venkatesh & Davis,
2000). In the literature, the experience construct seems to have a direct and moderating
impact to a significant level on behavioural, normative and control beliefs (e.g., Igbaria &
Chakrabarti, 1990; Igbaria, 1992; Taylor & Todd, 1995b; Venkatesh & Davis, 2000;
Venkatesh et al., 2003; Venkatesh & Morris, 2000; Venkatesh & Bala, 2008). It is

138
observed that experience acquired by repeating tasks produced low probability towards
individuals’ decision to accept new technologies (e.g., Taylor & Todd, 1995a; Fishbein &
Ajzen, 1975). The essence of this statement is based on the cognitive preposition, which
asserts that when IT usage is extremely enjoyable (higher in usage experience) than
behavioural belief, PU might not remain a construct of decision on the BI and BU (e.g.,
Davis, et al. 1989; Davis, 1989; Igbaria & Zinatelli, 1997; Chin et al., 2003; Burton-Jones
& Hubona, 2006). Similar criteria can be applied in the case of PEOU towards BI (e.g.,
Venkatesh et al., 2003; Agarwal & Prasad, 1999). In terms of normative beliefs and control
beliefs, experience (gained though time and training) also produced a negative effect. For
instance, researchers (e.g., Taylor & Todd, 1995a, 1995b; Venkatesh & Davis, 2000;
Venkatesh & Morris, 2000; Venkatesh et al, 2000; Venkatesh et al., 2004; Hu et al., 2003)
found a decreasing impact of SN on BI and BU, whereas researchers (e.g., Taylor & Todd,
1995b; Venkatesh et al., 2000; Venkatesh et al., 2004) found a decreasing impact of PBC
on BU. Contrary to the negative effect, experience has shown a positive effect (i.e.,
increase in explanatory power) between BI and BU (e.g., Davis et al., 1989; Taylor &
Todd, 1995b; Mathieson 1991; Venkatesh & Davis, 2000; Venkatesh et al., 2004; Hu et al.,
2003). For instance, during an examination of A-TAM, Taylor & Todd (1995b) found that
the effect of usage was significantly raised from 17% to 21%. Similar results were echoed
by Venkatesh & Davis (2000) during the development of TAM2. Thus, despite the
evidence in the discussion that experience decreases the impact on behavioural, normative,
and control beliefs and will increase intention and usage, still it is hypothesised on an
exploratory basis that:
H14a1: The influence of the predictors BI, PU, TF, RF, SE, IS, and GS towards BU is moderated by
experience, or (BI, PU, TF, RF, SE, IS, GS) X EXP����BU
H14a2: The influence of the predictors SN, PEOU, IS, and GS towards PU is moderated by experience, or
(SN, PEOU, IS, GS) X EXP����PU.
H14a3: The influence of the predictors PU, PEOU, TF, RF, SE, AT, NAT, and SN towards BI is
moderated by experience, or (PU, PEOU, TF, RF, SE, AT, NAT, SN) X EXP����BI
H14a4: The influence of the predictor SN towards PEOU is moderated by experience, or SN X
EXP����PEOU
3.6.2. Voluntariness
Voluntariness (VOL) is defined as: ‘an extent to which potential adopters perceive the
adoption decision to be non-mandatory’ (Venkatesh & Davis, 2000 p.188). In other words,
this is considered to be an explicit condition that helps to understand individuals’
perception when he/she uses a particular system. Voluntariness was initially introduced by
Moore & Benbasat (1991) during the extension of Roger’s DOI theory. At the time of the
139
TAM development, despite considering voluntariness as an explicit condition, Davis et al.
(1989) did not include it as part of the model. However, realising its importance, in a later
study (TAM2) Davis, along with Venkatesh (2000), included it as a key moderating factor.
Since this, moderator VOL, both alone and combined with EXP, is examined by a number
of studies in IT acceptance research (e.g., Venkatesh et al. 2003; Venkatesh & Davis,
2000; Sun & Zhang, 2006; Venkatesh & Bala, 2008).
In most of the research, the effect of VOL is observed on the relationships of SN and BI
(e.g., Hartwick & Barki, 1994; Venkatesh et al., 2003). Rationally, it is noticed that
normative beliefs can influence through two ways: directly through compliance or
indirectly through recognising perception of usefulness due to an internalisation and
identification process (Karahanna & Straub, 1999). The effect of compliance is closely
studied as the level of voluntariness (e.g., Venkatesh & Davis, 2000) in which individuals
are instructed to perform specific behaviour without prioritising their own intentions. In
simple words, the compliance effect increases the normative beliefs. Initially, the
significant effect of SN on BI in only mandatory settings was observed by Hartwick &
Barki (1994) but later on, Venkatesh & Davis (2000) retested and confirmed it in TAM2.
In the previous section (3.6.1) it was noticed that the effect of SN on BI subsided over time
with increased EXP; therefore, it may be argued that combined VOL and EXP can also
exhibit a moderating impact on intention. The argument is well-cited in literature. For
instance, Agarwal & Prasad (1997), in the extension of DOI, found that the system used in
mandatory conditions enhanced the early system utilisation, but at the same time it also
produced pressure on individuals to overcome the difficulties of first-time usage, which in
turn produced a lower level in acceptance behaviour. Consistent with Agarwal & Prasad
(1997), Venkatesh & Davis (2000) found a strong significant effect of SN on BI in early
system utilisation but was weaker on time and increased experience.
In the same line of research, Venkatesh et al. (2003) during the development of UTAUT,
re-evaluated the combined effect of VOL and EXP together in the models of TRA,
TAM/TAM2, TPB/DTPB, and C-TAM-TPB. Venkatesh et al. found that the effect of
belief PEOU, SN and PBC on PU and BI was only significant in mandatory settings and
decreased with increased experience. In addition, the authors in their integrated model
UTAUT, found that social influence (SI) showed a significant impact on BI in the
mandatory setting with limited experience. Despite the fact that VOL and EXP are
140
predominately related to the normative influence, it is still hypothesised on an exploratory
basis that:
H14b1: The influence of the predictors BI, PU, TF, RF, SE, IS, and GS towards BU is moderated by
voluntariness, or (BI, PU, TF, RF, SE, IS, GS) X VOL���� BU
H14b2: The influence of the predictors SN, PEOU, IS, and GS towards PU is moderated by voluntariness,
or (SN, PEOU, IS, GS) X VOL���� PU
H14b3: The influence of the predictors PU, PEOU, TF, RF, SE, AT, NAT, and SN towards BI is
moderated by voluntariness, or (PU, PEOU, TF, RF, SE, AT, NAT, SN) X VOL����BI
H14b4: The influence of the predictor SN towards PEOU is moderated by voluntariness, or SN X
VOL����PEOU.
3.7 Moderators: cultural variables
The moderating impact of culture integrated in the framework (figure 3.1) is
conceptualised with the help of four dimensions (MAS, IC, PD, and UA) suggested by
Hofstede (1980). In doing so, it helps to answer the research objective: ‘Is there any
perception of difference between segments of users (academics) towards acceptance of
technology (the Internet) due to their individual cultural differences?’ The rationales for
integrating cultural dimensions are two-fold: re-evaluating Hofstede’s cultural dimensions,
and incorporating them into the extended model to predict the difference on individual’s
acceptance behaviour. From the perspective of re-evaluation, it was noticed in the previous
chapter (section 2.14) that Hofstede’s dimensions are widely accepted in diverse fields of
research, but are equally criticised due to the lack of in-depth examination, poor
methodological foundations and measurement items, time elapsed since evaluation, and
hence, they merit further research. Incorporating Hofstede’s dimensions is also consistent
with the literature in the previous chapter (section 2.15), which revealed that studies in IT
acceptance largely applied Hofstede’s dimensions to only support their results, but in
reality a very few studies directly measured these dimensions, specifically within the same
culture. Before developing the hypothesis, it is necessary to clarify that, similar to the
demographic variables impact of cultural dimensions is examined on the basis of
exploratory basis. In doing so, it enables not only the validation of the paths suggested in
the previous literature but also helps to explore new relations within the categorical groups
of culture within same country context.
3.7.1. Masculinity-Femininity
According to Hofstede (1980), individuals high in masculine (MAS) culture tend to be
assertive and prioritise material accomplishments, while individuals in feminine culture
tend to be nurturing and prioritise human relationships and quality of life. From the

141
definition, it is obvious that the effect of masculinity will be highly relevant to the
behavioural belief PU due to the instrumentality effect and extrinsic motivation (see
conceptualisation of PU in TAM section 2.7) while, on the contrary, the effect will be
negatively related to the behavioural belief PEOU, normative beliefs, control beliefs, and
management support due to effect of intrinsic motivation (see conceptualisation of each
belief) (e.g., Srite & Karahanna, 2006; Parboteeah, et al., 2005; Venkatesh et al., 2004).
Despite this fact, masculinity and femininity are not synonymous with male and female,
but they are still highly correlated with each other (Hofstede, 1980). For instance, Bem
(1981) in the Sex Role Inventory (BSRI) found that men displayed more masculine traits
(e.g., assertiveness) compared with women, who exhibited more feminine traits (e.g.,
nurturing). Based on Bem’s conceptualisation, Venkatesh et al. (2004) and Srite &
Karahanna (2006) examined the effect of masculinity and femininity with relation to
gender and found similar results with marginal differences. Consistent with Bem and
follow-up studies, the conceptualisation of masculinity and femininity in the present study
is also rationalised with the effect of gender (see section 3.4.2). The summary of the
discussion suggests that men/masculinity perceived a higher importance of PU and AT,
while women/femininity perceived a higher importance of PEOU, SN, SE, GS, IS, and
NAT. Apart from the relation to gender, Hofstede & Hofstede (2005) reported that
masculinity is also interrelated with gender (younger), culture power distance (lower),
culture individualism-collectivism (individualist) and culture uncertainty avoidance
(lower). After careful investigation within related dimensions, it is noticed that relations
are more likely to be similar in all these dimensions. Given that, based on arguments and
consistent with the discussion in section (3.4.2), it is hypothesised on an exploratory basis:
H15a: The influence of the predictors BI, PU, TF, RF, SE, IS, and GS towards BU is moderated by the
cultural dimension MAS, or (BI, PU, TF, RF, SE, IS, GS) X MAS����BU
H15b: The influence of the predictors SN, PEOU, IS, and GS towards PU is moderated by the cultural
dimension MAS, or (SN, PEOU, IS, GS) X MAS����PU
H15c: The influence of the predictors PU, PEOU, TF, RF, SE, AT, NAT, and SN towards BI is moderated
by the cultural dimension MAS, or (PU, PEOU, TF, RF, SE, AT, NAT, SN) XMAS����BI
H15d: The influence of the predictor SN towards PEOU is moderated by cultural dimension MAS, or SN
X MAS���� PEOU
3.7.2. Individualism-Collectivism
Individualism-collectivism (IC) refers to the extent to which one perceives the relationship
between one’s self and the group of which one is a member (Hofstede, 1980). In
individualist culture, people tend to be more self-conceived and prioritise their own interest
above others (i.e., members in the same group or the organisation’s interest). Conversely,
142
an individual in a collectivist culture believes that one’s self-identity is dependent upon the
group’s identity. In other words, they are profoundly influenced by the group, and continue
to prove their unquestioning loyalty by complying with all acceptable or/and non-
acceptable norms and values (e.g., Srite & Karahanna, 2006; Hofstede & Hofstede, 2005).
As in individualist cultures, personal goals are more important than the collective,
therefore individuals in these cultures are expected to be influenced by the attitude and
behavioural beliefs. In contrast, in collectivist cultures where individuals’ decisions to
accept something is based on the group’s decision, it is expected that individuals in these
cultures will be influenced by the normative beliefs. The position of this argument is also
consistent with the literature in information system. For instance, Bontempo & Rivero
(1990) in meta-analysis, reported that an individualist’s behaviour is more closely related
to the attitude and collectivists towards norms.
Further exploration can also be understood from the basic conceptualisation of the beliefs.
For instance, in terms of PU which is one’s subjective probability to view the usefulness of
technology for self-interest can only be favoured to the individualistic. Rationally, within a
collectivist society, subjective probability is related to groups (McCoy, 2002) which can
favour the normative and control belief but not the belief PU (see also Parboteeah et al.,
2005). From the perspective of PEOU and SE, which are mostly complementary concepts
(e.g., Davis, 1989) and can be improved with the facilitation conditions (RF, TF), it will be
more relevant to the collectivist culture. This rationale is consistent with Hofstede’s (1980)
argument which posits that within the working environment, collectivism is associated
with training, physical conditions and use of skills. Finally, from the perspective of
normative beliefs and management support that are the perceptions of one’s decision based
on others’ will be expected to be higher in collectivist culture, as one is highly compliant
with priorities of group values. The rationales presented to conceptualise the
individualism-collectivism are also supported in information system literature (e.g.,
McCoy et al., 2005; McCoy et al., 2007; Srite & Karahanna, 2006; Pavlou & Chai, 2002;
Choe & Geistfeld, 2004; Parboteeah et al., 2005; Alsajjan & Dennis, 2010).
Apart from the direct conceptualisation, the interrelated effect of individualism-
collectivism can also be understood with the argument of Hofstede & Hofstede (2005).
Hofstede argued that cultures high in individualism are also correlated with the culture
low on power distance, low on uncertainty avoidance, high on masculinity, men in gender,
and finally, younger in age. Observing the discussion in relevant sections, specifically
143
within gender and masculinity (see section 3.4.2), it is noticed that relations proposed in
the present section are highly relevant within all groups. Thus, despite the clear rationale
that behavioural beliefs PU and AT will be highly relevant to the individualist, and
normative and control beliefs PEOU, SE, TF, RF, GS, IS, SN, and NAT will be relevant to
collectivist cultures, still it is hypothesised on an exploratory basis that:
H16a: The influence of the predictors BI, PU, TF, RF, SE, IS, and GS towards BU is moderated by the
cultural dimension IC, or (BI, PU, TF, RF, SE, IS, GS) X IC���� BU
H16b: The influence of the predictors SN, PEOU, IS, and GS towards PU is moderated by the cultural
dimension IC, or (SN, PEOU, IS, GS) X IC���� PU
H16c: The influence of the predictors PU, PEOU, TF, RF, SE, AT, NAT, and SN towards BI is
moderated by the cultural dimension IC, or (PU, PEOU, TF, RF, SE, AT, NAT, SN) X IC����BI.
H16d: The influence of the predictor SN towards PEOU is moderated by cultural dimension IC, or SN X
IC����PEOU.
3.7.3. Power Distance
Power distance (PD) is the extent to which an inequality is accepted as normal in a given
culture (Hofstede, 1980). In low PD cultures, individuals tend to be more egalitarian, and
feel less dependent on their superiors or working colleagues. Consequently, freedom of
equality diffuses the hierarchical structure within organisations and encourages individuals
to take part in the decision-making process (Leidner & Kayworth, 2006). In contrast,
within a culture high on PD, superiors and subordinates consider themselves unequal, and
thus, the traditional centralised hierarchal system is observed (Hofstede & Hofstede, 2005).
In high PD cultures, superiors are expected to tell and direct, and in turn, the subordinate
completes the tasks without measuring its merit or ethical values with the assumption that
the ‘superior is always right’ (ibid). In simple words, both groups of PD (high and low) are
distinct from each other on the basis of the compliance effect.
As in high PD, the compliance effect is higher, therefore individuals in these cultures are
expected to be influenced by the normative, control and management support belief. In
contrast, individuals in low PD are expected to be influenced by the behavioural beliefs,
specifically with the PU. The argument is consistent with the concept of ‘social influence’
(also known normative beliefs (see Venkatesh et al., 2003)) which can be manifest through
compliance, identification, and internationalisation effect (Kelman, 1958). According to
Srite & Karahanna (2006), within compliance an individual tends to accept influence from
another person/group with the aim of gaining a favourable advantage. In addition, from the
perspective of hierarchy, the effect of compliance is noticed to be higher as it is directed by
the more superior authority (ibid). Complementing Srite & Karahanna’s argument with
concept of high on PD (individuals are more concerned about complying with a superior’s

144
requirements and will fear disagreement), it is obvious that the effect of normative belief
towards acceptance intention will be more relevant in cultures with higher PD.
From the perspective of attitude and behavioural belief, specifically in terms of PU, the
effect is expected to be weaker within higher PD cultures. The rationale is consistent with
the previous literature (e.g., Harris, 1997; Gunton, 1988; Panko, 1988) which suggests that
technology is effective in conditions when it empowers the individuals to use it and decide
for themselves how to use it. Obviously, when individuals are empowered to think on their
own, they might start to depend upon their own skills (i.e. SE) and directly adopt the
technologies by perceiving its likely importance in job performance (i.e. PU). In some
cases, based on experience and familiarity with the technology, individuals start to suspect
their superior’s skills and regret accepting their decisions directly (Leonard-Barton &
Deschamps, 1988). Such instrumental values are contradictory within a high PD culture
where individuals are supposed to comply with their superior.
The rationales suggested above are also cited and validated within information systems
acceptance literature. For instance, researchers (e.g., Srite & Karahanna, 2006; Pavlou &
Chai, 2002; Hasan & Dista, 1999) found that the impact of normative beliefs on BI were
highly relevant within higher PD cultures only. Finally, from the perspective of the
interrelated effect of higher PD with other dimensions – higher on collectivism, higher on
feminine, women in gender, and older in age (Hofstede & Hofstede, 2005) – it is noticed
that the relationships presented in this section are also consistent with the relevant
dimensions (for more details, see the relevant sections). Therefore, despite the clear
rationales that high PD positively affects normative beliefs and negatively affects
behavioural belief, it is still hypothesised on an exploratory basis that:
H17a: The influence of the predictors BI, PU, TF, RF, SE, IS, and GS towards BU is moderated by the
cultural dimension PD, or (BI, PU, TF, RF, SE, IS, GS) X PD����BU
H17b: The influence of the predictors SN, PEOU, IS, and GS towards PU is moderated by the cultural
dimension PD, or (SN, PEOU, IS, GS) X PD����PU
H17c: The influence of the predictors PU, PEOU, TF, RF, SE, AT, NAT, and SN towards BI is
moderated by the cultural dimension PD, or (PU, PEOU, TF, RF, SE, AT, NAT, SN) X PD����BI
H17d: The influence of the predictor SN towards PEOU is moderated by cultural dimension PD, or SN
X PD���� PEOU.
3.7.4. Uncertainty Avoidance
Uncertainty Avoidance (UA) is the extent to which a member of the culture feels
uncomfortable with uncertain situations (Hofstede, 1980). According to Dorfman &
Howell (1988), it is the degree to which an individual favours structured over un-structured
situations. In high UA cultures, individuals often feel threatened by uncertain conditions

145
(Ford et al., 2003; Parboteeah et al., 2005). To avoid such feelings and achieve stability at
work, members in these societies are heavily pushed to rely upon formal rules and pre-
defined structures (Hofstede, 1980). By contrast, in low UA cultures, people feel
autonomous, and methods and procedures are volatile as individuals find new ways to
accomplish given tasks (Hofstede, 1980; Gunton, 1988). According to Dorfman & Howell
(1980), in low UA cultures, people tend to be more tolerant and feel less anxiety when
confronted with challenging or unpredictable problems.
The effect of UA in the technology acceptance domain is most clearly discernible on
behavioural beliefs and normative beliefs towards behaviour intention. For instance, from
the perspective of normative beliefs, the effect is expected to be stronger in situations with
a higher level of uncertainty. The rationale is consistent with the study of Srite &
Karahanna (2006). According to this, the social environment can be an important source of
information to reduce the level of uncertainty by determining the rules and their
acceptability. More specifically, if peers or superiors in an environment share their own
experience and perceptions, then individuals start to take them as evidence of reality (i.e.,
rule), which is socially desirable and acceptable (Karahanna, et al., 2005), and as a result,
the effect of uncertainty is reduced.
Similar to normative beliefs, the effect of belief PEOU, control beliefs and management
support beliefs are also expected to be stronger with respect to situations with a higher
level of uncertainty. This argument is consistent with the level of anxiety and stress that is
noted to be higher in highly uncertain situations (e.g., Dorfman & Howell, 1988; Hofstede
& Hofstede, 2005). According to social cogitative theory (SCT), anxieties and
expectancies (self-efficacy and ease of use) are reciprocal to each other (Bandura, 1986).
Therefore, higher anxieties indirectly decrease the self-efficacy (one’s self-
evaluation/confidence to complete targeted task) and decrease overall performance
(Bandura, 1977; Rosen & Maguire, 1990; Brosan, 1998). To overcome such conditions and
increase self-control, an individual tends to rely on facilitation conditions (resource and
technology facilitations, and management support) and support from the social
environment (e.g., Srite & Karahanna, 2006; Venkatesh & Morris, 2000; Hwang, 2005).
Thus, normative and control beliefs will be more important predictors of BI for individuals
within high uncertainty avoidance cultures.
In contrast, the effect of belief PU is noticed to be weaker with respect to higher UA
cultures (e.g., Parboteeah et al., 2005; Harris, 1997; Alsajjan & Dennis, 2010). The reason
146
is obvious in that IT innovations inherently involve change and uncertainty in
organisations (Yoon et al., 1995). Literature suggests that individuals in higher UA culture
are more bound or habitual with pre-defined rules and standardised procedure (e.g.,
McCoy, 2002; Veiga et al., 2001). Consequently they are more likely to view change as
negative and fail to perceive the usefulness of information technology in their work
(Parboteeah et al., 2005; Ford et al., 2003).
In fact, previous research suggests that the usefulness of technology is associated with the
freedom through which an individual is able to decide when and how the technology will
be useful to accomplish targeted tasks (e.g., Cotterman & Kumar, 1989; Goodhue &
Thompson, 1995). According to Harrison & Rainer (1992) and Harris (1997), an individual
who is less conformist to rules (low UA), social norms, and accepted work patterns is less
likely to have feelings of anxiety towards technology, and therefore will be more likely to
accept the information technology on their own through perceived advantages (PU). Apart
from the given argument, the previous research reviewed by Ford et al. (2003), and
literature (e.g., Parboteeah et al., 2005; Hasan & Dista, 1999; McCoy et al., 2007; Hwang,
2005) reported that countries that were higher on UA typically showed higher resistance
towards new technological applications and relied more on traditions. Finally, from the
perspective of the interrelated effect of higher UA with other dimensions – higher on
collectivism, higher on feminine, women in gender, and older in age (Hofstede &
Hofstede, 2005) – it is noticed that the relationships presented in this section are also
consistent with the relevant dimensions (for more details, see the relevant sections). Hence,
despite the clear rationale that higher UA positively affects the relationship between
normative and control beliefs, and negatively on perception of usefulness, still it is
hypothesised on exploratory basis that:
H18a: The influence of the predictors BI, PU, TF, RF, SE, IS, and GS towards BU is moderated by the
cultural dimension UA, or (BI, PU, TF, RF, SE, IS, GS) X UA����BU
H18b: The influence of the predictors SN, PEOU, IS, and GS towards PU is moderated by the cultural
dimension UA, or (SN, PEOU, IS, GS) X UA���� PU
H18c: The influence of the predictors PU, PEOU, TF, RF, SE, AT, NAT, and SN towards BI is
moderated by the cultural dimension UA, or (PU, PEOU, TF, RF, SE, AT, NAT, SN) X UA����BI
H18d: The influence of the predictor SN towards PEOU is moderated by cultural dimension UA, or SN
X UA����PEOU

147
Conclusion
This chapter has provided a theoretical framework based on the previous prominent
theories and models in the technology acceptance research domain i.e., SCT, TAM,
TAM2, TRA, DTPB, TTF and UTAUT. In addition, Bem’s BSRI and Hofstede’s cultural
theory were also integrated to examine the moderating effect on direct relationships. Based
on 13 direct determinants, a total of 12 hypotheses with 23 paths were proposed in the
model. Specifically, for the direct relationship of behavioural beliefs (PEOU and PU) three
hypotheses with four paths, for normative beliefs (PI and SI) two hypotheses with six
paths, for control beliefs (TF, RF, and SE) two hypotheses with six paths, for task
characteristics (AT and NAT) two hypotheses with two paths, for behavioural intention
(BI) one hypothesis with one path, and finally, for management support (GS and IS) two
hypotheses with four paths were presented.
After direct relationships, based on seven demographic and four cultural factors 6
hypotheses with 44 paths were proposed on an exploratory basis. Specifically, for the
demographic variables (age, gender, education-level, organisation-type, academic position,
voluntariness, and usage experience) two hypotheses with twenty-eight paths, and for
cultural variables (PD, IC, MAS, and UA) four hypotheses with sixteen paths were
presented. Dissecting the number of moderating relationships into a large number of paths
only intends to examine the possible effect, not the causal effect at each level. In the next
chapter, the proposed methodology and data analytical tools are being discussed to validate
the paths presented in this chapter.
148
Chapter 5
Research methodology
Introduction
The purpose of this chapter is to elucidate and justify the methodology and approach to
collecting and analysing the data. Choosing a certain methodology, as well as methods for
data collection and analysis, is tantamount to deciding an overall viewpoint that determines
what the researcher will come to find. In this chapter, section (4.1) discusses why this
research is positioned from the perspective of positivist epistemology and ontology.
Sections (4.2 and 4.3) discuss the two major paradigms in social science research, i.e.,
qualitative and quantitative research, with a justification of the selection of the quantitative
research method of surveys for this study. Section (4.3) explains the overall research
design, including the purpose of the study, type of investigation, extent of researcher
interference, study settings, unit of analysis, and time horizon. Section (4.4) discusses the
survey questionnaire development process, content, wording and layout criteria. Section
(4.5) discusses the selection of the population and sample for the present research with the
support of strong rationales and justifications. Sections (4.6 and 4.7) discuss the instrument
development and scale adoption respectively. Finally, sections (4.8, 4.9, and 4.10) discuss
the data collection techniques, pilot study, and data analysis technique with structural
equation modelling (SEM) using PLS. Finally, section (4.11) considers the ethical issues
with a summary in end.
4.1. Understanding epistemological and ontological considerations
According to the Oxford English Dictionary, the word ‘philosophy’ means the study of the
fundamental nature of knowledge, reality and existence (Oxford, 2005). It is a viewpoint or
a perspective that enables a researcher to perceive reality in the way in which it is
described, and its relationship with knowledge that explains how the reality has been
observed. Denzin & Lincolan (2000) observed philosophical assumptions as a set of
paradigms that are based on beliefs that guide a researcher’s actions to know how the world
works, and what characteristics of human nature are necessary.
Guba & Lincoln (1994) categorised the complexities of the various research philosophies
into three basic groups: ontology, epistemology and methodology. Whereas ontology refers
149
to questions about the nature of the reality to be known or examined, epistemology refers to
questions concerning the relationship of the researcher to the problem being researched,
whereas methodology refers to questions and techniques of the research process of
collecting and validating empirical evidence. An identical explanation was also postulated
by Creswell (2003) and Myers (1997). Furthermore, Guba & Lincoln (1994) and Lincoln &
Guba (2000) classified three philosophical paradigms into four schools of thoughts as:
positivism, post-positivism, critical theory and constructivism. The major classification of
each philosophical assumption and its corresponding philosophical thought are presented in
table 4.1, and discussed as follows:
• Positivism: the school of thought that predominantly advocates value-free (i.e.,
objective) natural sciences methods to study social reality and beyond (Bryman &
Bell, 2007). Based on rigorously applicable procedures, it is regarded as a one-way
mirror of inquiry in which researcher and researched object are presumed to be
independent entities without influencing each other (Guba & Lincoln, 1994).
• Post-positivism: a school of thought established in the early 19th century that
suggests that, within the context of research on human behaviour and actions, a
researcher cannot be ‘positive’ about claimed knowledge (Creswell, 2003). Identical
to positivism, the background philosophy is objectivism (i.e., social phenomenon
are independent from social actors (Bryman & Bell, 2007)), with only the
contradiction of inquiry method, which not only aims to verify the cause-law effect
but is also used to falsify the theoretical assumptions or hypotheses.
• Critical theory: the school of thought based on the principle of realism/subjectivism
in which social phenomenon is dependent upon a social actor’s conceptualisation
and the way he/she knows about reality (Bryman & Bell, 2007). In this, researcher
perception is influenced by the research objective(s) due to how they are inter-
linked with each other (Guba & Lincoln, 1994). The method of inquiry within
critical theory is mostly observation and the interview process, in which a problem
(i.e., realism) based on theoretical concepts is examined to finally present a
hypothesis that can be tested (Guba & Lincoln, 1994; Bryman & Bell, 2007).
• Constructivism: the school of thought that advocates that social phenomenon and
their meanings are continually being achieved by social actors (Bryman & Bell,
2007). Identical to critical theory, the background principle is based on
subjectivism, with one main exception: realities are produced through social

150
interaction that is often shared or categorised by many individuals together. The
methods of inquiry for examining the objective(s) in constructivism (also referred to
as ‘postmodernism’) are mostly interview and hermeneutics (Guba & Lincoln,
1994; Klein & Myers, 1999; Walsham, 1995).
Philosophical
assumption Positivism Post-positivism Critical theory Constructivism
Ontology
Native realism: real reality exists but is apprehendable. It is conventionally summed up in time and context-free generalisations, and is based on cause-effect laws.
Critical realism: real reality but only imperfectly and probabilistically apprehendable.
Historical realism: virtual reality shaped by social, political, cultural, economic, ethnic, and gender values; crystallised over time.
Relativism: local and specific constructed realities
Epistemology
Dualist/objectivist; finding true
Modified dualist/ objectivist; critical tradition/ community; findings probably true.
Transactional/ subjectivist; value-mediated findings.
Transactional/ subjectivist; created findings.
Methodology
Experimental/manipulative; verification of hypotheses; chiefly quantitative methods.
Modified experimental/manipulative; critical multiplism; falsification of hypotheses; may include qualitative methods.
Dialogic/dialectical Hermeneutical/dialectical
Table 4. 1: Underlying research philosophical paradigms: Source: Guba & Lincoln, 1994
Positivism and post-positivism are the opposing schools of thought to
constructivism/interpretivism (Denzin & Lincoln, 2000), and are sometimes called the
‘scientific deductive method’, to conduct empirical and quantitative research (Creswell,
2003). Both perspectives reflect the deterministic-reductionist approach in which ideas are
dissected into a small set of the items/variables with their effects and outcomes. Variables
in positivist and post-positivist approaches are used to constitute hypotheses which are
numerically measured by experiments (Creswell, 2003).
On other hand, social critical theory and social constructivism are based on the principle of
subjectivism and interpretivism (see Mertens, 1998). Both perspectives are ‘naturalistic
inductive methods’ of inquiry in which individuals seek to understand the world through
establishing subjective meanings of their experiences towards certain objects (Creswell,
2003). Contrary to objectivism, the method of inquiry within interpretivism is known as
‘qualitative’, in which ideas are not categorised into small chunks of variables, but are
further elaborated into theories with a specific context (Crotty, 1998).

151
4.1.1. Selection of positivism research approach
In order to guide the research in one particular direction, the selection of a positivist
approach is based on the nature of the problem addressed and previous literature in a
similar domain. Methodologically the positivist approach endeavours to examine reasoning
using a deductive process (Hirschheim & Klein, 1992) which in brief is mostly depicted
through: 1) the formulation of hypotheses, models, or causal relationship within constructs,
2) the probable use of quantitative methods to test relationships, and 3) the researcher’s
value-free interpretation objective (Chen & Hirschheim, 2004). Within a meta-analysis of
methodological paradigms Orlikowski & Baroudi (1991, p.5) classified studies as positivist
if they were based on prior fixed relationships, quantifiable measures of variables,
hypothesis testing, and drew inferences about phenomenona from the sample to a stated
population. The literature suggests that possible methods of inquiry within the positivist
approach could be: observations, measurements, surveys, questionnaire instruments,
laboratory and field experiments, statistical analysis, simulations, and case studies
(Mingers, 2003; Choudrie & Dwivedi, 2005).
The primary objective of this research is to investigate the predictors of an individual’s
(academics) acceptance beliefs that are established through the influence of perceived
behavioural beliefs, social and control beliefs, tasks characteristics, and management
support. Exploring the moderating impact of culture and demographic variables was also of
interest to the investigation. Therefore, from an ontological perspective, the positivist
approach suits the present study. As Orlikowski & Baroudi (1991, p.9) state, within
positivist ontology, “the role of [the] researcher is to discover the objective physical and
social reality by crafting precise measures that will detect and gauge those dimensions of
reality that interests the researcher.” This study is also justified from the perspective of a
positivist epistemological approach which, according to Chua (1986), regards beliefs about
knowledge as verified or shown to be false through empirical testable theories and a
hypothetical-deductive approach. In the present study, Chua's (1986) criteria for adopting a
positivist approach can be viewed by observing the ultimate goal of the study, which, as
described earlier, is to examine the constructs of behaviour intention for the acceptance of
new technologies. Consequently the goal requires a conceptual framework with a clearly
defined number of constructs and their relationships (i.e., independent, dependent, or
moderating). In doing so, the literature review in chapter 2 reveals that a considerable

152
number of theories and models are present within the domain of technology acceptance for
examining the various objectives of technology acceptance (see literature review table 2.2).
As a result, developing a conceptual model with rationales (e.g., Venkatesh et al., 2003) to
achieve the objective of this study is achievable.
Selecting positivist research does not suggest that other philosophical thoughts for the
present study are inappropriate. However, some rationales can be argued in favour of the
positivist approach. For instance, applying a post-positivist approach would require an extra
step of interviews to explore the cause and effect relationship (initially assumed to be false)
(Guba & Lincoln, 1994), which is far removed from the pertinence of the present study. As
discussed earlier, there is broad and up-to-date literature present within the domain of
information systems acceptance to explore the constructs and their relationship(s).
Therefore, adopting a post-positivist approach would only result in wastage of time, money
and effort. Additionally, unlike the post-positivist approach, which aims to explore
differences between the contexts of the phenomenon to establish the cause and effect
between the constructs (Guba & Lincoln, 1994), this research aims to explore the effect of
the widely accepted constructs (established within North American and Western countries)
on a single phenomenon (academics within higher educational institutes) and the context of
a single developing country (Pakistan). To avoid bias or the impact of a researcher on a
researched object, critical and constructivism theories are completely over-looked. Also,
the aim of this research is purely based on objectivism and there is little or no interference
required by the researcher on the researched problem, therefore adopting a critical and
constructivist research approach is unjustifiable because both of these are based on a
relativist (also called subjectivist) approach with an interlocking relationship between the
researcher and the researched object (Guba & Lincoln, 1994; Mertens, 1998).
4.2. Research strategy: quantitative and qualitative
According to Creswell (2003), quantitative methodology is based on objectivism ontology,
positivism epistemology, voluntarism/unbiased axiology, and deductive methodology.
Whereas Bryman & Bell (2007) explained the quantitative research strategy as a deductive
approach that typically uses scientific procedures and numerical analysis to illustrate the
relationship(s) among the factors in the phenomena of studies. Contrary to this, the
qualitative strategy uses methods to derive the theories and hypotheses by emphasising
description and understanding the situations behind the factors (Creswell, 2003; Klein &
Myers, 1999). Advantageously, qualitative research enables the researcher to see how
153
individuals perceive and interpret a social reality that is not static and changes over time
(Bryman & Bell, 2007).
The motivation for adopting a quantitative research strategy was applicable to this study
because it is one of the most useful methods in natural sciences as well as in social sciences
research. It helps the researcher to test and establish the reliability and validity of
previously researched theoretical propositions and hypotheses that are solely dependent on
experimentation and measurement techniques (Patton, 1990; Blumberg, Cooper &
Schindler, 2005). In contrast, not selecting qualitative research methods does not suggest
that they are an unreliable method for the present study or cannot be used in future
research. Predominantly, a qualitative research strategy is best suited when research aspires
to explore society in a subjective manner by describing and interpreting human changing
phenomena in a natural context. Moreover, it is the most reliable method of research when
there is little previous research literature present to delineate constructs and their
relationship(s) (Cohen, Manion & Morrison, 2000; Gilbert, 2001). However, this research,
which aims to see the world in an objective manner without researcher impact on the
researched object or problem domain, requires the testing of hypothetical observations
emerging in human behaviour towards the acceptance of information technology (IT).
Additionally this study, which is formulated using appropriate literature and poses a clear
relationship(s) between constructs needed to uncover the relevant data with the help of
statistical tests (Collis & Hussey, 2003), cannot be achieved through qualitative methods.
Perhaps formulating theoretical propositions or producing hypothetical observations in the
current context of the study is possible with a qualitative method, but their constructs
validations and relations still requires a positivist approach based on the quantification
method that is only possible with quantitative methodology. As Creswell (2003) stated, that
validation of theoretical generalisations and propositions in scientific endeavour, especially
in social and business studies, requires a quantitative method that can be tested and
interpreted numerically. Undoubtedly, qualitative methodology is a reliable method for
both group and individual studies, allowing the researcher to explore within a natural
setting, generate theories, and answer the questions that lead to an understanding of them
and the complex procedures to tackle them. It allows the researcher to study problems that
have been previously little studied (Creswell, 2003; Cassell & Symon, 2004; Yin, 1994),
but as justified earlier, this is not relevant to the current research.
154
4.3. Selection of survey research strategy
Selecting an appropriate method or strategy is considered to be a critical issue within any
research to avoid decisions that could be contentious. A number of research approaches and
methodologies have been devised in the field of social sciences and information
technology, such as laboratory experimental research, field experiments research, survey
methods, case studies, action research, grounded theory, ethnography, phenomenology,
numerical methods such as mathematical modelling etc. (Creswell, 2003; Myers, 1997;
Crotty, 1998; Chen & Hirschheim, 2004). Amongst these research approaches, the survey
research approach is most appropriate for the present context of the study. The rationales
behind opting for survey research are twofold. First, it is the most similar research strategy
to that used in past literature in order to achieve similar objectives in the present study, and
second, it is most relevant to the present context of the study. Both rationales are described
briefly in the following sub-sections.
4.3.1. Review of methods previously applied in information system research
According to Zikmund (2003), survey research facilitates the collection of primary data as
a source of information from a sample of people by using questionnaires or interviews.
Chiefly, the objectives of survey research are to identify the characteristics of the particular
research problem, such as the need to know what is happening (e.g., increasing prices or
slower acceptance of new technology by academics etc.), why it is happening (e.g., some
idea about why people do or not do something), how it is happening (e.g., process before
some action, like decision-making, time period etc.), and who is involved (e.g., the
persons, groups, organisations, characteristics etc.) (Zikmund, 2003; McDaniel & Gates,
2006).
Within information systems research paradigms, most studies are dependent on the
methods and strategies that empirically answer their research questions with hypotheses
testing (Chen and Hirschheim, 2004). Consequently, the survey is considered to be the
most appropriate research method of enabling the researcher to examine the phenomena in
their natural setting while covering a large population (Pinsonneault & Kraemer, 1993).
The significance of the survey research within the information systems domain can be
observed with the meta-analysis literature.
For instance, Orlikowski & Baroudi (1991) in the meta-analysis of 155 articles in
information system published literature between 1985 to 1989 in leading journals
((Management Information Systems Quarterly (MISQ), Communication of the ACM

155
(CACM), Management Sciences and Proceedings of the International Conferences on
Information Systems (ICIS)) found that overall, 96.8% of the articles applied a positivist
approach leaving 3.2% offering an interpretivist approach. Within the positivist approach,
the survey research strategy was the most dominant method with 49% of the studies
choosing this, and 13.5% and 27.1% of the studies using case-study and experiments
respectively. Similarly, Farhoomand & Drury (1999) scrutinised 2,098 articles based on
empirical and non-empirical studies published between 1985 to 1996 in MISQ, CACM,
Journal of Management Information Systems (JMIS), European Journal of Information
Systems (EJIS), Information and Management (I&M), Management Sciences (MS),
Information System Research (ISR), and the Journal of Strategic Information Systems
(JSIS). The author found that 61% of the studies were based on empirical findings and the
remaining 39% were based on non-empirical findings. Of the 61% empirical studies, the
survey method was dominant, covering 32% of those studies followed by case studies and
laboratory experiments, which covered 17% and 2% respectively (ibid).
In alignment with the literature of meta-analysis, evidence of survey research as the
predominant strategy within the information system domain can be observed from the
studies of the past decade. For instance, Chen & Hirschheim (2004) examined 1,983
studies published during 1991 to 2001 in four U.S. journals and four European journals
including: MISQ, ISR, JMIS, ICIS, Accounting, Management and Information Technology
(AMIT), the Journal of Information Technology (JIT), and EJIS. The findings indicate that
the positivist approach remained dominant in the information system domain with a
contribution of 81% of the studies followed by just 19% using the interpretivist approach.
In addition, the authors found that within the positivist approach, the survey method was
widely adopted i.e., by 41% of the studies surveyed, followed by case studies and
laboratory experiments i.e., 36% and 20% respectively (ibid). Specifically, within the
context of technology acceptance and adoption, which is the objective of the present study,
Choudrie & Dwivedi (2005) reviewed 48 articles published during 2001 to 2003 in MISQ,
ISR, EJIS, and ISJ. The authors found that 74% of the studies employed the survey method
and the remaining 26% applied a case study research method (ibid).
After the review of the previous meta-analysis papers in the context of information system
and IT acceptance and adoption literature, it is clearly apparent that the survey is the most
widely accepted method. The case study and experimental methods appeared in second and
third place. Hence, the findings of the past relevant literature suggest that employing a
survey research method likely enables the achievement of the objective of this study.

156
4.3.2. Rationales for selecting surveys as the preferred research approach
Apart from the past literature, survey research is also an appropriate method of research
because it provides a quick, inexpensive, efficient and accurate means of assessing
information about a target population (Zikmund, 2003). Pinsonneault & Kraemer (1993)
defined three main objectives for conducting survey research. First, when a study requires
a quantitative method of inquiry with standardised information (e.g., hypothesis and
relationship between variables) about a subject (i.e., individuals, groups, organisations, or
communities, projects, applications, systems etc.); second, when a study requires the
collection of data by asking questions with a pre-defined structured instrument; and third,
when a study requires the ability to generalise information about a whole population’s
attitude, behaviour or characteristic of individuals and groups through a fraction of the
sample.
In line with Pinsonneault & Kraemer's (1993) criteria, the aims and objectives of this study
are purely based on the positivist approach (see section 4.1.1) with a quantitative method
of inquiry (see section 4.2). In addition, the research clearly defined hypotheses and
relationships (i.e., independent, dependent and moderating) between constructs with the
help of rational justification from well-cited previously conducted studies (see chapter 3).
In terms of subjects or unit of analysis as groups within an organisational context, the
literature favours a case study strategy (Creswell, 2003; Yin, 1994). However, in the
present study the unit of analysis are individuals (academics) working full-time in higher
educational institutes in Pakistan. Therefore, the survey approach is preferred in the present
context of the study due to its ability to enable the approach of large number of individuals
distributed geographically in an inexpensive and time-saving manner (Gilbert, 2001;
Hussey & Hussey, 1997).
The second and third criteria of Pinsonneault & Kraemer (1993) are related to the extent to
which a researcher can be part of the context being studied. Within the present context of
this study, i.e., an exploration of the factors of the Internet’s intended acceptance by large
numbers of individuals, it is impractical to become part of the context and identify the
results using interviews, ethnography, observation and similar methods within an
interpretivist epistemology. Also, one of the objectives of this research is to use the
invariance analysis (i.e., multiple group analysis) to examine the moderation impact of
culture and demographic variables, which require at least 100 observations in each group
(Hair et al., 2006). Therefore, when taking random samples of the whole population in
157
order to generalise the acceptance of behavioural beliefs, the survey method is more
feasible in comparison with others.
Finally, usage of the survey method in this research is a result of the type of theories and
models employed for the acceptance of information technology in past literature (see
chapter 2, model compression table 2.2). The conceptual model presented in chapter 3 is
consistent with the theoretical frameworks of the TRA, TAM, TAM2, DTPB and UTAUT
(Venkatesh et al., 2003; Davis, 1989; Davis, Bagozzi & Warshaw, 1989; Taylor & Todd,
1995a; Fishbein & Ajzen, 1975), which are employed by a number of researchers across
cultures using a quantitative-positivist approach with the survey method (e.g., Choudrie &
Lee, 2004; Straub, Keil & Brenner, 1997; Jarvenpaa & Leidner, 1999; Harrisburg, Hasan
& Ditsa, 1999; Pavlou & Chai, 2002; Oh, Ahn & Kim, 2003; Hu, Clark & Ma, 2003; Seyal
et al., 2004; Hsu & Chiu, 2004; McCoy, Everard & Jones, 2005; Wu, Wang & Lin, 2007;
Gupta, Dasgupta & Gupta, 2008). Therefore, following the tradition of the relevant
domain, it is assumed that the survey method is the preferred tool for answering the
objectives of the present study.
4.4. Research design
According to Creswell (2003), research design is an overall procedure for formulating
research problems, explaining the site chosen for data collection, ethical requirements
when entering into the field, procedures for collection and analysis of the data, and the role
of the researcher during the data collection process. Hussey & Hussey (1997) postulated
that the success of the research only depends upon the selection of the right research
process/steps within research design. In fact, research design is the process by which the
success of each step depends upon successful completion of the earlier step. The key steps
within the research design to carry out the research process within the present study are
illustrated in the form of a flow chart in figure 4.1.
Overall, the research design process is categorised into three major steps. The first step is
listed as research design and aims to establish and generate research hypotheses based on
constructs relationships (presented as the conceptual framework in chapter 3). The
generation of a hypothetical framework requires a review of published literature (chapter
2) related to the objective of the research question (chapter 1). After achieving a clearly
stated research question, in the second step a series of rational decisions is decided and
termed as the methodology (presented in the current chapter) to validate/test the
relationships (hypotheses or conjectures) between the constructs established. Finally, the

158
third step concentrates on the data collection process (presented within the current
chapter), empirical analysis (chapter 5), discussion (chapter 6), and conclusion and future
recommendations (chapter7).
Figure 4. 1: Research Design

159
4.4.1. Decisions to finalise research design
In the previous three chapters and at the start of this chapter, the first four primary
objectives within the research design (figure 4.1) were already accomplished i.e., to
explore the predictors of technology acceptance behaviour and establish a conceptual
model with a set of hypotheses. These in turn guided the researcher to select a positivist
philosophy with quantitative survey method for the data collection process. In this section,
the fifth step of the research design is to finalise the process and stages for accomplishing
the overall purpose of the study. In doing so, six steps or guidelines suggested by Sekaran
(2000) are taken to decide the purpose of the study, location or setting of the study, the
type of study, researcher extent within study, the time horizon, and unit of analysis of the
study. The rationale for each decision is given below with a summary of the decisions in
table 4.2.
4.4.2. Purpose of the study: Hypothesis testing
Based on the nature of the research, Sekaran (2000) categorised the purpose of the studies
as: exploratory, descriptive, and hypothesis testing. The purpose of the study reveals the
knowledge required for achieving the particular object. For instance, the exploratory stage
is preferred when new dimensions are required for exploration; descriptive is preferred in
situations when certain characteristics of the research need to be described; and hypothesis
testing is best suited to the stage when the nature of the problem has already been explored
and described using hypotheses (Sekaran, 2000). As described earlier, this study is based
on a positivist approach in which data is collected through the survey method to examine
the variance between independent and dependent variables conceptually related to each
other. Therefore, hypothesis testing, as suggested by Sekaran (2000), would be best suited
to achieve the objective of the research.
4.4.3. Type of investigation: Correlational study
Studies to test hypothetical relationships from the perspective of investigation are usually
categorised into two groups i.e., causal and correlational (Sekaran, 2000). Whereas the
purpose of causal investigation is to examine the best or most appropriate cause and effect
relationship or the impact of one variable directly or indirectly over another, the purpose of
correlational investigation is to identify or establish the important constructs/relations
associated with certain problems of domain (Sekaran, 2000; Bordens & Abbott, 2007).
Contrary to causal investigations, which examine exact relationships or delineate the cause
160
of one construct over another, this study aims to examine the salient relationships between
the constructs of an individual’s technology acceptance behaviour accompanied by
demographic and cultural characteristics. In addition, this study aims to determine whether
constructs presented in a conceptual framework are covary (i.e., there is a relationship
between constructs, so that change in one tends to be accompanied by change in the other
(Bordens and Abbott, 2007)), and if so, then determine the direction, variance and form of
the observed relationship. According to Hair et al., (Hair et al., 2006), analysis of research
based on covary relationships requires the simultaneous analysis of the paths together (i.e.,
multivariate-analysis with structural equation modelling) so the strength of most salient
paths would be exploratory. Therefore, due to the nature of the present study, correlational
type of investigation is favoured over the causal type of investigation.
4.4.4. Extent of researcher interference with study: minimal extent
The extent to which a researcher can be a part of the context being researched also plays an
important role in determining the proper research approach (e.g. case study, survey
approach etc.) (Choudrie & Dwivedi, 2005). It also has an impact on the type of
investigation selected, either causal or correlational (Sekaran, 2000). According to Sekaran
(2000), if the research is conducted in a natural setting, which is possible in correlational
studies, than the researcher has minimal interference. On the contrary, when the research
aims to establish a cause-and-effect relationship by some manipulation of variables, in
causal studies the role of researcher is considered to be higher. In the present study, the
positivist approach over critical and constructivism theories was adopted to avoid
researcher bias over research object (section 4.1.1). Covering a large number of population
face-to-face was impractical, therefore, the data collected in this study is based on little or
no intervention by the researcher with respondents directly.
4.4.5. Study settings: Non-contrived
Sekaran (2000) postulated that generally all studies that use a correlational type of
investigation (i.e., field studies) are conducted in non-contrived settings, whereas causal
studies (i.e., lab experiments) are conducted in contrived settings. As justified earlier, the
type of investigation in this study is correlational, therefore the nature of this study would
be non-contrived.
4.4.6. Unit of analysis: Individuals
Sekaran (2000) defined the unit of analysis as the level of aggregation of data collection
during the subsequent data analysis stage. The selection of the unit is an important aspect
161
which must be considered at the time of formulating the problem statement or posing the
research question (Creswell, 2003). For this study, it is vital to recall the research objective
which aims to examine the predictor of perceived behavioural beliefs, social and control
beliefs, management support, and task characteristics of an individual’s (i.e., in this study
academics working in higher educational institutes in Pakistan) acceptance behaviour with
moderation of demographic and cultural factors. Therefore, evidently the research question
invites the individuals to be the unit of analysis.
4.4.7. Time horizon: Cross-sectional
Sekaran (2000) defined cross-sectional (one-shot study) as a type of research that needs to
be conducted just once to collect data, and might last for weeks or months. He defined
longitudinal studies as research conducted at more than one point in time to see the change
in dependent variables. For the present study, a cross-sectional design is selected. The
reason is obvious from one of the aims of the study, which is exploration of the salient
predictors of acceptance behaviour using multivariate analysis techniques. According to
Hair (Hair et al., 2006), a minimum sample of 200 is required to obtain the best results in
multivariate studies using structural equation modelling techniques. Therefore, a cross-
sectional study is selected because it facilitates application to a large sample within a short
time span and the researcher has not had to wait for a number of years in order to examine
the change in dependent variables (Bordens & Abbott, 2007).
Research process steps suggested by Sekaran
(2000)
Research process selected for this research
1. Purpose of the study: Exploratory, Descriptive, Hypothesis testing, Case study analysis
Hypothesis testing
2. Type of investigation: Causal, Correlational Correlational
3. Extent of researcher interference in the study Minimal interference of researcher
4. Study settings: Contrived, Non-contrived Non-contrived
5. Unit of analysis: Individuals, Dyads, Groups, Organisation, Culture
Individuals
6. Time horizon: Cross-sectional, Longitudinal studies
Cross-sectional
Table 4. 2: Research design steps
4.5. Population and sampling
After selecting the most appropriate process for the research, the next step in research
design (figure 4.1) is to design a targeted sample. Generally, the word ‘sample’ within
research is defined as a selected segment of the population, which is carefully chosen to
draw conclusions that are generalisable to the overall targeted population (Bryman & Bell,
2007; Sekaran, 2000; Schindler & Cooper, 2003)). In the present study, designing the
sample is based on some main issues highlighted by Fowler (2002) as follows:

162
• Choice of sample: Either probability or non-probability sampling
• Sample frame: Specific unit of population required to be sampled
• Size of sample: Number of subjects required to be included
• Response rate: Ratio in percentage of sampled actually collected
4.5.1. Choice of sample
Before starting to collect the data it is essential to recognise the importance of respondents
and their information, so that all the relevant data for the targeted objective can be
achieved. There are two main types of sampling method, probability and non-probability
sampling method (Bryman & Bell, 2007). In the former, subjects within the population
have equal known chances of being selected, while in the latter, the elements do not have a
predominant chance of being selected (Bryman & Bell, 2007; Sekaran, 2000).
In the present context of the study, a probability sampling method is chosen to collect the
data. The reason is plausible in that the targeted population in the present study are
individual academics working in higher educational institutes which are categorised
demographically (age, gender, educational level, organisation type, academic position,
technology usage experience and conditions for using), and the response of all the groups
is required on an equal basis. It would be possible to select the non-probability sampling in
conditions when the study aims to generalise the findings of the present study for a specific
group of the individuals, for example, only male or female individuals within a specific
institute, etc. According to Sekaran (2000), when there are time or other factors rather than
generalisability concerns, then non-probability sampling is favoured over probability
sampling. Therefore, in alignment with the research objective to cover a large sample
within a short span of time (i.e., cross-sectional study), the probability sampling method is
chosen for the present context of the study.
4.5.2. Target population
The selection of a target population or research settings/context is a central part of any
research success (Baker, 1994). Realistically, the decision to select specific settings sets
the boundaries for the generalisability of the research, which in turn are considered as
potential limitations on hypotheses generated within the conceptual framework. Hence,
selecting the appropriate settings can assist the researcher in finding the most effective way
to examine the proposed theories and hypothesis with confidence by drawing conclusion
about empirical findings (Eisenhardt, 1989). Within any setting, the choice of selecting an
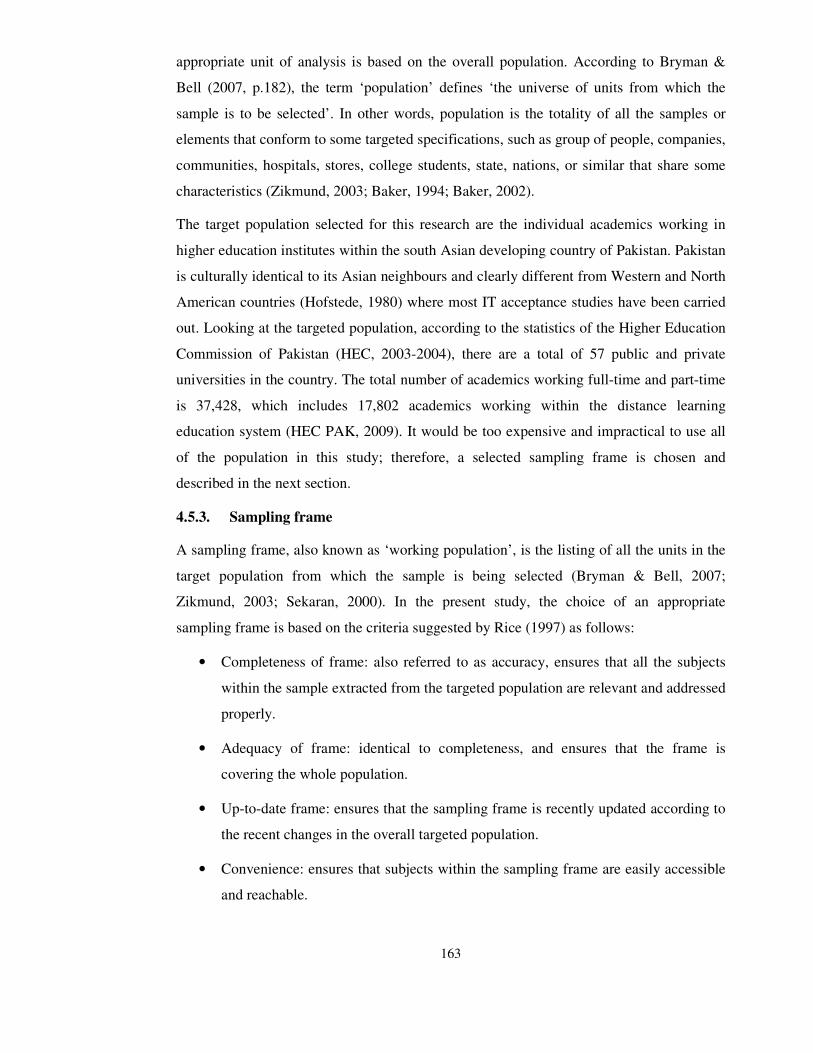
163
appropriate unit of analysis is based on the overall population. According to Bryman &
Bell (2007, p.182), the term ‘population’ defines ‘the universe of units from which the
sample is to be selected’. In other words, population is the totality of all the samples or
elements that conform to some targeted specifications, such as group of people, companies,
communities, hospitals, stores, college students, state, nations, or similar that share some
characteristics (Zikmund, 2003; Baker, 1994; Baker, 2002).
The target population selected for this research are the individual academics working in
higher education institutes within the south Asian developing country of Pakistan. Pakistan
is culturally identical to its Asian neighbours and clearly different from Western and North
American countries (Hofstede, 1980) where most IT acceptance studies have been carried
out. Looking at the targeted population, according to the statistics of the Higher Education
Commission of Pakistan (HEC, 2003-2004), there are a total of 57 public and private
universities in the country. The total number of academics working full-time and part-time
is 37,428, which includes 17,802 academics working within the distance learning
education system (HEC PAK, 2009). It would be too expensive and impractical to use all
of the population in this study; therefore, a selected sampling frame is chosen and
described in the next section.
4.5.3. Sampling frame
A sampling frame, also known as ‘working population’, is the listing of all the units in the
target population from which the sample is being selected (Bryman & Bell, 2007;
Zikmund, 2003; Sekaran, 2000). In the present study, the choice of an appropriate
sampling frame is based on the criteria suggested by Rice (1997) as follows:
• Completeness of frame: also referred to as accuracy, ensures that all the subjects
within the sample extracted from the targeted population are relevant and addressed
properly.
• Adequacy of frame: identical to completeness, and ensures that the frame is
covering the whole population.
• Up-to-date frame: ensures that the sampling frame is recently updated according to
the recent changes in the overall targeted population.
• Convenience: ensures that subjects within the sampling frame are easily accessible
and reachable.

164
• Non-duplication: an important criterion that ensures that subjects within the sample
are carefully selected without duplication.
In the present study, the sample frame is based on statistics provided by HEC (2003-2004)
which delineates the current number of universities and degree-awarding institutes (DAI)
with an exact number of academics working full-time, part-time and on a distance-learning
basis (see table 4.3).
Sector Full-time Part-time Total
Distance learning 182 17,620 17,802
Public 10.471 2975 13,446
Private 3963 2217 6180
Overall 14,616 22,812 37,428
Table 4. 3: Number of full and part-time faculty members within public and private sector universities/DAIs in 2003-04. Source: HEC (2003-04) (HEC PAK, 2009)
The statistics provided by HEC also help to examine the different levels of sampling
frames based on educational level, which range from the lowest level (bachelor degree) to
the highest level (PhD) (see table 4.5). Selecting the sample frame from HEC is
advantageous because of legal accessibility throughout time and world using its website
www.hec.gov.pk. In addition, statistics presented on the HEC website have almost
achieved all the criteria suggested by Rice (1997) with the exception of the up-to-date
frame, which represents a three year gap between the time of conducting this research and
the data updated on the website.
Surveying the whole population for a single study is very difficult and too expensive
(Sproull, 1995). Therefore, in the present study, the sample frame only includes those
individual academics who are working in the public and private sector with the omission of
distance learning sector individuals. Excluding individuals from within the distance
learning sector is reasonable due to the data collection method applied in the present study
(i.e., predominantly face-to-face survey). It is impracticable to locate individuals working
in the farthest territories and even abroad. Identically, the sample frame within the present
study only includes full-time individuals (academics) and excludes those individuals
working part time, which might increase the likelihood of data duplication (academics
working full-time in public sector institutes may also choose to work part-time within
private institutes), as warranted by Rice (1997). In addition, the reason for omitting part-
time academics from the sample frame is the non-availability of their educational level
data as officially published by the HEC (2003-2004), which can be observed from tables
4.3 and 4.4 (i.e., only presents the sample of full-time academics). It is worth explaining
that the present study aims to examine the validity and reliability of the conceptual model
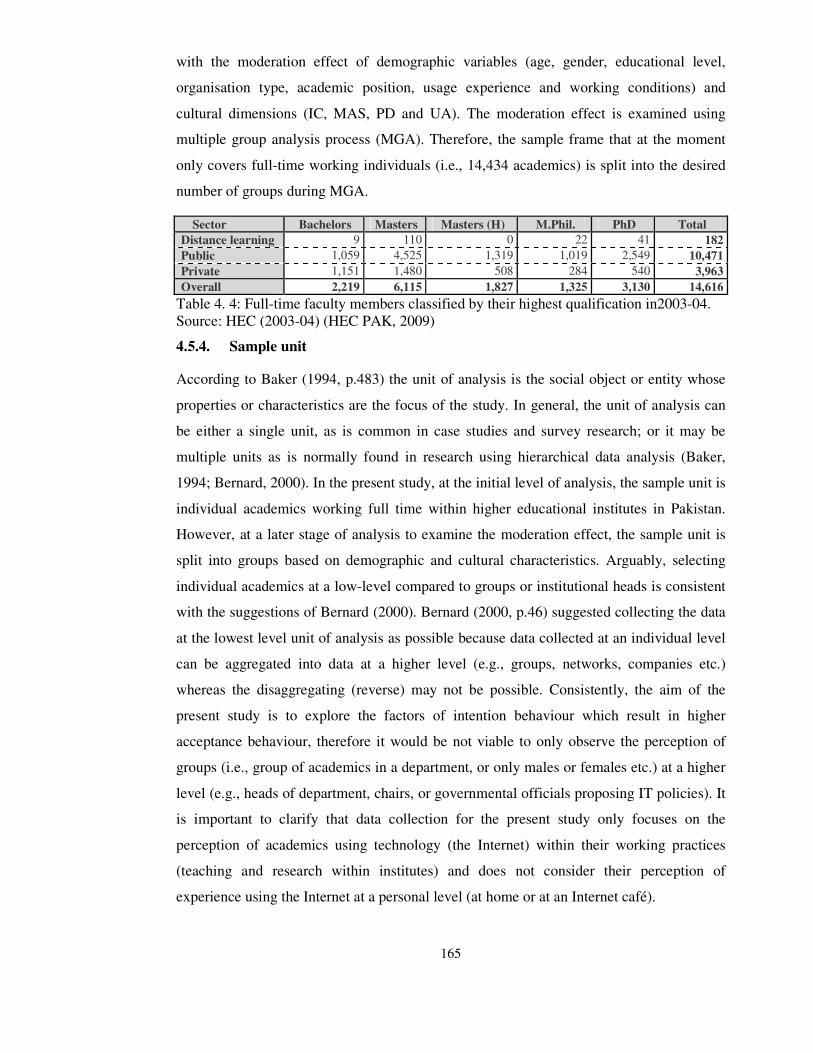
165
with the moderation effect of demographic variables (age, gender, educational level,
organisation type, academic position, usage experience and working conditions) and
cultural dimensions (IC, MAS, PD and UA). The moderation effect is examined using
multiple group analysis process (MGA). Therefore, the sample frame that at the moment
only covers full-time working individuals (i.e., 14,434 academics) is split into the desired
number of groups during MGA.
Sector Bachelors Masters Masters (H) M.Phil. PhD Total
Distance learning 9 110 0 22 41 182
Public 1,059 4,525 1,319 1,019 2,549 10,471
Private 1,151 1,480 508 284 540 3,963
Overall 2,219 6,115 1,827 1,325 3,130 14,616
Table 4. 4: Full-time faculty members classified by their highest qualification in2003-04. Source: HEC (2003-04) (HEC PAK, 2009)
4.5.4. Sample unit
According to Baker (1994, p.483) the unit of analysis is the social object or entity whose
properties or characteristics are the focus of the study. In general, the unit of analysis can
be either a single unit, as is common in case studies and survey research; or it may be
multiple units as is normally found in research using hierarchical data analysis (Baker,
1994; Bernard, 2000). In the present study, at the initial level of analysis, the sample unit is
individual academics working full time within higher educational institutes in Pakistan.
However, at a later stage of analysis to examine the moderation effect, the sample unit is
split into groups based on demographic and cultural characteristics. Arguably, selecting
individual academics at a low-level compared to groups or institutional heads is consistent
with the suggestions of Bernard (2000). Bernard (2000, p.46) suggested collecting the data
at the lowest level unit of analysis as possible because data collected at an individual level
can be aggregated into data at a higher level (e.g., groups, networks, companies etc.)
whereas the disaggregating (reverse) may not be possible. Consistently, the aim of the
present study is to explore the factors of intention behaviour which result in higher
acceptance behaviour, therefore it would be not viable to only observe the perception of
groups (i.e., group of academics in a department, or only males or females etc.) at a higher
level (e.g., heads of department, chairs, or governmental officials proposing IT policies). It
is important to clarify that data collection for the present study only focuses on the
perception of academics using technology (the Internet) within their working practices
(teaching and research within institutes) and does not consider their perception of
experience using the Internet at a personal level (at home or at an Internet café).

166
4.5.5. Sample size
Specifying the exact number of a sample size is a tricky and complex task. For instance, if
the sample size is lower than the estimated size it results in a greater chance of failure
convergence, improper solution (e.g., negative error variance estimated for measured
variable), and lower accuracy of parameter (Hair et al., 2006; Comrey & Lee, 1992). On
the contrary, a larger sample size than what is required will result in a waste of time,
expenses and process to obtain the respondents’ responses (Bryman & Bell, 2007;
Zikmund, 2003; Hair et al., 2006). Therefore, it is a critical question to know how large a
sample size should be so it can be generalised for all the targeted population with reliable
and trustworthy results. For the present study, the sample is selected by observing the most
cited rules of thumb within multivariate analysis and the requirements of data analysis
technique i.e., structured equation modelling (SEM) using CBSEM (e.g. AMOS, LISREL),
component-based or variance-based (e.g., PLS) techniques, and general approaches to
evaluating models using SEM.
Before applying the general approach of sample size selection, recall that the targeted
population for the present study is n=14,434 academics working full time within public
and private universities in Pakistan. There are two possibilities for estimating a sample size
that represents the overall population: 1) the sample selected would represent a random
number of individuals from the total population covering both public and private
universities (n=14,434), or 2) the sample size selected would represent separately selected
academics from public universities (n=10,471) and private universities (n=3,963) (see table
4.5). Following the generalised scientific criteria of sample selection suggested by Krejcie
and Morgan (1970) (c.f. Sekaran, 2000, p.295), the estimated sample size for the present
study is calculated as below:
Sector Full-
time
Part-
time
Total
Public 10,471 2,975 13,446
Private 39,63 2,217 6,180
Overall 14,434 5,192 19,626
Table 4. 5: Number of full and part-time faculty members by public and private universities/DAIs in 2003-04. Source: Adopted from HEC (2003-04) and modified for this research.
Krejcie & Morgan (1970), using rigorous statistical techniques, came up with a generalised
table of population to sample ratio (c.f. Sekaran, 2000, p.295). The total population needed
to be covered in the present study (n=14,434) is not given in Krejcie & Morgan’s (1970)

167
table, therefore, the average/mean for the two nearest population sizes given by Krejcie &
Morgan (10,000 and 15,000) is calculated in order to know the exact sample size as
follows:
According to Krejcie & Morgan (1970):
If the given population (N)=15,000 then sample (S) is required to be=375,
AND, if N=10,000 then S= 370,
Therefore, for the present study N=14,434, S is ((375+370)/2)=373.
Similarly, specifically for public sector universities, it is needed:
If the given population (N)=15,000 then sample (S) is required to be=375,
AND, if N=10,000 than S=370,
Therefore, for the present study N=10,471, S is ((375+370)/2)=373.
And, specifically for private sector universities it is needed :
If the given population (N)=4,000 then sample (S) is required to be=351,
AND, if N=3,500 then S=346,
Therefore, for the present study N=3,963, S is ((351+346)/2)=348.
Another technique to decide the sample size depends upon data analysis methods and
techniques (Fowler, 2002). Prior to discussion of the ‘rules of thumb’ to inspect the sample
size, it is necessary to recall that the data analysis method in the present study is based on
structural equation modelling (SEM). This is closely related to multiple regression
(multivariate analysis) and includes statistical techniques such as: confirmatory factor
analysis (CFA), structural path analysis (β), total variance extracted (R2), causal modelling
with latent variables, analysis of variance and multiple regression. The literature on data
analysis techniques presents a number of rules of thumb for achieving robust and
authenticated results using SEM, from which a few are considered for the present study
and explained as follows:
Roscoe (1975) proposed four rules for deciding and establishing a sample size:
1) Sample size (n), n>30 and n<500 are appropriate for most research.
168
2) In situations when the sample needs to be split into sub-samples (e.g., male/female,
junior/senior, etc.), a minimum sample size of 30 for each category is appropriate.
3) In multivariate analysis the sample size is required to be several times (preferably
10 times or more) larger than the number of variables in the framework.
4) For simple experimental research with full control over respondents’ behaviour a
sample size of 10 to 20 respondents is sufficient.
Similarly, Stevens (1996) postulates that 15 cases per construct are sufficient when a test
of least square multiple regression analysis is needed. Furthermore, a rigorous statistical
analysis data sample should be more than 300 respondents (ibid). Bentler & Chou (1987)
recommend at least five cases per parameter when the data is perfectly normalised,
distributed and without any missing or outlying cases, etc. It is worth noting that Bentler &
Chou’s recommendation concerns parameters (i.e., also considered regression path
between construct-to-construct and items-to-construct) which are always more than the
variables in any framework. Finally, Loehlin (1992) used confirmatory factor analysis
(CFA) and suggested that models with 2 or 4 factors need at least 100 cases and 200 would
be a better approach. Comrey & Lee (1992) give a guide of a sample size of 50 as very
poor, 100 as poor, 200 as fair, 300 as good, 500 as very good, and 1,000 as excellent.
In addition to considering the above rules of thumb, this study primarily considered the
criteria suggested by Tabachnick & Fidell (2007) and Hair et al., (2006). According to
Tabachnick & Fidell (2007, p.682 and p.613), covariances like the correlation are less
stable when estimated from a small sample size, therefore, it is important that that sample
size is large enough. The author suggested that as a general rule of thumb, it is comfortable
to have at least 300 cases for factor analysis; if factor loading is >0.80 then a sample of
about 150 cases is sufficient (ibid). Hair et al., (2006) emphasised a few considerations for
selecting proper sample size when data analysis is being achieved through SEM as:
• Multivariate distribution of data, which refers to the assumption that if data
deviates from more than the presumed normality then the ratio of respondent must
be greater than the number of parameters, i.e., usually consider 15 respondents for
each parameter estimated in the model.
• Estimation technique: maximum likelihood estimation (MLE) is the most common
estimation procedure in SEM and is an iterative process. It is recommended that
small sample size should be 100 to 150 for stable MLE results, and a sample of
150 to 400 is best.
169
• Model complexity: a model with a large number of constructs/variables requires a
large number of parameters to estimate the model. A model containing five or
fewer constructs can be estimated with a sample of 100 to150 and a model with a
larger number of factors, such as six or more with three measured items in each,
will require a sample size of more than 500.
• Average error variance of indicator: this refers to the process of communalities i.e.,
average amount of variation among measured variables. It is observed that a larger
sample size has shown a smaller number of communalities and vice versa. For
instance, for communalities of 0.6, an adequate sample is needed of 100-150; a
communality of 0.45-0.55 needs a sample size of 200.
Following the criteria of variable to number of cases ratio (e.g., Hair et al., 2006; Roscoe,
1975; Tabachnick & Fidell, 2007), the present study aims to examine 13 constructs with 58
items within the basic model; therefore, the minimum required sample size needed is 290
(i.e., 58x5=290). However, based on the calculation performed using Krejcie & Morgan’s
(1970) formula and others’ rules of thumb (Comrey & Lee, 1992; Bentler & Chou, 1987;
Loehlin, 1992), the present study intends to achieve at least 373 workable sample sizes
(after treating missing data) to examine the paths proposed in the model with reliable
estimates.
4.6. Instrument development
After designing the sample and selecting the specific sample size, the next step in research
design (figure 4.1) is to establish the instrument for collecting the data. Survey research for
achieving research goals and objectives, designing and selecting the correct instrument with
relevancy and accuracy is considered to be an essential and complex process (Zikmund,
2003). In particular, the instrument should be capable of answering the research question(s)
about what is to be measured (construct validity) and how it is to be measured (construct
reliability) (Zikmund, 2003; Sekaran, 2000). The present study followed Frazer & Lawley's
(2000) and Sekaran's (2000) procedures to develop a suitable instrument, which chiefly
emphasise three stages: 1) instrument content development by solving issues of item
selection, categorisation, scales and coding (before analysis), 2) item wording, and 3)
general appearance or layout of instrument.
In the present study, theories related to technology acceptance behaviour including the
TAM (Davis, 1989; Davis, Bagozzi & Warshaw, 1989), TAM2 (Venkatesh & Davis,
2000), DTPB (Taylor & Todd, 1995a), and UTAUT (Venkatesh et al., 2003), are
170
incorporated within the extended model to develop the survey instrument. In addition,
measuring the cultural dimension items from Hofstede’s (1980) and Dorfman & Howell's
(1988) studies are included, with the impact of management support suggested by Lewis,
Agarwal & Sambamurthy (2003). Finally, observing the moderating impact of
demographical characteristics from Agarwal & Prasad's (1999) and Venkatesh & Morris'
(2000) studies are incorporated. The full description of all the constructs used in the present
study with the number of measuring items, scale, support to hypothesis and their source of
adoption are presented in table 4.6.
4.6.1. Questionnaire content development and operational items
The content development is based on the research question, which aims to determine the
factors of perceived behaviour beliefs, social and control beliefs, management support at
institutional and governmental level, and task characteristics that lead towards an
individual’s acceptance behaviour. Specifically, the context of the present study is higher
educational institutes within the developing country of Pakistan. The sample is individual
academics, therefore, the content of the questions within the instrument are modified
according to the teaching context. In addition, the content of the instrument intends to
collect the demographic and cultural data that are expected to produce a moderating impact
on the constructs of an individual’s acceptance behaviour. Generally, content designed
within an instrument for the present study can be categorised into three sections. These are
described briefly as follows:
4.6.2. Section A: Moderating demographic variables
This section is based on three sub-sections, which include key determinants with the
specific role of moderators, i.e., age, gender, educational level, experience, voluntariness,
academic position, type of university or institute, and region or province. The impact of
these moderating variables can be viewed from the previous literature, but is not limited to
it (e.g., Venkatesh et al., 2003; Agarwal & Prasad, 1999; Venkatesh & Morris, 2000;
Venkatesh & Davis, 2000; Venkatesh & Bala, 2008; Morris, Venkatesh & Ackerman,
2005; Minton & Schneider, 1980). The items used in the first section intend to validate the
hypotheses H13 and H14, which include 28 path relationships.
In the demographic section, part I comprises seven questions (1 to 7) measured on a
nominal scale to gather the background information of the respondents, such as gender,
age, academic position, academic experience, educational level, type of university and
provinces. Section A, part II is related to individuals’ experience regarding Internet usage
171
when searching for material, sending and receiving emails, downloading multimedia
content and e-commerce activities. This part is based on two questions (8 and 9) and is
measured on a nominal scale. Section A, part III is based on four questions (10 to 13) that
gather information about the conditions of using the Internet, which might be the
individuals’ choice or institutional requirements (i.e., voluntariness). Given that, four
questions are adopted from the study of Venkatesh et al. (2003) and are measured on a
seven-point Likert scare anchored as 1=strongly disagree to 7=strongly agree.
4.6.3. Section B: Direct determinants of behaviour intention (BI) and behaviour usage (BU)
Section B of the instrument is based on questions for measuring the information of nine
independent constructs i.e., perceived usefulness (PU), perceived ease of use (PEOU), peer
influence (PI), superior influence (SI), self-efficacy (SE), technology facilitation (TF),
resource facilitation (RF), academic tasks (AT), non-academic tasks (NAT), one
mediating, as well as a dependent construct, behavioural intention (BI), and one dependent
construct, behavioural usage (BU). All the questions in section B are measured on a seven-
point Likert scale anchored as 1=strongly disagree to 7=strongly agree. However, construct
BU, which is also measured on a seven-point Likert scale but with slightly different
options, is anchored as 1=don’t use at all, 2=use about once each month, 3=use a few times
a month, 4=use once a week, 5=use a few times in a week, 6=use once a day, 7=use several
times a day. For simplification and grouping purposes, this section is sub-divided into six
parts.
Part I includes nine questions adopted from the study of Venkatesh, Morris & Ackerman
(2000) to measure the individual’s persuasive feelings/beliefs towards acceptance intention
of Internet technology. The first five questions (14 to 18) are related to the perception of
usefulness (PU) and intend to explore whether academics believe that using the Internet
would increase his/her job performance; whereas the remaining four questions (19 to 22)
are related to the perception of ease of use (PEOU) and intend to explore whether
academics believe that using the Internet is effort-free and easy to understand. Both
constructs PU and PEOU are the core construct of the TAM model (Davis, 1989; Davis,
Bagozzi & Warshaw, 1989) and have been widely practiced in literature to replicate TAM
studies or extending studies based on TAM (e.g., Venkatesh & Morris, 2000; Venkatesh &
Davis, 2000; Moore & Benbasat, 1991). Constructs PU and PEOU and their measuring
questions are included in the instrument to examine the path relationships presented in
hypotheses H1a, H1b, H2 and H3.
172
Section B, part II includes six questions related to the normative beliefs adopted from the
study of Lewis et al. (2003). The questions intend to examine the perception of the
academics’ particular behaviour as influenced by the judgment of others. The first four
questions (23 to 26) are related to peer influence (PI) and aim to explore whether
academics’ intention to accept Internet technology is due to the importance of the
perception of his/her colleagues, friends and family members; whereas, the remaining two
questions (27 and 28) are related to superior influence (SI) and aim to explore the
importance of superiors (i.e., heads of department and chairs) in academics’ perceptions of
accepting Internet technology. Both constructs PI and SI, combined in previous literature,
are also studied as a single construct of subjective norms (SN) (e.g., Taylor & Todd,
1995a; Mathieson, 1991; Venkatesh et al., 2004; Morris & Venkatesh, 2000) which were
initially introduced in TRA by Ajzen & Fishbein (1980) and Fishbein & Ajzen (1975).
Measuring constructs PI and SI helps to examine the path relationships presented in
hypotheses H4, H5a and H5b.
Section B, part III includes 15 questions related to the control beliefs adopted from the
study of Taylor & Todd (1995a). The questions aim to examine the conditions that affect
the form of facilitation or impedances on academics’ behaviour when using the Internet. In
doing so, the first six questions (29 to 34) are related to the concept of self-efficacy (SE)
and focus on measuring the academics’ self-evaluation beliefs towards Internet usage in
their tasks; the second four questions (35 to 38) are related to the concept of technology
facilitations (TF) and measure academics’ external beliefs as influenced by technology
availability and control over its usage. Finally, the last five questions (39 to 43) are related
to the concept of resource facilitations (RF) and measure the academics’ external beliefs
influenced by resource availability in terms of money, time, instructions and personal
support of their Internet usage. Combined together, SE, TF and RF are termed as perceived
behaviour control (PBC) and were originally introduced in TPB (Ajzen, 1991). The TPB,
and SE, TF, and RF are widely used as core constructs in theories to examine intention
behaviour of individuals (e.g., Taylor & Todd, 1995a; Wu, Wang & Lin, 2007; Taylor &
Todd, 1995b; Agarwal & Prasad, 1998; Compeau, Higgins & Huff, 1999; Compeau &
Higgins, 1995b; Compeau & Higgins, 1995a; Venkatesh, 2000). Measuring constructs SE,
TF and RF helps to examine the path relationships presented in hypotheses H6a, H6b, H7a,
H7b, H8a, and H8b.
Section B, part IV includes ten questions related to the task characteristics that are
facilitated by the use of the Internet. The questions are developed by the researcher through
173
applying the theory of task technology fit (TTF) (Goodhue & Thompson, 1995) over the
questions of BI construct proposed in the TAM (Davis, 1989; Davis, Bagozzi & Warshaw,
1989). In addition, studies by Reynolds (1992) and Rosenfeld et al., (1992) were used to
classify the tasks based on their characteristics. In doing so, it is observed that within the
context of higher educational institutes, acceptance of the Internet is mostly based on its
importance in academic (AT) and non-academic tasks (NAT). The first six questions (44 to
49) within the instrument are related to the measure of the intention to use the Internet in
academic tasks. Specifically, the questions focus on examining the intention to use the
Internet in preparing teaching materials, self-skills development (research) and
communicating with students. The remaining four questions (50 to 53) are related to the
measure of intention to use the Internet for non-academic tasks, specifically, questions
focus on observing the intention to use the Internet in administrative, socialisation and
enjoyment tasks. Constructs AT and NAT and their measuring question are included in the
instrument to examine the path relationships presented in hypotheses H9a and H9b.
Parts V and VI in section B are related to the academics’ cognitive processes (e.g., what
they think, feel and behave, etc.) in forming intention to accept and use the Internet. Both
parts include a total of eight questions adopted from the study of Venkatesh & Bala (2008).
Specifically, part V includes four questions (54 to 57) to observe the behaviour intention
(BI) of the academics to accept the Internet. The questions on BI are measured on a seven-
point Likert scale anchored as 1=strongly disagree to 7=strongly agree. Part VI includes
four similar questions to BI (58 to 61) and observes the behaviour usage (BU) with only a
difference in scale. This is an eight-point Likert scale to measure the usage frequency
anchored as: 1=don’t use at all, 2=use about once a month, 3=use a few times a month,
4=use once a week, 5=use a few times a week, 6=use once a day, 7=use several times a
day. BI is the most important construct of the present study and is chiefly the dependent
variable for most of the paths in the conceptual framework. Both BI and BU also remained
as major constructs in a number of theories within technology acceptance domain e.g.,
TRA, TAM, TAM2, TBP, DTPB, and UTUAT (see Venkatesh et al., 2003; Taylor &Todd,
1995a; Venkatesh & Morris, 2000; Venkatesh & Davis, 2000). In the present study
constructs BI and BU and their measuring questions are included in the instrument to
examine the path relationships presented in hypothesis H10.
4.6.4. Section C: Moderating cultural factors and direct determinant management support
This section includes the questions for measuring the important constructs to answer one of
main objectives of the study, i.e., is there any perception of difference between segments of

174
users (academics) towards acceptance of Internet technology on the basis of their
individual cultural characteristics (masculinity-femininity, individualism-collectivism,
power distance, uncertainty avoidance)? Recall the discussion in chapter 3, where it was
proposed that models and theories within technology acceptance domain are mostly
culturally biased, and need to be generalised within the specific context of culture. In
addition, it was discussed that, within developing countries, most decisions to introduce
new technologies are made by higher authorities without considering the concerns of end-
users. Therefore, overcoming both problems of cultural bias and the influence of
management support, four dimensions of culture suggested by Hofstede (1980) i.e., power
distance (PD), individualism/collectivism (IC), uncertainty avoidance (UA), and
masculinity/femininity (MF); and two constructs of management influence at a higher and
lower level i.e., government support (GS) and institute support (IS) suggested by Lewis et
al., (2003), are examined in the present study. Section C is divided into three sub-parts, in
which two are measured on seven-point Likert scales anchored as 1=strongly disagree to
7=strongly agree. The third part, which consists of information related to the e-Reforms, is
measured on a nominal scale.
Section C, part I includes 21 questions related to four cultural dimensions i.e., PD, IC, UA
and MF. All the questions measuring cultural dimensions are proposed by Hofstede (1980)
and are measured on Dorfman & Howell's (1988) scale. The reasoning behind this is
plausible in that the scale proposed by Hofstede (1980) would be applicable when the
study aims to examine the cultural differences at a country level (i.e., cross-cultural),
whereas the present study only requires the exploration of the differences on an individual
level. Additionally, the adoption of the Dorfman & Howell (1988) scale is based on the
suggestion of McCoy, Everard & Jones (2005), who postulated that when cultural
dimensions are to be explored at an individual level, then the Dorman & Howell scale is
the best option. In doing so, the first six questions (62 to 67) are related to the construct PD
to measure academics’ experience of freedom to talk in the work environment (e.g.,
sharing problems, decision-making, etc. with the heads and chairs of organisations). The
next six questions (68 to 73) are related to the construct IC to measure academics’
perceptions about him/her and the group of people in the working environment. The next
four questions (74 to 77) are related to the construct UA that measures academics’
perceptions about their certainty in the job when observing rules and regulations. Finally,
the last five questions (78 to 82) are related to the construct MF that measures academics’
perceptions about job goals, earning, recognition at work, advancement in work position,

175
and accepting challenging tasks, and establishing working relationships with colleagues
and supervisors to promote the family environment. A number of researchers in previous
literature has also examined the impact of culture (McCoy, Everard & Jones, 2005;
McCoy, Galletta & King, 2007; Robertson & Hoffman, 2000; Robertson, 2000; Srite,
2006; Srite & Karahanna, 2006; Hwang, 2005; Choi & Geistfeld, 2004; Parboteeah,
Bronson & Cullen, 2005; Alsajjan & Dennis, 2010). However, most were limited to
measuring differences at a country level score. In the present study, measuring constructs
PD, IC, UA and MAS helps to examine the moderating path relations presented in
hypotheses H15 (a,b,c,d), H16 (a,b,c,d), H17 (a,b,c,d) and H18 (a,b,c,d).
Section C, part II includes ten questions related to management support for promoting
Internet usage within academics working in higher educational institutes. All the questions
are adopted from the study of Lewis et al., (2003) with little moderation according to the
context of the study. The first five questions (83 to 87) are related to the construct
government support (GS) to measure the academic perception of government policies,
encouragement and their importance for Internet usage within universities. The next five
questions (88 to 92) are related to the construct institute support (IS). The questions
measuring GS are similar to IS except for difference of context, to see the influence of
management at a high and low level. The importance of management support is also
highlighted in previous studies e.g., Igbaria & Chakrabarti (1990) and Yoon, Guimaraes &
O'Neal (1995). Measuring GS and IS helps to examine the path relations in hypotheses
H11a, H11b, H12a, and H12b.
Finally, section C, part III includes five questions (93 to 98) that explore general
information about the awareness of academics regarding the programmes initiated by the
government to promote teaching and research skills. All the questions are measured on a
nominal scale to observe the awareness of programmes launched by the Pakistan Higher
Education Commission (HEC) under the umbrella of ‘e-Reforms’. These include: Pakistan
Education and Resource Network (PERN), digital library, Pakistan Research Repository
(PRR), e-learning, Enterprise Resource Planning (ERP), Campus Management Solution
(CMS), IT infrastructure upgrade, and broadband facility (HEC PAK, 2009). Within the
conceptual framework questions in section C, part III do not represent any path
relationship; however, the information collected from the question enables the evaluation
of the current infrastructure and its usage within academics’ work practices.
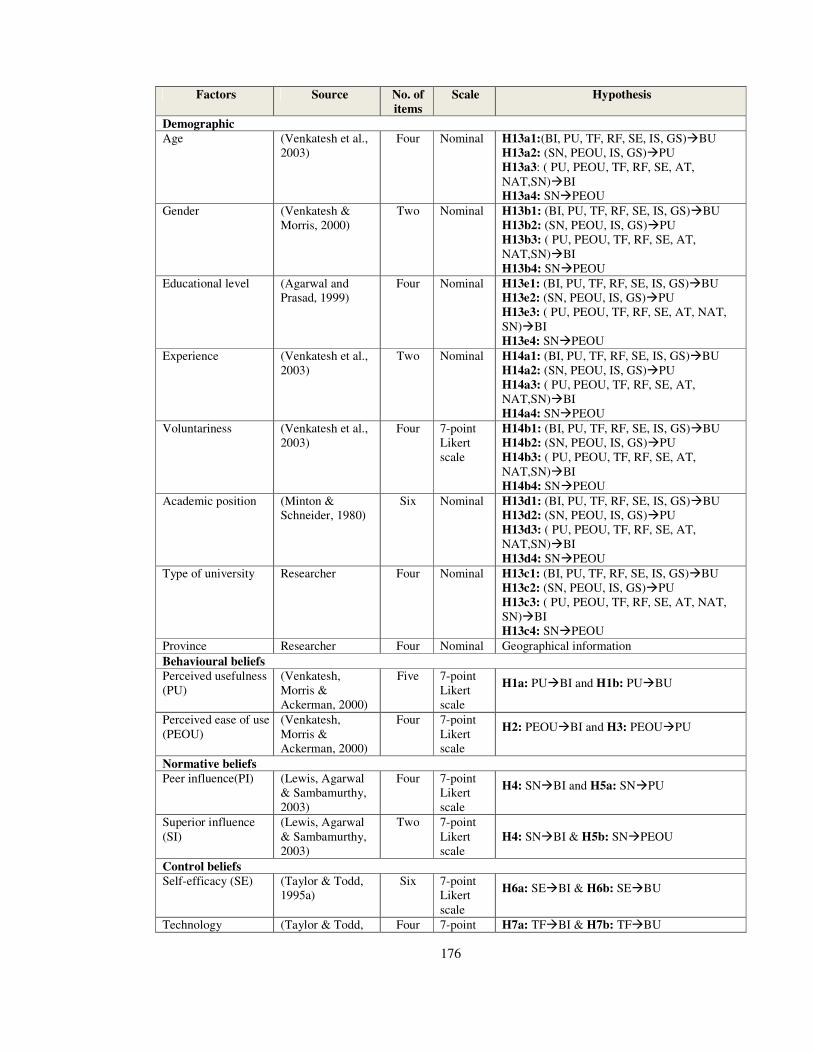
176
Factors Source No. of
items
Scale Hypothesis
Demographic Age (Venkatesh et al.,
2003) Four Nominal H13a1:(BI, PU, TF, RF, SE, IS, GS)�BU
H13a2: (SN, PEOU, IS, GS)�PU H13a3: ( PU, PEOU, TF, RF, SE, AT, NAT,SN)�BI H13a4: SN�PEOU
Gender (Venkatesh & Morris, 2000)
Two Nominal H13b1: (BI, PU, TF, RF, SE, IS, GS)�BU H13b2: (SN, PEOU, IS, GS)�PU H13b3: ( PU, PEOU, TF, RF, SE, AT, NAT,SN)�BI H13b4: SN�PEOU
Educational level (Agarwal and Prasad, 1999)
Four Nominal H13e1: (BI, PU, TF, RF, SE, IS, GS)�BU H13e2: (SN, PEOU, IS, GS)�PU H13e3: ( PU, PEOU, TF, RF, SE, AT, NAT, SN)�BI H13e4: SN�PEOU
Experience (Venkatesh et al., 2003)
Two Nominal H14a1: (BI, PU, TF, RF, SE, IS, GS)�BU H14a2: (SN, PEOU, IS, GS)�PU H14a3: ( PU, PEOU, TF, RF, SE, AT, NAT,SN)�BI H14a4: SN�PEOU
Voluntariness (Venkatesh et al., 2003)
Four 7-point Likert scale
H14b1: (BI, PU, TF, RF, SE, IS, GS)�BU H14b2: (SN, PEOU, IS, GS)�PU H14b3: ( PU, PEOU, TF, RF, SE, AT, NAT,SN)�BI H14b4: SN�PEOU
Academic position (Minton & Schneider, 1980)
Six Nominal H13d1: (BI, PU, TF, RF, SE, IS, GS)�BU H13d2: (SN, PEOU, IS, GS)�PU H13d3: ( PU, PEOU, TF, RF, SE, AT, NAT,SN)�BI H13d4: SN�PEOU
Type of university Researcher Four Nominal H13c1: (BI, PU, TF, RF, SE, IS, GS)�BU H13c2: (SN, PEOU, IS, GS)�PU H13c3: ( PU, PEOU, TF, RF, SE, AT, NAT, SN)�BI H13c4: SN�PEOU
Province Researcher Four Nominal Geographical information
Behavioural beliefs Perceived usefulness (PU)
(Venkatesh, Morris & Ackerman, 2000)
Five 7-point Likert scale
H1a: PU�BI and H1b: PU�BU
Perceived ease of use (PEOU)
(Venkatesh, Morris & Ackerman, 2000)
Four 7-point Likert scale
H2: PEOU�BI and H3: PEOU�PU
Normative beliefs Peer influence(PI) (Lewis, Agarwal
& Sambamurthy, 2003)
Four 7-point Likert scale
H4: SN�BI and H5a: SN�PU
Superior influence (SI)
(Lewis, Agarwal & Sambamurthy, 2003)
Two 7-point Likert scale
H4: SN�BI & H5b: SN�PEOU
Control beliefs Self-efficacy (SE) (Taylor & Todd,
1995a) Six 7-point
Likert scale
H6a: SE�BI & H6b: SE�BU
Technology (Taylor & Todd, Four 7-point H7a: TF�BI & H7b: TF�BU

177
facilitation (TF) 1995a) Likert scale
Resource facilitation (RF)
(Taylor & Todd, 1995a)
Five 7-point Likert scale
H8a: RF�BI & H8b: RF�BU
Task characteristics
Academic(AT) Researcher Six 7-point Likert scale
H9a: AT�BI
Non-academic (NAT)
Researcher Four 7-point Likert scale
H9b: NAT�BI
Cultural factors Power distance (PD) (Dorfman &
Howell, 1988) Six 7-point
Likert scale
H17a: (BI, PU, TF, RF, SE, IS, GS)�BU H17b: (SN, PEOU, IS, GS)�PU H17c: ( PU, PEOU, TF, RF, SE, AT, NAT, SN)�BI H17d: SN�PEOU
Individualism /Collectivism(IC)
(Dorfman & Howell, 1988)
Six 7-point Likert scale
H16a: (BI, PU, TF, RF, SE, IS, GS)�BU H16b: (SN, PEOU, IS, GS)�PU H16c: ( PU, PEOU, TF, RF, SE, AT, NAT, SN)�BI H16d: SN�PEOU
Uncertainty avoidance (UA)
(Dorfman & Howell, 1988)
Four 7-point Likert scale
H18a: (BI, PU, TF, RF, SE, IS, GS)�BU H18b: (SN, PEOU, IS, GS)�PU H18c: (PU, PEOU, TF, RF, SE, AT, NAT, SN)�BI H18d: SN�PEOU
Masculinity/ Femininity (MAS)
(Dorfman & Howell, 1988)
Five 7-point Likert scale
H15a: (BI, PU, TF, RF, SE, IS, GS)�BU H15b: (SN, PEOU, IS, GS)�PU H15c: ( PU, PEOU, TF, RF, SE, AT, NAT, SN)�BI H15d: SN�PEOU
Environmental factors Government support (GS)
(Lewis, Agarwal & Sambamurthy, 2003)
Five 7-point Likert scale
H12a: GS�PU & H12b: GS�BU
Top management support (IS)
(Lewis, Agarwal & Sambamurthy, 2003)
Five 7-point Likert scale
H11a: IS�PU & H11b: IS�BU
Behavioural factors
Behaviour intention (BI)
(Venkatesh & Bala, 2008)
Four 7-point Likert scale
H10: BI�BU
Behaviour usage (BU)
(Venkatesh & Bala, 2008)
Four 8-point Likert scale
H10: BI�BU
E-Reforms by HEC Internet access method
Researcher One Nominal General information
HEC provided the Internet access
Researcher One Nominal General information
Use of digital library Researcher One Nominal General information
Use of PRR Researcher Two Nominal General information
Participation in e-learning
Researcher One Nominal General information
Table 4. 6: Operationalisation of research variables

178
4.6.5. Questionnaire wording and layout
The wording and layout of a questionnaire plays an important role in enhancing a
respondent’s interest up until the end of the questionnaire. Sekaran (2000) suggested five
principles of wording in questionnaire design: 1) appropriateness of content, 2) question
wording and level of language sophistication, 3) type and form of question, 4) sequencing
of questions, and 5) personal data sought from the respondents.
The content of the questions in the present study mostly intend to explore the objective
feelings of academics which is measured using Nominal and Likert scale techniques.
Questions are asked in simple and easy language without using phrases or technical terms
related to information technology. In addition, all the questions are worded into positive
sentences of short length, so that respondents feel able to complete them without
concentrating on the form of the question.
The type and form of the questionnaire, which is also referred to as the ‘phrasing’ of the
question, is mostly categorised as either open-ended or closed-ended questions/fixed-
alternative (Zikmund, 2003). Open-ended questions fit well when the research is
exploratory so that respondents can freely describe their opinions; closed-ended questions
are best suited for explanatory or causal studies. Keeping in mind the nature of the present
study, the close-ended questionnaire phrasing is selected, which gives the advantage of
taking less time to complete and is easier for the respondent to answer. In addition,
applying closed-ended questions enables the researcher to code and tabulate them easily
for quantitative data analysis purposes (Zikmund, 2003; Sekaran, 2000). Apart from the
wording of questions, the researcher has also carefully examined the impact of bias from
questions through avoiding ambiguity or leading responses.
From the layout or appearance point of view, a number of researchers have proposed
mixed suggestions. Sekaran (2000) suggested that personal information either be kept at
the start or the end of the instrument depending upon the aim of the research. Dillman
(2000) suggested that personal information questions should not be at the start of the
instrument because they are easy to answer and lead respondents to believe that the
instrument is boring. In the present study, personal and demographic information is of
equal importance to the main constructs of the research (examining moderation effect),
therefore, in designing the layout the researcher has kept demographic information at the
start of the instrument. One potential threat in the present layout of the instrument (see
appendix B) could be its length (98 items). It might be possible that information at the end

179
of the instrument may be left incomplete or be less interesting to the respondents.
Overcoming this problem and ensuring that there is no difference between respondents’
initial answers and later responses, a Mann-Whitney-U-test will be computed during the
pilot study. In the case that a difference is observed, then three layouts of the instrument
would be developed. In the first layout sections A, B and C will be similar to the present
layout, as given in the appendix, while in the second layout the sequence will be A, C, B;
finally in the third layout the sequence will be C, A, B. The final decision will be made
after piloting the initial version of the instrument.
4.7. Scale used
In order to measure human attitude, Sekaran (2000) categorised two main groups of scales
i.e., rating and ranking scales. Within the rating scale she defined ten further scaling
methods. Among the types defined by Sekaran, the items selected for various constructs in
this study are mostly based on the Likert scale (i.e., seven-point) established by Rensis
Likert in 1932 (Likert, 1932). The reason for selecting the Likert scale is twofold: it is the
most common and easiest method for gathering information from respondents using survey
method (Sekaran, 2000; Viswanathan, Sudman & Johnson, 2004). It has been used widely
(either five or seven points) in the published literature relevant to the current study (e.g.,
Venkatesh et al., 2003; Taylor & Todd, 1995a; Dorfman & Howell, 1988; Venkatesh &
Morris, 2000; Venkatesh & Davis, 2000; Venkatesh & Bala, 2008). The full description of
the constructs and their measurement items with the relevant scale is given in section (4.6).
4.8. Data collection procedure
The method of data collection is an integral part of any research design (Sekaran, 2000). It
is the process by which the opinions of the respondents from the targeted population on a
specific topic are collected (Zikmund, 2003). A number of methods and techniques are
available for collecting the data according to the nature of the research problem. Methods
such as interview can be conducted via face-to face, telephone, or computer-assisted. The
questionnaire method includes self-administrated surveys, mail survey, electronic or
internet survey etc. (Zikmund, 2003; Sekaran, 2000; Fowler, 2002). The selection of the
data collection method requires an understanding of the sample size needed, type of the
research question posed, content and number of questions in the instrument, cost in terms
of accessibility to respondent and time (Fowler, 2002).
In the present study, the survey questionnaire method for data collection is selected, which
is defined as a predefined set of written closed structure or open-ended items filled by the

180
respondents (Sekaran, 2000). Specifically, the self-administrated questionnaire is adopted
as the primary source of data collection with some supporting posted/mail and e-mailed
surveys. Zikmund (2003) explained the self-administrated questionnaire as an instrument
that is normally printed on paper or attached to mail/e-mail and is filled in by the
respondent. The rationales behind selecting the self-administrated method for data
collection process are as follows:
• Covering a large area and population: the targeted population for the present study
are academics in higher educational institutes in Pakistan, which are spread
geographically across four provinces. Therefore, accessing/contacting each
individual personally for interview seems to be impractical. For simultaneous
distribution while keeping the researcher isolated, the self-administrated mail and
email method is preferred over the others (Zikmund, 2003).
• Inexpensive and time-saving: through simultaneous distribution, much time and
money can be saved compared with the interview method, because the researcher
does not need to sit with the respondent and fill the data in him/herself, as with the
interview method (Zikmund, 2003; Sekaran, 2000). In the present study, in order to
save additional time due to the delay in the postal service, and the expensive costs
of printing and travelling, an electronic format of the questionnaire is also included
for distribution.
• Respondent’s convenience: unlike the interview method, with the self-
administrated survey method (i.e., mail or e-mail) the respondent is free to think
about their replies and complete it whenever a convenient time is available to them
(Zikmund, 2003). Respondents in this method are not biased by the researcher’s
opinion, or by time hassle requirements.
Many disadvantages of the self-administrated method are observed which result in a slow
and low response to completing the data. These include the absence of the researcher when
filling in sensitive data or social data in the questionnaire that perhaps needs clarification at
the time of completing survey, or instructions which might be difficult to understand and
hence need the presence and guidance of the researcher (Zikmund, 2003; Sekaran, 2000).
In this research, the problem of revealing personal, social and sensitive data is solved by
attaching a cover letter with each questionnaire that clearly states how confidentiality of
information is secured through a coding system rather than the names of respondents; the
consent of each respondent is required before revealing his/her identity. The disadvantage
181
of the self-administrated questionnaire i.e., the difficulty of instruction at the time of filling
it in can be overcome by time-management. The researcher will use the follow-up
technique (Zikmund, 2003) to inquire about a slow response rate, and if it is because of
instruction then a revised version of the questions will be re-distributed for the data
collection method.
4.9. Pilot study
After designing the initial version of the survey instrument in the research design (figure
4.1) the next stage is purification of the questions within the instrument. A pilot or
feasibility study is usually carried out before the main data collection process in order to
check its feasibility in terms of reliability and validity to improve the design of the
instrument (Zikmund, 2003). Ticehurst and Veal, (2000, p.151) stress the importance of
piloting in order to eliminate possible weaknesses and flaws in the survey instrument.
These can be identified by testing question wording, sequence, layout, familiarity with
respondents, response rate, questionnaire completion time, and analysis process. The
recommended sample for the piloting study is usually 10 to 30 (Luck and Rubin, 1987)
members of the relevant population. The results of the pilot study conducted in the present
study are presented in detail in the next chapter (chapter 5, section 5.1).
4.10. Data analysis process
Having established the research design and data collection requirements, the next step in
the research design (figure 4.1) is data analysis and findings. For this purpose, the analysis
of the present study is divided into two stages: preliminary data analysis and evaluation of
structural model.
The first part of the analysis is related to the preliminary data analysis and presents the
descriptive statistics. The results of this part provide the general picture of the respondents’
information and their response to the survey instrument. In doing so, SPSS 16.0 version,
which has been accredited by many scholars (e.g., Tabachnick & Fidell, 2007; Field,
2006), was used for the tasks commenced from the pilot study to the main study e.g.,
coding, editing, checking missing data, assumptions of normality, linearity,
multicollinearity, outliers and factor analysis. The tests required to perform these sorts of
the tasks are briefly presented in table 4.7 and a detailed description and the purpose of
each task is given in the next chapter (sections 5.1 to 5.5.).
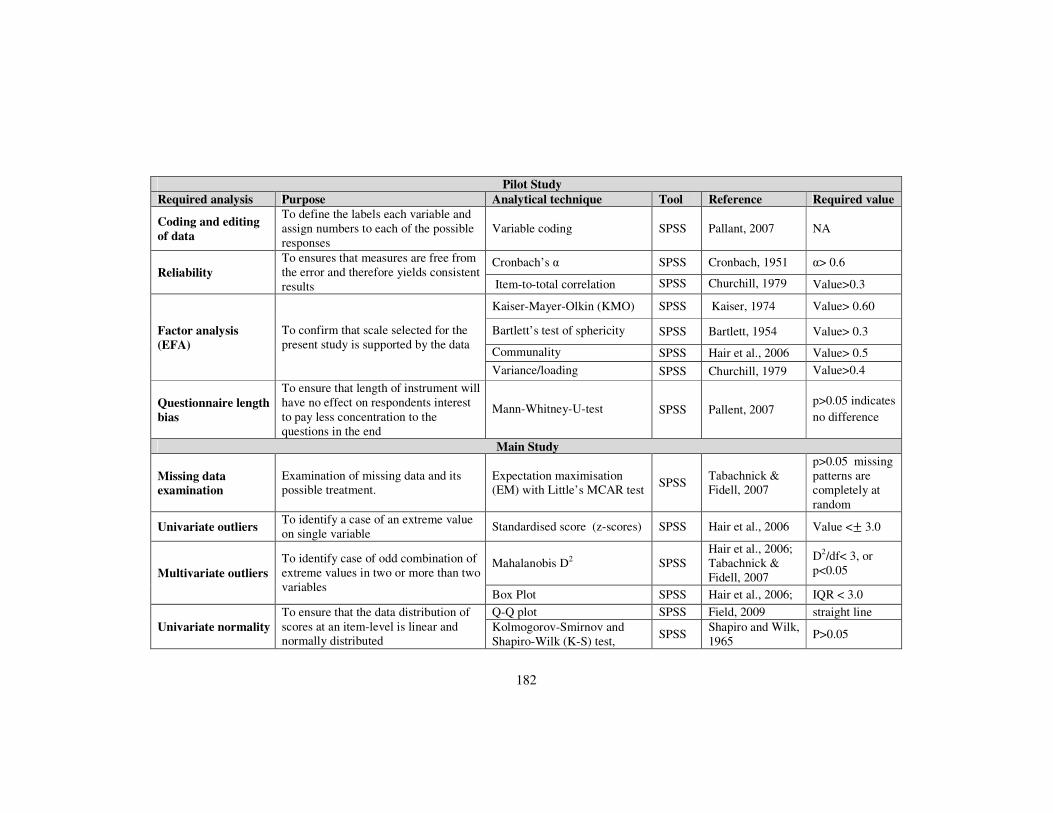
182
Pilot Study
Required analysis Purpose Analytical technique Tool Reference Required value
Coding and editing
of data
To define the labels each variable and assign numbers to each of the possible responses
Variable coding SPSS Pallant, 2007 NA
Reliability
To ensures that measures are free from the error and therefore yields consistent results
Cronbach’s α SPSS Cronbach, 1951 α> 0.6
Item-to-total correlation SPSS Churchill, 1979 Value>0.3
Factor analysis
(EFA)
To confirm that scale selected for the present study is supported by the data
Kaiser-Mayer-Olkin (KMO) SPSS Kaiser, 1974 Value> 0.60
Bartlett’s test of sphericity SPSS Bartlett, 1954 Value> 0.3
Communality SPSS Hair et al., 2006 Value> 0.5
Variance/loading SPSS Churchill, 1979 Value>0.4
Questionnaire length
bias
To ensure that length of instrument will have no effect on respondents interest to pay less concentration to the questions in the end
Mann-Whitney-U-test SPSS Pallent, 2007 p>0.05 indicates
no difference
Main Study
Missing data
examination
Examination of missing data and its possible treatment.
Expectation maximisation (EM) with Little’s MCAR test
SPSS Tabachnick & Fidell, 2007
p>0.05 missing patterns are completely at random
Univariate outliers To identify a case of an extreme value on single variable
Standardised score (z-scores) SPSS Hair et al., 2006 Value <� 3.0
Multivariate outliers
To identify case of odd combination of extreme values in two or more than two variables
Mahalanobis D2 SPSS Hair et al., 2006; Tabachnick & Fidell, 2007
D2/df< 3, or p<0.05
Box Plot SPSS Hair et al., 2006; IQR < 3.0
Univariate normality
To ensure that the data distribution of scores at an item-level is linear and normally distributed
Q-Q plot SPSS Field, 2009 straight line
Kolmogorov-Smirnov and Shapiro-Wilk (K-S) test,
SPSS Shapiro and Wilk, 1965
P>0.05
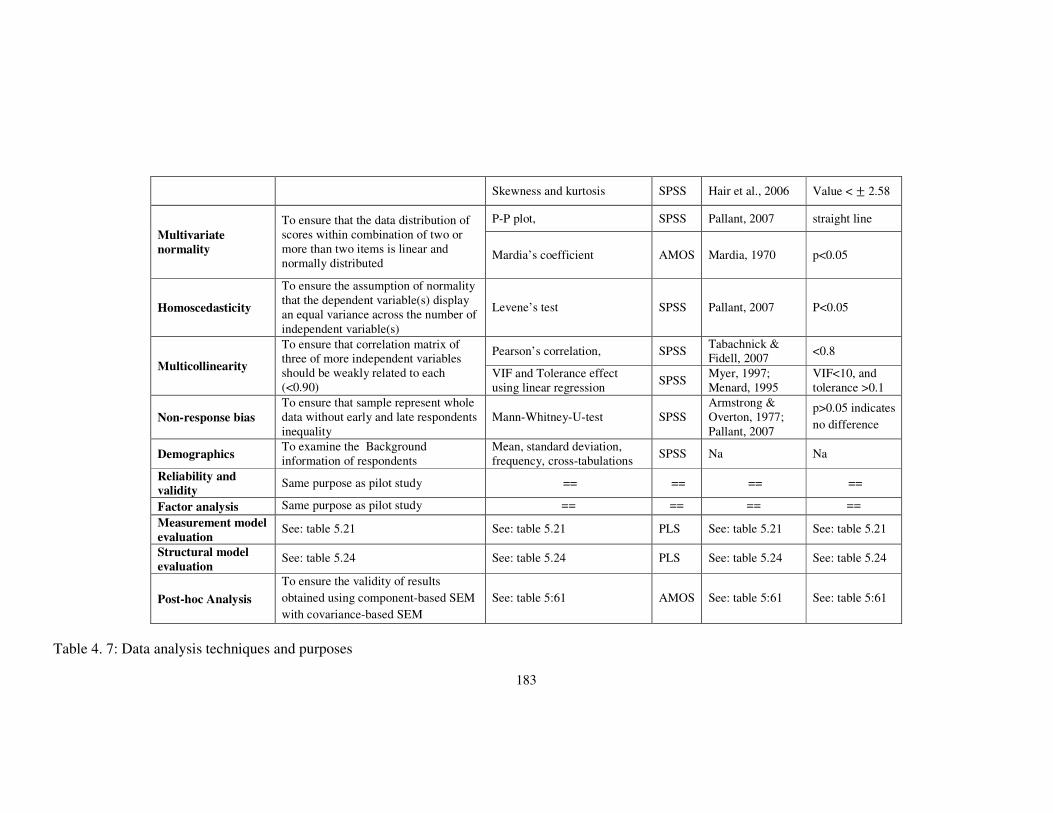
183
Skewness and kurtosis SPSS Hair et al., 2006 Value < � 2.58
Multivariate
normality
To ensure that the data distribution of scores within combination of two or more than two items is linear and normally distributed
P-P plot, SPSS Pallant, 2007 straight line
Mardia’s coefficient AMOS Mardia, 1970 p<0.05
Homoscedasticity
To ensure the assumption of normality that the dependent variable(s) display an equal variance across the number of independent variable(s)
Levene’s test SPSS Pallant, 2007 P<0.05
Multicollinearity
To ensure that correlation matrix of three of more independent variables should be weakly related to each (<0.90)
Pearson’s correlation, SPSS Tabachnick & Fidell, 2007
<0.8
VIF and Tolerance effect using linear regression
SPSS Myer, 1997; Menard, 1995
VIF<10, and tolerance >0.1
Non-response bias
To ensure that sample represent whole data without early and late respondents inequality
Mann-Whitney-U-test SPSS Armstrong & Overton, 1977; Pallant, 2007
p>0.05 indicates
no difference
Demographics To examine the Background information of respondents
Mean, standard deviation, frequency, cross-tabulations
SPSS Na Na
Reliability and
validity Same purpose as pilot study == == == ==
Factor analysis Same purpose as pilot study == == == ==
Measurement model
evaluation See: table 5.21 See: table 5.21 PLS See: table 5.21 See: table 5.21
Structural model
evaluation See: table 5.24 See: table 5.24 PLS See: table 5.24 See: table 5.24
Post-hoc Analysis
To ensure the validity of results
obtained using component-based SEM
with covariance-based SEM
See: table 5:61 AMOS See: table 5:61 See: table 5:61
Table 4. 7: Data analysis techniques and purposes

184
The second part of the analysis is related to the evaluation of the structural model to
examine the interrelationship between multiple independent and dependent variables
related to the individual’s acceptance behaviour towards the new technology (i.e., the
Internet). In addition, the impact of demographic and cultural characteristics is also part of
the analysis in this section. For this purpose, structural equation modelling (SEM), also
known as path analysis with latent variables (Bagozzi, 1984; Bagozzi & Yi, 1988), has
been employed to test the theoretical model. According to Tabachnick & Fidell (2007,
p.676) SEM itself is a set of statistical techniques that facilitates the
establishment/evaluation of the relationships between more than one construct
simultaneously. The statistical techniques within SEM can be broadly categorised into two
families: covariance-based modelling (e.g., LISREL, AMOS) and variance-based or
component-based modelling (e.g., PLS) (Gefen, Straub & Boudreau, 2000). In the present
study, Partial Least Squares (PLS), a component-based SEM technique, is primarily
adopted to examine the paths in the structural model. Specifically, MPLS Smart Version
2.0.3 (Ringle et al., 2005) is used to analyse the data. Rationally, due to its relevance to the
current study and popularity in recent research, adoption of PLS is justified. For instance,
PLS in recent years is getting more interest due to its capacity for modelling latent
variables under non-normalised and small number samples, for examining the
measurement path and explaining the regression estimation of structural paths (Janice et
al., 1996; Henseler et al., 2009).
The structural model in the present study is evaluated using a two-step approach on the
hierarchal basis (Henseler et al., 2009; Chin W. Wynne., 2002). First, the measurement
model is assessed by examining psychometric reliability and validity tests. Second,
multiple regression technique is used to assess the structural paths (i.e., hypothetical
relationships based on sign, magnitude and significance levels). The moderating impact of
demographic and cultural characteristics on the proposed relationships is assessed using a
multiple group analysis (MGA) technique, which is similar to the hierarchical multiple
regression developed by Cohen & Cohen (1983). This study employed bootstrap method
for 200 times to obtain the t-value (i.e., used for path significance between hypothetical
relationships) and standard error. A detailed description of the basic concepts of SEM,
types of analytical techniques using SEM, practical considerations for adopting SEM,
criteria to evaluate the measurement model and structural model based on a two-step
185
approach, and use of MGA to examine the moderation effect, are presented in chapter 5
(section 5.6). In addition, overcoming the analysis approach bias threat, post-hoc analysis
using a covariance-based SEM approach with analysis of moment structure (AMOS) is
also carried out in section (5.6.5).
4.11. Ethical considerations
In social and business science research, when a study aims to examine human behaviour,
ethical issues are considered to be a major issue. The lack of ethical consideration prior to
or during the data collection process might result in a lack of cooperation (compliance) by
the respondents and prevent collection of the desired amount of data (Zikmund, 2003;
Sekaran, 2000). In other words, informed consent by fulfilling ethical values is a
prerequisite for all research involving identifiable subjects, except in conditions where an
ethical committee judges that such consent is not possible or is not valuable to the
benefit/harm of the research (Christians, 2000). According to Sekaran (2000, pp.260-261),
the researcher should protect human rights by considering ethical considerations: 1) to
assure respondents that their information is kept strictly confident; 2) to assure respondents
that their personal information will not be solicited; 3) to assure respondents that their
information will not be misrepresented or distorted during the study; 4) the researcher
should clearly define the purpose of the study without any misrepresentation of the goals;
5) the researcher should never violate the self-esteem and self-respect of the respondents;
and finally 6) the researcher should get consent prior to collecting the data and should not
force respondents to become part of the survey.
In the present study, in addition to Sekaran's (2000) recommendations, the guidelines of
the Brunel Business School ethics committee are followed when collecting the data.
According to the ethical considerations provided by the Brunel Business School ethics
committee, the researcher needs to create a consent form which ensures the participants
that their participation in the research is voluntary and they can withdraw at any time if
they feel it is necessary. In addition, through the consent form, participants were informed
that they were free to decline to answer any question. Finally, participants were also
ensured that their confidentiality and data privacy would be the highest priority of the
researcher and secured data will be not shared/used with any other person/research. After
completing all the requirements of the Brunel Business School ethics committee and
creating a consent form, approval to collect the data was obtained by the researcher’s
supervisor and the school ethics committee.
186
During the data collection process, the cover letter (which included the title of the research
and requirements of the ethical consideration) was attached with each instrument.
Participants were informed that completing the survey instrument and sending it back to
the researcher was assumed to be their consent of participation. A copy of the cover letter
is presented with the questionnaire in the appendix-B.
Conclusion
This chapter presented the perspective, approach, and particular methods taken for the
present study. In this regard, the positivist perspective of information systems research is
justified with a critical overview of other choices. From a methodological perspective this
research is positioned in a quantitative paradigm with a survey research strategy for
collecting the data. Based on six elementary steps defined by Sekaran (2000), the research
process of this study includes: the purpose of the study as hypothesis testing, type of
investigation as correlational, extent of the researcher within the research is minimal,
setting of study is non-contrived, unit of study is individual, and time of study is cross-
sectional. The target population for the present study is academics working in the higher
educational institutes of Pakistan. The size of the sample has been carefully selected
keeping population-to-sample rules and data analysis techniques-to-sample rules. The
minimum sample size using probability random sampling method is estimated to be 373. A
survey questionnaire is developed in this study following the steps of content and
operational-items relevancy to the objective of the research, along with proper wording and
layout management. The data collection process is based on two techniques i.e., self-
administrative and e-mail questionnaire survey method. Finally, for purposes of data
analysis, a brief introduction about the preliminary statistical techniques to examine the
descriptive statics results, and structural equation modelling SEM with PLS to examine the
structural paths is presented.

187
Chapter 5
Data Analysis
Introduction
The previous chapter identified the justified an appropriate research methodology. In the
interest of the assessment and testing the proposed research model, this chapter deals with
the group of issues that are required to be resolved after data collection process. This
chapter is alienated majorly in six sections. After, introduction section (5.1) presents the
pilot study results to verify the reliability and validity of the survey instrument. Based on
the reliable survey instrument, section (5.2) presents the screening of the data with
essential statistical techniques and their output, such as- missing data treatment, outlier
examination, normality, homoscedasticity, and non-response biasness. Using screened
data, section (5.3) presents the descriptive statistics of the respondents’ demographic
characteristics and the Internet usage conditions with experience. Section (5.4) crafts the
ground for inferential analysis through partial least squares (PLS) and presents the
reliability and validity of the instrument. For confirming the items relations with
underlying constructs section (5.5) presents the exploratory factor analysis (EFA) for the
main constructs into framework as well as moderating construct of the culture. Section
(5.6) is the important section of the chapter, which is further classified into four sections.
Section (5.6.1) delineates the introduction of the structural equation modelling (SEM)
techniques, practical considerations and justifications to use the PLS in this study.
Followed, section (5.6.2) presents the two-step process to analysis the proposed model. In
first step, measurement model is validated through confirmatory factor analysis (CFA).
Having established unidimensionality, validity and reliability in first step, second step
presents the evaluation of the structural equation model with substantive relations in
framework. To this end, the plausibility of the hypothetical relations between the
constructs is set-up to examine the moderating effects. Next, section (5.6.3) starts with the
brief overview of the multiple group analysis (MGA) process and steps involved to
analysis the moderation effect. Given that, five demographic moderating variables, two
conditional variables, and four cultural variables moderating impact is examined. For
checking the goodness-of-fit of the model and reliability, section (5.6.5) presents the post-
188
hoc or post analysis of the basic model using AMOS. Finally, summary of the chapter is
presented in end.
5.1. Pilot Study
Recall, in previous chapter importance of pilot study was highlighted as an indispensable
process for developing reliable instrument, which in turn achieves the intended objectives
of study. In doing so, prior to collecting full scale data, a pilot study was conducted for the
present study during the month of January 2009. The pilot study aimed to evaluate the
important requirements during instrument purification e.g. testing questions wording,
sequence, layout, familiarity with respondents, response rate, questionnaire completion
time and analysis process (Ticehurst and Veal, 2005). Additionally, it aimed to evaluate the
level of content validity and reliability to ensure that the instructions, questions and scale
of questions were clear to understand (Sekaran, 2000; Zikmud, 2000). Before, distribution
of the instrument, questions wording, sequence and layout which all together establish
‘face validity’ criterion were tested by sending few survey instruments (via email) to the
faculty members working in higher educational institutes of the Pakistan. As the questions
within instrument were widely used in IT acceptance literature, therefore very little
corrections were suggested by respondents, and ensured the accuracy of face validity.
The pilot test of the instrument was conducted by distributing 45 instruments via-email
attachment to the randomly selected academics within higher educational institutes of the
Pakistan. The respondents included into pilot study were not invited to participate in the
final study. This is because it may influence the later behaviour of the respondents if they
have already been involved in the pilot study (Haralambos and Holborn, 2000). For the
piloting, selecting small sample size is in accordance to the guidelines in literature which
suggested the pilot study sample size to be generally small i.e. up to 100 respondents
(Diamantopoulos & Siguaw, 2000) or between 10 to 30 (Luck and Rubin, 1987). By the
cut off date, 39 survey instruments were collected, out of which 3 were excluded due to
large number of missing data. As result, response rate of the pilot study was 80%. The
pilot test revealed that on average, respondents took about 15 to 20 minutes to complete the
survey instrument.
In purification process of the instrument, next stage after content validity is reliability (i.e.
Cronbach’s α) of the instrument which ensures that ‘measures are free from the error and
therefore yields consistent results’ (Peter, 1979, p.6.). In addition, exploratory factor
analysis (EFA) was run to confirm that scale selected for the present study is supported by

189
the data. The detailed discussion (literature, justification to use in present study, and
criterion values) about the reliability and validity, and EFA is presented in section (5.4 and
5.5) respectively. The overall reliability of the instrument within piloting was α=0.800 or
80% which is above than the recommended threshold 0.7 (Nunnally and Bernstein, 1994).
The individual construct reliability ranges from 0.626 to 0.875 (see table 5.1). The only
construct which produced lower reliability than the cut off value was self-efficacy (i.e.
0.57). However, after examining each question in construct SE it was noticed that question
SE6 ‘I could complete my tasks using the Internet if I had enough time provided to use it’
produced lower item-to-total correlation (i.e. 0.12) than cut off value 0.30 (Churchill,
1979). After deleting SE6 the reliability α for the remaining five questions combined
together in SE was 0.62 which was in acceptable range (Cronbach, 1951). The results of
EFA revealed that Kaiser-Mayer-Olkin (KMO) statistics which is measurement of
sampling adequacy was higher than minimum recommended value of 0.60(Kaiser, 1974)
for most of the constructs. In addition, significance of Bartlett’s test of sphericity in all the
constructs indicates that the correlation among the measurement items was higher than 0.3
and were suitable for EFA (Hair et al., 2006). The total variance extracted by the questions
within construct were higher than 0.60 (Hair et al., 2006) expect PU, PEOU, BI and IS.
However, factor loading revealed that all the items in these constructs were loaded above
0.5, therefore they were retained (Hair et al., 2006) for more analysis (i.e. after full-scale
data collection process) (see details in table 5.1).
Factor
No.
of
Items
Cronbanch
α
EFA No.
of factor KMO
Bartlett’s
test
Sphericity
Variance
Explaine
d
Perceived Usefulness
(PU) 5 0.811 1 0.717 0.000 58.833%
Perceived Ease of Use
(PEOU) 4 0.709 1 0.646 0.000 56.681%
Peer Influence
(PI) 4 0.805 1 0.761 0.000 63.282%
Superior Influence
(SI) 2 0.601 1 0.589 0.015 63.73%
Self Efficacy
(SE) 6 0.576 2 0.530 0.000 83.186%
Self Efficacy
(SE)* 5 0.626 2 0.521 0.000 76.654%
Technology Facilitation
(TF) 4 0.829 1 0.756 0.000 66.710%
Resource Facilitation
(RF) 5 0.601 1 0.610 0.000 63.020%
Academic Tasks
(AT) 6 0.794 1 0.661 0.000 72.115%
Non-Academic Tasks
(NAT) 4 0.875 1 0.793 0.000 73.116%
Behavioural Intention 4 0.662 1 0.636 0.000 51.371%

190
(BI)
Behaviour Usage
(BU) 4 0.793 1 0.729 0.000 62.764%
Power Distance
(PD) 6 0.719 1 0.691 0.000 80.676
Individualism/Collectivis
m (IC) 6 0.753 1 0.581 0.000 64.49%
Uncertainty Avoidance
(UA) 4 0.771 1 0.551 0.000 69.024%
Masculinity/femininity
(MF) 5 0.655 1 0.602 0.000 70.406%
Government support
(GS) 5 0.723 1 0.637 0.000 69.269%
Institute Support
(IS) 5 0.743 1 0.696 0.000 52.153%
Table 5.1: Measurement of sampling adequacy and total variance * SE: after deleting one item SE6
Recall, within instrument design (section 4.6) it was discussed that length of instrument
might decrease respondents interest to pay equal concentration to the questions in the start
of the instrument compared to the question in the end of instrument. It was suggested to
examine the difference during pilot study and if difference is observed than different
versions of instrument would be used for full-scale data collection process. In this regard,
the chances of potential differences were computed by using Mann-Whitney-U-test
between first-five questions (i.e. PU1 to PU5) and last-five questions (i.e. IS1 to IS5) with
categorical variable gender (male/female). The results presented in table 5.2 revealed that
significant value in all ten variables were higher than 0.5 probability value and suggest no
difference between male and female respondents in all these questions (Pallent, 2007).
Closely comparing Z score of PU with IS questions it is noticed that none of construct is
totally higher than other (e.g. PU1>IS1, PU2>IS2 and so on), therefore, it can be infer that
respondents didn’t felt difficulty with respect to the length of the instrument. Based on
piloting study result the normal layout of the instrument (Appendix-B) was retained for
collecting full scale data.
PU1_1 PU2_1 PU3_1 PU4_1 PU5_1
Mann-Whitney U 136.000 150.000 128.000 146.000 132.500
Wilcoxon W 346.000 286.000 338.000 282.000 342.500
Z -.852 -.343 -1.177 -.483 -.941
Asymp. Sig. (2-
tailed) .394 .731 .239 .629 .347
IS1_1 IS2_1 IS3_1 IS4_1 IS5_1
Mann-Whitney U 142.000 138.000 108.500 131.500 154.500
Wilcoxon W 278.000 274.000 244.500 267.500 290.500
Z -.648 -.745 -1.709 -.983 -.190
Asymp. Sig. (2-
tailed) .517 .456 .087 .325 .850
Grouping Variable: D1 (Male/Female)
191
Table 5. 2: Mann-Whitney-U-test to observe difference between first-five and last-five questions within instrument.
5.2. Main Survey Study
5.2.1. Missing Data and Treatment
Most of the studies in social science and marketing research are based on survey
questionnaire (Sekaran, 2000). Additionally, it is very rare to obtain the complete data
when survey is administrated manually (Zikumnd, 2003). According to the Tabachnick &
Fidell (2007) missing data is one of the most common problems in data analysis process.
Specifically, within survey research problem of missing data (incomplete data) arises due
to the conditions when respondents in targeted sample fail to answer one and/or more items
in instrument. Missing data causes many problems in statistical analysis procedures. For
instance, reducing sample size because of missing data reduces statistical power, which
implies that, estimations calculated can be biased to generalise (Corderio et al., 2010).
Similar problems of missing data within multivariate analysis are also warned by Hair et
al., (2006) who state that- from the practical perspective: if solutions of missing data are
not applied properly than the observations having missing values are excluded,
consequently, reduction in sample produces inadequate sample for complete analysis; from
the substantive perspective: empirical results obtained through data containing non-random
missing data could be biased and leads to erroneous results.
Overcoming the above sever problems of missing data, Hair et al., (2006) prescribed four
steps to follow- 1) examine the type of missing data, 2) examine the extent of missing data,
3) examine the randomness of missing data, and finally 4) apply the remedies e.g.
imputation method. Whereas, type of the missing data are classified into two groups as-
‘ignorable and not-ignorable’. Furthermore, author (ibid) suggest that ignorable type of
missing data can be part of research survey instrument and does not require any remedy to
treat it. On other side, not-ignorable missing data is type of data which is result of either
researcher’s procedural factors e.g. errors during data entry process or failure to enter all
the entries, or even might be result of refusal by respondents to answer some items within
survey instrument(ibid).
In the current study, researcher did not include any item in survey instrument which
required to be un-answered by the respondents, hence, there was no chance of ignorable
missing data occurrences. However, there were chances of the not-ignorable missing due to
reasons described earlier. For the treatment of the not-ignorable missing data Hair et al.,
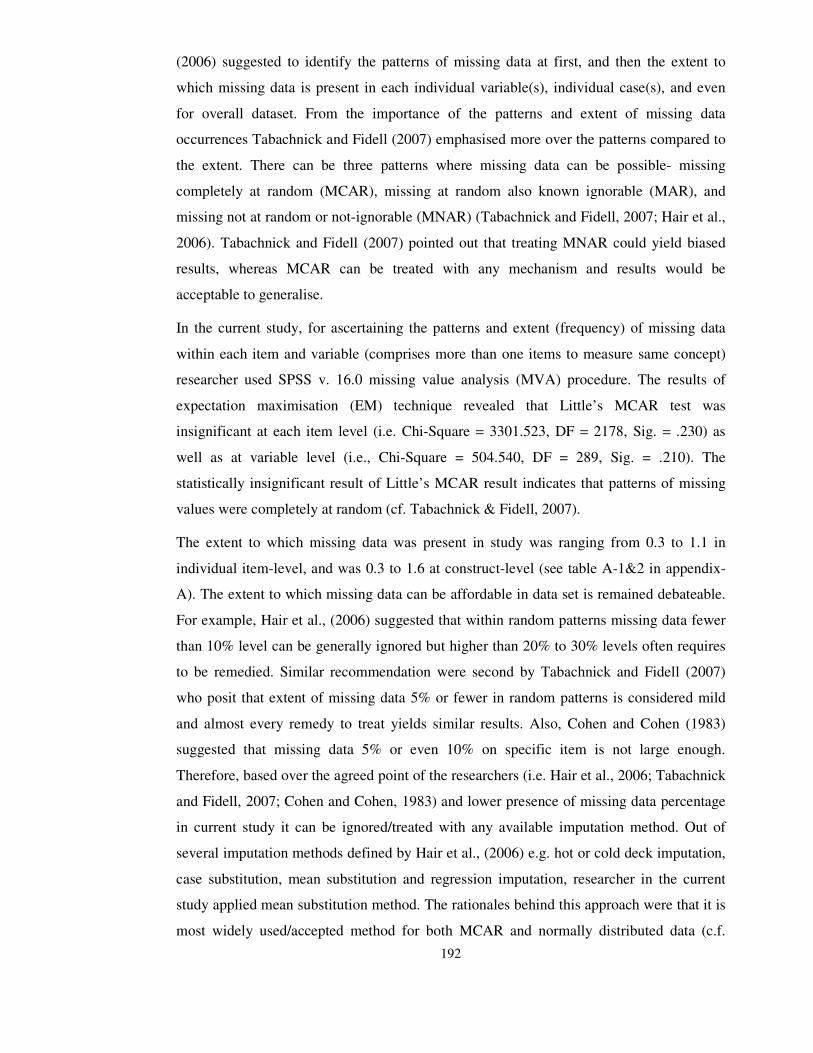
192
(2006) suggested to identify the patterns of missing data at first, and then the extent to
which missing data is present in each individual variable(s), individual case(s), and even
for overall dataset. From the importance of the patterns and extent of missing data
occurrences Tabachnick and Fidell (2007) emphasised more over the patterns compared to
the extent. There can be three patterns where missing data can be possible- missing
completely at random (MCAR), missing at random also known ignorable (MAR), and
missing not at random or not-ignorable (MNAR) (Tabachnick and Fidell, 2007; Hair et al.,
2006). Tabachnick and Fidell (2007) pointed out that treating MNAR could yield biased
results, whereas MCAR can be treated with any mechanism and results would be
acceptable to generalise.
In the current study, for ascertaining the patterns and extent (frequency) of missing data
within each item and variable (comprises more than one items to measure same concept)
researcher used SPSS v. 16.0 missing value analysis (MVA) procedure. The results of
expectation maximisation (EM) technique revealed that Little’s MCAR test was
insignificant at each item level (i.e. Chi-Square = 3301.523, DF = 2178, Sig. = .230) as
well as at variable level (i.e., Chi-Square = 504.540, DF = 289, Sig. = .210). The
statistically insignificant result of Little’s MCAR result indicates that patterns of missing
values were completely at random (cf. Tabachnick & Fidell, 2007).
The extent to which missing data was present in study was ranging from 0.3 to 1.1 in
individual item-level, and was 0.3 to 1.6 at construct-level (see table A-1&2 in appendix-
A). The extent to which missing data can be affordable in data set is remained debateable.
For example, Hair et al., (2006) suggested that within random patterns missing data fewer
than 10% level can be generally ignored but higher than 20% to 30% levels often requires
to be remedied. Similar recommendation were second by Tabachnick and Fidell (2007)
who posit that extent of missing data 5% or fewer in random patterns is considered mild
and almost every remedy to treat yields similar results. Also, Cohen and Cohen (1983)
suggested that missing data 5% or even 10% on specific item is not large enough.
Therefore, based over the agreed point of the researchers (i.e. Hair et al., 2006; Tabachnick
and Fidell, 2007; Cohen and Cohen, 1983) and lower presence of missing data percentage
in current study it can be ignored/treated with any available imputation method. Out of
several imputation methods defined by Hair et al., (2006) e.g. hot or cold deck imputation,
case substitution, mean substitution and regression imputation, researcher in the current
study applied mean substitution method. The rationales behind this approach were that it is
most widely used/accepted method for both MCAR and normally distributed data (c.f.

193
Cordeiro et al. 2010), also, calculated mean through this method can be best single
replacement for any missing value (Hair et al., 2006). The table A-1 in appendix-A
presents the frequency and percentage of missing data replaced with mean imputation.
5.2.2. Outliers Examination
According to Tabachnick and Fidell (2006, p. 72) an outlier is defined as ‘a case with such
an extreme value on one variable (a univariate outlier) or such a strange combination of
scores on two or more variable (multivariable outlier)’. It is observation(s) which is distinct
from other observations due to high or low scores (Hair et al., 2006). Researchers agreed
that outliers can result in non-normality of data and distorted statistical results (Kline,
2005; Hair et al., 2006; Tabachnick & Fidell, 2007). Tabachnick & Fidell (2007, p. 73)
defined four reasons for outliers’ presences within dataset, due to: 1) incorrect data entry,
2) failure of specifying codes for missing values which might be treated as real data, 3)
entering observation which is not part of population from which sample is extracted, and 4)
including observation from population but the distribution for the variable in the
population has extreme values than the normal distribution. Kline (2005) categorised two
types of outliers: univariate outliers- a case of an extreme value on single variable, and
multivariate outlier- case of odd combination of extreme values in two or more than two
variables. The issue of ‘extreme values’ and their tolerance are not explicitly characterised
in literature. However, there are some widely accepted rules of thumb which suggest that
within univariate outliers a case is outlier if: 1) standard score for small sample size (80 or
fewer) is � 2.5 or beyond, while for large sample size standard score can be considered up
to 4, 2) value more than � 3.0 standard deviations away from the mean is regarded as an
outlier (Hair et al., 2006. p.75).
In the current study, for detecting the univariate outliers items were grouped together to
represent single variable. Using SPSS function of descriptive statistics, the data values of
each observation were converted to standardised score also known as z-scores (Hair et al.,
2006; Tabachnick & Fidell, 2007). The results indicate that data set contains fewer
univariate outliers (see table 5.3).
S.NO Variable Case of outlier standardised values i.e. z-scores >�
3.0
1 NAT
103 -3.64489
57 -3.64489
124 -3.64489
115 -3.43909
344 -3.23328
2 BI No Case ---
3 BU 312 -3.55219
430 -3.28631
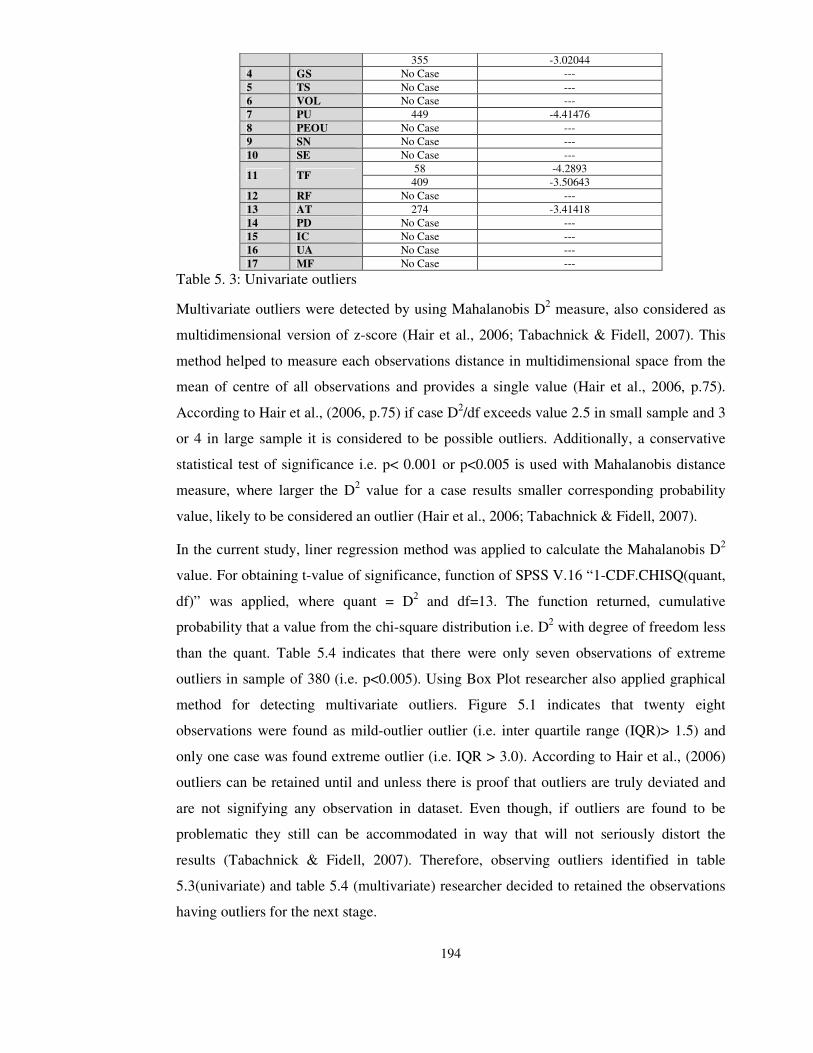
194
355 -3.02044
4 GS No Case ---
5 TS No Case ---
6 VOL No Case ---
7 PU 449 -4.41476
8 PEOU No Case ---
9 SN No Case ---
10 SE No Case ---
11 TF 58 -4.2893
409 -3.50643
12 RF No Case ---
13 AT 274 -3.41418
14 PD No Case ---
15 IC No Case ---
16 UA No Case ---
17 MF No Case ---
Table 5. 3: Univariate outliers
Multivariate outliers were detected by using Mahalanobis D2 measure, also considered as
multidimensional version of z-score (Hair et al., 2006; Tabachnick & Fidell, 2007). This
method helped to measure each observations distance in multidimensional space from the
mean of centre of all observations and provides a single value (Hair et al., 2006, p.75).
According to Hair et al., (2006, p.75) if case D2/df exceeds value 2.5 in small sample and 3
or 4 in large sample it is considered to be possible outliers. Additionally, a conservative
statistical test of significance i.e. p< 0.001 or p<0.005 is used with Mahalanobis distance
measure, where larger the D2 value for a case results smaller corresponding probability
value, likely to be considered an outlier (Hair et al., 2006; Tabachnick & Fidell, 2007).
In the current study, liner regression method was applied to calculate the Mahalanobis D2
value. For obtaining t-value of significance, function of SPSS V.16 “1-CDF.CHISQ(quant,
df)” was applied, where quant = D2 and df=13. The function returned, cumulative
probability that a value from the chi-square distribution i.e. D2 with degree of freedom less
than the quant. Table 5.4 indicates that there were only seven observations of extreme
outliers in sample of 380 (i.e. p<0.005). Using Box Plot researcher also applied graphical
method for detecting multivariate outliers. Figure 5.1 indicates that twenty eight
observations were found as mild-outlier outlier (i.e. inter quartile range (IQR)> 1.5) and
only one case was found extreme outlier (i.e. IQR > 3.0). According to Hair et al., (2006)
outliers can be retained until and unless there is proof that outliers are truly deviated and
are not signifying any observation in dataset. Even though, if outliers are found to be
problematic they still can be accommodated in way that will not seriously distort the
results (Tabachnick & Fidell, 2007). Therefore, observing outliers identified in table
5.3(univariate) and table 5.4 (multivariate) researcher decided to retained the observations
having outliers for the next stage.
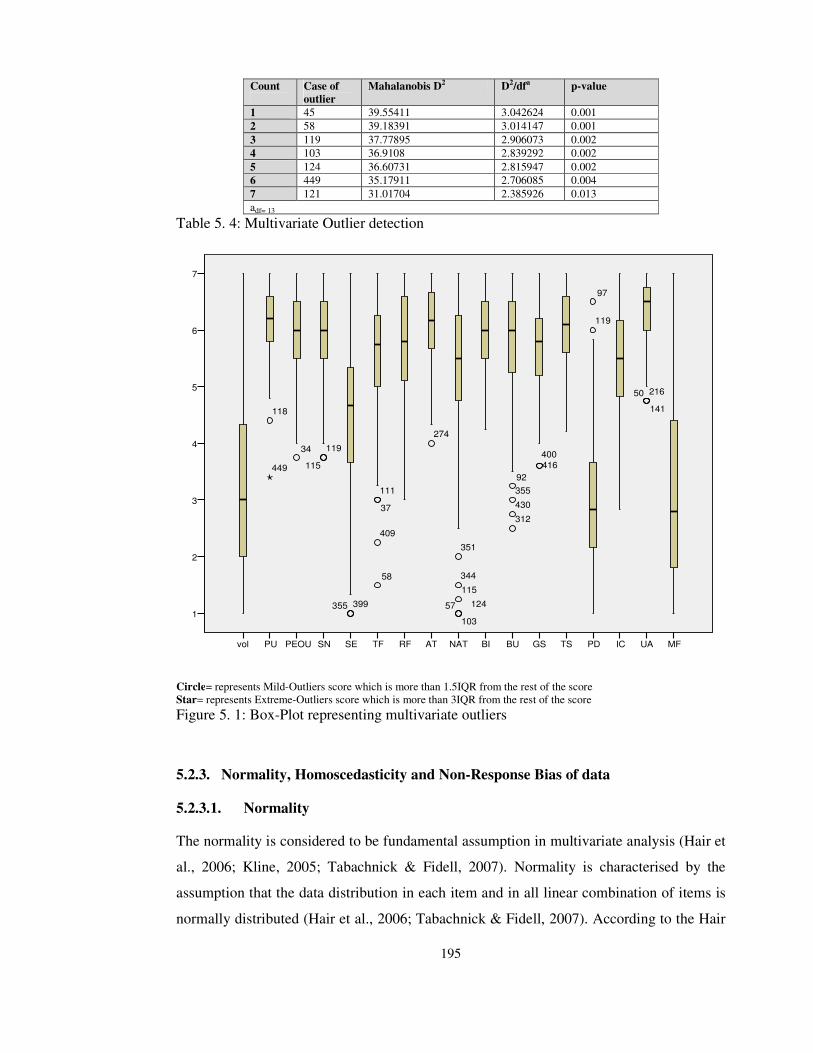
195
Count
Case of
outlier
Mahalanobis D2 D2/dfa p-value
1 45 39.55411 3.042624 0.001
2 58 39.18391 3.014147 0.001
3 119 37.77895 2.906073 0.002
4 103 36.9108 2.839292 0.002
5 124 36.60731 2.815947 0.002
6 449 35.17911 2.706085 0.004
7 121 31.01704 2.385926 0.013
adf= 13
Table 5. 4: Multivariate Outlier detection
Circle= represents Mild-Outliers score which is more than 1.5IQR from the rest of the score Star= represents Extreme-Outliers score which is more than 3IQR from the rest of the score
Figure 5. 1: Box-Plot representing multivariate outliers
5.2.3. Normality, Homoscedasticity and Non-Response Bias of data
5.2.3.1. Normality
The normality is considered to be fundamental assumption in multivariate analysis (Hair et
al., 2006; Kline, 2005; Tabachnick & Fidell, 2007). Normality is characterised by the
assumption that the data distribution in each item and in all linear combination of items is
normally distributed (Hair et al., 2006; Tabachnick & Fidell, 2007). According to the Hair
MFUAICPDTSGSBUBINATATRFTFSESNPEOUPUvol
7
6
5
4
3
2
1
449
118
92
355
430
312
97
119
400
416
111
37
409
58
34
399355
351
344
115
103
12457
50
141
216
274
119
115

196
et al., (2006, p. 79) ‘if the variation from the normal distribution is sufficiently large, all
resulting statistical test are invalid, because normality is required to use the F and t
statistics’. Furthermore, author state that violation of normality within multivariate analysis
can cause underestimation of fit indices and standardised residuals of estimations (ibid).
The assumptions of normality can be examined at unvariate level (i.e. distribution of scores
at an item-level) and at multivariate level (i.e. distribution of scores within combination of
two or more than two items). According to Hair et al., (2006, p. 80) if the variable/items
satisfies the multivariate normality than it also satisfy the univariate normality, while
reverse is not necessarily true. In other words, existence of univariate normality does not
guarantee the assumption of multivariate normality.
Assessing the severity of nonnormality is based on two assumptions- 1) the shape of
offending distribution, and 2) the sample size (Hair et al., 2006, p.80). According to
(Tabachnick & Fidell, 2007, p. 79) shape of normal distribution can be ascertained by
either graphical or statistical methods. Within graphical method of examination, normality
is checked by inspecting the histogram of variable, which requires being symmetrical, bell-
shaped curve and has higher frequency of scores in middle and lower on peaks (Pallant,
2007, p. 124). Another graphical method for assessing normality, also considered to be an
easier method compared to the others is Q-Q plot (also know normal probability plot)
(Norusis, 1992). The Q-Q plot, displays graph between observed values and expected
values. Within Q-Q plot if the points within graph are clustered around a straight line than
it represents variable is normally distributed (Field, 2009).
Through visual inspection in figure A-1(appendix-A) the distribution of values in the
current study shown that all variables were clustered around the straight line, therefore,
observation within sample does not require any adjustment through transformation process.
Furthermore, the normal probability plot (P-P plot of the regression standardised residual)
employed to assess multivariate normality were also noticed normal (see figure 5.2). In
addition, Kolmogorov-Smirnov and Shapiro-Wilk (K-S) statistics (Shapiro and Wilk,
1965) were calculated for each variable (see table 5.5) and results revealed that all the
variables were significant, which violated the assumption of normality. The significance of
K-S test was expected due to large sample size (Pallant, 2007, p. 62). According to the
Field (2006, p.93) the significance of K-S test for large sample size cannot be considered
as deviation of data from normal distribution.
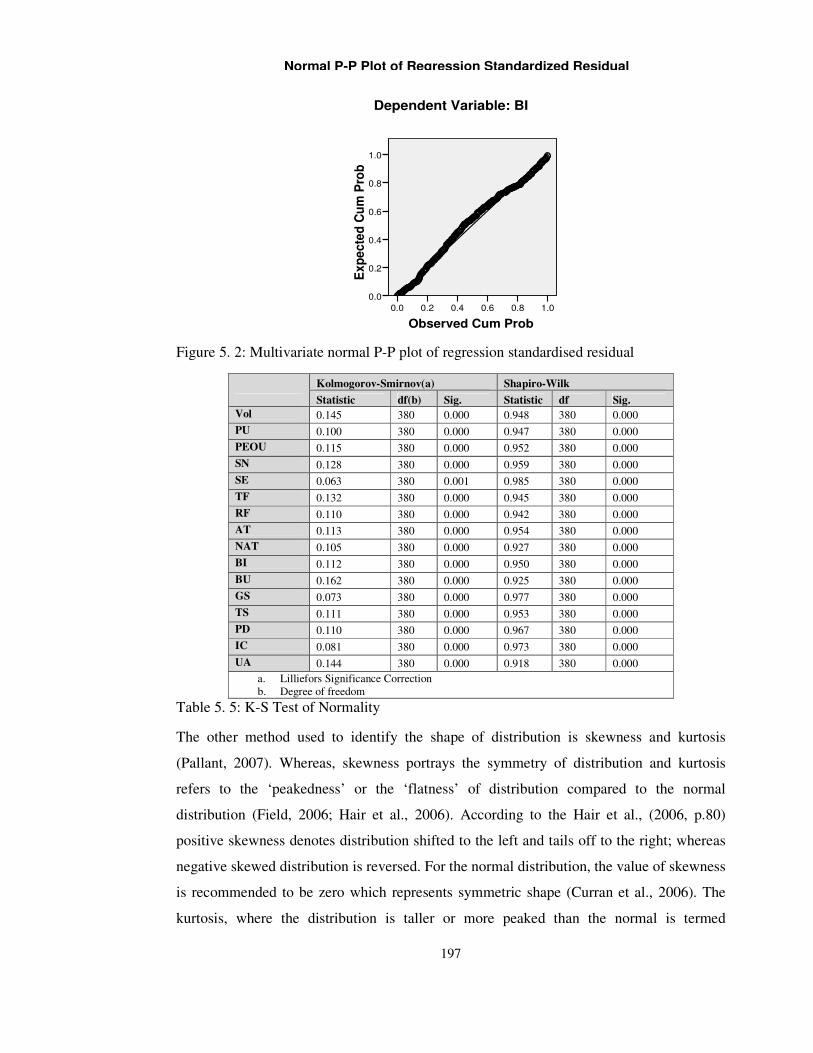
197
Figure 5. 2: Multivariate normal P-P plot of regression standardised residual
Kolmogorov-Smirnov(a) Shapiro-Wilk
Statistic df(b) Sig. Statistic df Sig.
Vol 0.145 380 0.000 0.948 380 0.000
PU 0.100 380 0.000 0.947 380 0.000
PEOU 0.115 380 0.000 0.952 380 0.000
SN 0.128 380 0.000 0.959 380 0.000
SE 0.063 380 0.001 0.985 380 0.000
TF 0.132 380 0.000 0.945 380 0.000
RF 0.110 380 0.000 0.942 380 0.000
AT 0.113 380 0.000 0.954 380 0.000
NAT 0.105 380 0.000 0.927 380 0.000
BI 0.112 380 0.000 0.950 380 0.000
BU 0.162 380 0.000 0.925 380 0.000
GS 0.073 380 0.000 0.977 380 0.000
TS 0.111 380 0.000 0.953 380 0.000
PD 0.110 380 0.000 0.967 380 0.000
IC 0.081 380 0.000 0.973 380 0.000
UA 0.144 380 0.000 0.918 380 0.000
a. Lilliefors Significance Correction b. Degree of freedom
Table 5. 5: K-S Test of Normality
The other method used to identify the shape of distribution is skewness and kurtosis
(Pallant, 2007). Whereas, skewness portrays the symmetry of distribution and kurtosis
refers to the ‘peakedness’ or the ‘flatness’ of distribution compared to the normal
distribution (Field, 2006; Hair et al., 2006). According to the Hair et al., (2006, p.80)
positive skewness denotes distribution shifted to the left and tails off to the right; whereas
negative skewed distribution is reversed. For the normal distribution, the value of skewness
is recommended to be zero which represents symmetric shape (Curran et al., 2006). The
kurtosis, where the distribution is taller or more peaked than the normal is termed
Observed Cum Prob
1.00.80.60.40.20.0
Ex
pe
cte
d C
um
Pro
b
1.0
0.8
0.6
0.4
0.2
0.0
Normal P-P Plot of Regression Standardized Residual
Dependent Variable: BI

198
‘leptokurtic’, and the distribution that is flat is termed ‘platykurtick’ (Hair et al., 2006, p.
80). Additionally, the negative kurtosis value indicates a flatter distribution, while a
positive value indicates peaked distribution. The kurtosis values less than � 1 are
considered negligible, and values from � 1 to � 10 are indicated moderate non-normality,
while greater than � 10 are indication of severe non-normality (Holmes-Smith,
Cunningham & Coote, 2006).
In this study, as presented in table 5.6 all the variables were within the normal range of
skewness and kurtosis(i.e. < � 2.58, c.f. Hair et al., 2006, p.82). However, the score
presented in table 5.6 have both positive and negative skewness and kurtosis values.
According to Pallant (2007, p. 56) negative or positive skewness and kurtosis does not
represents any problem until and unless they are within normal range. Also, negative or
positive values of skewness and kurtosis reflect the underlying nature of the construct
being measured. For example, in this study, the negative skewed score of construct
perceived usefulness represents that individuals within sample are agreed more than
disagreed towards the acceptance due to usefulness.
The severity of normality is also based over the sample size (Hair et al., 2006). The larger
sample size reduces the negative effects of non-normality (Hair et al., 2006; Pallant, 2007).
Moreover, small sample size (fewer than 50 cases) represents serious effect on normality
compared to the large sample size (more than 200 cases). In the current study, workable
sample size is 380; therefore, presence of little non-normal univariate distribution may be
avoidable.
For the test of multivariate normality, Mardia’s coefficient was used (Brwon, 1982).
Mardia’s (1970) coefficient of multivariate normality was computed by AMOS (Arbuckle,
2006) (see table A-3 in appendix-A), which indicates that the assumption of multivariate
normality was not tenable (Mardia’s coefficient = 228.527, CR = 39.88). The table A-4
appendix-A, represents the observations farthest from the centroid (Mahalanobis distance)
and displays potential multivariate outliers which resulted non-normality within sample.
N Minimum Maximum Mean
Std.
Deviation Skewness Kurtosis
Statistic Statistic Statistic Statistic Statistic Statistic Std. Error Statistic
Std.
Erro
r
vol 380 1.00 7.00 3.1897 1.51255 0.516 0.125 -0.628 0.250
PU 380 3.40 7.00 6.1463 0.62208 -0.433 0.125 0.022 0.250
PEOU 380 3.75 7.00 5.9480 0.73350 -0.319 0.125 -0.611 0.250
SN 380 3.75 7.00 5.9007 0.72609 -0.502 0.125 -0.234 0.250
SE 380 1.00 7.00 4.5561 1.24208 -0.141 0.125 -0.153 0.250
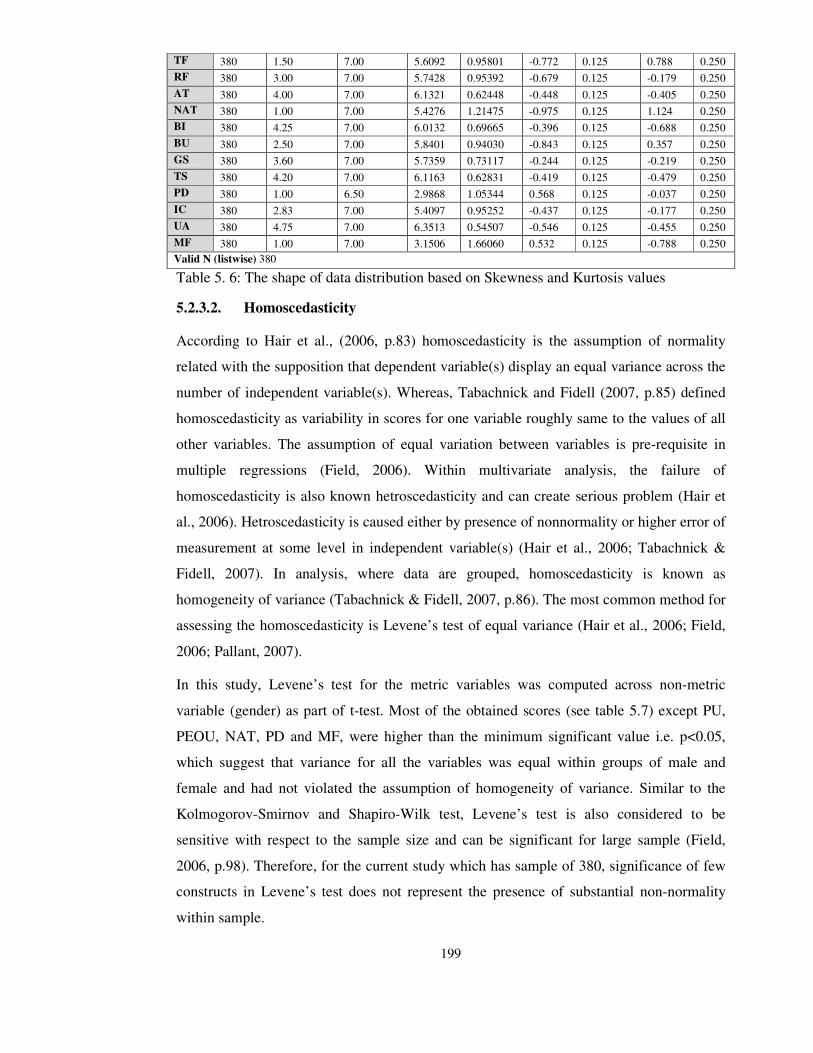
199
TF 380 1.50 7.00 5.6092 0.95801 -0.772 0.125 0.788 0.250
RF 380 3.00 7.00 5.7428 0.95392 -0.679 0.125 -0.179 0.250
AT 380 4.00 7.00 6.1321 0.62448 -0.448 0.125 -0.405 0.250
NAT 380 1.00 7.00 5.4276 1.21475 -0.975 0.125 1.124 0.250
BI 380 4.25 7.00 6.0132 0.69665 -0.396 0.125 -0.688 0.250
BU 380 2.50 7.00 5.8401 0.94030 -0.843 0.125 0.357 0.250
GS 380 3.60 7.00 5.7359 0.73117 -0.244 0.125 -0.219 0.250
TS 380 4.20 7.00 6.1163 0.62831 -0.419 0.125 -0.479 0.250
PD 380 1.00 6.50 2.9868 1.05344 0.568 0.125 -0.037 0.250
IC 380 2.83 7.00 5.4097 0.95252 -0.437 0.125 -0.177 0.250
UA 380 4.75 7.00 6.3513 0.54507 -0.546 0.125 -0.455 0.250
MF 380 1.00 7.00 3.1506 1.66060 0.532 0.125 -0.788 0.250
Valid N (listwise) 380
Table 5. 6: The shape of data distribution based on Skewness and Kurtosis values
5.2.3.2. Homoscedasticity
According to Hair et al., (2006, p.83) homoscedasticity is the assumption of normality
related with the supposition that dependent variable(s) display an equal variance across the
number of independent variable(s). Whereas, Tabachnick and Fidell (2007, p.85) defined
homoscedasticity as variability in scores for one variable roughly same to the values of all
other variables. The assumption of equal variation between variables is pre-requisite in
multiple regressions (Field, 2006). Within multivariate analysis, the failure of
homoscedasticity is also known hetroscedasticity and can create serious problem (Hair et
al., 2006). Hetroscedasticity is caused either by presence of nonnormality or higher error of
measurement at some level in independent variable(s) (Hair et al., 2006; Tabachnick &
Fidell, 2007). In analysis, where data are grouped, homoscedasticity is known as
homogeneity of variance (Tabachnick & Fidell, 2007, p.86). The most common method for
assessing the homoscedasticity is Levene’s test of equal variance (Hair et al., 2006; Field,
2006; Pallant, 2007).
In this study, Levene’s test for the metric variables was computed across non-metric
variable (gender) as part of t-test. Most of the obtained scores (see table 5.7) except PU,
PEOU, NAT, PD and MF, were higher than the minimum significant value i.e. p<0.05,
which suggest that variance for all the variables was equal within groups of male and
female and had not violated the assumption of homogeneity of variance. Similar to the
Kolmogorov-Smirnov and Shapiro-Wilk test, Levene’s test is also considered to be
sensitive with respect to the sample size and can be significant for large sample (Field,
2006, p.98). Therefore, for the current study which has sample of 380, significance of few
constructs in Levene’s test does not represent the presence of substantial non-normality
within sample.

200
Test of Homogeneity of Variances
Levene
Statistic df1 df2 Sig.
vol 0.581 1 378 0.447
PU 4.347 1 378 0.038
PEOU 4.117 1 378 0.043
SN 2.760 1 378 0.097
SE 0.857 1 378 0.355
TF 0.960 1 378 0.328
RF 3.228 1 378 0.073
AT 0.677 1 378 0.411
NAT 4.230 1 378 0.040
BI 2.404 1 378 0.122
GS 0.377 1 378 0.540
TS 0.513 1 378 0.474
PD 4.463 1 378 0.035
IC 3.306 1 378 0.070
UA 0.233 1 378 0.630
MF 7.041 1 378 0.008
BU 0.536 1 378 0.464
Table 5. 7: Leven’s test of homogeneity of variances
5.2.3.3. Multicollinearity
Multicollinearity is the problem related to the correlation matrix in which three or more
independent variables are highly correlated (say, .90 or above) to each other (Tabachnick
& Fidell, 2007; Hair et al., 2006). The presences of higher level of multicollinearity results
in lower of the unique variance explained by each independent variable (β-value) and
increase the shared prediction percentage (Hair et al., 2006, p.186). In other words, the
presence of multicollinearity limits the size of regression (R) value and makes it difficult to
understand the contribution of each individual independent variable (Field, 2006). For
increasing the prediction, it is suggested to inspect the highly correlated variables and
delete one of them (Hair et al., 2006, Tabachnick & Fidell, 2007).
From the several method of detecting severity of multicollinearity, two are very common:
inspecting the bivariate and multivariate correlation matrix, and calculating the variance
inflation factors (VIF) and tolerance impact (Pallant, 2007; Tabachnick & Fidell, 2007;
Temme et al., 2010). According to the Pallant (2007, p.156) the tolerance effect indicates
the variability specified by independent variable is unique (not explained by any other
independent variable), whereas VIF is the inverse of tolerance effect. The larger VIF (say,
above 10) and lower tolerance (say, below 0.1) indicates the presence of mulitcollinearity
(Myer, 1997; Menard, 1995; Pallant, 2007).

201
In the current study, bivariate correlation matrix was computed using Pearson’s
correlation. The results of correlation matrix presented in table 5.8 revealed that none of
the bivariate correlation was above than 0.8 for independent variables. The VIF and
tolerance effect were computed using multiple regression procedure with collinearity
diagnostic option. The results presented in table 5.9 revealed that larges VIF vale was
0.961 which suggest absence of multicollieairty within independent variables; however, the
tolerance effect in one independent variables was lower than the 0.1 and presents the
possibility of mulitcollinearity. The strategy for dealing multicolliearity is to delete the
redundant variable (Tabachnick & Fidell, 2007). However, instead of deleting the variable
at this stage, variables were retained for the further examination of collinearities using
factor analysis with principle component analysis method.

202
Vol PU PEOU SN SE TF RF AT NAT BI BU GS TS PD IC UA MF
vol 1
PU 0.036 1
PEO
U 0.065 .388(**) 1
SN 0.067 .307(**) .162(**) 1
SE 0.045 -0.013 -.113(*) .175(**) 1
TF 0.033 .157(**) .175(**) .148(**) -0.047 1
RF 0.005 .149(**) .125(*) .155(**) 0.078 .272(**) 1
AT -0.024 0.068 .156(**) .134(**) -0.002 .192(**) .177(**) 1
NAT 0.054 .110(*) .141(**) .126(*) -0.006 .219(**) 0.095 .244(**) 1
BI -0.075 .396(**) .219(**) .191(**) 0.069 .115(*) .263(**) .288(**) .118(*) 1
BU -0.031 .168(**) .118(*) 0.058 -0.002 .182(**) .101(*) 0.073 0.094 .242(**) 1
GS -0.031 .250(**) .192(**) .228(**) -0.001 .151(**) .193(**) .174(**) .202(**) .198(**) 0.084 1
TS -.192(**) .287(**) .189(**) 0.060 -0.085 .194(**) .165(**) .165(**) .109(*) .217(**) .243(**) .163(**) 1
PD .111(*) -0.016 -0.066 -0.060 .215(**) -0.029 .138(**) 0.000 -0.075 0.045 -0.026 0.082 -0.061 1
IC -0.021 .139(**) 0.084 0.097 .169(**) 0.064 -0.083 0.060 0.036 .101(*) .132(*) 0.080 0.098 -0.037 1
UA -0.072 .139(**) .127(*) .263(**) 0.002 .191(**) .213(**) .216(**) .120(*) .233(**) .151(**) .183(**) .199(**) -0.086 .242(**) 1
MF -0.070 -0.054 -.116(*) 0.034 0.014 -0.100 -0.022 0.001 -0.062 0.049 0.025 .127(*) -0.039 .165(**) -0.059
-.122(*)
1
**. Correlation is significant at the 0.01 level (2-tailed).
*. Correlation is significant at the 0.05 level (2-tailed).
Table 5. 8: Pearson correlation for observing multicollinearity

203
Unstandardized
Coefficients
Standardized
Coefficients t Sig. Collinearity Statistics
B
Std.
Error Beta Tolerance VIF B Std. Error
(Constant) .049 .572 .086 .931
Vol -.033 .021 -.071 -1.549 .122 .915 1.093
PU .353 .058 .315 6.081 .000 .715 1.398
PEOU .040 .047 .042 .853 .394 .788 1.270
SN .002 .048 .002 .049 .961 .775 1.290
SE .034 .027 .060 1.258 .209 .852 1.174
TF -.042 .035 -.058 -1.201 .230 .824 1.213
RF .105 .036 .144 2.955 .003 .810 1.235
AT .231 .053 .207 4.375 .000 .860 1.163
NAT .004 .027 .007 .153 .879 .871 1.148
BU .105 .034 .142 3.065 .002 .895 1.118
GS .009 .046 .010 .205 .838 .815 1.226
TS .012 .055 .011 .217 .828 .788 1.269
PD .019 .031 .028 .600 .549 .864 1.157
IC .004 .035 .006 .118 .906 .858 1.166
UA .123 .064 .096 1.933 .054 .777 1.286
MF .028 .019 .066 1.421 .156 .899 1.113
a Dependent Variable: BI
Table 5. 9: Regression for observing VIF and tolerance effect
5.2.3.4. Non- Response Biasness
One of the important aspects during the data collection procedure is to ensure that sample
collected represents complete population. The unexpected refusal to respond or
ineligibility to respond might reduces the sample size, which in turn distorts the validity of
sample to represent the overall population. According to Saunders et al., (2007) when
sample does not represent whole data than results obtained from the collected data are
considered biased. The existence of effective response rate provides confidence that
response bias is not a major problem (Weiss & Heide, 1993). The problem of non-
response biasness is common in survey research, which occurs when respondents differ in
meaningful way from non-respondents (Armstrong & Overton, 1977; Churchill, 1979).
In this study, the chances of any potential non-response biasness were computed by
assessing the difference through Mann-Whitney-U-test between early and late respondents
(see table 5.10) with respect to the means of all the variables (Armstrong & Overton, 1977;
Lambert & Harrington, 1990; Weiss & Heide, 1993). According to proportion of
approximated the actual way in which survey questionnaires were returned, first 50
observations were taken as early respondents and last 50 were taken as late respondents.
The results presented in table 5.10 shows that significance value in any variable is not less
than or equal to 0.5 probability value (i.e. insignificant), therefore, there is no statistically
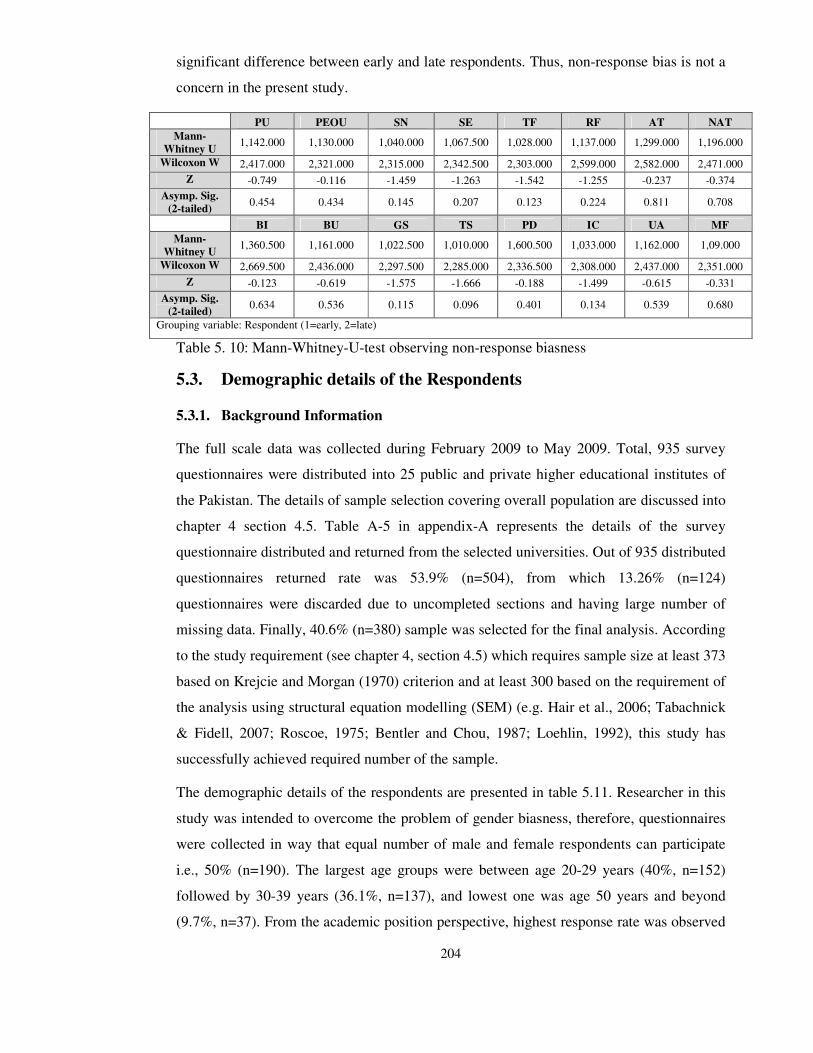
204
significant difference between early and late respondents. Thus, non-response bias is not a
concern in the present study.
PU PEOU SN SE TF RF AT NAT
Mann-
Whitney U 1,142.000 1,130.000 1,040.000 1,067.500 1,028.000 1,137.000 1,299.000 1,196.000
Wilcoxon W 2,417.000 2,321.000 2,315.000 2,342.500 2,303.000 2,599.000 2,582.000 2,471.000
Z -0.749 -0.116 -1.459 -1.263 -1.542 -1.255 -0.237 -0.374
Asymp. Sig.
(2-tailed) 0.454 0.434 0.145 0.207 0.123 0.224 0.811 0.708
BI BU GS TS PD IC UA MF
Mann-
Whitney U 1,360.500 1,161.000 1,022.500 1,010.000 1,600.500 1,033.000 1,162.000 1,09.000
Wilcoxon W 2,669.500 2,436.000 2,297.500 2,285.000 2,336.500 2,308.000 2,437.000 2,351.000
Z -0.123 -0.619 -1.575 -1.666 -0.188 -1.499 -0.615 -0.331
Asymp. Sig.
(2-tailed) 0.634 0.536 0.115 0.096 0.401 0.134 0.539 0.680
Grouping variable: Respondent (1=early, 2=late)
Table 5. 10: Mann-Whitney-U-test observing non-response biasness
5.3. Demographic details of the Respondents
5.3.1. Background Information
The full scale data was collected during February 2009 to May 2009. Total, 935 survey
questionnaires were distributed into 25 public and private higher educational institutes of
the Pakistan. The details of sample selection covering overall population are discussed into
chapter 4 section 4.5. Table A-5 in appendix-A represents the details of the survey
questionnaire distributed and returned from the selected universities. Out of 935 distributed
questionnaires returned rate was 53.9% (n=504), from which 13.26% (n=124)
questionnaires were discarded due to uncompleted sections and having large number of
missing data. Finally, 40.6% (n=380) sample was selected for the final analysis. According
to the study requirement (see chapter 4, section 4.5) which requires sample size at least 373
based on Krejcie and Morgan (1970) criterion and at least 300 based on the requirement of
the analysis using structural equation modelling (SEM) (e.g. Hair et al., 2006; Tabachnick
& Fidell, 2007; Roscoe, 1975; Bentler and Chou, 1987; Loehlin, 1992), this study has
successfully achieved required number of the sample.
The demographic details of the respondents are presented in table 5.11. Researcher in this
study was intended to overcome the problem of gender biasness, therefore, questionnaires
were collected in way that equal number of male and female respondents can participate
i.e., 50% (n=190). The largest age groups were between age 20-29 years (40%, n=152)
followed by 30-39 years (36.1%, n=137), and lowest one was age 50 years and beyond
(9.7%, n=37). From the academic position perspective, highest response rate was observed
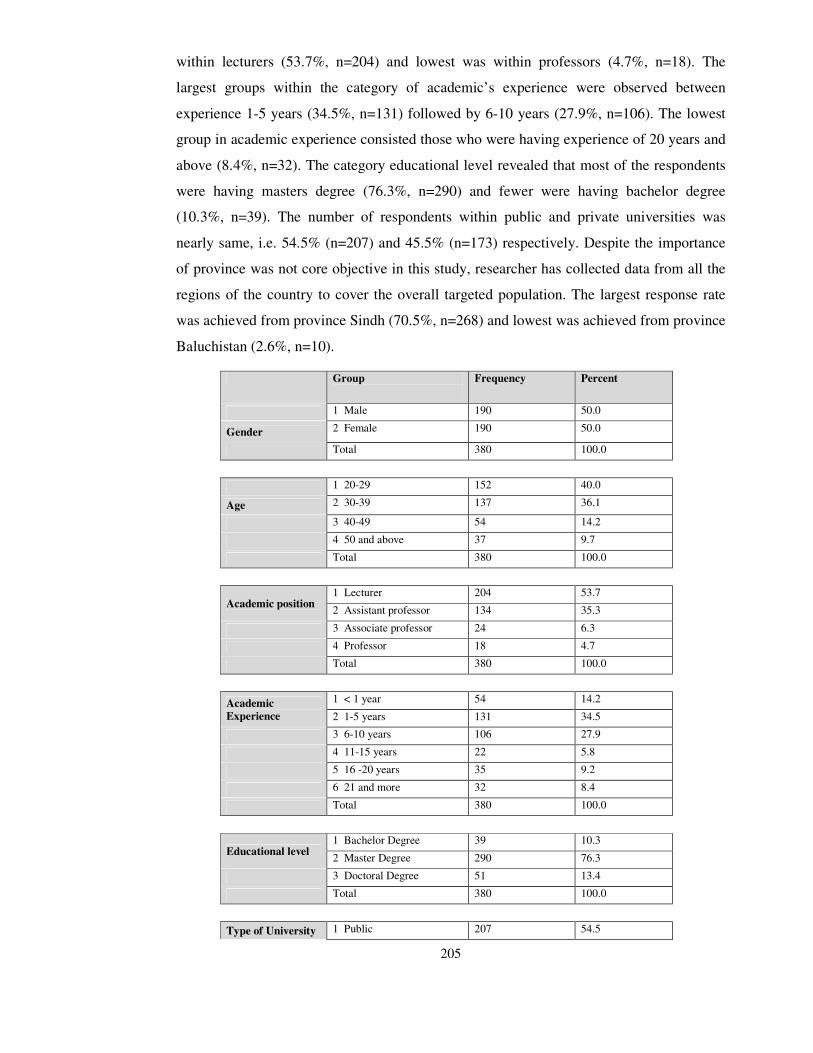
205
within lecturers (53.7%, n=204) and lowest was within professors (4.7%, n=18). The
largest groups within the category of academic’s experience were observed between
experience 1-5 years (34.5%, n=131) followed by 6-10 years (27.9%, n=106). The lowest
group in academic experience consisted those who were having experience of 20 years and
above (8.4%, n=32). The category educational level revealed that most of the respondents
were having masters degree (76.3%, n=290) and fewer were having bachelor degree
(10.3%, n=39). The number of respondents within public and private universities was
nearly same, i.e. 54.5% (n=207) and 45.5% (n=173) respectively. Despite the importance
of province was not core objective in this study, researcher has collected data from all the
regions of the country to cover the overall targeted population. The largest response rate
was achieved from province Sindh (70.5%, n=268) and lowest was achieved from province
Baluchistan (2.6%, n=10).
Group
Frequency Percent
1 Male 190 50.0
Gender 2 Female 190 50.0
Total 380 100.0
1 20-29 152 40.0
Age 2 30-39 137 36.1
3 40-49 54 14.2
4 50 and above 37 9.7
Total 380 100.0
Academic position 1 Lecturer 204 53.7
2 Assistant professor 134 35.3
3 Associate professor 24 6.3
4 Professor 18 4.7
Total 380 100.0
Academic
Experience
1 < 1 year 54 14.2
2 1-5 years 131 34.5
3 6-10 years 106 27.9
4 11-15 years 22 5.8
5 16 -20 years 35 9.2
6 21 and more 32 8.4
Total 380 100.0
Educational level 1 Bachelor Degree 39 10.3
2 Master Degree 290 76.3
3 Doctoral Degree 51 13.4
Total 380 100.0
Type of University 1 Public 207 54.5

206
2 Private 173 45.5
Total 380 100.0
Name of Province 1 Sindh 268 70.5
2 Baluchistan 10 2.6
3 Punjab 51 13.4
4 North West Frontier Province (NWFP)
51 13.4
Total 380 100.0
Table 5. 11:Demographic details of the respondents
5.3.2. Background of Internet usage experience
One of the objectives of this study is to observe the moderating impact of internet
experience. Therefore, the patterns of the Internet experience were obtained by asking
usage history in years and users self-assessment about usage (table 5.12). Results revealed
that based on usage history, largest group of respondents were having 6-10 years (41.8%,
n=159) experience followed by 1-5 years (26.6%, n=101) experience, and lowest one was
having less than one year (2.9%, n=11) experience. Interestingly, it was observed that there
were just few respondents who had never used Internet before (1.6%, n=6). Based on the
self-assessment of the Internet usage experience question, most of the respondents
evaluated themselves as moderate and highly experienced users i.e., 48.4% (n=184) and
46.3% (n=176) respectively. There were only 5.3% (n=20) respondents who evaluated
themselves as low in the Internet experience usage. The overall patterns of usage
experience revealed that within the higher educational institutes of the Pakistan academics
were having good experience of the Internet usage.
Group Frequency Percent
How long have you been using the Internet Valid 1 Don’t use at al 6.0 1.6 2 < 1 year
11.0 2.9 3 1-5 year 101.0 26.6 4 6-10 years 159.0 41.8 5 > 10 year 103.0 27.1 Total 380.0 100.0
How will you self-asses yourself about the
Internet usage experience level
Valid 1 Low 20.0 5.3
2 Moderate 184.0 48.4 3 High 176.0 46.3 Total 380.0 100.0
Table 5. 12: Descriptive of Interne experience usage

207
5.3.3. Impact of reforms initiated by Higher Education Commission of Pakistan
For examining the impact of reforms initiated by Higher Education Commission (HEC)
Pakistan, questions were asked related to method of usage, availability of resources, access
to the digital library, registration and access to the research repository, and finally
participation in the e-learning programs. The table 5.13 indicates that widely used method
of the Internet access within universities was broadband (86%, n=329) followed by
wireless (10%, n=41). The response pertaining to the resources availability was partially
observed. Near to half percent (52.11%, n=198) respondents answered that within their
institutes there were enough resources to use the Internet, while other half (44.47%, n=169)
denounced. The answers related to the awareness revealed that majority of respondents
were either unaware or were irregular to use digital library i.e. one of the Internet based
project. The response shown that 27% (n=105) respondents never used digital library, 20%
(n=76) used fewer times in week, and 16% (n=64) used only fewer times in a month. The
descriptive related to the use of Pakistan Research Repository (PRR) were more
unfavourable than the access to digital library awareness. Results revealed that 90.53%
(n=344) were not registered with PRR network and remaining only 9.47% (n=36) shown
registration at the time of data collection process. Despite of very less number of
academics registered with PRR, large number of respondents shown their willingness to
upload their research work on PRR. The number of respondents who shown willingness
were 80.79% (n=307).
Groups Frequency Percent
Method of usage 1 Broadband 329.00 86.58
2 Dial-up 6.00 1.58
3 Wireless 41.00 10.79
4 Other (specify) 4.00 1.05
Total 380.00 100.00
Enough to use
1 Not enough 169.00 44.47
2 Enough 198.00 52.11
3 More than Enough 13.00 3.42
Total 380.00 100.00
Digital Library
1 Don’t use at al 105.00 27.63
2 Use about once in a month 52.00 13.68
3 use about few times in a month 64.00 16.84
4 Use about once in a week 45.00 11.84
5 use about few times in a week 76.00 20.00
6 use about once in a day 14.00 3.68
7 use about few times in a day 24.00 6.32
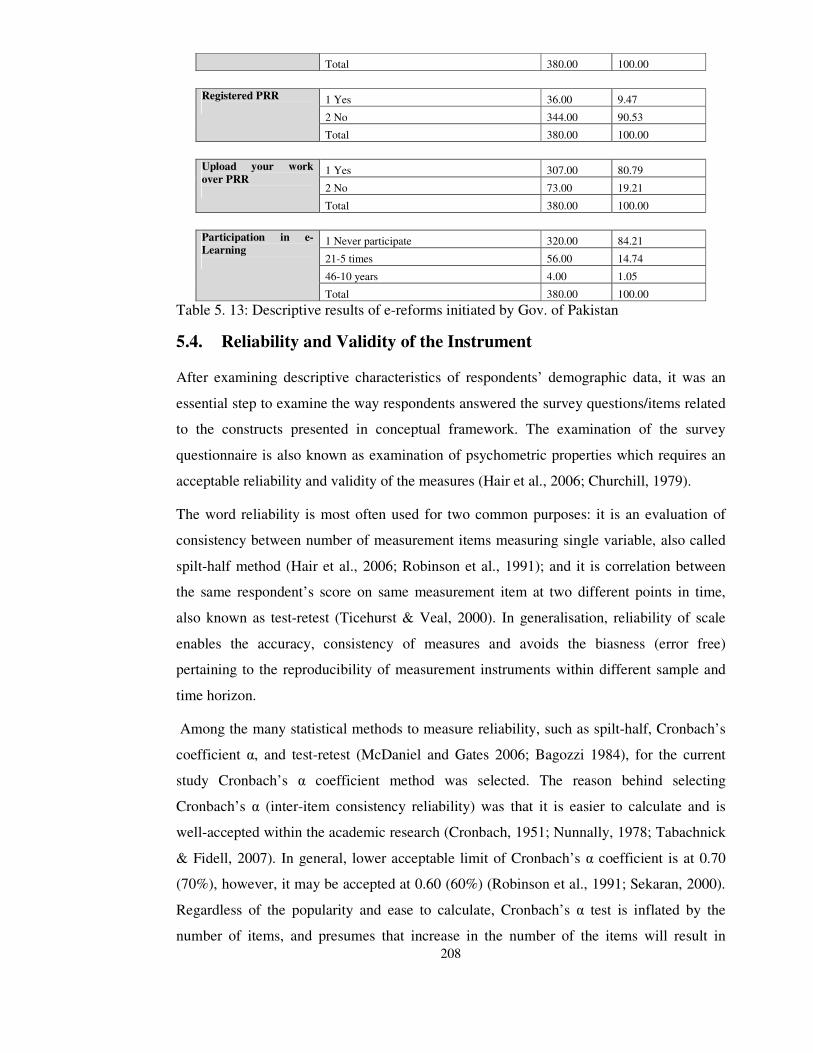
208
Total 380.00 100.00
Registered PRR
1 Yes 36.00 9.47
2 No 344.00 90.53
Total 380.00 100.00
Upload your work
over PRR
1 Yes 307.00 80.79
2 No 73.00 19.21
Total 380.00 100.00
Participation in e-
Learning
1 Never participate 320.00 84.21
21-5 times 56.00 14.74
46-10 years 4.00 1.05
Total 380.00 100.00
Table 5. 13: Descriptive results of e-reforms initiated by Gov. of Pakistan
5.4. Reliability and Validity of the Instrument
After examining descriptive characteristics of respondents’ demographic data, it was an
essential step to examine the way respondents answered the survey questions/items related
to the constructs presented in conceptual framework. The examination of the survey
questionnaire is also known as examination of psychometric properties which requires an
acceptable reliability and validity of the measures (Hair et al., 2006; Churchill, 1979).
The word reliability is most often used for two common purposes: it is an evaluation of
consistency between number of measurement items measuring single variable, also called
spilt-half method (Hair et al., 2006; Robinson et al., 1991); and it is correlation between
the same respondent’s score on same measurement item at two different points in time,
also known as test-retest (Ticehurst & Veal, 2000). In generalisation, reliability of scale
enables the accuracy, consistency of measures and avoids the biasness (error free)
pertaining to the reproducibility of measurement instruments within different sample and
time horizon.
Among the many statistical methods to measure reliability, such as spilt-half, Cronbach’s
coefficient α, and test-retest (McDaniel and Gates 2006; Bagozzi 1984), for the current
study Cronbach’s α coefficient method was selected. The reason behind selecting
Cronbach’s α (inter-item consistency reliability) was that it is easier to calculate and is
well-accepted within the academic research (Cronbach, 1951; Nunnally, 1978; Tabachnick
& Fidell, 2007). In general, lower acceptable limit of Cronbach’s α coefficient is at 0.70
(70%), however, it may be accepted at 0.60 (60%) (Robinson et al., 1991; Sekaran, 2000).
Regardless of the popularity and ease to calculate, Cronbach’s α test is inflated by the
number of items, and presumes that increase in the number of the items will result in
209
increase of the overall reliability. According to Hair et al., (2006, p.137) reliability or
internal consistency of scale can also be assessed by examining the item-to-total
correlation (the correlation of the item to the summated scale score) and the inter-item
correlation (the correlation among items). The suggested values of item-to-total correlation
is 0.50 (50%) and above, and for inter-item correlation is 0.30 (30%) and above (Robinson
et al., 1991; Hair et al., 2006).
Results in the table A-6 appendix-A, display that items in all the constructs were highly
correlated to each other. Also, Cronbach’s α was higher than the recommended value 0.6
(Cronbach’s, 1951) except construct SE (i.e. 0.49). One suggested method to increase the
α-value is by deleting the items having lower squared-multiple-correlations (SMC) or by
deleting the item having lower corrected-item-total correlation (Pallant, 2007). Following
the suggestions, items SE3 (corrected item-total correlation = 0.06) within SE construct
was required to delete for increasing the α-value, however, it was retained to further
examination using exploratory factor analysis method of convergent validity.
The validity of the measurement scale ensures that findings revealed through instrument
were real representation of the concept of the interest (Hair et al., 2006; Collis & Hussey,
2003; Bryman & Bell, 2007). A test of validity should be capable of confirming the
concepts already known (Bannister and Mair, 1968). Usually, within business and social
science research two common methods of validity test are applied to measure the goodness
of instrument: content validity and construct validity. Whereas, the content validity also
known as face validity is qualitative assessment of relationship between items and the
corresponding construct through rating by experts, judges, and pre-tests with multiple sub-
population (Hair et al., 2006, p. 136). Content validity should be the first step during
establishing the relationship between construct and its measuring items. According to the
Graver & Mentzer (1999, p.35) if measurement scale does not possess content validity, it
cannot possess construct validity no matter what the statistical analysis indicates.
In the current study for establishing the content validity, researcher extracted items from
information system literature through rigorous analysis process (see literature review in
chapter 2, and instrument development in chapter 4 section 4.6). Afterwards, researcher
asked faculty members in department of information systems and computing (DISC) at
Brunel university who were already familiar with the topic to evaluate the measurement
items and point out whether the items appeared to be logical valid or not. As the items
corresponding to the constructs were widely accepted in literature, therefore minor
210
typographical suggestions were recommended by the experts and were incorporated in
final questionnaire.
The second type of validity ‘construct validity’ is defined as degree to which a set of items
measures what they intends to measure (Garver & Mentzer, 1999, p.34). It is also known
as an external validity of instrument which is quantitatively calculated by observing the
correlation between theoretically underpinned set of measurement items (Hair et al., 2006;
Pallant, 2007). In generalisation, construct validity is the extent to which the set of
measurement items are free from any systematic or non-random error. Krathwohl (1997,
p.446) pointed out that construct validity provides evidence which forms the basis for
intended score interpretation. Construct validity can be examined through convergent
validity, discriminant validity and nomological validity (Campbell et al., 1959; Peter,
1981). At this stage, researcher was intended to examine the overall validity of survey
instrument; therefore, only convergent validity was computed to assess the extent through
which measuring items of same concept were correlated. The discriminant and
nomological validities were computed and explained and in section 5.6.3.
The convergent validity, also known as criterion validity (Zikumnd, 2003), indicates that
measuring items of specific construct should converge or share high proportion of variance
in common (Hair et al., 2006, p.137). In other words, it is an assessment of higher
correlation between items of same construct (Krathwohl, 1997). For higher convergent
validity, it is suggested that item-to-total-correlation should be higher than 0.50 (50%) and
the inter-item-correlation should be higher than 0.30 (Robinson et al., 1991). Besides,
Cohen (1988, p.79-81) suggest that correlation (r) =0.10 to 0.29 is small, r = 0.30 to 0.49 is
medium, and r = 0.50 to 1.00 is high correlation. In the current study, correlation was
computed using SPSS reliability test. Table A-6 in appendix-A, display that except little
exceptions, all the items were correlated medium to high with their relevant construct. The
highest item-to-total correlation (i.e. 0.7 and beyond) was observed into the items of
constructs PU and MF, while the lowest (i.e. 0.5 and below) was observed into items of
construct SE. The inter-item-correlation for all the constructs was between medium to high
level except SE. Until this stage of the study, items lower than the required correlations
were still retained for the further exploration through the exploratory factor analysis (i.e.,
an additional method of convergent validity).

211
5.5. Factor Analysis
Factor analysis (FA) was undertaken in order to further examine the measurement items
used in the present study. According to the Tabachnick and Fidell (2007, p.26) factor
analysis is best way to understand the underlying structure about particular theory and its
variables in analysis. The general purpose of the factor analysis is to reduce the
information contained in a number of measuring items into a smaller set of new composite
dimensions/factors (Gorsuch 1983; Rummel, 1970). Hair et al., (2006, p.107&111) defined
two issues for which chiefly factor analysis can be used:
1. Helps to specify the unit of analysis: The FA is used to identify the structure of
relationship (i.e. correlation) either between variables or respondents
2. Helps to achieve summarised data and reduced data: In data summarisation, FA is
used to combine the individuals variables grouped together so they represent
collectively the underlying dimensions. Whereas, in data reduction, FA empirically
(by factor scores) represents specific variables from much large number of
variables to be used in multivariate analysis, or creates entirely new set of variables
which is much smaller than the original number, and partially or completely
replaced original number of variable set.
Hence, factor analysis is way to examine the potential underlying dimensions that can be
identified through the characteristics of variables which are grouped together in a
meaningful way. This can be achieved by grouping variables which are highly correlated
with each other (Tabachnick & Fidell, 2007). Usually two techniques of factor analysis are
used to discover the variable of interest from the set of coherent subsets that are relatively
independent from each other: exploratory factor analysis (EFA), and confirmatory factory
analysis (CFA) (Hair et al., 2006; Tabachnick & Fidell, 2007).
The purpose of EFA is to explore the data and provide information to researcher about the
number of possible factors that best represent the data (Hair et al., 2006). Whereas, purpose
of the CFA is to validate/confirm the measurement factors that exists within set of
variables involved in theoretical model (ibid). The CFA is often performed through
structural equation modelling. Up to this stage of the study, objective was to check the
validity of the survey instrument; therefore, EFA was applied to test the measurement
items used in the present study. In next stage, CFA is applied to confirm theory about the
latent variables.

212
5.5.1. Exploratory Factor Analysis (EFA)
In this study, exploratory factor analysis (EFA) was performed to examine the structure of
the measurement items corresponding to the variables presented in conceptual framework.
Among the various methods of extraction such as- principal component analysis (PCA),
principle factors, maximum likelihood factoring, image factoring, alpha factoring and
unweighted and generalised weighted lest squares factoring (Tabachnick & Fidell, 2007, p.
633), PCA was selected to generate the initial solutions for the EFA. The PCA helps to
extract the maximum variance from the data set, in a way that first component extract
highest variance and last component extract least variance (Tabachnick & Fidell, 2007, p.
635). Additionally, PCA helps to identify and reduces the large set of variables into smaller
number of components by transforming interrelated variables into new unrelated linear
composite variables (Hair et al., 2006; Tabachnick & Fidell, 2007).
The orthogonal varimax rotational method for the extraction was selected. The reason
behind selecting orthogonal varimax method was that it is most commonly variance
maximising procedure and has higher generalizabliity and replicability power compared to
the oblique rotational method (Tabachnick & Fidell, 2007; Pallant, 2007). According to the
Rennie (1997) results generated by the orthogonal rotations are best fitted with the past and
future data, while within oblique rotation obtained results are best fitted with the data
collected from the current survey research. In addition, due to uncorrelated factors the
interpretations of the results obtained using orthogonal rotation are much easier compared
to the oblique method (Pallant, 2007; Tabachnick & Fidell, 2007).
Among the several criterions to assess the adequacy of extracted factors, three were
selected in this research, namely- latent root criterion, percentage of variance criterion, and
Scree test criterion. The Eigenvalues greater than one satisfies the latent root criterion and
solution that accounts 60% or above cumulative variance satisfies the criterion of variance
percentage (variability in score) (Hair et al., 2006). The total variance of an original
variable shared with other variables is also known as communality (Hair et al., 2006).
According to the Field (2006, p.630) a variable that has no variance have a communality of
1, and a variable which shares nothing with other variables have communality of 0. The
items that exhibits communality lower than 0.5 (50%) are considered to be weak items
(Hair et al., 2006). In some cases, with respect to the sample size 0.3 cut-off value of
communality is also accepted (Pallant, 2007).
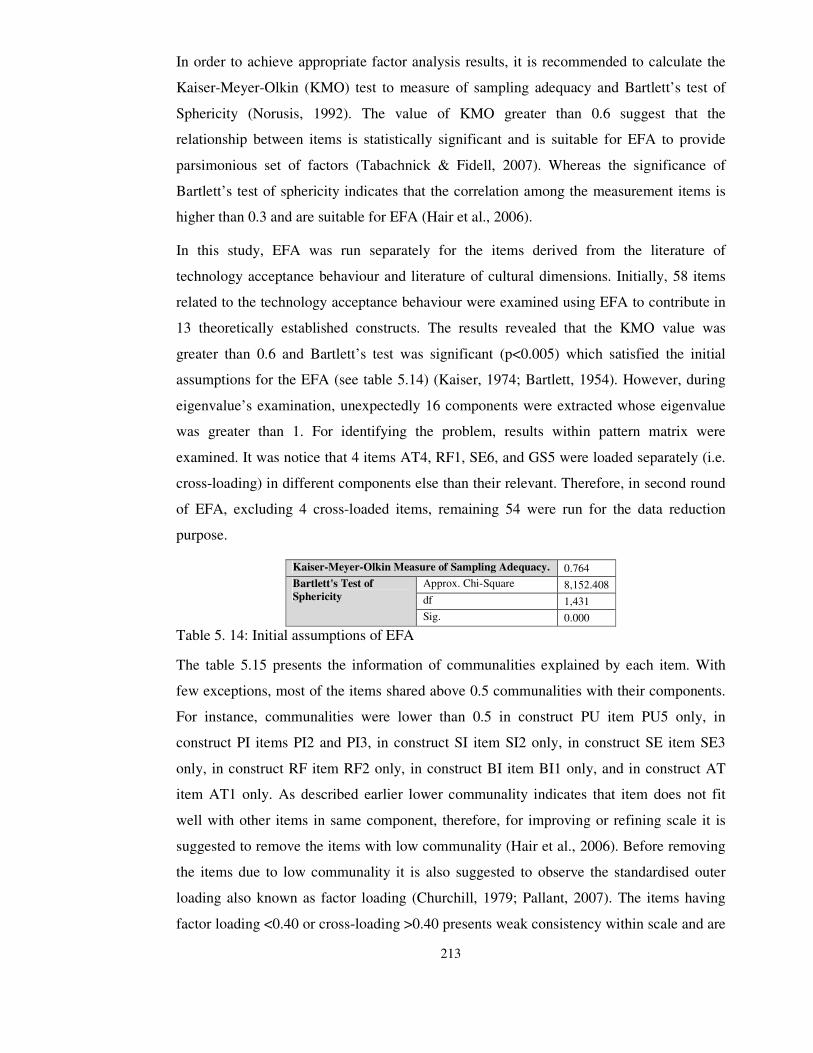
213
In order to achieve appropriate factor analysis results, it is recommended to calculate the
Kaiser-Meyer-Olkin (KMO) test to measure of sampling adequacy and Bartlett’s test of
Sphericity (Norusis, 1992). The value of KMO greater than 0.6 suggest that the
relationship between items is statistically significant and is suitable for EFA to provide
parsimonious set of factors (Tabachnick & Fidell, 2007). Whereas the significance of
Bartlett’s test of sphericity indicates that the correlation among the measurement items is
higher than 0.3 and are suitable for EFA (Hair et al., 2006).
In this study, EFA was run separately for the items derived from the literature of
technology acceptance behaviour and literature of cultural dimensions. Initially, 58 items
related to the technology acceptance behaviour were examined using EFA to contribute in
13 theoretically established constructs. The results revealed that the KMO value was
greater than 0.6 and Bartlett’s test was significant (p<0.005) which satisfied the initial
assumptions for the EFA (see table 5.14) (Kaiser, 1974; Bartlett, 1954). However, during
eigenvalue’s examination, unexpectedly 16 components were extracted whose eigenvalue
was greater than 1. For identifying the problem, results within pattern matrix were
examined. It was notice that 4 items AT4, RF1, SE6, and GS5 were loaded separately (i.e.
cross-loading) in different components else than their relevant. Therefore, in second round
of EFA, excluding 4 cross-loaded items, remaining 54 were run for the data reduction
purpose.
Kaiser-Meyer-Olkin Measure of Sampling Adequacy. 0.764
Bartlett's Test of
Sphericity
Approx. Chi-Square 8,152.408
df 1,431
Sig. 0.000
Table 5. 14: Initial assumptions of EFA
The table 5.15 presents the information of communalities explained by each item. With
few exceptions, most of the items shared above 0.5 communalities with their components.
For instance, communalities were lower than 0.5 in construct PU item PU5 only, in
construct PI items PI2 and PI3, in construct SI item SI2 only, in construct SE item SE3
only, in construct RF item RF2 only, in construct BI item BI1 only, and in construct AT
item AT1 only. As described earlier lower communality indicates that item does not fit
well with other items in same component, therefore, for improving or refining scale it is
suggested to remove the items with low communality (Hair et al., 2006). Before removing
the items due to low communality it is also suggested to observe the standardised outer
loading also known as factor loading (Churchill, 1979; Pallant, 2007). The items having
factor loading <0.40 or cross-loading >0.40 presents weak consistency within scale and are

214
recommended to be removed (Hair et al., 2006). By observing the pattern matrix table 5.18
it was noticed that all the items having lower communality (PU5, PI2, PI3, SI2, SE3, RF2,
BI1, and AT1) were highly loaded into their relevant component (i.e. factor loading >0.4
and no cross loading >0.4), therefore, items were retained for the next stage.
Items Initial Extraction Items Initial Extraction
PU1 1.000 0.601 AT1 1.000 0.435
PU2 1.000 0.546 AT2 1.000 0.710
PU3 1.000 0.669 AT3 1.000 0.519
PU4 1.000 0.518 AT5 1.000 0.681
PU5 1.000 0.407 AT6 1.000 0.782
PEOU1 1.000 0.757 NAT1 1.000 0.676
PEOU2 1.000 0.821 NTA2 1.000 0.719
PEOU3 1.000 0.591 NTA3 1.000 0.708
PEOU4 1.000 0.600 NTA4 1.000 0.683
PI1 1.000 0.524 BI1 1.000 0.455
PI2 1.000 0.496 BI2 1.000 0.649
PI3 1.000 0.445 BI3 1.000 0.684
PI4 1.000 0.592 BI4 1.000 0.541
SI1 1.000 0.579 BU1 1.000 0.559
SI2 1.000 0.436 BU2 1.000 0.626
SE1 1.000 0.827 BU3 1.000 0.759
SE2 1.000 0.839 BU4 1.000 0.702
SE3 1.000 0.365 GS1 1.000 0.651
SE4 1.000 0.768 GS2 1.000 0.637
SE5 1.000 0.777 GS3 1.000 0.589
TF1 1.000 0.663 GS4 1.000 0.634
TF2 1.000 0.658 IS1 1.000 0.597
TF3 1.000 0.678 IS2 1.000 0.539
TF4 1.000 0.572 IS3 1.000 0.574
RF2 1.000 0.443 IS4 1.000 0.549
RF3 1.000 0.636 IS5 1.000 0.576
RF4 1.000 0.640
RF5 1.000 0.650
Extraction Method: Principal Component Analysis.
Table 5. 15: Communalities shared by individual items
Table 5.16 presents the total variance explained by each component. The number of factors
that contributed eigenvalue>1 were only significant and remaining were disregarded (cf.
Hair et al., 2006; Tabachnick & Fidell, 2007). Table 5.16 display first 15 components
results where 13 components were having eigenvalue>1. These 13 components explained
total variance of 61.7% (see column cumulative %) which is higher than the
recommendations. Literature evidences that factors extracted using Kaiser’s criterion only
(i.e. eigenvalue>1) tends to overestimate number of components extracted (Hubbard &
Allen, 1987). Therefore, an additional statistical technique ‘Horn’s parallel analysis’
(Horn, 1965) were applied to confirm the factors extracted using Kaiser’s criterion. Using
Monte Carlo PCA program, predicted 54 variables with 380 sample sizes were run to
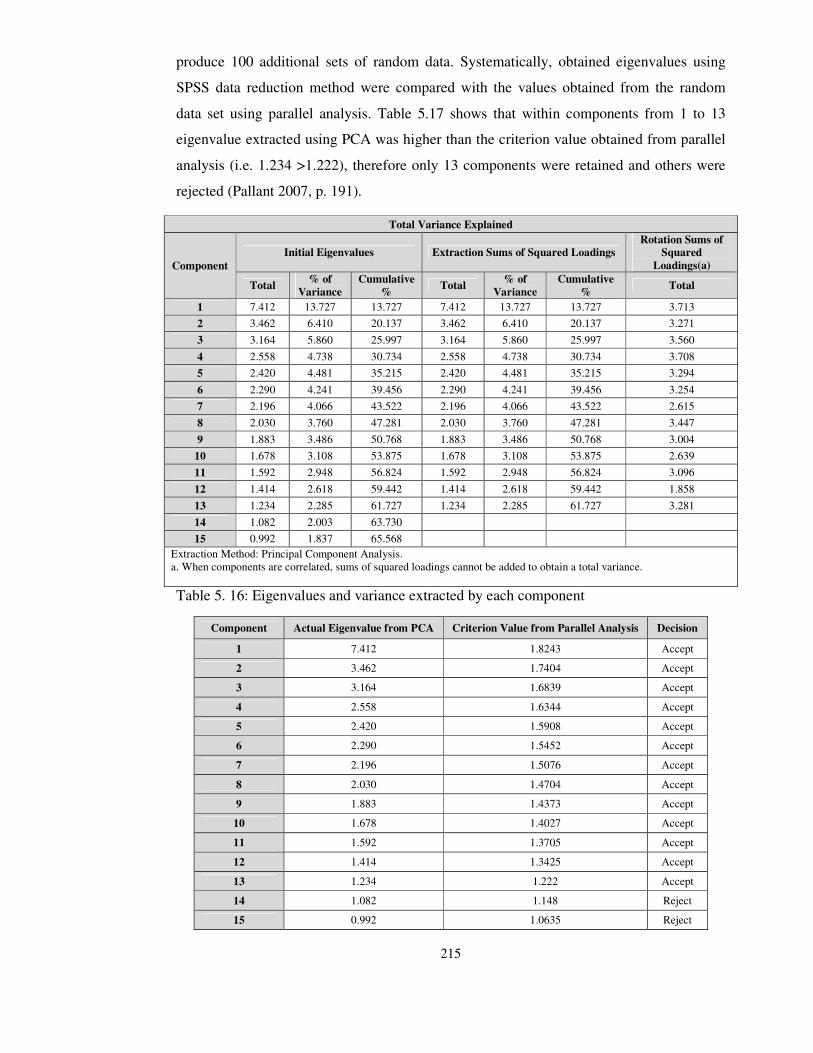
215
produce 100 additional sets of random data. Systematically, obtained eigenvalues using
SPSS data reduction method were compared with the values obtained from the random
data set using parallel analysis. Table 5.17 shows that within components from 1 to 13
eigenvalue extracted using PCA was higher than the criterion value obtained from parallel
analysis (i.e. 1.234 >1.222), therefore only 13 components were retained and others were
rejected (Pallant 2007, p. 191).
Total Variance Explained
Component
Initial Eigenvalues Extraction Sums of Squared Loadings
Rotation Sums of
Squared
Loadings(a)
Total % of
Variance
Cumulative
% Total
% of
Variance
Cumulative
% Total
1 7.412 13.727 13.727 7.412 13.727 13.727 3.713
2 3.462 6.410 20.137 3.462 6.410 20.137 3.271
3 3.164 5.860 25.997 3.164 5.860 25.997 3.560
4 2.558 4.738 30.734 2.558 4.738 30.734 3.708
5 2.420 4.481 35.215 2.420 4.481 35.215 3.294
6 2.290 4.241 39.456 2.290 4.241 39.456 3.254
7 2.196 4.066 43.522 2.196 4.066 43.522 2.615
8 2.030 3.760 47.281 2.030 3.760 47.281 3.447
9 1.883 3.486 50.768 1.883 3.486 50.768 3.004
10 1.678 3.108 53.875 1.678 3.108 53.875 2.639
11 1.592 2.948 56.824 1.592 2.948 56.824 3.096
12 1.414 2.618 59.442 1.414 2.618 59.442 1.858
13 1.234 2.285 61.727 1.234 2.285 61.727 3.281
14 1.082 2.003 63.730
15 0.992 1.837 65.568
Extraction Method: Principal Component Analysis. a. When components are correlated, sums of squared loadings cannot be added to obtain a total variance.
Table 5. 16: Eigenvalues and variance extracted by each component
Component Actual Eigenvalue from PCA Criterion Value from Parallel Analysis Decision
1 7.412 1.8243 Accept
2 3.462 1.7404 Accept
3 3.164 1.6839 Accept
4 2.558 1.6344 Accept
5 2.420 1.5908 Accept
6 2.290 1.5452 Accept
7 2.196 1.5076 Accept
8 2.030 1.4704 Accept
9 1.883 1.4373 Accept
10 1.678 1.4027 Accept
11 1.592 1.3705 Accept
12 1.414 1.3425 Accept
13 1.234 1.222 Accept
14 1.082 1.148 Reject
15 0.992 1.0635 Reject
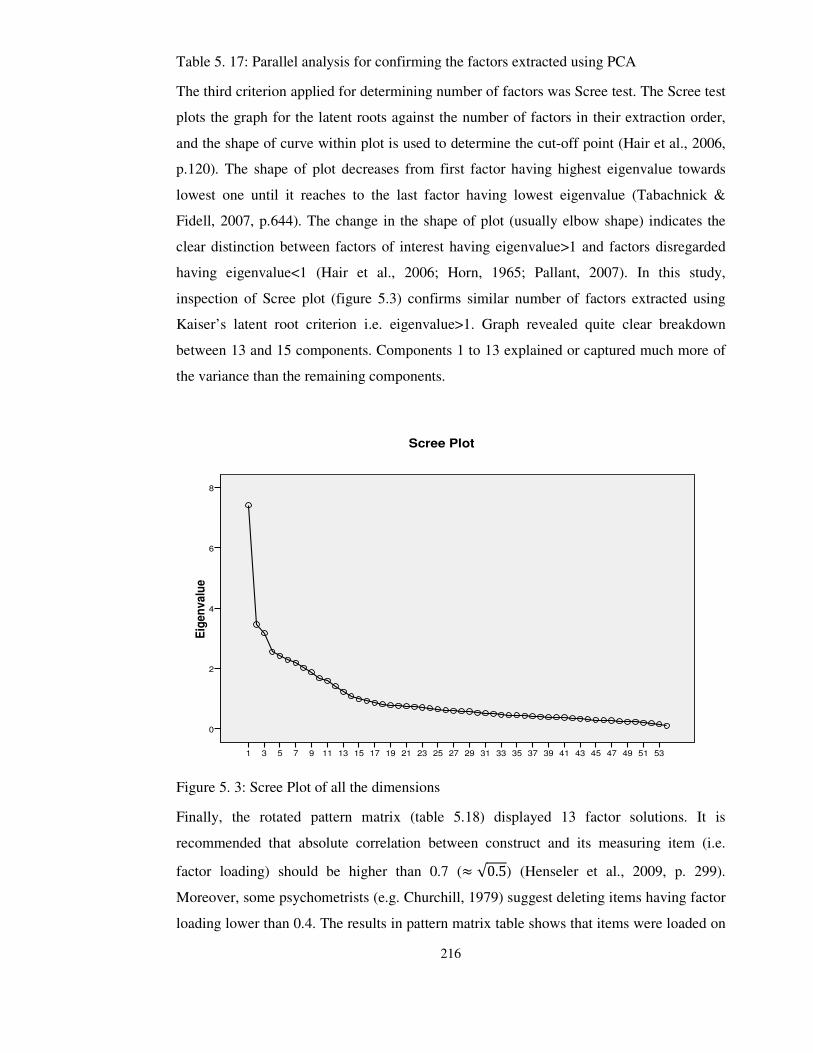
216
Table 5. 17: Parallel analysis for confirming the factors extracted using PCA
The third criterion applied for determining number of factors was Scree test. The Scree test
plots the graph for the latent roots against the number of factors in their extraction order,
and the shape of curve within plot is used to determine the cut-off point (Hair et al., 2006,
p.120). The shape of plot decreases from first factor having highest eigenvalue towards
lowest one until it reaches to the last factor having lowest eigenvalue (Tabachnick &
Fidell, 2007, p.644). The change in the shape of plot (usually elbow shape) indicates the
clear distinction between factors of interest having eigenvalue>1 and factors disregarded
having eigenvalue<1 (Hair et al., 2006; Horn, 1965; Pallant, 2007). In this study,
inspection of Scree plot (figure 5.3) confirms similar number of factors extracted using
Kaiser’s latent root criterion i.e. eigenvalue>1. Graph revealed quite clear breakdown
between 13 and 15 components. Components 1 to 13 explained or captured much more of
the variance than the remaining components.
Figure 5. 3: Scree Plot of all the dimensions
Finally, the rotated pattern matrix (table 5.18) displayed 13 factor solutions. It is
recommended that absolute correlation between construct and its measuring item (i.e.
factor loading) should be higher than 0.7 (� √0.5) (Henseler et al., 2009, p. 299).
Moreover, some psychometrists (e.g. Churchill, 1979) suggest deleting items having factor
loading lower than 0.4. The results in pattern matrix table shows that items were loaded on
5351494745434139373533312927252321191715131197531
Eig
en
va
lue
8
6
4
2
0
Scree Plot
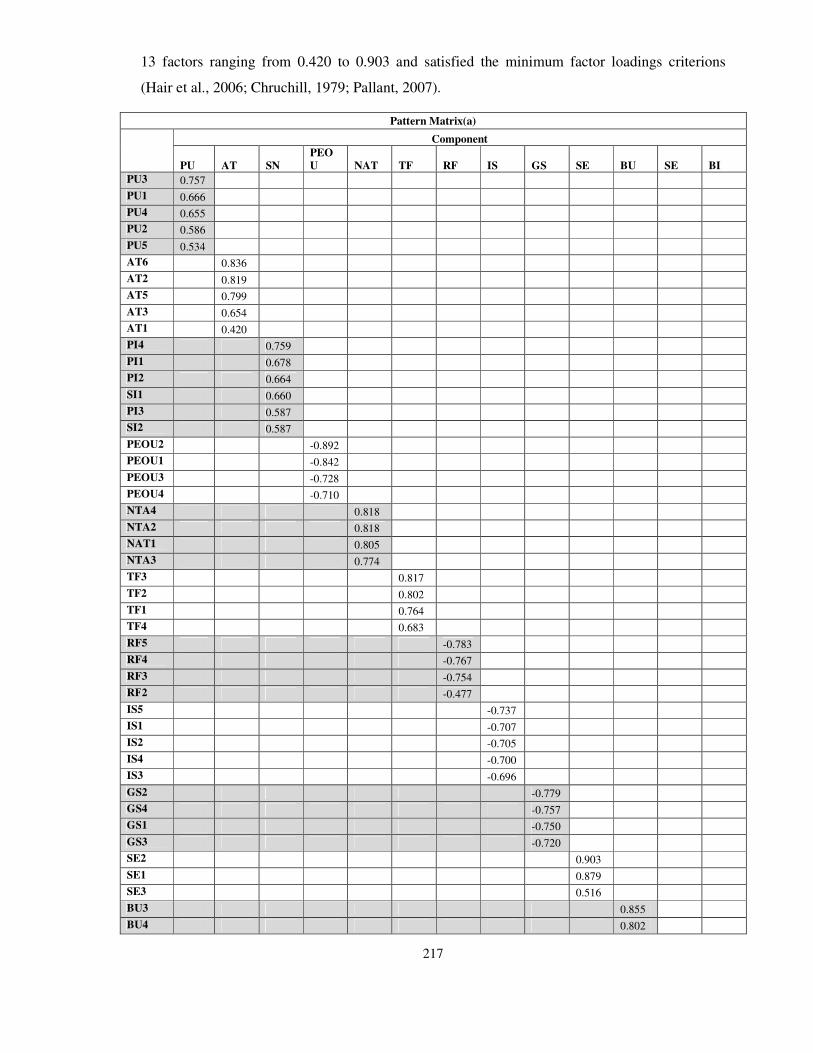
217
13 factors ranging from 0.420 to 0.903 and satisfied the minimum factor loadings criterions
(Hair et al., 2006; Chruchill, 1979; Pallant, 2007).
Pattern Matrix(a)
Component
PU AT SN
PEO
U NAT TF RF IS GS SE BU SE BI
PU3 0.757
PU1 0.666
PU4 0.655
PU2 0.586
PU5 0.534
AT6 0.836
AT2 0.819
AT5 0.799
AT3 0.654
AT1 0.420
PI4 0.759
PI1 0.678
PI2 0.664
SI1 0.660
PI3 0.587
SI2 0.587
PEOU2 -0.892
PEOU1 -0.842
PEOU3 -0.728
PEOU4 -0.710
NTA4 0.818
NTA2 0.818
NAT1 0.805
NTA3 0.774
TF3 0.817
TF2 0.802
TF1 0.764
TF4 0.683
RF5 -0.783
RF4 -0.767
RF3 -0.754
RF2 -0.477
IS5 -0.737
IS1 -0.707
IS2 -0.705
IS4 -0.700
IS3 -0.696
GS2 -0.779
GS4 -0.757
GS1 -0.750
GS3 -0.720
SE2 0.903
SE1 0.879
SE3 0.516
BU3 0.855
BU4 0.802

218
BU1 0.727
BU2 0.714
SE4 0.864
SE5 0.857
BI3 -0.801
BI2 -0.734
BI4 -0.629
BI1 -0.555
Cronba
ch’s α 0.783 0.788 0.774 0.842 0.843 0.79 0.716 0.77 0.776 0.661 0.79 0.751 0.72
Extraction Method: Principal Component Analysis.
a. Rotation converged in 13 iterations.
Table 5. 18: Pattern Matrix (factor loading)
Once factors have been extracted, it is required to know the extant at which items are loaded on
their relevant component. The consistency of each component with their relevant items is
identified using Cronbach’s α measure (Cronbach, 1951; Nunnally, 1978). The details of each
factor extracted are as follows:
Factor 1: Perceived Usefulness (PU): This factor extracted the information about the
respondent’s beliefs related to the usage of the Internet technology which resulted in
improvement, performance and productivity at workplace. Five items adopted from Venkatesh et
al., (2000) study were applied for the factor analysis and all were loaded above than the required
value 0.5 (Field, 2006). The Cronbach’s α for the items loaded in factor was 0.783. The highest
loaded item was PU3 which revealed that individual’s accepted Internet because it makes their
task easier to complete.
Factor 2: Usage intention in Academic Tasks (AT): This factor extracted the information about
the respondent’s beliefs related to the acceptance of Internet which facilitate them to prepare
teaching tasks, enhanced their teaching skills and knowledge, and to remain in contact with peer-
fellows and students. Six items were developed by researcher based on Rosenfeld et al. (1992)
tasks categorisation. One item AT4 was dropped due to lower loading 0.4 and remaining five
were loaded in single component with α 0.788. The highest item loaded was AT6 which suggest
that respondents accepted Internet in their tasks because of higher perception of relevance.
Factor 3: Subjective Norms (SN): This factor extracted the information about the respondent’s
perceptions related to the Internet technology which was influenced by the judgement of others
(i.e. peer and superior). Four items of peer-influence and two items of superior-influence were
adopted from Lewis et al., (2003). Unpredictably, all the items were loaded into single
component, which was consistent with the previous study of
219
Thompson et al. (1991) with construct social factor. Cronbach’s α for the items loaded into
factor was 0.774. The highest item loaded was PI4 which revealed that respondents were
more influenced by the opinion of non-academic group members (e.g. friends and family)
compared to the academic colleagues and superiors.
Factor 4: Perceived Ease of Use (PEOU): This factor extracted items which provide
information about the beliefs that the Internet is perceived to be easier and require fewer
efforts to use and understand. Four-items were adopted from the study of Venkatesh et al.,
(2000) for the factor analysis. All the items were loaded into single factor and contributed
0.84 Cronbach’s α value. The highest item loaded was PEOU2 which suggest that
respondents were willing to accept the Internet if they found it easier to get material for
their teaching purpose.
Factor 5: Usage intention in Non-Academic Tasks (NAT): This factor extracted the
information about the respondent’s beliefs about Internet acceptance which facilitate them
to perform non-teaching task i.e. socialisation and administrative tasks. Similar to the AT,
four items were developed by researcher based on Rosenfeld et al. (1992) tasks
categorisation. All the items were loaded in single factor with α 0.84. The highest item
loaded was NAT4 which suggest that respondents accepted the Internet because of its
relevance in administrative tasks rather than the socialisation purposes.
Factor 6: Technology Facilitation (TF): This factor extracted the items which provide
information related to the external beliefs, specifically about the technology availability
and control over it. Originally four items were adopted from the study of Taylor & Todd
(1995a), and all were loaded into single factor. The Cronbach’s α for the factor was 0.79.
TF3 was the highest item loaded in factor 6, which suggest that respondents accepted the
Internet because of good and quick access to use at their workplace.
Factor 7: Resource Facilitation (RF): Similar to the TF this factor extracted the items
which provided information related to the external beliefs in terms of resources like-
money, time, instructions, personal support. Five items from the study of Taylor & Todd
(1995a) were adopted for the factor analysis. In initial round of factor analysis RF1 was
removed due to cross loading above than 0.4 with items of TF factor. In second round of
factor loading remaining four items were loaded into single factor with α-value 0.716. The
highest item loaded was RF5 which suggest that respondents were motivated to accept the
Internet if resources, opportunities and knowledge about the Internet usage was available.

220
Factor 8: Institute Support (IS): This factor extracted the items which observed the
respondents perceptions regarding to the policies, encouragement and importance
suggested by the local institute or local level management towards the Internet usage and
acceptance. Five items from the study of Lewis et al., (2003) were applied for the factor
analysis. All items were loaded into single factor by contributing 0.77 Cronbach’s α value.
The highest item loaded was IS5 which suggest that respondents were well aware about
their Internet usage and its relevancy for native department and institute.
Factor 9: Government Support (GS): Similar to the IS this factor observed the respondents
perceptions regarding the policies, encouragement and importance suggested by the
government or top level management. Initially five items were taken from the study of
Lewis et al., (2003) for factor analysis, and item GS5 was dropped due to cross loading
with the items of IS factor. The remaining four items contributed 0.776 Cronbach’s α
value. The highest item loaded was GS2 which revealed that respondents were well aware
about government commitment policies and support efforts for the Internet usage in
teaching tasks.
Factor 10 and 12: Self- Efficacy (SE): This factor extracted the items related to the
individual’s self-evaluation behaviour which is established by the experience of persistent
supporting and non-supporting efforts during Internet usage. Six items adopted from the
study of Taylor & Todd (1995a) were applied for the factor analysis. Notwithstanding to
the literature (e.g. Taylor & Todd, 1995a) the factor analysis shown that items SE1, SE2,
and SE3 were loaded separately in factor 10, and remaining items SE4 and SE5 were
loaded in factor 12. The item SE6 was excluded in first run of factor analysis due to lower
factor loading (<0.3) (Hair et al., 2006). The Cronbach’s α for the factor 10 was 0.661 and
for the factor 12 was .751. The first group of items in factor 10 revealed that individuals
were more comfortable of using the Internet by their own, while the other group of items
revealed the importance of help facility for the Internet usage. Due to requirement of items
per factor (Hair et al., 2006) only factor 10 was retained for the further analysis.
Factor 11: Behavioural Usage (BU): This factor extracted the items related to the
frequency of future Internet usage within academic and non-academic task. Four items
were adopted from the study of Venkatesh and Bala (2008) to apply for factor analysis. All
the items were loaded in single factor and contributed 0.79 Cronbach’s α value. The
highest item loaded was BU3 which suggest that if individuals had access to the Internet
they were willing to use it fewer times in a week.
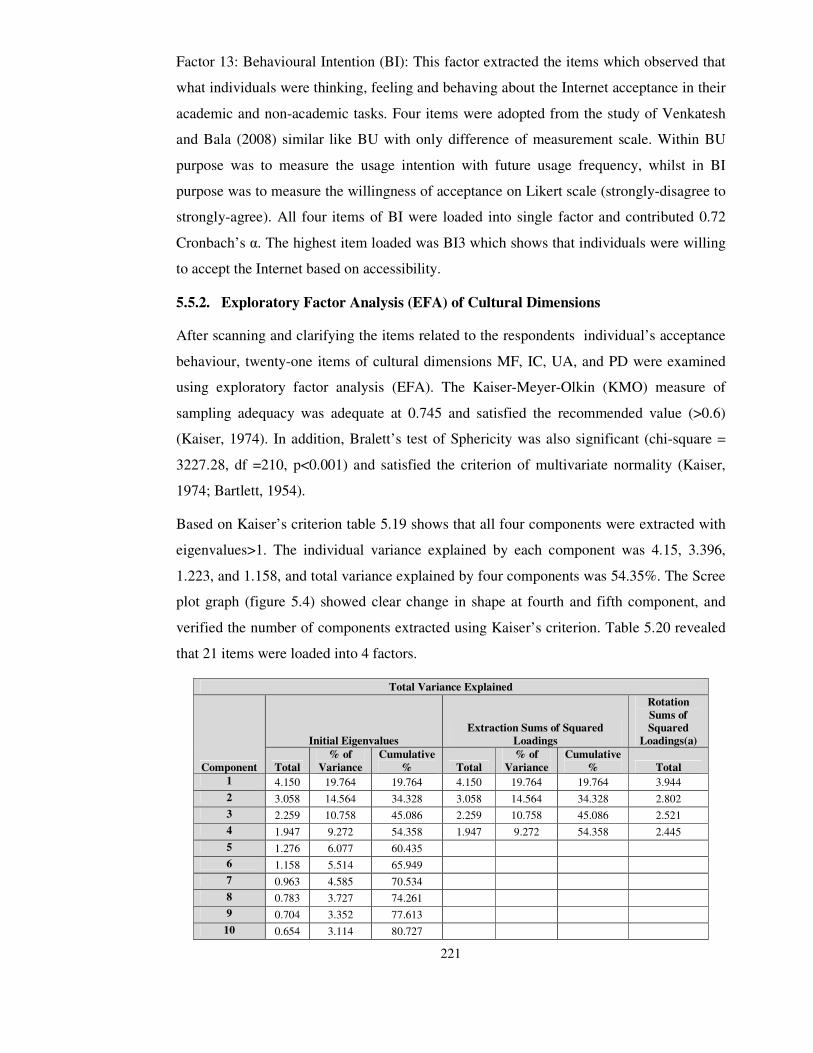
221
Factor 13: Behavioural Intention (BI): This factor extracted the items which observed that
what individuals were thinking, feeling and behaving about the Internet acceptance in their
academic and non-academic tasks. Four items were adopted from the study of Venkatesh
and Bala (2008) similar like BU with only difference of measurement scale. Within BU
purpose was to measure the usage intention with future usage frequency, whilst in BI
purpose was to measure the willingness of acceptance on Likert scale (strongly-disagree to
strongly-agree). All four items of BI were loaded into single factor and contributed 0.72
Cronbach’s α. The highest item loaded was BI3 which shows that individuals were willing
to accept the Internet based on accessibility.
5.5.2. Exploratory Factor Analysis (EFA) of Cultural Dimensions
After scanning and clarifying the items related to the respondents individual’s acceptance
behaviour, twenty-one items of cultural dimensions MF, IC, UA, and PD were examined
using exploratory factor analysis (EFA). The Kaiser-Meyer-Olkin (KMO) measure of
sampling adequacy was adequate at 0.745 and satisfied the recommended value (>0.6)
(Kaiser, 1974). In addition, Bralett’s test of Sphericity was also significant (chi-square =
3227.28, df =210, p<0.001) and satisfied the criterion of multivariate normality (Kaiser,
1974; Bartlett, 1954).
Based on Kaiser’s criterion table 5.19 shows that all four components were extracted with
eigenvalues>1. The individual variance explained by each component was 4.15, 3.396,
1.223, and 1.158, and total variance explained by four components was 54.35%. The Scree
plot graph (figure 5.4) showed clear change in shape at fourth and fifth component, and
verified the number of components extracted using Kaiser’s criterion. Table 5.20 revealed
that 21 items were loaded into 4 factors.
Total Variance Explained
Component
Initial Eigenvalues
Extraction Sums of Squared
Loadings
Rotation
Sums of
Squared
Loadings(a)
Total
% of
Variance
Cumulative
% Total
% of
Variance
Cumulative
% Total
1 4.150 19.764 19.764 4.150 19.764 19.764 3.944
2 3.058 14.564 34.328 3.058 14.564 34.328 2.802
3 2.259 10.758 45.086 2.259 10.758 45.086 2.521
4 1.947 9.272 54.358 1.947 9.272 54.358 2.445
5 1.276 6.077 60.435
6 1.158 5.514 65.949
7 0.963 4.585 70.534
8 0.783 3.727 74.261
9 0.704 3.352 77.613
10 0.654 3.114 80.727
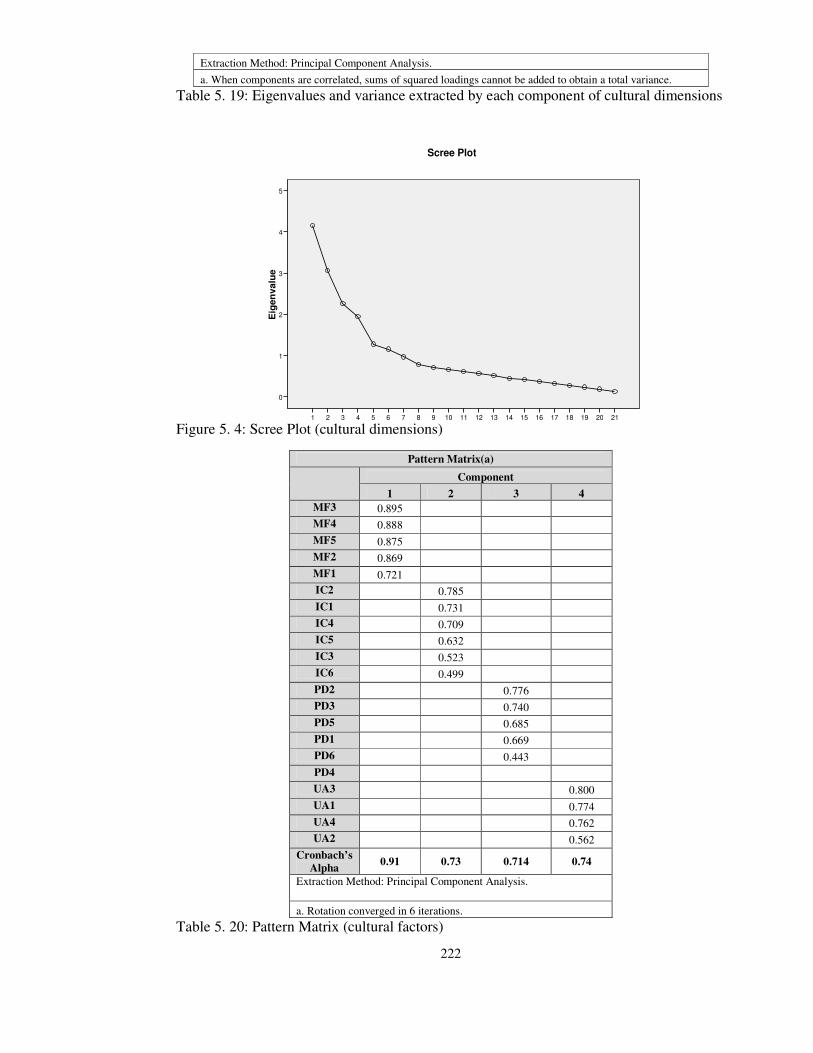
222
Extraction Method: Principal Component Analysis.
a. When components are correlated, sums of squared loadings cannot be added to obtain a total variance.
Table 5. 19: Eigenvalues and variance extracted by each component of cultural dimensions
Figure 5. 4: Scree Plot (cultural dimensions)
Pattern Matrix(a)
Component
1 2 3 4
MF3 0.895
MF4 0.888
MF5 0.875
MF2 0.869
MF1 0.721
IC2
0.785
IC1
0.731
IC4
0.709
IC5
0.632
IC3
0.523
IC6
0.499
PD2
0.776
PD3
0.740
PD5
0.685
PD1
0.669
PD6
0.443
PD4
UA3
0.800
UA1
0.774
UA4
0.762
UA2
0.562
Cronbach’s
Alpha 0.91 0.73 0.714 0.74
Extraction Method: Principal Component Analysis.
a. Rotation converged in 6 iterations.
Table 5. 20: Pattern Matrix (cultural factors)
212019181716151413121110987654321
Eig
en
valu
e
5
4
3
2
1
0
Scree Plot
223
Even though, it was not objective of the study to measure the constructs of cultural
dimensions as direct determinants of the Internet acceptance behaviour, but still for the
reliability of measurement items with their relevant constructs it was required to assess the
factor analysis. For measuring the culture, all the items were adopted from the study of
Dorfman and Howell (1988) with little moderation of context. The description of each
factor with respect to reliability measure Cronbach’s α value is given below:
Factor 1: Masculinity and Femininity (MF): This factor extracted the items which observed
the masculine nature at work, which were based on working goals, earnings, and
promotions at workplaces. Five items were applied for the factor analysis and all were
loaded into single factor with 0.91 Cronbach’s α value. The highest item loaded was MF3
which suggest that within masculine culture men usually solve problems with logical
analysis, whilst women solve problems with intuition.
Factor 2: Individualism and Collectivism (IC): This factor extracted the information which
was related to the individuals’ perception about himself/herself and the group of people
one is member. Items of this construct observed the extent at which respondents prioritised
self-interest over the concerns of group. Six items applied for the factor analysis were
loaded into single factor with 0.73 Cronbach’s α value. The highest item loaded was IC2
which suggest that within collectivist society success of group was more important than
then individual’s success.
Factor 3: Power Distance (PD): This factor extracted items which were related to measure
the subordinate’s perception about the power between him and his superior. Out of six
items applied for the factor analysis five were above the 0.4 recommended values (Hair et
al., 2006). Item PD4 was removed due to lower factor loading. The Cronbach’s α value for
five items was 0.714. The highest item loaded was PD2 which suggest that in high PD
culture respondents favoured to use authority and power when dealing with their
subordinates.
Factor 4: Uncertainty Avoidance (UA): This factor extracted items which measured the
extent to which employees were uncertain about unclear procedures, strategies and rules.
Four items applied for the factor analysis were loaded into single factor and contributed
0.74 Cronbach’s α value. The highest item loaded was UA3 which suggest that for
respondent’s rules and regulations were important because they informed them what the
organisation is expecting from them.

224
5.6. Structural Evaluation of the Model
5.6.1. Basic concepts of Structural Equation Modelling (SEM)
5.6.1.1. Introduction
Structural equation modelling (SEM) refers to the collection of statistical techniques which
facilitates to bring the data and underlying theory together (Tabachnik and Fidell, 2006).
SEM is also known as causal modelling, causal analysis, simultaneous equation modelling,
analysis of covariance structure, path analysis, or confirmatory factor analysis (Tabachnick
& Fidell, 2007, p. 676). The analysing techniques of SEM such as covariance-based
modelling (i.e. LISREL, AMOS) and variance-based or component-based modelling (i.e.
Partial Least Squares (PLS)) are referred as second generation data analysing techniques
(Bagozzi and Fornell, 1982). Contrary to the first generation statistical tools such as
regression (e.g. linear regression, factor analysis, PCA, ANOVA, and MANOVA) which
can analyse only one layer of relationship between independent and dependent variable at
time, SEM enables researcher to model multiple layer relationship among the multiple
independent and dependent variables simultaneously (Chin, 1998; Gerbing & Anderson,
1988; Gefen et al., 2000, Hair et al., 2006). Additionally, SEM supersedes first generation
statistical tools by facilitating researcher to model complex relationships, deal with
multicollinearity, perform confirmatory factor analysis, incorporate both unobserved (i.e.
latent) and observed variables, and finally to estimate explicit measurement error variance
(unreliability and random errors) to avoid the bias (Rigdon et al., 1998; Hair et al., 2006;
Barbara, 2001). Because of these outstanding features, SEM tools are increasingly being
used in behavioural research for the modelling complex relationships and multivariate
datasets which requires researcher to gather multiple measures for the proposed constructs
(Hair et al., 2006). According to the Gefen et al., (2000, p. 6) SEM is increasingly been
considered in well known information systems Journals (e.g. MIS Quarterly, Information
& Management and Information System Research) to validate the measurement items and
testing casual relationship between constructs.
5.6.1.2. Types of models in SEM
SEM contains two interrelated models explicitly defined by the researcher, namely,
measurement model and structural model (Gefen et al., 2000). Whereas measurement
model also known as confirmatory factor analysis (CFA) defines the constructs (latent
variables) that the model uses, and allocates observed variables to each, while structural
model also known as regression or path analysis defines the hypothetical relationship
225
among the latent variables (Hair et al., 2006; Gefen et al., 2000). It is important to clarify
that latent variable is representation of the theoretical construct which cannot be observed
directly and can have exogenous form (i.e. independent variable) or endogenous form (i.e.
dependent variable) in model (Hair et al., 2006).
5.6.1.3. Practical consideration for SEM
Before adopting the SEM tools for the analysis it is important to consider some practical
issues described as follows:
Sample Size: SEM is based on covariances which alike the correlations are less stable
when estimations are made from the small samples (Tabachnick & Fidell, 2007).
Therefore, sample size is a very important issue in the applications of SEM which
determines that weather the sample collected is sufficient to assess the model with the
given number of the parameters to be estimated (Baumgartner & Homburg, 1996).
Although, SEM requires large sample size based on the number of measurement items in
model, model misspecification, model complexity, and estimation procedure (Hair et al.,
2006; Tabachnick & Fidell, 2007), however, there is no correct or absolute sample size
limit established in literature. According to Hair et al., (2006, p. 742) model having five or
fewer constructs with more than three items each and communality higher than 0.6 can
well be estimated with small sample size (100-150). Furthermore, model with modest
communality (0.45-0.55) needs sample more than 200, and finally for complex model
having constructs more than six and having low communality (<0.45) requires samples
above 500 (ibid).
Multivariate Normality: Most of the techniques used in the SEM require data closer to
the assumptions of multivariate normality (Tabachnick & Fidell, 2007). The violation of
the assumption of normality might produce potential distortion within results and leads
bias outcome (Hair et al., 2006). Within SEM, assumption of multivariate normality is
based on Maridia’s coefficient (Mardia’s, 1970), which requires to be tenable as p<0.005
(Arbuckle, 2006)
One-step or two-step approach: Usually in SEM domain, two-step approach is preferred
over one-step approach (Hair et al., 2006, p. 848). Within two-step approach initially
measurement model is assessed by observing unidimensionality, reliability, validity
(convergent and discriminant) of the model. In second step, structural model is evaluated
by verifying the causal relationships based on path significance between theoretically
proposed latent constructs (Anderson & Gerbing, 1988; Garver & Mentzer, 1999). On
226
other side, the one-step approach estimates both measurement model and structural model
simultaneously (Hair et al., 2006). The one-step approach is recommended over two-steps
when model is derived from strong theoretical justifications and measurement items are
well established in prior research (Hair et al., 2006; Fornel & Yi, 1992), however, it is
given less consideration due to difficulty in achieving good model fitting (Hulland et al.,
1996). Therefore, this study adopted two-step approach which is also recommended by the
majority of the researchers in SEM (Chin et al., 1998; Anderson & Gerbing, 1988).
5.6.2. Rational for selecting SEM with PLS approach compared to CBSEM
approach
Prior to the evaluation of the conceptual model it is important to highlight the significance
and rationales for adopting component-based or variance-based SEM technique PLS to
analyse the data. For this purpose, it is needed to compare and contrast between two broad
families of SEM analysis techniques i.e. covariance-based SEM (CBSEM) e.g. AMOS,
LISREL, EQS, and variance-based or component-based SEM e.g. PLS, PLS Graph. The
purpose of differentiating between two techniques is not to favour one technique over
other, but it only intends to reveal their relevance within present study.
Some researchers postulated that both these techniques are complimentary to each other
(e.g. Chin, 1998; Thompson et al., 1995). Chiefly, these two set of techniques differs
based on estimation method. For instance, out of many (e.g. ULS, GLS, WLS, ML)
CBSEM applies most commonly maximum likelihood (ML) estimation method to compare
the observed and estimated covariance matrix (Hair et al., 2006). The primary objective of
CBSEM is to present that measurement items extracted from the theory being examined
and are supported by the data (Bollen, 1989; Joreskog and Sorbom, 2001). In other words,
model examined using CBSEM produces an estimated covariance matrix which is within
sampling variation of the observed matrix, additionally fits the data well and are generally
accepted as fit-model (Hair et al., 2006). The data sample within CBSEM requires to be
higher (at least 100 or 150) and assumed to be multivariate normal to achieve the
goodness-of-fit indices, such as chi-square, CFI, REMSE, and GFA (Bollen, 1989; Hair et
al., 2006; Tabachnick and Fidell, 2007). One of the disadvantages of CBSEM compared to
component-based SEM techniques is that model does not always converges and produce
un-interpretable outcome, consequently model requires to be modified or the theory needs
to be reassessed(Chin, 1998; Henseler et al., 2009).
227
In contrast, component-based techniques, such as PLS applies ordinary least squares (OLS)
as estimation method to explain the total variance (Gefen et al., 2000). Specifically, unlike
CBSEM to estimate the variance of all the observed variables at time, PLS applies an
iterative sequence of OLS (i.e. factor analysis combined with path difference) to analyse
one construct at time in such way that it minimise the residual variance of all the dependent
variables in structural model until the difference in the average R2 of the construct becomes
insignificant, consequently it is less susceptible of sample size and multivariate normal
distribution requirement (Thompson et al., 1995; Chin, 1998; Gefen et al., 2000).
In the present study, rationales for adopting component-based SEM specifically PLS are
twofold: first, it is widely accepted and used in recent diversified literature e.g. strategic
management (e.g. Hulland, 1999), MIS (e.g.Dibbern et al., 2004), e-business (e.g. Pavlou
and Chai, 2002) and so on (see review of Henseler et al., 2009). Second purpose of
adopting PLS is based on the relevance of the present study. For instance, during screening
process of data (section 5.2.3.1) one of the basic requirements for using CBSEM method
i.e. multivariate distribution of data was not tenable (Mardia’s coefficient = 228.527, CR =
39.88). Therefore, examining structural model using CBSEM is insensible due to potential
threat that model might fails to converge as per requirement (Tabachinick and Fidell, 2007;
Hair et al., 2006; Arbuckle, 2006). Another reason for not adopting CBSEM method is the
sample size. Albeit, overall sample calculated for the present study (i.e. 380 workable
sample) is enough to justify the use of CBSEM approach, but still is not enough to
examine the moderation effect using invariance analysis (i.e. at least 100 per group (Hair et
al., 2006)). Hence, applying PLS is best option for the present study, which not only
facilitates to predict the path relations but also helps to build the theories and validate them
with confirmatory factor analysis without prerequisite of sample size and multivariate
distribution of data (Chin, 1998; Chin and Newsted, 1999; Gefen et al., 2000; Henseler et
al., 2009; Tenenhaus et al., 2005). Supporting single approach (i.e. PLS) might be consider
research approach biasness, therefore, this study also re-examines the results obtained
through PLS with CBSEM (i.e. AMOS) which increases the robustness of the model and
represents the possible chances of the errors between results of two approaches.
5.6.3. Basic Model Evaluation
The conceptual model developed in chapter three was evaluated using a two-step approach
(i.e. inner-model or measurement model and outer-model or structural model) on the
hierarchal basis (e.g., Chin, 2002; Henseler et al., 2009; Anderson & Gerbing, 1988). First,

228
the inner-model was assessed through examining psychometric reliability and validity tests
for the measurement items used. The evaluation of inner-model is also referred as
confirmatory factor analysis (CFA), which is practically useful when one dependent
construct becomes independent in subsequent dependence relationship (Tabachnick &
Fidell, 2007). The next step was to assess the outer-model through multiple regression
technique (i.e. hypothetical relationships based over sign, magnitude and significance
level).
5.6.3.1. Step-one: Measurement Model Results
The first part in evaluating model is termed measurement model and employs CFA to
assess the reliability (Cronbach’s α and composite reliability) and validity (convergent and
discriminant) of the model. The measurement or outer-model uses the factor analysis to
assess the extent to which observed variables are loaded on their underlying construct
(Chin, 1998). Even though, the theoretical model presented in chapter 3 was established
from the well mature and acceptable theoretical research streams in information system,
that does not require measurement re-assessment (Hair et al., 2006), still outer model/CFA
is suggested to confirm the underlying relationship of the observed variables with the latent
factors (Barbara, 2001). The criterions for the measurement model fitting are presented in
table 5.21. Based on criterions stepwise analysis is given as follows:
Criterion Description Acceptable fit
Construct reliability Composite reliability
Is measure of internal consistency and is
calculated by formula �� �∑ �� ���� �/�∑ ��� ��� � � ∑Θ�� , Where, �, �, and Θ�� are the factor loadings, factor variance, and error variance respectively (Werts et al., 1974)
Value > 0.6 (Hair et al., 2006; Bagozzi & Yi, 1991)
Construct reliability
Cronbach’s α
Measures the indicators uni-dimensionality (inter-correlation) with their latent construct. It
is calculated by � � ����� � �1 ∑ !"#$"%&!'# (
Where, N is number of indicators, )*� indicates variance of indicator i, and )+� represents the variance of the sum of all the indicators scores (Cronbach, 1951)
Value > 0.6 (Hair et al., 2006), and value > 0.8 or 0.9 is better (Nunnally & Bernsein, 1994)
Indicator reliability
Is absolute standardised outer loading. It indicates the variance explained by the observed variable towards underlying latent construct (Churchill, 1979)
Value > 0.7(, √0.5) is better (Henseler et al., 2009), and value> 0.4 is acceptable (Hulland, 1999; Churchill, 1979)
Convergent validity
Is the degree to whic two measures of the same concepts are correlated. It is demonstrated by the uni-dimensionality using average variance extracted (AVE)= �∑ ��� ��� �/�∑ ��� ��� � � ∑Θ�� , Where, �, �, and Θ�� are the factor loadings, factor
Value > 0.5 (Fornell & Larcker, 1981)

229
variance, and error variance respectively (Fornell & Larcker, 1981)
Discriminant validity Construct-level
Is the degree to which two conceptually similar concepts are distinct (Hair et al., 2006). It ensures that each latent variable shares more variance with its own block of indicators that with another latent variable
√-./>latent variable correlation (Fornell & Larcker, 1981)
Discriminant validity Item-level
Is the degree to which two conceptually similar concepts are distinct from each other (Hair et al., 2006)
Loading of each indicator > cross loadings (Chin, 1998; Gotz et al., 2010), and Cross loading <0.4 (Hair et al., 2006)
Table 5. 21: Criterion of assessment of the measurement model Source: Developed by researcher
Measurement of the reliability (Item-level): In assessment of measurement model, first
criterion was to assess the internal consistency of the measuring observed variables/items
with each other. Specifically, item-reliability indicates that which part of item’s variance
can be explained by the underlying latent variable (Gotz et al., 2010, p.694). A common
postulate is that absolute correlation (i.e. standardised outer loadings) should be more than
half (i.e. 50%) explained by the latent construct (Chin, 1998). However, value above 0.7
i.e. (, √0.5) (Henseler et al., 2009) and value no less than 0.4 (Churchill, 1979) are
recommended. Based on PLS measurement analysis, table 5.22 show that the absolute
correlation between the construct and its measuring manifest items (i.e. factor loading) was
above than the minimum threshold criterion 0.4. The factor loading was ranging from 0.58
to 0.95 and satisfied the requirements of the psychometric reliability test (Henseler et al.,
2009; Churchill, 1979).
Measurement of the reliability (Construct-level): The construct-level reliability ensured
that items assigned to the same constructs revealed higher relationship with each other.
Even though, earlier calculated individual-level item reliability was adequate enough but it
was still recommended to observe the constructs reliability measured jointly by the group
of items within same construct (Bagozzi & Baumgartner, 1994). In this study, construct-
level reliability was examined by using Cronbach’s α and by composite reliability. Where,
Cronbach’s α measured the uni-dimensionality of multi-item scale’s internal constancy
(Cronhach, 1951), and composite reliability (similar to factor reliability) measured that
how well construct were measured by its assigned items (Fornell & Larcker, 1981; Gotz et
el., 2010). Table 5.26 shows that the Cronbach’s α was higher than the required value of
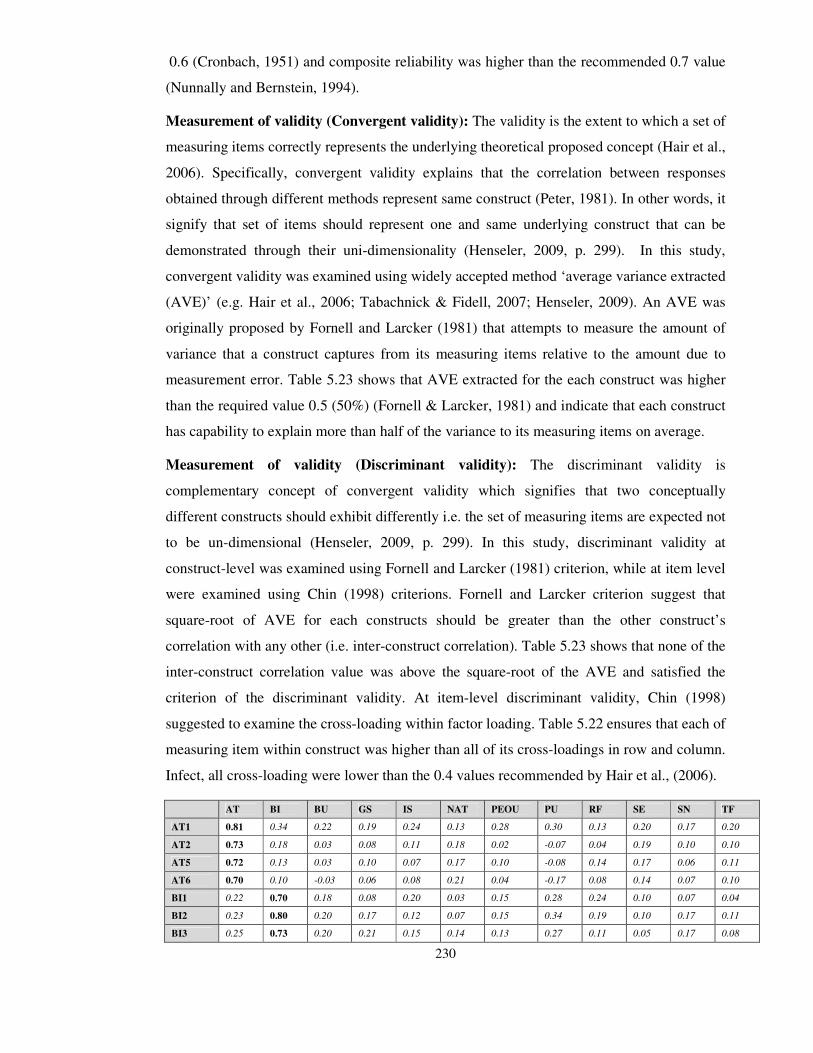
230
0.6 (Cronbach, 1951) and composite reliability was higher than the recommended 0.7 value
(Nunnally and Bernstein, 1994).
Measurement of validity (Convergent validity): The validity is the extent to which a set of
measuring items correctly represents the underlying theoretical proposed concept (Hair et al.,
2006). Specifically, convergent validity explains that the correlation between responses
obtained through different methods represent same construct (Peter, 1981). In other words, it
signify that set of items should represent one and same underlying construct that can be
demonstrated through their uni-dimensionality (Henseler, 2009, p. 299). In this study,
convergent validity was examined using widely accepted method ‘average variance extracted
(AVE)’ (e.g. Hair et al., 2006; Tabachnick & Fidell, 2007; Henseler, 2009). An AVE was
originally proposed by Fornell and Larcker (1981) that attempts to measure the amount of
variance that a construct captures from its measuring items relative to the amount due to
measurement error. Table 5.23 shows that AVE extracted for the each construct was higher
than the required value 0.5 (50%) (Fornell & Larcker, 1981) and indicate that each construct
has capability to explain more than half of the variance to its measuring items on average.
Measurement of validity (Discriminant validity): The discriminant validity is
complementary concept of convergent validity which signifies that two conceptually
different constructs should exhibit differently i.e. the set of measuring items are expected not
to be un-dimensional (Henseler, 2009, p. 299). In this study, discriminant validity at
construct-level was examined using Fornell and Larcker (1981) criterion, while at item level
were examined using Chin (1998) criterions. Fornell and Larcker criterion suggest that
square-root of AVE for each constructs should be greater than the other construct’s
correlation with any other (i.e. inter-construct correlation). Table 5.23 shows that none of the
inter-construct correlation value was above the square-root of the AVE and satisfied the
criterion of the discriminant validity. At item-level discriminant validity, Chin (1998)
suggested to examine the cross-loading within factor loading. Table 5.22 ensures that each of
measuring item within construct was higher than all of its cross-loadings in row and column.
Infect, all cross-loading were lower than the 0.4 values recommended by Hair et al., (2006).
AT BI BU GS IS NAT PEOU PU RF SE SN TF
AT1 0.81 0.34 0.22 0.19 0.24 0.13 0.28 0.30 0.13 0.20 0.17 0.20
AT2 0.73 0.18 0.03 0.08 0.11 0.18 0.02 -0.07 0.04 0.19 0.10 0.10
AT5 0.72 0.13 0.03 0.10 0.07 0.17 0.10 -0.08 0.14 0.17 0.06 0.11
AT6 0.70 0.10 -0.03 0.06 0.08 0.21 0.04 -0.17 0.08 0.14 0.07 0.10
BI1 0.22 0.70 0.18 0.08 0.20 0.03 0.15 0.28 0.24 0.10 0.07 0.04
BI2 0.23 0.80 0.20 0.17 0.12 0.07 0.15 0.34 0.19 0.10 0.17 0.11
BI3 0.25 0.73 0.20 0.21 0.15 0.14 0.13 0.27 0.11 0.05 0.17 0.08

231
BI4 0.22 0.74 0.18 0.12 0.17 0.15 0.24 0.31 0.20 0.12 0.18 0.14
BU1 0.15 0.21 0.76 0.09 0.19 0.08 0.09 0.14 0.05 0.10 0.04 0.13
BU2 0.15 0.25 0.80 0.15 0.19 0.19 0.08 0.14 0.14 0.03 0.07 0.19
BU3 0.11 0.22 0.87 0.04 0.23 0.04 0.08 0.10 0.09 0.04 0.03 0.17
BU4 0.02 0.07 0.72 -0.02 0.18 -0.04 0.13 0.17 0.04 0.04 -0.03 0.13
GS1 0.10 0.19 0.14 0.75 0.04 0.21 0.19 0.18 0.13 0.06 0.15 0.18
GS2 0.07 0.08 0.04 0.74 0.10 0.18 0.09 0.20 0.12 0.02 0.13 0.06
GS3 0.14 0.19 0.05 0.77 0.14 0.11 0.09 0.22 0.15 0.10 0.18 0.10
GS4 0.15 0.08 0.04 0.75 0.06 0.14 0.15 0.18 0.11 0.03 0.20 0.04
GS5 0.16 0.16 0.08 0.58 0.26 0.11 0.17 0.16 0.18 0.07 0.19 0.19
NAT1 0.20 0.12 0.14 0.18 0.10 0.83 0.04 0.08 0.09 0.15 0.11 0.14
NTA2 0.17 0.08 0.10 0.18 0.07 0.82 0.11 0.08 0.05 0.16 0.06 0.22
NTA3 0.16 0.14 0.02 0.19 0.04 0.86 0.20 0.12 0.07 0.23 0.19 0.19
NTA4 0.16 0.06 0.11 0.12 0.11 0.76 0.11 0.09 0.06 0.13 0.09 0.20
PEOU1 0.16 0.20 0.11 0.18 0.16 0.06 0.86 0.34 0.11 0.06 0.11 0.15
PEOU2 0.15 0.19 0.03 0.15 0.05 0.11 0.89 0.30 0.10 0.10 0.17 0.16
PEOU3 0.21 0.18 0.13 0.13 0.20 0.16 0.77 0.30 0.11 0.18 0.15 0.15
PEOU4 0.17 0.17 0.11 0.15 0.21 0.15 0.78 0.33 0.06 0.18 0.18 0.13
PI1 0.09 0.16 0.08 0.17 0.13 0.09 0.17 0.23 0.15 0.20 0.72 0.13
PI2 0.09 0.09 0.05 0.18 0.00 0.17 0.10 0.18 0.09 0.17 0.67 0.13
PI3 0.18 0.20 0.04 0.17 0.12 0.12 0.15 0.26 0.15 0.21 0.74 0.12
PI4 0.13 0.10 -0.06 0.18 -0.01 0.14 0.08 0.18 0.05 0.13 0.68 0.06
PU1 0.09 0.34 0.14 0.22 0.23 0.14 0.28 0.75 0.10 0.14 0.23 0.11
PU2 0.07 0.36 0.17 0.24 0.26 0.09 0.25 0.76 0.08 0.05 0.24 0.17
PU3 0.09 0.30 0.11 0.24 0.22 0.07 0.29 0.81 0.11 0.09 0.24 0.10
PU4 0.07 0.24 0.10 0.14 0.19 0.04 0.30 0.71 0.14 0.11 0.21 0.11
PU5 0.09 0.24 0.09 0.10 0.16 0.08 0.31 0.65 0.08 0.14 0.23 0.13
RF2 0.12 0.20 0.13 0.18 0.17 0.00 0.16 0.09 0.70 -0.01 0.00 0.24
RF3 0.07 0.16 0.06 0.18 0.12 0.12 0.08 0.10 0.74 0.11 0.22 0.15
RF4 0.07 0.17 0.05 0.13 0.11 0.03 0.06 0.14 0.73 0.11 0.07 0.21
RF5 0.12 0.19 0.05 0.06 0.10 0.12 0.01 0.08 0.76 0.09 0.12 0.15
SE1 0.22 0.11 0.06 0.09 0.14 0.20 0.17 0.17 0.14 0.95 0.24 0.14
SE2 0.24 0.12 0.07 0.06 0.05 0.20 0.12 0.10 0.04 0.94 0.23 0.13
SI1 0.07 0.11 0.01 0.15 -0.07 0.05 0.14 0.24 0.00 0.16 0.74 0.08
TF1 0.18 0.10 0.19 0.13 0.18 0.19 0.10 0.14 0.25 0.15 0.13 0.82
TF2 0.15 0.07 0.06 0.08 0.12 0.11 0.12 0.09 0.22 0.06 0.00 0.69
TF3 0.10 0.07 0.15 0.10 0.13 0.17 0.11 0.08 0.17 0.12 0.11 0.81
TF4 0.18 0.13 0.19 0.16 0.18 0.18 0.22 0.19 0.19 0.10 0.15 0.81
IS1 0.16 0.14 0.27 0.18 0.78 0.07 0.14 0.22 0.13 0.09 0.08 0.18
IS2 0.04 0.10 0.17 0.14 0.71 0.02 0.12 0.20 0.14 0.05 0.00 0.12
IS3 0.17 0.17 0.13 0.07 0.68 0.18 0.18 0.19 0.08 0.05 0.06 0.20
IS4 0.21 0.19 0.17 0.09 0.74 0.03 0.12 0.26 0.19 0.11 0.07 0.11
IS5 0.20 0.20 0.15 0.09 0.72 0.06 0.14 0.19 0.10 0.05 0.01 0.13
Table 5. 22: Outer/factor loading with cross-loadings
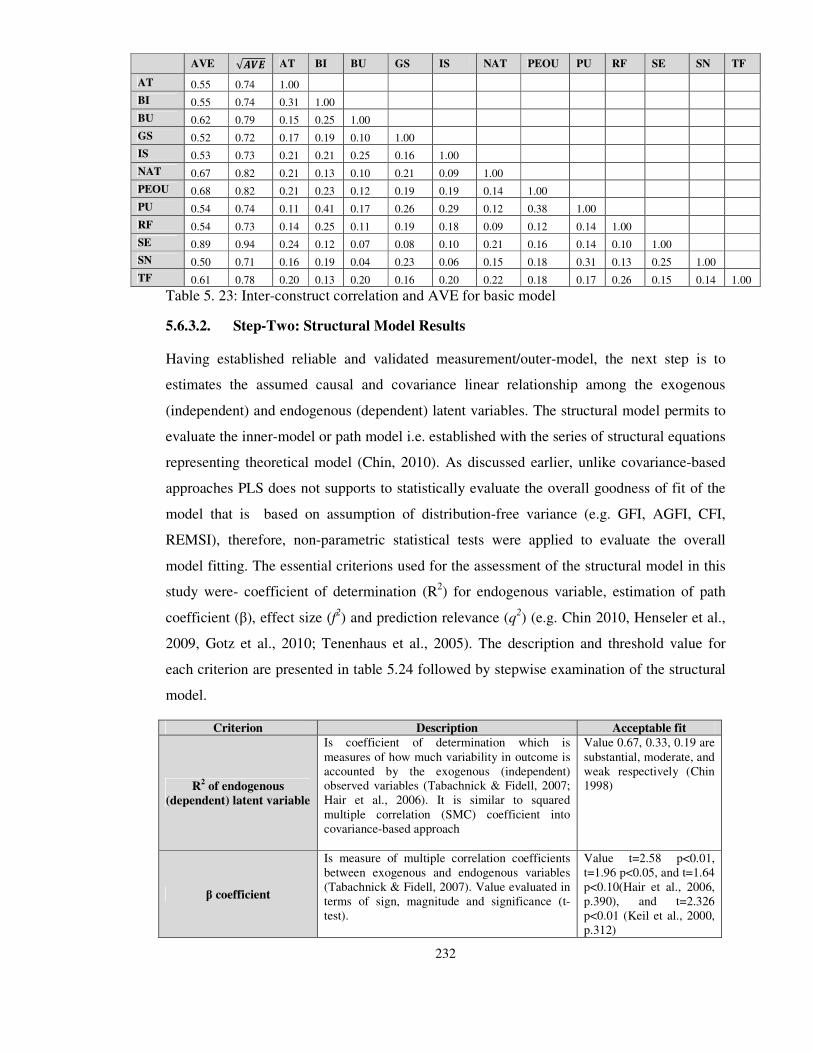
232
AVE √012 AT BI BU GS IS NAT PEOU PU RF SE SN TF
AT 0.55 0.74 1.00
BI 0.55 0.74 0.31 1.00
BU 0.62 0.79 0.15 0.25 1.00
GS 0.52 0.72 0.17 0.19 0.10 1.00
IS 0.53 0.73 0.21 0.21 0.25 0.16 1.00
NAT 0.67 0.82 0.21 0.13 0.10 0.21 0.09 1.00
PEOU 0.68 0.82 0.21 0.23 0.12 0.19 0.19 0.14 1.00
PU 0.54 0.74 0.11 0.41 0.17 0.26 0.29 0.12 0.38 1.00
RF 0.54 0.73 0.14 0.25 0.11 0.19 0.18 0.09 0.12 0.14 1.00
SE 0.89 0.94 0.24 0.12 0.07 0.08 0.10 0.21 0.16 0.14 0.10 1.00
SN 0.50 0.71 0.16 0.19 0.04 0.23 0.06 0.15 0.18 0.31 0.13 0.25 1.00
TF 0.61 0.78 0.20 0.13 0.20 0.16 0.20 0.22 0.18 0.17 0.26 0.15 0.14 1.00
Table 5. 23: Inter-construct correlation and AVE for basic model
5.6.3.2. Step-Two: Structural Model Results
Having established reliable and validated measurement/outer-model, the next step is to
estimates the assumed causal and covariance linear relationship among the exogenous
(independent) and endogenous (dependent) latent variables. The structural model permits to
evaluate the inner-model or path model i.e. established with the series of structural equations
representing theoretical model (Chin, 2010). As discussed earlier, unlike covariance-based
approaches PLS does not supports to statistically evaluate the overall goodness of fit of the
model that is based on assumption of distribution-free variance (e.g. GFI, AGFI, CFI,
REMSI), therefore, non-parametric statistical tests were applied to evaluate the overall
model fitting. The essential criterions used for the assessment of the structural model in this
study were- coefficient of determination (R2) for endogenous variable, estimation of path
coefficient (β), effect size (f2) and prediction relevance (q2) (e.g. Chin 2010, Henseler et al.,
2009, Gotz et al., 2010; Tenenhaus et al., 2005). The description and threshold value for
each criterion are presented in table 5.24 followed by stepwise examination of the structural
model.
Criterion Description Acceptable fit
R2 of endogenous
(dependent) latent variable
Is coefficient of determination which is measures of how much variability in outcome is accounted by the exogenous (independent) observed variables (Tabachnick & Fidell, 2007; Hair et al., 2006). It is similar to squared multiple correlation (SMC) coefficient into covariance-based approach
Value 0.67, 0.33, 0.19 are substantial, moderate, and weak respectively (Chin 1998)
β coefficient
Is measure of multiple correlation coefficients between exogenous and endogenous variables (Tabachnick & Fidell, 2007). Value evaluated in terms of sign, magnitude and significance (t-test).
Value t=2.58 p<0.01, t=1.96 p<0.05, and t=1.64 p<0.10(Hair et al., 2006, p.390), and t=2.326 p<0.01 (Keil et al., 2000, p.312)

233
Effect size f2
Is measure of representing the ratio of the improvement in prediction that results from the fitting the model (Tabachnick & Fidell, 2007). It is calculated by f2 = (R2
incl – R2excl )/(1- R2
incl) (Cohen, 1988)
Value 0.02,0.15, and 0.35 are weak, medium and large effect respectively (Cohen, 1988; Chin, 1998)
Prediction relevance q2
Is an assessment of model’s capability to predict R2 through sample reuse/cross-validation (Henseler et al., 2009). It is calculated using q2 = (F2
incl – F2excl )/(1- F2
incl)
Value 0.02,0.15, and 0.35 are weak, medium and large effect respectively (Chin, 1998)
Goodness of fit (GoF)
It is criterion of global goodness of fit, which is computed through the geometric mean of the average communality and average R2. Formula
is = 34� � ��5��65 �7889:�;<=>
Value closer to 1 is better (Tenenhaus et al., 2005)
Table 5. 24: Criterion of assessment of the Structural model (Developed by researcher)
Path estimation (β): The path estimation also known as nomological validity (i.e.
hypothetical relations) was performed to examine the significance of the path relations in
inner-model (e.g. Chin, 1998). In other words each path relationship presented in framework
was examined though regression coefficient (β�. The significance of regression coefficient β
is based on t-value, which was obtained using PLS Bootstrap process. Table 5.25 shows that
out of twenty path relations representing twelve hypotheses eleven were significant and
remaining nine were insignificant. Graphical representation of paths is presented in figure A-
2 and A-3 in appendix-A. Given that, results of paths towards dependent variable BU
revealed that only TF, IS and BI were positively significant, while SE, RF, PU, and GS were
insignificant. The highly significant path (p<0.001) was between BI and BU (β=0.19 or 19%
and t= 3.42) while least significant (p<0.05) was between TF and BU (β=0.14 or 14% and t=
2.6). These results suggest that usage of the Internet within educational institutes context was
mainly influenced by the individual respondent’s (academics) personal intention to accept
followed by the technological facilitations and institutional support. Thus, hypotheses H7b,
H10 and H11b were supported, and H1b, H6b, H8b and H12b were unsupported.
The result shows that more than half of the paths towards dependent variable BI were
insignificant. Specifically, only AT, PU, and RF were significant and TF, NAT, PEOU, SE
and SN were insignificant. The highest significant path was between PU and BI (β=0.34 or
34% and t= 7.5) followed by AT and BI (β=0.24 or 24% and t= 5.11). These results suggest
that behavioural intention to accept the Internet in the academic institutions was
predominantly influenced by the perception of usefulness of the Internet technology. Thus,
hypothesis H1a, H8a and H9a were supported, and H2, H4, H6a, H7a, H9b were not
supported.
234
All the paths SN, PEOU, GS and IS towards PU were significant and met the proposed
theoretical suggestions. The highest significant relationship was between PEOU and PU
(β=0.28 or 28% and t= 5.81) followed by SN on PU (β=0.22 or 22% and t= 3.99), and lowest
was between GS and PU (β=0.12 or 12% and t= 2030). These results suggest that ease of use
of the Internet and opinion of peer-fellows and social environment were the major
antecedent to observe the usefulness of the Internet. Finally, the only path proposed for the
relationship between PEOU and SN was also found to be significant (β=0.18 or 18% and t=
4.17) which suggest that like the PU peer-fellows and social environment had also impact on
the ease of use of the Internet within academic institutions. Thus, hypothesis H3, H5a, H5b,
H11a, H12a were all supported.
Determination of coefficient (R2): The determination of coefficient (R2) provides the
percentage of variation in dependent variable(s) explained by independent variable(s) (Keil
et al., 2000). According to the Bakhaus et al., (2003, p.63) R2 represents the level of the
latent construct’s explained variance and therefore measures the regression function’s
‘goodness of fit’ against the empirically obtained observed items. The value of R2 varies
according to the number of measuring independent variable(s) i.e. higher number of
independent variable needs to produce higher value of R2 and vice-verse (Chin, 1998).
Furthermore, according to Chin (1998) model having R2 as 0.67, 0.33, and 0.19 are
considered as substantial, moderate, and weak respectively. Table 5.26 indicates that the PU
shared highest variance (R2= 0.269 ,27%) followed by BI (i.e. R2= 0.265 or 26%), BU (i.e.
R2=0.12 or 12%) and PEOU (i.e. R2=0.03 or 3%). Following the criterion of Chin (1998)
model is considered to be moderately fit. The results of R2 were expected higher in BI
compared to the others but due to having less significance of independent variables it was
quite lower than the expectations. These results suggests that model mainly explained largest
variation in perceived usefulness, which in turn contributed into variation explained by
behaviour intention, and finally, a very little variation was explained by construct behaviour
usage.
Effect size (f2): Albers (2009) found that within inner-model path coefficient β declined with
the increased number of indirect relationships, consequently, considerable direct
relationships become insignificant. Additionally, effect was higher specifically when
mediating variables have a suprious effect on the direct path (ibid). Therefore, for the
goodness-of-fit model, it is required to keep the total effect (direct and indirect significant
paths in inner-model) relatively constant, so that reasonable explanations for the proposed
hypothesis may be justified (Henseler et al., 2009). In this study, within inner-model change

235
in the relations with respect to the effect size is calculated by means of Cohen’s (1988)
function of f2. The effect size function f2 which is similar to traditional partial F-test (Gotz et
al., 2010) helps to examine the increase in the R2 relative to the proportion of variance of the
dependent variable that remains unexplained. Contrary to the traditional F-test, f2 does not
refer to the sample size but to the basic population of the analysis, thus, no degree of
freedom was needed to compute f2 value. According to the Cohen (1988, p.413) values for f2
of 0.02, 0.15, and 0.35 for the significant independent variables represents weak, moderate
and substantial effect respectively.
In table 5.25 column f2 revealed that most of the relations presented moderate effect size (i.e.
f2 >0.02). The moderate impact of effect size suggests that inclusion of an additional path(s)
or independent variable(s) have no observable effect on dependent variable’s shared
variance. Specifically, in terms of the substantive effect for the significant paths towards BU,
f2 for TF, BI and IS were 0.020, 0.033 and 0.029 respectively. These results suggest that path
coefficient (β) has an approximately medium effect on BU above and beyond the
contributions provided by TF, BI and IS. On other hand, all paths towards PU were found to
be significant and f2 for the paths SN, PEOU, GS, and IS towards PU ranges from 0.061 to
0.322. The paths towards dependent variable BI were partially significant and only AT, PU
and RF contributed with effect size f2 of 0.069, 0.12, and 0.36 respectively. Finally, f2 for the
significant β value SN on PEOU suggest that the relationship was moderately acceptable. It
is worth to noticed that the effect size f2of some paths were negative or below the accepted
range (e.g. PU�BU, SE�BU and alike). Reasonably, the negative or zero effect of these
paths was based on their insignificant impact on the dependent variable.
Prediction relevance (q2), cv-communality (H
2), cv-redundancy(F
2): Another assessment
of structural model is q2 statistics, which is predictive capability of the model by reproducing
the observed values by the model itself and its estimating parameters. The q2 is computed
using Stone-Geisser (Stone, 1974; Geisser, 1975) criterion which suggests that model must
be able to provide a prediction of the dependent variable’s measuring items. The criterion of
q2 is also known as the sample reuse technique which facilitates to assess the cross-
validation (CV) of the model (Chin, 1998; Wold, 1982). According the Fornell & Cha (1994,
p. 73) if the q2 is larger than zero the model is considered to have predictive relevance
otherwise model lacks to have predictive relevance.
In PLS, two kinds of predictive relevances/validities are estimated for the measurement
model i.e. cv-communality (H2) and cv-redundancy (F2). Whereas, cv-communality is
236
calculated through the measurement model’s capability to assess the path model, such that,
block of measuring items are directly derived from their own latent variable (Tenenhaus et
al., 2005). Additionally, prediction of the measuring items of dependent or endogenous
block is measured using only the measuring items of that block (ibid). In other words, cv-
communality is obtained if prediction of the omitted data points in the measuring variables
block is made by an underlying construct or latent variable (Chin, 1998). On other hand, cv-
redundancy measures the capability of the path model to predict the dependent or
endogenous measuring items indirectly from the prediction of their own latent variable using
the related structural relation, by cross-validation (Tenenhaus et al., 2005, p. 181-182).
Contrary to the cv-communality, cv-redundancy measures the quality of the structural model
only taking into account the measurement model (ibid).
In this study, predictive validities i.e. q2, H
2, F
2 were computed using ‘blindfolding’
procedure. Gotz et al.,(2010, p.702) defined blindfolding procedure, as a parameter
estimation method where systematically some data for the particular block (a block is set of
measuring items for a construct) is removed from the sample and is treated as missing data.
In the next step, a block of the missing data is treated as part of the estimation process by
ignoring another part of the data, and the procedure is repeated until every data point is
omitted and estimated. The omission and estimation of the data points in blindfolding
procedure is dependent on the omission distance (G) (Chin, 1998). According to the Wold
(1982), the omission distance should be integer between the number of indicators and cases,
while Chin (1998) recommended omission distance is feasible between 5 and 10. In this
study, considering the Chin (1998) recommendations, blindfolding has been carried out
using omission distance G =7.
The indices for the q2 are explained in table 5.25. As can be seen that the significant paths
towards the dependent variable BU explained slightly above the common threshold of (i.e.
q2>0 and q2<0.02) predictive relevance and presented lower impact. Within significant paths
towards PU predictive relevance was higher than the 0.02 in most of the path (except
GS�PU) and reflects medium impact. For the significant paths towards dependent variable
BI predictive relevance was higher than the 0.02 and reflected, again, medium

237
impact, except RF�BI. Finally, the predictive relevance for the significant path SN�
PEOU also reflected medium predictive relevance impact. The indices for the cv-
communality (H2) and cv-redundancy (F2) obtained through the blindfolding method are
given in table 5.26. It is worth to remind that cv-redundancy alike the R2 is only computed
for the path model to predict the endogenous or dependent variable. Results show that all the
blocks presented an acceptable c-v redundancy index and cv-communality index. None of
the index was negative which may imply that the corresponding latent variable(s) were been
badly estimated (e.g. Tenenhaus et al., 2005).
Goodness-of-fit index (GoF): Finally, after examining the effect size of path estimation and
predictive relevance capability, last criterion was remained to see the overall fit of the model.
As discussed earlier, unlike CBSEM methods (e.g. LISREL, AMOS), PLS lacks to optimise
global scalar function (e.g. chi-square X2 in CBSEM) and, consequently, it lacks to calculate
the index which measures the overall validity/fitting of the model globally (Chin, 2010;
Tenenhaus et al., 2005). Overcoming this problem, Tenenhaus et al., (2005) and Amato et
al., (2004) proposed a global criterion of goodness-of-fit (GoF) index, which is geometric
mean of the average communality (i.e. outer-model or measurement model) and the average
of R2 (i.e. variance explained into dependent variable). The GoF is normed between 0 to 1,
where the higher value represents better path model estimation (Heneseler et al., 2009,
p.310). The GoF for the current study model was 0.322 (32%) (see table 5.26) and can be
accepted at moderate level (Chin, 1998).
H.
No.
Path
Relations
Path
(t-value)
Standard
Error f2 q2 Supported/Not-
Supported
H1a. PU -> BI 0.3421
(7.5819)*** 0.0729 0.123 0.061 Supported
H1b. PU -> BU 0.0139
(0.1968)Not Sig. 0.0705 -0.004 -0.008 Not-Supported
H2. PEOU -> BI 0.0232
(0.4562)Not Sig. 0.0721 -0.001 0.011 Not-Supported
H3. PEOU -> PU 0.281
(5.8124)*** 0.0766 0.098 0.050 Supported
H4. SN -> BI 0.0252
(0.5275)Not Sig. 0.0794 0.000 0.010 Not-Supported
H5a. SN -> PU 0.2203
(3.9937)*** 0.0919 0.061 0.033 Supported
H5b. SN -> PEOU 0.1836
(4.1729)*** 0.0664 0.035 0.024 Supported
H6a. SE -> BI -0.0124
(0.2125)Not Sig. 0.1024 0.000 -0.002 Not-Supported
H6b. SE -> BU 0.0041
(0.0818)Not Sig. 0.0499 0.000 -0.004 Not-Supported
H7a. TF -> BI -0.0359
(0.6647)Not Sig. 0.0735 0.002 -0.001 Not-Supported
H7b. TF -> BU 0.1435
(2.6076)** 0.055 0.020 0.004 Supported
H8a. RF -> BI 0.1715
(3.5596)*** 0.0844 0.036 0.017 Supported
H8b. RF -> BU -0.0141 0.0553 0.000 -0.008 Not-Supported

238
(0.2555)Not Sig.
H9a. AT -> BI 0.2439
(5.1168)*** 0.068 0.069 0.027 Supported
H9b. NAT -> BI 0.0282
(0.6458)Not Sig. 0.0609 0.001 0.008 Not-Supported
H10. BI -> BU 0.1941
(3.4228)*** 0.0567 0.033 0.008 Supported
H11a. IS -> PU 0.208
(4.6002)*** 0.0764 0.322 0.024 Supported
H11b. IS -> BU 0.1802
(3.2638)** 0.0552 0.029 0.006 Supported
H12a. GS -> PU 0.1208
(2.3049)* 0.0673 0.322 0.008 Supported
H12b. GS -> BU 0.0055
(0.0866)Not Sig. 0.0637 0.000 0.013 Not-Supported
Notes: *** p<0.001, ** p<0.001, * p<0.05; (based on t(198), two-tailed test) f2 = (R2
incl – R2excl )/(1- R2
incl) q2 = (F2
incl – F2excl )/(1- F2
incl)
Table 5. 25: Structural relations and path significance of basic model
Constructs Comp
Reliability R2 Communality
Cronbach’s
Alpha H2 Redundancy F2
AT 0.829 0.548 0.777 0.242
BI 0.832 0.265 0.553 0.730 0.2612 0.051 0.1289
BU 0.865 0.126 0.617 0.795 0.3676 0.035 0.0589
GS 0.844 0.521 0.767 0.2842
IS 0.849 0.530 0.779 0.297
NAT 0.891 0.672 0.843 0.427
PEOU 0.895 0.034 0.680 0.842 0.4603 0.026 0.0234
PU 0.855 0.269 0.542 0.788 0.3176 0.023 0.1406
RF 0.821 0.535 0.713 0.223
SE 0.943 0.893 0.880 0.5551
SN 0.835 0.504 0.758 0.234
TF 0.862 0.610 0.796 0.353
Average 0.173425 0.6003667 0.033625
GoF 0.322
Note: H2 = Constructs cross-validate communality F2 = Construct cross-validate redundancy
GoF = Goodness of Fit index = 34� � ��5��65 �7889:�;<=>
Table 5. 26: Overall overview of results and GoF of basic model
5.6.4. Testing Moderating Impact
After examining the direct path relationships within core model, next step was to examine
the moderating affect of the seven demographic variables: age, gender, educational level,
academic position, organisational type, usage experience, and voluntariness; and four
cultural variables: individualism-collectivism (IC), power distance (PD), masculinity and
femininity (MF) and uncertainty avoidance (UA). According to Baron and Kenny (1986,
p.1174) a moderator can be qualitative or quantitative variable that affects the direction
and/or strength of a relation between an independent and dependent or criterion variable.
There are several ways to examine the moderating effect within structural models but two
are very common: examination using interaction effect (product term) and examination using
239
multiple-group analysis (MGA). Before adopting any approach, brief overview of both
methods is given as follows:
The first approach to examine the moderating effect is known as interaction-effect or
product-term effect approach. In this, moderating effect within structural path model is
always represented with new structural relationship (Henseler & Fasssott, 2010). Hence,
proposed model needs to be examined with moderating effect not only comprise the main
effect under consideration (a) and the moderator variable’s main effect on criterion variable
(b), but also an interaction variable’s effect (c) (predictor x moderator) (ibid). Furthermore, if
path c satisfy to differ significantly from zero (i.e. null hypothesis is rejected) than it
represents an existence of moderation effect (Baron & Kenny, 1986). This approach to
examine moderating effects is missing in CBSEM techniques (e.g. AMOS, LISERL, etc.)
because of the assumption that the correlation between latent variable’s needs to be zero
(Ebrel, 2010). Apparently this approach has no drawbacks until and unless the predictors and
moderator variables are modelled with the reflective indicators, however, if one of the two
constructs is operationalised with the formative indicators than this approach is suboptimal
to adopt (Chin et al., 2003, Eberl, 2010).
Overcoming the limitation of the interaction-effect approach, second approach is known as
multiple-group analysis (MGA). This approach is widely suggested if either independent or
moderator variable are categorical in nature (Henseler & Fassott, 2010). According to the
Rigdon et al., (1998, p.1) ‘if one or both of the interacting variable(s) is discrete or can be
made so, researcher can apply a ‘multisample’ approach, with the interaction effect
becoming apparent as differences in parameter estimates when the same model is applied to
different but related set of data’. Usually this type of the group analysis is widely accepted
into CBSEM methods to check moderating effect (Joreskog, 1971), and recently is also
getting interest of the researchers within PLS environment (e.g. Chin, 2000; Keil et al., 2000;
Eberl, 2010). Nevertheless, this approach does also have drawbacks, and one is its
perquisite to test the t-value with assumption of the data normality. Overcoming this
problem within PLS, recently Dibbern & Chin (2005) suggested an alternative, distribution
free approach and provided random permutation method. In MGA, moderators are
examined by dividing data-sample into subsamples (mostly dichotomous e.g. high and low)
according to the moderating variable and same PLS model is run for both subsamples (Chin,
1998). The path differences between two groups are compared by examining the significance
of parametric t-test (ibid).

240
From the explained two approaches above, in this study PLS based MGA was adopted to
investigate the impact of moderators on the influence of independent variables towards the
dependent variables. There were two reasons to select the PLS-MGA approach over the
interaction approach- 1) as described MGA approach is also common in CBSEM methods,
therefore, result obtained in this research using PLS will be helpful for the future researchers
who might wish to re-examine and compare the moderating effect using CBSEM methods;
2) most of the moderators examined in this study were discrete/categorical in nature and all
the predictors were measured on reflective indicators, therefore following the assumption of
Rigdon et al., (1998) and Eberl (2010) MGA is most appropriate approach over the
interaction effect.
It was also possible to perform the MGA using traditional MGA methods using ANOVA
and MANOVA test, where intent is to assess the significant differences in terms of means
scores on the dependent variable across the groups (Hair et al., 2006; Pallant, 2007). For that
reason the variables measured in these tests needs to be observed and drawn from the data.
In addition, the primary concerns for these tests were to see the difference in the dependent
variable rather than the latent variables which might be unobservable in nature (Tabachnick
& Fidell, 2007). According to the nature of current study where dependent or criterion
variables were unobserved in nature and means of predictor or independent variable was
indirectly supported on their indicators loadings, ANOVA and MANOVA were less
preferred to use in comparison to the SEM techniques (see Allua, Stapleton and Beretvas,
2008)
5.6.4.1. Steps to examine the moderating impact using MGA
The objective of performing MGA was to confirm that whether the paths between groups
were significantly different or not. The presence of significant difference among the groups
(e.g. gender- male and female, culture- high and low on IC) suggests that moderator does
have effect on the path strength and direction. The variables presented in framework were
assessed with moderating variables in much similar stepwise approach of hierarchical
multiple regressions developed by Cohen and Cohen (1983). The step-wise process is
supported from the studies of Chin (1998; 2000) and Keil et al., (2000). In this approach,
initially sample is split into desired groups (subsample) and the path-relationships of
exogenous/independent variable(s) are regressed with endogenous/dependent variable(s)
using one subsample at time. Each model considered to be acceptable in terms of goodness
of fit i.e. validity (discriminant and convergent), reliability (Cronbach α and composite
241
reliability) and explanatory power in dependent variable (R2). In next step, bootstrap method
is applied (in present study 200 times) to re-sample the data for obtaining the standard error
of the structural paths in subsamples under consideration. In third step, differences between
the path estimators are tested for the significance of t-test. If the obtained standard errors of
path estimators are assumed to be equal the t-static is computed using Chin (2002) criterion
as follows:
t @��� @���
A �:��� 1��:��� � :��� 2 C5�@����� � �:��� 1��:��� � :��� 2 C5�@����� D3 1:��� � 1:���
Where b���= Path value in group one b���= Path value in group two
n���= Sample size in group one n���= Sample size in group two Se= Standard error
This would follow at t-distribution with m+n-2 degree of freedom. Where m= subsample1,
and n=subsample2.
In conditions when assumption of standard errors’ inequality is present, the differences
between the paths estimators of two groups are tested using Smith-Satterthwait test (c.f.
Chin, 2002) as follows:
= I�=J�C�8I;51� I�=J�C�8I;52�KC. 5. �C�8I;51���� � C. 5. �C�8I;52����
5.6.4.2. Results of MGA for Demographic moderating variables
5.6.4.2.1 Age
As described earlier, moderating effect is examined using MGA. The nature of moderating
variable age was categorical in the survey question, therefore according to the Henseler &
Fassott (2010, p.720) it does not required any refinement to divide the sample into groups.
Due to lower number of respondents in some groups overall sample was split into two
groups: younger-age group and older-age group. Within younger-age group there were total
289 respondents (academics) out of which 152 (52%) were in age between 20-29 and
remaining 137(47%) were in age between 30-39; within older-age group there were 91
respondent (academics) out of which 54(59%) were in age between 40-49 and remaining
37(40%) were above age 50. F-test showed that age differed among the two split groups
(F=1.096, p<0.05)

242
The results presented in table 5.27 revealed AVE for majority of the constructs in both
models were higher than the 0.50 threshold and satisfied the criterion of the convergent
validity (Fornell & Larcker, 1981). Only construct SN in younger-age group and GS in
older-age group demonstrated slightly lower AVE’s. Furthermore, the square-root of AVE
for each construct was relatively high than the inter-construct correlation in both models and
satisfied the criterion of discriminant validity (ibid).
Correlation among the construct (Younger-age Group)
AVE √012 AT BI BU GS IS NAT PEOU PU RF SE SN TF
AT 0.544 0.74 1.00
BI 0.542 0.74 0.32 1.00
BU 0.638 0.80 0.13 0.24 1.00
GS 0.541 0.74 0.14 0.18 0.08 1.00
IS 0.538 0.73 0.18 0.16 0.23 0.10 1.00
NAT 0.619 0.79 0.19 0.19 0.14 0.24 0.06 1.00
PEOU 0.671 0.82 0.23 0.22 0.06 0.16 0.13 0.18 1.00
PU 0.535 0.73 0.14 0.41 0.15 0.26 0.27 0.22 0.40 1.00
RF 0.544 0.74 0.21 0.27 0.17 0.24 0.19 0.11 0.11 0.21 1.00
SE 0.911 0.95 0.22 0.12 0.06 0.05 0.06 0.24 0.17 0.12 0.19 1.00
SN 0.489 0.70 0.15 0.22 0.04 0.26 0.07 0.16 0.15 0.31 0.15 0.25 1.00
TF 0.593 0.77 0.17 0.12 0.20 0.15 0.16 0.20 0.20 0.20 0.27 0.17 0.15 1.00
Correlation among the construct (Older-age Group)
AT 0.55 0.74 1.00
BI 0.60 0.77 0.33 1.00
BU 0.56 0.75 0.21 0.34 1.00
GS 0.44 0.67 0.33 0.29 0.16 1.00
IS 0.51 0.72 0.31 0.37 0.32 0.38 1.00
NAT 0.73 0.86 0.30 0.11 0.10 0.16 0.21 1.00
PEOU 0.71 0.84 0.17 0.23 0.31 0.31 0.38 0.18 1.00
PU 0.58 0.76 0.08 0.39 0.25 0.30 0.41 -0.06 0.35 1.00
RF 0.50 0.71 -0.04 0.24 -0.07 0.03 0.09 0.08 0.09 -0.07 1.00
SE 0.75 0.87 0.36 0.24 0.13 0.20 0.25 0.23 0.18 0.28 -0.18 1.00
SN 0.53 0.73 0.22 0.14 0.08 0.16 0.06 0.20 0.27 0.31 0.06 0.21 1.00
TF 0.65 0.80 0.26 0.18 0.27 0.21 0.32 0.37 0.13 0.11 0.19 0.01 0.12 1.00
Table 5. 27: Inter-construct correlation and AVE for moderator age
Table 5.28 presents the overview of acceptable fit in both models. The Cronbach α and
composite reliability were higher than 0.7 and 0.8 respectively and satisfied the internal
consistency of measurement with underlying constructs in both models (Cronbach, 1951;
Werts et al., 1974). The R2 values for the main dependent variable BI was 26% and 34%,
and for PU was 28% in each model, which indicates that models were moderately fit (see
Chin, 1998). The communalities for both models were more than 0.50 thresholds (Hair et al.,
2006) which suggest that variance extracted by the indicators/items towards underlying
construct were more than half of the shared variance compared to the others. In addition
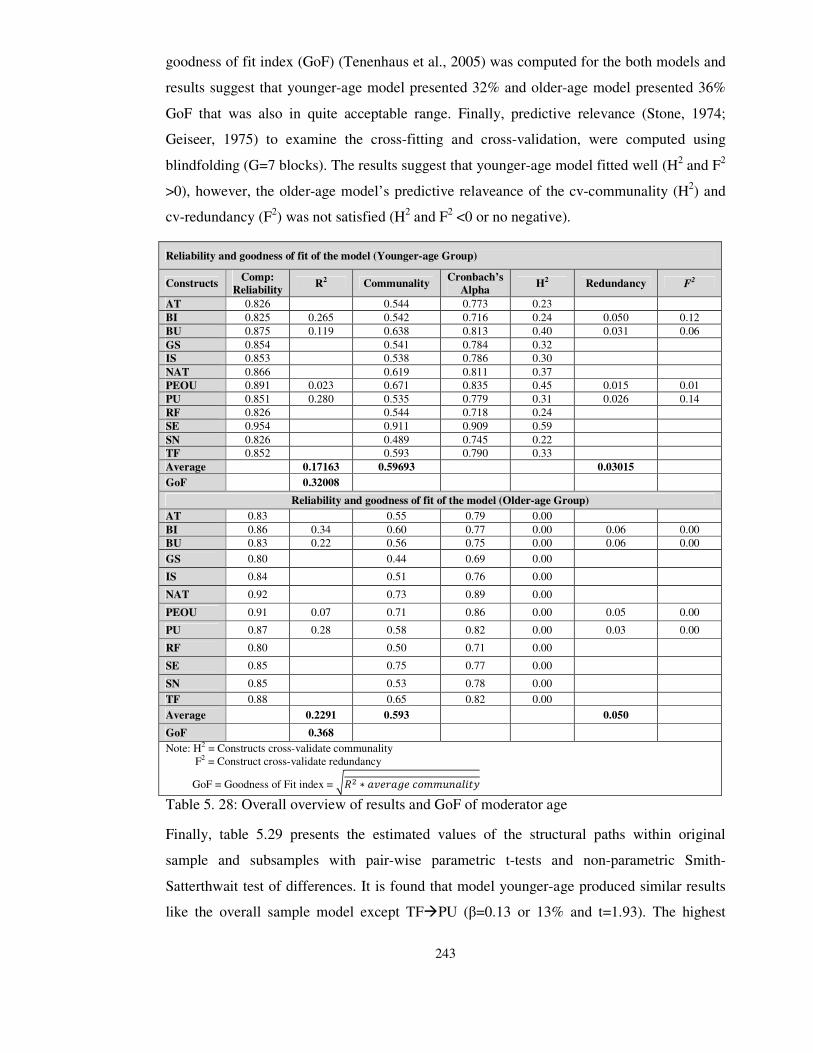
243
goodness of fit index (GoF) (Tenenhaus et al., 2005) was computed for the both models and
results suggest that younger-age model presented 32% and older-age model presented 36%
GoF that was also in quite acceptable range. Finally, predictive relevance (Stone, 1974;
Geiseer, 1975) to examine the cross-fitting and cross-validation, were computed using
blindfolding (G=7 blocks). The results suggest that younger-age model fitted well (H2 and F2
>0), however, the older-age model’s predictive relaveance of the cv-communality (H2) and
cv-redundancy (F2) was not satisfied (H2 and F2 <0 or no negative).
Reliability and goodness of fit of the model (Younger-age Group)
Constructs Comp:
Reliability R2 Communality
Cronbach’s
Alpha H2 Redundancy F2
AT 0.826 0.544 0.773 0.23
BI 0.825 0.265 0.542 0.716 0.24 0.050 0.12
BU 0.875 0.119 0.638 0.813 0.40 0.031 0.06
GS 0.854 0.541 0.784 0.32
IS 0.853 0.538 0.786 0.30
NAT 0.866 0.619 0.811 0.37
PEOU 0.891 0.023 0.671 0.835 0.45 0.015 0.01
PU 0.851 0.280 0.535 0.779 0.31 0.026 0.14
RF 0.826 0.544 0.718 0.24
SE 0.954 0.911 0.909 0.59
SN 0.826 0.489 0.745 0.22
TF 0.852 0.593 0.790 0.33
Average 0.17163 0.59693 0.03015
GoF 0.32008
Reliability and goodness of fit of the model (Older-age Group)
AT 0.83 0.55 0.79 0.00
BI 0.86 0.34 0.60 0.77 0.00 0.06 0.00
BU 0.83 0.22 0.56 0.75 0.00 0.06 0.00
GS 0.80 0.44 0.69 0.00
IS 0.84 0.51 0.76 0.00
NAT 0.92 0.73 0.89 0.00
PEOU 0.91 0.07 0.71 0.86 0.00 0.05 0.00
PU 0.87 0.28 0.58 0.82 0.00 0.03 0.00
RF 0.80 0.50 0.71 0.00
SE 0.85 0.75 0.77 0.00
SN 0.85 0.53 0.78 0.00
TF 0.88 0.65 0.82 0.00
Average 0.2291 0.593 0.050
GoF 0.368
Note: H2 = Constructs cross-validate communality F2 = Construct cross-validate redundancy
GoF = Goodness of Fit index = 34� � ��5��65 �7889:�;<=>
Table 5. 28: Overall overview of results and GoF of moderator age
Finally, table 5.29 presents the estimated values of the structural paths within original
sample and subsamples with pair-wise parametric t-tests and non-parametric Smith-
Satterthwait test of differences. It is found that model younger-age produced similar results
like the overall sample model except TF�PU (β=0.13 or 13% and t=1.93). The highest
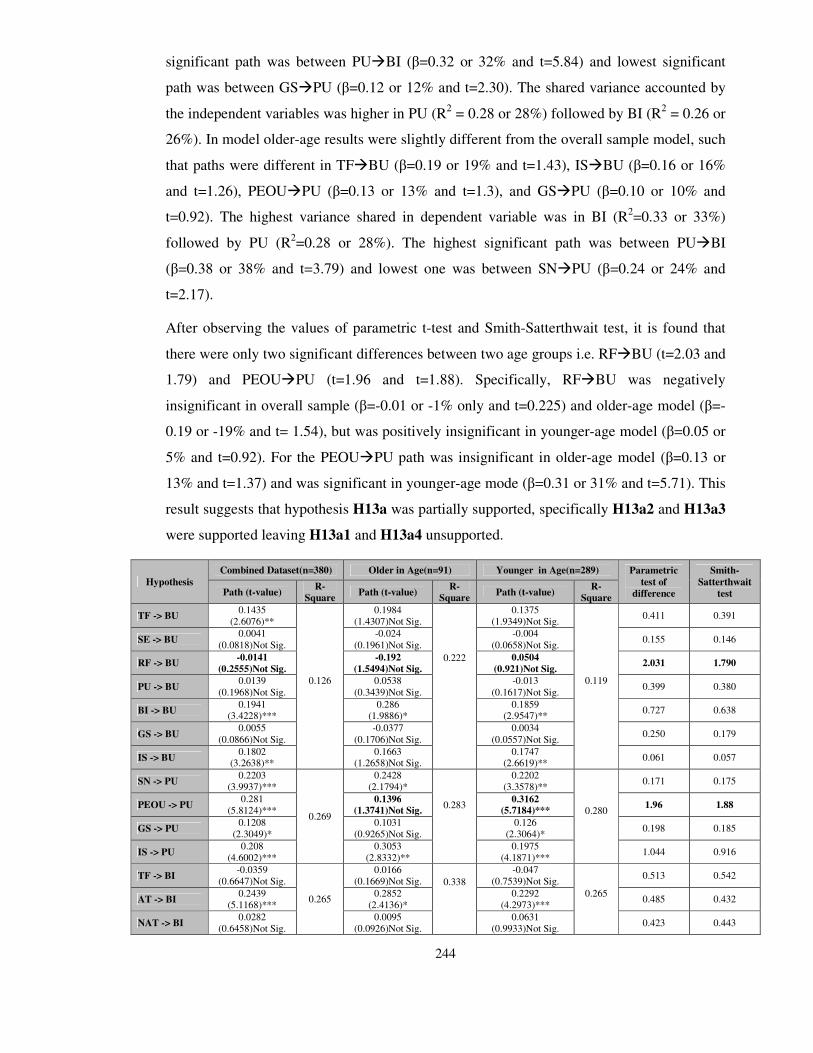
244
significant path was between PU�BI (β=0.32 or 32% and t=5.84) and lowest significant
path was between GS�PU (β=0.12 or 12% and t=2.30). The shared variance accounted by
the independent variables was higher in PU (R2 = 0.28 or 28%) followed by BI (R2 = 0.26 or
26%). In model older-age results were slightly different from the overall sample model, such
that paths were different in TF�BU (β=0.19 or 19% and t=1.43), IS�BU (β=0.16 or 16%
and t=1.26), PEOU�PU (β=0.13 or 13% and t=1.3), and GS�PU (β=0.10 or 10% and
t=0.92). The highest variance shared in dependent variable was in BI (R2=0.33 or 33%)
followed by PU (R2=0.28 or 28%). The highest significant path was between PU�BI
(β=0.38 or 38% and t=3.79) and lowest one was between SN�PU (β=0.24 or 24% and
t=2.17).
After observing the values of parametric t-test and Smith-Satterthwait test, it is found that
there were only two significant differences between two age groups i.e. RF�BU (t=2.03 and
1.79) and PEOU�PU (t=1.96 and t=1.88). Specifically, RF�BU was negatively
insignificant in overall sample (β=-0.01 or -1% only and t=0.225) and older-age model (β=-
0.19 or -19% and t= 1.54), but was positively insignificant in younger-age model (β=0.05 or
5% and t=0.92). For the PEOU�PU path was insignificant in older-age model (β=0.13 or
13% and t=1.37) and was significant in younger-age mode (β=0.31 or 31% and t=5.71). This
result suggests that hypothesis H13a was partially supported, specifically H13a2 and H13a3
were supported leaving H13a1 and H13a4 unsupported.
Hypothesis
Combined Dataset(n=380) Older in Age(n=91) Younger in Age(n=289) Parametric
test of
difference
Smith-
Satterthwait
test Path (t-value) R-
Square Path (t-value)
R-
Square Path (t-value)
R-
Square
TF -> BU 0.1435
(2.6076)**
0.126
0.1984 (1.4307)Not Sig.
0.222
0.1375 (1.9349)Not Sig.
0.119
0.411 0.391
SE -> BU 0.0041
(0.0818)Not Sig. -0.024
(0.1961)Not Sig. -0.004
(0.0658)Not Sig. 0.155 0.146
RF -> BU -0.0141
(0.2555)Not Sig. -0.192
(1.5494)Not Sig. 0.0504
(0.921)Not Sig. 2.031 1.790
PU -> BU 0.0139
(0.1968)Not Sig. 0.0538
(0.3439)Not Sig. -0.013
(0.1617)Not Sig. 0.399 0.380
BI -> BU 0.1941
(3.4228)*** 0.286
(1.9886)* 0.1859
(2.9547)** 0.727 0.638
GS -> BU 0.0055
(0.0866)Not Sig. -0.0377
(0.1706)Not Sig. 0.0034
(0.0557)Not Sig. 0.250 0.179
IS -> BU 0.1802
(3.2638)** 0.1663
(1.2658)Not Sig. 0.1747
(2.6619)** 0.061 0.057
SN -> PU 0.2203
(3.9937)***
0.269
0.2428 (2.1794)*
0.283
0.2202 (3.3578)**
0.280
0.171 0.175
PEOU -> PU 0.281
(5.8124)*** 0.1396
(1.3741)Not Sig. 0.3162
(5.7184)*** 1.96 1.88
GS -> PU 0.1208
(2.3049)* 0.1031
(0.9265)Not Sig. 0.126
(2.3064)* 0.198 0.185
IS -> PU 0.208
(4.6002)*** 0.3053
(2.8332)** 0.1975
(4.1871)*** 1.044 0.916
TF -> BI -0.0359
(0.6647)Not Sig.
0.265
0.0166 (0.1669)Not Sig.
0.338
-0.047 (0.7539)Not Sig.
0.265
0.513 0.542
AT -> BI 0.2439
(5.1168)*** 0.2852
(2.4136)* 0.2292
(4.2973)*** 0.485 0.432
NAT -> BI 0.0282
(0.6458)Not Sig. 0.0095
(0.0926)Not Sig. 0.0631
(0.9933)Not Sig. 0.423 0.443

245
PEOU -> BI 0.0232
(0.4562)Not Sig. 0.0229
(0.1868)Not Sig.
0.0135 (0.2202)Not Sig.
0.073 0.069
PU -> BI 0.3421
(7.5819)*** 0.3815
(3.7983)*** 0.322
(5.8457)*** 0.527 0.520
RF -> BI 0.1715
(3.5596)*** 0.2998
(2.3503)* 0.1533
(2.4883)* 1.121 1.034
SE -> BI -0.0124
(0.2125)Not Sig. 0.0992
(0.7276)Not Sig. -0.0244
(0.3871)Not Sig. 0.912 0.822
SN -> BI 0.0252
(0.5275)Not Sig. -0.0899
(0.9998)Not Sig. 0.0582
(0.979)Not Sig. 1.264 1.374
SN -> PEOU 0.1836
(4.1729)*** 0.034
0.2714 (3.1488)**
0.074 0.1509
(2.7892)** 0.023 1.120 1.184
Table 5. 29: Structural relations and path significance difference of moderator age
5.6.4.2.2 Gender
The nature of the moderating variable gender was categorical i.e. male and female, therefore
it does not required any refinement. Also, no F-test was computed to examine the real
difference between two groups. Out of 380 respondents half of were (n=190, 50%) were
male and remaining half were (n=190, 50%) female. Table 5.30 indicates that AVE for most
of the constructs in both models was higher than the common threshold 0.5 and satisfied the
requirement of the convergent validity (Fornell & Larcker, 1981). Only construct GS, IS and
RF in male group, and AT and SN’s AVE in female group were slightly lower than then
recommended value. The square-root of AVE computed for the each construct was higher
than the inter-construct correlation, which indicates that the latent variable shared more
variances with its assigned indicators compared to the others and satisfied the criterion of
discriminant validity (ibid).
Correlation among the construct (Gender: Male Group)
AVE √012 AT BI BU GS IS NAT PEOU PU RF SE SN TF
AT 0.609 0.78 1.00
BI 0.579 0.76 0.33 1.00
BU 0.588 0.77 0.17 0.23 1.00
GS 0.497 0.70 0.18 0.33 0.15 1.00
IS 0.493 0.70 0.21 0.24 0.24 0.33 1.00
NAT 0.707 0.84 0.28 0.15 0.04 0.22 0.14 1.00
PEOU 0.635 0.80 0.13 0.22 0.08 0.15 0.16 0.23 1.00
PU 0.504 0.71 0.03 0.37 0.14 0.29 0.22 0.16 0.32 1.00
RF 0.481 0.69 0.13 0.29 0.15 0.18 0.15 0.10 0.14 0.07 1.00
SE 0.867 0.93 0.34 0.09 0.19 0.13 0.18 0.33 0.18 0.11 0.15 1.00
SN 0.505 0.71 0.14 0.18 0.14 0.27 0.10 0.23 0.20 0.38 0.17 0.22 1.00
TF 0.505 0.71 0.23 0.19 0.19 0.22 0.28 0.28 0.27 0.15 0.24 0.21 0.20 1.00
Correlation among the construct (Gender: Female Group)
AT 0.48 0.69 1.00
BI 0.53 0.73 0.33 1.00
BU 0.64 0.80 0.14 0.27 1.00
GS 0.55 0.74 0.15 0.09 0.06 1.00
IS 0.55 0.74 0.22 0.23 0.30 0.01 1.00
NAT 0.60 0.78 0.17 0.16 0.16 0.18 0.02 1.00

246
PEOU 0.72 0.85 0.30 0.23 0.16 0.22 0.23 0.06 1.00
PU 0.58 0.76 0.21 0.44 0.20 0.25 0.38 0.09 0.44 1.00
RF 0.58 0.76 0.15 0.23 0.09 0.22 0.20 0.07 0.11 0.20 1.00
SE 0.91 0.95 0.17 0.17 -0.03 0.04 0.03 0.10 0.16 0.19 0.06 1.00
SN 0.49 0.70 0.22 0.23 -0.04 0.19 0.05 0.10 0.18 0.30 0.10 0.30 1.00
TF 0.61 0.78 0.19 0.09 0.23 0.11 0.13 0.14 0.13 0.19 0.28 0.08 0.12 1.00
Table 5. 30: Inter-construct correlation and AVE for moderator gender
Internal consistency metrics, presented in table 5.31 revealed that Cronbach α was higher
than 0.7 and composite reliability was higher than 0.78 in both models and satisfied the
measurement indicators criterion (Cronbach, 1951; Werts et al., 1974). The variance
explained by independent variables in dependent variables R2 in male group was higher in
BI (0.30 or 30%) followed by PU (0.24 or 24%). For the female group, R2 was higher in PU
(0.33 or 33%) followed by the BI (0.28 or 28%). Based on Chin’s criterion (Chin, 1998), R2
suggests that both models were moderately acceptable. The shared variances extracted by the
indicators in their underlying constructs presented by communalities were also higher than
0.5 thresholds in both models. Only, GS, IS and RF in male group, and AT and SN in female
group shared slightly lower communalities than the recommended value. However, the
average communality of all the constructs in individual model was still higher than the
required threshold i.e. 0.58 (58%) and 0.60 (60%) in male and female group respectively.
The goodness of fit index (GoF) for the male group was 0.32 or 32% and for female group
was 0.35 or 35% which were in quite acceptable range. Finally the predictive relevance
suggested by Stone and Geiseer (Stone, 1974; Geiseer, 1975) were computed using
blindfolding method with omission distance G=7. The results of predictive relevance suggest
that both models were acceptable at fit level (H2 and F2 >0).
Reliability and goodness of fit of the model (Gender: Male Group)
Constructs Comp:
Reliability R2 Communality
Cronbach’s
Alpha H2 Redundancy F2
AT 0.861 0.609 0.801 0.330
BI 0.846 0.303 0.579 0.757 0.299 0.064 0.162
BU 0.850 0.118 0.588 0.768 0.316 0.027 0.048
GS 0.830 0.497 0.744 0.247
IS 0.828 0.493 0.749 0.238
NAT 0.906 0.707 0.866 0.500
PEOU 0.874 0.041 0.635 0.806 0.388 0.025 0.026
PU 0.834 0.245 0.504 0.755 0.259 0.030 0.111
RF 0.787 0.481 0.662 0.144
SE 0.929 0.867 0.855 0.496
SN 0.836 0.505 0.756 0.246
TF 0.860 0.609 0.793 0.355
Average 0.177 0.589 0.036
GoF 0.323
Reliability and goodness of fit of the model (Gender: Female Group)
AT 0.783 0.482 0.748 0.171
BI 0.818 0.287 0.533 0.702 0.229 0.052 0.116

247
BU 0.875 0.180 0.637 0.818 0.400 0.040 0.084
GS 0.857 0.549 0.788 0.326
IS 0.861 0.555 0.800 0.333
NAT 0.858 0.604 0.813 0.326
PEOU 0.911 0.033 0.720 0.869 0.523 0.024 0.025
PU 0.873 0.336 0.581 0.817 0.371 0.029 0.177
RF 0.848 0.584 0.761 0.311
SE 0.952 0.909 0.903 0.586
SN 0.826 0.490 0.761 0.221
TF 0.862 0.609 0.800 0.338
Average 0.209 0.604 0.036
GoF 0.355
Note: H2 = Constructs cross-validate communality F2 = Construct cross-validate redundancy
GoF = Goodness of Fit index = 34� � ��5��65 �7889:�;<=>
Table 5. 31: Overall overview of results and GoF of moderator gender
Table 5.32 shows the estimated values of the structural relations within overall sample and
subsamples. Total twenty paths with two groups (i.e. 20x2 = 40 comparisons) were
compared using pair-wise parametric t-tests and non-parametric Smith-Satterthwait test of
differences. Results revealed that male group sample produced slightly different results from
the overall sample model, specifically TF�BU (β=0.07 or 7% and t=1.08), BI�BU (β=0.15
or 15% and t=1.46), GS�PU (β=0.13 or 13% and t=1.84) and IS�PU (β=0.11 or 11% and
t=1.55) were different. The highest significant path in male group was between PU�BI
(β=0.34 or 34% and t=5.27) and lowest significant path was between IS�BU (β=0.15 or
15% and t=2.15). In the model female group sample results were similar like the overall
sample model. The highest significant path was between PU�BI (β=0.36 or 36% and
t=5.34) and lowest one was between RF�BI (β=0.13 or 13% and t=2.21).
After observing the values of parametric t-test and Smith-Satterthwait non-parametric test, it
was found that there was significant difference between male and female group at relations,
SE�BU (t=2.04 and 2.04) and IS�PU (t=1.98 and t=1.97). For instance, even though
SE�BU was insignificant in overall sample and in both subsamples, but it produced
negative relationship in only female sample (β=-0.09 or -09% and t= 1.11). The second
difference within subsamples was between IS�PU, such that relationship was significant in
female group sample (β=0.29 or 29% and t=4.12) and was insignificant in male group
sample (β=0.11 or 11% and t=1.55). Thus hypotheses H13b was partially supported.
Specifically, H13b1 and H13b2 were supported and H13b3 and H13b4 were unsupported.

248
Hypothesis
Combined Dataset(n=380) Gender Male(n=190) Gender Female(n=190) Parametric
test of
difference
Smith-
Satterthwait
test Path (t-value) R-
Square Path (t-value)
R-
Square Path (t-value)
R-
Square
TF -> BU 0.1435
(2.6076)**
0.126
0.0783 (1.0883)Not Sig.
0.118
0.2038 (2.8368)**
0.180
1.238 1.234
SE -> BU 0.0041
(0.0818)Not Sig. 0.1203
(1.8912)Not Sig. -0.0904
(1.1106)Not Sig. 2.045 2.040
RF -> BU -0.0141
(0.2555)Not Sig. 0.0393
(0.3554)Not Sig. -0.0715
(1)Not Sig. 0.844 0.841
PU -> BU 0.0139
(0.1968)Not Sig. 0.0206
(0.1868)Not Sig. -0.005
(0.0476)Not Sig. 0.169 0.168
BI -> BU 0.1941
(3.4228)*** 0.1502
(1.4678)Not Sig. 0.2334
(3.2256)** 0.666 0.664
GS -> BU 0.0055
(0.0866)Not Sig. 0.0002
(0.002)Not Sig. 0.0377
(0.4384)Not Sig. 0.293 0.292
IS -> BU 0.1802
(3.2638)** 0.1533
(2.1545)* 0.2366
(2.8377)** 0.762 0.760
SN -> PU 0.2203
(3.9937)***
0.269
0.202 (2.753)**
0.245
0.288 (4.0531)***
0.336
0.844 0.842
PEOU -> PU 0.281
(5.8124)*** 0.2225
(3.3595)** 0.3001
(4.3918)*** 0.818 0.816
GS -> PU 0.1208
(2.3049)* 0.139
(1.8436)Not Sig. 0.1406
(2.1325)* 0.016 0.016
IS -> PU 0.208
(4.6002)*** 0.1102
(1.5537)Not Sig. 0.2926
(4.1295)*** 1.980 1.970
TF -> BI -0.0359
(0.6647)Not Sig.
0.265
0.0247 (0.3713)Not Sig.
0.303
-0.0793 (0.8626)Not Sig.
0.287
0.919 0.916
AT -> BI 0.2439
(5.1168)*** 0.3185
(5.0721)*** 0.225
(3.3545)** 1.020 1.017
NAT -> BI 0.0282
(0.6458)Not Sig. 0.005
(0.0986)Not Sig. 0.0822
(0.94)Not Sig. 0.767 0.765
PEOU -> BI 0.0232
(0.4562)Not Sig. 0.0459
(0.5974)Not Sig. -0.025
(0.3652)Not Sig. 0.691 0.689
PU -> BI 0.3421
(7.5819)*** 0.3415
(5.2706)*** 0.3655
(5.3447)*** 0.255 0.255
RF -> BI 0.1715
(3.5596)*** 0.2346
(3.2509)** 0.1389
(2.212)* 1.003 1.000
SE -> BI -0.0124
(0.2125)Not Sig. -0.0997
(1.3156)Not Sig. 0.0472
(0.6524)Not Sig. 1.405 1.401
SN -> BI 0.0252
(0.5275)Not Sig. -0.0232
(0.3932)Not Sig. 0.0451
(0.6406)Not Sig. 0.745 0.743
SN -> PEOU 0.1836
(4.1729)*** 0.034
0.2012 (3.01)**
0.041
0.1819 (2.9999)**
0.033
0.214 0.214
Table 5. 32: Structural relations and path significance difference of moderator gender
5.6.4.2.3 Organisational type
The nature of the moderating variable organisation type was categorical, where one category
was representing public universities (n=207, 54%) and other was representing private
universities (n=173, 45%). Similar like gender, no refinement was made to create the groups
therefore there was no need to compute the F-test for assessing the differences. Table 5.33
revealed that the AVE computed for most the construct in public universities’ model was
higher than 0.5 except GS and SN. Within private universities’ sample AVE was also higher
than the thresholds except AT, NAT and SN. The higher AVE satisfied the criterion of the
convergent validity (Fornell and Larcker, 1981). For the discriminant validity at construct
level, square-root of AVE was compared with the inter-construct correlation which was
higher than the all relative correlations, and thus, satisfied criterion of discriminant validity
(ibid).

249
Correlation among the construct (Organisation: Public universities)
AVE √012 AT BI BU GS IS NAT PEOU PU RF SE SN TF
AT 0.590 0.77 1.00
BI 0.600 0.77 0.40 1.00
BU 0.629 0.79 0.31 0.42 1.00
GS 0.472 0.69 0.23 0.29 0.13 1.00
IS 0.537 0.73 0.33 0.35 0.38 0.30 1.00
NAT 0.679 0.82 0.34 0.29 0.15 0.26 0.19 1.00
PEOU 0.673 0.82 0.24 0.30 0.22 0.15 0.28 0.24 1.00
PU 0.567 0.75 0.15 0.49 0.29 0.28 0.39 0.24 0.46 1.00
RF 0.514 0.72 0.19 0.28 0.20 0.22 0.16 0.16 0.13 0.22 1.00
SE 0.912 0.95 0.29 0.23 0.21 0.13 0.20 0.25 0.19 0.23 0.17 1.00
SN 0.480 0.69 0.17 0.25 0.07 0.36 0.10 0.17 0.24 0.39 0.15 0.36 1.00
TF 0.630 0.79 0.26 0.19 0.16 0.16 0.22 0.18 0.25 0.21 0.27 0.22 0.14 1.00
Correlation among the construct (Organisation: Private universities)
AT 0.465 0.68 1.00
BI 0.510 0.71 0.21 1.00
BU 0.601 0.78 -0.01 0.09 1.00
GS 0.544 0.74 0.14 0.15 0.09 1.00
IS 0.505 0.71 0.08 0.10 0.15 0.06 1.00
NAT 0.412 0.64 -0.01 -0.25 0.07 0.05 0.04 1.00
PEOU 0.685 0.83 0.19 0.13 0.00 0.24 0.07 -0.03 1.00
PU 0.517 0.72 0.07 0.32 0.06 0.29 0.20 -0.06 0.30 1.00
RF 0.557 0.75 0.09 0.24 0.02 0.16 0.17 0.04 0.11 0.04 1.00
SE 0.859 0.93 0.18 -0.03 -0.09 0.03 -0.03 0.06 0.09 0.02 -0.02 1.00
SN 0.495 0.70 0.12 0.10 0.01 0.13 0.08 -0.02 0.14 0.29 0.13 0.13 1.00
TF 0.585 0.76 0.12 0.06 0.28 0.16 0.16 0.20 0.10 0.12 0.22 0.04 0.15 1.00
Table 5. 33: Inter-construct correlation and AVE for moderator organisational type
Table 5.34 present the overall view of the both models. It is found that reliability values
Cronbach α and composite reliability were within the boundaries usually required for
acceptance (>0.7) and satisfied the requirement of the internal consistency of the
measurement items with their underlying latent variable (Cronbach, 1951; Werts et al.,
1974). The shared variance explained by the independent variables into dependent variable
for the public universities model was 36% (R2= 0.36) in both BI and PU, whereas for the
private universities it was 24% in BI (R2= 0.24) followed by 21% in PU (R2= 0.21).
According the Chin (1998) criterions suggested for the R2 values in both model were well
fitted into moderate category. Some of the communalities which are the measure of the
outer-model (measurement model) were below than the acceptable threshold (>0.5), for
instance- GS and SN in public universities, and AT, NAT and SN in private universities.
However, the average communality in both models was well above than the required values.
The GoF for the public universities was moderately acceptable (0.39 or 39%) compared to
the private universities (0.28 or 28%) which was slightly lower than public universities

250
model fit value. The cv-communality (H2) and cv-redundancy (F2) for the predictive
relevance of both models were computed using G=7 omission distance in blindfolding
method. The results reveal that both models were well above the acceptable threshold value
(H2 and F2 >0 or no negative).
Reliability and goodness of fit of the model (Organisation: Public Group)
Constructs Comp:
Reliability R2 Communality
Cronbach’s
Alpha H2 Redundancy F2
AT 0.852 0.590 0.802 0.298
BI 0.857 0.366 0.600 0.778 0.332 0.086 0.203
BU 0.871 0.254 0.629 0.806 0.377 0.096 0.134
GS 0.817 0.472 0.732 0.197
IS 0.852 0.537 0.782 0.308
NAT 0.894 0.679 0.843 0.456
PEOU 0.892 0.059 0.673 0.838 0.449 0.041 0.040
PU 0.867 0.364 0.567 0.808 0.349 0.018 0.200
RF 0.808 0.514 0.691 0.201
SE 0.954 0.912 0.905 0.589
SN 0.821 0.480 0.734 0.182
TF 0.872 0.630 0.811 0.373
Average 0.261 0.607 0.060
GoF 0.398
Reliability and goodness of fit of the model (Organisation: Private Group)
AT 0.770 0.465 0.738 0.163
BI 0.804 0.241 0.510 0.677 0.207 0.021 0.074
BU 0.856 0.110 0.601 0.786 0.338 0.003 0.033
GS 0.853 0.544 0.795 0.331
IS 0.834 0.505 0.769 0.264
NAT 0.713 0.412 0.845 0.039
PEOU 0.896 0.019 0.685 0.847 0.477 0.012 0.012
PU 0.841 0.217 0.517 0.765 0.276 0.038 0.100
RF 0.834 0.557 0.748 0.263
SE 0.924 0.859 0.851 0.435
SN 0.829 0.495 0.758 0.233
TF 0.848 0.585 0.779 0.317
Average 0.147 0.561 0.019
GoF 0.287
Note: H2 = Constructs cross-validate communality F2 = Construct cross-validate redundancy
GoF = Goodness of Fit index = 34� � ��5��65 �7889:�;<=>
Table 5. 34: Overall overview of results and GoF of moderator organisation type
Table 5.35 presents the standardised estimation path values of the relations in overall sample
and two subsample models. Results reveal that, within public universities subsample, only
two paths were different from the overall sample. For instance, TF�BU (β=0.14 or 14% and
t=2.60) and GS�PU (β=0.06 or 6% and t=0.89) were different. The highest significant path
in public universities was between PU�BI (β=0.38 or 38% and t=6.94) and lowest one was
between RF�BI (β=0.13 or 13% and t=2.17). The path results for the private universities
were also bit similar to the overall sample except few. For instance, BI�BU (β=0.08 or 8%

251
and t=0.81), IS�BU (β=0.11 or 11% and t=1.53), AT�BI (β=0.17 or 17% and t=1.5) and
SN�PEOU (β=0.13 or 13% and t=1.76) were different. The highest significant path in
private universities subsample was between PU�BI (β=0.29 or 29% and t=3.98) and lowest
one was between GS�PU (β=0.19 or 19% and t=2.9).
Differences between the paths of public and private universities subsamples were computed
using t-test and Smith-Satterwait test. It was found that paths were different in relations at
TF�BU (t=2.05 and t=2.22), and BI�BU (t=1.99 and t=2.0). For instance TF�BU was
insignificant (β=0.02 or 02% and t=0.3) in public universities subsample and was significant
(β=0.27 or 27% and t=2.94) in private universities subsample similar to the overall sample.
Contrary, BI�BU similar to the overall sample was the significant (β=0.30 or 30% and
t=3.86) into public universities subsample but was insignificant (β=0.08 or 8% and t=0.81)
into private universities subsample. Looking at the results, hypothesis H13c was partially
supported. Specifically, H13c1 was only supported and remaining three H13c2, H13c3, and
H13c4 were unsupported.
Hypothesis
Combined Dataset(n=380) Organisation Public(n=207) Organisation
Private(n=173) Parametric
test of
difference
Smith-
Satterthwait
test Path (t-value) R-
Square Path (t-value)
R-
Square Path (t-value)
R-
Square
TF -> BU 0.1435
(2.6076)**
0.126
0.0204
(0.3116)Not Sig.
0.254
0.2721
(2.9464)**
0.110
2.050 2.224
SE -> BU 0.0041
(0.0818)Not Sig. 0.0805
(1.2358)Not Sig. -0.0946
(1.2216)Not Sig. 1.477 1.730
RF -> BU -0.0141
(0.2555)Not Sig. 0.0574
(0.7228)Not Sig. -0.0938
(1.0372)Not Sig. 1.052 1.256
PU -> BU 0.0139
(0.1968)Not Sig. 0.0335
(0.3882)Not Sig. -0.037
(0.3314)Not Sig. 0.443 0.500
BI -> BU 0.1941
(3.4228)*** 0.3009
(3.8652)*** 0.0884
(0.8132)Not Sig. 1.991 2.01
GS -> BU 0.0055
(0.0866)Not Sig. -0.0643
(0.7964)Not Sig. 0.0553
(0.563)Not Sig. 0.811 0.941
IS -> BU 0.1802
(3.2638)** 0.1166
(1.539)Not Sig. 0.2495
(4.1575)*** 1.205 1.375
SN -> PU 0.2203
(3.9937)***
0.269
0.2624 (3.7911)***
0.364
0.2191 (2.9237)**
0.217
0.348 0.425
PEOU -> PU 0.281
(5.8124)*** 0.3167
(4.8173)*** 0.2153
(3.4582)*** 0.871 1.120
GS -> PU 0.1208
(2.3049)* 0.0634
(0.8979)Not Sig 0.1991
(2.9545)** 1.084 1.390
IS -> PU 0.208
(4.6002)*** 0.1585
(2.1035)* 0.2531
(3.9585)*** 0.814 0.958
TF -> BI -0.0359
(0.6647)Not Sig.
0.265
-0.0174 (0.2423)Not Sig.
0.366
0.0061 (0.0724)Not Sig.
0.241
0.180 0.212
AT -> BI 0.2439
(5.1168)*** 0.2827
(4.9172)*** 0.1762
(1.5015)Not Sig. 0.897 0.815
NAT -> BI 0.0282
(0.6458)Not Sig. 0.0709
(1.3024)Not Sig. -0.2341
(1.0168)Not Sig. 1.867 1.289
PEOU -> BI 0.0232
(0.4562)Not Sig. 0.0158
(0.209)Not Sig. -0.0143
(0.1888)Not Sig. 0.223 0.281
PU -> BI 0.3421
(7.5819)*** 0.3825
(6.9149)*** 0.2996
(3.9869)*** 0.805 0.888
RF -> BI 0.1715
(3.5596)*** 0.1328
(2.172)* 0.2265
(2.9814)** 0.835 0.960
SE -> BI -0.0124
(0.2125)Not Sig. 0.0118
(0.1426)Not Sig. -0.044
(0.4136)Not Sig. 0.366 0.414
SN -> BI 0.0252
(0.5275)Not Sig. 0.0212
(0.2948)Not Sig. -0.0294
(0.3907)Not Sig. 0.393 0.486

252
SN -> PEOU 0.1836
(4.1729)*** 0.034
0.2437 (3.6116)***
0.059
0.1373 (1.768)Not Sig.
0.019 0.870 1.034
Table 5. 35: Structural relations and path significance difference of moderator organisation type
5.6.4.2.4 Academic position
The nature of moderating construct academic position was categorical, comprising on five
categories- lecturer (n=204, 53%), assistant professor (n=134, 35%), associate professor
(n=24, 6%) and professor (n=18, 4%). Due to lower number of the respondents from
assistant professor to professor categories the sample were split into two groups- lecturer
(n=204, 53%) and higher position (n=176, 46%). The F-test showed that the two groups split
were really different from each other (F= 3.42, p<0.005). Results in table 5.36 shows that
AVE for majority of the constructs in both sub-models was higher than threshold acceptance
value (>0.5) satisfied the requirement for the convergent validity (Fornell and Larcker,
1981). The assumption of the discriminant validity examined by comparing the square-root
of the each constructs AVE’s with the inter-construct’s correlation was also satisfied (ibid).
Correlation among the construct (Academic Position: Lecturer Group)
AVE √012 AT BI BU GS IS NAT PEOU PU RF SE SN TF
AT 0.521 0.722 1.00
BI 0.534 0.730 0.34 1.00
BU 0.652 0.807 0.16 0.28 1.00
GS 0.531 0.729 0.14 0.17 0.15 1.00
IS 0.534 0.731 0.25 0.14 0.30 0.13 1.00
NAT 0.622 0.789 0.18 0.23 0.25 0.23 0.12 1.00
PEOU 0.667 0.817 0.22 0.23 0.16 0.22 0.25 0.12 1.00
PU 0.530 0.728 0.11 0.42 0.27 0.25 0.36 0.24 0.49 1.00
RF 0.543 0.737 0.24 0.27 0.16 0.30 0.22 0.17 0.09 0.26 1.00
SE 0.910 0.954 0.20 0.17 0.08 0.06 0.15 0.23 0.14 0.17 0.20 1.00
SN 0.494 0.702 0.15 0.22 0.02 0.21 0.09 0.17 0.22 0.26 0.22 0.26 1.00
TF 0.601 0.775 0.12 0.09 0.25 0.16 0.16 0.17 0.17 0.21 0.22 0.16 0.13 1.00
Correlation among the construct (Academic Position: Higher position Group)
AT 0.576 0.759 1.00
BI 0.586 0.766 0.31 1.00
BU 0.569 0.754 0.15 0.25 1.00
GS 0.497 0.705 0.18 0.22 0.06 1.00
IS 0.520 0.721 0.15 0.32 0.23 0.20 1.00
NAT 0.719 0.848 0.26 0.06 -0.02 0.18 0.07 1.00
PEOU 0.685 0.828 0.22 0.22 0.07 0.17 0.13 0.19 1.00
PU 0.561 0.749 0.13 0.39 0.05 0.30 0.23 0.00 0.29 1.00
RF 0.507 0.712 0.02 0.26 0.07 0.06 0.07 0.01 0.14 0.00 1.00
SE 0.773 0.879 0.33 0.14 0.05 0.10 0.06 0.22 0.21 0.15 -0.02 1.00
SN 0.507 0.712 0.18 0.21 0.06 0.27 0.01 0.11 0.20 0.40 0.03 0.23 1.00
TF 0.614 0.783 0.29 0.20 0.19 0.13 0.25 0.28 0.20 0.14 0.31 0.13 0.14 1.00
Table 5. 36: Inter-construct correlation and AVE for moderator academic position

253
The overall model fitting and overview for the both sub-models is presented in table 5.37.
Results suggest that both models were well fitted in terms of reliability and validity. For
instance, internal consistency measures Cronbach α for the both models was higher than the
0.7 and composite reliability was higher than 0.8. The sub-model lecturer explained highest
shared variance into dependent construct PU (R2 = 0.33 or 33%) followed by BI (R2 = 0.28
or 28%). The sub-model higher in position explained highest shared variance into dependent
variable BI (R2 = 0.28 or 28%) followed by PU (R2 =0.26 or 26%). Based on Chin (1998)
criterions both models were acceptable at moderate level. The relationship of the indicators
with their underlying latent variable was observed with communalities, which were higher
than the acceptable value (>0.5). Only, SN in sub-model lecturer, and GS in sub-model
higher in position presented slightly lower communalities. However, average computed for
both sub-models communalities indicated that indicators in both sub-models shared more
than half of the variance in their underlying constructs. The GoF computed for the both sub-
models was higher than the 0.30 or 30% and were moderately acceptable range. Finally, tests
of the predictive relevance computed using blindfolding with omission distance G=7 shows
that cv-communality (H2) and cv-redundancy (F2) were well above the acceptable range (H2
and F2 >0 or no negative).
Reliability and goodness of fit of the model (Academic Position: Lecturer Group)
Constructs Comp:
Reliability R2 Communality
Cronbach’s
Alpha H2 Redundancy F2
AT 0.812 0.521 0.766 0.202
BI 0.820 0.287 0.534 0.706 0.232 0.056 0.120
BU 0.882 0.189 0.652 0.822 0.413 0.045 0.092
GS 0.850 0.531 0.783 0.288
IS 0.851 0.534 0.785 0.301
NAT 0.868 0.622 0.815 0.365
PEOU 0.889 0.047 0.667 0.834 0.438 0.030 0.029
PU 0.848 0.330 0.530 0.775 0.299 0.021 0.160
RF 0.824 0.543 0.713 0.253
SE 0.953 0.910 0.908 0.580
SN 0.827 0.494 0.762 0.236
TF 0.857 0.601 0.804 0.332
Average 0.213 0.595 0.038
GoF 0.356
Reliability and goodness of fit of the model (Academic Position: Higher position Group)
AT 0.844 0.576 0.792 0.276
BI 0.850 0.286 0.586 0.765 0.312 0.051 0.137
BU 0.838 0.109 0.569 0.767 0.304 0.030 0.030
GS 0.827 0.497 0.745 0.256
IS 0.844 0.520 0.771 0.278
NAT 0.911 0.719 0.872 0.373
PEOU 0.896 0.040 0.685 0.848 0.473 0.027 0.026
PU 0.864 0.264 0.561 0.804 0.339 0.038 0.139
RF 0.802 0.507 0.719 0.176
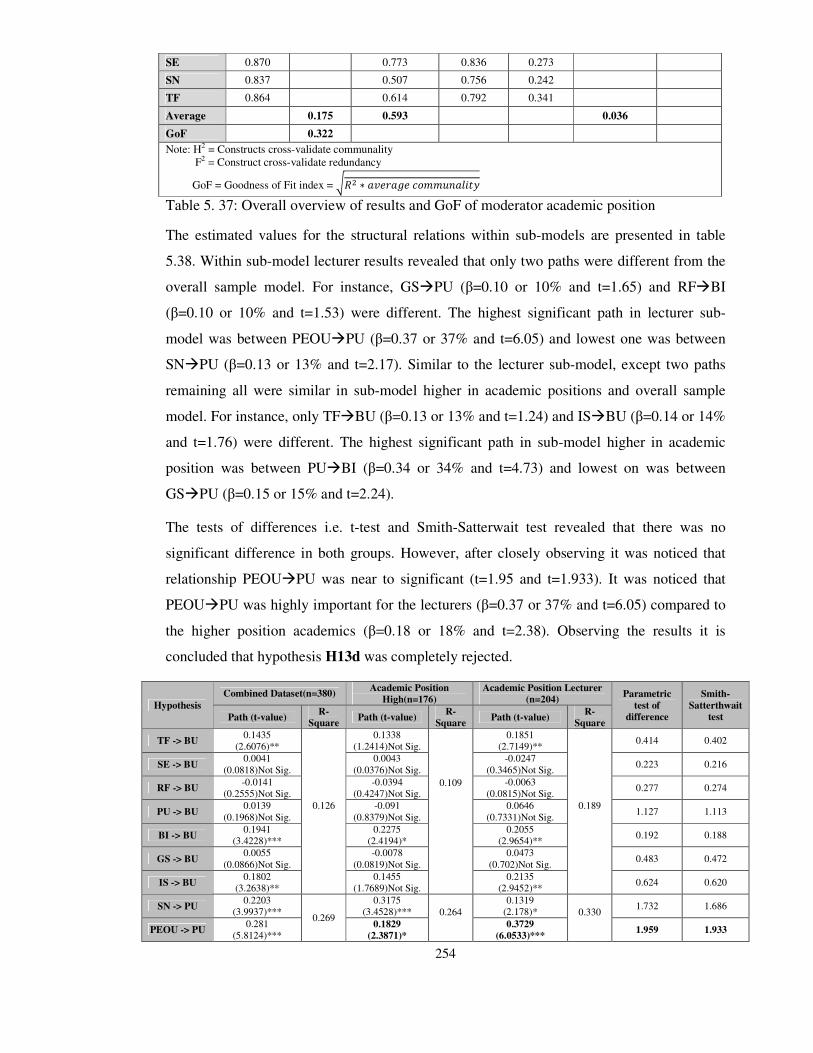
254
SE 0.870 0.773 0.836 0.273
SN 0.837 0.507 0.756 0.242
TF 0.864 0.614 0.792 0.341
Average 0.175 0.593 0.036
GoF 0.322
Note: H2 = Constructs cross-validate communality F2 = Construct cross-validate redundancy
GoF = Goodness of Fit index = 34� � ��5��65 �7889:�;<=>
Table 5. 37: Overall overview of results and GoF of moderator academic position
The estimated values for the structural relations within sub-models are presented in table
5.38. Within sub-model lecturer results revealed that only two paths were different from the
overall sample model. For instance, GS�PU (β=0.10 or 10% and t=1.65) and RF�BI
(β=0.10 or 10% and t=1.53) were different. The highest significant path in lecturer sub-
model was between PEOU�PU (β=0.37 or 37% and t=6.05) and lowest one was between
SN�PU (β=0.13 or 13% and t=2.17). Similar to the lecturer sub-model, except two paths
remaining all were similar in sub-model higher in academic positions and overall sample
model. For instance, only TF�BU (β=0.13 or 13% and t=1.24) and IS�BU (β=0.14 or 14%
and t=1.76) were different. The highest significant path in sub-model higher in academic
position was between PU�BI (β=0.34 or 34% and t=4.73) and lowest on was between
GS�PU (β=0.15 or 15% and t=2.24).
The tests of differences i.e. t-test and Smith-Satterwait test revealed that there was no
significant difference in both groups. However, after closely observing it was noticed that
relationship PEOU�PU was near to significant (t=1.95 and t=1.933). It was noticed that
PEOU�PU was highly important for the lecturers (β=0.37 or 37% and t=6.05) compared to
the higher position academics (β=0.18 or 18% and t=2.38). Observing the results it is
concluded that hypothesis H13d was completely rejected.
Hypothesis
Combined Dataset(n=380) Academic Position
High(n=176)
Academic Position Lecturer
(n=204) Parametric
test of
difference
Smith-
Satterthwait
test Path (t-value) R-
Square Path (t-value)
R-
Square Path (t-value)
R-
Square
TF -> BU 0.1435
(2.6076)**
0.126
0.1338 (1.2414)Not Sig.
0.109
0.1851 (2.7149)**
0.189
0.414 0.402
SE -> BU 0.0041
(0.0818)Not Sig. 0.0043
(0.0376)Not Sig. -0.0247
(0.3465)Not Sig. 0.223 0.216
RF -> BU -0.0141
(0.2555)Not Sig. -0.0394
(0.4247)Not Sig. -0.0063
(0.0815)Not Sig. 0.277 0.274
PU -> BU 0.0139
(0.1968)Not Sig. -0.091
(0.8379)Not Sig. 0.0646
(0.7331)Not Sig. 1.127 1.113
BI -> BU 0.1941
(3.4228)*** 0.2275
(2.4194)* 0.2055
(2.9654)** 0.192 0.188
GS -> BU 0.0055
(0.0866)Not Sig. -0.0078
(0.0819)Not Sig. 0.0473
(0.702)Not Sig. 0.483 0.472
IS -> BU 0.1802
(3.2638)** 0.1455
(1.7689)Not Sig. 0.2135
(2.9452)** 0.624 0.620
SN -> PU 0.2203
(3.9937)*** 0.269
0.3175 (3.4528)***
0.264
0.1319 (2.178)* 0.330
1.732 1.686
PEOU -> PU 0.281
(5.8124)*** 0.1829
(2.3871)* 0.3729
(6.0533)*** 1.959 1.933

255
GS -> PU 0.1208
(2.3049)* 0.1512
(2.2454)* 0.1063
(1.6576)Not Sig. 0.483 0.483
IS -> PU 0.208
(4.6002)*** 0.1694
(2.2175)* 0.245
(4.3813)*** 0.815 0.799
TF -> BI -0.0359
(0.6647)Not Sig.
0.265
0.0017 (0.0238)Not Sig.
0.286
-0.0597 (0.8144)Not Sig.
0.287
0.590 0.592
AT -> BI 0.2439
(5.1168)*** 0.2498
(3.6755)*** 0.2583
(4.0463)*** 0.091 0.091
NAT -> BI 0.0282
(0.6458)Not Sig. -0.013
(0.2142)Not Sig. 0.0791
(1.4028)Not Sig. 1.113 1.110
PEOU -> BI 0.0232
(0.4562)Not Sig. 0.0219
(0.3039)Not Sig. -0.0207
(0.315)Not Sig. 0.439 0.437
PU -> BI 0.3421
(7.5819)*** 0.3451
(4.7347)*** 0.3504
(5.3245)*** 0.054 0.054
RF -> BI 0.1715
(3.5596)*** 0.2533
(2.9996)** 0.1045
(1.5311)Not Sig. 1.388 1.370
SE -> BI -0.0124
(0.2125)Not Sig. 0.0055
(0.0534)Not Sig. 0.0116
(0.157)Not Sig. 0.049 0.048
SN -> BI 0.0252
(0.5275)Not Sig. 0.0145
(0.1829)Not Sig. 0.0642
(0.9603)Not Sig. 0.484 0.479
SN -> PEOU 0.1836
(4.1729)*** 0.034
0.1989 (2.9976)**
0.040
0.2157 (3.2595)**
0.047
0.179 0.179
Table 5. 38: Structural relations and path significance difference of moderator academic position.
5.6.4.2.5 Educational level
Like the other moderator the nature of educational level moderator was also categorical. The
first category was respondents (academics) having bachelor degree (n=39, 10%), second was
respondents having masters degree (n=290, 76%) and finally third one was the respondents
having doctorate degree (n=51, 13%). There was visible difference between the respondents
having master’s degree and others. It was possible to combine the groups having bachelor
degree and doctorate degree to see the difference with master’s degree but it was illogical.
Due to totally different level of the educational level between bachelors and doctorate
respondents they were not combined together. Thus, the impact of moderator educational
level was observed into three groups rather than two. No refinement was made into variable
therefore there was no need to compute the F-test to see the differences.
Table 5.39 presents the convergent validity and discriminant validity for all the three models.
Even though sample was very low in bachelor and doctorate sub-models but still AVE
computed for all the three models was higher than the acceptable level (>0.5). Exceptionally,
within sub-model bachelor AVE was bit lower in BI, GS and IS, and was extremely lower in
construct NAT. Within sub-model masters except SN all others constructs AVE was well
above the threshold value. Finally within sub-model doctorate IS was bit lower and GS was
extremely lower than the required values. The overall AVE’s average results suggest that all
three models produced acceptable convergent validity between the measurement items and
underlying latent variables. The discriminant validity was assessed by observing the square-
root of the AVE with inter-construct correlations (Fornell & Larcker, 1981). In all three
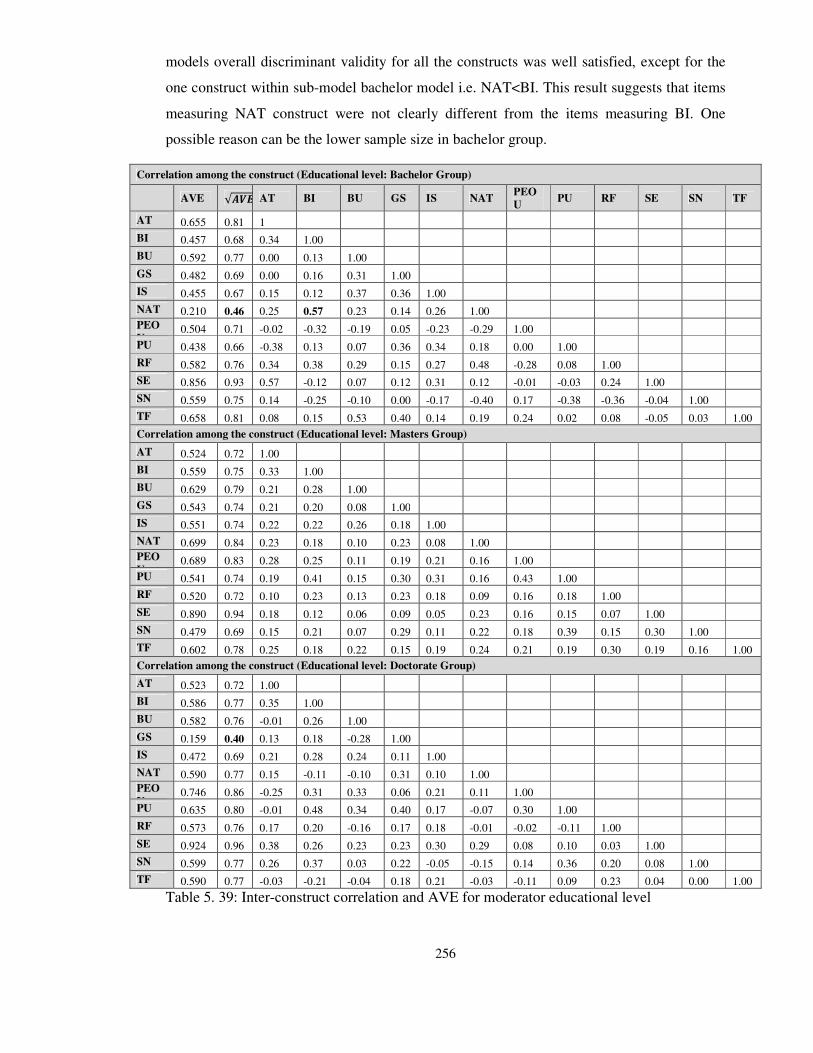
256
models overall discriminant validity for all the constructs was well satisfied, except for the
one construct within sub-model bachelor model i.e. NAT<BI. This result suggests that items
measuring NAT construct were not clearly different from the items measuring BI. One
possible reason can be the lower sample size in bachelor group.
Correlation among the construct (Educational level: Bachelor Group)
AVE √012 AT BI BU GS IS NAT
PEO
U PU RF SE SN TF
AT 0.655 0.81 1
BI 0.457 0.68 0.34 1.00
BU 0.592 0.77 0.00 0.13 1.00
GS 0.482 0.69 0.00 0.16 0.31 1.00
IS 0.455 0.67 0.15 0.12 0.37 0.36 1.00
NAT 0.210 0.46 0.25 0.57 0.23 0.14 0.26 1.00
PEO
U 0.504 0.71 -0.02 -0.32 -0.19 0.05 -0.23 -0.29 1.00
PU 0.438 0.66 -0.38 0.13 0.07 0.36 0.34 0.18 0.00 1.00
RF 0.582 0.76 0.34 0.38 0.29 0.15 0.27 0.48 -0.28 0.08 1.00
SE 0.856 0.93 0.57 -0.12 0.07 0.12 0.31 0.12 -0.01 -0.03 0.24 1.00
SN 0.559 0.75 0.14 -0.25 -0.10 0.00 -0.17 -0.40 0.17 -0.38 -0.36 -0.04 1.00
TF 0.658 0.81 0.08 0.15 0.53 0.40 0.14 0.19 0.24 0.02 0.08 -0.05 0.03 1.00
Correlation among the construct (Educational level: Masters Group)
AT 0.524 0.72 1.00
BI 0.559 0.75 0.33 1.00
BU 0.629 0.79 0.21 0.28 1.00
GS 0.543 0.74 0.21 0.20 0.08 1.00
IS 0.551 0.74 0.22 0.22 0.26 0.18 1.00
NAT 0.699 0.84 0.23 0.18 0.10 0.23 0.08 1.00
PEO
U 0.689 0.83 0.28 0.25 0.11 0.19 0.21 0.16 1.00
PU 0.541 0.74 0.19 0.41 0.15 0.30 0.31 0.16 0.43 1.00
RF 0.520 0.72 0.10 0.23 0.13 0.23 0.18 0.09 0.16 0.18 1.00
SE 0.890 0.94 0.18 0.12 0.06 0.09 0.05 0.23 0.16 0.15 0.07 1.00
SN 0.479 0.69 0.15 0.21 0.07 0.29 0.11 0.22 0.18 0.39 0.15 0.30 1.00
TF 0.602 0.78 0.25 0.18 0.22 0.15 0.19 0.24 0.21 0.19 0.30 0.19 0.16 1.00
Correlation among the construct (Educational level: Doctorate Group)
AT 0.523 0.72 1.00
BI 0.586 0.77 0.35 1.00
BU 0.582 0.76 -0.01 0.26 1.00
GS 0.159 0.40 0.13 0.18 -0.28 1.00
IS 0.472 0.69 0.21 0.28 0.24 0.11 1.00
NAT 0.590 0.77 0.15 -0.11 -0.10 0.31 0.10 1.00
PEO
U 0.746 0.86 -0.25 0.31 0.33 0.06 0.21 0.11 1.00
PU 0.635 0.80 -0.01 0.48 0.34 0.40 0.17 -0.07 0.30 1.00
RF 0.573 0.76 0.17 0.20 -0.16 0.17 0.18 -0.01 -0.02 -0.11 1.00
SE 0.924 0.96 0.38 0.26 0.23 0.23 0.30 0.29 0.08 0.10 0.03 1.00
SN 0.599 0.77 0.26 0.37 0.03 0.22 -0.05 -0.15 0.14 0.36 0.20 0.08 1.00
TF 0.590 0.77 -0.03 -0.21 -0.04 0.18 0.21 -0.03 -0.11 0.09 0.23 0.04 0.00 1.00
Table 5. 39: Inter-construct correlation and AVE for moderator educational level
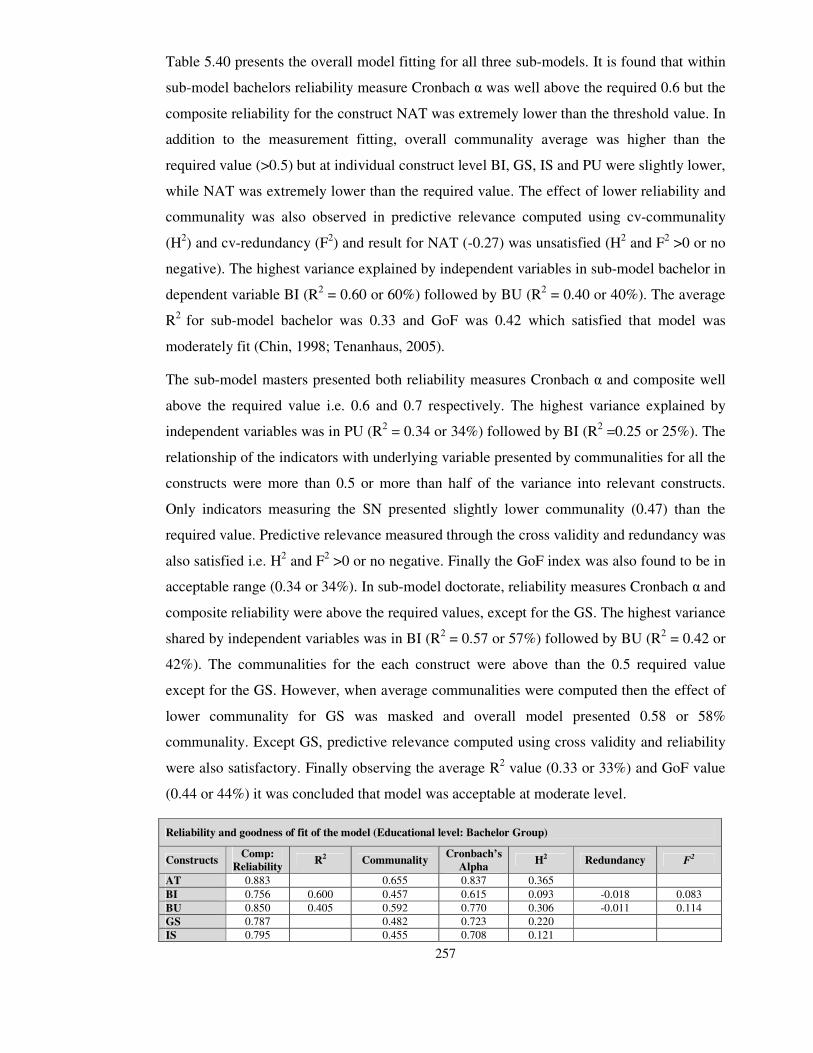
257
Table 5.40 presents the overall model fitting for all three sub-models. It is found that within
sub-model bachelors reliability measure Cronbach α was well above the required 0.6 but the
composite reliability for the construct NAT was extremely lower than the threshold value. In
addition to the measurement fitting, overall communality average was higher than the
required value (>0.5) but at individual construct level BI, GS, IS and PU were slightly lower,
while NAT was extremely lower than the required value. The effect of lower reliability and
communality was also observed in predictive relevance computed using cv-communality
(H2) and cv-redundancy (F2) and result for NAT (-0.27) was unsatisfied (H2 and F2 >0 or no
negative). The highest variance explained by independent variables in sub-model bachelor in
dependent variable BI (R2 = 0.60 or 60%) followed by BU (R2 = 0.40 or 40%). The average
R2 for sub-model bachelor was 0.33 and GoF was 0.42 which satisfied that model was
moderately fit (Chin, 1998; Tenanhaus, 2005).
The sub-model masters presented both reliability measures Cronbach α and composite well
above the required value i.e. 0.6 and 0.7 respectively. The highest variance explained by
independent variables was in PU (R2 = 0.34 or 34%) followed by BI (R2 =0.25 or 25%). The
relationship of the indicators with underlying variable presented by communalities for all the
constructs were more than 0.5 or more than half of the variance into relevant constructs.
Only indicators measuring the SN presented slightly lower communality (0.47) than the
required value. Predictive relevance measured through the cross validity and redundancy was
also satisfied i.e. H2 and F2 >0 or no negative. Finally the GoF index was also found to be in
acceptable range (0.34 or 34%). In sub-model doctorate, reliability measures Cronbach α and
composite reliability were above the required values, except for the GS. The highest variance
shared by independent variables was in BI (R2 = 0.57 or 57%) followed by BU (R2 = 0.42 or
42%). The communalities for the each construct were above than the 0.5 required value
except for the GS. However, when average communalities were computed then the effect of
lower communality for GS was masked and overall model presented 0.58 or 58%
communality. Except GS, predictive relevance computed using cross validity and reliability
were also satisfactory. Finally observing the average R2 value (0.33 or 33%) and GoF value
(0.44 or 44%) it was concluded that model was acceptable at moderate level.
Reliability and goodness of fit of the model (Educational level: Bachelor Group)
Constructs Comp:
Reliability R2 Communality
Cronbach’s
Alpha H2 Redundancy F2
AT 0.883 0.655 0.837 0.365
BI 0.756 0.600 0.457 0.615 0.093 -0.018 0.083
BU 0.850 0.405 0.592 0.770 0.306 -0.011 0.114
GS 0.787 0.482 0.723 0.220
IS 0.795 0.455 0.708 0.121

258
NAT 0.105 0.210 0.800 -0.270
PEOU 0.754 0.030 0.504 0.632 0.230 0.018 0.008
PU 0.786 0.310 0.438 0.689 0.111 0.053 0.051
RF 0.847 0.582 0.762 0.311
SE 0.923 0.856 0.833 0.332
SN 0.862 0.559 0.804 0.179
TF 0.882 0.658 0.827 0.438
Average 0.336 0.537 0.010
GoF 0.425
Reliability and goodness of fit of the model (Educational level: Masters Group)
AT 0.813 0.524 0.768 0.214
BI 0.835 0.254 0.559 0.736 0.271 0.054 0.126
BU 0.871 0.143 0.629 0.805 0.386 0.044 0.071
GS 0.855 0.543 0.790 0.316
IS 0.859 0.551 0.796 0.328
NAT 0.903 0.699 0.858 0.483
PEOU 0.898 0.034 0.689 0.848 0.477 0.023 0.023
PU 0.854 0.342 0.541 0.786 0.313 0.030 0.170
RF 0.813 0.520 0.702 0.209
SE 0.942 0.890 0.878 0.547
SN 0.821 0.479 0.733 0.204
TF 0.858 0.602 0.794 0.335
Average 0.193 0.602 0.038
GoF 0.341
Reliability and goodness of fit of the model (Educational level: Doctorate Group)
AT 0.813 0.523 0.735 0.148
BI 0.850 0.577 0.586 0.765 0.300 0.067 0.198
BU 0.845 0.427 0.582 0.757 0.304 0.004 0.120
GS 0.145 0.159 0.612 -0.445
IS 0.814 0.472 0.716 0.178
NAT 0.846 0.590 0.801 0.198
PEOU 0.921 0.020 0.746 0.888 0.564 0.012 0.005
PU 0.896 0.306 0.635 0.855 0.447 0.099 0.181
RF 0.841 0.573 0.750 0.299
SE 0.961 0.924 0.918 0.637
SN 0.881 0.599 0.838 0.322
TF 0.847 0.590 0.797 0.340
Average 0.332 0.582 0.045
GoF 0.440
Note: H2 = Constructs cross-validate communality F2 = Construct cross-validate redundancy
GoF = Goodness of Fit index = 34� � ��5��65 �7889:�;<=>
Table 5. 40: Overall overview of results and GoF of moderator educational level
After observing the model fitting of the all three models, next step was to see the estimated
path differences among three models. Table 5.41 shows that seven of the paths in sub-model
bachelor were different from the overall sample model. For instance BI�BU (β=-0.06 or -
6% and t=0.29), PEOU�PU (β=0.09 or 9% and t=0.43), IS�PU (β=0.19 or 19% and
t=0.71), PU�BI (β=0.26 or 26% and t=1.19), RF�BI (β=0.007 or 00% and t=0.04),
SE�BI (β=-0.53 or 53% and t=2.06), and SN�PEOU (β=0.17 or 17% and t=0.79) were
different. The highest significant path was between AT�BI (β=0.66 or 66% and t=2.00) and
lowest one was between IS�BU (β=0.27 or 27% and t=0.77). For sub-model masters group
results were similar like the overall sample group. One possible reason for the similar
significance of result can be large sample size in sub-model master derived from the overall
sample model. The highest significant path was between PU�BI (β=0.31 or 31% and
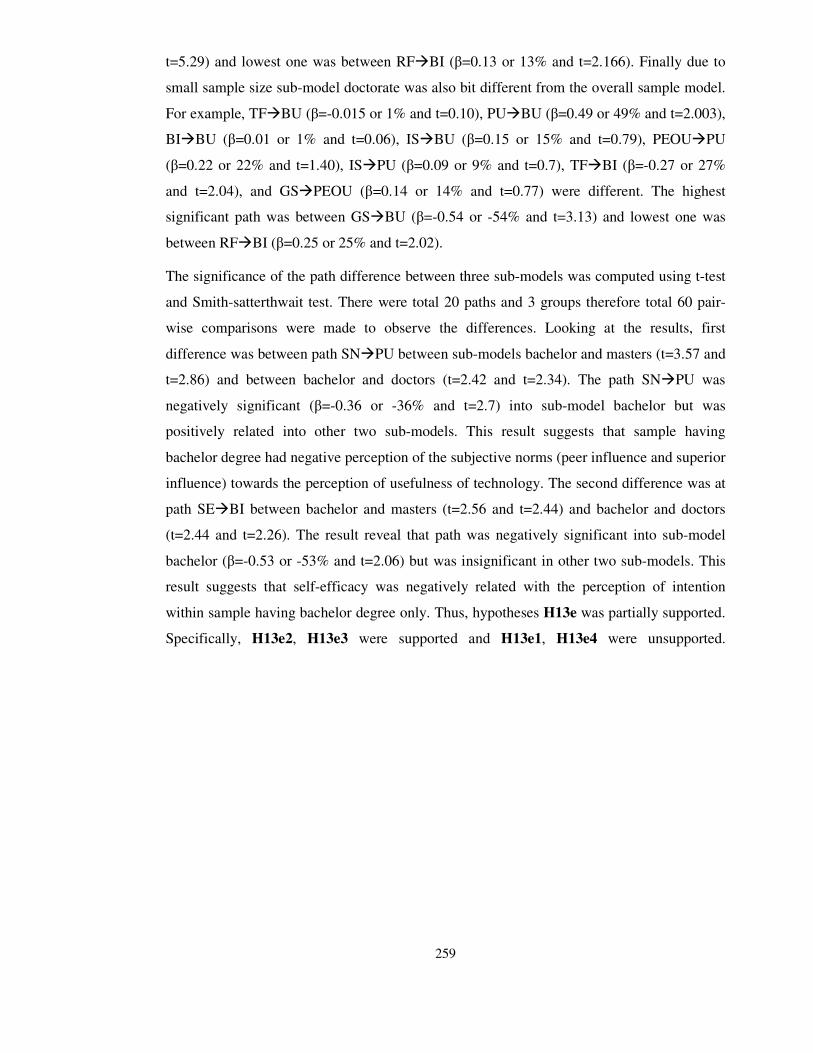
259
t=5.29) and lowest one was between RF�BI (β=0.13 or 13% and t=2.166). Finally due to
small sample size sub-model doctorate was also bit different from the overall sample model.
For example, TF�BU (β=-0.015 or 1% and t=0.10), PU�BU (β=0.49 or 49% and t=2.003),
BI�BU (β=0.01 or 1% and t=0.06), IS�BU (β=0.15 or 15% and t=0.79), PEOU�PU
(β=0.22 or 22% and t=1.40), IS�PU (β=0.09 or 9% and t=0.7), TF�BI (β=-0.27 or 27%
and t=2.04), and GS�PEOU (β=0.14 or 14% and t=0.77) were different. The highest
significant path was between GS�BU (β=-0.54 or -54% and t=3.13) and lowest one was
between RF�BI (β=0.25 or 25% and t=2.02).
The significance of the path difference between three sub-models was computed using t-test
and Smith-satterthwait test. There were total 20 paths and 3 groups therefore total 60 pair-
wise comparisons were made to observe the differences. Looking at the results, first
difference was between path SN�PU between sub-models bachelor and masters (t=3.57 and
t=2.86) and between bachelor and doctors (t=2.42 and t=2.34). The path SN�PU was
negatively significant (β=-0.36 or -36% and t=2.7) into sub-model bachelor but was
positively related into other two sub-models. This result suggests that sample having
bachelor degree had negative perception of the subjective norms (peer influence and superior
influence) towards the perception of usefulness of technology. The second difference was at
path SE�BI between bachelor and masters (t=2.56 and t=2.44) and bachelor and doctors
(t=2.44 and t=2.26). The result reveal that path was negatively significant into sub-model
bachelor (β=-0.53 or -53% and t=2.06) but was insignificant in other two sub-models. This
result suggests that self-efficacy was negatively related with the perception of intention
within sample having bachelor degree only. Thus, hypotheses H13e was partially supported.
Specifically, H13e2, H13e3 were supported and H13e1, H13e4 were unsupported.

260
Hypothesis
Combined Dataset(n=380) Education level Bachelor
(n=39)
Educational level
Masters(n=290)
Educational level
Doctor(n=51) Parametric test of difference Smith-Satterthwait test
Path (t-value) R-
Square Path (t-value)
R-
Square Path (t-value)
R-
Square Path (t-value)
R-
Square
Bachelor
vs. Masters
Bachelor
vs.
Doctorate
Masters
vs.
Doctorate
Bachelor
vs.
Masters
Bachelor
vs.
Doctorate
Masters
vs.
Doctorate
TF -> BU 0.1435
(2.6076)**
0.126
0.4727
(2.0302)*
0.405
0.1513
(2.678)**
0.143
-0.0151
(0.1089)Not Sig.
0.427
1.835 1.915 1.138 1.342 1.801 1.113
SE -> BU 0.0041
(0.0818)Not Sig.
-0.0539
(0.2809)Not Sig.
-0.0033
(0.0548)Not Sig.
0.252
(1.6591)Not Sig. 0.287 1.282 1.644 0.252 1.251 1.565
RF -> BU -0.0141
(0.2555)Not Sig.
0.2171
(1.1914)Not Sig.
0.0033
(0.0483)Not Sig.
-0.0539
(0.3838)Not Sig. 1.086 1.211 0.332 1.099 1.177 0.366
PU -> BU 0.0139
(0.1968)Not Sig.
-0.0552
(0.1968)Not Sig.
-0.0273
(0.4009)Not Sig.
0.4981
(2.0039)* 0.132 1.491 1.737 0.097 1.476 1.039
BI -> BU 0.1941
(3.4228)***
-0.0636
(0.2962)Not Sig.
0.2243
(3.4651)***
0.0135
(0.0693)Not Sig. 1.496 0.268 1.213 1.284 0.266 1.028
GS -> BU 0.0055
(0.0866)Not Sig.
0.0203
(0.1257)Not Sig.
-0.0165
(0.2364)Not Sig.
-0.5429
(3.1328)** 0.185 1.004 1.035 0.209 1.114 1.087
IS -> BU 0.1802
(3.2638)**
0.2772
(2.7736)**
0.1967
(3.3036)**
0.153
(0.7944)Not Sig. 0.389 0.328 0.269 0.222 0.305 0.217
SN -> PU 0.2203
(3.9937)***
0.269
-0.3689
(2.7001)**.
0.310
0.2763
(4.6209)***
0.342
0.2609
(1.9816)*
0.306
3.572 2.426 0.098 2.866 2.342 0.091
PEOU ->
PU
0.281
(5.8124)***
0.0917
(0.4319)Not Sig.
0.3196
(5.8617)***
0.22
(1.4061)Not Sig. 1.365 0.504 0.687 1.040 0.487 0.601
GS -> PU 0.1208
(2.3049)*
0.2886
(1.9958)*
0.119
(2.4319)*
0.3216
(2.0842)** 1.168 0.091 1.199 1.010 0.098 0.674
IS -> PU 0.208
(4.6002)***
0.1916
(0.7179)Not Sig.
0.1928
(3.7386)***
0.0988
(0.7012)Not Sig. 0.007 0.331 0.691 0.004 0.308 0.626
TF -> BI -0.0359
(0.6647)Not Sig.
0.265
0.0642
(0.3672)Not Sig.
0.600
0.0042
(0.0582)Not Sig.
0.254
-0.2764
(2.0438)*
0.577
0.289 1.584 1.545 0.317 1.541 1.829
AT -> BI 0.2439
(5.1168)***
0.6695
(2.0086)*
0.2311
(4.6056)***
0.354
(1.996)**. 1.881 0.847 0.833 1.301 0.801 0.570
NAT -> BI 0.0282
(0.6458)Not Sig.
0.2983
(1.1566)Not Sig.
0.0547
(1.1278)Not Sig.
-0.2041
(1.1918)Not Sig. 1.510 1.703 1.911 0.928 1.623 1.454
PEOU -> BI 0.0232
(0.4562)Not Sig.
-0.2157
(1.0837)Not Sig.
0.015
(0.2789)Not Sig.
0.2509
(1.9624)Not Sig. 1.417 1.078 1.704 1.119 1.972 1.701
PU -> BI 0.3421 0.2684 0.319 0.4449 0.276 0.784 0.841 0.217 0.716 1.069

261
(7.5819)*** (1.1933)Not Sig. (5.2929)*** (4.3985)***
RF -> BI 0.1715
(3.5596)***
0.0078
(0.0406)Not Sig.
0.1345
(2.1662)*
0.2586
(2.0282)* 0.693 1.142 0.790 0.628 1.089 0.875
SE -> BI -0.0124
(0.2125)Not Sig.
-0.5315
(2.0655)*
0.0025
(0.0372)Not Sig.
0.124
(0.9271)Not Sig. 2.567 2.441 0.743 1.988 2.261 0.844
SN -> BI 0.0252
(0.5275)Not Sig.
-0.1057
(0.5265)Not Sig.
0.0137
(0.2118)Not Sig.
-0.013
(0.0904)Not Sig. 0.626 0.390 0.161 0.566 0.376 0.169
SN ->
PEOU
0.1836
(4.1729)*** 0.034
0.1717
(0.7954)Not Sig.
0.030
0.1848
(3.205)**
0.034
0.1401
(0.7781)Not Sig.
0.020
0.075 0.114 0.286 0.059 0.112 0.236
Table 5. 41: Structural relations and path significance difference of moderator educational level.
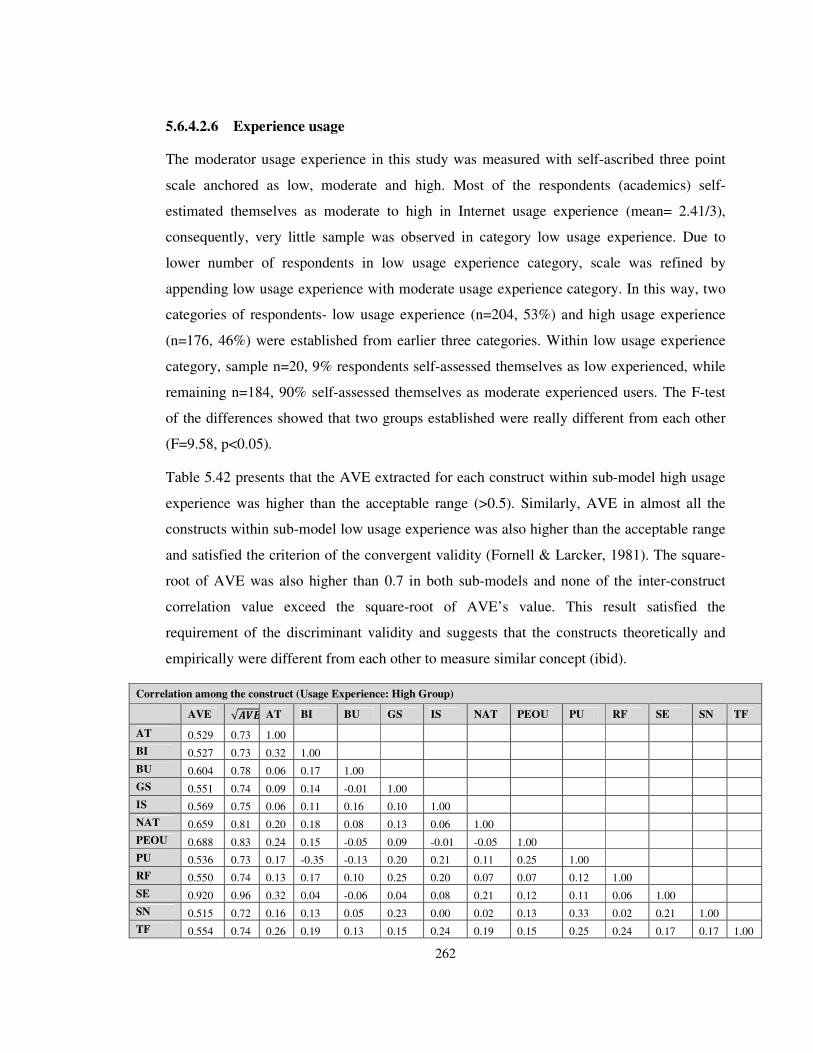
262
5.6.4.2.6 Experience usage
The moderator usage experience in this study was measured with self-ascribed three point
scale anchored as low, moderate and high. Most of the respondents (academics) self-
estimated themselves as moderate to high in Internet usage experience (mean= 2.41/3),
consequently, very little sample was observed in category low usage experience. Due to
lower number of respondents in low usage experience category, scale was refined by
appending low usage experience with moderate usage experience category. In this way, two
categories of respondents- low usage experience (n=204, 53%) and high usage experience
(n=176, 46%) were established from earlier three categories. Within low usage experience
category, sample n=20, 9% respondents self-assessed themselves as low experienced, while
remaining n=184, 90% self-assessed themselves as moderate experienced users. The F-test
of the differences showed that two groups established were really different from each other
(F=9.58, p<0.05).
Table 5.42 presents that the AVE extracted for each construct within sub-model high usage
experience was higher than the acceptable range (>0.5). Similarly, AVE in almost all the
constructs within sub-model low usage experience was also higher than the acceptable range
and satisfied the criterion of the convergent validity (Fornell & Larcker, 1981). The square-
root of AVE was also higher than 0.7 in both sub-models and none of the inter-construct
correlation value exceed the square-root of AVE’s value. This result satisfied the
requirement of the discriminant validity and suggests that the constructs theoretically and
empirically were different from each other to measure similar concept (ibid).
Correlation among the construct (Usage Experience: High Group)
AVE √012 AT BI BU GS IS NAT PEOU PU RF SE SN TF
AT 0.529 0.73 1.00
BI 0.527 0.73 0.32 1.00
BU 0.604 0.78 0.06 0.17 1.00
GS 0.551 0.74 0.09 0.14 -0.01 1.00
IS 0.569 0.75 0.06 0.11 0.16 0.10 1.00
NAT 0.659 0.81 0.20 0.18 0.08 0.13 0.06 1.00
PEOU 0.688 0.83 0.24 0.15 -0.05 0.09 -0.01 -0.05 1.00
PU 0.536 0.73 0.17 -0.35 -0.13 0.20 0.21 0.11 0.25 1.00
RF 0.550 0.74 0.13 0.17 0.10 0.25 0.20 0.07 0.07 0.12 1.00
SE 0.920 0.96 0.32 0.04 -0.06 0.04 0.08 0.21 0.12 0.11 0.06 1.00
SN 0.515 0.72 0.16 0.13 0.05 0.23 0.00 0.02 0.13 0.33 0.02 0.21 1.00
TF 0.554 0.74 0.26 0.19 0.13 0.15 0.24 0.19 0.15 0.25 0.24 0.17 0.17 1.00
263
Correlation among the construct (Usage Experience: Low Group)
AT 0.57 0.75 1.00
BI 0.57 0.75 0.30 1.00
BU 0.61 0.78 0.18 0.32 1.00
GS 0.49 0.70 0.23 0.24 0.20 1.00
IS 0.49 0.70 0.32 0.28 0.34 0.22 1.00
NAT 0.63 0.79 0.21 0.09 0.06 0.29 0.07 1.00
PEOU 0.66 0.82 0.15 0.26 0.23 0.31 0.32 0.24 1.00
PU 0.55 0.74 0.05 0.45 0.22 0.33 0.36 0.09 0.51 1.00
RF 0.51 0.72 0.15 0.33 0.13 0.13 0.19 0.13 0.16 0.16 1.00
SE 0.87 0.93 0.18 0.17 0.13 0.10 0.11 0.21 0.17 0.16 0.12 1.00
SN 0.49 0.70 0.17 0.29 0.08 0.24 0.13 0.32 0.27 0.33 0.25 0.29 1.00
TF 0.60 0.77 0.15 0.12 0.29 0.18 0.16 0.19 0.22 0.11 0.28 0.09 0.14 1.00
Table 5. 42: Inter-construct correlation and AVE for moderator usage experience
Table 5.43 shows that Cronbach α and composite reliability were respectively above than 0.6
and 0.8 and satisfied the reliability conditions. Average R2 explained for the dependent
constructs in sub-model high usage experience was lower than the sub-model low usage
experience. Individually, within sub-model high in usage experience highest R2 was
explained into dependent variable BI (R2=0.21 or 21%) followed by PU (R2=0.20 or 20%),
whereas within sub-model low on usage experience highest R2 was explained into PU
(R2=0.35 or 35%) followed by BI (R2=0.33 or 33%). The average R2 for both the model was
higher than 0.19, which suggest that both models were acceptable at moderate level (see
Chin, 1998). The communalities for the both sub-models were higher than 0.5 and satisfied
the criterion for the convergent validity (Fornell and Larcker, 1981). The predictive
relevance assessed using blindfolding method with omission distance G=7, shows that cv-
communality (H2) and cv-redundancy (F2) values were above than the required criterion (H2
and F2 >0 or no negative). Finally, the combined measurement items validity (average
communality) and structural path’s explanatory power (average R2) were computed using
GoF. Results shows that GoF for both sub-models both were in acceptable range,
specifically, within sub-model high usage experience GoF was 0.27(27%) and for sub-model
low usage experience GoF was 0.38(38%).
Reliability and goodness of fit of the model (Usage Experience: High group)
Constructs Comp:
Reliability R2 Communality
Cronbach’s
Alpha H2 Redundancy F2
AT 0.817 0.529 0.768 0.207
BI 0.815 0.217 0.527 0.697 0.231 0.051 0.087
BU 0.857 0.068 0.604 0.803 0.297 0.011 0.005
GS 0.856 0.551 0.791 0.342
IS 0.868 0.569 0.812 0.348
NAT 0.885 0.659 0.839 0.435
PEOU 0.896 0.016 0.688 0.850 0.500 0.010 0.012
PU 0.852 0.205 0.536 0.784 0.303 0.016 0.092
RF 0.829 0.550 0.753 0.253
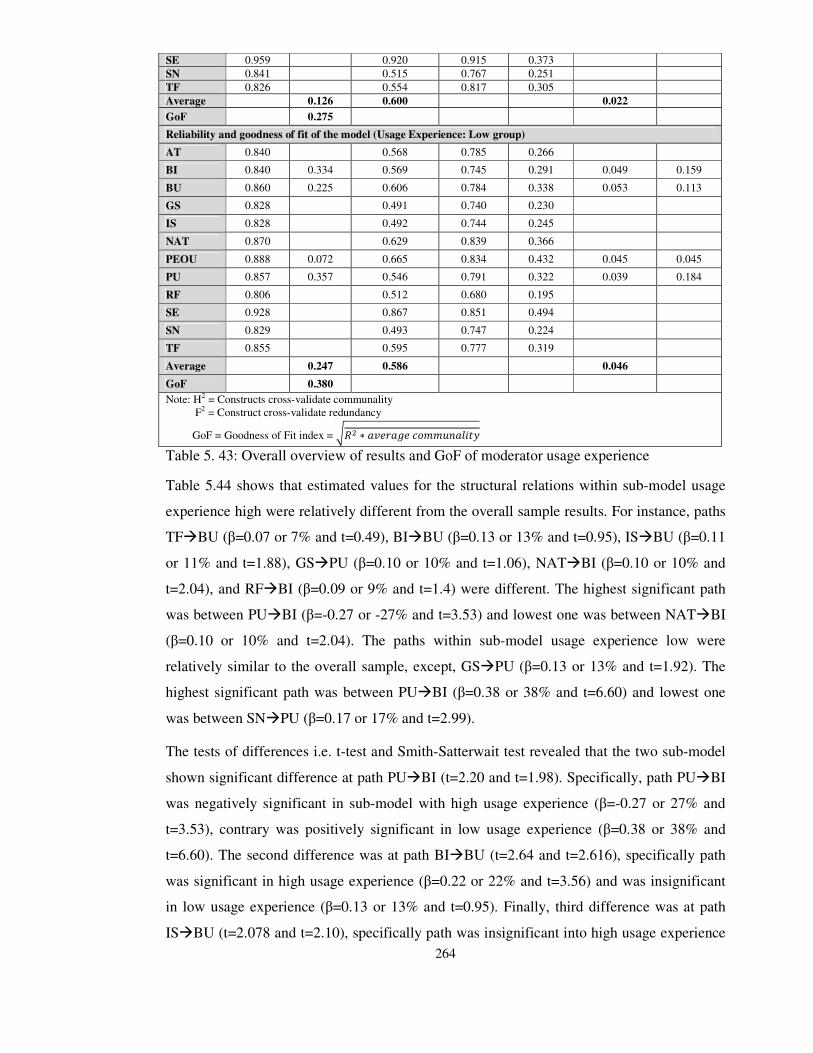
264
SE 0.959 0.920 0.915 0.373
SN 0.841 0.515 0.767 0.251
TF 0.826 0.554 0.817 0.305
Average 0.126 0.600 0.022
GoF 0.275
Reliability and goodness of fit of the model (Usage Experience: Low group)
AT 0.840 0.568 0.785 0.266
BI 0.840 0.334 0.569 0.745 0.291 0.049 0.159
BU 0.860 0.225 0.606 0.784 0.338 0.053 0.113
GS 0.828 0.491 0.740 0.230
IS 0.828 0.492 0.744 0.245
NAT 0.870 0.629 0.839 0.366
PEOU 0.888 0.072 0.665 0.834 0.432 0.045 0.045
PU 0.857 0.357 0.546 0.791 0.322 0.039 0.184
RF 0.806 0.512 0.680 0.195
SE 0.928 0.867 0.851 0.494
SN 0.829 0.493 0.747 0.224
TF 0.855 0.595 0.777 0.319
Average 0.247 0.586 0.046
GoF 0.380
Note: H2 = Constructs cross-validate communality F2 = Construct cross-validate redundancy
GoF = Goodness of Fit index = 34� � ��5��65 �7889:�;<=>
Table 5. 43: Overall overview of results and GoF of moderator usage experience
Table 5.44 shows that estimated values for the structural relations within sub-model usage
experience high were relatively different from the overall sample results. For instance, paths
TF�BU (β=0.07 or 7% and t=0.49), BI�BU (β=0.13 or 13% and t=0.95), IS�BU (β=0.11
or 11% and t=1.88), GS�PU (β=0.10 or 10% and t=1.06), NAT�BI (β=0.10 or 10% and
t=2.04), and RF�BI (β=0.09 or 9% and t=1.4) were different. The highest significant path
was between PU�BI (β=-0.27 or -27% and t=3.53) and lowest one was between NAT�BI
(β=0.10 or 10% and t=2.04). The paths within sub-model usage experience low were
relatively similar to the overall sample, except, GS�PU (β=0.13 or 13% and t=1.92). The
highest significant path was between PU�BI (β=0.38 or 38% and t=6.60) and lowest one
was between SN�PU (β=0.17 or 17% and t=2.99).
The tests of differences i.e. t-test and Smith-Satterwait test revealed that the two sub-model
shown significant difference at path PU�BI (t=2.20 and t=1.98). Specifically, path PU�BI
was negatively significant in sub-model with high usage experience (β=-0.27 or 27% and
t=3.53), contrary was positively significant in low usage experience (β=0.38 or 38% and
t=6.60). The second difference was at path BI�BU (t=2.64 and t=2.616), specifically path
was significant in high usage experience (β=0.22 or 22% and t=3.56) and was insignificant
in low usage experience (β=0.13 or 13% and t=0.95). Finally, third difference was at path
IS�BU (t=2.078 and t=2.10), specifically path was insignificant into high usage experience

265
(β=0.117 or 11% and t=1.88) and was significant into low usage experience users (β=0.23 or
23% and t=2.81). Observing the results of differences it is found that hypothesis H14a was
partially accepted, specifically, H14a1 and H14a3 were supported and H14a2 and H14a4
were unsupported.
Hypothesis
Combined Dataset(n=380) Usage Experience
High(n=176)
Usage Experience
Low(n=204) Parametric
test of
difference
Smith-
Satterthwait
test Path (t-value) R-
Square Path (t-value)
R-
Square Path (t-value)
R-
Square
TF -> BU 0.1435
(2.6076)**
0.126
0.0709 (0.4957)Not Sig.
0.068
0.2336 (3.4325)***
0.225
1.075 1.027
SE -> BU 0.0041
(0.0818)Not Sig. -0.0891
(0.8318)Not Sig. 0.0491
(0.6799)Not Sig. 1.098 1.070
RF -> BU 0.0141
(0.2555)Not Sig. -0.0489
(0.5372)Not Sig. 0.0634
(0.8383)Not Sig. 0.960 0.949
PU -> BU 0.0139
(0.1968)Not Sig. -0.0573
(0.5476)Not Sig. 0.0091
(0.1052)Not Sig. 0.495 0.489
BI -> BU 0.1941
(3.4228)*** 0.2227
(3.5617)***
0.1305
(0.9592)Not Sig. 2.646 2.616
GS -> BU 0.0055
(0.0866)Not Sig. -0.0716
(0.7085)Not Sig. 0.0618
(0.7186)Not Sig. 1.015 1.006
IS -> BU 0.1802
(3.2638)** 0.1177
(1.889)Not Sig. 0.2315
(2.8141)** 2.078 2.102
SN -> PU 0.2203
(3.9937)***
0.269
0.2782 (3.3781)**
0.205
0.1778 (2.9925)**
0.357
1.010 0.989
PEOU -> PU 0.281
(5.8124)*** 0.2059
(2.9824)** 0.3568
(5.1143)*** 1.532 1.537
GS -> PU 0.1208
(2.3049)* 0.1007
(1.0686)Not Sig. 0.1373
(1.9233)Not Sig. 0.315 0.310
IS -> PU 0.208
(4.6002)*** 0.2006
(3.1724)** 0.195
(3.1011)** 0.063 0.063
TF -> BI 0.0359
(0.6647)Not Sig.
0.265
-0.0262 (0.2756)Not Sig.
0.217
0.0182 (0.287)Not Sig.
0.334
0.399 0.389
AT -> BI 0.2439
(5.1168)*** 0.2557
(3.1894)** 0.2423
(4.1306)*** 0.138 0.135
NAT -> BI 0.0282
(0.6458)Not Sig. 0.1076
(2.0405)* -0.0484
(0.5391)Not Sig. 1.443 1.498
PEOU -> BI 0.0232
(0.4562)Not Sig. 0.0313
(0.3537)Not Sig. -0.0194
(0.2594)Not Sig. 0.442 0.437
PU -> BI 0.3421
(7.5819)*** -0.2745
(3.5325)*** 0.3897
(6.6031)*** 2.201 1.981
RF -> BI 0.1715
(3.5596)*** 0.0939
(1.4431)Not Sig. 0.2193
(3.6089)*** 1.411 1.408
SE -> BI -0.0124
(0.2125)Not Sig. -0.102
(1.2025)Not Sig. 0.0258
(0.3447)Not Sig. 1.136 1.129
SN -> BI 0.0252
(0.5275)Not Sig. 0.0033
(0.0379)Not Sig. 0.0764
(1.0942)Not Sig. 0.662 0.653
SN -> PEOU 0.1836
(4.1729)*** 0.034
0.1261 (1.9886)*
0.016 0.2676
(3.8154)*** 0.072
1.436 1.443
Table 5. 44: Structural relations and path significance difference of moderator usage experience
5.6.4.2.7 Voluntariness
The nature of moderating variable voluntariness in this study was metrically scaled. Three
questions measured on seven-point Likert-scale ranging from strongly-disagrees to strongly-
agree were asked from the respondents (academics) to know whether the nature of the
Internet usage was mandatory or was voluntary in their institutions. The overall mean of the
construct was 3.18/7.0, which suggests that the usage of the Internet in the perspective of the
respondents was mandatory. For observing the moderating impact using MGA the metrically

266
scaled construct voluntariness was transformed into categorical construct. Based on mean
3.18, scores were categorised into two groups- compliance group (n=226, 59%, mean<3.18)
and voluntariness (n=154, 40%, mean>3.18). The F-test shows that two groups were
significantly different from each other (F=9.18, p<0.005). The convergent validity and
discriminant validity of the both sub-models were examined by observing the AVE of each
latent construct form its measuring indicators/items. Table 5.45 revealed that AVE extracted
for both sub-models were above than the required value (>0.5) and satisfied the criterion of
convergent validity (Fornell and Larcker, 1981). Only slightly lower (near to acceptable)
AVE was observed into IS and SN in sub-model voluntariness. The square-root of AVE
compared with the inter-construct correlation reveals that none of the inter-construct
correlation was higher than the square-root of AVE and satisfied the criterion of the
discriminant validity (ibid).
Correlation among the construct (Voluntariness: Compliance group)
AVE √012 AT BI BU GS IS NAT PEOU PU RF SE SN TF
AT 0.555 0.745 1.00
BI 0.551 0.742 0.31 1.00
BU 0.616 0.785 0.08 0.23 1.00
GS 0.560 0.748 0.11 0.19 0.08 1.00
IS 0.516 0.718 0.18 0.22 0.27 0.08 1.00
NAT 0.653 0.808 0.12 0.17 0.14 0.21 0.16 1.00
PEOU 0.693 0.832 0.15 0.18 0.08 0.23 0.19 0.14 1.00
PU 0.542 0.736 0.04 0.38 0.17 0.23 0.23 0.15 0.35 1.00
RF 0.553 0.743 0.12 0.22 0.06 0.14 0.17 0.16 0.10 0.14 1.00
SE 0.907 0.952 0.20 0.18 0.03 0.07 0.12 0.15 0.17 0.20 0.09 1.00
SN 0.511 0.715 0.22 0.22 0.07 0.20 0.05 0.19 0.20 0.29 0.13 0.20 1.00
TF 0.645 0.803 0.20 0.16 0.27 0.23 0.27 0.22 0.19 0.21 0.28 0.11 0.13 1.00
Correlation among the construct (Voluntariness: Voluntariness group)
AT 0.53 0.73 1.00
BI 0.56 0.75 0.33 1.00
BU 0.62 0.78 0.27 0.31 1.00
GS 0.46 0.68 0.27 0.24 0.16 1.00
IS 0.54 0.73 0.26 0.23 0.24 0.30 1.00
NAT 0.66 0.81 0.39 0.14 0.07 0.20 0.06 1.00
PEOU 0.66 0.81 0.32 0.31 0.18 0.14 0.19 0.14 1.00
PU 0.55 0.74 0.25 0.48 0.19 0.33 0.41 0.05 0.45 1.00
RF 0.51 0.72 0.17 0.31 0.18 0.28 0.18 0.00 0.15 0.14 1.00
SE 0.87 0.93 0.30 0.04 0.14 0.09 0.08 0.31 0.13 0.04 0.11 1.00
SN 0.49 0.70 0.06 0.16 0.02 0.28 0.12 0.07 0.16 0.35 0.15 0.33 1.00

267
TF 0.54 0.73 0.17 0.09 0.11 0.06 0.12 0.22 0.18 0.10 0.24 0.20 0.16 1.00
Table 5. 45: Inter-construct correlation and AVE for moderator voluntariness
The validity, reliability and overall model fitting is presented in table 5.46. Results indicates
that Cronbach α and composite reliability for both sub-models were higher than the 0.6 and
0.7 and satisfied the criterion of the internal consistency reliability (Cronbach, 1951; Werts
et al., 1974). The communalities for all the constructs in sub-model compliance were higher
than the required value 0.5, while within sub-model voluntariness construct GS and SN
shown slightly lower values than the acceptable range. However, overall average
communality for both sub-models were satisfactory (>0.5). Within sub-model compliance,
the variance explained by independent variables into dependent variable i.e. R2 was highest
in BI (R2=0.25 or 25%) followed PU (R2=0.21 or 21%), while within sub-model
voluntariness R2 was highest in PU (R2=0.39 or 39%) followed by BI (R2=0.33 or 33%).
According to Chin (1998) criterion based on explanatory power R2 both models presented
moderate level of acceptable fit. Besides looking at the magnitude of the R2 as a criterion for
predictive relevance, the cv-communality (H2) and cv-redundancy (F2) results in both
models were above than the zero positive value and satisfied model’s predicative relevance
(Tenenhaus et al., 2005). Finally, the global criterion of goodness of fit (GoF) index
represented that sub-model compliance group shown 0.31 or 31%, and sub-model
voluntariness 0.36 or 36% fit index which suggest that both models were moderately
acceptable.
Reliability and goodness of fit of the model (Voluntariness: Compliance group)
Constructs Comp:
Reliability R2 Communality
Cronbach’s
Alpha H2 Redundancy F2
AT 0.832 0.555 0.792 0.235
BI 0.829 0.252 0.551 0.725 0.262 0.052 0.112
BU 0.864 0.146 0.616 0.798 0.366 0.025 0.068
GS 0.863 0.560 0.804 0.338
IS 0.842 0.516 0.766 0.271
NAT 0.882 0.653 0.843 0.399
PEOU 0.900 0.042 0.693 0.850 0.480 0.028 0.027
PU 0.855 0.216 0.542 0.787 0.313 0.022 0.108
RF 0.831 0.553 0.729 0.248
SE 0.951 0.907 0.898 0.583
SN 0.839 0.511 0.764 0.234
TF 0.879 0.645 0.822 0.401
Average 0.164 0.608 0.032
GoF 0.316
Reliability and goodness of fit of the model (Voluntariness: Voluntariness group)
AT 0.819 0.532 0.760 0.359
BI 0.835 0.332 0.559 0.737 0.302 0.047 0.081
BU 0.864 0.143 0.615 0.793 0.167 0.053 0.066
GS 0.808 0.460 0.704 0.265
IS 0.853 0.539 0.786 0.314

268
NAT 0.885 0.659 0.846 0.431
PEOU 0.887 0.025 0.664 0.831 0.490 0.017 0.036
PU 0.857 0.393 0.546 0.791 0.327 0.038 0.076
RF 0.808 0.513 0.693 0.196
SE 0.929 0.868 0.854 0.480
SN 0.826 0.489 0.742 0.120
TF 0.818 0.535 0.748 0.460
Average 0.223 0.582 0.039
GoF 0.360
Note: H2 = Constructs cross-validate communality F2 = Construct cross-validate redundancy
GoF = Goodness of Fit index = 34� � ��5��65 �7889:�;<=>
Table 5. 46: Overall overview of results and GoF of moderator voluntariness
Table 5.47 provides the detailed results of the standardised path estimations for the overall
sample model and two sub-models. Within sub-model compliance most of the paths were
similar to the overall sample model. The highest significant path in sub-model compliance
was PU�BI (β=0.32 or 32% and t=5.31) and lowest one was RF�BI (β=0.12 or 12% and
t=2.19). Within sub-model voluntariness paths were bit different from the overall sample
model. For instance, path relations TF�BU (β=0.03 or 3% and t=0.21), IS�BU (β=0.03 or
3% and t=0.29), GS�PU (β=0.11 or 11% and t=1.92) and AT�BI (β=0.17 or 17% and
t=1.87) were different. The highest significant path was between PU�BI (β=0.37 or 37%
and t=4.68) and lowest one was between PEOU�SN (β=0.15 or 15% and t=2.05). Even
though there were some paths different in the both sub-model, but the parametric t-test and
non-parametric Smith-Satterthwait tests of significant differences reveal that there was no
significant difference among two groups. Hence, hypothesis H14b was completely rejected.
Hypothesis
Combined Dataset(n=380) Compliance (n=226) Voluntariness (n=154) Parametric
test of
difference
Smith-
Satterthwait
test Path (t-value) R-
Square Path (t-value)
R-
Square Path (t-value)
R-
Square
TF -> BU 0.1435
(2.6076)**
0.126
0.2141 (2.6985)**
0.146
0.0373 (0.2192)Not Sig.
0.143
1.043 0.942
SE -> BU 0.0041
(0.0818)Not Sig. -0.0487
(0.7108)Not Sig. 0.1013
(1.1351)Not Sig. 1.355 1.333
RF -> BU -0.0141
(0.2555)Not Sig. -0.0713
(1.0476)Not Sig. 0.0496
(0.5325)Not Sig. 1.076 1.048
PU -> BU 0.0139
(0.1968)Not Sig. 0.038
(0.3854)Not Sig. -0.0217
(0.2464)Not Sig. 0.428 0.451
BI -> BU 0.1941
(3.4228)*** 0.166
(2.2617)* 0.2519
(2.8337)** 0.747 0.745
GS -> BU 0.0055
(0.0866)Not Sig. -0.0114
(0.1278)Not Sig. 0.0305
(0.2936)Not Sig. 0.304 0.306
IS -> BU 0.1802
(3.2638)** 0.1844
(2.612)* 0.1596
(1.9055)Not Sig. 0.226 0.226
SN -> PU 0.2203
(3.9937)***
0.269
0.2096 (2.56)*
0.216
0.2206 (3.1854)**
0.393
0.096 0.103
PEOU -> PU 0.281
(5.8124)*** 0.2508
(3.4469)*** 0.3442
(4.9936)*** 0.892 0.932
GS -> PU 0.1208
(2.3049)* 0.1347
(2.0207)* 0.1194
(1.9249)Not Sig. 0.165 0.168
IS -> PU 0.208
(4.6002)*** 0.2825
(3.7604)*** 0.1633
(2.7016)** 1.246 1.237
TF -> BI -0.0359
(0.6647)Not Sig. 0.265
-0.0251 (0.3074)Not Sig.
0.252 -0.052
(0.5926)Not Sig. 0.332 0.220 0.225
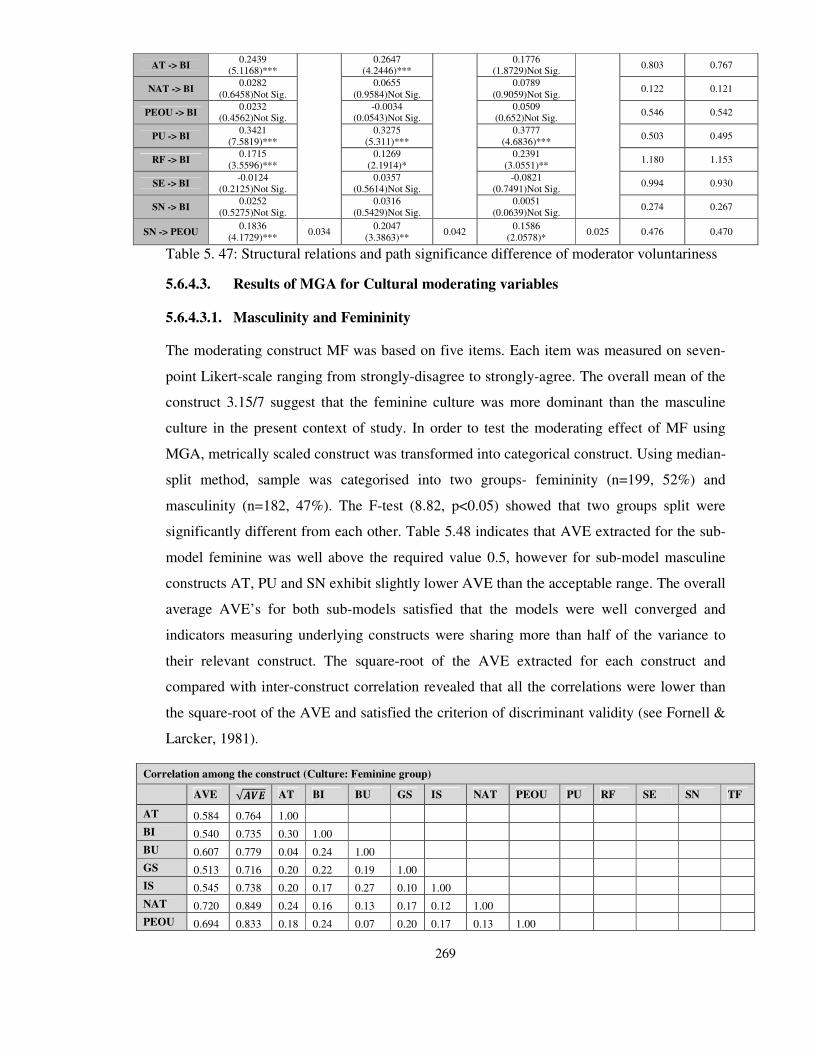
269
AT -> BI 0.2439
(5.1168)*** 0.2647
(4.2446)*** 0.1776
(1.8729)Not Sig. 0.803 0.767
NAT -> BI 0.0282
(0.6458)Not Sig. 0.0655
(0.9584)Not Sig. 0.0789
(0.9059)Not Sig. 0.122 0.121
PEOU -> BI 0.0232
(0.4562)Not Sig. -0.0034
(0.0543)Not Sig. 0.0509
(0.652)Not Sig. 0.546 0.542
PU -> BI 0.3421
(7.5819)*** 0.3275
(5.311)*** 0.3777
(4.6836)*** 0.503 0.495
RF -> BI 0.1715
(3.5596)*** 0.1269
(2.1914)* 0.2391
(3.0551)** 1.180 1.153
SE -> BI -0.0124
(0.2125)Not Sig. 0.0357
(0.5614)Not Sig. -0.0821
(0.7491)Not Sig. 0.994 0.930
SN -> BI 0.0252
(0.5275)Not Sig. 0.0316
(0.5429)Not Sig. 0.0051
(0.0639)Not Sig. 0.274 0.267
SN -> PEOU 0.1836
(4.1729)*** 0.034
0.2047 (3.3863)**
0.042 0.1586
(2.0578)* 0.025 0.476 0.470
Table 5. 47: Structural relations and path significance difference of moderator voluntariness
5.6.4.3. Results of MGA for Cultural moderating variables
5.6.4.3.1. Masculinity and Femininity
The moderating construct MF was based on five items. Each item was measured on seven-
point Likert-scale ranging from strongly-disagree to strongly-agree. The overall mean of the
construct 3.15/7 suggest that the feminine culture was more dominant than the masculine
culture in the present context of study. In order to test the moderating effect of MF using
MGA, metrically scaled construct was transformed into categorical construct. Using median-
split method, sample was categorised into two groups- femininity (n=199, 52%) and
masculinity (n=182, 47%). The F-test (8.82, p<0.05) showed that two groups split were
significantly different from each other. Table 5.48 indicates that AVE extracted for the sub-
model feminine was well above the required value 0.5, however for sub-model masculine
constructs AT, PU and SN exhibit slightly lower AVE than the acceptable range. The overall
average AVE’s for both sub-models satisfied that the models were well converged and
indicators measuring underlying constructs were sharing more than half of the variance to
their relevant construct. The square-root of the AVE extracted for each construct and
compared with inter-construct correlation revealed that all the correlations were lower than
the square-root of the AVE and satisfied the criterion of discriminant validity (see Fornell &
Larcker, 1981).
Correlation among the construct (Culture: Feminine group)
AVE √012 AT BI BU GS IS NAT PEOU PU RF SE SN TF
AT 0.584 0.764 1.00
BI 0.540 0.735 0.30 1.00
BU 0.607 0.779 0.04 0.24 1.00
GS 0.513 0.716 0.20 0.22 0.19 1.00
IS 0.545 0.738 0.20 0.17 0.27 0.10 1.00
NAT 0.720 0.849 0.24 0.16 0.13 0.17 0.12 1.00
PEOU 0.694 0.833 0.18 0.24 0.07 0.20 0.17 0.13 1.00
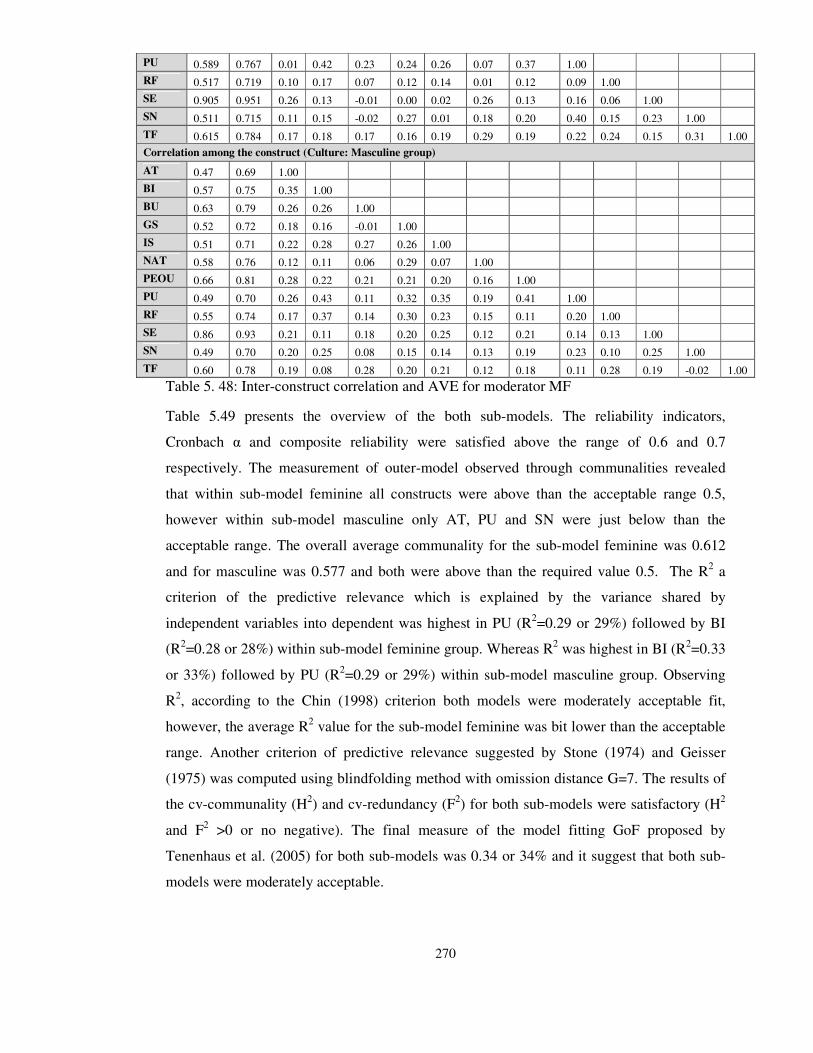
270
PU 0.589 0.767 0.01 0.42 0.23 0.24 0.26 0.07 0.37 1.00
RF 0.517 0.719 0.10 0.17 0.07 0.12 0.14 0.01 0.12 0.09 1.00
SE 0.905 0.951 0.26 0.13 -0.01 0.00 0.02 0.26 0.13 0.16 0.06 1.00
SN 0.511 0.715 0.11 0.15 -0.02 0.27 0.01 0.18 0.20 0.40 0.15 0.23 1.00
TF 0.615 0.784 0.17 0.18 0.17 0.16 0.19 0.29 0.19 0.22 0.24 0.15 0.31 1.00
Correlation among the construct (Culture: Masculine group)
AT 0.47 0.69 1.00
BI 0.57 0.75 0.35 1.00
BU 0.63 0.79 0.26 0.26 1.00
GS 0.52 0.72 0.18 0.16 -0.01 1.00
IS 0.51 0.71 0.22 0.28 0.27 0.26 1.00
NAT 0.58 0.76 0.12 0.11 0.06 0.29 0.07 1.00
PEOU 0.66 0.81 0.28 0.22 0.21 0.21 0.20 0.16 1.00
PU 0.49 0.70 0.26 0.43 0.11 0.32 0.35 0.19 0.41 1.00
RF 0.55 0.74 0.17 0.37 0.14 0.30 0.23 0.15 0.11 0.20 1.00
SE 0.86 0.93 0.21 0.11 0.18 0.20 0.25 0.12 0.21 0.14 0.13 1.00
SN 0.49 0.70 0.20 0.25 0.08 0.15 0.14 0.13 0.19 0.23 0.10 0.25 1.00
TF 0.60 0.78 0.19 0.08 0.28 0.20 0.21 0.12 0.18 0.11 0.28 0.19 -0.02 1.00
Table 5. 48: Inter-construct correlation and AVE for moderator MF
Table 5.49 presents the overview of the both sub-models. The reliability indicators,
Cronbach α and composite reliability were satisfied above the range of 0.6 and 0.7
respectively. The measurement of outer-model observed through communalities revealed
that within sub-model feminine all constructs were above than the acceptable range 0.5,
however within sub-model masculine only AT, PU and SN were just below than the
acceptable range. The overall average communality for the sub-model feminine was 0.612
and for masculine was 0.577 and both were above than the required value 0.5. The R2 a
criterion of the predictive relevance which is explained by the variance shared by
independent variables into dependent was highest in PU (R2=0.29 or 29%) followed by BI
(R2=0.28 or 28%) within sub-model feminine group. Whereas R2 was highest in BI (R2=0.33
or 33%) followed by PU (R2=0.29 or 29%) within sub-model masculine group. Observing
R2, according to the Chin (1998) criterion both models were moderately acceptable fit,
however, the average R2 value for the sub-model feminine was bit lower than the acceptable
range. Another criterion of predictive relevance suggested by Stone (1974) and Geisser
(1975) was computed using blindfolding method with omission distance G=7. The results of
the cv-communality (H2) and cv-redundancy (F2) for both sub-models were satisfactory (H2
and F2 >0 or no negative). The final measure of the model fitting GoF proposed by
Tenenhaus et al. (2005) for both sub-models was 0.34 or 34% and it suggest that both sub-
models were moderately acceptable.

271
Reliability and goodness of fit of the model (Culture: Feminine group)
Constructs Comp:
Reliability R2 Communality
Cronbach’s
Alpha H2 Redundancy F2
AT 0.848 0.584 0.782 0.282
BI 0.824 0.285 0.540 0.716 0.239 0.050 0.120
BU 0.859 0.142 0.607 0.792 0.359 0.028 0.052
GS 0.839 0.513 0.759 0.274
IS 0.856 0.545 0.792 0.321
NAT 0.911 0.720 0.871 0.508
PEOU 0.901 0.039 0.694 0.853 0.482 0.026 0.025
PU 0.877 0.294 0.589 0.825 0.378 0.020 0.156
RF 0.809 0.517 0.712 0.207
SE 0.950 0.905 0.898 0.561
SN 0.839 0.511 0.769 0.244
TF 0.864 0.615 0.806 0.363
Average 0.190 0.612 0.031
GoF 0.341
Reliability and goodness of fit of the model (Culture: Masculine group)
AT 0.774 0.472 0.773 0.176
BI 0.841 0.330 0.569 0.747 0.289 0.059 0.156
BU 0.869 0.189 0.625 0.800 0.374 0.041 0.099
GS 0.841 0.517 0.769 0.280
IS 0.839 0.511 0.764 0.263
NAT 0.845 0.581 0.816 0.313
PEOU 0.886 0.035 0.661 0.827 0.433 0.023 0.019
PU 0.826 0.290 0.490 0.741 0.245 0.038 0.128
RF 0.829 0.550 0.721 0.246
SE 0.925 0.860 0.839 0.483
SN 0.828 0.491 0.744 0.213
TF 0.858 0.602 0.784 0.336
Average 0.211 0.577 0.040
GoF 0.349
Note: H2 = Constructs cross-validate communality F2 = Construct cross-validate redundancy
GoF = Goodness of Fit index = 34� � ��5��65 �7889:�;<=>
Table 5. 49: Overall overview of results and GoF of moderator MF
The standardised estimated path relations for both sub-models are presented in table 5.50.
Most of the path relations in sub-model feminine were similar to overall sample model.
Exceptionally, paths TF�BU (β=0.08 or 8% and t=0.94), BI�BU (β=0.14 or 14% and
t=1.64), GS�PU (β=0.08 or 8% and t=1.33), and RF�BI (β=0.10 or 10% and t=1.35) were
different in between sub-model feminine and overall sample model. The highest significant
path in sub-model feminine was between PU�BI (β=0.42 or 42% and t=6.79) and lowest on
was between SN�PEOU (β=0.19 or 19% and t=3.01). Within masculine sub-model only
path SN�PU (β=0.11 or 11% and t=1.72) was different from the overall sample model. The
highest significant path was between PU�BI (β=0.30 or 30% and t=4.34) and lowest one
was between GS�PU (β=0.17 or 17% and t=2.61).

272
The test of differences computed using parametric t-test and non-parametric test of Smith-
Satterwait shows that path SN�PU were significantly different in two groups (t=2.20 and
t=2.17). Specifically, path SN�PU was highly significant in feminine group (β=0.32 or 32%
and t=4.93) but was insignificant in masculine group (β=0.11 or 11% and t=1.72). Based on
this moderating difference hypothesis H15b was only partially supported, while H15a, H15c
and H15d were rejected.
Hypothesis
Combined Dataset(n=380) Feminine(n=199) Masculine (n=181) Parametric
test of
difference
Smith-
Satterthwait
test Path (t-value) R-
Square Path (t-value)
R-
Square Path (t-value)
R-
Square
TF -> BU 0.1435
(2.6076)**
0.126
0.0829 (0.9493)Not Sig.
0.142
0.2395 (3.9904)***
0.189
1.469 1.478
SE -> BU 0.0041
(0.0818)Not Sig. -0.0531
(0.7198)Not Sig. 0.0969
(1.4568)Not Sig. 1.519 1.511
RF -> BU -0.0141
(0.2555)Not Sig. -0.0179
(0.1967)Not Sig. -0.0191
(0.195)Not Sig. 0.009 0.009
PU -> BU 0.0139
(0.1968)Not Sig. 0.0874
(0.8776)Not Sig. -0.0476
(0.507)Not Sig. 0.994 0.986
BI -> BU 0.1941
(3.4228)*** 0.146
(1.6485)Not Sig. 0.2326
(2.5286)* 0.687 0.678
GS -> BU 0.0055
(0.0866)Not Sig. 0.1012
(1.0802)Not Sig. -0.1443
(1.6055)Not Sig. 1.906 1.891
IS -> BU 0.1802
(3.2638)** 0.1998
(2.8992)** 0.1897
(2.3113)* 0.096 0.094
SN -> PU 0.2203
(3.9937)***
0.269
0.3208
(4.9317)***
0.290
0.1165
(1.7211)Not Sig.
0.290
2.202 2.175
PEOU -> PU 0.281
(5.8124)*** 0.2559
(4.0691)*** 0.3055
(4.4445)*** 0.540 0.532
GS -> PU 0.1208
(2.3049)* 0.0824
(1.3322)Not Sig. 0.1757
(2.617)* 1.036 1.022
IS -> PU 0.208
(4.6002)*** 0.2304
(2.9073)** 0.2014
(3.3857)** 0.300 0.293
TF -> BI -0.0359
(0.6647)Not Sig.
0.265
0.0203 (0.2903)Not Sig.
0.285
-0.0645 (0.847)Not Sig.
0.330
0.831 0.820
AT -> BI 0.2439
(5.1168)*** 0.2774
(4.1048)*** 0.2146
(3.2989)** 0.675 0.670
NAT -> BI 0.0282
(0.6458)Not Sig. 0.0718
(1.1065)Not Sig. -0.0182
(0.1821)Not Sig. 0.779 0.756
PEOU -> BI 0.0232
(0.4562)Not Sig. 0.0307
(0.4723)Not Sig. 0.0084
(0.1099)Not Sig. 0.226 0.222
PU -> BI 0.3421
(7.5819)*** 0.4209
(6.7961)*** 0.3014
(4.3435)*** 1.305 1.285
RF -> BI 0.1715
(3.5596)*** 0.1096
(1.3537)Not Sig. 0.2862
(3.4618)*** 1.543 1.526
SE -> BI -0.0124
(0.2125)Not Sig. -0.0228
(0.2575)Not Sig. -0.0298
(0.4169)Not Sig. 0.062 0.062
SN -> BI 0.0252
(0.5275)Not Sig. -0.0888
(1.3168)Not Sig. 0.1129
(1.6929)Not Sig. 1.146 1.125
SN -> PEOU 0.1836
(4.1729)*** 0.034
0.1967 (3.0127)**
0.039 0.1856
(3.1866)** 0.035 0.128 0.127
Table 5. 50: Structural relations and path significance difference of moderator MF
5.6.4.3.2. Individualism-Collectivism
There were six items in survey questionnaire to measure the level of the IC within the
respondents (academics) working in the higher educational institutes. All the items like other
cultural constructs were measured on seven-point Likert-scales. The total mean of the
construct was 5.40/7 which showed that respondents were more inclined towards collectivist
society. In the interest of the MGA metrically scaled construct was transformed into two-
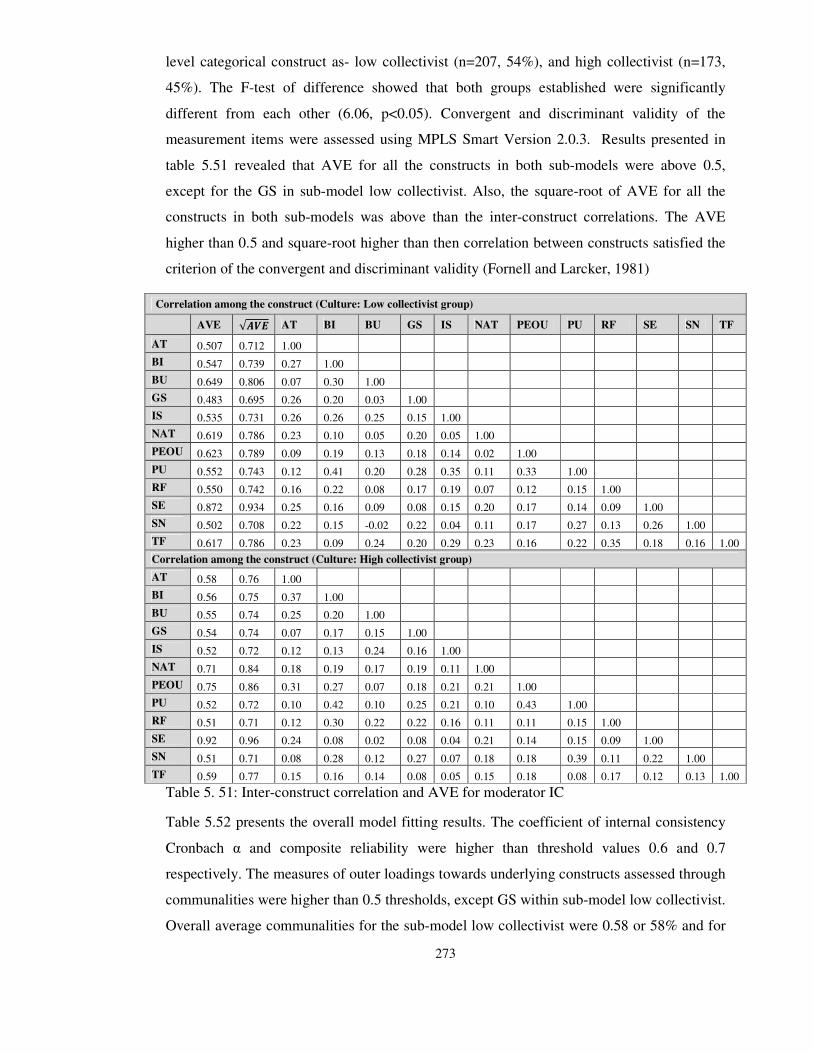
273
level categorical construct as- low collectivist (n=207, 54%), and high collectivist (n=173,
45%). The F-test of difference showed that both groups established were significantly
different from each other (6.06, p<0.05). Convergent and discriminant validity of the
measurement items were assessed using MPLS Smart Version 2.0.3. Results presented in
table 5.51 revealed that AVE for all the constructs in both sub-models were above 0.5,
except for the GS in sub-model low collectivist. Also, the square-root of AVE for all the
constructs in both sub-models was above than the inter-construct correlations. The AVE
higher than 0.5 and square-root higher than then correlation between constructs satisfied the
criterion of the convergent and discriminant validity (Fornell and Larcker, 1981)
Correlation among the construct (Culture: Low collectivist group)
AVE √012 AT BI BU GS IS NAT PEOU PU RF SE SN TF
AT 0.507 0.712 1.00
BI 0.547 0.739 0.27 1.00
BU 0.649 0.806 0.07 0.30 1.00
GS 0.483 0.695 0.26 0.20 0.03 1.00
IS 0.535 0.731 0.26 0.26 0.25 0.15 1.00
NAT 0.619 0.786 0.23 0.10 0.05 0.20 0.05 1.00
PEOU 0.623 0.789 0.09 0.19 0.13 0.18 0.14 0.02 1.00
PU 0.552 0.743 0.12 0.41 0.20 0.28 0.35 0.11 0.33 1.00
RF 0.550 0.742 0.16 0.22 0.08 0.17 0.19 0.07 0.12 0.15 1.00
SE 0.872 0.934 0.25 0.16 0.09 0.08 0.15 0.20 0.17 0.14 0.09 1.00
SN 0.502 0.708 0.22 0.15 -0.02 0.22 0.04 0.11 0.17 0.27 0.13 0.26 1.00
TF 0.617 0.786 0.23 0.09 0.24 0.20 0.29 0.23 0.16 0.22 0.35 0.18 0.16 1.00
Correlation among the construct (Culture: High collectivist group)
AT 0.58 0.76 1.00
BI 0.56 0.75 0.37 1.00
BU 0.55 0.74 0.25 0.20 1.00
GS 0.54 0.74 0.07 0.17 0.15 1.00
IS 0.52 0.72 0.12 0.13 0.24 0.16 1.00
NAT 0.71 0.84 0.18 0.19 0.17 0.19 0.11 1.00
PEOU 0.75 0.86 0.31 0.27 0.07 0.18 0.21 0.21 1.00
PU 0.52 0.72 0.10 0.42 0.10 0.25 0.21 0.10 0.43 1.00
RF 0.51 0.71 0.12 0.30 0.22 0.22 0.16 0.11 0.11 0.15 1.00
SE 0.92 0.96 0.24 0.08 0.02 0.08 0.04 0.21 0.14 0.15 0.09 1.00
SN 0.51 0.71 0.08 0.28 0.12 0.27 0.07 0.18 0.18 0.39 0.11 0.22 1.00
TF 0.59 0.77 0.15 0.16 0.14 0.08 0.05 0.15 0.18 0.08 0.17 0.12 0.13 1.00
Table 5. 51: Inter-construct correlation and AVE for moderator IC
Table 5.52 presents the overall model fitting results. The coefficient of internal consistency
Cronbach α and composite reliability were higher than threshold values 0.6 and 0.7
respectively. The measures of outer loadings towards underlying constructs assessed through
communalities were higher than 0.5 thresholds, except GS within sub-model low collectivist.
Overall average communalities for the sub-model low collectivist were 0.58 or 58% and for

274
the sub-model high collectivist was 0.60 or 60%. Within sub-model low collectivist,
coefficient of determination R2 of the dependent variables was highest in PU (R2 = 0.27 or
27%) followed by BI (R2 = 0.24 or 24%). Whereas, within sub-model high collectivist R2
was highest in BI (R2 = 0.34 or 34%) followed by PU (R2 = 0.30 or 30%). Based on Chin’s
(1998) criterion on individual construct’s R2 values both sub-models were acceptable at
moderate level, however, based on average of R2 value sub-model low collectivist was
acceptable at substantial level and sub-model high collectivist was acceptable at moderate
level. Models capability to predict shows that cv-communality (H2) and cv-redundancy (F2)
for the both sub-models were positive higher than the zero and satisfied the conditions of the
predictive relevance (Stone, 1974; Geisser, 1975). Finally, the measure of the overall
goodness of fit index (GoF) revealed that sub-model low collectivist presented 0.32 or 32%
fit index, and sub-model high on collectivist presented 0.34 or 34% index. The GoF for both
sub-models were in moderate acceptable range.
Reliability and goodness of fit of the model (Culture: Low collectivist group)
Constructs Comp:
Reliability R2 Communality
Cronbach’s
Alpha H2 Redundancy F2
AT 0.802 0.507 0.760 0.185
BI 0.827 0.244 0.547 0.720 0.256 0.037 0.113
BU 0.881 0.160 0.649 0.819 0.413 0.057 0.080
GS 0.822 0.483 0.733 0.227
IS 0.852 0.535 0.785 0.303
NAT 0.866 0.619 0.802 0.290
PEOU 0.868 0.028 0.623 0.796 0.367 0.018 0.016
PU 0.859 0.273 0.552 0.796 0.339 0.032 0.128
RF 0.830 0.550 0.729 0.257
SE 0.931 0.872 0.854 0.490
SN 0.834 0.502 0.758 0.244
TF 0.866 0.617 0.803 0.346
Average 0.176 0.588 0.036
GoF 0.322
Reliability and goodness of fit of the model (Culture: High collectivist group)
AT 0.846 0.579 0.794 0.284
BI 0.837 0.347 0.563 0.741 0.274 0.074 0.150
BU 0.825 0.118 0.548 0.751 0.265 0.015 0.031
GS 0.856 0.544 0.792 0.308
IS 0.841 0.516 0.768 0.276
NAT 0.906 0.709 0.879 0.487
PEOU 0.922 0.034 0.747 0.886 0.570 0.026 0.027
PU 0.843 0.301 0.518 0.768 0.276 0.019 0.143
RF 0.806 0.510 0.696 0.177
SE 0.958 0.919 0.916 0.572
SN 0.837 0.508 0.759 0.231
TF 0.852 0.593 0.779 0.311
Average 0.200 0.605 0.033
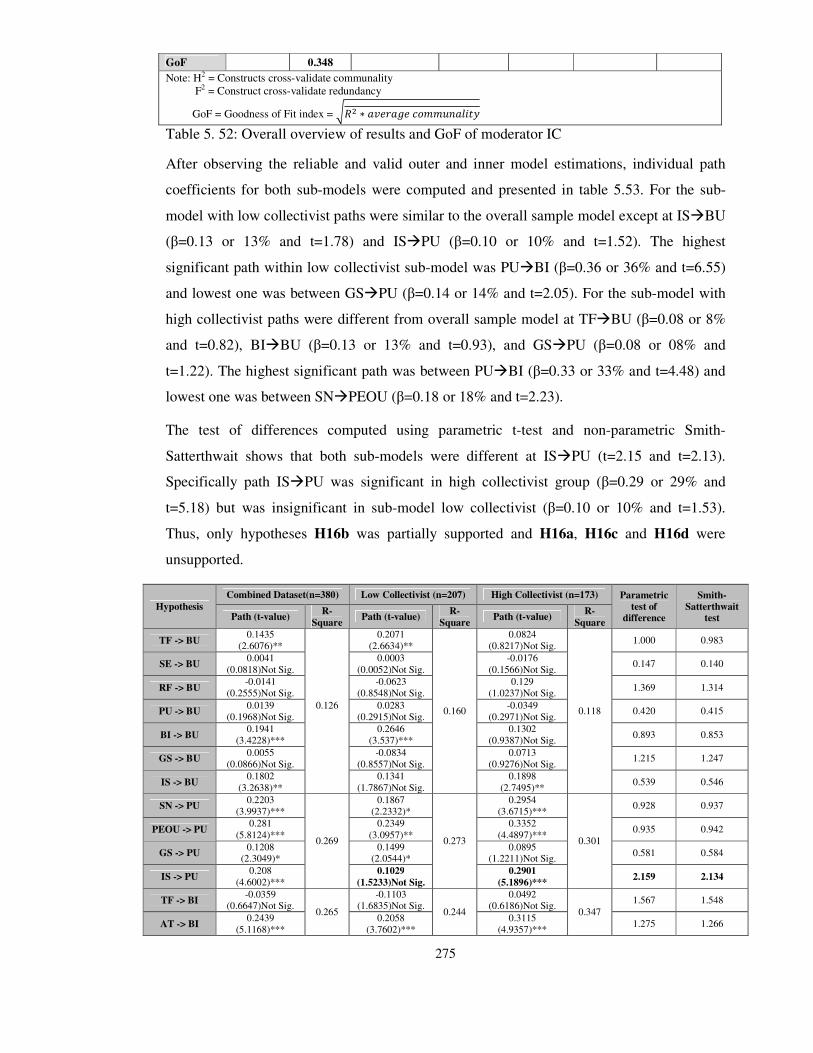
275
GoF 0.348
Note: H2 = Constructs cross-validate communality F2 = Construct cross-validate redundancy
GoF = Goodness of Fit index = 34� � ��5��65 �7889:�;<=>
Table 5. 52: Overall overview of results and GoF of moderator IC
After observing the reliable and valid outer and inner model estimations, individual path
coefficients for both sub-models were computed and presented in table 5.53. For the sub-
model with low collectivist paths were similar to the overall sample model except at IS�BU
(β=0.13 or 13% and t=1.78) and IS�PU (β=0.10 or 10% and t=1.52). The highest
significant path within low collectivist sub-model was PU�BI (β=0.36 or 36% and t=6.55)
and lowest one was between GS�PU (β=0.14 or 14% and t=2.05). For the sub-model with
high collectivist paths were different from overall sample model at TF�BU (β=0.08 or 8%
and t=0.82), BI�BU (β=0.13 or 13% and t=0.93), and GS�PU (β=0.08 or 08% and
t=1.22). The highest significant path was between PU�BI (β=0.33 or 33% and t=4.48) and
lowest one was between SN�PEOU (β=0.18 or 18% and t=2.23).
The test of differences computed using parametric t-test and non-parametric Smith-
Satterthwait shows that both sub-models were different at IS�PU (t=2.15 and t=2.13).
Specifically path IS�PU was significant in high collectivist group (β=0.29 or 29% and
t=5.18) but was insignificant in sub-model low collectivist (β=0.10 or 10% and t=1.53).
Thus, only hypotheses H16b was partially supported and H16a, H16c and H16d were
unsupported.
Hypothesis
Combined Dataset(n=380) Low Collectivist (n=207) High Collectivist (n=173) Parametric
test of
difference
Smith-
Satterthwait
test Path (t-value) R-
Square Path (t-value)
R-
Square Path (t-value)
R-
Square
TF -> BU 0.1435
(2.6076)**
0.126
0.2071 (2.6634)**
0.160
0.0824 (0.8217)Not Sig.
0.118
1.000 0.983
SE -> BU 0.0041
(0.0818)Not Sig. 0.0003
(0.0052)Not Sig. -0.0176
(0.1566)Not Sig. 0.147 0.140
RF -> BU -0.0141
(0.2555)Not Sig. -0.0623
(0.8548)Not Sig. 0.129
(1.0237)Not Sig. 1.369 1.314
PU -> BU 0.0139
(0.1968)Not Sig. 0.0283
(0.2915)Not Sig. -0.0349
(0.2971)Not Sig. 0.420 0.415
BI -> BU 0.1941
(3.4228)*** 0.2646
(3.537)*** 0.1302
(0.9387)Not Sig. 0.893 0.853
GS -> BU 0.0055
(0.0866)Not Sig. -0.0834
(0.8557)Not Sig. 0.0713
(0.9276)Not Sig. 1.215 1.247
IS -> BU 0.1802
(3.2638)** 0.1341
(1.7867)Not Sig. 0.1898
(2.7495)** 0.539 0.546
SN -> PU 0.2203
(3.9937)***
0.269
0.1867 (2.2332)*
0.273
0.2954 (3.6715)***
0.301
0.928 0.937
PEOU -> PU 0.281
(5.8124)*** 0.2349
(3.0957)** 0.3352
(4.4897)*** 0.935 0.942
GS -> PU 0.1208
(2.3049)* 0.1499
(2.0544)* 0.0895
(1.2211)Not Sig. 0.581 0.584
IS -> PU 0.208
(4.6002)*** 0.1029
(1.5233)Not Sig. 0.2901
(5.1896)*** 2.159 2.134
TF -> BI -0.0359
(0.6647)Not Sig. 0.265
-0.1103 (1.6835)Not Sig.
0.244
0.0492 (0.6186)Not Sig.
0.347 1.567 1.548
AT -> BI 0.2439
(5.1168)*** 0.2058
(3.7602)*** 0.3115
(4.9357)*** 1.275 1.266
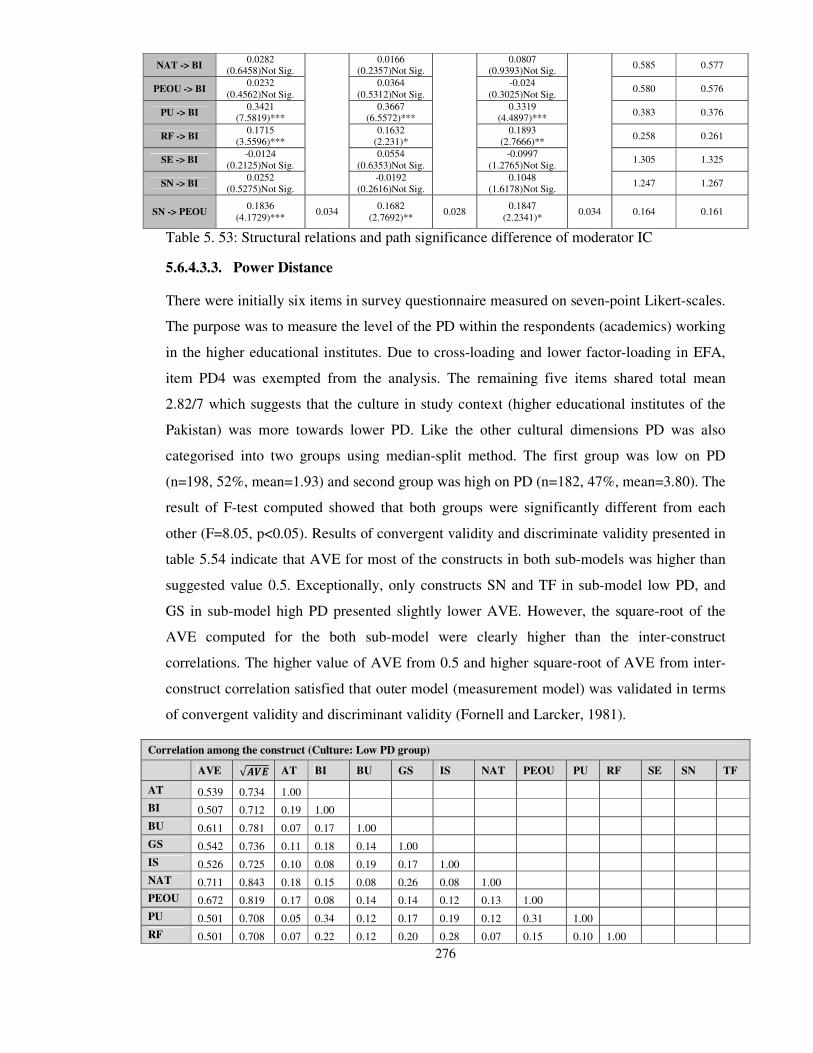
276
NAT -> BI 0.0282
(0.6458)Not Sig. 0.0166
(0.2357)Not Sig. 0.0807
(0.9393)Not Sig. 0.585 0.577
PEOU -> BI 0.0232
(0.4562)Not Sig. 0.0364
(0.5312)Not Sig. -0.024
(0.3025)Not Sig. 0.580 0.576
PU -> BI 0.3421
(7.5819)*** 0.3667
(6.5572)*** 0.3319
(4.4897)*** 0.383 0.376
RF -> BI 0.1715
(3.5596)*** 0.1632
(2.231)* 0.1893
(2.7666)** 0.258 0.261
SE -> BI -0.0124
(0.2125)Not Sig. 0.0554
(0.6353)Not Sig. -0.0997
(1.2765)Not Sig. 1.305 1.325
SN -> BI 0.0252
(0.5275)Not Sig. -0.0192
(0.2616)Not Sig. 0.1048
(1.6178)Not Sig. 1.247 1.267
SN -> PEOU 0.1836
(4.1729)*** 0.034
0.1682 (2.7692)**
0.028 0.1847
(2.2341)* 0.034 0.164 0.161
Table 5. 53: Structural relations and path significance difference of moderator IC
5.6.4.3.3. Power Distance
There were initially six items in survey questionnaire measured on seven-point Likert-scales.
The purpose was to measure the level of the PD within the respondents (academics) working
in the higher educational institutes. Due to cross-loading and lower factor-loading in EFA,
item PD4 was exempted from the analysis. The remaining five items shared total mean
2.82/7 which suggests that the culture in study context (higher educational institutes of the
Pakistan) was more towards lower PD. Like the other cultural dimensions PD was also
categorised into two groups using median-split method. The first group was low on PD
(n=198, 52%, mean=1.93) and second group was high on PD (n=182, 47%, mean=3.80). The
result of F-test computed showed that both groups were significantly different from each
other (F=8.05, p<0.05). Results of convergent validity and discriminate validity presented in
table 5.54 indicate that AVE for most of the constructs in both sub-models was higher than
suggested value 0.5. Exceptionally, only constructs SN and TF in sub-model low PD, and
GS in sub-model high PD presented slightly lower AVE. However, the square-root of the
AVE computed for the both sub-model were clearly higher than the inter-construct
correlations. The higher value of AVE from 0.5 and higher square-root of AVE from inter-
construct correlation satisfied that outer model (measurement model) was validated in terms
of convergent validity and discriminant validity (Fornell and Larcker, 1981).
Correlation among the construct (Culture: Low PD group)
AVE √012 AT BI BU GS IS NAT PEOU PU RF SE SN TF
AT 0.539 0.734 1.00
BI 0.507 0.712 0.19 1.00
BU 0.611 0.781 0.07 0.17 1.00
GS 0.542 0.736 0.11 0.18 0.14 1.00
IS 0.526 0.725 0.10 0.08 0.19 0.17 1.00
NAT 0.711 0.843 0.18 0.15 0.08 0.26 0.08 1.00
PEOU 0.672 0.819 0.17 0.08 0.14 0.14 0.12 0.13 1.00
PU 0.501 0.708 0.05 0.34 0.12 0.17 0.19 0.12 0.31 1.00
RF 0.501 0.708 0.07 0.22 0.12 0.20 0.28 0.07 0.15 0.10 1.00
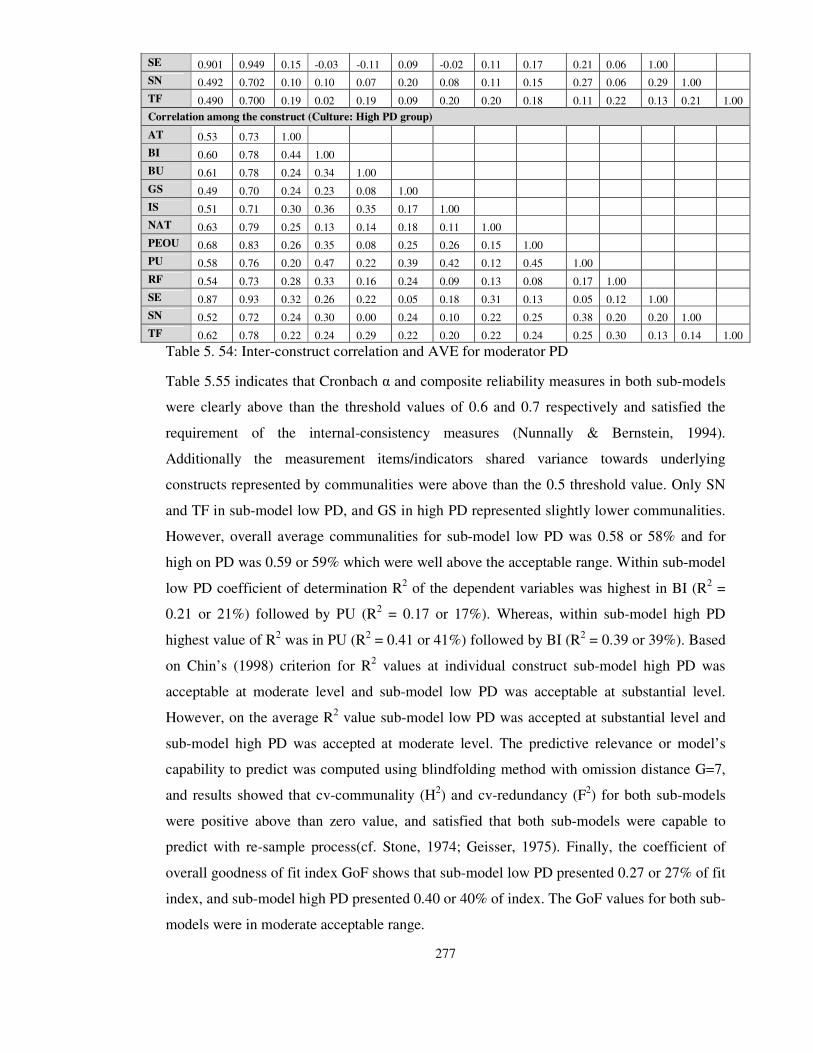
277
SE 0.901 0.949 0.15 -0.03 -0.11 0.09 -0.02 0.11 0.17 0.21 0.06 1.00
SN 0.492 0.702 0.10 0.10 0.07 0.20 0.08 0.11 0.15 0.27 0.06 0.29 1.00
TF 0.490 0.700 0.19 0.02 0.19 0.09 0.20 0.20 0.18 0.11 0.22 0.13 0.21 1.00
Correlation among the construct (Culture: High PD group)
AT 0.53 0.73 1.00
BI 0.60 0.78 0.44 1.00
BU 0.61 0.78 0.24 0.34 1.00
GS 0.49 0.70 0.24 0.23 0.08 1.00
IS 0.51 0.71 0.30 0.36 0.35 0.17 1.00
NAT 0.63 0.79 0.25 0.13 0.14 0.18 0.11 1.00
PEOU 0.68 0.83 0.26 0.35 0.08 0.25 0.26 0.15 1.00
PU 0.58 0.76 0.20 0.47 0.22 0.39 0.42 0.12 0.45 1.00
RF 0.54 0.73 0.28 0.33 0.16 0.24 0.09 0.13 0.08 0.17 1.00
SE 0.87 0.93 0.32 0.26 0.22 0.05 0.18 0.31 0.13 0.05 0.12 1.00
SN 0.52 0.72 0.24 0.30 0.00 0.24 0.10 0.22 0.25 0.38 0.20 0.20 1.00
TF 0.62 0.78 0.22 0.24 0.29 0.22 0.20 0.22 0.24 0.25 0.30 0.13 0.14 1.00
Table 5. 54: Inter-construct correlation and AVE for moderator PD
Table 5.55 indicates that Cronbach α and composite reliability measures in both sub-models
were clearly above than the threshold values of 0.6 and 0.7 respectively and satisfied the
requirement of the internal-consistency measures (Nunnally & Bernstein, 1994).
Additionally the measurement items/indicators shared variance towards underlying
constructs represented by communalities were above than the 0.5 threshold value. Only SN
and TF in sub-model low PD, and GS in high PD represented slightly lower communalities.
However, overall average communalities for sub-model low PD was 0.58 or 58% and for
high on PD was 0.59 or 59% which were well above the acceptable range. Within sub-model
low PD coefficient of determination R2 of the dependent variables was highest in BI (R2 =
0.21 or 21%) followed by PU (R2 = 0.17 or 17%). Whereas, within sub-model high PD
highest value of R2 was in PU (R2 = 0.41 or 41%) followed by BI (R2 = 0.39 or 39%). Based
on Chin’s (1998) criterion for R2 values at individual construct sub-model high PD was
acceptable at moderate level and sub-model low PD was acceptable at substantial level.
However, on the average R2 value sub-model low PD was accepted at substantial level and
sub-model high PD was accepted at moderate level. The predictive relevance or model’s
capability to predict was computed using blindfolding method with omission distance G=7,
and results showed that cv-communality (H2) and cv-redundancy (F2) for both sub-models
were positive above than zero value, and satisfied that both sub-models were capable to
predict with re-sample process(cf. Stone, 1974; Geisser, 1975). Finally, the coefficient of
overall goodness of fit index GoF shows that sub-model low PD presented 0.27 or 27% of fit
index, and sub-model high PD presented 0.40 or 40% of index. The GoF values for both sub-
models were in moderate acceptable range.

278
Reliability and goodness of fit of the model (Culture: Low PD group)
Constructs Comp:
Reliability R2 Communality
Cronbach’s
Alpha H2 Redundancy F2
AT 0.821 0.539 0.802 0.251
BI 0.804 0.215 0.507 0.674 0.190 0.018 0.086
BU 0.861 0.110 0.611 0.798 0.361 0.012 0.045
GS 0.853 0.542 0.793 0.330
IS 0.845 0.526 0.791 0.306
NAT 0.908 0.711 0.866 0.501
PEOU 0.891 0.022 0.672 0.840 0.432 0.012 0.014
PU 0.833 0.172 0.501 0.751 0.252 0.009 0.075
RF 0.799 0.501 0.715 0.173
SE 0.948 0.901 0.914 0.533
SN 0.828 0.492 0.756 0.228
TF 0.783 0.490 0.797 0.213
Average 0.130 0.583 0.013
GoF 0.275
Reliability and goodness of fit of the model (Culture: High PD group)
AT 0.817 0.528 0.752 0.103
BI 0.858 0.397 0.603 0.779 0.175 0.095 0.040
BU 0.863 0.224 0.612 0.790 0.450 0.057 0.024
GS 0.824 0.485 0.733 0.378
IS 0.839 0.510 0.761 0.277
NAT 0.869 0.626 0.822 0.538
PEOU 0.895 0.061 0.681 0.842 0.496 0.042 0.005
PU 0.874 0.414 0.584 0.819 0.243 0.069 0.083
RF 0.822 0.539 0.710 0.136
SE 0.928 0.866 0.848 0.642
SN 0.842 0.516 0.766 0.193
TF 0.865 0.616 0.795 0.212
Average 0.274 0.597 0.066
GoF 0.405
Note: H2 = Constructs cross-validate communality F2 = Construct cross-validate redundancy
GoF = Goodness of Fit index = 34� � ��5��65 �7889:�;<=>
Table 5. 55: Overall overview of results and GoF of moderator PD
Table 5.56 presents the estimated path relations in both sub-models with the tests of the
differences. Within sub-model low PD paths TF�BU (β=0.16 or 16% and t=1.18), BI�BU
(β=0.11 or 11% and t=1.01), IS�BU (β=0.12 or 12% and t=1.48), GS�PU (β=0.07 or 7%
and t=1.20), and IS�PU (β=0.120 or 12% and t=1.92) were different from the overall
sample model. The highest significant path within sub-model low PD was between PU�BI
(β=0.35 or 35% and t=4.75) and lowest one was between SN�PEOU (β=0.14 or 14% and
t=2.36). Within sub-model high PD all the paths were similarly significant like the overall
sample model with little change in the significance level. The highest significant path within
sub-model high PD was PU�BI (β=0.31 or 31% and t=4.59) and lowest one was between
RF�BI (β=0.17 or 17% and t=2.27).

279
In the interest of checking the differences between two sub-models parametric t-test and
non-parametric Smith-Satterthwait were computed. Results indicates that groups were
different at path IS�PU (t=2.01 and t=2.0). Specifically, IS�PU was insignificant in sub-
model low PD (β=0.12 or 12% and t=1.92) but was highly significant in sub-model high PD
(β=0.29 or 29% and t=4.67). Based on the results, hypotheses H17b was partially supported
and H17a, H17c and H17d were completely rejected.
Hypothesis
Combined Dataset(n=380) Low PD (n=198) High PD(n=182) Parametric
test of
difference
Smith-
Satterthwait
test Path (t-value) R-
Square Path (t-value)
R-
Square Path (t-value)
R-
Square
TF -> BU 0.1435
(2.6076)**
0.126
0.1642 (1.1812)Not Sig.
0.110
0.1937 (2.6545)**
0.224
0.184 0.188
SE -> BU 0.0041
(0.0818)Not Sig. -0.1502
(1.7963)Not Sig. 0.1012
(1.546)Not Sig. 1.347 1.369
RF -> BU -0.0141
(0.2555)Not Sig. 0.0091
(0.0854)Not Sig. 0.0213
(0.28)Not Sig. 0.092 0.093
PU -> BU 0.0139
(0.1968)Not Sig. 0.0537
(0.6062)Not Sig. -0.0074
(0.0765)Not Sig. 0.469 0.467
BI -> BU 0.1941
(3.4228)*** 0.1126
(1.0174)Not Sig. 0.196
(2.2161)* 0.584 0.589
GS -> BU 0.0055
(0.0866)Not Sig. 0.0918
(0.9529)Not Sig. -0.0563
(0.7349)Not Sig. 1.193 1.204
IS -> BU 0.1802
(3.2638)** 0.1204
(1.4849)Not Sig. 0.2311
(2.9912)** 0.987 0.988
SN -> PU 0.2203
(3.9937)***
0.269
0.2079 (2.8556)**
0.172
0.2302 (2.9721)**
0.414
0.211 0.210
PEOU -> PU 0.281
(5.8124)*** 0.2565
(3.7198)*** 0.2651
(3.6792)*** 0.086 0.086
GS -> PU 0.1208
(2.3049)* 0.0722
(1.2051)Not Sig. 0.2148
(3.4078)*** 1.945 1.940
IS -> PU 0.208
(4.6002)*** 0.125
(1.9268)Not Sig. 0.2936
(4.6771)*** 2.016 2.007
TF -> BI -0.0359
(0.6647)Not Sig.
0.265
-0.0964 (1.088)Not Sig.
0.215
0.0142 (0.2215)Not Sig.
0.397
0.999 1.011
AT -> BI 0.2439
(5.1168)*** 0.1853
(2.3275)* 0.2582
(3.2515)** 0.649 0.648
NAT -> BI 0.0282
(0.6458)Not Sig. 0.1
(1.6344)Not Sig. -0.0676
(0.7711)Not Sig. 1.592 1.567
PEOU -> BI 0.0232
(0.4562)Not Sig. -0.0683
(0.8631)Not Sig. 0.1025
(1.2895)Not Sig. 1.525 1.523
PU -> BI 0.3421
(7.5819)*** 0.3519
(4.7576)*** 0.3184
(4.5963)*** 0.330 0.330
RF -> BI 0.1715
(3.5596)*** 0.2062
(2.4278)* 0.173
(2.2724)* 0.290 0.291
SE -> BI -0.0124
(0.2125)Not Sig. -0.1454
(1.7083)Not Sig. 0.1308
(1.5644)Not Sig. 2.316 2.315
SN -> BI 0.0252
(0.5275)Not Sig. 0.035
(0.4436)Not Sig. 0.0493
(0.6976)Not Sig. 0.134 0.135
SN -> PEOU 0.1836
(4.1729)*** 0.034
0.1488 (2.3625)*
0.022 0.2472
(4.1777)*** 0.061 1.136 1.138
Table 5. 56: Structural relations and path significance difference of moderator PD
5.6.4.3.4. Uncertainty Avoidance
The four items measuring cultural construct UA were based on seven-point Likert-scale
ranging from strongly-disagree to strongly-agree. The overall mean of the construct was
6.35/7 which suggests that there was very high UA in respondents in the context of the
study. Using median-split method, metrically scaled construct UA was transformed into two
level dichotomous construct, where one was low on UA (n=237, 62%, mean=6.0) and
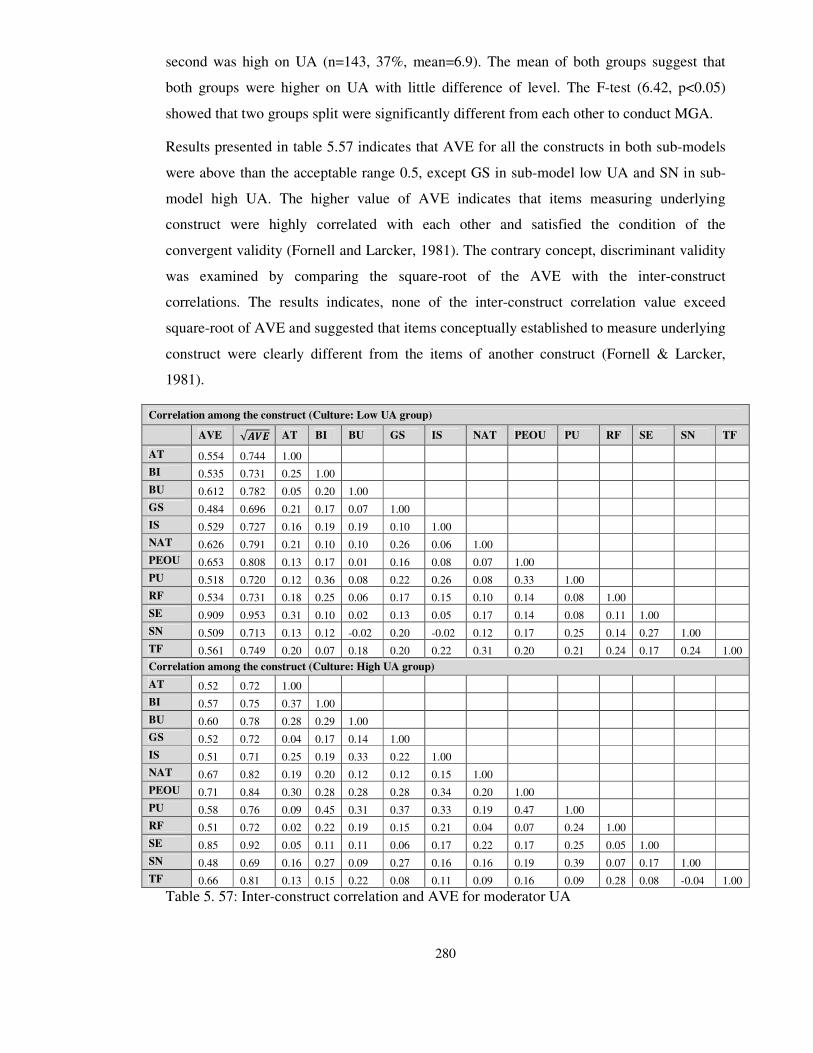
280
second was high on UA (n=143, 37%, mean=6.9). The mean of both groups suggest that
both groups were higher on UA with little difference of level. The F-test (6.42, p<0.05)
showed that two groups split were significantly different from each other to conduct MGA.
Results presented in table 5.57 indicates that AVE for all the constructs in both sub-models
were above than the acceptable range 0.5, except GS in sub-model low UA and SN in sub-
model high UA. The higher value of AVE indicates that items measuring underlying
construct were highly correlated with each other and satisfied the condition of the
convergent validity (Fornell and Larcker, 1981). The contrary concept, discriminant validity
was examined by comparing the square-root of the AVE with the inter-construct
correlations. The results indicates, none of the inter-construct correlation value exceed
square-root of AVE and suggested that items conceptually established to measure underlying
construct were clearly different from the items of another construct (Fornell & Larcker,
1981).
Correlation among the construct (Culture: Low UA group)
AVE √012 AT BI BU GS IS NAT PEOU PU RF SE SN TF
AT 0.554 0.744 1.00
BI 0.535 0.731 0.25 1.00
BU 0.612 0.782 0.05 0.20 1.00
GS 0.484 0.696 0.21 0.17 0.07 1.00
IS 0.529 0.727 0.16 0.19 0.19 0.10 1.00
NAT 0.626 0.791 0.21 0.10 0.10 0.26 0.06 1.00
PEOU 0.653 0.808 0.13 0.17 0.01 0.16 0.08 0.07 1.00
PU 0.518 0.720 0.12 0.36 0.08 0.22 0.26 0.08 0.33 1.00
RF 0.534 0.731 0.18 0.25 0.06 0.17 0.15 0.10 0.14 0.08 1.00
SE 0.909 0.953 0.31 0.10 0.02 0.13 0.05 0.17 0.14 0.08 0.11 1.00
SN 0.509 0.713 0.13 0.12 -0.02 0.20 -0.02 0.12 0.17 0.25 0.14 0.27 1.00
TF 0.561 0.749 0.20 0.07 0.18 0.20 0.22 0.31 0.20 0.21 0.24 0.17 0.24 1.00
Correlation among the construct (Culture: High UA group)
AT 0.52 0.72 1.00
BI 0.57 0.75 0.37 1.00
BU 0.60 0.78 0.28 0.29 1.00
GS 0.52 0.72 0.04 0.17 0.14 1.00
IS 0.51 0.71 0.25 0.19 0.33 0.22 1.00
NAT 0.67 0.82 0.19 0.20 0.12 0.12 0.15 1.00
PEOU 0.71 0.84 0.30 0.28 0.28 0.28 0.34 0.20 1.00
PU 0.58 0.76 0.09 0.45 0.31 0.37 0.33 0.19 0.47 1.00
RF 0.51 0.72 0.02 0.22 0.19 0.15 0.21 0.04 0.07 0.24 1.00
SE 0.85 0.92 0.05 0.11 0.11 0.06 0.17 0.22 0.17 0.25 0.05 1.00
SN 0.48 0.69 0.16 0.27 0.09 0.27 0.16 0.16 0.19 0.39 0.07 0.17 1.00
TF 0.66 0.81 0.13 0.15 0.22 0.08 0.11 0.09 0.16 0.09 0.28 0.08 -0.04 1.00
Table 5. 57: Inter-construct correlation and AVE for moderator UA
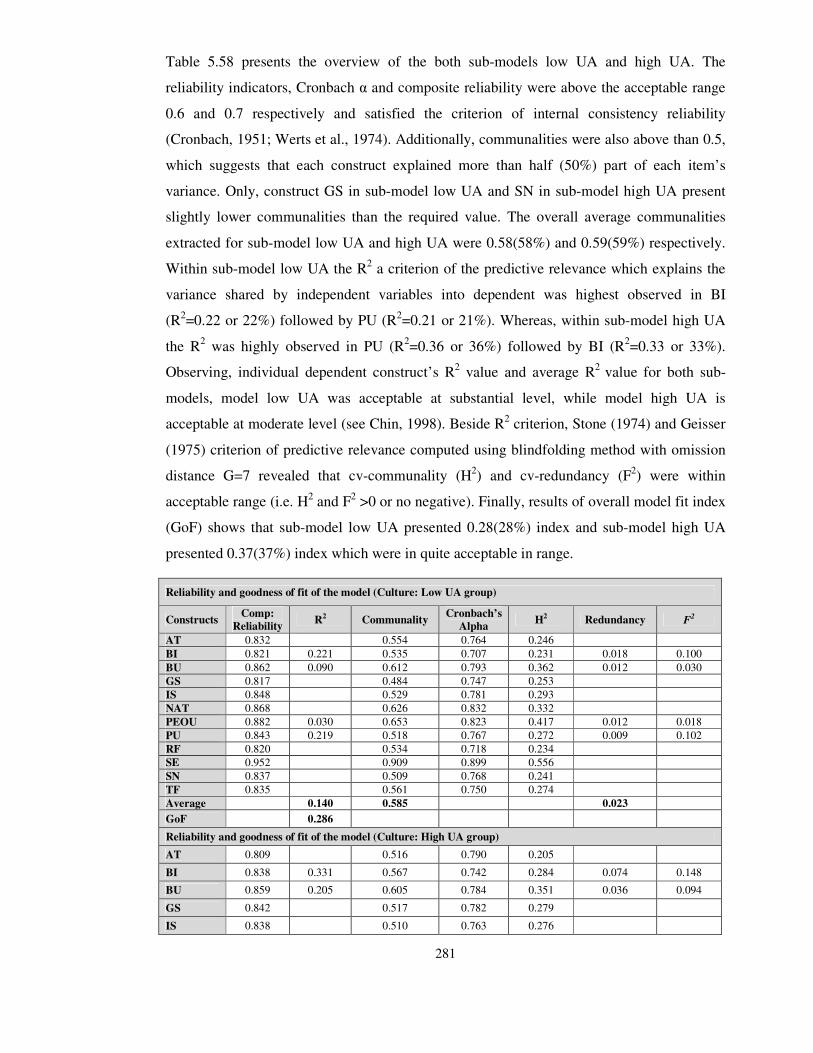
281
Table 5.58 presents the overview of the both sub-models low UA and high UA. The
reliability indicators, Cronbach α and composite reliability were above the acceptable range
0.6 and 0.7 respectively and satisfied the criterion of internal consistency reliability
(Cronbach, 1951; Werts et al., 1974). Additionally, communalities were also above than 0.5,
which suggests that each construct explained more than half (50%) part of each item’s
variance. Only, construct GS in sub-model low UA and SN in sub-model high UA present
slightly lower communalities than the required value. The overall average communalities
extracted for sub-model low UA and high UA were 0.58(58%) and 0.59(59%) respectively.
Within sub-model low UA the R2 a criterion of the predictive relevance which explains the
variance shared by independent variables into dependent was highest observed in BI
(R2=0.22 or 22%) followed by PU (R2=0.21 or 21%). Whereas, within sub-model high UA
the R2 was highly observed in PU (R2=0.36 or 36%) followed by BI (R2=0.33 or 33%).
Observing, individual dependent construct’s R2 value and average R2 value for both sub-
models, model low UA was acceptable at substantial level, while model high UA is
acceptable at moderate level (see Chin, 1998). Beside R2 criterion, Stone (1974) and Geisser
(1975) criterion of predictive relevance computed using blindfolding method with omission
distance G=7 revealed that cv-communality (H2) and cv-redundancy (F2) were within
acceptable range (i.e. H2 and F2 >0 or no negative). Finally, results of overall model fit index
(GoF) shows that sub-model low UA presented 0.28(28%) index and sub-model high UA
presented 0.37(37%) index which were in quite acceptable in range.
Reliability and goodness of fit of the model (Culture: Low UA group)
Constructs Comp:
Reliability R2 Communality
Cronbach’s
Alpha H2 Redundancy F2
AT 0.832 0.554 0.764 0.246
BI 0.821 0.221 0.535 0.707 0.231 0.018 0.100
BU 0.862 0.090 0.612 0.793 0.362 0.012 0.030
GS 0.817 0.484 0.747 0.253
IS 0.848 0.529 0.781 0.293
NAT 0.868 0.626 0.832 0.332
PEOU 0.882 0.030 0.653 0.823 0.417 0.012 0.018
PU 0.843 0.219 0.518 0.767 0.272 0.009 0.102
RF 0.820 0.534 0.718 0.234
SE 0.952 0.909 0.899 0.556
SN 0.837 0.509 0.768 0.241
TF 0.835 0.561 0.750 0.274
Average 0.140 0.585 0.023
GoF 0.286
Reliability and goodness of fit of the model (Culture: High UA group)
AT 0.809 0.516 0.790 0.205
BI 0.838 0.331 0.567 0.742 0.284 0.074 0.148
BU 0.859 0.205 0.605 0.784 0.351 0.036 0.094
GS 0.842 0.517 0.782 0.279
IS 0.838 0.510 0.763 0.276
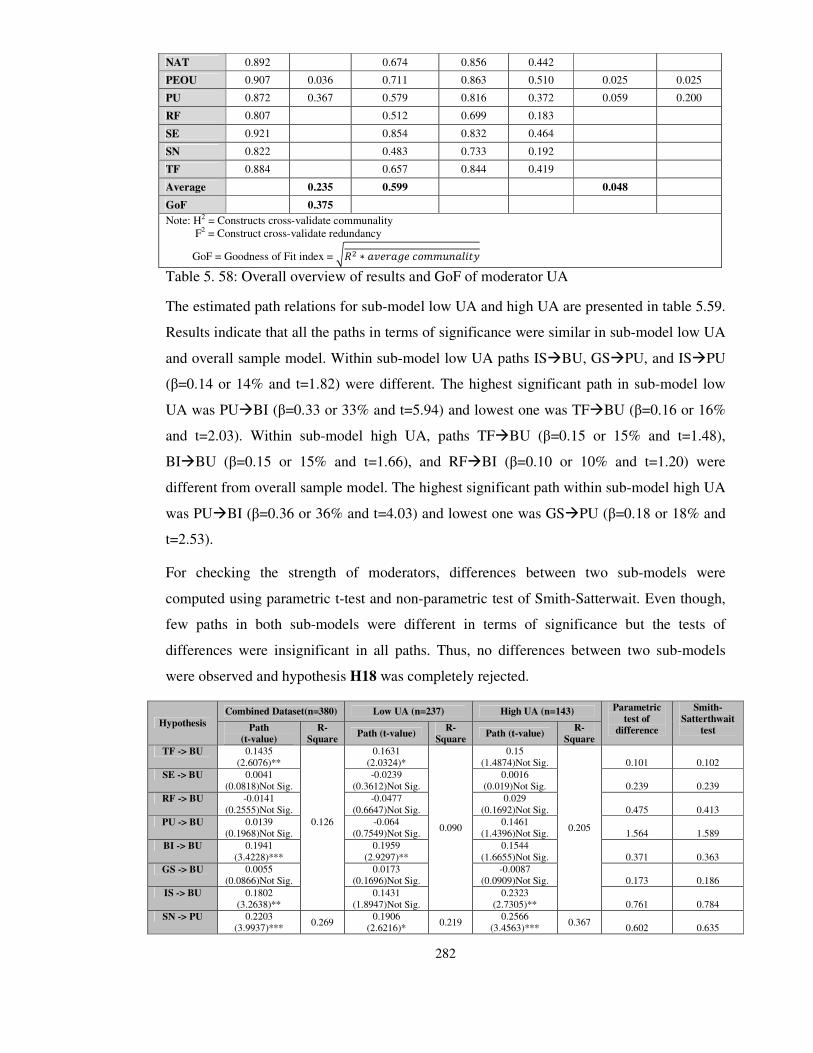
282
NAT 0.892 0.674 0.856 0.442
PEOU 0.907 0.036 0.711 0.863 0.510 0.025 0.025
PU 0.872 0.367 0.579 0.816 0.372 0.059 0.200
RF 0.807 0.512 0.699 0.183
SE 0.921 0.854 0.832 0.464
SN 0.822 0.483 0.733 0.192
TF 0.884 0.657 0.844 0.419
Average 0.235 0.599 0.048
GoF 0.375
Note: H2 = Constructs cross-validate communality F2 = Construct cross-validate redundancy
GoF = Goodness of Fit index = 34� � ��5��65 �7889:�;<=>
Table 5. 58: Overall overview of results and GoF of moderator UA
The estimated path relations for sub-model low UA and high UA are presented in table 5.59.
Results indicate that all the paths in terms of significance were similar in sub-model low UA
and overall sample model. Within sub-model low UA paths IS�BU, GS�PU, and IS�PU
(β=0.14 or 14% and t=1.82) were different. The highest significant path in sub-model low
UA was PU�BI (β=0.33 or 33% and t=5.94) and lowest one was TF�BU (β=0.16 or 16%
and t=2.03). Within sub-model high UA, paths TF�BU (β=0.15 or 15% and t=1.48),
BI�BU (β=0.15 or 15% and t=1.66), and RF�BI (β=0.10 or 10% and t=1.20) were
different from overall sample model. The highest significant path within sub-model high UA
was PU�BI (β=0.36 or 36% and t=4.03) and lowest one was GS�PU (β=0.18 or 18% and
t=2.53).
For checking the strength of moderators, differences between two sub-models were
computed using parametric t-test and non-parametric test of Smith-Satterwait. Even though,
few paths in both sub-models were different in terms of significance but the tests of
differences were insignificant in all paths. Thus, no differences between two sub-models
were observed and hypothesis H18 was completely rejected.
Hypothesis
Combined Dataset(n=380) Low UA (n=237) High UA (n=143) Parametric
test of
difference
Smith-
Satterthwait
test Path
(t-value)
R-
Square Path (t-value)
R-
Square Path (t-value)
R-
Square
TF -> BU 0.1435 (2.6076)**
0.126
0.1631 (2.0324)*
0.090
0.15 (1.4874)Not Sig.
0.205
0.101 0.102
SE -> BU 0.0041 (0.0818)Not Sig.
-0.0239 (0.3612)Not Sig.
0.0016 (0.019)Not Sig. 0.239 0.239
RF -> BU -0.0141 (0.2555)Not Sig.
-0.0477 (0.6647)Not Sig.
0.029 (0.1692)Not Sig. 0.475 0.413
PU -> BU 0.0139 (0.1968)Not Sig.
-0.064 (0.7549)Not Sig.
0.1461 (1.4396)Not Sig. 1.564 1.589
BI -> BU 0.1941 (3.4228)***
0.1959 (2.9297)**
0.1544 (1.6655)Not Sig. 0.371 0.363
GS -> BU 0.0055 (0.0866)Not Sig.
0.0173 (0.1696)Not Sig.
-0.0087 (0.0909)Not Sig. 0.173 0.186
IS -> BU 0.1802 (3.2638)**
0.1431 (1.8947)Not Sig.
0.2323 (2.7305)** 0.761 0.784
SN -> PU 0.2203 (3.9937)***
0.269 0.1906
(2.6216)* 0.219
0.2566 (3.4563)***
0.367 0.602 0.635

283
PEOU -> PU 0.281 (5.8124)***
0.2544 (5.0385)***
0.3195 (4.6662)*** 0.777 0.765
GS -> PU 0.1208 (2.3049)*
0.1216 (1.8688)Not Sig.
0.1827 (2.5383)* 0.608 0.629
IS -> PU 0.208 (4.6002)***
0.1456 (1.8211)Not Sig.
0.233 (3.7897)*** 0.871 0.866
TF -> BI -0.0359 (0.6647)Not Sig.
0.265
-0.0996 (1.506)Not Sig.
0.221
0.0532 (0.5087)Not Sig.
0.331
1.302 1.235
AT -> BI 0.2439 (5.1168)***
0.1781 (2.8329)**
0.3093 (3.8487)*** 1.286 1.285
NAT -> BI 0.0282 (0.6458)Not Sig.
0.0412 (0.4004)Not Sig.
0.0621 (0.915)Not Sig. 0.147 0.170
PEOU -> BI 0.0232 (0.4562)Not Sig.
0.022 (0.326)Not Sig.
-0.017 (0.2062)Not Sig. 0.362 0.366
PU -> BI 0.3421 (7.5819)***
0.3374 (5.9468)***
0.3664 (4.0312)*** 0.286 0.271
RF -> BI 0.1715 (3.5596)***
0.2092 (3.1556)**
0.1032 (1.2034)Not Sig. 0.981 0.978
SE -> BI -0.0124 (0.2125)Not Sig.
0.0084 (0.1226)Not Sig.
-0.0363 (0.4194)Not Sig. 0.405 0.406
SN -> BI 0.0252 (0.5275)Not Sig.
-0.0023 (0.0319)Not Sig.
0.0735 (0.9602)Not Sig. 0.693 0.723
SN -> PEOU 0.1836 (4.1729)***
0.034 0.1728 (3.0993)**
0.030 0.1903 (2.0571)*
0.036 0.173 0.162
Table 5. 59: Structural relations and path significance difference of moderator UA
5.6.5. Post-analysis using AMOS
Even though, at the initial stage of the data analysis CBSEM method of analysis (e.g.
AMOS, LISERAL) were rejected due to violation of the multivariate normality i.e. Mardia’s
coefficient (see section 5.6.2), but at this stage of the study researcher adopted one of the
CBSEM’s widely accepted technique AMOS to re-run the model. Reason behind this re-
examination is to enhance the reliability of the model by verifying the paths significance and
goodness-of-fit with two different approaches in the paradigm of SEM. Also the re-
examination of the model overcomes the limitation of the research approach biasness by
using component-based SEM method PLS. As the model is already evaluated using CFA
and SEM with PLS approach, therefore, recommended one-step approach (Hair et al., 2006;
Fornell & Yi, 1992) is applied to re-assure the path significance. Standardised and
unstandardised regression weights output of the AMOS model with similar construct run
into PLS are presented in figure A-4 and A-5 appendix-A respectively. Only, construct SE
was excluded from the AMOS model because of having lower standardised regression
weight.
Table 5.60 presents the regression weights. Observing the results, it is clearly visible that
path significant in PLS were also significant in AMOS. For example, paths significant in
PLS model i.e. PU�BI, PEOU�PU, SN�PU, SN�PEOU, TF�BU, RF�BI, AT�BI,
BI�BU, IS�PU, IS�BU, GS�PU were also significant in AMOS model. The path value
represented by estimates in AMOS were slightly higher than the path values in PLS (β). For
example, in AMOS PU�BI path value was 0.44(44%), while it was 0.34(34%) in PLS.

284
Contrary the critical ratio (C.R) similar to t-value in PLS was bit lower observed in AMOS.
For instance PU�BI was 2.52 in AMOS and was 7.58 in PLS. Apart from these difference,
the significance level (p-value) in both models was similar. The squared multiple correlation
(SMC) analogous to the determination of coefficient (R2) in PLS, revealed that highest
variation was explained into construct BI (0.34 or 34%) followed by nearly same PU (0.33
or 33%), BU (0.14 or 14%) and PEOU (0.044 or 4%). Compared to the PLS (R2) values,
SMC values computed using AMOS were clearly higher.
H.
No.
Path
Relations Estimate
Standard
Error C.R. P
Supported/Not-
Supported
H1a. PU -> BI .448 .081 5.520 *** Supported
H1b. PU -> BU -.047 .101 -.463 .644 Not-Supported
H2. PEOU -> BI .006 .038 .161 .872 Not-Supported
H3. PEOU -> PU .193 .040 4.841 *** Supported
H4. SN -> BI .001 .052 .023 .981 Not-Supported
H5a. SN -> PU .241 .055 4.388 *** Supported
H5b. SN -> PEOU .250 .076 3.297 *** Supported
H6a. SE -> BI Excluded Excluded Excluded Excluded Not-Supported
H6b. SE -> BU Excluded Excluded Excluded Excluded Not-Supported
H7a. TF -> BI -.007 .035 -.201 .840 Not-Supported
H7b. TF -> BU .119 .050 2.361 .018 Supported
H8a. RF -> BI .085 .031 2.728 .006 Supported
H8b. RF -> BU -.028 .044 -.654 .513 Not-Supported
H9a. AT -> BI .167 .048 3.456 *** Supported
H9b. NAT -> BI .002 .026 .077 .938 Not-Supported
H10. BI -> BU .354 .120 2.943 .003 Supported
H11a. IS -> PU .286 .061 4.672 *** Supported
H11b. IS -> BU .290 .086 3.372 *** Supported
H12a. GS -> PU .145 .047 3.060 .002 Supported
H12b. GS -> BU -.010 .063 -.160 .873 Not-Supported
Table 5. 60: Structural path relations using AMOS
Table 5.61 presents the overview of model fitting criterions. As, it was not objective to
examine the data using AMOS, therefore details of each criterion are briefly summated into
single table. Based on literature (Hair et al., 2006; Kline, 2005; Arbuckle, 2006), fit
measures were grouped into majorly three groups i.e. absolute fit index, incremental fit
index and parsimonious fit index. Using AMOS values obtained were presented in last
column of the table. Against the assumption, it was found that χ2 (chi-square) and normed
chi-square (χ2/df) were significant which indicate that model does not fit with the data.
However, because the chi-square statistic is very sensitive to the sample size it was more
appropriate to look at other fit measures (Hair et al., 2006). Fortunately, other fit measures

285
indicated that model was well fitted with the data (CMIN/DF = 1.708, RMSEA = 0.043, CFI
= 0.900) (see table 5.61).
Fit index Description Acceptable fit Value obtained
using AMOS
Absolute fit index
Chi-square (χ2) Is minimum value of discrepancy, used to
test the null hypothesis that the estimated
variance-covariance matrix deviate from the
sample. It is sample sensitive. The more the
implied and sample moments differ, the
bigger the chi-square statistic, and the
stronger the evidence against the null
hypothesis.
Non-Significant at
least p>0.005
1159.775,
p<0.000
Normed Fit Chi-
Square CMIN/DF (χ2 /
df)
Is minimum discrepancy divided by its
degree of freedom. Value close to 1
indicates good fit but less than 1 implies
over fit
Close to 1 is
good, but should
not exceed to3
1159.775/679=1.
708, p<0.000
Goodness-Of-Fit Index
(GFI)
Represents the comparison of the square
residual for the degree of freedom, obtained
through ML (maximum likelihood) and
ULS(unweighted least squares )
Value >0.95 good
fit; value 0.90-
0.95 adequate fit
.865
Adjusted Goodness-
Of-Fit Index (AGFI)
Is based over the degree of freedom. Very
often used due to lower predictability across
the applications. Value is not bounded by 0
and 1
Value >0.95 good
fit; value 0.90-
0.95 adequate fit .845
Root Means Square
Error of
Approximation
Residual (RMSEA)
Is population discrepancy function which
implies that how well the fitted model
approximates per degree of freedom.
Value<0.05 good
fit; value 0.08-
0.05 adequate fit
.043
Incremental fit index
Buntler-Bonett
Normed Fit Index
(NFI)
Represents a comparative index between the
proposed and baseline model (not adjusted
for df). The effect of sample size is strong
Value >0.95 good
fit; value 0.90-
0.95 adequate fit
.791
Comparative Fit Index
(CFI)
Is improved version of NFI and identical to
Relative non-centrality Index (RNI).
Represents the comparative index between
proposed and baseline model adjusted for df.
It is highly recommended index for fitness
of model
Value >0.95 good
fit; value 0.90-
0.95 adequate fit
.900
Tucker Lewis Index
(TLI)
Is opposite of NFI and called as non-NFI or
NNFI. Represents the comparative index
between proposed and baseline model
adjusted for df
Value >0.95 good
fit; value 0.90-
0.95 adequate fit
.891
Parsimonious fit index
Parsimony Goodness-
Fit Index (PGFI)
Degree of freedom is used to adjust the GFI
value using parsimony ratio.
Higher value
compared to the
other model is
better
.916
Parsimony Normed Fit Degree of freedom is used to adjust the NFI Higher value .725

286
Index (PNFI) value based on parsimony ratio compared to the
other model is
better
Table 5. 61: Overall overview of results and model fitting using AMOS
Conclusion
This chapter started with the preliminary results of the pilot study. The results of the pilot
study were satisfactory and confirmed that the instrument was reliable and valid to collect
the full scale data. The data was collected using self-administrated survey and e-mail survey
method in the higher educational institutes of the Pakistan in 2009. In the first step of
analysis, the returned data from main survey was screened-out through statistical techniques-
missing data, outliers, normality, homoscedasticity and non-response biasness. The amount
of missing data was very little (0.3 to 1.1) at item-level and (0.3 to 1.6) at construct-level;
additionally Little’s MCAR test revealed that patterns of missing data were completely at
random, therefore remedies to overcome the missing data problem were ignored. The z-
scores showed that there were only 12/380 univariate outliers. Mahalanobis D2 score showed
that only 7 multivariate outliers were present. Observing the nature of outliers from box plot
it was found that all the outliers were mild in nature therefore they were retained to ascertain
the generalisation. The P-P plot along with the results of skewness and kurtosis suggested
that data was normal at univariate level. However, significance of K-S test at construct level,
significance of Levene’s test of homogeneity, and significance of Mardia’s coefficient’ (i.e.
228.527, CR=39.88) revealed that assumption of multivariate normality was violated.
Consequently, rather than using CBSEM approach (e.g. AMOS) which best performs on
multivariate normal data, PLS was selected as primary approach of analysis. The assumption
of multicollinearity examined using bivariate Pearson correlation and multiple regression
showed that r, VIF and tolerance effect were within acceptable range which suggested the
absence of multicolinearity. Finally, data was checked for non-response error from
respondents using Mann-Whitney-U test between early and late respondents. All the results
were insignificant which suggest that there was no difference between the early and late
respondents response.
In next step, descriptive statistics of screened demographic data was reported. The response
rate was 40.6% (n=380). The largest number of respondents based on age was academics
having age 20-29 years (n=152, 40%), based on academic position were lecturer (n=204,
53.7%), based on academic experience were academics having experience 1-5 years (n=131,

287
34.5%), based on educational level were having degree masters (n=290, 76.3%). The ratio of
sample obtained from public universities was 54.5% (n=207) and from private universities
was 45.5% (n=173). The descriptive of the Internet usage experience shows that most of the
users were having experience of 6-10 years (n=159, 41.8%). The descriptive of the reforms
initiated by higher education commission (HEC) of the Pakistan revealed that largest method
of the Internet access within universities was broadband (n=329, 86%). The response
pertaining to the resources availability to use the Internet was partially observed, as 52.11%
(n=198) were agreed and remaining 44.47% (n=169) were not agreed about the availably of
the resources. Regarding to the access of digital library project, large number of respondents
(n=105, 27.63%) were unaware and remaining were very irregular to utilise the digital
library resources. Similarly, response of registered Pakistan research repository (PRR)
network was negligible (n=36, 9.4%). However, the willingness of respondents to upload
their research work on PRR was very high (n=307, 80.7%). Finally the descriptive of
participation into e-learning programs showed that large number of respondents (n=320,
84.2%) had never participated in such programs.
In the third step of analysis, reliability and validity of all the constructs were examined,
followed by exploratory factor analysis (EFA) to group the multiple items that belongs to the
same construct. Based on Kaiser’s criterion of eigenvalue 13 components were extracted
which explained total 61.7% variance. The highest variance was explained into construct PU
(13.27%). During EFA items AT4, RF1, SE6, and GS5 were deleted due to cross-loading
with other components. Factor extracted based on EFA were parallel examined using Scree
plot and Monto Carlo method. Similar process of EFA was applied for the construct of
cultural dimensions and all the items were loaded into underlying construct except PD5.
Total variance explained by the cultural dimensions was 54.35%.
In fourth step of the analysis, assessment and testing of the proposed model was performed
using structural equation modelling (SEM) with two-step approach. In first step,
measurement model was evaluated to observe the items and constructs reliability,
discriminant validity and convergent validity. Results revealed that constructs within model
fitted well with underlying measuring items; therefore none of the item was deleted at that
stage. In second step, structural model was evaluated to examine the hypothetical relations
presented in framework. The criterion of model fitting R2 and GoF suggested that model was
fitted at moderate level with the data. The highest variance explained by the independent
constructs to dependent was almost similar into PU and BI (R2=26%). Out of total 20 paths
representing 12 hypotheses, 11 were supported and 9 were unsupported. The predicative
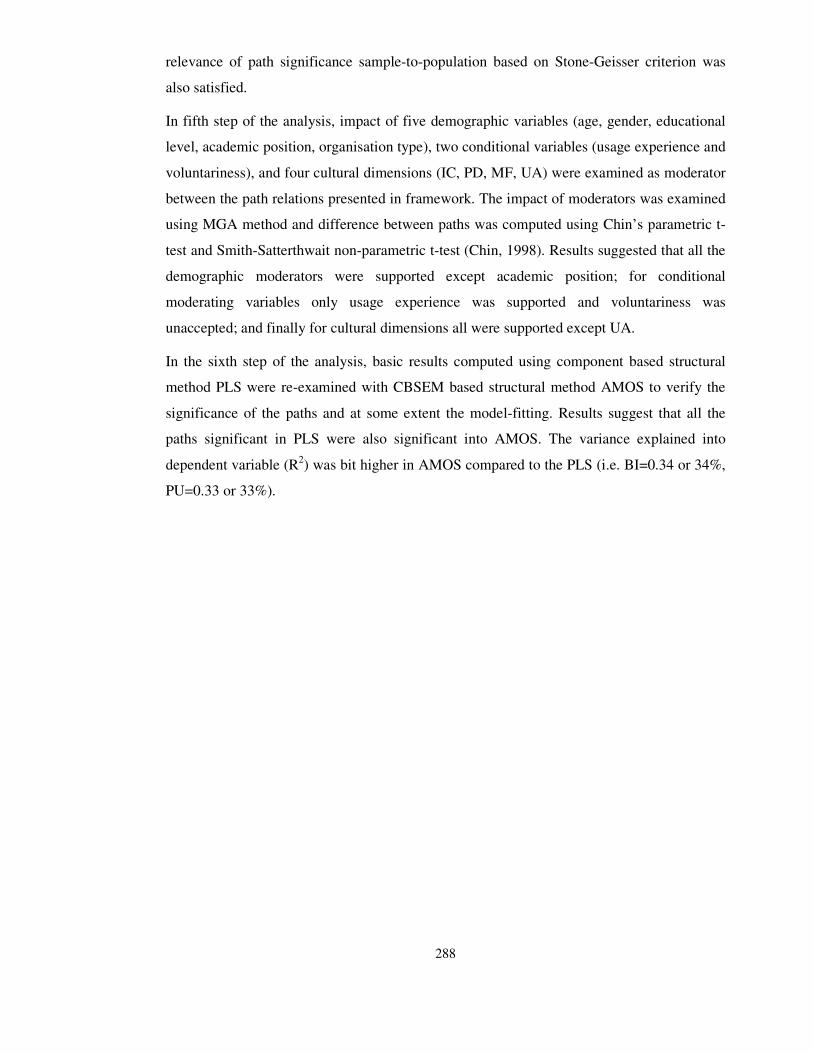
288
relevance of path significance sample-to-population based on Stone-Geisser criterion was
also satisfied.
In fifth step of the analysis, impact of five demographic variables (age, gender, educational
level, academic position, organisation type), two conditional variables (usage experience and
voluntariness), and four cultural dimensions (IC, PD, MF, UA) were examined as moderator
between the path relations presented in framework. The impact of moderators was examined
using MGA method and difference between paths was computed using Chin’s parametric t-
test and Smith-Satterthwait non-parametric t-test (Chin, 1998). Results suggested that all the
demographic moderators were supported except academic position; for conditional
moderating variables only usage experience was supported and voluntariness was
unaccepted; and finally for cultural dimensions all were supported except UA.
In the sixth step of the analysis, basic results computed using component based structural
method PLS were re-examined with CBSEM based structural method AMOS to verify the
significance of the paths and at some extent the model-fitting. Results suggest that all the
paths significant in PLS were also significant into AMOS. The variance explained into
dependent variable (R2) was bit higher in AMOS compared to the PLS (i.e. BI=0.34 or 34%,
PU=0.33 or 33%).
289
Chapter 6
Discussion and Synthesis
Introduction
The previous chapter presented a preliminary analysis of the pilot study and a rigorous
analysis of the findings of the main study. The aim of the previous chapter was to
empirically examine the potential predictors of behavioural intention to accept Internet
technology in a higher educational institute’s academic context. In doing so, the structural
model was evaluated with and without the moderating effect of demographic and cultural
dimensions. In alignment with the findings of the previous chapter, this chapter aims to
discuss the possible justifications for the significance and insignificance of the
relationships proposed in the conceptual model (see Figure 6.1). Specifically, followed by
the introduction, section (6.1) presents a discussion of the findings of the basic extended
model, which aims to answer the question of how do predictors of perceived behavioural
beliefs, social and control beliefs, management support at institutional and governmental
level, and task characteristics influence individuals’ beliefs towards acceptance of Internet
technology? Next, section (6.2) presents a discussion of the findings obtained by
examining the moderating impact of demographic and cultural characteristics. This helps
to understand how the moderating impact of demographic characteristics (age, gender,
organisational type, academic position, educational level, experience usage and
voluntariness) and cultural dimensions (MF, IC, PD, UA) influence the individuals’
perceptions when accepting Internet technology. Finally, a summary of the chapter is
presented.
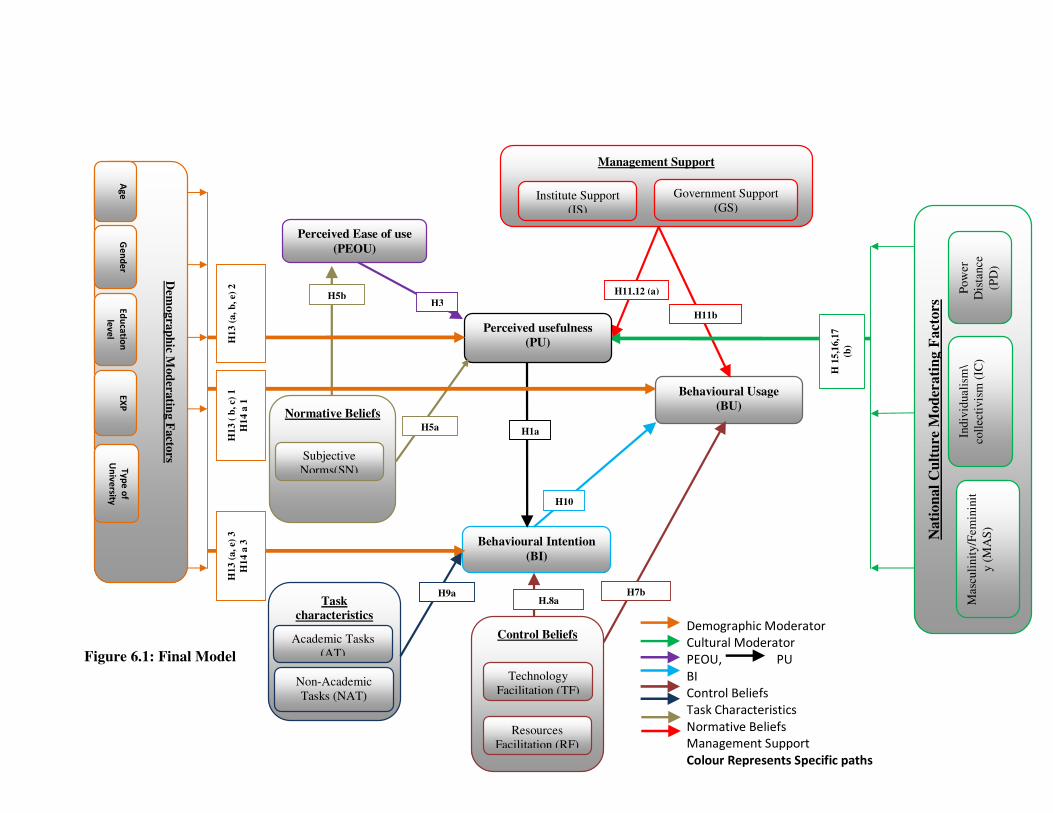
290
Figure 6.1: Final Model
Demographic Moderator
Cultural Moderator
PEOU, PU
BI
Control Beliefs
Task Characteristics
Normative Beliefs
Management Support
Colour Represents Specific paths
Behavioural Usage
(BU)
Behavioural Intention
(BI)
H10
Management Support
Government Support (GS)
Institute Support (IS)
H11,12 (a)
H11b
H 1
5,1
6,1
7
(b)
Na
tio
na
l C
ult
ure
Mo
der
ati
ng
Fact
ors
Mas
culi
nit
y/F
emin
init
y (
MA
S)
Indiv
idual
ism
\
coll
ecti
vis
m (
IC)
Pow
er
Dis
tance
(PD
)
Perceived usefulness
(PU)
H1a
Perceived Ease of use
(PEOU)
H3
H,8a H7b
Control Beliefs
Technology Facilitation (TF)
Resources Facilitation (RF)
Task
characteristics
Academic Tasks (AT)
Non-Academic Tasks (NAT)
H9a
H5a
H5b
Normative Beliefs
Subjective Norms(SN)
H1
3 (
b, c)
1
H1
4 a
1
H1
3 (
a,
e) 3
H1
4 a
3
H1
3 (
a,
b, e)
2 D
emogra
ph
ic Mod
eratin
g F
acto
rs
EX
P
Ty
pe
of
Un
ive
rsity
Ge
nd
er
Ag
e
Ed
uca
tion
lev
el
291
6.1. Discussion of the results: Extended model
This research set out to meet the research objectives presented in chapter 1. In the extended
model without moderation effect, initially total 12 hypotheses with 23 paths were
proposed, but due to merger of two determinants (PI and SI in SN) same 12 general
hypotheses were representing 20 path relations. The rationale behind segregating the
hypotheses into a number of relations was in order to understand the in-depth exploratory
impact of the each construct’s relation as moderated by demographic and cultural
dimensions on the acceptance of the individuals’ behaviour. A summary of all the paths is
presented in chapter 5, table 5.25. The results revealed that the partial relations were
significant i.e., out of 20 paths 11 were supported and 9 were unsupported. By grounding
the related constructs from the well-known accepted models TRA, TAM, TAM2, DTPB
and UTAUT into the extended model and then applying them to a non-Western and non-
North American context, it showed that an explanatory power of model within BI was
accepted at a moderate level (R2= 26% using PLS, and R2=34% using AMOS), which is
slightly lower than the TAM’s persistence explanatory power (R2=40%). The lower
explanatory power is consistent with the inherent limitation of the cultural bias in the TAM
and models based on the TAM’s conceptualisation (e.g., Straub, Keil & Brenner, 1997;
Srite & Karahanna, 2006; Teo et al., 2009; Alsajjan & Dennis, 2010). For example Straub,
Keil & Brenner (1997) examined the TAM across three countries and found that the model
shared similar variance within both a U.S. and Swiss context (R2=10% in each) but was
very low in a Japanese context (R2=01% only). Closely observing the cultural
characteristics measured by Hofstede (1980) for the Japanese context and current study
context (i.e., Pakistan), it is observed that both countries tend towards greater power
distance, collectivist sentiments and are higher on uncertainty avoidance which may limit
their Internet usage and result in a disassociation from the intention to accept. Similar
results were found by Teo et al (2009) who examined TAM within Singapore and
Malaysian context. Teo et al., found clear difference in terms of beliefs explaining
behavioural intention, such that effect was stronger in Malaysian context (i.e. 53%)
compared to the Singapore context (i.e. 8% only). Supported by Straub et al. (1997),
findings regarding the TAM’s cultural bias and difference in explanatory power are further
substantiated by reproducing the findings of the extended model in different cultural
groups in chapter 5, section (5.6.4.3). In the following section an explanation of each group
of hypotheses in the extended framework is presented.
292
6.1.1. Behavioural beliefs
For achieving the objective of observing how behavioural beliefs influence individuals’
intentions beliefs towards acceptance of Internet technology, three path relations with two
hypotheses were proposed:
H1a: PU�BI; H1b: PU�BU; H2: PEOU�BI; H3: PEOU�PU.
The SEM results in table 5.25 provided empirical evidence that hypothesis H1 was
partially supported i.e., H1a was significant and H1b was insignificant; while H2 was
completely insignificant and H3 was highly significant. In accordance with the TAM
(Davis, 1989; Davis, Bagozzi & Warshaw, 1989) and with previous literature (e.g.,
Venkatesh & Morris, 2000; Venkatesh, Morris & Ackerman, 2000; Venkatesh & Davis,
1996; Pai & Huang, 2011) it is found that the total effect of PU was significant and greater
than PEOU on BI (H1a, H2). However, notwithstanding Davis’ suggestions, an
insignificant relation between PEOU and BI was observed (H2). This is not uncommon
and has occurred in many other studies (e.g., McCoy, Everard & Jones, 2005; Abbasi, Irani
& Chandio, 2010). The most significant relation between PEOU, PU and BI has always
been between PU and BI (Alsajjan & Dennis, 2010). These findings are relevant to the
context of the current study, which suggests that the respondents (academics) are driven to
accept the Internet primarily on the basis of its usefulness, which is established by
perceiving relative advantages. A possible explanation for the insignificant relation of
PEOU on BI can be derived from the study of Davis (Davis, 1986) itself, who argued that
the impact of PEOU may influence BI indirectly through PU. Table 5.25 indicates that
PEOU has an indirect effect on BI via a strong direct significance on PU (H3). This result
suggests that PEOU increased the perception of usefulness of the Internet technology.
Similar result were also found by Venkatesh et al. (2003) in UTAUT with a direct effect of
effort expectancy (i.e., PEOU) on performance expectancy (i.e., PU), and by Alsajjan and
Dennis (2010) in Internet banking acceptance model with a effect of perceived
manageability (similar to PEOU in this study) on PU. In addition, strong evidence in
literature is present (e.g., Davis, 1989; Davis, Bagozzi & Warshaw, 1989; Taylor & Todd,
1995a; Mathieson, 1991; Yi et al., 2006; Teo et al., 2009; Pai & Huang, 2011; Teo, 2010)
supporting the relationship between PEOU on PU.
The insignificant relation of PEOU and BI (H2) is consistent with the prior research (e.g.,
Gefen & Straub, 2000; Abbasi, Irani & Chandio, 2010) which suggests that the perception
of ease of use primarily influences the potential adopters’ usage intention. For example
293
Gefen & Straub (2000) found that new technology was adopted due to extrinsic
motivations (i.e., PU) rendering intrinsic motivations insignificant (i.e., PEOU). Therefore,
it can be inferred that PEOU can only influence the intention and use when intrinsic
characteristics of the technology contribute to the actual usage. Additionally, the impact of
PEOU on BI and BU is found to be inconsistent in relation to the usage experience and
complexity of the system, that is, the impact is stronger when the users have less
experience and the technology is more complex to use (Igbaria et al., 1997; Kim, Choi &
Han, 2009). In the sample of the current study most of the respondents (academics) self-
estimated themselves as moderate (n=184) to higher (n=176) with regard to their Internet
usage experience, therefore, as much as respondents were gaining experience with the
Internet technology, more cognitive considerations emerged and insignificance in the
intended behaviour was expected. An additional possible explanation could be that
technological usage, specifically the Internet within the context of the study (i.e., higher
educational institutes in Pakistan), is still new. Consequently, respondents might be willing
to use the Internet but due to scarcity of resources they are discouraged. Nevertheless, the
relation of PEOU on BI and BU is consistently found to be significant in information
systems literature, but in some cases it was also found to be statistically insignificant (e.g.,
Hu, Clark & Ma, 2003; Wu & Wang, 2005). Reasonably in some of the recent literature
effect of PEOU on BI is completely excluded (e.g. Alsajjan & Dennis, 2010; Ha & Stoel,
2009).
Finally, contrary to the TAM, the effect of PU on BU (H1b) was found to be insignificant.
This insignificance is consistent with Straub, Keil & Brenner (1997) study which found
cultural bias within the TAM. Authors, found an insignificant impact of PU on BU in the
Japanese context (similar to the current study’s context), while it was found to be
significant in the context of the U.S. and Switzerland (ibid). An additional possible
explanation could be given on the basis of usage experience, which suggests that higher
usage experience creates an enjoyment effect, which in turn minimises the significance of
PU (Chin, Marcolin & Newsted, 1996). This lower or even negative impact of PU
moderated by perceived enjoyment (i.e., higher in usage experience) is also reported in
previous literature (e.g. Davis, 1989; Davis, Bagozzi & Warshaw, 1989; Igbaria et al.,
1997; Igbaria, 1993; Abbasi, Irani & Chandio, 2010; Kim, Choi & Han, 2009). In the
current study, as defined earlier, respondents had moderate to higher usage experience,
which might have given rise to an enjoyment effect, and consequently the impact of PU
294
became weaker. Further clarification of this impact is given in the discussion of section
(6.2.1.6) where experience is examined as a core moderator.
6.1.2. Normative beliefs
Within the extended model the second objective was to observe how perceived normative
beliefs will influence an individual’s behavioural and intentional beliefs towards
acceptance of Internet technology. Initially, based on Taylor and Todd's (1995a) study,
conceptualisation of normative beliefs in the framework were incorporated as peer
influence (PI) and superior influence (SI). Six paths represented the two hypotheses as
follows:
H4a: PI�BI; H4a: SI�BI; H5a: PI�PU; H5b: SI�PU;
H5c: PI�PEOU; H5d: SI�PEOU
However, after EFA both constructs PI and SI were loaded into a single component with
highest factor loading of PI followed by SI (see table 5.18). This suggests that respondents
(academics) were more influenced by their peers and colleagues in comparison with their
superiors. Based on the EFA results, both factors PI and SI were merged into one construct
as subjective norms (SN). Thus, the previous six paths and two hypotheses were converted
into three path relations representing two hypotheses as follows:
H4: SN�BI; H5a: SN�PU; H5b: SN�PEOU
In this study the grouped PI and SI construct in SN is also consistent with previous
literature. For example, SN was studied in TRA (Ajzen & Fishbein, 1980; Fishbein &
Ajzen, 1975), TAM2 (Venkatesh & Davis, 2000), TPB (Ajzen, 1991), DTPB (Taylor &
Todd, 1995a), and A-TAM (Taylor & Todd, 1995b). SN were also studied as social
influence in UTAUT (Venkatesh et al., 2003) which is defined as individuals’ perception
about particular behaviour influenced by the judgment of others. Similarly it was studied as
image in IDT (Rogers, 1995).
The results in table 5.25 provide empirical evidence that hypothesis H4 was completely
rejected; while H5 was fully accepted. These results are in accordance with TAM2
(Venkatesh & Davis, 2000) and recent literature (e.g. Baker, Al-Gahtani & Hubona, 2010;
Teo, 2010) which suggest that the opinions of professional co-workers and superiors play a
major role in developing the behavioural beliefs towards acceptance intention. The
insignificant impact of SN on BI (H4) is not common and Davis (Davis, 1989; Davis,
Bagozzi & Warshaw, 1989) decided to remove SN from the original model for this very

295
reason. However, in later studies SN was added with the caution of time and experience
(Venkatesh & Morris, 2000; Venkatesh & Davis, 2000). For instance, Venkatesh & Davis
(2000) found that the direct impact of SN on BI became weaker with the passage of time
and experience usage. This implies that users in early/before technology implementation
were less familiar with technology and its benefits, and thus for developing intention they
rely more on other people’s opinions. With the passage of time users acquires direct
experience and knowledge about the system’s strengths and weaknesses; this lessens the
influence of others in shaping their own intentions. An identical effect was found in
literature by Morris and Venkatesh (2000) which states that SN become weaker over time.
Additionally Taylor & Todd (1995b) and Karahanna and Straub (1999) reported that the
relative impact of SN on BI intention was higher for the respondents with less experience.
In the current study, as stated earlier, most of the respondents (academics) had moderate to
high usage experience which they gained with the passage of time, therefore their cognitive
consideration towards intention to accept technology (i.e., the Internet) was based on self-
reliance experience rather than the opinion of others.
The significance of the path SN on PU (H5a) is in accordance with the TAM2 (Venkatesh
& Davis, 2000) and literature (e.g. Baker, Al-Gahtani & Hubona, 2010; Kim, Kim & Shin,
2009), which posits that SN can influence BI indirectly through PU by the process of
internalisation effect. The literature also supports indirectly the effect of PEOU on BI via
PU (Davis et al., 1992); therefore the indirect impact of SN on PU via PEOU (H5b)
consistent with literature (e.g. Alsajjan & Dennis, 2010; Teo, 2010) was also expected in
this study. The internalisation refers to the process by which individuals refine their own
behavioural beliefs by incorporating the opinion of the important referents (Venkatesh &
Davis, 2000). It is different from the normative beliefs where individuals form their
intentions by taking others’ opinions as evidence of reality (ibid). Additionally, it is
noticed that the effect of SN on the BI to accept the technology through the indirect
relation of PU tends to disappear with increased experience and voluntary usage conditions
(e.g., Venkatesh et al., 2003; Hu, Clark & Ma, 2003; Venkatesh & Davis, 2000; Yi et al.,
2006). In the context of the study (higher educational institutes in Pakistan), the overall
mean of the usage conditions (i.e., voluntariness) was 3.18/7.0, which suggests that the
usage of the technology (the Internet) was mandatory. Therefore, the significant impact of
SN on behavioural beliefs (PU and PEOU) was expected and met the conditions of the
literature discussed.

296
6.1.3. Control beliefs
The third objective within the extended model was to observe how perceived control
beliefs will influence individuals’ behavioural and intentional beliefs towards acceptance
of Internet technology. Similar to the normative beliefs, perceived behavioural beliefs were
adopted from the decomposed theory of the planned behaviour (Taylor & Todd, 1995a).
Based on Ajzen (1991), the conceptualisation impact of PBC (i.e., beliefs regarding access
to the resources and opportunities needed to perform behaviour) were examined in two
groups of the constraints: internal constraints and external constraints. The internal
constraints refer to the construct self-efficacy (Bandura, 1977), which reflects one’s self-
appraisal of his/her ability to perform specific tasks. To examine SE, two path relations
representing one hypothesis were parsed as:
H6a: SE�BI; H6b: SE�BU
Whereas external constraints refers to the construct facilitation condition (Triandis, 1979),
which reflects the availability of the resources (e.g., time, money and specialised
resources) needed to engage in specific behaviour. For in-depth understanding, FC was
examined with the help of two control beliefs, one related to the resource factors (time and
money) and the other relating to technology compatibility issues that may constrain usage.
Hence, four path relations representing two hypotheses were examined:
H7a: TF�BI; H7b: TF�BU; H8a: RF�BI; H8b: RF�BU
The results in chapter 5, table 5.25 revealed that hypothesis H6 was completely rejected,
H7 and H8 were partially supported (i.e., H7b and H8a were accepted, and H7a and H8b
were rejected). Contrary to the literature (e.g., Mathieson, 1991; Compeau and Higgins,
1995a; Mathieson, Peacock and Chin, 2001; Hasan & Ahmed, 2010; Wang & Wang,
2010), SE produced an insignificant effect on BI and BU (H6a and H6b). One possible
explanation could be that SE showed uncertain properties within the model. For instance,
during psychometric examinations of the survey, the overall reliability of the construct was
lower than the required value (0.49); one item, SE3 (‘I could complete my tasks using the
Internet if there is no one around me to tell what to do as I go’), produced very low
corrected item-to-total correlation (0.06). Contrary to the recommendations (Pallant, 2007),
the item was retained up to EFA. Within the EFA item, SE6, (‘I could complete my tasks
using the Internet if I had enough time provided to use it’) was excluded due to cross-
loading. The remaining items of SE were loaded into two groups. The first group of items
represented individuals who were more comfortable using the Internet on their own, while
297
the other group represented individuals who were more comfortable getting help to use the
Internet. Following the requirement of items per factor (Hair et al., 2006), only the first
group was examined in the extended model, which produced an insignificant effect.
Apart from the lower construct fitting into the model, another justification could be given
from the previous literature, which referred to SE as a similar concept to both PEOU
(Davis, 1989; Alsajjan & Dennis, 2010) and internal control (Venkatesh & Morris, 2000).
It was observed and discussed in H2 that there was an insignificant relation between PEOU
and BI, therefore, due to similarities in the concept, a lower perception of PEOU resulted
in a lower evaluation of self-efficacy. This insignificant effect of SE is also consistent with
previous studies e.g., Lewis et al., (2003) found an insignificant effect of SE on PU,
Venkatesh et al., (2003) found an insignificant effect on BI, and Hsu & Chiu (2004) found
an insignificant effect on e-service satisfaction. Finally, the insignificance of SE can be
explained with the awareness of technology in the current context of the study. It is
possible and it was observed that technology awareness is getting easier in the educational
institutes of Pakistan and academics increasingly socialised using technology. As a result it
is becoming ubiquitous within and outside of work situations. Therefore, it might be
possible that the relevance of SE as an important construct due to the awareness of
technology in explaining acceptance intention is becoming eroded with the passage of
time.
The results in table 5.25 revealed that the proposed paths related to external constraints,
which is facilitation conditions (TF and RF), were partially supported. During EFA item,
RF1 (‘Use of the Internet in my university is free of cost’) was excluded due to lower
factor loading. The justification behind the partial support for the hypothetical relations
related to the FC (it includes both TF and RF) could be given from the study of Taylor &
Todd (1995a), who argued that lack of FC represents a barrier to use and may inhibit the
shaping of intention. However the reverse may not be assumed as encouragement. In other
words, the availability of TF and RF may or may not impact on usage and intention
behaviour, but equally, usage and intention are less likely to be expected with reference to
less time, money and decreased technical compatibility.
In literature, the impact of FC on BI and BU is examined through the perception of
behaviour control (PBC) (Taylor & Todd, 1995a; Mathieson, 1991; Taylor & Todd, 1995b;
Mathieson, Peacock & Chin, 2001; Puschel et al., 2010), which is moderated by experience
(Taylor & Todd, 1995b). For example, within A-TAM it was observed that the relation
298
between PBC with BI and BU decreased with increased experience (Taylor & Todd,
1995b). Similar results were found by Venkatesh et al. (2003) during the development of
UTAUT. The author reproduced the results using TBP and DTPB and found that the
impact of PBC on BI was moderated by experience, so that PBC decreased with increased
experience. As mentioned earlier, the majority of the respondents (academics) in this study
had moderate to high experience of the technology (the Internet) and therefore more
chances of insignificance were expected. However, observing the clear impact of the
experience, table 5.44 revealed that paths TF on BU (H7b) and RF on BI (8Ha) were only
significant with individuals with less experience, and this supports the previous literature.
A possible explanation behind the insignificant relation of TF on BI (H7a) and RF on BU
(H8b) could be the insignificant relation of facilitation conditions (i.e., combined TF and
RF items) on intention in UTAUT (Venkatesh et al., 2003). Venkatesh et al. (2003) found
that in the presence of construct effort expectancy (similar to PEOU in this study) and
performance expectancy (similar to PU in this study), the effects of FC were insignificant
on BI and BU. Therefore, the significance of PU on BI (H1a) could be a possible reason
for the insignificance of FC. The mixed results (partially significant) for FC are also found
in the previous literature. For example, in TPB and DTPB, the path was significant.
However, in other cases MPCU and IDT paths were insignificant (for review see
Venkatesh et al., 2003).
6.1.4. Task characteristics
The fourth objective within extended model was to examine the importance of task
characteristics towards individuals’ acceptance behaviour, with one hypothesis and two
path relations:
H9a: AT�BI; H9b: NAT�BI
The SEM results in table 5.25 provide empirical evidence that hypothesis H9 was partially
supported (i.e. H9a was accepted and H9b was rejected) and suggest that academics
primarily adopted technology (Internet) due to relevance within academic task (AT).
Recalling the conceptual framework (chapter 3, section 3.24) where AT were considered as
routine-task and NAT as non-routine, results of the present hypothesis are contrary to the
literature. For instance, Goodhue & Thompson (1995) within TTF found strongest effect of
non-routine tasks compared to routine tasks. One of the possible rational for this result can
be understood from the study of Dishaw and Strong (1999). By combining both TTF and
TAM authors found that precursors of utilisation (i.e. behavioural beliefs and attitude)
299
were reflected with situational conditions (i.e. voluntariness and mandatory) (ibid).
Therefore, recalling the discussion (in section 6.2.1.7) and considering similarities with
normative beliefs it was expected that effect of routine-task (i.e. mandatory most likely
imposed by supervisors) would be higher than the non-routine task (i.e. voluntary for the
purpose of self-interest). In addition to this, even in voluntary settings, effect of technology
(Internet) was expected higher in AT due to relevance with job characteristics. This is
consistent with the literature which utters that element of acceptance of any innovation is
based on its need at work (Roger, 1983; Compeau and Higgins, 1995; Larsen et al., 2009).
For instance, Laresen et al. (2009, p. 780) posit that if the technology meets the
requirement of the specific work tasks, than there is higher probability that the technology
will contribute to improve the job performance. In contrary to this, Leonard-Barton and
Deschamps (1998, p-1255-56) posit that if task has less relevance, than individual’s may
have lower perceived importance and needs push from the higher management.
Considering job requirements, which is similar to job-relevance and perception of
usefulness (see conceptual framework Section 3.2.1) the effect of AT was highly expected.
In addition, looking at direct and indirect effect in table A-7 appendix-A, it was noticed
that identical to PU conceptualisation in TAM, path of AT was significant on both BI as
well as on BU.
6.1.5. Behavioural intention towards behavioural usage
The fifth objective of the study was to examine the direct relationship between behaviour
intention and behaviour usage. The hypothesis investigated was:
H10: BI�BU
Consistent with the TAM, TRA, and TPB (Davis, 1989; Davis, Bagozzi && Warshaw,
1989; Ajzen, 1991; Ajzen & Fishbein, 1980; Fishbein & Ajzen, 1975), the theoretical
underpinnings of this study found usage behaviour to be a direct determinant of behaviour
intention (table 5.25). This significance corroborates the possibility of placing the extended
technology acceptance model in the context of non-Western academics’ Internet
acceptance. The pragmatic inclusion of behaviour intention as a mediator between key
determinants of cognitive intention and usage was to increase the predictive power of the
model (Taylor & Todd, 1995a). Albeit, a significant impact of intention dictating usage
behaviour substantiates previous findings (e.g., Davis, 1989; Davis, Bagozzi & Warshaw,
1989; Taylor & Todd, 1995a; Venkatesh & Morris, 2000; Venkatesh et al., 2004; Morris &
Venkatesh, 2000; Ajzen & Fishbein, 1980; Taylor & Todd, 1995b; Igbaria & Chakrabarti,
300
1990; Igbaria & Iivari, 1995; Shih & Fang, 2004; Szajna, 1996; Szajna, 1994; Szajna &
Scamell, 1993) but the paths of beliefs which shaped intention revealed an ineffective
significance on usage behaviour. Arguably, there may be several possibilities but one is the
operationalisation of measures to examine the behaviour. The measures used to examine
the usage were similar to intention with a different scale i.e., intentions were observed
using a scale of agree/disagree, and usage was observed by asking the frequency of future
willingness. Due to the cross-sectional approach, usage frequency was not examined for
understanding the differences over time. In other words, measures to examine the usage
were self-assessed questions to measure the similar concept of intention. Therefore, the
significance of the paths concerning usage also supported the higher intention regarding
acceptance.
6.1.6. Management support: institutional and governmental level
Within the extended model the sixth objective was to present the empirical evidence that
institutional and governmental forces in terms of management support exhibit a significant
and differential impact on the key determinants of the behavioural beliefs and usage
towards the acceptance of Internet technology. A total of four causal paths representing
two hypotheses were investigated as:
H11a: IS�PU; H11b: IS�BU; H12a: GS�PU; H12b: GS�BU
The results in table 5.25 show that the relationship between low-level management i.e.,
institute support (IS), was positively significant with respondents’ (academics) behavioural
belief i.e., PU and usage or BU (H11a and H11b). However, the relationship was partly
supported in the context of top-level management i.e., government support (GS) (H12a).
The significance of management support (similar to organisational support) is in
accordance with theoretical speculation which reported the influence of the external
variables over the formation of the individuals’ cognitive acceptance behaviour through
behavioural beliefs i.e., PU and PEOU (Davis, 1989; Davis, Bagozzi & Warshaw, 1989;
Szajna, 1996; Szajna, 1994; Szajna & Scamell, 1993). This significance also highlights the
importance of management support as a key predictor, and the lack of it as a critical barrier
to acceptance and success (e.g., Yoon, Guimaraes & O'Neal, 1995; Igbaria et al., 1997).
Pragmatically, the significance of the relationship is consistent with previous literature in
the context of organisational support (e.g., Davis, Bagozzi & Warshaw, 1989; Igbaria &
Chakrabarti, 1990; Thompson, Higgins & Howell, 1991; Igbaria, 1990; DeLone, 1988;
Leonard-Barton & Deschamps, 1988; Monge, Cozzens & Contractor, 1992; Monge et al.,

301
1998; Kim & Kim, 2008) and specifically within management support towards PU and
system usage (e.g., Lewis, Agarwal & Sambamurthy, 2003; Igbaria et al., 1997; Igbaria,
1994; Igbaria & Tan, 1997; Abdul-Gader & Kozar, 1995; Rouibah et al., 2009).
In accordance with Lewis et al.’s (2003) term ‘institutional factors’, the findings of the
current study suggest that when respondents (academics) were aware of their future
visions, their efforts regarding support and recognition, encouragement and incentives, and
finally their importance for the institute or government, they showed a positive response
towards behavioural beliefs and usage. In other words, management, in terms of
commitment and support, influenced academics’ beliefs about the usefulness and usage of
technology (the Internet). This relationship was inevitable in terms of the context of the
study, as discussed earlier: the government of Pakistan recently initiated mega-projects for
encouraging technological use in the higher educational system in order to enhance the
research skills of academics. One of these projects is entitled e-Reforms and includes the
Pakistan Education and Research Network (PERN), the Digital Library, the Pakistan
Research Repository (PRR), and the Campus Management Solution (CMS) (HEC PAK,
2009). In addition, the government has invited many foreign investors to invest in
upgrading the basic IT infrastructure and broadband facility. Promotions and upgradings
which were previously given on the basis of seniority are now based on research efforts
and skills. Consequently, technology and Internet usage in order to improve skills are
becoming necessary for academics. Therefore, the support of management in terms of
resource allocation and recognising individuals’ efforts was likely to promote the
perceived usefulness and usage of technology acceptance.
The higher impact of IS (fully supported) compared with GS (partly supported) can be
understood through the analogy of Miller & Toulouse (1986) who reported a higher impact
of the chief executive officer (CEO) in the context of small firms. Similarly, in the context
of this study (higher educational institutes) academics were more likely be influenced by
lower-level management i.e., management at the level of institutes (chairs, deans, vice-
chancellors) compared with top management. Rationally, lower-level management have an
enormous influence via their face-to-face contact, the immediate effect of their expressed
goals, and preferences. Indeed, this differentiated impact is consistent with Lewis et al.’s
(2003) findings that individuals were much influenced by their immediate supervisors due
to their day-to-day communication compared with top-management. Further support of this
difference is examined next with the moderating effect of the organisational context
(section 6.3.1.3).
302
6.2. Discussion of the results: moderators
6.2.1. Demographic characteristics
Beside establishing and examining the extended model, the second goal of this research
was to explore the difference evoked between segments of respondents (academics)
towards acceptance of the technology (the Internet) on the basis of their demographic
characteristics i.e., age, gender, organisational type, academic position, educational level,
experience and voluntariness. In the findings chapter, the researcher examined seven
moderating variables using the multiple-group analysis (MGA) method. Each examination
required splitting the sample into the desired group; differences between the paths’
parameters were scrutinised on the basis of parametric and non-parametric t-statistics.
Before explaining the brief discussion on the results below, it is important to assert that all
the relations in MGA were examined on the basis of exploratory approach. In other words,
rather than not validating each causal path presented in the extended model, only the paths
with significant difference were explored.
6.2.2.1.Age
Within demographic groups first moderator investigated was age, to know the influence of
exogenous variables on endogenous variables with the help of following proposed
hypotheses:
H13a1: (BI, PU, TF, RF, SE, IS, GS) X Age�BU
H13a2: (SN, PEOU, IS, GS) X Age�PU
H13a3: (PU, PEOU, TF, RF, SE, AT, NAT, SN) X Age�BI
H13a4: SN X Age�PEOU
The results in section (5.6.4.2.1) show that the model fitting for both the younger and older
age group was satisfied except predictive relevance in the older group. One possible reason
behind the unsatisfactory predictive relevance (i.e., cross-validity and redundancy of paths
by re-sampling method) could be the lower number of respondents in the older age group.
In this study, the age groups were split based on the research of Morris et al., (Morris,
Venkatesh & Ackerman, 2005) which suggests that the age range <39 represents younger
and ≥40 represents older groups. Therefore, in the older group the number of examined
respondents was only 91 and the remaining 289 were in the younger group. Although, age
became a potential moderator in this study and differences were observed but the
generalised observations for the older group should be treated with caution.
303
The R2 value (i.e., shared variance explained by predictors of criterion variable) was higher
in terms of instrumentality factor PU (R2=0.28 or 28% in both groups). However, in terms
of establishing cognitive intention towards acceptance, the older group was more sensitive
than the younger one i.e., R2=0.33 or 33% and R2 = 0.26 or 26% respectively. This finding
is consistent with Venkatesh et al.’s (2003) study in which the author reported that the
impact of performance expectancy (similar to PU) was higher in the younger age group. In
the current context of the study, this finding suggests that perception development towards
the acceptance of the Internet within higher educational institutes is primarily influenced
by perceiving positive intention in older academics, and perceiving usefulness in younger
academics.
Consistent with the TAMs (Davis, 1989; Davis, Bagozzi & Warshaw, 1989), the highest
significant path within both groups was PU�BI. However, the lowest significant path in
the younger group was GS�PU, and in the older group it was SN�PU. These results
suggest that both groups perceived the higher importance of technology (the Internet)
usefulness in their tasks, which in turn established positive intentions towards acceptance
behaviour. The impact of government support was also noticed in forming perceptions;
however, it was hardly observed in the younger age group. Finally, both groups were
significantly influenced by the normative factors (peer and superior influence) but older
age group respondents (academics), compared with the younger age group, paid very little
attention to the opinions of others when forming their own perceptions of technology
usefulness.
Before examining the impact of moderation, it is worth mentioning that age only evoked a
moderating impact when differences (variance) were computed based on parametric t-test.
However in terms of non-parametric t-test there was no moderating impact found. The
results show that age produced a moderating impact between two groups at path RF�BU
and PEOU�PU. For instance, RF�BU was negatively insignificant in the overall sample
and the older age group but it was positively insignificant in the younger age group.
Contrary to DTPB, A-TAM and UTAUT (Venkatesh et al., 2003; Taylor & Todd, 1995a;
Taylor & Todd, 1995b), which posits a positive relationship between PBC and facilitation
conditions towards usage, the path of resource facilitation (i.e., component of PBC in
DTPB) was insignificant in this study. Even though the path was insignificant in both
groups, the negative insignificance in older groups reveals that RF was much less
important for the older age group compared with the younger age group. This finding is
partly consistent with the study of Morris et al., (2005) which found that a higher age

304
reduced PBC due to lower SE and cognitive skills. Additionally, in recent study of Chung
et al., (2010) echoed previous literature and found negative relationship between age and
the Internet self-efficacy.
The second moderating impact PEOU�PU revealed that the path was significant in the
younger age group and was insignificant in the older age group. This finding can be
interpreted with the previous literature (Venkatesh et al., 2003; Wang et al., 2009) which
found a higher impact of effort expectancy (similar to PEOU in this study) in younger age
individuals only towards BI. Furthermore, it is also noticed that increased age shows an
association with difficulty in processing complex stimuli and allocating attention to task-
relevant knowledge (Plude, 1985). Consequently, older people are less likely to have
technological experience, exposure and information, and therefore less perception of the
importance of usefulness. These results suggest that hypothesis H13a was partially
supported, specifically H13a and H13b were supported and H13c and H13d were
unsupported.
6.2.2.2. Gender
The demographic variable gender was investigated to examine the following hypotheses:
H13b1: (BI, PU, TF, RF, SE, IS, GS) X Gender�BU
H13b2: (SN, PEOU, IS, GS) X Gender�PU
H13b3: (PU, PEOU, TF, RF, SE, AT, NAT, SN) X Gender�BI
H13b4: SN X Gender�PEOU
Section (5.6.4.2.2) presents the results obtained during the analysis of moderating variable
gender. The shared variance (R2) explained in dependent variable for the male group was
higher in BI followed by PU i.e., R2 = 0.30 or 30% and 0.24 or 24% respectively; whereas
in the female group the variance noticed was higher in PU followed by BI i.e., R2= 0.33 or
33% and 0.28 or 28% respectively. Theoretically and based on previous literature (e.g.,
Davis, 1989; Davis, Bagozzi & Warshaw, 1989; Taylor & Todd, 1995a), a higher variance
explained in BI was expected. However, in the female group a higher variance explained
PU was surprising at the first instance. Vigilantly examining the results of path
significance in table 5.32, it is found that within the female group, the overall sample data
significant path ratio was higher in the dependent variable PU compared with the BI.
Consequently PU shared the highest variance (i.e., the number of paths’ significance is
directly related to variance explained (Chin, 1998b)). This finding suggests that male

305
respondents (academics) accepted the technology (the Internet) primarily by perceiving the
direct impact of beliefs i.e., behavioural, social, control, support and task characteristics
over BI, whereas female respondents established acceptance intention via indirect effects
of perceived behavioural, social, control, support and task characteristics beliefs mediated
through the PU. Consistent with the TAM results, the highest significant path in both
groups was PU�BI. However, the lowest was IS�BU in the male and RF�BI in the
female group. This result suggest that management support at an institute level and
resource facilitation established behaviour intention of acceptance and usage behaviour but
their importance was very low compared with the other constructs.
The test of moderation showed that gender produced a significant moderating impact at
paths SE�BU and IS�PU. Regardless of the evidence that SE did not produce any
significant relation in the model (possibly due to weak psychometric properties), it showed
negative insignificant relation in the female group towards BU. One possible explanation is
given by social cognitive theory (SCT) (Bandura, 1986), which suggests that anxieties and
expectancies (i.e., SE and PEOU) are reciprocal with each other. Additionally, literature
(e.g., Bandura, 1977; Rosen & Maguire, 1990; Brosan, 1998; He & Freeman, 2009)
indicates that the lower the computer anxiety, the greater the experience, which indirectly
increases SE and in turn improves performance. In the context of gender IT acceptance
studies, literature (e.g., Igbaria & Chakrabarti, 1990; Brosnan & Lee, 1998; Schumacher &
Morahan-Martin, 2001; Weil & Rosen, 1995; He & Freeman, 2009) shows that women,
compared with men, had higher levels of computer anxiety and were more techno-phobic.
Consequently they were more reluctant to interact with technology and had perceived
lower ability of SE to perform tasks and established BU and BI.
The second path difference due to the moderating impact of gender IS�PU revealed that
the path was significant in the female group and insignificant in the male group. This result
suggests that female respondents (academics) gave a higher importance to the institute
support towards the PU of technology (the Internet). One possible explanation could be
inferred by recalling the discussion above which suggests that females were higher on
anxiety and lower on SE. It is obvious that when one’s self-appraisal of his/her ability to
perform a task decreases then he/she will be more interdependent and sensitive to the needs
of others. This argument is also supported in the literature (e.g., Venkatesh & Morris,
2000; Gefen & Straub, 1997; Bem, 1981; Wang et al., 2009; Hu et al., 2010) which
reported that women, as compared with men, are flexible towards compliance with orders
and most likely to accept behaviour if it is confirmed by a majority of people. These results

306
suggests that hypothesis H13b was partially supported. Specifically, H13b1 and H13b2
were supported and H13b3 and H13b4 were unsupported.
6.2.2.3. Organisational type
The third moderator was to examine the impact of organizational type (public and private)
over the relations of independent and dependent variables in the framework. Examination
of organisation type will help to evaluate the following hypotheses:
H13c1: (BI, PU, TF, RF, SE, IS, GS) X Org�BU
H13c2: (SN, PEOU, IS, GS) X Org�PU
H13c3: (PU, PEOU, TF, RF, SE, AT, NAT, SN) X Org�BI
H13c4: SN X Org� PEOU
Section (5.6.4.2.3) presents the results examined using MGA to observe the moderation
impact due to organisational context. The two models were compared by splitting the main
data into public organisations (n=207) and private organisations (n=173), which achieved a
moderate acceptable fit. Consistent with the TAM (Davis, 1989; Davis, Bagozzi &
Warshaw, 1989), both models shared highest and similar variance into dependent variable
BI i.e., R2= 0.36 or 36%, followed by PU (i.e., R2= 0.24 or 24% in public, R2= 0.21 or 21%
in private).
These results suggest that primarily the intention of acceptance within both organisations
was based on the direct impact of beliefs: behavioural, social, control, support and task
characteristics; and afterwards, via indirect effect, similar beliefs through the PU.
Specifically within public organisations, respondents were more influenced by the PU
compared with the private organisations. Consistent to the TAM (Davis, 1989; Davis,
Bagozzi & Warshaw, 1989), the highest significant path in both models was PU�BI, and
the lowest path was RF�BI in the public and GS�PU in the private organisation. The
possible explanation behind the weaker significance of the RF path in public organisations
and the GS path in private organisations is related to the type of management support. For
instance, in previous sections (6.2.1.2) it was noticed that respondents gave higher
importance to the perception of the immediate head of the organisation compared with the
top-level management. This impact is clearly visible in private organisations context where
the impact of IS�PU was much higher than in public organisations. Additionally,
GS�PU was totally insignificant in the context of public organisation and was weak
significant in the context of private organisations. The reason is obvious that in private

307
organisations the influence of low-level management (institute-level chairs and heads) is
perceived to be higher due to most of the assets ownership in the organisation.
Additionally, it is common for heads to be involved in most of the key decisions and
perhaps are the only individuals who can harness the technology on the basis of
compliance to achieve their objectives and goals. On the contrary, in public organisations
the use of technology is on a voluntary basis and respondents grant a lower importance to
both top- and low-level management. In these organisations individuals value their own
autonomy and in rare cases view hierarchical relationships between themselves and the
head of the organisations as an administrative necessity. Further authentication of this
compliance and voluntary use and their impact is examined in section (6.2.1.7).
The MGA show that two paths i.e., TF�BU and BI�BU were significantly different in
two organisational contexts. Specifically, TF in public and BI in private organisations
(universities) was insignificant. Recall that the discussion on those individuals in both
organisations, specifically in public, gave lower importance to top-level management
support (government support). Therefore, the related advantages of top-level management
in terms of encouragement (instrumental reward) and facilitation (money, time, and
technology) are also less perceived by individuals. This is the reason that not only TF, but
also RF were totally insignificant in the context of public organisations. This is contrary to
private organisations where low-level management has a higher influence on an
employee’s attitude to the acceptable importance of the technology and resource
facilitations of their acceptance behaviour. Observing the MGA result, hypothesis H13c
was partially supported, specifically, only H13c1 was supported and the remaining three
H13c2, H13c3, and H13c4 were unsupported.
6.2.2.4. Academic position
Moderating factor academic position was investigated to examine the following
hypotheses:
H13d1: (BI, PU, TF, RF, SE, IS, GS) X AC�BU
H13d2: (SN, PEOU, IS, GS) X AC�PU
H13d3: (PU, PEOU, TF, RF, SE, AT, NAT, SN) X AC�BI
H13d4: SN X AC�PEOU.
Section (5.6.4.2.4) presents the results of the MGA when observing the moderating impact
of academic position. Five groups based on hierarchical academic position were split into

308
two groups: lecturer (n=204) and higher position (n=176). Both models achieved
acceptable reliability, validity, explanatory power, predictive relevance and goodness of fit.
Consistent with the TAM (Davis, 1989; Davis, Bagozzi & Warshaw, 1989) based on
higher academic positions explained highest shared variance into BI (R2=0.28 or 28%)
followed by PU (R2=0.26 or 26%). However, the model based on the lecturer sample
presented the highest shared variance of belief PU (R2=0.33 or 33%) followed by BI
(R2=0.28 or 28%). The highest significant path in higher position academics was PU�BI
and the lowest was GS�PU, whereas the highest significant path in the lecturer group was
PEOU�PU and the lowest was SN�PU. This result suggests that the intentions of the
academics who held a higher position to accept technology (the Internet) were solely based
on the perception of instrumental outcome PU, while newer academics’ acceptance
intention was based on the PEOU. Both of these relations were consistent with Davis et
al.’s (1989) findings which reported the direct impact of behavioural beliefs (PU and
PEOU) over BI and an indirect of PEOU via PU over BI.
The results of the MGA show that there was no significant difference between the two
groups. It was noticed that academic position nearly moderated the path PEOU�PU (i.e.,
parametric t-test=1.95 and non-parametric t-test=1.933). Regardless of which path was
significant in both groups in the same direction, the results suggest that academics who
held the position of lecturer compared with those who held a higher position, perceived a
higher importance of PEOU toward BI via PU. In summary, the moderator of academic
position failed to produce an acceptable difference, and thus hypothesis H13d was
completely rejected.
6.2.2.5. Educational level
The final personal characteristic examined as a moderator was educational level, and
represent following hypotheses:
H13e1: (BI, PU, TF, RF, SE, IS, GS) X EL�BU
H13e2: (SN, PEOU, IS, GS) X EL�PU
H13e3: (PU, PEOU, TF, RF, SE, AT, NAT, SN) X EL�BI
H13e4: SN X EL�PEOU
The number of respondents (academics) was highest in the category of masters degree
(n=290) and so were lower in the categories of bachelor degree (n=39) and doctorate
degree (n=51). Due to the lower sample size in the bachelor and doctorate group, the fitting
309
of these models was slightly lower than an acceptable fit. In addition, out of twenty paths,
seven in the bachelor group and the majority of the doctorate group were different.
Therefore generalisation of the results of the moderating impact of educational level
requires cautious interpretation.
Consistent with the TAM (Davis, 1989; Davis, Bagozzi & Warshaw, 1989), the highest
shared variance (R2) explained in the bachelor and doctorate groups was in dependent
variable BI i.e., R2=0.60 or 60% and R2=0.57 or 57% respectively. However, in the
masters group, the shared variance was observed to be higher in PU followed by BI i.e.,
R2=0.34 or 34% and R2=0.25 or 25% respectively. These results suggest that a large
number of the respondents (academics in the masters group) established an intention to
accept technology through beliefs - behavioural, social, control, support and task
characteristics - mediated by the PU. Whereas respondents from the bachelor and doctorate
groups accepted the technology primarily on the basis of their cognitive behaviour
established directly through the behavioural, social, control, support and task
characteristics beliefs. In the bachelor group the highest significant path was between
AT�BI and the lowest was IS�BU; whereas consistent with TAM’s findings, the highest
significant path in the masters group was PU�BI and the lowest was RF�BI. Finally, in
the doctorate group the highest path was between GS�BU and the lowest was RF�BI.
The test of significance of differences using MGA shows that the level of education shows
a moderating effect at path SN�PU between the bachelor and the other two groups.
Specifically, the path was negatively significant in the bachelor group compared with
positively significant in the other two groups. The second difference was at path SE�BI
between the bachelor and the other two groups. As with the previous difference, this path
was negatively significant in the bachelor subgroup and was insignificant in the remaining
two groups. These results suggest that the sample with the lower level of education
perceived a negative impact of social norms and self-efficacy regarding the perception of
usefulness and intention.
The negative impact of SE over BI in the bachelor degree groups is consistent with the
previous literature that reported a negative impact of education with computer anxiety
(negative perception of usefulness and learning) and a positive impact on PU, attitude, BI
and BU (e.g., Igbaria, 1993; Igbaria, Pavri & Huff, 1989; Igbaria & Parasuraman, 1989;
Lymperopoulos & Chaniotakis, 2005). These studies reported empirical evidence that less
educated individuals possess insufficient knowledge, greater anxiety, and less sophisticated
310
cognitive structures to learn new things; consequently they are one of the main barriers
towards the acceptance of technology. Similarly Agarwal and Prasad (1999) and Calisir et
al., (2009) found a positive significant impact of education (higher) on the PEOU
(theoretically built on internal control also known as SE (Venkatesh & Morris, 2000)), as
less educated people would find technology cumbersome and strenuous to learn.
The negative impact of SN in the bachelor group is also related to the lower education
level. An increase in education empowers the users (e.g., high levels of knowledge,
experience, income, and higher position) and reduces the effect of social norms on their
behavioural beliefs. These negative relations can also be understood in terms of age and
academic position. It seems rational that an individual with a bachelor degree would be in a
lower academic position (lecturer) and would be younger (lower in age). This recalls the
discussion in sections (6.2.1.4 and 6.2.1.1) and results in tables 5.38 and 5.29, which show
similar results to those presented here. Specifically, regarding academic position, the
impact of SN over PU in the lecturer group was clearly lower to the academics who held
higher positions. Similarly, within the age group, the younger academics showed a
negative impact of SE over BI. Thus, hypothesis H13e was partially supported.
Specifically, H13e2 and H13e3 were supported and H13e1 and H13e4 were unsupported.
6.2.2.6. Experience usage
Apart from personal characteristics, in this study two moderating factors, experience and
voluntariness, were included from the UTAUT (Venkatesh et al., 2003) which showed a
significant impact in the literature of technology acceptance. In this regard, moderating
variable usage experience is examined to test the following hypotheses:
H14a1: (BI, PU, TF, RF, SE, IS, GS) X EXP�BU
H14a2: (SN, PEOU, IS, GS) X EXP�PU.
H14a3: (PU, PEOU, TF, RF, SE, AT, NAT, SN) X EXP�BI
H14a4: SN X EXP�PEOU
Section (5.6.4.2.6) presents the results of the MGA with the moderating effect of
experience. Before explaining the results of the moderation it is worth remembering that
experience in the current study was measured with the self-assessment measure anchored
as novice, moderate and highly experienced. A higher proportion of the sample assessed
themselves as moderate (n=184) than high (n=176) usage experienced. The sample were
split into two groups based on the median method to represent low (n=204) and high

311
(n=176) usage experience, but overall the mean (2.41/3) revealed that all the users had
good levels of technology (the Internet) usage experience. Furthermore, respondents were
also examined on the basis of usage history (in years). The results revealed that the
majority of the respondents had a usage experience of >6 years (mean=3.90/5). Finally the
cross-tabulation between self-assessed and years of usage revealed that the highest number
of users were moderate with six to ten years’ experience (n=84, 22.1%). Therefore,
generalising the results of the moderating factor experience requires cautious interpretation
of both high and low usage experience.
The model fitting in both groups was moderately accepted. Consistent with the TAM and
other studies in the context of North America, the highest shared variance within high
usage experience was observed in BI (R2=0.21 or 21%) followed by PU (R2=0.20 or 20%),
whereas in the low usage experience the group was explained by PU (R2=0.35 or 35%),
followed by BI (R2=0.33 or 33%). These results suggest that respondents with a higher
usage experience were directly influenced by the predictors of behavioural beliefs, social
and control beliefs, support and task characteristics. By contrast, respondents with a lower
usage experience established acceptance intentions by perceiving the impact of behavioural
beliefs, social and control beliefs, support and task characteristics through the indirect
effect of PU. Consistent with the TAM, the highest significant path in both groups was
PU�BI. However, the lowest was NAT�BI in the higher experience and SN�PU in the
lower experience group.
The test of moderation effect revealed that experience played a potential moderation effect
between the predictors of behaviour intention towards acceptance. For instance, the first
difference was found at path PU�BI which was negatively significant in high usage
experience and positively significant in low usage experience. This result suggests that
respondents (academics) with higher usage experience perceived a lower importance of PU
towards BI. This result is consistent with the previous literature (e.g., Davis, 1989; Davis,
Bagozzi & Warshaw, 1989; Igbaria et al., 1997; Kim, Choi & Han, 2009) which posits that
higher usage experience creates an enjoyment effect, which in turn minimised PU (see also
Chin, Marcolin & Newsted, 2003; Abbasi, Irani & Chandio, 2010). The negative relation
of higher experience and lower relation in lower usage experience groups were expected in
this study. It was observed that the majority of respondents in the collected data rated
themselves as moderate users i.e., with six to ten years’ experience.

312
The second moderating impact of experience was observed at path BI�BU. Specifically,
the path was highly significant within the high usage experience group and was
insignificant in the low usage experience group. This result suggests that experience is vital
for developing intention and the basic relationships proposed were not enough to accept
and establish the cognitive behaviour. The result is consistent with the argument that
experienced users employ their gained knowledge from prior experience to form intention
towards usage behaviour (e.g., Fishbein & Ajzen, 1975). Also there is strong evidence
present in the literature which reported that direct experience will result in a stronger and
more stable relationship between BI and BU (e.g., Ajzen & Fishbein, 1980; Fishbein &
Ajzen, 1975; Taylor & Todd, 1995b; Igbaria & Iivari, 1995; Igbaria, Guimaraes & Davis,
1995).
Finally, the third moderating difference due to experience was found at path IS�BU.
Specifically the path was significant in low usage experience and was insignificant in high
usage experience. As was expected, the low level or insignificance of management support
at an institutional level (IS) was countered by gaining higher experience. It is commonly
observed that experience and training are likely to improve an individual’s perceptions and
beliefs about technology use, which in turn increase their personal beliefs and their ability
to master and reduce the fear and anxiety (e.g., Igbaria & Iivari, 1995; Gist, Rosen &
Schwoerer, 1988; Gist, Schwoerer & Rosen, 1989). Consequently, experienced individuals
compared with less experienced feel less susceptible or less likely to accept specific
technology due to managerial influence or social influence (peer and superior). This
argument is also well-supported in previous literature. For instance, Leonard-Barton &
Deschamps (1988) reported that if individuals have enough experience of specific tasks
then they may be less inclined to the suggestions of higher authority because they might
doubt the technical competence of their superiors. Similarly, Venkatesh & Morris (2000)
reported that the impact of normative beliefs (somehow similar to management support in
terms of suggestions and advice) with the passage of time and experience were diminished
towards intention (immediate construct of usage). Hence, experience played a vital
moderating impact in the current study’s context and hypothesis H14a was partially
accepted, specifically, H14a1 and H14a3 were supported and H14a2 and H14a4 were
unsupported.
313
6.2.2.7. Voluntariness
The second moderating factor derived from the unified theory of acceptance and usage
technology (UTAUT) (Venkatesh et al., 2003) was voluntariness. The expected impact
was proposed as on following hypotheses:
H14b1: (BI, PU, TF, RF, SE, IS, GS) X VOL� BU
H14b2: (SN, PEOU, IS, GS) X VOL� PU
H14b3: (PU, PEOU, TF, RF, SE, AT, NAT, SN) X VOL�BI
H14b4: SN X VOL�PEOU.
Section (5.6.4.2.7) presents the results of the second moderating variable of voluntariness,
adopted from the UTAUT (Venkatesh et al., 2003). It is worth mentioning that the
construct measuring voluntariness presented a mean of 3.18/7.0 which suggests that usage
of the technology (the Internet) in the current context of the study (higher educational
institutes) was in mandatory settings. Therefore, generalisation of the results, as with the
experience results, requires caution.
Based on the mean two groups were established to examine the significant difference:
compliance (n=226) and voluntary (n=154). The model fitting for both groups was well
above the acceptable range and both models were moderately fit. Within the compliance
group the highest shared variance explained by the independent variables in the dependent
variable (R2) was noticed in BI (R2=0.25 or 25%) followed by PU (R2=0.21 or 21%).
Within the voluntary group, it was noticed in PU (R2=0.39 or 39%) followed by BI
(R2=0.33 or 33%). In accordance with the TAM study, the highest significant predictor for
establishing intention in both groups was PU. However, the lowest was RF�BI in the
compliance group and PEOU�SN in the voluntary group.
There were some paths different in both groups but parametric and non-parametric tests
showed an insignificant effect, thus there was no moderating impact of voluntariness and
hypothesis H14b was completely rejected. This finding is inconsistent with the previous
literature which reported a higher significant impact of subjective norms, social influence,
and increased system utilisation in early and mandatory settings (e.g., Venkatesh et al.,
2003; Venkatesh & Davis, 2000; Agarwal & Prasad, 1997). One possible justification
could be that there was an indistinguishable distribution of the respondents in the voluntary
and compliance settings, thus the results of both groups were influenced by the mandatory
settings only.

314
Looking closely at the results it was noticed that, contrary to Venkatesh et al. (2003), the
impact of SN�PU was lower in the higher compliance group compared with the lower
compliance group. The rationale for this result can be derived from the study of Venkatesh
and Davis (2000) in the extended TAM. The author found the impact of SN to be
significant in mandatory settings at the initial stage of implementation; however, with the
passage of time and experience, its impact was diminished. It is worth remembering that
the majority of the respondents in the current study were also moderate to highly
experienced users, therefore a lower impact of SN was to be expected.
Earlier during the examination of organisational moderating impact, it was noticed that,
within public organisations as compared to private, respondents perceived a lower
importance of management support due to the voluntary use of technology. These findings
can be clearly understood in the current section of analysis where the impact of GS�PU
was less significant in mandatory settings (similar to that observed in private organisations)
and was insignificant in voluntary settings (similar to that observed in public
organisations). In addition, like the organisational moderating results, path IS�PU was
higher in mandatory settings and was lower in voluntary settings. These results give
support to the argument that technology acceptance within private institutes is the result of
mandatory settings.
6.2.2. Discussion: Cultural moderating variables
In addition to the demographic characteristics this study also examined the impact of
culture as a moderator on an individual’s perception of acceptance within the extended
model. Given that, four dimensions of culture suggested by Hofstede (1980) i.e.,
masculinity-femininity (MF), individualism-collectivism (IC), power distance (PD), and
uncertainty avoidance (UA) were measured using the Dorfman & Howell (1988) scale to
observe the perception of difference. Similar to the previous section (6.2.1) MGA was
adopted to explore the difference based on parametric and non-parametric t-statics. The
discussion of each analysis is presented below.
6.2.2.1.Masculinity-Femininity
The moderating impact of the first dimension masculinity and femininity (MF) was
examined to explore the following relations:
H15a: (BI, PU, TF, RF, SE, IS, GS) X MAS�BU
H15b: (SN, PEOU, IS, GS) X MAS�PU

315
H15c: (PU, PEOU, TF, RF, SE, AT, NAT, SN) XMAS�BI
H15d: SN X MAS� PEOU
Section (5.6.4.3.1) presents the result of moderating factor MF in cultural dimension. The
overall mean of the construct was 3.15/7, which suggests that feminine culture was more
dominant in the context of the study (higher educational institutes in Pakistan). In literature
(Bem’s (1981) Sex Role Inventory) it is reported that men tend to exhibit more masculine
traits (e.g., assertiveness) and women tends to exhibit more feminine traits (e.g.,
tenderness). Therefore for observing relationships cross-tabulation was computed between
gender and masculine-feminine index. Table 6.1 shows that out of the overall sample, 182
(47%) of the respondents were masculine and 199 (52%) were feminine. Specifically,
within the masculine sample, 97 (53%) were men and 84 (46%) were women; whereas
within the feminine sample, 93 (48%) were men and the remaining 106 (55%) were
women. Thus, the argument that men tend to be more masculine and women tend to be
more feminine is closer to acceptance. During the cross-tabulation within the context of the
study (Pakistan), one important difference was found between the previous MAS index
computed by Hofstede (1980) and the current study. Hofstede rated Pakistan as moderate
on the masculinity-femininity index (50), but the researcher in this study found that culture
in Pakistan is getting closer to the feminine index (52%).
Gender as
psychological
construct
Gender as
biological
construct
Sample (N) per
gender ratio
% of gender as
biological construct
% of gender as
psychological
construct
Total
Masculine Men 97 97/190= 51.1% 97/181= 53.6% (97+84)/380=
47.6% Women 84 84/190= 44.2% 84/181=46.4%
Feminine Men 93 93/190= 48.9% 93/199= 46.7% (93+106)/380=
52.4% Women 106 106/190= 55.8% 106/199= 53.3%
Table 6. 1: Number of men and women within psychological categorisation of gender. Note: The third and fourth column represents the number of men and women and their percentage as masculine-men,
masculine-women, feminine-men and feminine-women. The fifth column represents the ratio of men and women in gender
as psychological construct. Finally, the sixth column represents the overall sample distribution of masculine and
feminine individuals.
The overall model fitting for both models, masculine and feminine, was averagely accepted
and moderately fit. Within the feminine group shared variance (R2) explained by the
independent variables in dependent variable was observed to be higher in PU (R2=0.29 or
29%) followed by BI (R2=0.28 or 28%). Within the masculine model it was higher in BI
(R2=0.33 or 33%) followed by PU (R2=0.29 or 29%). Consistent with the TAM (Davis,
1989; Davis, Bagozzi and Warshaw, 1989), the highest significant path in both groups was
PU�BI, while the lowest was SN�PEOU in the feminine group and GS�PU in the
316
masculine group. These results are in accordance with those of the TAM which revealed
that in both groups the intention to accept the technology (the Internet) was primarily based
on outcome performance or perceived usefulness of the technology. On the other side the
respondents attached very little importance to ease of use in the feminine group and
government support in the masculine group.
The parametric and non-parametric t-test of moderation revealed that the two groups were
different at path SN�PU. Specifically, the path was highly significant in the feminine
group and was insignificant in the masculine group. This finding is consistent with the
study of McCoy et al., (2005) which suggests that in the feminine group as compared with
the masculine group, normative beliefs were more important to establish the BI through the
PU. This result is supported by the previous literature which suggests that feminine
individuals tend to show higher influenceablity because of the intention towards agreeable
desires, maintaining social relationships and interaction, concern with the well-being of
others and greater interdependence (e.g., Srite & Karahanna, 2006; Bem, 1981).
Furthermore, justification for the support of the argument that feminine individuals tend to
be sensitive towards normative beliefs can be understood from the perspective of gender. It
was noticed that females possessed more feminine traits, therefore, looking closely at the
same relationship SN�PU in gender moderation (section 6.2.1.2 and table 5.32), it was
found that females, compared with males, perceived a higher importance of normative
beliefs (peer and superior influence) towards the PU. Similar results were also reported by
Venkatesh & Morris (2000) who found that the impact of SN was significant in both males
and females at the initial stage. However, in the long run this impact only remained
significant in the female group. The insignificant impact of normative beliefs in the
masculine group can be justified by the literature which suggests that masculine
individuals and men are more categorical, independent in nature and concerned more with
their own feelings rather than others’ (Venkatesh & Morris, 2000; Srite & Karahanna,
2006; Gefen & Straub, 1997; Bem, 1981; Hofstede & Hofstede, 2005; Hu et al., 2010).
Consequently, they are less likely to establish intentions based on other people’s opinions
or judgement. Based on this moderating difference hypothesis H15b was only partially
supported, while H15a, H15c and H15d were rejected.
6.2.2.2.Individualism-Collectivism
The second moderating construct within cultural group was individualism-collectivism(IC)
to explore the following path relations:
317
H16a: (BI, PU, TF, RF, SE, IS, GS) X IC� BU
H16b: (SN, PEOU, IS, GS) X IC� PU
H16c: (PU, PEOU, TF, RF, SE, AT, NAT, SN) X IC�BI.
H16d: SN X IC�PEOU.
Section (5.6.4.3.2) presents the results of the moderating factor in the cultural dimension
IC. The overall mean of the construct (5.40/7.0) shows that respondents in the context of
the study (higher educational institutes of Pakistan) were highly inclined towards a
collectivist society. The low level of individualism culture in Pakistan was also reported by
Hofstede (1980) in which Pakistan scored just 14 on the individualism scale. Given the
high level of collectivist society, the sample was split into two groups in order to observe
the difference between high collectivist (n=173) and low collectivist (n=207) respondents.
As with the MF, the generalisation of moderator IC requires caution due to missing
segregation between the individualist and collectivist groups.
The overall model fitting for both groups, high and low collectivist, was averagely
acceptable and moderately fit. The highest shared variance (R2) explained by independent
variables in dependent was noticed in PU (R2=0.27 or 27%) followed by BI (R2=0.24 or
24%) within the low collectivist group. Within the high collectivist group it was in BI
(R2=0.34 or 34%) followed by PU (R2=0.30 or 30%). The rationale behind the difference
in variance can be observed by the analogy of a collectivist society with the female gender.
According to Hofstede (1980, p.80), individuals in a collectivist society give higher
priority to obedience, respect, honour, support and cooperation. Likewise, females are
more agreeable towards social relationships and the well-being of others (Taylor & Hall,
1982), therefore both the female gender and respondents who inclined towards the
collectivist society shared similar attributes. Recalling the results in section (6.2.1.2) and
table 5.32 of gender as a moderator, it was noticed that PU shared a higher variance
compared with the BI in the female group. This result suggests that within the high
collectivist group respondents (academics) established their intentions to accept technology
(the Internet) by perceiving behavioural, social and control, management support, and task
beliefs through the indirect effect of PU. Whereas in the low collectivist group the
mediating effect of PU was lower than the direct effect of BI. In line with the TAM (Davis,
1989; Davis, Bagozzi & Warshaw, 1989) and its related findings, the highest significant
path in both groups was PU�BI, while the lowest was GS�PU in the low collectivist
respondents and SN�PEOU in the high collectivist respondents.
318
The test of moderation significance shows that the two groups were different at path
IS�PU; specifically, the path was significant in the high collectivist group and
insignificant in the low collectivist group. This finding is consistent with the results of
McCoy et al., (2005) and suggests that the respondents (academics) within the high
collectivist group compared to the low collectivist group were more influenced by the
management at an institutional level. The explanation can be understood from the literature
(e.g., Srite, 2006; Srite & Karahanna, 2006; Straub et al., 2002; Triandis, 1989), which
suggests that in a collectivist society individuals are more concerned about the opinion and
help of others in shaping their own behaviour. Furthermore, the higher importance of
management support in a collectivist society can also be understood by recalling the
discussion in previous sections. As noticed, a high collectivist shares similar characteristics
with the female gender; therefore, vigilant examination of the path IS�PU, shows that the
path was also higher in older age, compliance work settings, female gender, and feminine
cultural dimension compared with younger age, voluntary work settings, male gender, and
masculine cultural dimension respectively. The rationale for this relationship is similar to
the rationale of the female group: higher levels of computer anxiety, more dependent on
support, easily convinced by social pressure, less experience, higher importance given to
other’ opinions, and willingness to sacrifice personal interest for the sake of the group
(e.g., Venkatesh & Morris, 2000; Srite & Karahanna, 2006; Gefen & Straub, 1997; Bem,
1981; Hofstede & Hofstede, 2005). McCoy et al., (2005) also reported that within a
collectivist society individuals are more likely to adopt a new technology when the group
(colleagues) decides that it is valuable. Straub et al., (1998) state that face-to-face
interaction (i.e., rich media) more readily transmits social situations cues that are deemed
to be important and desirable for collectivist cultures. Thus, only hypothesis H16b was
partly supported and H16a, H16c and H16d were unsupported.
6.2.2.3.Power Distance
The third moderating construct within cultural group was power distance (PD). The impact
of PD was examined to see moderating relations between the paths below:
H17a: (BI, PU, TF, RF, SE, IS, GS) X PD�BU
H17b: (SN, PEOU, IS, GS) X PD�PU
H17c: (PU, PEOU, TF, RF, SE, AT, NAT, SN) X PD�BI
H17d: SN X PD� PEOU.

319
Section (5.6.4.3.3) presents the moderating results of the cultural dimension, PD. The mean
of the construct 2.8/7.0 suggests that culture within the context of the study (higher
education institutes in Pakistan) is moderately lower on the PD dimension. The mean
calculated is consistent with Hofstede’s (1980) study which rated Pakistan at 55 on the PD
index. Similar to previous cultural dimensions i.e., MF and IC, interpretation of the PD
dimension results requires caution due to the unclear difference between high and low PD
individuals. Based on the mean two groups, low PD (n=198) and high PD (n=182), were
established for the group analysis.
Both models were well above the acceptable range and moderately fit. Within the low PD
group the shared variance (R2) explained by independent variables in dependent variable
was highly noticed in BI (R2=0.21 or 21%) followed by PU (R2=0.17 or 17%). Whereas in
the high PD group the shared variance was noticed to be higher in PU (R2=0.41 or 41%)
followed by BI (R2=0.39 or 39%). This result suggests that within the high PD group,
respondents established their behavioural intentions though the indirect effect of
behavioural, social and control, management support and task characteristics beliefs
through the PU. The rationale behind the development of acceptance intention through PU
in the high PD group can be understood by the similar analogy within the high collectivist
group in the previous section. As Hofstede and Hofstede (2005, p.82) reported, PD and IC
are negatively correlated: large-PD countries are likely to be more collectivist, and small-
PD countries to be more individualist. Due to the relationship of PD with collectivist,
shared variance was also noticed to be similar in groups similar to collectivist i.e., cultural
dimension feminine and female gender (see section 6.3.2.1, table 5.50, and section 6.2.1.2,
table 5.32 respectively).
The highest significant path in both models was PU�BI and the lowest was RF�BI in
high PD and SN�PEOU in low PD. The test of moderation between high and low PD
groups shows that groups were different at path IS�PU. Specifically the path was
insignificant in the low PD group and was significant in the high PD group. Closely
observing the results, a similar difference was also found in path GS�PU but the
significance difference was only slightly lower than the acceptable range and therefore the
moderation effect was ignored. These results suggest that management support at a
government or institute level has no significant impact on intention behaviour by
perceiving usefulness of technology within the respondents holding lower PD traits.

320
The significant impact of management support in high PD was expected and is consistent
with Hofstede’s (1980) cultural theory, which suggests that within a high PD workplace
subordinates respond either by completely accepting or rejecting the decisions of higher
management. In addition, Hofstede (1980) also stated that individuals in high PD are more
concerned about complying with their superiors and would be afraid to disagree with them.
Justification of this relationship and Hofstede’s statement can also be observed within
work settings that moderations affect i.e., voluntariness (section 6.2.1.7 and table 5.47). It
was noticed that both paths of managerial support were highly significant in compliance
settings compared with voluntary settings at work. Related to the compliance effect, it was
also noticed that both paths were highly significant in private organisations as with public
organisations, and thus confirms the researcher’s argument that private organisations are
more inclined to the compliance effect and higher on PD. The importance of others’
opinions in forming intentions was also noticed by McCoy et al., (2005) who found a
strong relationship of normative beliefs in cultures which score higher in PD. In
accordance with McCoy, the results in the current study also revealed higher impact of
SN�PU and IS�BU in the high PD group.
Finally, recalling the statement that high PD respondents were more inclined towards a
high collectivist culture, it is noticed in section (6.3.2.2, table 5.53) that the paths were
highly significant in the collectivist group only. The respondents who were higher on
collectivism are also observed to be higher on feminine traits, which in turn are influenced
by the female gender roles (e.g., modesty, cooperation, interdependence) (Bem, 1981;
Hofstede & Hofstede, 2005). Therefore, the results in section (6.3.2.1, table 5.50) and
section (6.2.1.2, table 5.32) show that the paths were highly significant in the feminine
individuals and female groups as compared with the masculine individuals and male
groups. Based on the results, hypothesis H17b was partially supported and H17a, H17c
and H17d were completely rejected.
6.2.2.4.Uncertainty Avoidance
The final moderating construct within cultural dimensions was uncertainty avoidance (UA)
to observe the moderating effect on the following path relations:
H18a: (BI, PU, TF, RF, SE, IS, GS) X UA�BU
H18b: (SN, PEOU, IS, GS) X UA� PU
H18c: (PU, PEOU, TF, RF, SE, AT, NAT, SN) X UA�BI
H18d: SN X UA�PEOU

321
The results of the fourth cultural dimension UA are presented in section (5.6.4.3.4). The
overall mean of the construct was 6.35/7.0 which shows that respondents in the current
study were very high on UA. These findings are aligned with the score of Hofstede (1980)
who rated Pakistan as moderately higher on UA index (score=70). The higher score on UA
shows higher levels of anxiety and nervousness during work through informal rules and
structure within the context of study (higher educational institutes in Pakistan).
Based on the mean, two split groups models, high UA (n=143) and low UA (n=273), were
well above the acceptable range and moderately fit. Within the low UA, the shared
variance (R2) explained by the independent variable in dependent was higher in BI
(R2=0.22 or 22%) followed by PU (R2=0.21 or 21%). Within the high PD the shared
variance was higher in PU (R2=0.36 or 36%) followed by BI (R2=0.33 or 33%). In spite of
many visible path differences between the two groups, the test of moderation showed an
insignificant effect. Thus, hypothesis H18 was completely rejected due to no moderating
effect of UA. However, closely observing the results, it was noticed that individuals within
high UA showed similar results towards normative beliefs and management support in
groups: high on PD, high on collectivist, more on feminine individuals and female, low on
experience, older in age, compliance work environments and in private organisations. The
reason for the similar relationship with previous moderating variables and higher scores on
management and normative support is warranted. For instance, the acceptance of a new
technology (the Internet in the context of the study) within an organisation requires
sufficient knowledge about its usage and potential benefits. However, due to uncertain
rules and bureaucratic organisational structure, the respondents were only compelled to
look at the social environment which suggested and encouraged them to accept that
particular technology by perceiving that its usefulness would be valuable within a personal
and organisation context. Similar results, which suggest that the relationship between
normative beliefs (SN) and intentions are moderated by high UA, were found by Srite &
Karahanna in (2006). The results of UA differences are also interesting in terms of the
TAM’s reliability in different cultures. For instance, basic relations within the TAM based
on PU, PEOU and BI reveals that paths were higher and significant in high UA only and
reveal the cultural bias within the TAM.
Conclusion
This chapter presented a discussion of the findings of the structural model evaluated in the
previous chapter. The findings are categorically described in two groups of hypotheses:
322
with and without the moderation effect. Specifically, without the moderation effect,
independent factors of perceived behavioural beliefs, social and control beliefs,
management support at institutional and governmental level, and task characteristics were
discussed regarding the relationship with dependent variable behavioural intention and
usage. With moderation, the effect of demographic and cultural characteristics was
discussed. Consistent with Straub et al.’s (1997) reasoning, the extended model in the
present study displays a lower variance in the explanatory power of behaviour intention of
the developing countries’ respondent context, which claims the presence of cultural bias
within the predictors of technology acceptance models and theories.
The most significant path in the model is between perception of usefulness and intention,
which suggests that the respondents in the developing country’s context are driven to
accept the technology mainly on the basis of its usefulness, established by perceiving
relative advantages. The effect of normative influence was significant on intention via the
perception of usefulness which suggests that the opinion of professional co-workers and
superiors plays a major role in establishing behavioural beliefs towards acceptance
intention. In addition, it was noticed that academics primarily accepts new technology
based on their task relevance (academic teaching and research). Their perceptions were
more influenced by the local institutional management support compared with higher-level
governmental support and motivation.
The results with the moderation effect of demographic characteristics revealed that
respondents who were younger in age, female in gender, and held a bachelor degree level
of education were more influenced by the perception of ease of use, normative beliefs and
management support at an institute level towards the perception of usefulness of the
technology to establishing acceptance intention. The academic position does not have any
effect on the predictors of intention; however, organisational context showed a higher
importance of control belief over usage only in the context of private universities. The
usage experience and voluntariness conditions of use as a moderator revealed that
management support at an institutional level were more visible in mandatory settings,
specifically within the context of private institutes. Whereas the perception of usefulness
decreased with high usage experience; and intention towards usage was insignificant for
respondents who had low usage experience.
Finally, the moderation effects of cultural dimensions revealed that respondents within the
context of Pakistan are higher on collectivist nature, moderate on masculinity, moderately

323
higher on power distance and higher on uncertainty avoidance. These scores are similar to
the score obtained by Hofstede (1980). Results revealed that culture has mostly affected
the relationship of normative beliefs on the perception of usefulness to establish the
intention. Specifically, normative beliefs (opinions of co-workers and superior) were
highly recognised in respondents who are feminine, collectivist and high on power distance
cultural characteristics. Based on the findings of the previous chapter and the discussion in
the current chapter, the next chapter discusses the contribution of the study and its
potential limitations with future recommendations.
324
Chapter 7
Conclusions
Introduction
The primary objective of this research is to provide an extended model of technology
acceptance that determines the predictors of academics’ behavioural intention to accept the
Internet technology on the one hand, and the impact of demographic and cultural
characteristics on the predictors of intention on the other hand. To achieve these objectives,
questions for this research were positioned as: How do predictors of perceived behavioural
beliefs, social and control beliefs, management support at institutional and governmental
level, and task characteristics influence individuals’ Internet technology acceptance
behaviour? In addition, how are basic beliefs of an individual’s acceptance behaviour
influenced by the moderating impact of demographic characteristics (age, gender,
organisational type, academic position, educational level, experience usage and
voluntariness) and by native cultural dimensions (masculinity-femininity, individualism-
collectivism, power distance and uncertainty avoidance)?
Achieving aim of the study, a structured literature review was examined in chapter 2
followed by chapter 3, which represented important predictors of intention behaviour
within the conceptual framework with the expected impact of demographic and cultural
characteristics. Examining the real practicability of the model, research design was
positioned with a positivism paradigm using the survey instrument to collect the data.
Subsequently, chapter 5 presented an examination of the model with research findings, and
chapter 6 presented a discussion in light of the research objectives and observed findings.
Finally, summing up the research, this chapter presents the implications and contributions
of the research based on theoretical, methodological and managerial perspective. At the
same time, the chapter also presents the potential limitations of the research with suggested
future research directions.
325
7.1. Implications and Contributions
There may be several perspectives on the implications and contributions but categorically
they are judged from two perspectives: theoretical and methodological contributions, and
managerial or practical implications.
7.1.1. Theoretical contributions
7.1.1.1. Critical analysis and synthesis of literature
The primary objective of this study is to develop a conceptual model that can predict the
factors that determine an individual’s intentions to accept Internet technology in the
context of developing countries on the one hand, and how this relationship is moderated by
individual and cultural differences on the other. To achieve the research objective and
develop the theoretical background, a systematic literature review was conducted in
chapter 2. The literature critically reviewed nine of the most influential theoretical models
in information system acceptance literature. For the purpose of ascertaining the strengths
and weaknesses of the reviewed models, all the models were critically compared by
examining the paths specified, the paths’ strengths (i.e., significance and insignificance),
explanatory power of the model (in terms of dependent variables), parsimonious of model,
and influence of external variables. In addition, culture as a dimension of the individual
differences was also explored.
The synthesis of the literature suggests that the TAM was the most successful model,
however, its fundamental constructs (perceived usefulness and ease of use) were not
enough to completely reflect the technology (the Internet) acceptance and so there was a
need for additional variables. The comprehensive literature provides an incremental
contribution of additional substance for the empirical studies in this area. For instance,
research for the design of future technology acceptance models can introduce/extend new
concepts, variables, or even establish new relations between the current models (reviewed
models in literature) by evaluating the relative importance and contributions found in this
study.
7.1.1.2. Extension in the IT acceptance literature
The comprehensive, albeit less parsimonious model developed in the current study, thus
makes an additional contribution to the literature by grounding key predictors of belief in
technology acceptance model and then applying them to a new context (south Asian
developing countries). Contrary to the TAM, which posits that individuals accept the
326
technology only and if they believe it will have a positive outcome (i.e., perceived
usefulness), the present study followed the assumption of SCT that is accentuated to
understand both individuals’ expectations of their capabilities and beliefs about outcome in
examining acceptance behaviour. The extended model was formulated in an attempt to
identify the number of fundamental variables suggested by the previous research dealing
with the individuals’ cognitive acceptance behaviour. In doing so, the TAM was extended
by modelling theoretical relationships and integrating various disparate lines of the
research: TRA, TAM2, DTPB, UTAT, Bem’s Sex Role Inventory (BSRI) and cultural
theory of Hofstede as theoretical backdrop. The extended model explained moderate
shared variance in acceptance intention (R2=26% using PLS, and R2=34% using AMOS)
which shows that only beliefs about outcome (identical to the TAM) may not be sufficient
to affect acceptance behaviour (identical to SCT) if an individual’s doubt about their
capabilities (in terms of, social, situational and control beliefs, managerial support and
relevance of tasks), personal characteristics (demographic characteristics) and cultural
relevance (that one holds inherently) to successfully use the technology with interest.
However, some beliefs may be generalised across the context with caveats; this study also
confirms that, in general, beliefs are context specific: what is not necessarily applied in one
context can give identical results in another context.
The key strength of the extended model is its comprehensiveness which is opposite to the
assumption of parsimony. However, in terms of in-depth understanding parsimony in and
of itself is not desirable, but to a certain extent it is enviable to facilitate the understanding
(Venkatesh & Bala, 2008; Venkatesh, 2000). For instance, if the model does not provide
information that can guide acceptance of development, it will not be useful to examine it,
no matter how well it predicts intention at low cost (i.e., lower number of factors and path
relations). Therefore, in order to add the richness and insight to our understanding and
provide actionable guidance for individuals’ acceptance behaviour, all the relevant factors
are integrated in the present work, which was not viable considering the parsimony of the
model. In spite of the parsimony limitation, the extended model contributed by delineating
20 path relations with 12 general hypotheses between 13 key predictors covering
behavioural beliefs, normative beliefs, control beliefs, management support and task
characteristics towards the understanding of acceptance intentions.
Besides, the extended model was examined to explore the relations with 7 moderating
factors of personal characteristics and 4 moderating factors of cultural dimensions in order
to see what causes individuals to accept new technologies. Consequently, the results of the
327
present study will be a useful guide to understanding whether causes were inherent within
personality and background (moderation effect) or were driven by the key determinants of
information technology acceptance itself (without a indirect effect of moderation). Indeed,
emphasising the integration of external factors to explore the individual’s differences was
suggested by Davis, Bagozzi & Warshaw (1989); however, little attention was paid (Chan
et al., 2010), specifically over the factors relating to individual differences (e.g., Agarwal
& Prasad, 1999; Agarwal & Prasad, 1997).
7.1.1.3. Extension in literature to understand the context of the study
A number of recent developments indicate that the factors influencing technology
acceptance are one of the most important issues facing many organisations, specifically
within the context of developing countries. However, the models developed to examine
acceptance behaviour are predominantly established and examined within North America
and specifically within one single country, the U.S. (e.g., Venkatesh & Morris, 2000;
Venkatesh et al., 2004). Realising the ongoing drive towards globalisation, a handful of
studies contributed literature to examine the cross-cultural validity of the models
developed in the North American context. Surprisingly, these studies were limited to
examining the difference at the mean difference of culture computed by Hofstede (1980)
30 years ago. Specifically, as far as the researcher is aware, factors influencing the decision
to accept technology (the Internet) within higher educational institutes of the developing
country (Pakistan) have not yet attracted the attention of the research community.
Therefore, this study breakes new ground within IT acceptance literature because it is one
of the few studies which attempted to validate the constructs of the well-established IT
acceptance theories outside the North American context. Indeed, regardless of the
extensive applicability and extensionality of the TAM and similar models, literature shows
its limitations to serve equally across cultures, specifically beyond the boundaries of North
America (e.g., Straub, Keil & Brenner, 1997; McCoy, Everard & Jones, 2005; McCoy,
Galletta & King, 2007; Srite, 2006; Parboteeah, Bronson & Cullen, 2005; Rose & Straub,
1998; Alsajjan & Dennis, 2010; Baker, Al-Gahtani & Hubona, 2010; Yang, 2010).
Although this study has limitations when it comes to generalising its context
independently, it represents a contribution to the examination of the extended model with
primary data across two real organisations (public and private institutes) and with a non-
student sample. Since the key predictors examined in the present study are influenced by
the environmental and work-related activities, taking a student sample would be limiting
due to having no/low level of work and/or technological experience/awareness. Evidently,

328
most of the prior research examined technology acceptance theories and models based on a
student sample (e.g., Taylor & Todd, 1995a; Srite & Karahanna, 2006; Venkatesh &
Davis, 1996) and secondary data (e.g., Parboteeah, Bronson & Cullen, 2005). Therefore,
examining academics working in the context of universities contributes to the literature
and the understanding of the perception of the autonomous knowledge workers. The
university environment facilitates the support of academics’ autonomy, provides a
decentralised environment, and the opportunity to examine the likelihood of influence
exercised by a social circle.
7.1.1.4. Extension in literature to understand the cultural factors
One of the paramount contributions of the present study is the introduction of the culture
itself as a dimension of the difference towards acceptance behaviour of technology.
Evidently, in prior research, differences of beliefs towards acceptance are examined using
Hofstede’s (1980) national culture’s mean differences without directly measuring the
cultural dimension itself (e.g., Straub, Keil & Brenner, 1997; Karahanna, Evaristo & Srtie,
2005; Alsajjan & Dennis, 2010; Yang, 2010). The present study contributes by examining
the cultural dimensions itself at an individual level, which helps to understand more
accurate empirical findings between the effects of the cultural dimensions on the IT
acceptance behaviour. Also the differences computed are not based on mean differences,
but are based on β-value which is carefully computed using multiple-group analysis
(MGA) identical to hierarchal regression method.
Additionally, unlike previous research (e.g., Straub, Keil & Brenner, 1997; Parboteeah,
Bronson and Cullen, 2005), the present study contributes to the examination of Hofstede’s
(1980) cultural dimensions (power distance, individualism and collectivism, uncertainty
avoidance, and masculinity and femininity) at an individual level within the context of a
single country (intra-culture). Exercising Hofstede’s measures in the model of individual-
level acceptance behaviour is impractical and requires strong rhetorical justification as well
as a re-consideration of the measurement items. Overcoming this problem, this study
contributes to an examination of Hofstede’s cultural dimensions by introducing Dorfman
& Howell’s (1988) scale, which provides nearly similar results to those established by
Hofstede (1980). Derived solely from the results of the present study, it is postulated that
individuals are conditioned by their native/national culture (similar to Hofstede’s cultural
theory), whereas national culture is conditioned by the cultural values which one holds
differently (i.e., found in this research). Therefore, the findings of the present study are
beneficial in aggregating and understanding the exact salient impact of the particular

329
behaviour, not only at an individual level but at an organisational level, regional level, as
well as at a national level.
The comprehensive examination of the 20 path relations within four cultural dimensions,
each split into two groups (low and high) produced a total of 160 comparisons
(20x4x2=160). In addition, each difference computed for comparison using parametric and
non-parametric t-statics is a principal contribution and can be used as actionable guidelines
in the literature pertaining to explore cultural differences.
The achieved results with moderation effect revealed that some of the key predictors of
acceptance beliefs, specifically subjective norms and management support at an institute
level, were highly important within cultural groups: higher on femininity, higher on
collectivist, higher on power distance and uncertainty avoidance. These results call for
great caution when applying technology acceptance models and theories developed in one
context and replicated in another context. In other words, the results support the
researcher’s argument that, due to differential cultural differences, large amounts of the
research carried out in IT acceptance areas within North American culture may not be
relevant for understanding individuals’ acceptance behaviour within the context of a
developing country.
7.1.1.5. Extension in literature to understand the demographic factors
This study contributes to the recognition of boundary conditions which are moderated by
personal/demographic variables (age, gender, organisational type, academic position,
educational level and experience) and working conditions (i.e., voluntariness and
mandatory). The examination of boundary conditions associated with the role played by
the key determinants within an extended model helps to refine, sharpen, and, quite possibly
better apply the extended model to the study of behaviour acceptance in a wide range of
workplaces. Indeed, assessing the impact of external or boundary variables is emphasised
in the key literature of technology acceptance (e.g., Venkatesh et al., 2003; Davis, Bagozzi
& Warshaw, 1989; Agarwal & Prasad, 1999; Venkatesh & Morris, 2000; Morris,
Venkatesh & Ackerman, 2005; Porter & Donthu, 2006; I-F Lui et al., 2010).
Similar to the cultural dimensions, six demographic variables were split into two groups
(e.g., high and low, male and female etc.) and one (education qualification) was split into
three groups, therefore a total of 300 comparisons (20x6x2=240 and 20x1x3=60) were
computed to explore (not validate) the in-depth differences between key determinants
moderated by demographic variables.

330
The obtained results revealed that respondent who were younger in age perceived higher
importance of the perception of usefulness; female in gender and academics in private
institutes perceived a higher importance of management support at institute level; in the
educational level normative and control beliefs were negatively related with the individuals
holding a bachelor degree. In terms of usage experience a negative impact was observed
between the perception of usefulness and intention. Finally, two moderators, academic
position and working conditions (i.e. voluntariness) failed to produce any significant
difference within the present context of the study. Apart from the contribution in terms of
exploring the differences this study can also be used as a guide to examine the strength (β
value) between paths of interest; eventually they will be able to identify the causes of
obstruction or facilitations towards decisions of technology acceptance.
7.1.2. Methodological contributions
In terms of methodology, this study offers several major contributions. For instance, the
study contributes to the examination of the predictors of well-established models of
technology acceptance in a country which is culturally different from the environments in
which these constructs were developed (North American and European context). In doing
so, the study verifies, adopts, and purifies the measurement items with rigorous statistical
tests to check their validity and reliability. Although a few items were deleted from the
conceptual model, the overall constructs displayed a high degree of convergent and
discriminant validity, reliability, and finally satisfied the fit indices along with more than
half of the relations being found to be significant. Thus this study contributes to the
literature which examined certain constructs in the context of a developed country within
the context of a developing country.
This study contributes in the methodology by examining the conceptual framework using
structural equation modelling (SEM). Contrary to first generation analysis methods (e.g.,
regression, factor analysis, ANOVA and MANOVA), which can analyse one layer of a
relationship at a time between independent and criterion variables, SEM enables the
modelling of multiple layers simultaneously and answers the set of interrelated research
questions in a single precise model with a systematic and comprehensive manner (Gefen,
Straub & Boudreau, 2000; Chin, 1998b). Due to the lack of multivariate normality, partial
least squares (PLS) as a technique of SEM was exercised in the present study which is an
additional contribution to the method analysis. Using a two-step approach (measurement
analysis and structural analysis) presents the study in a very thorough manner that explains
331
each step of the analysis and can be used as a guideline for the future research. For
instance, study stepwise examined construct reliability (composite and α), item reliability,
convergent validity, discriminant validity (item and construct level), explanatory power of
model (R2), path significance (β value), effect size (f2), predictive relevance (cv-
communality and cv-redundancy), and goodness of fit indices (GoF).
This study provides a leading contribution to the methodology by illustrating the
identification and quantification of the moderation effect using multiple-group analysis
(MGA) technique. To date, a handful of methodology-oriented studies have assessed the
detection of moderation effect using PLS path model, among them Chin et al., (2003),
Eggert et al., (2005) and Henseler & Fassott (2010) are noteworthy. The future
recommendations of the said researchers in addition to the dissuasion on the PLS official
forum (www.smartpls.de) reveals that the process of inclusion and examination of
moderation effect in PLS is still new and requires great work to be formalised. In order to
provide actionable guidelines for future researchers, this study applied and explained the
MGA approach in an identical manner to that applied by Cohen & Cohen (1983) using
hierarchical multiple regression method. The analysis is so detailed that it provides 460
exploratory comparisons between each path and their significance differences using both
parametric (Chin, 1998b) and non-parametric t-tests (Chin, 2002).
Finally, this study contributes to examinations of the robustness of the model by using
parallel analysis. Primarily, the technique for using the SEM was based on the component-
based model method PLS. However, for identifying the similarities and contrasts the model
was re-examined using covariance-based SEM modelling technique AMOS. Despite the
fact that covariance-based models require multivariate normal data, which was not tenable
in the present study, AMOS provides similar structural results like the PLS with acceptable
fit indices. Even though, interestingly, the path significance and explanatory power of the
model generated using AMOS compared to the PLS was slightly higher. This parallel
analysis contributes to the literature specifically related to examining the techniques of
SEM. In addition, these results suggest that it is not perhaps necessarily that the data needs
to be multivariate normal to exercise the covariance-based modelling techniques, such as
AMOS.
7.1.3. Managerial and practical implications
This study provides several practical implications which can be understood by categorising
them into two groups: first, general implications based on the core determinant findings
332
which can be used as a guideline for any organisation; second, implications specific to the
context of the study, which is higher educational institutes in the developing country
Pakistan.
7.1.3.1. General practical implications
Regarding general implications, the primary question posed by this study was: what are the
predictors that affect an individual’s acceptance behaviour towards new technologies in
organisations? The answer obtained from the findings was that it depends upon a number
of factors (beliefs) that are important for individuals in establishing intention, such as
behavioural beliefs, social and control beliefs, support beliefs, and task characteristics
beliefs. Additionally, it is noticed that beliefs are also influenced by the individual’s
demographic and cultural traits. It is an accepted fact that within any organisation, a
successful introduction of technology depends upon its acceptance by individuals who are
also the targeted end-users. In addition to the core determinants of the technology
acceptance model (ease of use and usefulness), the findings of the current study highlight
the importance of social and environmental factors towards acceptance behaviour.
Specifically, the importance of management support at a low-level (e.g., the CEO at local
branch level) towards establishing intention through the perception of usefulness was
noticed to be higher within respondents that were female, younger in age, in private
organisations, and junior in working status. Contrary to this, individuals who were more
skilled and had higher usage experience gave little importance to management support in
establishing intention behaviour.
These findings are important for higher management in terms of providing facilitation
conditions (e.g., provision of technology and training) at local management level. The
management can reduce time and money constraints and enhance the technology
acceptance behaviour if they recognise specific segments of the employees who are more
susceptible to management support compared with the segment who do not perceive any
need. Similarly, the findings of this result suggest that the perceived ease of use is not a
direct crucial determinant of intention behaviour; however, through the perception of
usefulness, those who are younger in age, female in gender, in a public organisation, lower
in academic position, lower on usage experience and within a voluntary use environment,
perceived higher importance. It may be advisable for the management to target this
segment of users by attempting to build their confidence with training programmes and
assistance facilitations. In order to introduce new technologies within organisations,
management also needs to consider the impact of working conditions (voluntary or

333
compliance) and usage experience. For instance, the path from intention to behaviour was
more salient for experienced users, which suggests that experience can fill the expectation
gap when introducing new technology; therefore, management faces challenges to find a
way to close the expectation gap or to attract the inexperienced individuals only.
Additionally, findings revealed that the perception of usefulness towards intention
produces a negative impact. These findings may suggest that information and training
provided to skilled and experienced users to establish their positive intention towards
technology acceptance is futile because they value their own skills and autonomy, no
matter how important and useful the information provided to them by their supervisors or
organisational management.
Regardless of demographic differences, management also needs to consider the importance
of cultural dimensions which are not homogeneous across the nations and even across the
individuals within the same nation. The findings of the current study highlighted that social
influence does matter within distinct cultural groups, whether in the form of subjective
norms or in management support. For example, individuals higher on power distance,
feminine in nature, more on collectivist, gave a higher importance to subjective norms
(peer and superior influence) and management support at an institute level to establish the
acceptance intention through the perception of usefulness. Consistent with the moderation
effect of femininity, collectivism, and power distance management can devise strategies to
improve the acceptance behaviour with the help of colleagues and local management. This
may include, but is not limited to, the provision of group training programmes, structured
learning opportunities within groups, availability of resources at local organisational level,
and sharing the future commitment and vision of technology through local management,
colleagues and peers.
7.1.3.2. Specific practical implications within higher educational institutes
Perhaps the most significant implications discussed within the previous section are closely
relevant to the context of higher educational institutes in Pakistan, where management is
expecting advancements in research and teaching from academics by introducing new
technologies and the Internet. Recently the government of Pakistan has introduced the e-
Reforms project (HEC PAK, 2009) for the betterment of academic research in universities.
This includes: Pakistan education and research network (PERN), Digital library, Pakistan
research repository (PRR), and Campus management solutions (CMS). In addition, the
government has set up a broadband infrastructure for use of the Internet in universities and

334
to create awareness of its usefulness with academics. However, the government needs to
understand that expecting usage and acceptance behaviour from academics based only on
usefulness is not enough when introducing new technologies: as was noticed in the results
of the present study, individuals’ perception are formed through behavioural, social,
control and institutional beliefs. Additionally, differences of perception are moderated by
demographic and cultural traits. Therefore, the models proposed in Western culture or even
within the same culture and applied within one segment cannot be taken for granted for the
total population. Recognising the needs of a particular segment, their task relevance and
targeting them with a specific strategy will be beneficial for both end-users (academics)
and the implementing authority (government). For instance, the greater significance of
Internet technology within academic tasks to establish intention in this study suggests that
when academics perceived the higher importance of Internet technology in their teaching
and research, they felt no reluctance in accepting it.
Similarly, recalling the discussion on general implications, it is noticed that social norms,
management support, and the perception of behaviour beliefs are perceived differently by
academics based on their demographic and cultural differences. Therefore, the
management of the higher educational system, both at a governmental and local institute
level, should identify the specific segments and design tailored information for different
constituencies, thereby giving each segment the relevant information to solve its barriers
(e.g., lack of training, resources etc.) and increase the level of acceptance. For example,
management support at a governmental level can influence IT acceptance by initiating the
educational and training programmes which increase the sense of efficacy and in turn the
perception of ease of use. In addition, the government may provide a wider selection of
different software tools that are potentially useful and relevant to an educational
institutional context in order to increase the use of technology.
On the other hand, management at an institute level, which showed strong influence in
some segments of academics in this study, can play a vital role by encouraging academics
about the incentives of technology, showing interest in, and being aware of the problems
encountered by not using the new technologies. In conclusion, establishing more
favourable beliefs will eventually increase acceptance of the technology.

335
7.2. Limitations and directions for future research
Although this study has produced interesting findings in terms of presenting an extended
model of an individual’s acceptance behaviour, these findings carry important limitations
which are relevant for future research, as detailed below.
7.2.1. Sample size
Due to the distribution of population geographically, organisationally, working positions,
experience, age and gender, the sampling method chosen to collect the data was the
probability method (Sekaran, 2000). The descriptive revealed that the response rate
(n=380/935, 40.6%) was lower than the expected requirement (if it was 721, then two
independent models of public and private universities would be examined). However, the
obtained response rate still confirms the requirements of the data analysis techniques
(SEM) and shows an insignificant difference in non-response bias checks (i.e., using the
Mann-Whitney-U-test), but still random selections of the participants and the lower
response rate requires caution when understanding or interpreting the findings. For
instance, in a few groups (e.g., educational level) sample sizes were less than 50, which
could result in a reduction in the power of the significant test. Additional research is
essential to target a large sample as a means of increasing statistical power and more
conclusively establishing the robustness of the findings explored in the current study.
7.2.2. Context and generalisation
The second limitation is related to the issues of the external validity of the current study.
Even though the study gathered data from two different organisational contexts (public and
private universities), still the context was unique (higher educational institutes in Pakistan),
the working tasks were similar (teaching and research), the technology examined was
homogenous (the Internet) and the sample exhibits similar task characteristics (teaching
and research). Therefore, it is not certain that, other than the current context of the study,
the findings would be similar. In other words, the findings reported here are subject to the
usual caveats about the inadvisability of comprehensive generalisation. For instance,
within the findings of the cultural dimension masculinity-femininity, it was noticed that the
culture within higher educational institutes tends to be feminine which favoured a higher
impact of normative beliefs over intention behaviour. This may not be true in other
contexts dominated by masculine individuals, such as for example, the army, security
services etc.

336
Apart from the intra-cultural context limitations, the study also contains limitations as to
how it can be generalised at a cross-cultural level. The present study was based on data
from one country, and Hofstede’s (1980) analysis confirms that Pakistan is culturally
relatively moderate on power distance and masculinity, higher on uncertainty avoidance,
and lower on individualism than Western European (e.g., Great Britain) and North
American (e.g., U.S., Canada) countries. Therefore, the interpretations of results, despite
the similar context (educational institutes), cannot be generalised. This difference can be
understood from the perspective of usage behaviour. For example, Igbaria and Iivari
(1995) and Davis (1989) reported that individuals’ abilities, experiences, perception of
usefulness and organisational support are likely to play salient role in the perception of
usage, and numerous studies confirmed this in the context of Western Europe and North
America (e.g., Venkatesh et al., 2003; Taylor & Todd, 1995b; Venkatesh, 2000; Igbaria &
Chakrabarti, 1990; Taylor & Todd, 1995c). However, in the present study (Pakistan), due
to its high scores on feminine and collectivist societies, perception of usefulness was not a
dominant factor of usage. Future research is necessary to collect data across multiple
organisations, cultures and technologies in order to establish the generalisability of this
research and deepen our understanding of the findings obtained.
Finally, the limitations of the perspective context may be due to the self-reported
questionnaire. As the study used a single method (survey) and a single set of respondents
(academics) at a single point in time (cross-sectional) the possibility of the common
method variance may be due to inflated correlation for the obtained results (e.g., Igbaria,
1993). To some extent the researcher overcame this problem by using exploratory factor
analysis (EFA) which substantiated that factors were loaded separately; however, the
chances of there being a spurious effect were still inevitable. The alternative approach to a
self-report data source and refining measures would certainly reduce the likelihood of
obtaining spurious relationships and would increase the reliability and validity of the
measurement model and more rigorous results using SEM.
7.2.3. Cross-sectional study
The third limitation of this study is related to the cross-sectional design that restrained the
understanding of the extent to which causality can be inferred. In spite of the fact that
cross-sectional design allowed the researcher to collect a large data sample in a short span
of time (Bordens and Abbott, 2007), it remained futile to try to understand the impact of
the key predictors with respect to time towards acceptance intentions and usage behaviour.

337
Realistically, the extended model in the current study is based on the TAM, which in turn
is based on behavioural theories of cognition, i.e., TRA and SCT. These require continuous
interaction/feedback with the factors under examination. Specifically, for the acceptance of
newer IT systems where users evolve from being novices to experienced users, there is a
clear need to examine the phenomena over several points of time (e.g., Davis, 1989; Davis,
Bagozzi & Warshaw, 1989; Venkatesh & Davis, 2000; Kim, Choi & Han, 2009).
In support, the literature shows that initial adoption and sustained usage (i.e., novice to
experienced) of technology produced differences in many of the TAM and models similar
to its conceptualisation constructs on behavioural beliefs (e.g., Venkatesh et al., 2003;
Morris & Venkatesh, 2000; Davis & Venkatesh, 2004). For example, during an
examination of gender-based differences in technology acceptance behaviour, Venkatesh et
al., (2000), based on the studies of Lu (1999) and Roosmalen & McDaniel (1992), reported
that women, compared with men, were more likely to sustain the follow-up on expressed
intentions. Similarly, linked to the normative beliefs, Venkatesh & Davis (2000) found that
the direct impact of SN on BI became weaker with the passage of time and experienced
gained. Therefore, future research particular to longitudinal studies is needed to replicate
the current study and address the issues related to time and long-term usage.
7.2.4. Normality of data and construct reliability
An examination of the extended model using SEM provides strong support through the
acceptable structure paths and measurement weights; however, to some extent the
psychometric properties of the measurement items were weak. For instance, multivariate
normality, which is one of the fundamental requirements for the multivariate analysis
(Tabachnick & Fidell, 2007) specifically for the CBSEM method (Arbuckle, 2006), was
not tenable in the current study. In addition, the study was also unable to determine the
reliability score for items measuring one of the important exogenous constructs of self-
efficacy. The exploratory factor analysis showed that the construct SE was split into two
groups: one measured the perception of those individuals who were more comfortable
using technology on their own; the other measured the perception of the individuals who
were comfortable using technology with the appropriate help facility. In the present study
only the first group of the respondents were retained due to the number of items and
reliability requirements. Therefore, there is a chance that some of the important
relationships with respect to the SE remain unexplored and require further investigation.

338
7.2.5. Predictive power of the model
One of the limitations needs to be considered in terms of predictive relevance i.e., the R2
value. The basic model without moderation produced only a 26% variance using PLS, and
34% using AMOS. With the moderation effect, the highest variance was observed in the
cultural dimension of high PD (39%) followed by public organisation (36%). Perhaps the
interesting results from this study were obtained by adding the normative, control and
management support beliefs with the moderation effect of personal characteristics and
culture to the relatively simple TAM model; the ability of the model to predict intention
behaviour was not increased substantially. This leads to the question of what does still
account for the approximately 66% unexplained variance in intention behaviour. This may
be due in part to the insignificant effect of half of the path relations (9/20) in the proposed
model. Alternatively, it may postulate that variance explained in the present (26% to 39%)
study is the best in the current study settings and additional factors were situation specific
which doesn’t account for any improvement. Nevertheless, further exploration replicating
similar factors in the different context, or alternatively, distinct factors in the current
context to establish intention behaviour are warranted.
7.2.6. Lack of mediation, indirect effect and new relations
This study potentially has limits when highlighting the mediation and indirect effect
between key predictors and acceptance behaviour. Within the model proposed, it can be
inferred that BI, PU and PEOU can possibly play the role of mediator between predictors
and acceptance intention. In the appendix-A, the table A-7 presenting direct effects shows
that the impact of AT�BI was also significant on BU. In addition, the impact of GS�PU
and IS�PU was also significantly related to the BI, and SN�PEOU was also related to
the PU. Interestingly, path PEOU�BI, which was insignificant in direct relations, was
significant with the mediating effect of the PU perception. These results are so important
and were missing in the present study.
Within IT acceptance the literature has emphasised the need to explore the mediating
impact. For instance, Taylor & Todd (1995a) examined the importance of the construct BI
as a mediator in TAM, TPB, and TRA, as suggested by Fishbein & Ajzen (1975); that
research found that omitting the BI results led to a substantial decrease in BU. Analogous
to this, in the present study it is observed that PEOU was only significant on BI when
individuals perceived the importance of PU only. Thus, the PU played an important
substantive role in predicting BI. In future research, a re-evaluation of the present model

339
with the missing relationships could explore the new findings, specifically in terms of
increasing the predictive relevance of the model and the importance of the mediators
within the model.
Apart from the mediation effect, future research is also invited to explore the distinct role
of the variables present in the extended model. For instance, SE, which has been studied
purely as an exogenous variable, could also be studied as an endogenous variable.
Compeau & Higgins (1995) reported that SE is positively related to the encouragement by
others’ use (known in the present study as management support) and support of the
organisation in terms of help assistance (in the present study as resource facilitations).
Similarly, Davis et al., (1989) highlighted the importance for exploring new relations with
external factors and perceptions of ease of use and usefulness. Therefore, future research is
invited to examine the relationships among the construct presented in the current study in
order to see how well they can predict and explain the user acceptance.
7.2.7. Moderation effect
Finally, this study is limited to eliciting the underlying multiple-way interaction effect of
the moderators. For example, observing the effect of gender within the demographic group
of moderators, literature in sociology, social psychology and in information system
acceptance (e.g., Venkatesh et al., 2003; Levy, 1988) asserts that gender is related to
experience, age and voluntariness. Similarly, Minton & Schneider (1980) found that
income, occupation and education can be confounding variables associated with age.
Minton & Schneider’s argument is justifiable, for instance, usually older individuals, as
compared with younger individuals, are overrepresented in categories of higher income,
higher occupational position and higher educational qualifications.
In the same line of research the literature shows that normative beliefs (SN) were
significant only in mandatory settings for the female gender with higher age and lower
experience (e.g., Venkatesh et al., 2003; Venkatesh & Davis, 2000; Szajna, 1996; Szajna,
1994). In the present study, during the MGA it was noticed that many paths were similar or
contradictory to each other within different groups. For example, path IS�PU was highly
significant in the female gender and organisations of private institutes, which might
suggest a new relationship: female individuals, as compared with male, perceived a higher
importance in management support at an institute level within private institutes as
compared with public institutes. Despite this fact, a relationship can be validated from the

340
results of the current study but cannot be generalised without calculating the interaction
effect (i.e., gender x organisation type).
Standing in the same line and observing cultural dimensions, Hofstede & Hofstede (2005)
postulates that individuals with high PD are more inclined towards a collectivist society.
Evidence of this can be observed in the current study. Path SN�PU was highly significant
in high PD and in the high collectivist group, which can present the proposition that:
individuals high on PD compared to low on PD perceived a higher importance of the
normative belief (SN) towards acceptance intention by perceiving the usefulness within
collectivist society. Like the gender and organisation relationship, this relationship could
also be justified by the current study but its generalisation needs caveats.
These patterns and many others likewise reflect the importance of the multiple-way
interaction effect of moderating variables on individuals’ personality and the perception of
acceptance behaviour. Thus, future research is invited to underscore the moderating
impacts of demographic variables as well as cultural variables presented in the current
study with the multiple-interaction method.

341
References
Abbasi, M.S., Irani, Z. & Chandio, F.H. (2010) "Determinants of social and institutional beliefs about internet acceptance within developing country’s context: A structural evaluation of higher education systems in Pakistan", EMCIS2010, .
Abdul-Gader, A.H. & Kozar, K.A. (1995) "The impact of computer alienation on information technology investment decisions: An exploratory...", MIS Quarterly, vol. 19, no. 4, pp. 535.
Adams, D.A., Nelson, R.R. & Todd, P.A. (1992) "Perceived Usefulness, Ease of Use, and Usage of Information Technology - a Replication", MIS Quarterly, vol. 16, no. 2, pp. 227-247.
ADB, (2007) Asian Development Bank. Available: http://www.adb.org/ [2011, 12/03/11].
Agarwal, R. & Prasad, J. (1997) "The Role of Innovation Characteristics and Perceived Voluntariness in the Acceptance of Information Technologies", Decision Sciences,
vol. 28, no. 3, pp. 557-582.
Agarwal, R., Sambamurthy, V. & Ralph, M.S. (2000) "Research Report: The Evolving Relationship Between General and Specific Computer Self-Efficacy - An Empirical Assessment", Information Systems Research, , pp. 418-430.
Agarwal, R. & Karahanna, E. (2000) "Time flies when you're having fun: Cognitive absorption and beliefs about information technology usage", MIS Quarterly, vol. 24, no. 4, pp. 665-694.
Agarwal, R. & Prasad, J. (1998) "A conceptual and operational definition of personal innovativeness in the domain of information technology", Information Systems
Research, vol. 9, no. 2, pp. 204-215.
Agarwal, R. & Prasad, J. (1999) Are Individual Differences Germane to the Acceptance of
New Information Technologies?.
Ajzen, I. (1988) Attitudes, personality, and behavior, Dorsey Press, Chicago.
Ajzen, I. (1985) "Action-control: From Cognition to Behavior", From intention to actions:
a theory of planned behaviour, , pp. 11-39.
Ajzen, I. & Fishbein, M. (1980) Understanding Attitudes and Predicting Social Behavior,
Prentice Hall, Englewood Cliffs, NJ.
Ajzen, I. (2002) "Perceived Behavioral Control, Self-Efficacy, Locus of Control, and the Theory of Planned Behavior1", Journal of Applied Social Psychology, vol. 32, no. 4, pp. 665-683.
Ajzen, I. (1991) "The theory of planned behavior", Organizational behavior and human
decision processes, vol. 50, no. 2, pp. 179-211.
Al-Jabri, M.I. & Al-Khaldi, A., M. (1997) "Effects of user characteristics on computer attitudes among undergraduate business students", Journal of End User Computing,
vol. 9, no. 2, pp. 16-22.
Alsajjan, B. & Dennis, C. (2010) "Internet banking acceptance model: Cross-market examination", Journal of Business Research, vol. 63, no. 9-10, pp. 957-963.

342
Allua, S., Stapleton, L.M. & Beretvas, S.N. (2008) "Testing Latent Mean Differences Between Observed and Unobserved Groups using Multilevel Factor Mixture Models", Educational and Psychological Measurement, vol. 68, no. 3, pp. 357-378.
Amato, S., Vinzi, V.E. & Tenenhaus, M. (March 2004) "A global goodness-of-fit index for PLS structural equation modeling", Oral Communication to PLS Club, HEC School
of Management, .
Anderson, J.C. & Gerbing, D.W. (1988) "Structural equation modeling in practice: a review and recommended two-step approach", Psychological Bulletin, vol. 103, pp. 411-423.
Arbuckle, J.L. (2006) Amos (Version 7.0) User's guide, SPSS, Chicago.
Armstrong, J.S. & Overton, T.S. (1977) "Estimating Non-response Bias in Mail Surveys", Journal of Marketing Research, vol. 14, no. August, pp. 396-402.
Backhaus, K., Erichson, B., Plinke, W. & Weiber, R. (2003) Multivariate
Analysemethoden, 10th edn, Springer, Berlin.
Bagozzi, R.P. (1984) "A Prospectus for Theory Construction in Marketing", Journal of
Marketing, vol. 48, pp. 11-29.
Bagozzi, R.P. & Fornell, C. (1982) "Theoretical Concepts, Measurement, and Meaning" in A Second Generation of Multivariate Analysis, ed. C. Fornell, pp. 5-23.
Bagozzi, R.P. & Yi, T. (1988) "On the evaluation of structural equation models", Journal
of the Academy of Marketing Science, vol. 16, no. 1, pp. 74-94.
Bagozzi, R.P. (2007a) "Explaining Consumer Behavior and Consumer Action: From Fragmentation to Unity", Seoul Journal of Business, .
Bagozzi, R.P. (2007) "The Legacy of the Technology Acceptance Model and a Proposal for a Paradigm Shift", Journal of the Association for Information Systems, vol. 8, pp. 244-254.
Bagozzi, R.P. (1984a) "Expectancy-value attitude models an analysis of critical measurement issues", International Journal of Research in Marketing, vol. 1, no. 4, pp. 295-310.
Bagozzi, R.P. (1981) "An Examination of the Validity of Two Models of Attitude", Multivariate Behavioral Research, vol. 16, no. July, pp. 323-359.
Bagozzi, R.P. & Baumgartner, H. (1994) "The Evaluation of Structural Equation Models and Hypothesis Testing" in Principles of Marketing Research, ed. R.P. Bagozzi, Blackwell, Cambridge, MA, pp. 386-422.
Bagozzi, R.P. & Phillips, L.W. (1982) "Representing and Testing Organizational Theories: A Holistic Construal", Administrative Science Quarterly, vol. 27, no. 3, pp. 459-489.
Bagozzi, R.P. & Yi, Y. (1989) "The Degree of Intention Formation as a Moderator of the Attitude-Behavior Relationship", Social psychology quarterly, vol. 52, no. 4, pp. pp. 266-279.
343
Bagozzi, R.P., Yi, Y. & Phillips, L.W. (1991) "Assessing Construct Validity in Organizational Research", Administrative Science Quarterly, vol. 36, no. 3 (September), pp. 421-458.
Baker, E.W., Al-Gahtani, S. & Hubona, G.S. (2010) "Cultural Impacts on Acceptance and Adoption of Information Technology in a Developing Country", Journal of global
information management, vol. 18, no. 3, pp. 35-58.
Baker, M. (2002) "Sampling", The Market Review, vol. 3, no. 1, pp. 103-120.
Baker, T.L. (1994) Doing Social Research, 2nd edn, McGraw-Hill Inc., New York.
Bandura, A. (2006) "Guide for constructing self-efficacy scales" in Self-efficacy beliefs of
adolescents, eds. F. Pajares & T. Urdan, Information Age Publishing., Greenwich, CT:, pp. 307-337.
Bandura, A. (1997) Self-Efficacy: The Exercise of Control, Worth Publishers, New York.
Bandura, A. (1989) "Social cognitive theory" in International encyclopedia of
communications, ed. E. Barnouw, Oxford University Press, New York, pp. 92-96.
Bandura, A. (1986) Social Foundations of Thought and Action, Prentice-Hall, Englewood Cliffs, NJ,.
Bandura, A. (1977) Social Learning Theory, General Learning Press, New York.
Bannister, D. & Mair, J.M.M. (1968) The Evaluation of Personal Constructs, Academy Press, London.
Barbara, B.M. (2001) Structural Equation Modeling With AMOS: Basic Concepts,
Applications, and Programming, Lawrence Erlbaum Associates, Mahwah, NJ.
Barclay, D., Higgins, C.A. & Thompson, R.L. (1995) "The Partial Least Squares (PLS) Approach to Causal Modeling: Personal Computer Adoption and Use as an Illustration", Technology Studies, vol. 2, no. 2, pp. 285-309.
Baron, R.M. & Kenny, D., A. (1986) "The moderator–mediator variable distinction in social psychological research: Conceptual, strategic, and statistical considerations.", Journal of Personality and Social Psychology, vol. 51, no. 6, pp. 1173-1182.
Bartlett, M.S. (1954) "A note on the multiplying factors for various chi square approximations", Journal of the Royal Statistical Society, vol. 16, no. B, pp. 296-298.
Baskerville, R.F. (2003) "Hofstede never studied culture", Accounting, Organizations and
Society, vol. 28, no. 1, pp. 1-14.
Baumgartner, H. & Homburg, C. (1996) "Applications of structural equation modeling in marketing and consumer research. A review", International Jr. of Research in
Marketing, vol. 13, pp. 139-161.
Bem, S.L. (1981) "The BSRI and gender schema theory: A reply to Spence and Helmreich", Psychological Review, vol. 88, pp. 226-238.
Bem, S.L. (1974) "The measurement of psychological androgyny", Journal of consulting
and clinical psychology, vol. 42, no. 2, pp. 155-162.
344
Benbasat, I. & Zmud, R.W. (1999) "Empirical Research in Information Systems: the Practice of Relevance", MIS Quarterly, vol. 23, no. 1, pp. 3-16.
Bentler, P.M. & Chou, C.P. (1987) "Practical issues in structural modeling", Sociological
Methods & Research, vol. 16, pp. 78-117.
Bergeron, F. & Rivard, S. (1990) "Investigating the Support Role of the Information Center.", MIS Quarterly, vol. 14, no. 3, pp. 247.
Bernard, H.R. (2000) Social Research Methods: Qualitative and Quantitative Approaches,
Sage Publication Inc., Oaks, California.
Bhattacherjee, A. (2000) "Acceptance of e-commerce services: The case of electronic brokerages", IEEE Transactions on Systems, Man, and Cybernetics Part A:Systems
and Humans., vol. 30, no. 4, pp. 411-420.
Blumberg, B.F., Cooper, D.R. & Schindler, P.S. (2005) "Survey Research" in Business
Research Methods, eds. B.F. Blumberg, D. Cooper & P.S. Schindler, McGraw-Hill, NewYork, pp. 243-276.
Bollen, K.A. (1989) Structural Equations with Latent Variables, John Wiley and Sons, New York.
Bontempo, R., N. & Rivero, J.C. (1990) "Cultural variation in cognition: The role of self-concept in the attitude behavior link", paper presented at Academy of Management
Meeting, .
Bordens, K. & Abbott, B.B. (2007) Research design and methods: A process approach,
7th edn, McGraw-Hill, New York, NY, USA.
Brosan, M.J. (1998) "The impact of computer anxiety and self-efficacy upon performance", Journal of computer assisted learning, vol. 14, pp. 223-234.
Brosnan, M. & Lee, W. (1998) "A cross-cultural comparison of gender differences in computer attitudes and anxieties: the United Kingdom and Hong Kong", Computers
in Human Behavior, vol. 14, no. 4, pp. 559-577.
Brown, I. & Buys, M. (2005) "A cross-cultural investigation into customer satisfaction with internet banking security",Proceedings of the 2005 annual research conference
of the South African institute of computer scientists and information technologists on
IT research in developing countriesSouth African Institute for Computer Scientists and Information Technologists, , pp. 200.
Browne, M.W. (1982) "Covariance structures." in Topic in applied multivariate analysis, ed. D.M. Hawkins, Cambrige University Press, Cambridge, pp. 72-141.
Bryman, A. & Bell, E. (2007) Business Research Methods, Oxsford University Press inc, New York.
Burton-Jones, A. & Hubona, G.S. (2006) "The mediation of external variables in the technology acceptance model", Information & Management, vol. 43, no. 6, pp. 706-717.
Burton-Jones, A. & Hubona, G.S. (2005) "Individual differences and usage behavior revisiting a technology acceptance model assumption", SIGMIS Database, vol. 36, no. 2, pp. 58-77.
345
Calisir, F., Gumussoy, A.C. & Bayram, A. (2009) "Predicting the behavioral intention to use enterprise resource planning systems: An exploratory extension of the technology acceptance model", Management Research News, vol. 32, no. 7, pp. 597-613.
Campbell, D.T. & Fiske, D.W. (1959) "Convergent and Discriminant Validation by the Multitrait-Multimethod Matrix", Psychological Bulletin, vol. 56, no. 2 (March), pp. 81-105.
Carlson, J.R. & Zmud, R.W. (1999) "Channel expansion theory and the experiential nature of media richness perceptions", Academy of Management Journal, vol. 42, no. 2, pp. 153-170.
Carveth, R. & Kretchmer, S., B. (2002) "The digital divide in Western Europe: problems and prospects", Informing Science, , pp. 239-249.
Cassell, C.M. & Symon, G. (2004) An Essential Guide to Qualitative Methods in
Organizational Research, Sage, London.
Caudle, S.L., Gorr, W.L. & Newcomer, K.E. (1991) "Key Information Systems Management Issues for the Public Sector", MIS Quarterly, vol. 15, no. 2, pp. 171-188.
Chakrabarti, A.K. (1974) "The Role of Champion in Product Innovation", California
Management Review, vol. 17, pp. 58-62.
Chan, F.K.Y., Thong, J.Y.L., Venkatesh, V., Brown, S.A., Hu, P.J. & and Tam, K.Y. (2010) "Modeling Citizen Satisfaction with Mandatory Adoption of an E-Government Technology", Journal of the Association for Information Systems, vol. 11, no. 10 Article 2.
Chau, P.Y.K. (2001) "Influence of computer attitude and self-efficacy on IT usage behavior", Journal of End User Computing, vol. 13, no. 1, pp. 26.
Chau, P.Y.K. & Hu, P.J.H. (2002) "Investigating healthcare professionals' decisions to accept telemedicine technology: an empirical test of competing theories", Information
& Management, vol. 39, no. 4, pp. 297-311.
Chau, P.Y.K. & Hu, P.J.H. (2001) "Information technology acceptance by individual professionals: A model comparison approach", Decision Sciences, vol. 32, no. 4, pp. 699-719.
Chen, W. & Hirschheim, R. (2004) "A paradigmatic and methodological examination of information systems research from 1991 to 2001", Information Systems Journal, vol. 14, pp. 197-235.
Chen, L.D., Gillenson, M.L. & Sherrell, D.L. (2002) "Enticing online consumers: an extended technology acceptance perspective", Information & Management, vol. 39, no. 8, pp. 705-719.
Chiero, R.,T. (1997) "Teachers' perspectives on factors that affect computer use", Journal
of Research on Computing in Education, vol. 30, no. 2.
Chin W. Wynne. (2002) Partial Least Squares For Researchers: An overview and
presentation of recent advances using the PLS approach. Available: http://www.bauer.uh.edu/plsgraph/plstalk.pdf [2011, 03/03].

346
Chin, W.W. (2010) "How to write up and report PLS analysis" in Handbook of Partial
Least Squares Concepts, Methods and Applications, eds. E.V. Vinzi, W.W. Chin, J. Henseler & H. Wang, springer handbooks comp.statistics, Heidelberg, pp. 655-689.
Chin, W.W. & Dibbern, J. (2010) "A permutation based procedure for multi-group PLS analysis: results of testes of differences on simulated data and a cross cultural analysis of the sourcing of information system services between Germany and the USA" in Handbook of Partial Least Squares: Concepts, Methods and Applications, ed. Vincenzo Esposito Vinzi, Wynne W. Chin, Jörg Henseler and Huiwen Wang, springer handbooks comp.statistics, Hiedelberg.
Chin, W.W., Marcolin, B.L. & Newsted, P.N. (2003) "A partial least squares latent variable modeling approach for measuring interaction effects: results from monte carlo simulation study and an electronic-mail emotions/adoption study", Information
system research, vol. 14, no. 2, pp. 189-217.
Chin, W.W. & Newsted, P.R. (1999) "Structural equation modeling analysis with small samples using partial least squares" in Statistical strategies for small sample
research, ed. R.H. Hoyle, Sage, Thousand Oaks, pp. 307-341.
Chin, W.W. & Gopal, A. (1995) "Adoption intention in GSS relative importance of beliefs", Data base, vol. 26, no. 2-3, pp. 42-64.
Chin, W.W., Marcolin, B., L. & Newsted, P.R. (1996) "A Partial Least Squares Latent Variable Modeling Approach for Measuring Interaction Effects- Results from a Monte Carlo Simulation Study and Voice Mail Emotion-Adoption Study.", , pp. 21.
Chin, W.W. (1998b) "The Partial Least Squares Approach to Structural Equation Modeling" in Modern Methods for Business Research, ed. G.A. Marcoulides,London, pp. 295-336.
Chin, W.W. (1998a) "Issues and Opinion on Structural Equation Modeling", MIS
Quarterly, vol. 22, no. 1 (March), pp. vii-xvi.
Chin, W.W. & Todd, P.A. (1995) "On the Use, Usefulness, and Ease of Use of Structural Equation Modeling in MIS Research: A Note of Caution", MIS Quarterly, vol. 19, no. 2 (June), pp. 237-246.
Chismar, W.G. & Wiley-Patton, S. (2003) "Does the extended technology acceptance model apply to physicians", System Sciences, 2003. Proceedings of the 36th Annual
Hawaii International Conference.
Choi, J. & Geistfeld, L.V. (2004) "A cross-cultural investigation of consumer e-shopping adoption", Journal of Economic Psychology, vol. 25, no. 6, pp. 821-838.
Choudrie, J. & Dwivedi, Y., K. (2005) "Investigating the Research Approaches for Examining Technology Adoption Issues", Journal of Research Practice, vol. 1, no. 1.
Choudrie, J. & Lee, H. (2004) "Broadband development in South Korea: institutional and cultural factors", European Journal of Information Systems, vol. 13, no. 2, pp. 103-114(10).
Christians, C. (2000) "Ethics and Politics in Qualitative Research" in Handbook of
Qualitative Research, eds. N. Denzin & Y. Lincoln, Sage, London, pp. 133-155.

347
Chua, W.F. (1986) "Radical Developments in Accounting Thought", The Accounting
Review, vol. 61, no. 4, pp. 601-632.
Chung, J.E., Park, N., Wang, H., Fulk, J. & McLaughlin, M. (2010) "Age differences in perceptions of online community participation among non-users: An extension of the Technology Acceptance Model", Computers in Human Behavior, vol. 26, no. 6, pp. 1674-1684.
Churchill, G.A. (1979) "A Pardigm for Developing Better Measures of Marketing Constructs", Journal of Marketing Research, , no. 16, pp. 64-73.
Clark, T. (1990) "International marketing and national character: A review and proposal for an integrative theory", Journal of Marketing, vol. 54, no. 4, pp. 66-79.
Cohen, J. & and Cohen, P. (1983) Applied multiple regression/correlation analysis for the
behavioral science, 2nd edn, Hillsdale, NJL Lawrence Erlbaum Associates, Inc.
Cohen, L., Manion, L. & Morrison, K. (2000) Research Methods in Education, 5th edn, Routeledge Falmer, London.
Cohen, J. (1988) Statistical Power Analysis for the Behavioral Sciences, 2nd edn, L. Erlbaum Associates, Hillsdale, NJ.
Collis, J. & Hussey, R. (2003) Business Research: A Practical Guide for Undergraduate
and Postgraduate Student, 2nd edn, palgrave macmillan, New York.
Compeau, D., R. & Higgins, C., A. (1991) "A social cognitive theory perspective on individual reactions to computing technology", ICIS '91-twelfth international
conference on Information systems, eds. Janice DeGross, Izak Benbasat, Gerardine DeSanctis & Cynthia Mathis Beath, , pp. 187.
Compeau, D., Higgins, C.A. & Huff, S. (1999) "Social cognitive theory and individual reactions to computing technology: A longitudinal study", MIS Quarterly, vol. 23, no. 2, pp. 145-158.
Compeau, D.R. & Higgins, C.A. (1995a) "Application of Social Cognitive Theory to Training for Computer Skills", Information Systems Research, vol. 6, no. 2, pp. 118-143.
Compeau, D.R. & Higgins, C.A. (1995b) "Computer Self-Efficacy: Development of a Measure and Initial Test", MIS Quarterly, vol. 19, no. 2, pp. 189-211.
Compeau, D. & Higgins, C.A. (1999) "Social Cognitive Theory and Individual Reactions to Computing Technology: a Longitudinal Study.", MIS Quarterly, vol. 23, no. 2, pp. 145.
Comrey, L.A. & Lee, H.B. (1992) A First Course in Factor Analysis, 2nd edn, Lawrence Erlbaum Associates Inc., New Jersey.
Conner, M. & Sparks, P. (1996) "The theory of planned behaviour and health behaviours" in Predicting health behaviour, ed. M. Conner & P. Norman, Buckingham: Open University Press, , pp. 121-162.
Conner, M. & Armitage, C.J. (1998) "Extending the Theory of Planned Behavior: A Review and Avenues for Further Research", Journal of Applied Social Psychology,
vol. 28, no. 15, pp. 1429-1464.

348
Conner, M., Povey, R., Sparks, P., James, R. & Shepherd, R. (2003) "Moderating role of attitudinal ambivalence within the theory of planned behaviour", British Journal of
Social Psychology, vol. 42, no. 1, pp. 75-94.
Cooper, J. & Weaver, K. (2003) Gender and Computers: Understanding the Digital
Divide, Lawrence Erlbaum Associates, Mahwah, NJ.
Cordeiro, C., Machas, A. & Neves, M.M. (2010) "A case study of customer satisfaction problem: Bootstrap and imputation techniques" in Handbook of Partial Least Squares
Concepts, Methods and Applications, eds. E.V. Vinzi, W.W. Chin, J. Henseler & H. Wang, springer handbooks comp.statistics, Heidelberg.
Cotterman, W.W. & Kumar, K. (1989) "User Cube: A Taxonomy of End Users", Communications of the ACM, vol. 32, no. 11, pp. 1313-1320.
Crane, D. (ed)(1994) The sociology of culture, Blackwell, Oxford.
Creswell, J.W. (2003) Research design: Qualitative, quantitative, and mixed methods
approaches 2nd edn, Thousand Oaks, CA: Sage.
Cronbach, L.J. (1951) "Coefficient Alpha and the Internal Structure of Tests", Psychometrika, vol. 16, no. September, pp. 297-334.
Crotty, M. (1998) The foundations of social research: meaning and perspective in the
research process, St Leonards, NSW: Allen and Unwin.
Curran, P.J., West, S.G. & F. Finch, J.F. (1996) "The robustness of test statistics to non-normality and specification error in confirmatory factor analysis.", Psychological
Methods, vol. 1, no. 1, pp. 16-29.
Curtis, L., Edwards, C., Fraser, K.L., Gudelsky, S., Holmquist, J., Thornton, K. & Sweetser, K.D. (2010) "Adoption of social media for public relations by nonprofit organizations", Public Relations Review, vol. 36, no. 1, pp. 90-92.
Dabholkar, P.A. & Bagozzi, R.P. (2002) "An Attitudinal Model of Technology-Based Self-Service: Moderating Effects of Consumer Traits and Situational Factors", Journal of
the Academy of Marketing Science 2002 30: 184, vol. 30, no. 184.
Davidson, A.R. & Morrison, D.M. (1983) "Predicting contraceptive behavior from attitudes: A comparison of within-versus between-subjects procedures", Journal of
Personality and Social Psychology, vol. 45, pp. 997-1009.
Davis, D.L. & Davis, D.F. (1990) "The Effect of Training Techniques and Personal Characteristics on Training End Users of Information Systems", Journal of
Management Information Systems, vol. 7, no. 2, pp. 93-110.
Davis, F. (1989) "Perceived Usefulness, Perceived Ease of Use, and User Acceptance of Information Technology", MIS Quarterly, , pp. 319-339.
Davis, F. (1986) Technology Acceptance Model for Empirically Testing New End-User
Information Systems: Theory and Results, Massachussetts Institute of Technology.
Davis, F., Bagozzi, R. & Warshaw, P. (1989) "User Acceptance of Computer Technology: A Comparison of Two Theoretical Models", <I>Management Science</I>, vol. 35, no. 8, pp. 982-1003.

349
Davis, F.D. (1993) "User Acceptance of Information Technology - System Characteristics, User Perceptions and Behavioral Impacts", International Journal of Man-Machine
Studies, vol. 38, no. 3, pp. 475-487.
Davis, F.D., Bagozzi, R.P. & Warshaw, P.R. (1992) "Extrinsic and Intrinsic Motivation to Use Computers in the Workplace", Journal of Applied Social Psychology, vol. 22, no. 14, pp. 1111-1132.
Davis, F.D. & Venkatesh, V. (2004) "Toward preprototype user acceptance testing of new information systems: implications for software project management", Engineering
Management, IEEE Transactions on, vol. 51, no. 1, pp. 31-46.
De Long, D.W. & Fahey, L. (2000) "Diagnosing cultural barriers to knowledge management", Academy of Management Executive, vol. 14, no. 4, pp. 113-127.
DeLone, W.H. (1988) "Determinants of Success for Computer Usage in Small Business.", MIS Quarterly, vol. 12, no. 1, pp. 50.
Denzin, N.K. & Lincoln, Y.S. (2000) Handbook of qualitative research, Introduction: The
discipline and practice of qualitative research, 2nd edn, Sage, Thousand Oaks, CA.
Diamantopoulos, A. & Siguaw, J. (2000) Introducing LISERL, Sage, London.
Dibbern, J. & Chin, W.W. (2005) "Multi-group comparison: testing a PLS-model on the sourcing of application software service across Germany and U.S.A. using permutation based algorithm" in Handbuch PLS Pfadmodellierung: Methode,
Anwendung, Praxisbeispiele, eds. F.W. Bliemel, A. Eggert, G. Fassott & J. Henseler, Stuttgart, Schffer-Poeschel, pp. 135-159.
Dillman, D. (2000) Constructing the questionnaire Mail and internet surveys, John Wiley & Sons, New York.
Dishaw, M.T. & Strong, D.M. (1999) Extending the Technology Acceptance Model with
Task-technology Fit Constructs.
Doherty, N.F. & Doig, G. (2003) "An Analysis of the Anticipated Cultural Impacts of the Implemementation of Data Warehouses", IEEE transactions on engineering
management, vol. 50, no. 1, pp. 78-88.
Dorfman, W.P. & Howell, P.J. (1988) "Dimensions of National Culture and Effective Leadership Patterns: Hofstede Revised", Advances in International Comparative
Management, vol. 3, pp. 127-150.
Eagly, A.H. & Chaiken, S. (1993) "The psychology of attitudes", .
Eastin, M.S. (2002) "Diffusion of e-commerce: an analysis of the adoption of four e-commerce activities", Telematics and Informatics, vol. 19, no. 3, pp. 251-267.
Eastin, M.S. & LaRose, R. (2000) "Internet Self-Efficacy and the Psychology of the Digital Divide", Journal of Computer-Mediated Communication, vol. 6, no. 1,
Eberl, M. (2010) "An application of PLS in multi-group analysis: the need for differentiated corporate-level marketing in the mobile communications industry" in Handbook of partial least squares: Concepts, Methods and Aplications, eds. E.V. Vinzi, W.W. Chin, J. Henseler & H. Wang, SPRINGER HANDBOOKS COMP.STATISTICS, Heidelberg, pp. 487-513.

350
Eckhardt, A., Laumer, S. & Weitzel, T. (2009) "Who influences whom? Analyzing workplace referents’ social influence on IT adoption and non-adoption", Journal of
Information Technology, vol. 24, no. 1, pp. 11-24.
Eggert, A., Fassott, G. & Helm, S. (2005) "Identifizierung und quantifizierung mediierender und moderierender effekte in komplexen kausalstrukturen." in Handbuch PLS-Pfadmodellierung. Methode, Anwendung, Praxisbeispiele., eds. F. Bliemel, A. Eggert, G. Fassott & J. Henseler, Stuttgart, Schaffer-Poeschel.
Eisenhardt, K. (1989) "Building Theory from Case Study Research", Academy of
Management Review, vol. 14, no. 4, pp. 532-550.
Ellen, P., Bearden, W. & Sharma, S. (1991) "Resistance to technological innovations: An examination of the role of self-efficacy and performance satisfaction", Journal of the
Academy of Marketing Science, vol. 19, no. 4, pp. 297-307.
Elliott, M.A., Armitage, C.J. & Baughan, C.J. (2003) "Drivers' compliance with speed limits: An application of the theory of planned behavior", Journal of Applied
Psychology, vol. 88, no. 5, pp. 964-972.
Farhoomand, A. & Drury, D.H. (1999) "A historiographical examination of information systems", Communications of AIS, vol. 1, no. 5.
Fichman, R.G. (1992) "Information technology diffusion: a review of empirical research", 13th International Conference on Information Systems (ICIS).
Field, A. (2009) Discovering Statistics using SPSS, 3rd edn, Sage, London.
Field, A. (2006) Discovering Statistics Using SPSS, 2nd edn, SAGE, London.
Finance PAK (2010) Government of Pakistan, Ministry of Finance. Available: http://www.finance.gov.pk/survey_0910.htmlJan 2010].
Fishbein, M. & Ajzen, I. (1975) Belief, Attitude, Intention and Behavior: An Introduction
to Theory and Research, Addison-Wesley Publishing Company, Reading, MA.
Ford, D.P., Connelly, C.E. & Meister, D.B. (2003) "Information systems research and hofstede's culture's consequences: an uneasy and incomplete partnership", IEEE
Transactions on Engineering Management, vol. 50, no. 1, pp. 8-25.
Ford, F., N., Ledbetter, W., N. & Roberts, T., L. (1996) "The impact of decision support training on computer use: the effect of prior training, age, and gender", J. End User
Comput, vol. 8, no. 3, pp. 15-23.
Fornell, C. & Cha, J. (1994) "Partial least squares " in Advanced Methods of Marketing
Research, ed. R.P. Bagozzi, Blackwell, Cambridge, MA., pp. 52-78.
Fornell, C. & Larcker, D., F. (1981) "Evaluating Structural Equation Models with Unobservable Variables and Measurement Error", Journal of Marketing Research,
vol. 18, no. 1, pp. 39-50.
Fornell, C. & Yi, Y. (1992) "Assumptions of the two-step approach to latent variable modeling ", Sociological Methods and Research, vol. 20, pp. 291-320.
Fowler, F.J. (2002) Survey Research Methods, 3rd edn, Sage Publications, Newbury Park, CA.
351
Foxall, G.R. (1997) Marketing Psychology: The Paradigm in the wings, Macmillan, London.
Frazer, L. & Lawley, M. (2000) Questionnaire Design and Administration, Wiley, New York, NY, .
Galliers[supa], R.D. (1998) "Information systems and culture: applying 'stages of growth' concepts to development administration", Information Technology for Development,
vol. 8, no. 2, pp. 89.
Garver, M.S. & Mentzer, J.T. (1999) "Logistics research methods: Employing structural equation modeling to test for construct validity", Journal of Business Logistics, vol. 20, no. 1, pp. 33-57.
Gefen, D. & Straub, D., W. (1997) "Gender Differences in the Perception and Use of E-Mail: An Extension to the Technology Acceptance Model", MIS Quarterly, vol. 21, no. 4, pp. 389-400.
Gefen, D. & Straub, D. (2000) "The Relative Importance of Perceived Ease of Use in IS Adoption: A Study of E-Commerce Adoption", Journal of the Association for
Information Systems, vol. 1, no. 8, pp. 1-30.
Gefen, D., Straub, D. & Boudreau, M. (2000) "Structural Equation Modeling and Regression: Guidelines for Research Practice", Communications of the Association
for Information Systems, vol. 4, no. 7, pp. 1-77.
Geisser, S. (1975) "A predictive approach to the random effect model", Biometrika, vol. 61, no. 1, pp. 101-107.
Gentry, L. & Calantone, R. (2002) "A comparison of three models to explain shop-bot use on the web", Psychology and Marketing, vol. 19, pp. 945-956.
Gerbing, D.W. & Anderson, J.C. (1988) "An Updated Paradigm for Scale Development Incorporating Unidimensionality and Its Assessment", Journal of Marketing
Research, vol. 25, no. May, pp. 186-192.
Gilbert, N. (2001) Researching Social Life, 2nd edn, Sage, London.
Gilbert, S.W. (1996) "Making the most of a slow revolution", Change, vol. 28, no. 2, pp. 10.
Gist, M.E., Schwoerer, C. & Rosen, B. (1989) "Effects of alternative training methods on self-efficacy and performance in computer software training.", Journal of Applied
Psychology, vol. 74, no. 6, pp. 884-891.
Gist, M., Rosen, B. & Schwoerer, C. (1988) "The influence of training method and trainee age on the acquisition of computer skills", Personal Psychology, vol. 41, no. 2, pp. 255-265.
Gold, A.H., Malhotra, A. & Segars, A.H. (2001) "Knowledge Management: An Organizational Capabilities Perspective", Journal of Management Information
Systems, vol. 18, no. 1, pp. 185-214.
Goodhue, D.L. (1988) "IS attitudes: toward theoretical and definitional clarity", SIGMIS
Database, vol. 19, no. 3/4, pp. 6-15.

352
Goodhue, D.L. & Thompson, R.L. (1995) "Task-Technology Fit and Individual Performance", MIS Quarterly, vol. 19, no. 2, pp. 341-356.
Gorsuch, R.L. (1983) Factor analysis, Lawrence Erlbaum Associates, Hillsdale, NJ.
Gotz, O., Liehr-Gobbers, K. & Krafft, M. (2010) "Evaluation of structural equation models using the partial least squares (PLS) approach" in Handbook of Partial Least
Squares: Concepts, Methods and Applications, eds. V.E. Vinzi, W.W. Chin & J.W. Henseler H., springer handbooks comp.statistics, Heidelberg, pp. 691-711.
Gouldner, A.W. (1958) "Cosmopolitans and Locals: Toward an Analysis of Latent Social Roles–II", Administrative Science Quarterly, vol. 2, no. 4, pp. 444-480.
Gov. Pak (2009) Government of Pakistan: Official web gateway to the government of
Pakistan. Available: http://www.pakistan.gov.pk/ [2009, 12/30].
Greene, K.L., Hale, J.L. & Rubin, D. (1997) "A test of the theory of reasoned action in the context of condom use and AIDS", Communication Reports, vol. 10, pp. 21-35.
Grover, V., Teng, J.T.C. & Fiedler, K.D. (1998) "IS investment priorities in contemporary organizations ", Commun. ACM, vol. 41, no. 2, pp. 40-48.
Guba, E.G. & Lincoln, Y.S. (1994) "Competing paradigms in qualitative research" in Handbook of Qualitative Research, eds. N.K. Denzin & Y.S. Lincoln, Sage, Thousand Oaks, pp. 105-117.
Guiller, J. & Durndell, A. (2006) "'I totally agree with you': gender interactions in educational online discussion groups", Journal of Computer Assisted Learning, vol. 22, no. 5, pp. 368-381.
Gunton, T. (1988) Business Information Technology: End User Focus, Prentice-Hall, Inc., Upper Saddle River, NJ, USA.
Gupta, B., Dasgupta, S. & Gupta, A. (2008) "Adoption of ICT in a government organization in a developing country: An empirical study", The Journal of Strategic
Information Systems, vol. 17, no. 2, pp. 140-154.
Gyeung-Min Kim & Eui, S.K. (2008) "An Exploratory Study of Factors Influencing Asp (Application Service Provider) Success", Journal of Computer Information Systems,
vol. 48, no. 3, pp. 118-124.
Ha, S. & Stoel, L. (2009) "Consumer e-shopping acceptance: Antecedents in a technology acceptance model", Journal of Business Research, vol. 62, no. 5, pp. 565-571.
Hair Joseph F. Jr., Black William C., Babin Barry J., Anderson Rolph E. & Tatham Ronald L. (2006) Multivariate Data Analysis, 6th edn, Pearson Prentice Hall, Pearson Education, Inc., Upper Saddle River, New Jersey 07458.
Hall, D. & Mansfield, R. (1975) "Relationship of age and seniority with career variables of engineering and scientist", J. Appl. Psychol, vol. 60, pp. 201-210.
Hall, E.T. (1989) Beyond Culture, Anchor Books Editions, New York.
Han, S. (2003) Individual adoption of information systems in organizations: A literature
review of technology acceptance model, TUCS.

353
Haralambos, M. & Holborn, M. (2000) Sociology: Themes and Perspectives,
HarperCollins Publishers, Hammersmith, London.
Harris, R.W. (1997) "Teaching, learning and information technology: Attitudes towards computers among Hong Kong’s faculty", Journal of Computing in Higher Education,
vol. 9, no. 1, pp. 89-114.
Harrisburg, J., Hasan, H. & Ditsa, G. (1999) "The impact of culture on the Adoption of IT: An interpretive study", Journal of Global Information Management, vol. 7, no. 1, pp. 5-15.
Harrison, W.A. & Rainer, J. (1992) "The influence of individual differences on skill in end-user computing", Journal of Management Information Systems, vol. 9, no. 1, pp. 93-111.
Hartwick, J. & Barki, H. (1994) "Explaining the role of user participation in information system use", Management Science, vol. 40, no. 4, pp. 440-465.
Hasan, B.B. & Ahmed, M.U. (2010) "A Path Analysis of the Impact of Application-Specific Perceptions of Computer Self-Efficacy and Anxiety on Technology Acceptance", Journal of organizational and end user computing, vol. 22, no. 3, pp. 82-95.
Hasan, H. & Ditsa, G. (1999) "The impact of culture on the adoption of IT: An interpretive study", Journal of global information management, vol. 7, no. 1, pp. 5.
HEC PAK (2009) Higher Education Commission, Pakistan. Available: http://www.hec.gov.pk/Pages/main.aspx [2009, 12/30].
Heijden, V.D.H. (2004) "User Acceptance of Hedonic Information Systems", MIS
Quarterly, vol. 28, no. 4, pp. 695-704.
Heintze, T. & Bretschneider, S. (2000) "Information Technology and Restructuring in Public Organizations: Does Adoption of Information Technology Affect Organizational Structures, Communications, and Decision Making?", Journal of
Public Administration Research and Theory, vol. 10, no. 4, pp. 801-830.
He, J. & Freeman, L. (2009) "Are Men More Technology-Oriented Than Women? The Role of Gender on the Development of General Computer Self-Efficacy of College Students", AIS Electronic Library (AISeL), , pp. Paper 672.
Henseler, J. & Fassott, G. (2010) "Testing Moderating Effects in PLS Path Models: An Illustration of Available Procedures" in Hand Book of Partial Least Squares:
Concepts, Methods and Applications, eds. V.E. Vinzi, W.W. Chin, J. Henseler & H. Wang, Springer Handbooks Comp.Statistics, , pp. 713-735.
Henseler, J., Christian, M., Ringle & Rudolf, R., Sinkovics (2009) "the use of partial least squares path modeling in international marketing", New Challenges to International
Marketing Advances in International Marketing, vol. 20, pp. 277-319.
Hilgard., E., R. & Bower., G., H. (1975) Theories of Learning, Prentice Hall, Englewood Cliffs, NJ.
354
Hill, C.E., Loch, K.D., Straub, D. & El-Sheshai, K. (1998) "A qualitative assessment of Arab culture and information technology transfer", Journal of global information
management, vol. 6, pp. 29.
Hirschheim, R. & Klein, H.K. (1992) "Paradigmatic influences on information systems development methodologies: Evolution and conceptual advances Advances in Computers", Advances in Computers, vol. 34, pp. 293-392.
Hoecklin, L.A. (1995) Managing cultural differences : strategies for competitive
advantage, Addison-Wesley, Wokingham, England ; Reading, Mass.
Hofstede, G. (1994) Values survey modules manual [Homepage of Tilburg University, Tilburg, Netherlands], [Online]. Available: http://stuwww.uvt.nl/~csmeets/~1st-VSM.html [2010, 2/12].
Hofstede, G. (1984) Culture's Concequences, Abridged edition edn, Sage Publications, Beverly Hills, CA.
Hofstede, G. & Hofstede, J. (2005) Cultures and Organizations: Software of the Mind, 2nd
Edition, McGraw-Hill.
Hofstede, G. (1980) Culture's consequences: International differences in work-related
values, Sage, Beverly Hills.
Holden, N. (2002) "Cross-cultural management: A knowledge management perspective" in Financial Times Prentice Hall, Harlow, In Dahl Stephan, 2004.
Holmes-Smith, P., Coote, L. & Cunningham, E. (2004) "Structural Equation Modeling: From the Fundamentals to Advanced Topics,", ACSPRI-Summer Training Program, .
Honold, P. (1999) "Cross-Cultural or Intercultural: Some Findings on International Usability Testing", Designing for Global Markets 1: IWIPS’ 1999 Proceedings The
First International Workshop on Internationalization of Products and
SystemsBackhouse Press. Rochester, New York, USA, , pp. 107.
Horn, J.L. (1965) "A rationale and test for the number of factors in factor analysis", Psychometrika, vol. 30, pp. 179-185.
Howard, G., S. & Smith, R., D. (1986) "Computer anxiety in management: myth or reality?", Commun. ACM, vol. 29, no. 7, pp. 611-615.
Hsu, M. & Chiu, C. (2004a) "Predicting electronic service continuance with a decomposed theory of planned behaviour", Behaviour and Information Technology, vol. 23, no. 5, pp. 359-373(15).
Hsu, M. & Chiu, C. (2004b) "Internet self-efficacy and electronic service acceptance", Decision Support Systems, vol. 38, no. 3, pp. 369-381.
Hu, H., Al-Gahtani, S.S. & and Hu, P.J., (2010) " Examining Gender Effects in Technology Acceptance by Arabian Workers: A Survey Study ",
Hu, P.J., Chau, P.Y.K., Liu Sheng, O.R. & Kar, Y.T. (1999) "Examining the Technology Acceptance Model Using Physician Acceptance of Telemedicine Technology", Journal of Management Information Systems, vol. 16, no. 2, pp. 91-112.
355
Hu, P.J., Clark, T.H.K. & Ma, W.W. (2003) "Examining technology acceptance by school teachers: a longitudinal study", Information & Management, vol. 41, no. 2, pp. 227-241.
Huang, J.C., Newell, S., Galliers, R.D. & Shan-Ling Pan (2003) "Dangerous liaisons? Component-based development and organizational subcultures", Engineering
Management, IEEE Transactions on, vol. 50, no. 1, pp. 89-99.
Hubbard, R. & Allen, S.J. (1987) "An empirical comparison of alternative methods for principal component extraction", Journal of Business Research, vol. 15, pp. 173-190.
Huh, H.J., Kim, T.(. & Law, R. (2009) "A comparison of competing theoretical models for understanding acceptance behavior of information systems in upscale hotels", International Journal of Hospitality Management, vol. 28, no. 1, pp. 121-134.
Hulland, J. (1999) "Use of partial least squares (PLS) in strategic management research: a review of four recent studies", Strategic management journal, vol. 20, no. 4, pp. 195-204.
Hussey, J. & Hussey, R. (1997) Business Research: A Practical Guide for Undergraduate
and Postgraduate Students, Macmillan, London.
Hwang, Y. (2005) "Investigating enterprise systems adoption: uncertainty avoidance, intrinsic motivation, and the technology acceptance mode", European Journal of
Information Systems, vol. 14, no. 2, pp. 150-161.
Igbaria, M. (1992) "An examination of microcomputer usage in Taiwan", Information and
Management., vol. 22, no. 1, pp. 19-28.
Igbaria, M.F.N., Pavri & Huff, S.L. (1989) "Microcomputer applications: An empirical look at usage.", Information and Management, vol. 16, no. 4, pp. 187-196.
Igbaria, M. & Chakrabarti, A. (1990) "Computer anxiety and attitudes towards microcomputer use", Behaviour and Information Technology, vol. 9, no. 3, pp. 229-241.
Igbaria, M. & Parasuraman, S. (1989) "A Path Analytic Study of Individual Characteristics, Computer Anxiety and Attitudes toward Microcomputers", Journal
of Management, vol. 15, no. 3, pp. 373-388.
Igbaria, M. (1994) "An examination of the factors contributing to microcomputer technology acceptance.", Accounting, Management and Information Technologies,
vol. 4, no. 4, pp. 205-224.
Igbaria, M. (1993) "User acceptance of microcomputer technology: An empirical test", Omega, vol. 21, no. 1, pp. 73-90.
Igbaria, M. (1990) "End-user computing effectiveness: A structural equation model", Omega, vol. 18, no. 6, pp. 637-652.
Igbaria, M. & Iivari, J. (1995) "Effects of self-efficacy on computer usage", Omega-
International Journal of Management Science, vol. 23, no. 6, pp. 587-605.
Igbaria, M. & Tan, M. (1997) "The consequences of information technology acceptance on subsequent individual performance", Information & Management, vol. 32, no. 3, pp. 113-121.
356
Igbaria, M., Zinatelli, N., Cragg, P. & Cavaye, A.L.M. (1997) "Personal computing acceptance factors in small firms: A structural equation model", MIS Quarterly, vol. 21, no. 3, pp. 279-305.
Igbaria, M., Guimaraes, T. & Davis, G.B. (1995) "Testing the determinants of microcomputer usage via a structural equation model", Journal of Management
Information Systems, vol. 11, no. 4, pp. 87.
Igbaria, M. & Nachman, S.A. (1990) "Correlates of user satisfaction with end user computing : An exploratory study", Information & Management, vol. 19, no. 2, pp. 73-82.
Igbaria, M. & Zinatelli, N. (1997) "Personal computing acceptance factors in small firms: A structural equation model.", MIS Quarterly, vol. 21, no. 3, pp. 279.
Internet World Stats (2010) January 1, 2010-last update, Internet World Stats Usage and
Population Statistics. Available: http://www.internetworldstats.com/ [2010, 1/1].
ITU (2009) International Telecommunication Union, World Telecommunication
Development Report and database, and World Bank estimates. Available: http://datafinder.worldbank.org/internet-users [2009, 12/30].
Janice, I., Degross, Sirkka, J., Ananth, S., Wynne, C., Barbara, Barbara, L., Marcolin & Peter, R., Newsted. (1996) "A Partial Least Squares Latent Variable Modeling Approach For Measuring Interaction Effects: Results From A Monte Carlo Simulation Study And Voice Mail Emotion/adoption Study", [Online], .
Jarvenpaa, S.L., Tractinsky, N. & Saarinen, L. (1999) "Consumer Trust in an Internet Store: A Cross-Cultural Validation ", Journal of Computer-Mediated
Communication, vol. 5, no. 2, pp. 1-34.
Jarvenpaa, S.L. & Leidner, D.E. (1999) "Communication and Trust in Global Virtual Teams", Organization Science, vol. 10, no. 6, pp. 791-815.
Jarvenpaa, S.L. & Leidner, D.E. (1998) "An information company in Mexico: Extending the resource-based view of the firm to a developing country context", Information
Systems Research, vol. 9, no. 4, pp. 342-361.
Jarvenpaa, S.L. & Staples, D.S. (2001) "Exploring Perceptions of Organizational Ownership of Information and Expertise", Journal of Management Information
Systems, vol. 18, no. 1, pp. 151-183.
Johnson, R.D. & Marakas, G.M. (2000) "Research Report: The Role of Behavioral Modeling in Computer Skills Acquisition: Toward Refinement of the Model ", Information Systems Research, vol. 11, no. 402, pp. 417.
Johnston, D.C. (1997) "Computers clogged, IRS seeks to hire outside processors ", New
York Times (Jan. 31), .
Joreskog, G. & Sorbom, D. (2001) LISREL 8: User's reference guide, Scientific software international Inc., Lincolnwood, IL.
Jorgenson, D.W. & Motohashi, K. (2005) "Information technology and the Japanese economy", Journal of the Japanese and International Economies, vol. 19, no. 4, pp. 460-481.

357
Kaiser, H.F. (1974) "An Index of Factorial Simplicity", Psychometrika, vol. 39, pp. 31-36.
Kanter, R.M. (1983) The Change Masters: Innovation for Productivity in the American
Coorporations, Simon & Shuster, New York.
Karahanna, E., Evaristo, R. & Srtie, M. (2005) "Levels of culture and individual behavior: An integrative perspective", Journal of Global Information Managment, vol. 13, no. 2.
Karahanna, E. & Straub, D.W. (1999) "The psychological origins of perceived usefulness and ease-of- use", Information & Management, vol. 35, no. 4, pp. 237-250.
Karahanna, E. (1999) "Information Technology Adoption Across Time: A Cross-Sectional cmparison of Pre-Adoption and Post-Adoption Beliefs", MIS Quarterly, vol. 23, no. 2, pp. 183-213.
Keil, M., Beranek, P.M. & Konsynski, B.R. (1995) "Usefulness and Ease of Use - Field-Study Evidence Regarding Task Considerations", Decision Support Systems, vol. 13, no. 1, pp. 75-91.
Keil, M. (2000) "A Cross-Cultural Study on Escalation of Commitment Behavior in Software Projects.", MIS Quarterly, vol. 24, no. 2, pp. 299.
Kelman, H., C. (1958) "Compliance, Identification, and Internalization: Three Processes of Attitude Change.", Journal of Conflict Resolution, vol. 2, no. 1, pp. 51-60.
Khoumbati, K., Dwivedi, Y.K., Lal, B. & Chen, H. (2007) "Broadband adoption in Pakistan", Electronic Government, an International Journal, vol. 4, no. 4, pp. 451-465.
Kim, B., Choi, M. & Han, I. (2009) "User behaviors toward mobile data services: The role of perceived fee and prior experience", Expert Systems with Applications, vol. 36, no. 4, pp. 8528-8536.
Kim, H., Kim, T.(. & Shin, S.W. (2009) "Modeling roles of subjective norms and eTrust in customers' acceptance of airline B2C eCommerce websites", Tourism Management,
vol. 30, no. 2, pp. 266-277.
Kite, M.E. (1996) "AGE, GENDER, AND OCCUPATIONAL LABEL", Psychology of
Women Quarterly, vol. 20, no. 3, pp. 361-374.
Klein, H.K. & Myers, M.D. (1999) "A set of principles for conducting and evaluating interpretive field studies in information systems", MIS Quarterly, vol. 23, no. 1, pp. 67-93.
Kline, R.B. (2005) Principles and practice of structural equation modeling, 2nd edn, Guildwood, New York.
Kluckhohn, F.R. & Strodtbeck, F.L. (1961) Variations in value orientations, Evanston, III, Row, Peterson.
Koivumäki, T., Ristola, A. & Kesti, M. (2008) "The perceptions towards mobile services: an empirical analysis of the role of use facilitators", Personal and Ubiquitous
Computing, vol. 12, no. 1, pp. 67-75.

358
Koufaris, M. (2002) "Applying the technology acceptance model and flow theory to online consumer behavior", Information Systems Research, vol. 13, no. 2, pp. 205-223.
Krathwohl, D. (1997) Methods of Educational and Social Science Research: An Integrated
Approach, 2nd edn, Addison Wesley Longman, Glen View, IL.
Krejcie, R.V. & Morgan, D.W. (1970) "Determining sample size for research activities", Educational and Psychological Measurement, vol. 30, pp. 607-610.
Kripanont, N. (2007) Examining a Technology Acceptance Model of Internet Usage by
Academics within Thai Business Schools, Victoria University.
Kroeber, A.L. & Kluckholn, C. (1952) Culture: A critical review of concepts and
definations, Vintage Books, New York.
Lambert, D.M. & Harrington, T.C. (1990) "Measuring non-response bias in customer service mail surveys", Journal of Business Logistics, vol. 11, no. 2, pp. 5-25.
Landauer, T.K. The Trouble with Computers: Usefulness, Usability, and Productivity, MIT Press, Cambridge, MA.
LaRose, R. & Eastin, M., S. (2004) "A Social Cognitive Theory of Internet Uses and Gratifications: Toward a New Model of Media Attendance", Journal of Broadcasting
& Electronic Media, vol. 48, no. 3, pp. 358-377.
Larsen, T.J., Sørebø, A.M. & Sørebø, Ø. (2009) "The role of task-technology fit as users’ motivation to continue information system use", Computers in Human Behavior, vol. 25, no. 3, pp. 778-784.
Lazinger, S.S., Bar-Ilan, J. & Peritz, B.C. (1997) "Internet use by faculty members in various disciplines: A comparative case study", Journal of the American Society for
Information Science, vol. 48, no. 6, pp. 508-518.
Lee, D. (1986) "Usage Pattern and Sources of Assistance for Personal Computer Users ", MIS Quarterly, vol. 10, no. 4, pp. 313-325.
Lee, Y., Kozar, K.A. & Larsen, K.R.T. (2003) "The Technology Acceptance Model: Past, Present, and Future ", Communications of the Association for Information Systems, vol. 12, no. 50, pp. 752-780.
Leidner, D.E., Carlsson, S., Elam, J. & Corrales, M. (1999) "Mexican and Swedish Managers' Perceptions of the Impact of EIS on Organizational Intelligence, Decision Making, and Structure*", Decision Sciences, vol. 30, no. 3, pp. 632-658.
Leidner, D.E. & Kayworth, T. (2006) "Review: a Review of Culture in Information Systems Research: Toward a Theory of Information Technology Culture Conflict", MIS Quarterly, vol. 30, no. 2, pp. 357-399.
Leonard-Barton (1987) "The Case for Integrative Innovation An Expert System at Digital", MIT Sloan management review, vol. 29, no. 1, pp. 7.
Leonard-Barton, D. & Deschamps, I. (1988) "Managerial influence in the implementation of new technology", Management Science, vol. 34, no. 10, pp. 1252-1265.

359
Leone, L., Perugini, M. & Ercolani, A.P. (2004) "Studying, Practicing, and Mastering: A Test of the Model of Goal-Directed Behavior (MGB) in the Software Learning Domain", Journal of Applied Social Psychology, vol. 34, no. 9, pp. 1945-1973.
Levy, J.A. (1988) "Intersections of Gender and Aging", The Sociological Quarterly, vol. 29, no. 4, pp. 479-486.
Lewis, W., Agarwal, R. & Sambamurthy, V. (2003) "sources of influence on beliefs about information technology use: an empirical study of knowledge workers.", MIS
Quarterly, vol. 27, no. 4, pp. 657-678.
Likert, R. (1932) "A technique for the measurement of attitudes.", Archives of Psychology,
vol. 22, no. 140, pp. 1-55.
Lin, F.H.D. & Wu, D.J.H. (2004) "An Empirical Study of End-User Computing Acceptance Factors in Small and Medium Enterprises in Taiwan: Analyzed by Structural Equation Modeling", Journal of Computer Information Systems, vol. 44, no. 3, pp. 98-108.
Lin, H. (2007) "Predicting consumer intentions to shop online: An empirical test of competing theories", Electronic Commerce Research and Applications, vol. 6, no. 4, pp. 433-442.
Lincoln, Y.S. & Guba, E.G. (2000) "Paradigmatic controversies, contradictions and emerging confluences" in Handbook of Qualitative Research, eds. N.K. Denzin & Y.S. Lincoln, 2nd edn, Thousands Oaks, CA, Sage Publications, .
Liu, I., Chen, M.C., Sun, Y.S., Wible, D. & Kuo, C. (2010) "Extending the TAM model to explore the factors that affect Intention to Use an Online Learning Community", Computers & Education, vol. 54, no. 2, pp. 600-610.
Loch, K.D., Straub, D.W. & Kamel, S. (2003) "Diffusing the Internet in the Arab world: the role of social norms and technological culturation", Engineering Management,
IEEE Transactions on, vol. 50, no. 1, pp. 45-63.
Loehlin, J.C. (1992) Latent Variable Models An Introduction to Factor, Path, and
Structural Analysis, 3rd edn, Lawrence Erlbaum Associates, New Jersey London.
Lu, M. (1999) "Do people move when they say they will? Inconsistencies in individual migration behavior", Population and Environment A Journal of Interdisciplinary
Studies, vol. 20, no. 467, pp. 488.
Luck, D. & Rubin, R. (1987) Marketing Research, Prentice- Hall., New York.
Lymperopoulos, C. & Chaniotakis, I., E. (2005) "Factors affecting acceptance of the internet as a marketing-intelligence tool among employees of Greek bank branches", International Journal of Bank Marketing, vol. 23, no. 6, pp. 484-505.
Ma, W.W., Andersson, R. & Streith, K. (2005) "Examining user acceptance of computer technology: an empirical study of student teachers", Journal of Computer Assisted
Learning, vol. 21, no. 6, pp. 387-395.
Madden, T.J., Ellen, P.S. & Ajzen, I. (1992) "A comparison of the Theory of Planned Behavior and the Theory of Reasoned Action", Personality and Social Psychology
Bulletin, vol. 18, no. 1, pp. 3-9.
360
Mahmood, M.A., Hall, L. & Swanberg, D.L. (2001) "Factors Affecting Information Technology Usage: A Meta-Analysis of the Empirical Literature", Journal of
Organizational Computing and Electronic Commerce, vol. 11, no. 2, pp. 107-130.
Majchrzak, A. & Cotton, J. (1988) "A longitudinal study of adjustment to technological change: From mass to computer-automated batch production", Journal of
Occupational Psychology, vol. 61, no. 1, pp. 43-66.
Malhotra, Y. (2002) "Is knowledge management really an oxymoron? Unravelling the role of organizational controls in knowledge management" in knowledge mapping and
management, White D, Ed edn, Idea Group Publishing, Hershey, pp. 1-13.
Manstead, A. & Parker, D. (1995) "Evaluating and Extending the Theory of Planned Behaviour", European Review of Social Psychology, vol. 6, pp. 69-95.
Manstead, A.S.R. & van Eekelen, S.A.M. (1998) "Distinguishing Between Perceived Behavioral Control and Self-Efficacy in the Domain of Academic Achievement Intentions and Behaviors", Journal of Applied Social Psychology, vol. 28, no. 15, pp. 1375-1392.
Marakas, G., Yi, M. & Johnson, R. (1998) "The Multilevel and Multifaceted Character of Computer Self-Efficacy: Toward Clarification of the Construct and an Integrative Framework for Research", Information Systems Research, vol. 9, no. 2, pp. 126-163.
Mardia, K.V. (1970) "Measures of multivariate skewness and kurtosis with applications.", Biometrika, vol. 57, no. 3, pp. 519-530.
Martocchio, J.J. & Webster, J. (1992) "Effects of Feedback and Cognitive Playfulness on Performance in Microcomputer Software Training", Personnel Psychology, vol. 45, no. 3, pp. 553-578.
Mathieson, K. (1991) "Predicting User Intentions: Comparing the Technology Acceptance Model with the Theory of Planned Behavior", Information Systems Research, vol. 2, no. 3 (September), pp. 173-191.
Mathieson, K., Peacock, E. & Chin, W.W. (2001) "Extending the technology acceptance model: The influence of perceived user resources", Database for Advances in
Information Systems, vol. 32, no. 3, pp. 86.
McCoy, S. (2002) The Effect of National Culture Dimensions on the Acceptance of
Information Technology: A Trait Based Approach , doctoral dissertation edn, University of Pittsburgh.
McCoy, S., Everard, A. & Jones, B. (2005) "An examination of the technology acceptance model in Uruguay and the U.S.: a focus on culture", Journal of Global Information
Technology, vol. 8, no. 1, pp. 27-45.
McCoy, S., Galletta, D.F. & King, W. (2007) "Applying TAM across cultures: the need for caution", European Journal of Information Systems, vol. 16, pp. 81-90(10).
McDaniel, C.J. & Gates, R. (2006) Marketing Research Essentials, 5th edn, John Wiley & Sons, Inc, River Street, Hoboken.
361
McSweeney, B. (2002) "Hofstede's Model of National Cultural Differences and Their Consequences: A Triumph of Faith- A Failure of Analysis", Human Relations, vol. 55, pp. 89-118.
ME.Pak (2010) Ministry of Education Pakistan. Available: http://www.moe.gov.pk/ [2011, 12/03].
Mead, M. (1953) Cultural Patterns and Technical Change, Greenwood Press.
Mejias, R.J., Shepherd, M.M. & Morgan, M. (1996) "Consensus and perceived satisfaction and consensus levels: A cross cultural comparison of GSS and non-GSS outcome within and between the US and Mexico", Journal of Management Information
Systems, vol. 13, no. 3, pp. 137-161.
Menard, S. (2002) Applied Logistic Regression Analysis, 2nd edn, Sage, London, UK.
Mertens, D.M. (1998) Research methods in education and psychology: Integrating
diversity with quantitative & qualitative approaches, Sage Publications, Thousand Oaks, Calif.
Meyer, R. (1990) Classical and Modern Regression with Applications, Duxbury, Boston, MA.
Miller, C. & Toulouse, J.M. (1986) "Chief Executive Personality and Corporate Strategy and Structure in Small Firms", Management Science, vol. 32, no. 11, pp. 1389-1409.
Miller, K. (2005) Communications theories: perspectives, processes, and contexts,
McGraw-Hill, New York.
Miller, N.E. & Dollard, J. (1941) Social Learning and Imitation, Yale University Press, New Haven.
Mingers,J.(2003)"A classification of the philosophical assumptions of management science methods", Journal of the Operational Research Society, vol. 54, no. 6, pp. 559-570.
Minton, C. & & Schneider, F.W. (1980) Differential Psychology, Prospect Heights, IL: Waveland Press.
MOIT.PAK (2004) Ministry of Information Technology, Pakistan. Available: http://www.moit.gov.pk/ [2011, 12/03].
Monge, P.R., Cozzens, M.D. & Contractor, N.S. (1992) "Communication and Motivational Predictors of the Dynamics of Organizational Innovation", Organization Science, vol. 3, no. 2, pp. 250-274.
Monge, P.R., Fulk, J., Kalman, M.E., Flanagin, A.J., Parnassa, C. & Rumsey, S. (1998) "Production of collective action in alliance-based interorganizational communication and information systems", Organization Science, vol. 9, no. 3, pp. 411-433.
Moon, J.W. & Kim, Y.G. (2001) "Extending the TAM for a World-Wide-Web context", Information & Management, vol. 38, no. 4, pp. 217-230.
Moore, G.,C. & Benbasat, I. (1991) "Development of an Instrument to Measure the Perceptions of Adopting and Information Technology Innovation", Information
Systems Reseaerch, vol. 2, no. 3, pp. 192-222.
362
Moore, G.C. & Benbasat, I. (1996) "Integrating diffusion of innovations and theory of reasoned action models to predict utilization of information technology by end-users" in Diffusion and adoption of information technology, eds. K. Kautz & J. Pries-Heje, Chapman and Hall, London, pp. 132-146.
Morris, M.G. & Venkatesh, V. (2000) "Age Differences in Technology Adoption Decisions: Implications for a Changing Workforce", Personnel Psychology, vol. 53, no. 2, pp. 375-403.
Morris, M.G., Venkatesh, V. & Ackerman, P.L. (2005) "Gender and Age Differences in Employee Decisions About New Technology: An Extension to the Theory of Planned Behavior ", IEEE Transactions on Engineering Management, vol. 52, no. 1, pp. 69-84.
MTDF (2005) Medium Term Development Framework, Higher Education Commission,
Islamabad [2011, 12/03/2011].
Mujahid, Y.H. (2002) "Digital Opportunity Initiative for Pakistan", The Electronic Journal
on Information Systems in Developing Countries, vol. 8, no. 6, pp. 1-14.
Myers, M.D. (1997) "Qualitative research in information systems.", MIS Quarterly, vol. 21, no. 2, pp. 241-242.
Nguyen, M.N., Potvin, L. & Otis, J. (1997) "Regular Exercise In 30- To 60-Year-Old Men: Combining The Stages-Of-Change Model And The Theory Of Planned Behavior To Identify Determinants For Targeting Heart Health Interventions. ", Journal Of Community Health, vol. 22, no. 4, pp. 233-246.
Ngwenyama, O. & Nielsen, P.A. (2003) "Competing values in software process improvement: an assumption analysis of CMM from an organizational culture perspective", Engineering Management, IEEE Transactions on, vol. 50, no. 1, pp. 100-112.
Norusis, M.J. (1992) SPSS for Windows: Professional statistics, SPSS Inc., Chicago: IL.
Nunnally, J.C. (1978) Psychometric Theory, 2nd edn, McGraw-Hill, New York.
Nunnally, J.C. & Bernstein, I.H. (1994) Psychometric Theory, 3rd edn, McGraw-Hill, New York.
Nutt, P.C. (2000) "Decision-Making Success in Public, Private and Third Sector Organizations: Finding Sector Dependent Best Practice", Journal of Management
Studies, vol. 37, no. 1, pp. 77-108.
Obaid, Z. (2006) Reforming Political Universities: An Organizational Analysis of
University of Peshawar, Unpublished PhD Thesis edn, Department of Administration and Organization, University of Bergen, Norway.
Oh, S., Ahn, J. & Kim, B. (2003) "Adoption of broadband Internet in Korea: the role of experience in building attitudes", J Inf Technol, vol. 18, no. 4, pp. 267-280.
Orbell, S., Hodgkins, S. & Sheeran, P. (1997) "Implementation intentions and the theory of planned behavior 23 945–954 1997.", Personality and Social Psychology Bulletin,
vol. 23, pp. 945-954.
363
Orlikowski, W.J. & Baroudi, J.J. (1991) "Studying Information Technology in Organizations: Research Approaches and Assumptions", Information Systems
Research, vol. 2, no. 1, pp. 1-28.
Orlikowski, W. (1992) "The Duality of Technology: Rethinking the Concept of Technology in Organizations", Organization Science, vol. 3, no. 3, pp. 398-427.
Orlikowski, W.J. (2000) "Using Technology and Constituting Structures: A Practice Lens for Studying Technology in Organisations", Organisation Science, vol. 11, no. 4, pp. 404-428.
Oxford (2005) The Oxford Dictionary of Philosophy, 2nd edn, xford University Press 1994, 1996, 2005, 2008.
Pai, F. & Huang, K. (2011) "Applying the Technology Acceptance Model to the introduction of healthcare information systems", Technological Forecasting and
Social Change, vol. 78, no. 4, pp. 650-660.
Pajares (2002) Overview of social cognitive theory and of self-efficacy. Available: http://www.emory.edu/EDUCATION/mfp/eff.html [11/03/11, .
Pallant, J. (2007) SPSS Survival Manual: step-by-step guide to data analysis, 3rd edn, Allen & Unwin, Australia.
Panko, R., R. (1988) End User Computing: Management, Applications, &Amp;
Technology, John Wiley & Sons, Inc., New York, NY, USA.
Parasuraman, S. & Igbaria, M. (1990) "An examination of gender differences in the determinants of computer anxiety and attitudes toward microcomputers among managers", International Journal of Man-Machine Studies, vol. 32, no. 3, pp. 327-340.
Parboteeah, K.P., Bronson, W.J. & Cullen, B.J. (2005) "Does National Culture Affect Willingness to Justify Ethically Suspect Behaviors? A Focus on the GLOBE National Culture Scheme", International Journal of Cross Cultural Management, vol. 5, no. 2, pp. 123-138.
Patton, M.Q. (1990) Qualitative Research and Evaluation Methods, Sage Publications, Newbury Park, CA.
Pavlou, P., A. & Chai, L. (2002) "what drives electronic commerce across cultures? A cross-cultural empirical investigation of the theory of planned behaviour", Journal of
Electronic Commerce Research, vol. 3, no. 4, pp. 240-253.
Peabody, R.L. (1961) "Perception of organizational authority: A comparative analysis", Admin. Sci. Quart., , pp. 463-482.
Perugini, M. & Bagozzi, R.P. (2001) "The role of desires and anticipated emotions in goal-directed behaviours: Broadening and deepening the theory of planned behaviour", British Journal of Social Psychology, vol. 40, no. 1, pp. 79-98.
Peter, J.P. (1981) "Construct Validity: A Review of Basic Issues and Marketing Practices", Journal of Marketing Research, vol. 18, no. 2 (May), pp. 133-145.
Peter, J.P. (1979) "Reliability: A Review of Psychometric Basics and Recent Marketing Practices", Journal of Marketing Research, vol. 16, no. 1 (February), pp. 6-17.
364
Pikkarainen, T., Pikkarainen, K., Karjaluoto, H. & Pahnila, S. (2004) "Consumer acceptance of online banking: an extension of the technology acceptance model", Internet research, vol. 14, no. 3, pp. 224-235.
Pinsonneault, A. & Kraemer, K. (1993) "Survey Research Methodology in Management Information Systems: An Assessment", Journal of Management Information Systems,
vol. 10, pp. 75-105.
Plude, D.H., W (1985) "Attention and performance: identifying and localizing age deficits" in Aging and Human Performance, ed. N. Charness, Wiley, New York, pp. 47-99.
Png, I.P.L., Tan, B.C.Y. & Khai-Ling, W. (2001) "Dimensions of national culture and corporate adoption of IT infrastructure", Engineering Management, IEEE
Transactions on, vol. 48, no. 1, pp. 36-45.
Porter, C.E. & Donthu, N. (2006) "Using the technology acceptance model to explain how attitudes determine Internet usage: The role of perceived access barriers and demographics", Journal of Business Research, vol. 59, no. 9, pp. 999-1007.
Powell, M. & Ansic, D. (1997) "Gender differences in risk behavior in financial decision making: An experimental analysis", Journal of Economic Psychology, vol. 18, pp. 605-628.
Prager, K.J. (1986) "Identity Development, Age, and College Experience in Women", Journal of Genetic Psychology, vol. 147, no. 1, pp. 31.
PTA (2010) Pakistan Telecommunication Authority. Available: http://www.pta.gov.pk/ [2011, 12/03].
Purvis, R.L., Sambamurthy, V. & Zmud, R.W. (2001) "The assimilation of knowledge platforms in organizations: An empirical investigation", Organization Science, vol. 12, no. 2, pp. 117-135.
Püschel, J., Mazzon, J., A. & Hernandez, C.M.J. (2010) "Mobile banking: proposition of an integrated adoption intention framework", International Journal of Bank
Marketing, vol. 28, no. 5, pp. 389-409.
Rainey, H.G., Backoff, R.W. & Levine, C.H. (1976) "Comparing public and private organisations", Public administration review, , pp. 233-244.
Raub, A. (1981) Correlates of computer anxiety in college students, Ph.D edn, University of Pennsylvania, Philadelphia, PA.
Rennie, K.M. (1997) "Exploratory and confirmatory rotation strategies in exploratory factor analysis,", Annual Meeting of the Southwest Educational Research
Association, .
Reynolds, A. (1992) "What Is Competent Beginning Teaching? A Review of the Literature", review of educational research, vol. 62, no. 1, pp. 1-35.
Rice, C. (1997) Understanding Customers, Butter worth-Heinemann, Oxford.
Rigdon, E.E. & E., F.C.,Jr (1991) "The Performance of the Polychoric Correlation Coefficient and Selected Fitting Functions in Confirmatory Factor Analysis with Ordinal Data", Journal of Marketing Research, vol. 28, no. 4 (November), pp. 491-497.
365
Ringle, Christian Marc/Wende, Sven/Will & Alexander (2005) SmartPLS, University of Hamburg, Hamburg, Germany.
Robertson, C.J. (2000) "The global dispersion of Chinese values: a three-country study of Confucian Dynamism", Management International Review, vol. 40, no. 3, pp. 253-268.
Robertson, C.J. & Hoffman, J.J. (2000) "How different are we? An investigation of Confucian values in the United States", Journal of Managerial Issues, vol. 12, no. 1, pp. 34-47.
Robey, D. (1979) "User Attitudes and Management Information System Use", Academy of
Management Journal, vol. 22, no. 3, pp. 527-538.
Robinson, J.P., Shaver, P.R. & Wrightsman, L.S. (1991) "Criteria for Scale Selection and Evaluation In Measure of Personality and Social Psychological Attitudes", .
Rodgers, S. & Chen, Q. (2002) "Post-Adoption Attitudes to Advertising on the Internet", Journal of Advertising Research, vol. 42, no. 5, pp. 95-104.
Rogers, E.M. (2003) Diffusion of innovations, 5th edn, Free Press, New York.
Rogers, E.,M. (1995) Diffusion of Innovations, Fourth Edition edn, The Free Press, New York.
Rogers, E.,M. (1983) Diffusion of Innovations, Third Edition edn, The Free Press, New York.
Roosmalen, V. & McDaniel, S.A. (1992) "Adolescent smoking intentions: gender differences in peer context", Adolescence, vol. 27, no. 87, pp. 105.
Roscoe, J.T. (1975) Fundamental Research Statistics for the Behavioral Sciences, 2nd edn, Holt, Rinehart and Winston, Inc., New York, NY.
Rose, G.M., Evaristo, R. & Straub, D. (2003) "Culture and consumer responses to web download time: a four-continent study of mono and polychronism", Engineering
Management, IEEE Transactions on, vol. 50, no. 1, pp. 31-44.
Rose, G. & Straub, D. (1998) Predicting General IT Use: Applying TAM to the Arabic
World.
Rosen, L.D. & Maguire, P.D. (1990) "Myths and Realities in Computerphobia: A meta-analysis", Anxiety Research, vol. 3, pp. 175-191.
Rosenfeld, M., Reynolds, A. & Bukatko, P. (1992) The professional functions of
elementary school teachers, Princeton, NJ: Educational Testing Service.
Rouibah, K., Hamdy, H.I. & Al-Enezi, M.Z. (2009) "Effect of management support, training, and user involvement on system usage and satisfaction in Kuwait", Industrial Management & Data Systems, vol. 109, no. 3, pp. 338-356.
Rummel, R.J. (1970) Applied factor analysis, Northwestern University Press., Evanston, IL.
Saunders, M., Lewis, P. & Thornhill, A. (2007) Research methods for business students
4th edn, Prentice Hall, London.

366
Schepers, J. & Wetzels, M. (2007) "A meta analysis of the technology acceptance model: investigating subjective norm and moderation effects ", Information & Management,
vol. 44, no. 1, pp. 90-103.
Schindler, D.R. & Cooper, P.S. (2003) Business Research Methods, 8th edn, McGraw-Hill, New York, NY.
Schmidt, F.L. (1973) "Implications of a measurement problem for expectancy theory research", Organizational behavior and human performance, vol. 10, no. 2, pp. 243-251.
Schumacher, P. & Morahan-Martin, J. (2001) "Gender, Internet and computer attitudes and experiences", Computers in Human Behavior, vol. 17, no. 1, pp. 95-110.
Schwartz, S.H. (1994) "Are There Universal Aspects in the Structure and Contents of Human Values?", Journal of Social Issues, vol. 50, no. 4, pp. 19-45.
Sekaran, U. (2000) Research Methods For Business: A Skill-Building Approach, 3rd edn, John Wiley & Sons, Inc, New York, NY.
Seyal, A.H., Awais, M.M., Shamail, S. & Abbas, A. (2004) "Determinants of electronic commerce in Pakistan: a preliminary evidence from small and medium enterprises"", Electronic Markets, vol. 14, no. 4, pp. 372-87.
Seyal, A.H. & Rahman, M.N. (2003) "A preliminary investigation of electronic commerce adoption in small and medium enterprises in Brunei", Journal of Golobal Information
Technology Management, vol. 6, no. 2, pp. 6-26.
Shanks, G., Parr, A., Hu, B., Corbitt, B., Thanasankit, T. & Seddon, P. (2000) "Differences in critical success factors in ERP implementation in Australia and China a cultural analysis", European Conference on Information Systems, pp. 537.
Shapiro, S.S. & Wilk, M.B. (1965) "An analysis of variance test for normality (complete samples) ", Biometrika, vol. 52, no. 3 and 4, pp. 591-611.
Sheppard, B.H., Hartwick, J. & Warshaw, P.R. (1988) "The Theory of Reasoned Action: A Meta-Analysis of Past Research with Recommendations for Modifications and Future Research", Journal of Consumer Research, vol. 15, no. 3 (December), pp. 325-343.
Shih, Y. & Fang, K. (2004) "The use of a decomposed theory of planned behavior to study Internet banking in Taiwan", Internet Research, vol. 14, no. 3, pp. 213-223.
Shimp, T.A. & Kavas, A. (1984) "The Theory of Reasoned Action Applied to Coupon Usage", Journal of Consumer Research, vol. 11, no. 3, pp. 795-809.
Siehl, C. & Martin, J. (1990) "Organizational culture: A key to financial performance?" in Organizational climate and culture, ed. B. Schneider, Jossey-Bass, San Francisco.
Sonnenwald, D.H., Maglaughlin, K.L. & Whitton, M.C. (2001) "Using innovation diffusion theory to guide collaboration technology evaluation: work in progress", Enabling Technologies: Infrastructure for Collaborative Enterprises, 2001. WET ICE
2001. Proceedings. Tenth IEEE International Workshops on, pp. 114.

367
Spacey, R., Goulding, A. & Murray, I. (2004) "Exploring the attitudes of public library staff to the Internet using the TAM", Journal of Documentation, vol. 60, no. 5, pp. 550-564.
Sparks, P. (2000) "Subjective Expected Utility-Based Attitude-Behavior Models: The Utility of Self-Identity" in Attitudes, Behavior, and Social Context: The Role of
Norms and Group Membership, Applied Social Research, , eds. D.J. Terry & M.A. Hogg, Lawrence Erlbaum, Mahwah, NJ, pp. 31-46.
Sparks, P., Shepherd, R. & Frewer, L.J. (1995) "Assessing and Structuring Attitudes Toward the Use of Gene Technology in Food Production: The Role of Perceived Ethical Obligation", Basic & Applied Social Psychology, vol. 16, no. 3, pp. 267-285.
Spector, P.E. & Cooper, C.L. (2002) "The Pitfalls of Poor Psychometric Properties: A Rejoinder to Hofstede?s Reply to Us", Applied Psychology, vol. 51, no. 1, pp. 174-178.
Spector, P.E., Cooper, C.L. & Sparks, K. (2001) "An International Study of the Psychometric Properties of the Hofstede Values Survey Module 1994: A Comparison of Individual and Country/Province Level Results", Applied Psychology, vol. 50, no. 2, pp. 269-281.
Sproull, N.L. (1995) The handbook of research methods: A guide for practioners and
students in the social sciences. The Scarecrow Press, Inc., Metuchen, NJ:.
Srite, M. (2006) "Culture as an Explanation of Technology Acceptance Differences: An Empirical Investigation of Chinese and US Users", Australasian Journal of
Information Systems, vol. 14, no. 1.
Srite, M. & Karahanna, E. (2006) "The Role of Espoused National Cultural Values in Technology Acceptance", MIS Quarterly, vol. 30, no. 3, pp. 679-704.
Stevens, J. (1996) Applied multivariate statistics for the social sciences, Lawrence Erlbaum Publishers, Mahwah, NJ.
Stone, M. (1974) "Cross-validatory choice and assessment of statistical predictions", Journal of the Royal Statistical Society, vol. 36, pp. 111-147.
Straub, D. & Karahanna, E. (1998) "Knowledge worker communications and recipient availability: Toward a task closure explanation of media choice", Organization
Science, vol. 9, no. 5, pp. 160-175.
Straub, D., Keil, M. & Brenner, W. (1997) "Testing the technology acceptance model across cultures: A three country study", Information & Management, vol. 33, no. 1, pp. 1-11.
Straub, D.W. (1994) "The Effect of Culture on It Diffusion - E-Mail and Fax in Japan and the United-States", Information Systems Research, vol. 5, no. 1, pp. 23-47.
Straub, D., Loch, K., Evaristo, R., Karahanna, E. & Srite, M. (2002) "Toward a Theory-Based Measurement of Culture", Journal of Global Information Management, , pp. 13-23.
Subramanian, G.H. (1994) "A Replication of Perceived Usefulness and Perceived Ease of Use Measurement", Decision Sciences, vol. 25, no. 5-6, pp. 863-874.
368
Sun, H. & Zhang, P. (2006) "The role of moderating factors in user technology acceptance", International Journal of Human-Computer Studies, vol. 64, no. 2, pp. 53-78.
Szajna, B. (1996) "Empirical Evaluation of the Revised Technology Acceptance Model", Management Science, vol. 42, no. (1), pp. 85-92.
Szajna, B. (1994) "Software Evaluation and Choice: Predictive Validation of the Technology Acceptance Instrument", MIS Quarterly, vol. 17, no. 3, pp. 319-324.
Szajna, B. & Scamell, R.W. (1993) "The Effects of Information System User Expections on their Performance and Perceptions", MIS Quarterly, vol. 17, no. 4 (December), pp. 493-516.
Tabachnick, B.G. & Fidell, L.S. (2007) Using Multivariate Statistics, 5th edn, Allyn and Bacon, Boston.
Tan, N. & Teo, T.S.H. (1998) "Factors Influencing the Adoption of the Internet ", International Journal of Electronic Commerce, vol. 2, no. 3, pp. 5-18.
Tan, B.C.Y., Smith, H.J., Keil, M. & Montealegre, R. (2003) "Reporting bad news about software projects: impact of organizational climate and information asymmetry in an individualistic and a collectivistic culture", Engineering Management, IEEE
Transactions on, vol. 50, no. 1, pp. 64-77.
Tan, B.C.Y., Watson, R.T. & Wei, K.K. (1995) "National Culture and Group Support Systems - Filtering Communication to Dampen Power Differentials", European
Journal of Information Systems, vol. 4, no. 2, pp. 82-92.
Tan, B.C.Y., Wei, K., Watson, R.T., Clapper, D.L. & Mclean, E.R. (1998) "Computer-Mediated Communication and Majority Influence: Assessing the Impact in an Individualistic and a Collectivistic Culture", Management Science, vol. 44, no. 9, pp. 1263-1278.
Taylor, M.C. & Hall, J.A. (1982) "Psychological androgyny: Theories, methods and conclusions", Psychological Bulletin, vol. 92, pp. 347-366.
Taylor, S. & Todd, P. (1995c) "Decomposition and crossover effects in the theory of planned behavior: A study of consumer adoption intentions", International Journal of
Research in Marketing, vol. 12, no. 2, pp. 137-155.
Taylor, S. & Todd, P. (1995b) "Assessing IT usage: The role of prior experience.", MIS
Quarterly, vol. 19, no. 4, pp. 561.
Taylor, S. & Todd, P.A. (1995a) "Understanding Information Technology Usage: A Test of Competing Models", Information Systems Research, vol. 6, no. 2 (June), pp. 144-176.
Temme, D., Kreis, H. & Hildebrandt, L. (2010) "A comparison of current PLS path modeling software: features, ease-of-use, and performance" in Handbook of partial
least squares: concepts, methods and applications, eds. E.V. Vinzi, W.W. Chin, J. Henseler & H. Wang, springer handbooks comp.statistics, Heidelberg, pp. 737-755.
369
Tenenhaus, M., Esposito Vinzi, V.E., Chatelin, Y.M. & Lauro, C. (2005) "PLS path modeling ", Computational Statistics & Data Analysis, vol. 48, no. 1, pp. 159-205.
Teo, H.-., Tan, B.C.Y. & Wei, K.-. (1995) "Innovation Diffusion Theory as a Predictor of Adoption Intention for Financial EDI. ", International Conference on Information
Systems (ICIS) .
Teo Timothy (2010) "Examining the influence of subjective norm and facilitating conditions on the intention to use technology among pre-service teachers: a structural equation modeling of an extended technology acceptance model", Asia Pacific Educ.
Rev., vol. 11, no. 2, pp. 253-262.
Teo, T., Lee, C.B., Chai, C.S. & Wong, S.L. (2009) "Assessing the intention to use technology among pre-service teachers in Singapore and Malaysia: A multigroup invariance analysis of the Technology Acceptance Model (TAM)", Computers &
Education, vol. 53, no. 3, pp. 1000-1009.
Thompson, R.L., Higgins, C.A. & Howell, J.M. (1991) "Personal Computing: Toward a Conceptual Model of Utilization", MIS Quarterly, vol. 15, no. 1 (March), pp. 125-142.
Thompson, R.L., Higgins, C.A. & Howell, J.M. (1994) "Influence of Experience on Personal Computer Utilization: Testing a Conceptual Model", Journal of
Management Information Systems, vol. 11, no. 1, pp. 167-187.
Ticehurst, G.W. & Veal, A.J. (2000) Business research methods: a managerial approach,
Longman, French Forest, NSW.
Tornatzky, L.G. & Klein, K.J. (1982) "Innovation characteristics and innovation adoption-implementation: A meta-analysis of findings", IEEE Transactions on Engineering
Management, vol. EM-29, no. 1, pp. 28-45.
Trevino, L.K. & Webster, J. (1992) "Flow in computer-mediated communication: Electronic mail and voice mail evaluation and impacts", Communication Research,
vol. 19, no. 5, pp. 539-573.
Triandis, H.C. (1972) The analysis of subjective culture, John Wiley & Sons, New York.
Triandis, H.C. (1989) "The self and social behavior in differing cultural contexts", Psychological Review. 96(3), vol. 96, no. 3, pp. 506-520.
Triandis, H.C. (1993) "Collectivism and Individualism as Cultural Syndromes", Cross-
Cultural Research, vol. 27, no. 3-4, pp. 155-180.
Triandis, H.C. (1979) "Values, Attitudes, and Interpersonal behaviour", Nebraska
Symposium on Motivation: Beliefs, Attitude, and Values, , no. 195, pp. 259.
Triandis, H.C. (1971) Attitude and Attitude Change, John Wiley and Sons, New York.
Trompenaars, F. & Hampden-Turner, C. (1998) Riding the waves of culture, MacGraw-Hill, New York.
Van Raaij, E.M. & Schepers, J.J.L. (2008) "The acceptance and use of a virtual learning environment in China", Computers & Education, vol. 50, no. 3, pp. 838-852.

370
Veiga, O.F., Floyd, S. & Dechant, K. (2001) "Towards modelling the effects of national culture on IT implementation and acceptance", Journal of Information Technology,
vol. 16, no. 3, pp. 145-158.
Venkatesh, V., Morris, M.G., Ackerman, P. & and Sykes, T. (2004) "Individual Reaction to New Technologies in the Workplace: The Role of Gender as a Psychological Construct", Journal of Applied Social Psychology, vol. 34, no. 3, pp. 445-467.
Venkatesh, V. & Bala, H. (2008) "Technology Acceptance Model 3 and a Research Agenda on Interventions", Decision Sciences, vol. 39, no. 2, pp. 273-315.
Venkatesh, V. (2000) "Determinants of perceived ease of use: Integrating control, intrinsic motivation, and emotion into the technology acceptance model", Information Systems
Research, vol. 11, no. 4, pp. 342-365.
Venkatesh, V. & Morris, M.G. (2000) "Why don't men ever stop to ask for directions? Gender, social influence, and their role in technology acceptance and usage behavior", MIS Quarterly, vol. 24, no. 1, pp. 115-139.
Venkatesh, V. & Davis, F.D. (2000) A Theoretical Extension of the Technology
Acceptance Model: Four Longitudinal Field Studies.
Venkatesh, V. & Davis, F.D. (1996) "A Model of the Antecedents of Perceived Ease of Use: Development and Test", Decision Sciences, vol. 27, no. 3 (Summer), pp. 451-481.
Venkatesh, V., Davis, F.D. & Morris, M.G. (2007) "Dead Or Alive? The Development, Trajectory And Future Of Technology Adoption Research", Journal of the
Association for Information Systems, vol. 8, no. 4, pp. 268-286.
Venkatesh, V., Morris, M.G. & Ackerman, P.L. (2000) "A Longitudinal Field Investigation of Gender Differences in Individual Technology Adoption Decision-Making Processes", Organizational behavior and human decision processes, vol. 83, no. 1, pp. 33-60.
Venkatesh, V., Morris, M.G., Davis, G.B. & Davis, F.D. (2003) "user acceptance of information technology: toward a unified view.", MIS Quarterly, vol. 27, no. 3, pp. 425-478.
Verhoeven, J.C., Heerwegh, D. & De Wit, K. (2010) "Information and communication technologies in the life of university freshmen: An analysis of change", Computers &
Education, vol. 55, no. 1, pp. 53-66.
Viswanathan, M., Sudman, S. & Johnson, M. (2004) "Maximum versus meaningful discrimination in scale response:: Implications for validity of measurement of consumer perceptions about products", Journal of Business Research, vol. 57, no. 2, pp. 108-124.
Walsham, G. (1995) "The emergence of interpretivism in IS research", Information
Systems Research, vol. 6, no. 4, pp. 376-394.
Walsham, G. (2002) "cross-cultural software production and use: a structurational analysis.", MIS Quarterly, vol. 26, no. 4, pp. 359.
371
Wang, H.W. & Wang, S.H. (2010) "User acceptance of mobile Internet based on the Unified Theory of Acceptance and Use of Technology: Investigating the determinants and gender differences", An International Journal of Social Behavior &
Personality, vol. 33, no. 3, pp. 415-426.
Wang, Y.S., Wu, M.C. & Wang, H.Y. (2009) "Investigating the determinants and age and gender differences in the acceptance of mobile learning", British Journal of
Educational Technology, vol. 4, no. 1, pp. 92-118.
Warshaw, P.R. & Davis, F. (1985) "Disentangling behavioral intention and behavioral expectation", Journal of Experimental Social Psychology, vol. 21, pp. 213-228.
Watson, R.T., Ho, T.H. & Raman, K.S. (1994) "Culture: A fourth dimension of group support systems", Communications of the ACM, vol. 37, no. 10, pp. 45-55.
Weil, M. & Rosen, L. (1995) "The psychological impact of technology from a global perspective: A study of technological sophistication and technophobia in university students from twenty-three countries", Computers in human behavio, vol. 11, no. 1, pp. 95-133.
Weisinger, J.Y. & Trauth, E.M. (2003) "The importance of situating culture in cross-cultural IT management", Engineering Management, IEEE Transactions on, vol. 50, no. 1, pp. 26-30.
Weiss, A.M. & Heide, J.B. (1993) "The nature of organizational search in high technology markets", Journal of Marketing Research, vol. 30, pp. 220-233.
Werts, C.E., Linn, R.L. & Joreskog, K.G. (1974) "Intraclass reliability estimates: Testing structural assumptions", Educational and Psychological Measurement, 34(1), 25–33.,
vol. 34, no. 1, pp. 25-33.
Westland, J.C. & Clark, T. (2000) Global Electronic Commerce: Theory and Case Studies,
MIT Press Books, Boston, MA.
Whitley, B.E. (1997) "Gender differences in computer-related attitudes and behavior: A meta-analysis", Computers in Human Behavior, vol. 13, no. 1, pp. 1-22.
Wilkins, L., Swatman, P. & Holt, D. (2009) "Adding value to enterprisewide system integration: A new theoretical framework for assessing technology adoption outcomes", , pp. 53.
Wilson, J.S., Stocking, V.B. & Goldstein, D. (1994) "Gender differences in motivation for course selection: Academically talented students in an intensive summer program", Sex Roles, vol. 31, pp. 349-350.
Wold, H. (1982) "Soft modeling: the basic design and some extensions" in System under
indirect observation, eds. K.G. Joreskog & H. Wold, 2nd edn,North-Holland, Amsterdam, pp. 1-54.
World Bank (2009) World Bank national accounts data, and OECD National Accounts
data files. Available: http://datafinder.worldbank.org/gdp-current [2009, 12/30].
Wu, J. & Wang, S. (2005) "What drives mobile commerce?: An empirical evaluation of the revised technology acceptance model", Information & Management, vol. 42, no. 5, pp. 719-729.
372
Wu, J., Wang, S. & Lin, L. (2007) "Mobile computing acceptance factors in the healthcare industry: A structural equation model", International journal of medical informatics,
vol. 76, no. 1, pp. 66-77.
Yang, K. (2010) "The Effects of Technology Self-Efficacy and Innovativeness on Consumer Mobile Data Service Adoption between American and Korean Consumers", Journal of International Consumer Marketing, vol. 22, no. 2.
Yi, Y., Wu, Z. & Tung, L.L. (2005) "how individual differences influence technology usage behavior? Toward an integrated framework", The Journal of Computer
Information Systems, vol. 46, no. 2, pp. 52-63.
Yi, M.Y., Jackson, J.D., Park, J.S. & Probst, J.C. (2006) "Understanding information technology acceptance by individual professionals: Toward an integrative view", Information & Management, vol. 43, no. 3, pp. 350-363.
Yin, R.K. (1994) Case Study Research. Design and Method, 2nd edn, Sage, London.
Yoon, Y., Guimaraes, T. & and O'Neal, Q. (1995) "Exploring the Factors Associated with Expert Systems Success", MIS Quarterly, vol. 19, no. 1, pp. 83-106.
Zikmund, W.G. (2003) Business Research Methods, 7th edn, South-Western, Ohio.

373
Appendix-A
Univariate Statistics (item-level)
N Mean
Std.
Deviation
Missing No. of Extremes(a)
High
Count
% Percent Low
V1 380 5.29 1.531 0 0.0 0 0
V2 379 3.98 2.167 1 0.3 0 0
V3 380 2.41 1.726 0 0.0 0 37
V4 380 3.18 1.887 0 0.0 0 0
PU1 380 6.29 0.813 0 0.0 9 0
PU2 380 6.28 0.774 0 0.0 6 0
PU3 380 6.20 0.830 0 0.0 5 0
PU4 379 6.15 0.774 1 0.3 5 0
PU5 379 5.79 1.019 1 0.3 3 0
PEOU1 380 5.87 0.971 0 0.0 2 0
PEOU2 380 5.81 1.109 0 0.0 4 0
PEOU3 380 6.00 0.894 0 0.0 0 0
PEOU4 378 5.93 0.970 2 0.5 0 0
PI1 380 5.98 0.937 0 0.0 3 0
PI2 380 5.69 1.069 0 0.0 1 0
PI3 379 5.50 1.156 1 0.3 20 0
PI4 380 5.27 1.185 0 0.0 34 0
SI1 380 6.00 0.989 0 0.0 29 0
SI2 380 6.15 0.896 0 0.0 20 0
SE1 380 6.30 0.871 0 0.0 8 0
SE2 380 6.23 0.881 0 0.0 13 0
SE3 380 5.56 1.327 0 0.0 18 0
SE4 379 4.60 1.573 1 0.3 18 0
SE5 380 3.81 1.837 0 0.0 0 0
SE6 378 5.37 1.313 2 0.5 35 0
TF1 380 5.69 1.280 0 0.0 17 0
TF2 379 5.25 1.598 1 0.3 60 0
TF3 377 5.71 1.223 3 0.8 9 0
TF4 379 5.39 1.343 1 0.3 32 0
RF1 379 6.46 0.909 1 0.3 11 0
RF2 379 5.65 1.566 1 0.3 26 0
RF3 380 4.67 1.825 0 0.0 0 0
RF4 380 4.88 1.825 0 0.0 0 0
RF5 378 5.87 1.220 2 0.5 9 0
AT1 377 6.07 1.040 3 0.8 25 0
AT2 379 6.19 0.855 1 0.3 6 0
AT3 377 5.30 1.640 3 0.8 0 0
AT4 379 6.41 0.838 1 0.3 7 0
AT5 380 6.47 0.888 0 0.0 8 0
AT6 378 6.44 0.783 2 0.5 6 0
NAT1 379 5.68 1.369 1 0.3 17 0
NTA2 380 5.56 1.579 0 0.0 33 0
NTA3 380 5.26 1.650 0 0.0 31 0
NTA4 380 5.32 1.573 0 0.0 28 0
BI1 378 5.95 0.941 2 0.5 1 0
BI2 378 5.31 1.402 2 0.5 33 0

374
BI3 378 5.13 1.528 2 0.5 13 0
BI4 380 6.09 0.862 0 0.0 14 0
BU1 380 6.14 1.079 0 0.0 25 0
BU2 380 5.17 1.795 0 0.0 61 0
BU3 377 5.25 1.784 3 0.8 39 0
BU4 379 6.18 1.144 1 0.3 26 0
PD1 378 2.29 1.543 2 0.5 0 23
PD3 380 3.28 1.892 0 0.0 0 0
PD4 379 3.80 1.835 1 0.3 0 0
PD5 377 2.97 1.640 3 0.8 0 11
PD6 378 2.55 1.528 2 0.5 0 24
IC1 378 5.80 1.356 2 0.5 15 0
PD2 380 3.03 1.765 0 0.0 0 16
IC2 380 5.79 1.317 0 0.0 13 0
IC3 379 5.80 1.217 1 0.3 5 0
IC4 379 5.06 1.570 1 0.3 18 0
IC5 380 5.00 1.660 0 0.0 8 0
IC6 380 5.01 1.580 0 0.0 5 0
UA1 380 6.38 0.772 0 0.0 11 0
UA2 380 6.24 0.818 0 0.0 12 0
UA3 380 6.50 0.583 0 0.0 1 0
UA4 380 6.15 1.135 0 0.0 24 0
MF1 378 3.96 2.021 2 0.5 0 0
MF2 377 3.11 1.954 3 0.8 0 0
MF3 379 3.15 1.853 1 0.3 0 0
MF4 380 2.90 1.929 0 0.0 0 0
MF5 380 2.63 1.943 0 0.0 0 0
GS1 377 5.63 1.129 3 0.8 16 0
GS2 378 5.66 1.029 2 0.5 9 0
GS3 376 5.41 1.147 4 1.1 18 0
GS4 377 5.47 1.165 3 0.8 19 0
GS5 378 5.69 1.194 2 0.5 4 0
TS1 380 6.06 0.973 0 0.0 23 0
TS2 378 6.01 0.952 2 0.5 16 0
TS3 380 5.98 0.944 0 0.0 1 0
TS4 380 5.92 1.028 0 0.0 5 0
TS5 380 6.21 0.876 0 0.0 15 0
a. Number of cases outside the range (Q1 - 1.5*IQR, Q3 + 1.5*IQR).
Little's MCAR test: Chi-Square = 3301.523, DF = 2178, Sig. = .230
Table A. 1: Missing data examination at item-level

375
Univariate Statistics
N Mean
Std.
Deviation
Missing
No. of
Extremes(a)
High Count Percent Low
M_VOL 379 3.1856 1.51240 1 0.3 0 0
M_PU 378 6.1476 0.66237 2 0.5 0 0
M_PEOU 378 5.9061 0.78980 2 0.5 0 0
M_SN 379 5.7647 0.72384 1 0.3 1 0
M_SE 377 4.5871 1.21390 3 0.8 3 0
M_TF 375 5.5093 1.04762 5 1.3 13 0
M_RF 377 5.5034 0.98759 3 0.8 0 0
M_AT 374 6.1448 0.64582 6 1.6 4 0
M_NAT 380 5.4276 1.21475 0 0.0 10 0
M_BI 378 5.6210 0.89190 2 0.5 0 0
M_BU 377 5.6857 1.08897 3 0.8 6 0
M_PD 375 2.9756 1.05377 5 1.3 0 2
M_IC 376 5.4189 0.95110 4 1.1 0 0
M_UA 380 6.3191 0.58988 0 0.0 7 0
M_MF 374 3.1214 1.65603 6 1.6 0 0
M_GS 374 5.5743 0.92309 6 1.6 5 0
M_TS 378 6.0397 0.76447 2 0.5 9 0
a. Number of cases outside the range (Q1 - 1.5*IQR, Q3 + 1.5*IQR).
Little's MCAR test: Chi-Square = 504.540, DF = 289, Sig. = .210
Table A. 2: Missing data examination at Construct-level

376
Observed Value
86420
Exp
ected
No
rm
al
Valu
e
8
6
4
2
0
Normal Q-Q Plot of vol
Observed Value
876543
Exp
ected
No
rm
al
Valu
e
7
6
5
4
Normal Q-Q Plot of PU
Observed Value
7654
Exp
ected
No
rm
al
Valu
e
7
6
5
4
Normal Q-Q Plot of PEOU
Observed Value
7654
Exp
ected
No
rm
al
Valu
e
7
6
5
4
Normal Q-Q Plot of SN
Observed Value
8642
Exp
ecte
d N
orm
al
Valu
e
8
7
6
5
4
3
2
1
Normal Q-Q Plot of SE
Observed Value
8642
Exp
ecte
d N
orm
al
Valu
e
8
7
6
5
4
3
2
Normal Q-Q Plot of TF
Observed Value
876543
Exp
ecte
d N
orm
al
Valu
e
8
7
6
5
4
3
Normal Q-Q Plot of RF
Observed Value
87654
Exp
ecte
d N
orm
al
Valu
e
7
6
5
4
Normal Q-Q Plot of AT
Observed Value
8642
Exp
ecte
d N
orm
al
Valu
e
8
7
6
5
4
3
2
Normal Q-Q Plot of NAT
Observed Value
87654
Exp
ecte
d N
orm
al
Valu
e
8
7
6
5
4
Normal Q-Q Plot of BI
Observed Value
8765432
Exp
ecte
d N
orm
al
Valu
e
8
7
6
5
4
3
Normal Q-Q Plot of BU
Observed Value
7654
Exp
ecte
d N
orm
al
Valu
e
7
6
5
4
Normal Q-Q Plot of GS

377
Figure A. 1: Normal probability Q-Q plot
Observed Value
87654E
xp
ecte
d N
orm
al
Valu
e
7
6
5
4
Normal Q-Q Plot of TS
Observed Value
6420
Exp
ecte
d N
orm
al
Valu
e
6
4
2
0
Normal Q-Q Plot of PD
Observed Value
8765432
Exp
ecte
d N
orm
al
Valu
e
8
7
6
5
4
3
2
Normal Q-Q Plot of IC
Observed Value
7.06.56.05.55.04.5
Exp
ecte
d N
orm
al
Valu
e
7.0
6.5
6.0
5.5
5.0
4.5
Normal Q-Q Plot of UA
Observed Value
86420
Exp
ecte
d N
orm
al
Valu
e
8
6
4
2
0
Normal Q-Q Plot of MF

378
Assessment of normality (Group number 1)
Variable min max skew c.r. kurtosis c.r.
PEOU3_1 3 7 -0.601 -4.78 -0.075 -0.3
TS1_1 3 7 -0.772 -6.148 0.293 1.166
TS2_1 3 7 -0.528 -4.2 -0.251 -1
TS4_1 2 7 -0.922 -7.336 1.289 5.129
TS5_1 3 7 -0.83 -6.604 0.052 0.208
PU5_1 2 7 -0.774 -6.157 0.664 2.64
PU4_1 3 7 -0.67 -5.329 0.146 0.58
PU3_1 3 7 -0.622 -4.954 -0.404 -1.609
PU2_1 3 7 -0.781 -6.215 0.106 0.423
PU1_1 3 7 -0.92 -7.323 0.308 1.224
BI4_1 4 7 -0.564 -4.487 -0.505 -2.008
BI3_1 1 7 -1.234 -9.819 2.059 8.192
BI2_1 3 7 -0.462 -3.674 -0.548 -2.179
BI1_1 3 7 -0.666 -5.299 0.076 0.301
GS1_1 3 7 -0.539 -4.292 -0.175 -0.697
GS2_1 3 7 -0.295 -2.35 -0.415 -1.65
GS3_1 3 7 -0.413 -3.291 -0.407 -1.621
GS4_1 3 7 -0.467 -3.715 -0.409 -1.627
AT2_1 3 7 -0.712 -5.668 0.206 0.819
TF4_1 1 7 -0.968 -7.705 1.135 4.517
TF3_1 1 7 -0.994 -7.908 1.105 4.396
TF2_1 2 7 -1.017 -8.091 0.867 3.449
TF1_1 2 7 -0.983 -7.824 0.963 3.831
RF5_1 1 7 -1.142 -9.085 0.606 2.411
RF4_1 1 7 -1.171 -9.32 0.585 2.326
RF3_1 1 7 -0.976 -7.771 0.009 0.034
NAT1_1 1 7 -1.204 -9.585 1.487 5.916
NTA2_1 1 7 -1.209 -9.622 1.184 4.713
NTA4_1 1 7 -0.953 -7.588 0.506 2.015
AT6_1 3 7 -0.565 -4.5 -0.257 -1.024
AT5_1 2 7 -0.762 -6.062 0.623 2.48
SI1_1 2 7 -0.81 -6.446 0.33 1.313
PI2_1 3 7 -0.535 -4.26 -0.374 -1.49
PI1_1 2 7 -0.928 -7.384 1.172 4.663
PEOU1_1 3 7 -0.385 -3.064 -0.625 -2.489
PEOU2_1 3 7 -0.343 -2.728 -0.586 -2.332
BU3_1 1 7 -1.315 -10.468 1.7 6.765
BU2_1 2 7 -1.028 -8.18 0.664 2.641
BU1_1 1 7 -1.144 -9.108 1.291 5.139
Multivariate 228.527 39.388
Table A. 3: Assessment of normality
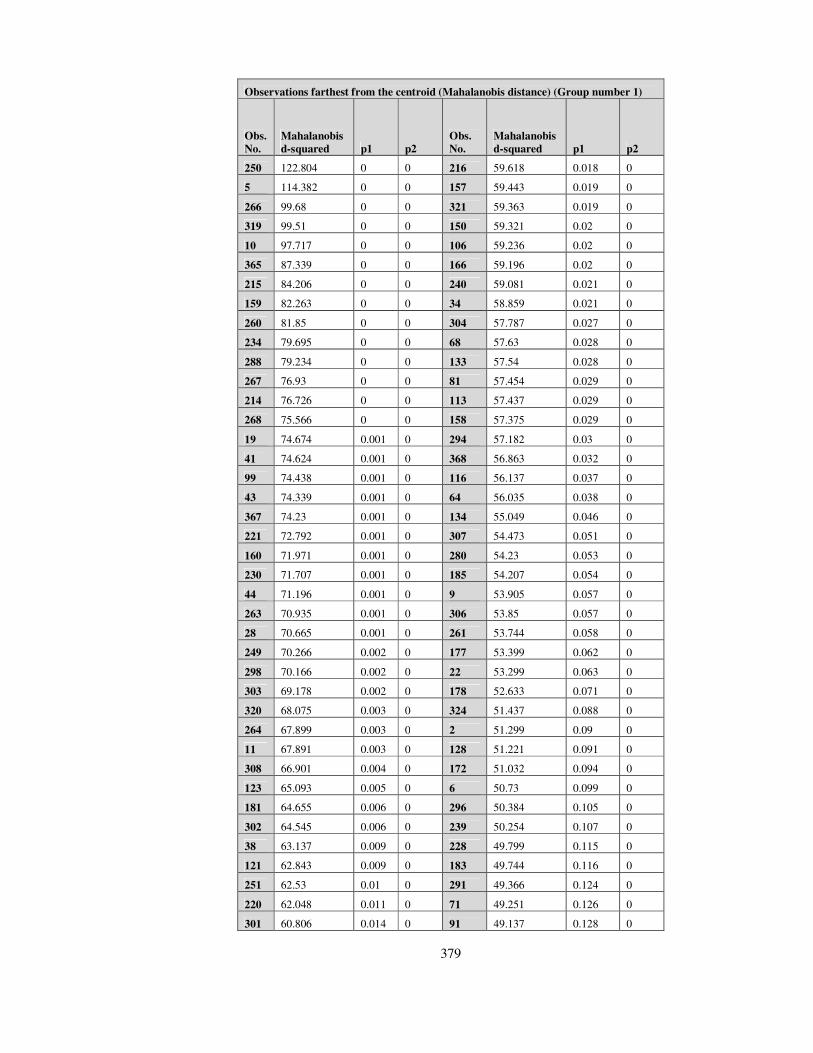
379
Observations farthest from the centroid (Mahalanobis distance) (Group number 1)
Obs.
No.
Mahalanobis
d-squared p1 p2
Obs.
No.
Mahalanobis
d-squared p1 p2
250 122.804 0 0 216 59.618 0.018 0
5 114.382 0 0 157 59.443 0.019 0
266 99.68 0 0 321 59.363 0.019 0
319 99.51 0 0 150 59.321 0.02 0
10 97.717 0 0 106 59.236 0.02 0
365 87.339 0 0 166 59.196 0.02 0
215 84.206 0 0 240 59.081 0.021 0
159 82.263 0 0 34 58.859 0.021 0
260 81.85 0 0 304 57.787 0.027 0
234 79.695 0 0 68 57.63 0.028 0
288 79.234 0 0 133 57.54 0.028 0
267 76.93 0 0 81 57.454 0.029 0
214 76.726 0 0 113 57.437 0.029 0
268 75.566 0 0 158 57.375 0.029 0
19 74.674 0.001 0 294 57.182 0.03 0
41 74.624 0.001 0 368 56.863 0.032 0
99 74.438 0.001 0 116 56.137 0.037 0
43 74.339 0.001 0 64 56.035 0.038 0
367 74.23 0.001 0 134 55.049 0.046 0
221 72.792 0.001 0 307 54.473 0.051 0
160 71.971 0.001 0 280 54.23 0.053 0
230 71.707 0.001 0 185 54.207 0.054 0
44 71.196 0.001 0 9 53.905 0.057 0
263 70.935 0.001 0 306 53.85 0.057 0
28 70.665 0.001 0 261 53.744 0.058 0
249 70.266 0.002 0 177 53.399 0.062 0
298 70.166 0.002 0 22 53.299 0.063 0
303 69.178 0.002 0 178 52.633 0.071 0
320 68.075 0.003 0 324 51.437 0.088 0
264 67.899 0.003 0 2 51.299 0.09 0
11 67.891 0.003 0 128 51.221 0.091 0
308 66.901 0.004 0 172 51.032 0.094 0
123 65.093 0.005 0 6 50.73 0.099 0
181 64.655 0.006 0 296 50.384 0.105 0
302 64.545 0.006 0 239 50.254 0.107 0
38 63.137 0.009 0 228 49.799 0.115 0
121 62.843 0.009 0 183 49.744 0.116 0
251 62.53 0.01 0 291 49.366 0.124 0
220 62.048 0.011 0 71 49.251 0.126 0
301 60.806 0.014 0 91 49.137 0.128 0
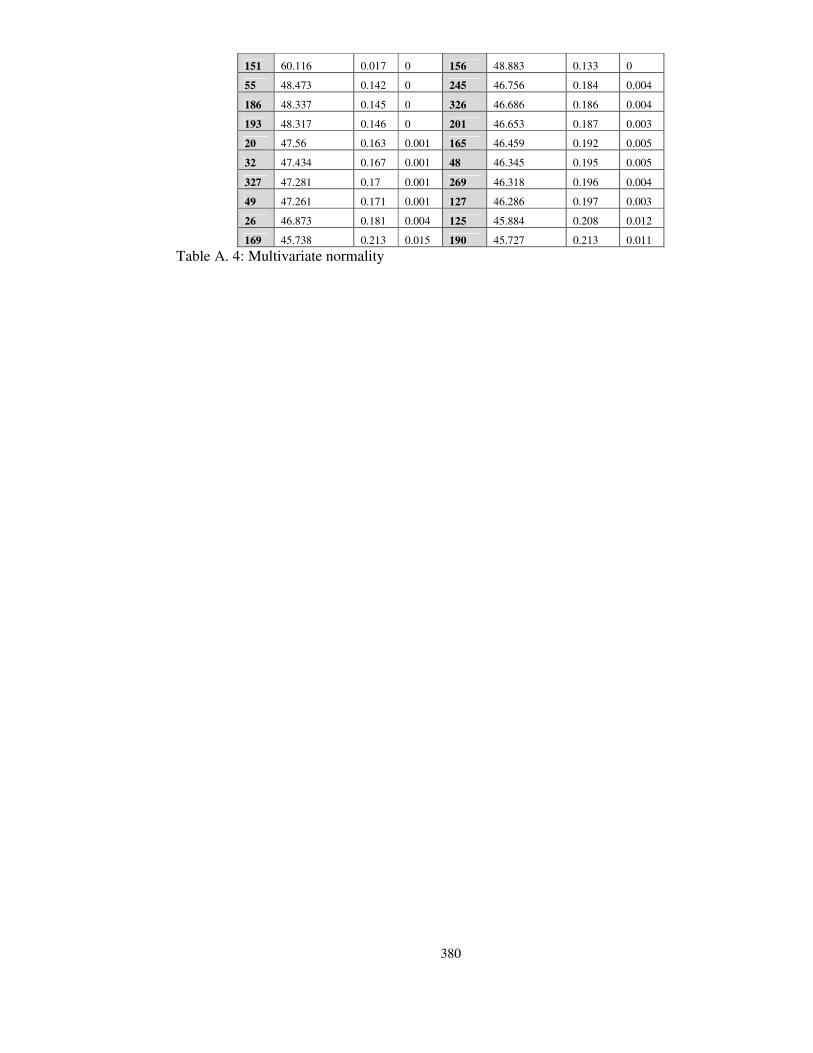
380
151 60.116 0.017 0 156 48.883 0.133 0
55 48.473 0.142 0 245 46.756 0.184 0.004
186 48.337 0.145 0 326 46.686 0.186 0.004
193 48.317 0.146 0 201 46.653 0.187 0.003
20 47.56 0.163 0.001 165 46.459 0.192 0.005
32 47.434 0.167 0.001 48 46.345 0.195 0.005
327 47.281 0.17 0.001 269 46.318 0.196 0.004
49 47.261 0.171 0.001 127 46.286 0.197 0.003
26 46.873 0.181 0.004 125 45.884 0.208 0.012
169 45.738 0.213 0.015 190 45.727 0.213 0.011
Table A. 4: Multivariate normality

381
S.No. Name of University Sector
(Public/Private) Province
Questionnaire
Distributed
Questionnaire
Returned
Response
Rate(%)
1 University of Sindh Jamshoro Public Sindh 180 59 32.78
2 Quaid-e-Awam University of Engineering Science and Technology, Nawabshah Public Sindh 55 22 40.00
3 Sukkur Institute of Business Administration Public Sindh 40 34 85.00
4 Mehran University of Engineering and Technology Public Sindh 40 33 82.50
5 University of Karachi Public Sindh 35 18 51.43
6 NED University of Engineering and Technology Public Sindh 35 17 48.57
7 Sindh Agriculture University, Tandojam Public Sindh 50 27 54.00
8 Shah Abdul Latif University Public Sindh 45 21 46.67
9 University of Sindh, Lar College, Badin Public Sindh 25 10 40.00
10 Liaqat University of Medical and Health Sciences Public Sindh 25 20 80.00
11 Hamdard University Karachi Private Sindh 40 34 85.00
12 Shaheed Zulifiqar Ali Bhutto Institute of Science and Technology (SZABIST) Private Sindh 20 15 75.00
13 Preston University Karachi Private Sindh 30 13 43.33
14 Sir Syed University of Engg. & Technology Private Sindh 30 11 36.67
15 KASB Institute of Technology Karachi Private Sindh 35 22 62.86
16 Isra University, Hyderabad Private Sindh 35 27 77.14
17 University of Peshawar Public NWFP 15 12 80.00
18 NWFP University of Engineering and Technology, Peshawar Public NWFP 5 5 100.00
19 Ghulam Ishaque Khand Institute of Engineering and Technology Private NWFP 50 36 72.00
20 Lahore University of Management Sciences Private Punjab 20 12 60.00
21 Institute of Management Sciences Private Punjab 20 10 50.00
22 University of Punjab Public Punjab 30 12 40.00

382
23 National College of Arts Public Punjab 45 24 53.33
24 Iqra University, Quetta Private Baluchistan 15 5 33.33
25 Baluchistan University of Information Technology and Management Sciences Public Baluchistan 15 5 33.33
Total 935 504 53.90
Table A. 5: Details of questionnaires distributed and response rate

383
Construct Item Question Mean Std.
Deviation
Corrected
Item-Total
Correlatio
n
Voluntariness
Items= 3 VOL2 My use of the Internet is voluntary 3.98 2.16 0.48
Cronbach's Alpha ( 0.68)
VOL3 My chair does not require me to us the Internet 2.41 1.73 0.53
Inter-Item Correlations 0.45-0.39
VOL4 Although it might be helpful, using Internet is certainly not compulsory in my job
3.18 1.89 0.49
Perceived Usefulness
Items= 5 PU1
Using Internet enables me to accomplish my teaching and research activities more quickly
6.28 0.81 0.56
Cronbach's Alpha (0.78)
PU2 Using Internet improves the quality of my teaching and research job
6.21 0.83 0.57
Inter-Item Correlations 0.56-0.29
PU3 Using Internet makes teaching and research activities easier to me
6.20 0.81 0.65
PU4 Using Internet enhance my teaching and research effectiveness
6.13 0.82 0.55
PU5 Using Internet gives me greater control over my teaching and research job
5.91 0.97 0.48
Perceived Ease of Use
Items= 4 PEOU1
Usage of Internet to support my teaching and research is clear and understandable
5.93 .896 .727
Cronbach's Alpha ( 0.84)
PEOU2
When using Internet to support my teaching and research, I found it easy to get material that I use to do what I want them to do
5.90 .902 .783
Inter-Item Correlations 0.82-0.473
PEOU3 Overall, I believe that it is easy to use the Internet to support my teaching and research skills
6.02 .896 .608
PEOU4 Learning Internet use to support my teaching and research skills is easy for me
5.94 .882 .595
Peer Influence
Items= 4
PI1
My academic colleagues think that using the Internet is valuable for teaching and research
5.96 .957 .466
Cronbach's Alpha ( 0.69)
PI2 The opinion of my academic colleagues is important to me
5.76 1.028 .452
Inter-Item Correlations 0.28-0.45
PI3 People in non-academic groups (e.g., friends and family) think that using Internet is valuable for me
5.73 1.140 .497
PI4 The opinion of non-academic groups (e.g., friends and family) is important to me
5.59 1.137 .526
Social Influence
Items=2 SI1
My departmental and organizational chair thinks that using Internet is valuable for teaching and research activities
5.94 1.02 0.42
Cronbach's Alpha (0.59) Inter-Item Correlations 0.22-0.13
SI2 The opinion of my departmental and organizational chair is important to me
6.08 0.92 0.42
Self Efficacy
Items=6 SE1 I would feel comfortable using the Internet on my own 6.29 0.84 0.24
Cronbach's Alpha (0.49)
SE2 For me, feeling comfortable using the Internet on my own is important
6.23 0.83 0.29
Inter-Item Correlations 0.79-0.13
SE3 I could complete my job using the Internet if there is no one around to tell me what to do as I go
5.59 1.33 0.06
SE4 I could complete my job using the Internet if I had help-facility for assistant
4.55 1.60 0.40
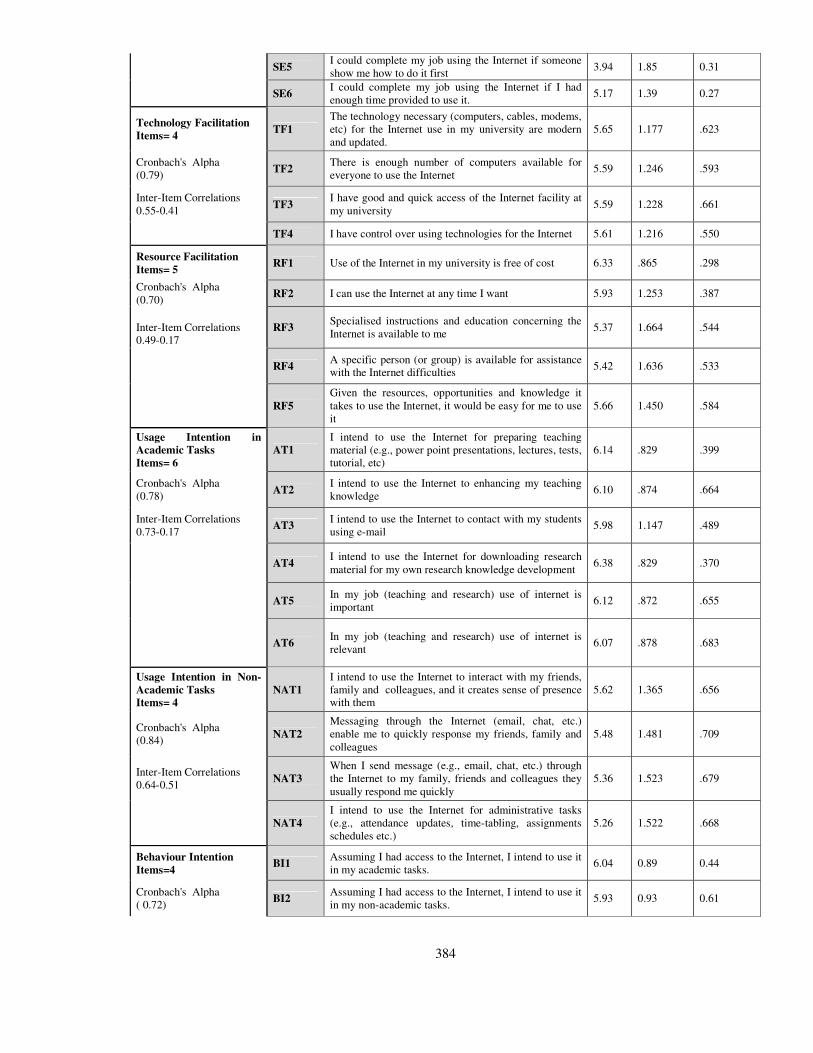
384
SE5 I could complete my job using the Internet if someone show me how to do it first
3.94 1.85 0.31
SE6 I could complete my job using the Internet if I had enough time provided to use it.
5.17 1.39 0.27
Technology Facilitation
Items= 4 TF1
The technology necessary (computers, cables, modems, etc) for the Internet use in my university are modern and updated.
5.65 1.177 .623
Cronbach's Alpha (0.79)
TF2 There is enough number of computers available for everyone to use the Internet
5.59 1.246 .593
Inter-Item Correlations 0.55-0.41
TF3 I have good and quick access of the Internet facility at my university
5.59 1.228 .661
TF4 I have control over using technologies for the Internet 5.61 1.216 .550
Resource Facilitation
Items= 5 RF1 Use of the Internet in my university is free of cost 6.33 .865 .298
Cronbach's Alpha (0.70)
RF2 I can use the Internet at any time I want 5.93 1.253 .387
Inter-Item Correlations 0.49-0.17
RF3 Specialised instructions and education concerning the Internet is available to me
5.37 1.664 .544
RF4 A specific person (or group) is available for assistance with the Internet difficulties
5.42 1.636 .533
RF5
Given the resources, opportunities and knowledge it takes to use the Internet, it would be easy for me to use it
5.66 1.450 .584
Usage Intention in
Academic Tasks
Items= 6
AT1
I intend to use the Internet for preparing teaching material (e.g., power point presentations, lectures, tests, tutorial, etc)
6.14 .829 .399
Cronbach's Alpha (0.78)
AT2 I intend to use the Internet to enhancing my teaching knowledge
6.10 .874 .664
Inter-Item Correlations 0.73-0.17
AT3 I intend to use the Internet to contact with my students using e-mail
5.98 1.147 .489
AT4 I intend to use the Internet for downloading research material for my own research knowledge development
6.38 .829 .370
AT5 In my job (teaching and research) use of internet is important
6.12 .872 .655
AT6 In my job (teaching and research) use of internet is relevant
6.07 .878 .683
Usage Intention in Non-
Academic Tasks
Items= 4
NAT1
I intend to use the Internet to interact with my friends, family and colleagues, and it creates sense of presence with them
5.62 1.365 .656
Cronbach's Alpha (0.84)
NAT2
Messaging through the Internet (email, chat, etc.) enable me to quickly response my friends, family and colleagues
5.48 1.481 .709
Inter-Item Correlations 0.64-0.51
NAT3
When I send message (e.g., email, chat, etc.) through the Internet to my family, friends and colleagues they usually respond me quickly
5.36 1.523 .679
NAT4
I intend to use the Internet for administrative tasks (e.g., attendance updates, time-tabling, assignments schedules etc.)
5.26 1.522 .668
Behaviour Intention
Items=4 BI1
Assuming I had access to the Internet, I intend to use it in my academic tasks.
6.04 0.89 0.44
Cronbach's Alpha ( 0.72)
BI2 Assuming I had access to the Internet, I intend to use it in my non-academic tasks.
5.93 0.93 0.61
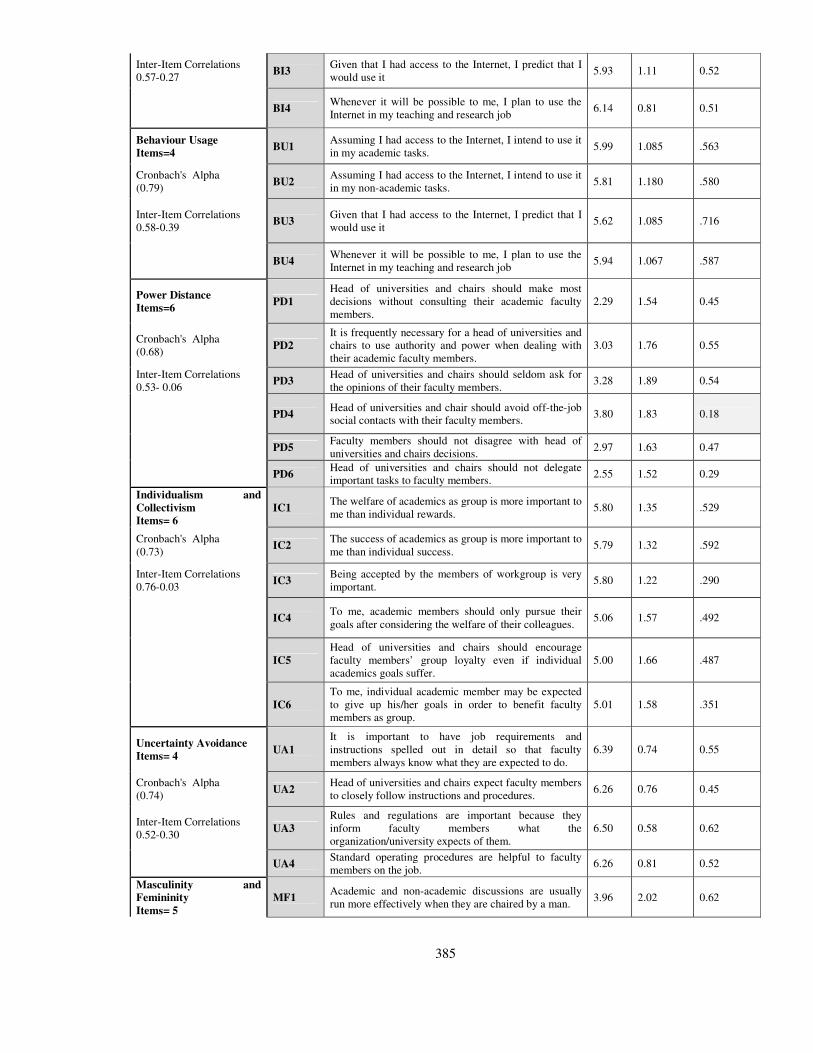
385
Inter-Item Correlations 0.57-0.27
BI3 Given that I had access to the Internet, I predict that I would use it
5.93 1.11 0.52
BI4 Whenever it will be possible to me, I plan to use the Internet in my teaching and research job
6.14 0.81 0.51
Behaviour Usage
Items=4 BU1
Assuming I had access to the Internet, I intend to use it in my academic tasks.
5.99 1.085 .563
Cronbach's Alpha (0.79)
BU2 Assuming I had access to the Internet, I intend to use it in my non-academic tasks.
5.81 1.180 .580
Inter-Item Correlations 0.58-0.39
BU3 Given that I had access to the Internet, I predict that I would use it
5.62 1.085 .716
BU4 Whenever it will be possible to me, I plan to use the Internet in my teaching and research job
5.94 1.067 .587
Power Distance
Items=6 PD1
Head of universities and chairs should make most decisions without consulting their academic faculty members.
2.29 1.54 0.45
Cronbach's Alpha (0.68)
PD2
It is frequently necessary for a head of universities and chairs to use authority and power when dealing with their academic faculty members.
3.03 1.76 0.55
Inter-Item Correlations 0.53- 0.06
PD3 Head of universities and chairs should seldom ask for the opinions of their faculty members.
3.28 1.89 0.54
PD4 Head of universities and chair should avoid off-the-job social contacts with their faculty members.
3.80 1.83 0.18
PD5 Faculty members should not disagree with head of universities and chairs decisions.
2.97 1.63 0.47
PD6 Head of universities and chairs should not delegate important tasks to faculty members.
2.55 1.52 0.29
Individualism and
Collectivism
Items= 6
IC1 The welfare of academics as group is more important to me than individual rewards.
5.80 1.35 .529
Cronbach's Alpha (0.73)
IC2 The success of academics as group is more important to me than individual success.
5.79 1.32 .592
Inter-Item Correlations 0.76-0.03
IC3 Being accepted by the members of workgroup is very important.
5.80 1.22 .290
IC4 To me, academic members should only pursue their goals after considering the welfare of their colleagues.
5.06 1.57 .492
IC5
Head of universities and chairs should encourage faculty members’ group loyalty even if individual academics goals suffer.
5.00 1.66 .487
IC6
To me, individual academic member may be expected to give up his/her goals in order to benefit faculty members as group.
5.01 1.58 .351
Uncertainty Avoidance
Items= 4 UA1
It is important to have job requirements and instructions spelled out in detail so that faculty members always know what they are expected to do.
6.39 0.74 0.55
Cronbach's Alpha (0.74)
UA2 Head of universities and chairs expect faculty members to closely follow instructions and procedures.
6.26 0.76 0.45
Inter-Item Correlations 0.52-0.30
UA3
Rules and regulations are important because they inform faculty members what the organization/university expects of them.
6.50 0.58 0.62
UA4 Standard operating procedures are helpful to faculty members on the job.
6.26 0.81 0.52
Masculinity and
Femininity
Items= 5
MF1 Academic and non-academic discussions are usually run more effectively when they are chaired by a man.
3.96 2.02 0.62

386
Cronbach's Alpha (0.91)
MF2
It is more important for men to have a professional career than it is for women to have a professional career.
3.11 1.95 0.80
Inter-Item Correlations 0.80-0.52
MF3 Men usually solve problems with logical analysis; women usually solve problems with intuition.
3.15 1.85 0.82
MF4
Solving organizational/departmental problems usually requires an active forcible approach which is typical of men.
2.90 1.93 0.83
MF5 It is preferable to have a man in a high level position rather than a woman.
2.63 1.94 .775
Government Support
Items= 5 GS1
The government is committed to a vision of using the Internet in universities
5.75 0.99 0.52
Cronbach's Alpha (0.76)
GS2 The government is committed to support academics efforts in using the Internet for teaching and research
5.73 0.98 0.54
Inter-Item Correlations 0.52-0.21
GS3 The government strongly encourages the use of the Internet for teaching and research purpose
5.70 1.01 0.58
GS4 The government will recognize academics efforts in using the Internet for teaching and research purpose
5.78 1.01 0.56
GS5 The use of the Internet for teaching and research purpose is important for government.
5.85 1.08 .451
Local level Support
Items= 5 TS1
My University and department are committed to a vision of using the internet in teaching and research tasks
6.11 0.85 0.61
Cronbach's Alpha (0.77)
TS2
My University and department are committed to support academics efforts in using the Internet for teaching and research purpose
6.14 0.79 0.57
Inter-Item Correlations 0.45-0.33
TS3 My University and department strongly encourages the use of the Internet for teaching and research purpose
6.05 0.90 0.56
TS4
My University and department will recognize academics efforts in using the Internet for teaching and research purpose
6.06 0.91 0.49
TS5 The use of the Internet for teaching and research purpose is important for my University and department.
6.20 0.85 0.51
Table A. 6: Reliability and Validity of the survey questionnaire

387
Figure A. 2: PLS based Path diagram

388
Figure A. 3: PLS based t-values
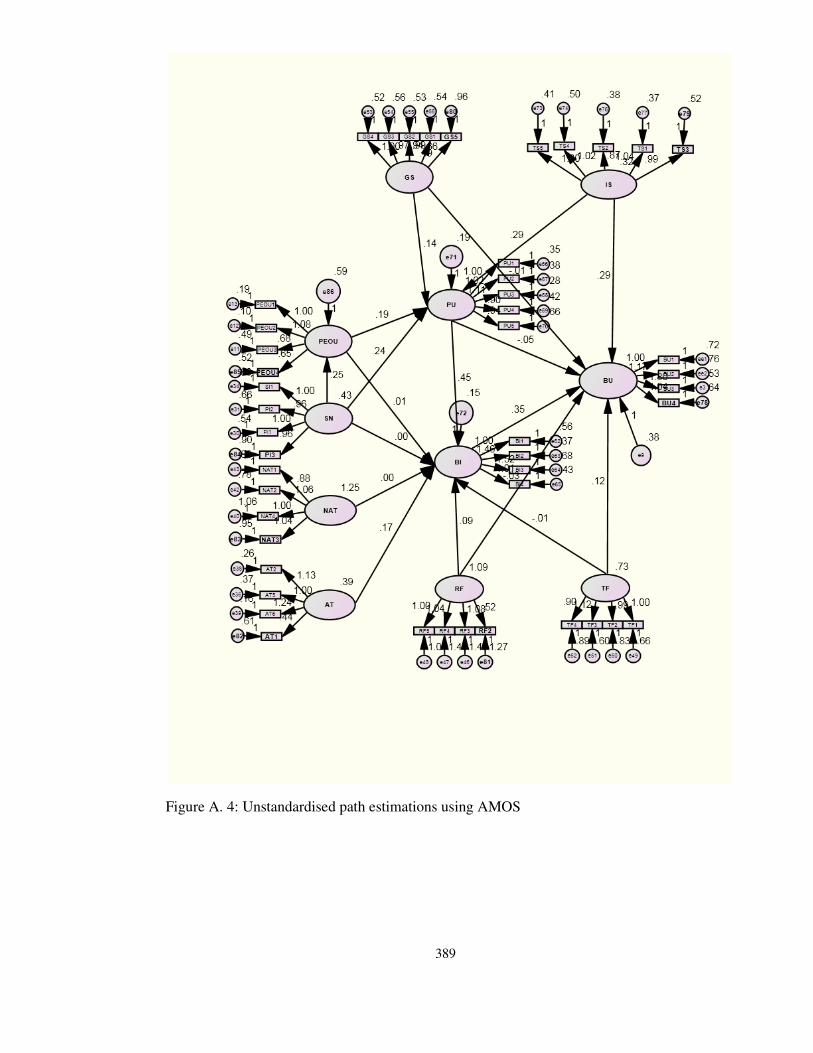
389
Figure A. 4: Unstandardised path estimations using AMOS
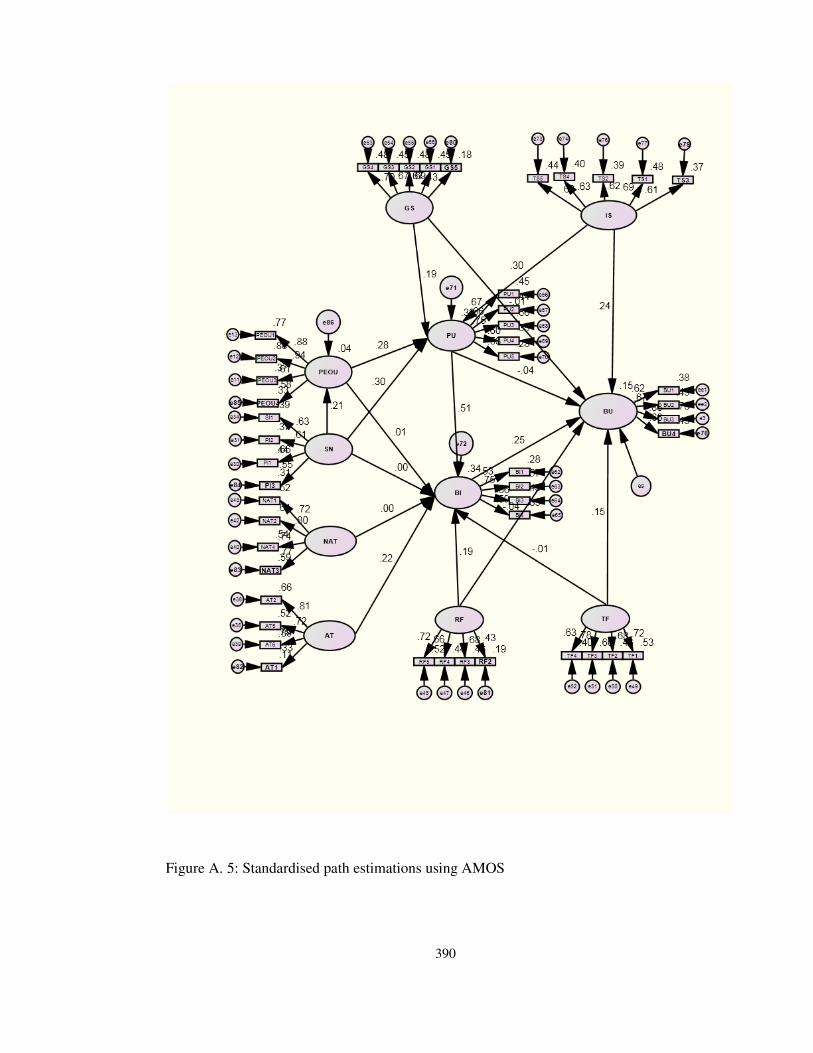
390
Figure A. 5: Standardised path estimations using AMOS
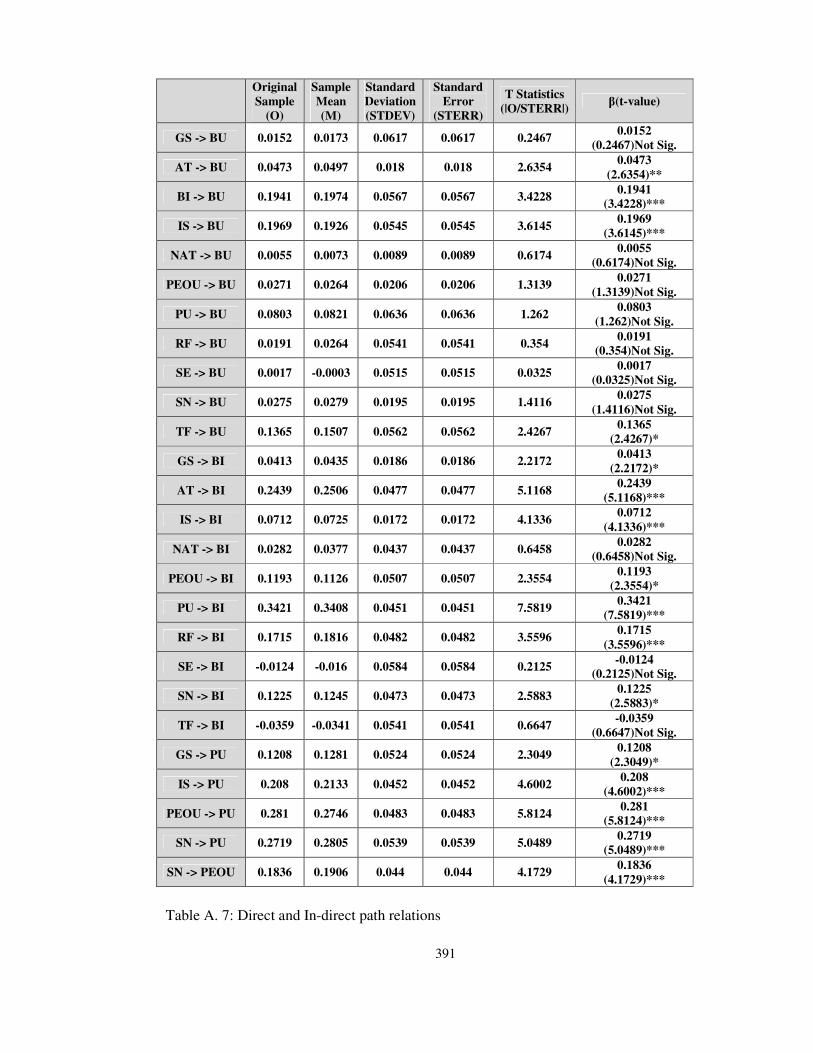
391
Original
Sample
(O)
Sample
Mean
(M)
Standard
Deviation
(STDEV)
Standard
Error
(STERR)
T Statistics
(|O/STERR|) β(t-value)
GS -> BU 0.0152 0.0173 0.0617 0.0617 0.2467 0.0152
(0.2467)Not Sig.
AT -> BU 0.0473 0.0497 0.018 0.018 2.6354 0.0473
(2.6354)**
BI -> BU 0.1941 0.1974 0.0567 0.0567 3.4228 0.1941
(3.4228)***
IS -> BU 0.1969 0.1926 0.0545 0.0545 3.6145 0.1969
(3.6145)***
NAT -> BU 0.0055 0.0073 0.0089 0.0089 0.6174 0.0055
(0.6174)Not Sig.
PEOU -> BU 0.0271 0.0264 0.0206 0.0206 1.3139 0.0271
(1.3139)Not Sig.
PU -> BU 0.0803 0.0821 0.0636 0.0636 1.262 0.0803
(1.262)Not Sig.
RF -> BU 0.0191 0.0264 0.0541 0.0541 0.354 0.0191
(0.354)Not Sig.
SE -> BU 0.0017 -0.0003 0.0515 0.0515 0.0325 0.0017
(0.0325)Not Sig.
SN -> BU 0.0275 0.0279 0.0195 0.0195 1.4116 0.0275
(1.4116)Not Sig.
TF -> BU 0.1365 0.1507 0.0562 0.0562 2.4267 0.1365
(2.4267)*
GS -> BI 0.0413 0.0435 0.0186 0.0186 2.2172 0.0413
(2.2172)*
AT -> BI 0.2439 0.2506 0.0477 0.0477 5.1168 0.2439
(5.1168)***
IS -> BI 0.0712 0.0725 0.0172 0.0172 4.1336 0.0712
(4.1336)***
NAT -> BI 0.0282 0.0377 0.0437 0.0437 0.6458 0.0282
(0.6458)Not Sig.
PEOU -> BI 0.1193 0.1126 0.0507 0.0507 2.3554 0.1193
(2.3554)*
PU -> BI 0.3421 0.3408 0.0451 0.0451 7.5819 0.3421
(7.5819)***
RF -> BI 0.1715 0.1816 0.0482 0.0482 3.5596 0.1715
(3.5596)***
SE -> BI -0.0124 -0.016 0.0584 0.0584 0.2125 -0.0124
(0.2125)Not Sig.
SN -> BI 0.1225 0.1245 0.0473 0.0473 2.5883 0.1225
(2.5883)*
TF -> BI -0.0359 -0.0341 0.0541 0.0541 0.6647 -0.0359
(0.6647)Not Sig.
GS -> PU 0.1208 0.1281 0.0524 0.0524 2.3049 0.1208
(2.3049)*
IS -> PU 0.208 0.2133 0.0452 0.0452 4.6002 0.208
(4.6002)***
PEOU -> PU 0.281 0.2746 0.0483 0.0483 5.8124 0.281
(5.8124)***
SN -> PU 0.2719 0.2805 0.0539 0.0539 5.0489 0.2719
(5.0489)***
SN -> PEOU 0.1836 0.1906 0.044 0.044 4.1729 0.1836
(4.1729)***
Table A. 7: Direct and In-direct path relations

392
Appendix-B
Brunel Business School
A Covering Letter
Dear Respondent,
I am a PhD candidate at Brunel University West London, under the supervision of Professor. Zahir
Irani, Head of Brunel Business School, Brunel University, London, UK. This research is entitled as:
Culture, Demography and Individuals’ Technology Acceptance Behaviour: A PLS Based Structural
Evaluation of an Extended Model of Technology Acceptance in South-Asian Country Context
The aim of study is twofold, i.e. to generate model to contribute the knowledge regarding the
constructs which significantly determine the acceptance of information technology in developing
countries context, and to provide useful information to the IT policy makers within the developing
countries to improve the Internet usage within the academic’s working and professional practices.
This study will require you to complete the survey questionnaire (attached) which takes
approximately 20 to 30 minutes. Your participation is voluntary, and if you do not wish to participate
please discards the questionnaire. Your name and any information you provide will be kept strictly
confidential and will not be attributed to the individual or organisation. Completed questionnaire
response will be stored in secure environment, and the results of research would be used for only
academic purpose.
If you have any question or concern about this study, please contact the investigator: Mr. Muhammad
Sharif Abbasi, PhD Student, Brunel Business School, Brunel University, West London, UB8, 3PH,
email: [email protected] or my supervisor email: [email protected].
Your help would be greatly appreciated, thank you very much for your time and cooperation.
Consent:
I wish to be identified in the report YES NO
I have read the above information and I agree to participate
in this study (Please Tick)
Researcher Signature
Date: Wednesday, 02 November 2011
Cordially,
Muhammad Sharif Abbasi.
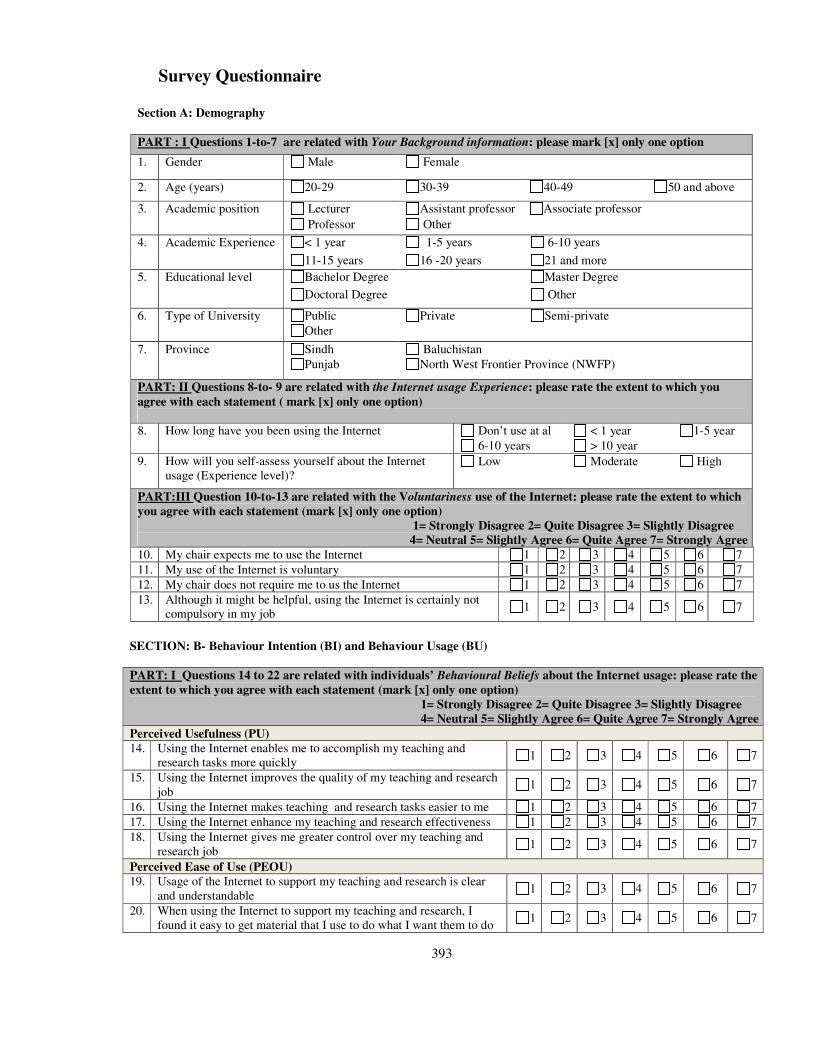
393
Survey Questionnaire
Section A: Demography
PART : I Questions 1-to-7 are related with Your Background information: please mark [x] only one option
1. Gender Male Female
2. Age (years) 20-29 30-39 40-49 50 and above
3. Academic position Lecturer Assistant professor Associate professor
Professor Other
4. Academic Experience < 1 year 1-5 years 6-10 years
11-15 years 16 -20 years 21 and more
5. Educational level Bachelor Degree Master Degree
Doctoral Degree Other
6. Type of University Public Private Semi-private
Other
7. Province Sindh Baluchistan
Punjab North West Frontier Province (NWFP)
PART: II Questions 8-to- 9 are related with the Internet usage Experience: please rate the extent to which you
agree with each statement ( mark [x] only one option)
8. How long have you been using the Internet Don’t use at al < 1 year 1-5 year
6-10 years > 10 year
9. How will you self-assess yourself about the Internet usage (Experience level)?
Low Moderate High
PART:III Question 10-to-13 are related with the Voluntariness use of the Internet: please rate the extent to which
you agree with each statement (mark [x] only one option)
1= Strongly Disagree 2= Quite Disagree 3= Slightly Disagree
4= Neutral 5= Slightly Agree 6= Quite Agree 7= Strongly Agree 10. My chair expects me to use the Internet 1 2 3 4 5 6 7
11. My use of the Internet is voluntary 1 2 3 4 5 6 7
12. My chair does not require me to us the Internet 1 2 3 4 5 6 7
13. Although it might be helpful, using the Internet is certainly not compulsory in my job
1 2 3 4 5 6 7
SECTION: B- Behaviour Intention (BI) and Behaviour Usage (BU)
PART: I Questions 14 to 22 are related with individuals’ Behavioural Beliefs about the Internet usage: please rate the
extent to which you agree with each statement (mark [x] only one option)
1= Strongly Disagree 2= Quite Disagree 3= Slightly Disagree
4= Neutral 5= Slightly Agree 6= Quite Agree 7= Strongly Agree
Perceived Usefulness (PU)
14. Using the Internet enables me to accomplish my teaching and research tasks more quickly
1 2 3 4 5 6 7
15. Using the Internet improves the quality of my teaching and research job
1 2 3 4 5 6 7
16. Using the Internet makes teaching and research tasks easier to me 1 2 3 4 5 6 7
17. Using the Internet enhance my teaching and research effectiveness 1 2 3 4 5 6 7
18. Using the Internet gives me greater control over my teaching and research job
1 2 3 4 5 6 7
Perceived Ease of Use (PEOU)
19. Usage of the Internet to support my teaching and research is clear and understandable
1 2 3 4 5 6 7
20. When using the Internet to support my teaching and research, I found it easy to get material that I use to do what I want them to do
1 2 3 4 5 6 7
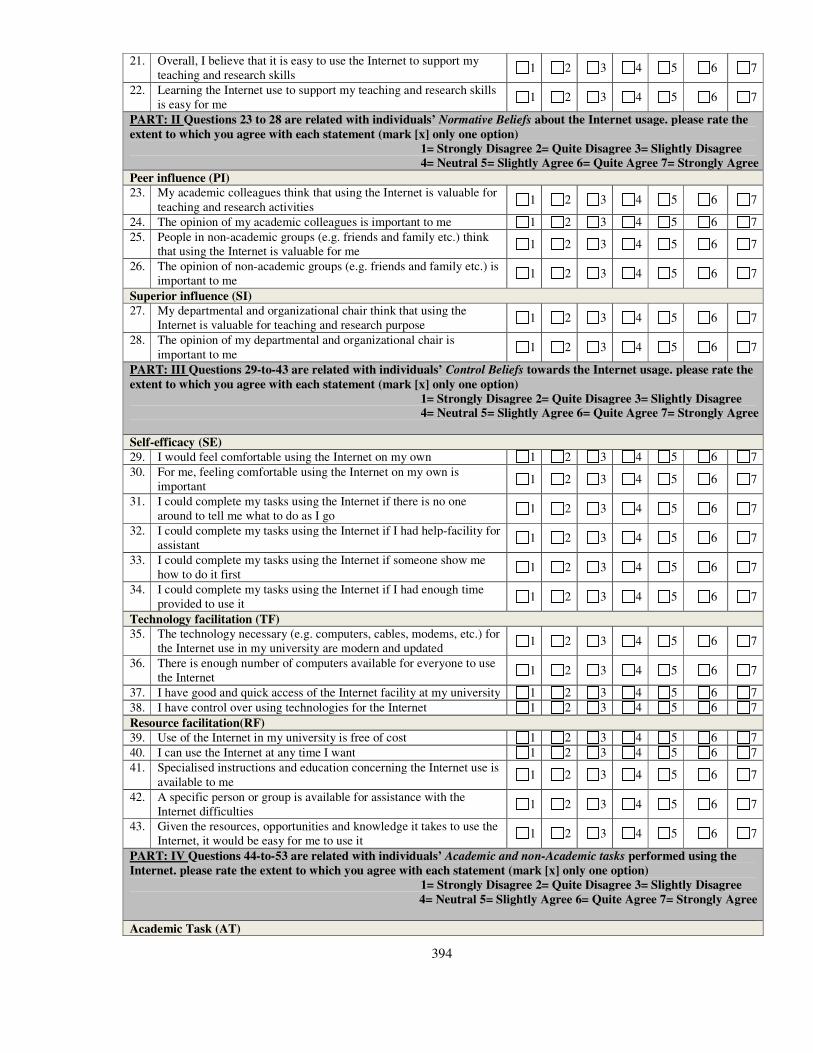
394
21. Overall, I believe that it is easy to use the Internet to support my teaching and research skills
1 2 3 4 5 6 7
22. Learning the Internet use to support my teaching and research skills is easy for me
1 2 3 4 5 6 7
PART: II Questions 23 to 28 are related with individuals’ Normative Beliefs about the Internet usage. please rate the
extent to which you agree with each statement (mark [x] only one option)
1= Strongly Disagree 2= Quite Disagree 3= Slightly Disagree
4= Neutral 5= Slightly Agree 6= Quite Agree 7= Strongly Agree
Peer influence (PI) 23. My academic colleagues think that using the Internet is valuable for
teaching and research activities 1 2 3 4 5 6 7
24. The opinion of my academic colleagues is important to me 1 2 3 4 5 6 7
25. People in non-academic groups (e.g. friends and family etc.) think that using the Internet is valuable for me
1 2 3 4 5 6 7
26. The opinion of non-academic groups (e.g. friends and family etc.) is important to me
1 2 3 4 5 6 7
Superior influence (SI) 27. My departmental and organizational chair think that using the
Internet is valuable for teaching and research purpose 1 2 3 4 5 6 7
28. The opinion of my departmental and organizational chair is important to me
1 2 3 4 5 6 7
PART: III Questions 29-to-43 are related with individuals’ Control Beliefs towards the Internet usage. please rate the
extent to which you agree with each statement (mark [x] only one option)
1= Strongly Disagree 2= Quite Disagree 3= Slightly Disagree
4= Neutral 5= Slightly Agree 6= Quite Agree 7= Strongly Agree
Self-efficacy (SE) 29. I would feel comfortable using the Internet on my own 1 2 3 4 5 6 7
30. For me, feeling comfortable using the Internet on my own is important
1 2 3 4 5 6 7
31. I could complete my tasks using the Internet if there is no one around to tell me what to do as I go
1 2 3 4 5 6 7
32. I could complete my tasks using the Internet if I had help-facility for assistant
1 2 3 4 5 6 7
33. I could complete my tasks using the Internet if someone show me how to do it first
1 2 3 4 5 6 7
34. I could complete my tasks using the Internet if I had enough time provided to use it
1 2 3 4 5 6 7
Technology facilitation (TF) 35. The technology necessary (e.g. computers, cables, modems, etc.) for
the Internet use in my university are modern and updated 1 2 3 4 5 6 7
36. There is enough number of computers available for everyone to use the Internet
1 2 3 4 5 6 7
37. I have good and quick access of the Internet facility at my university 1 2 3 4 5 6 7
38. I have control over using technologies for the Internet 1 2 3 4 5 6 7
Resource facilitation(RF) 39. Use of the Internet in my university is free of cost 1 2 3 4 5 6 7
40. I can use the Internet at any time I want 1 2 3 4 5 6 7
41. Specialised instructions and education concerning the Internet use is available to me
1 2 3 4 5 6 7
42. A specific person or group is available for assistance with the Internet difficulties
1 2 3 4 5 6 7
43. Given the resources, opportunities and knowledge it takes to use the Internet, it would be easy for me to use it
1 2 3 4 5 6 7
PART: IV Questions 44-to-53 are related with individuals’ Academic and non-Academic tasks performed using the
Internet. please rate the extent to which you agree with each statement (mark [x] only one option)
1= Strongly Disagree 2= Quite Disagree 3= Slightly Disagree
4= Neutral 5= Slightly Agree 6= Quite Agree 7= Strongly Agree
Academic Task (AT)
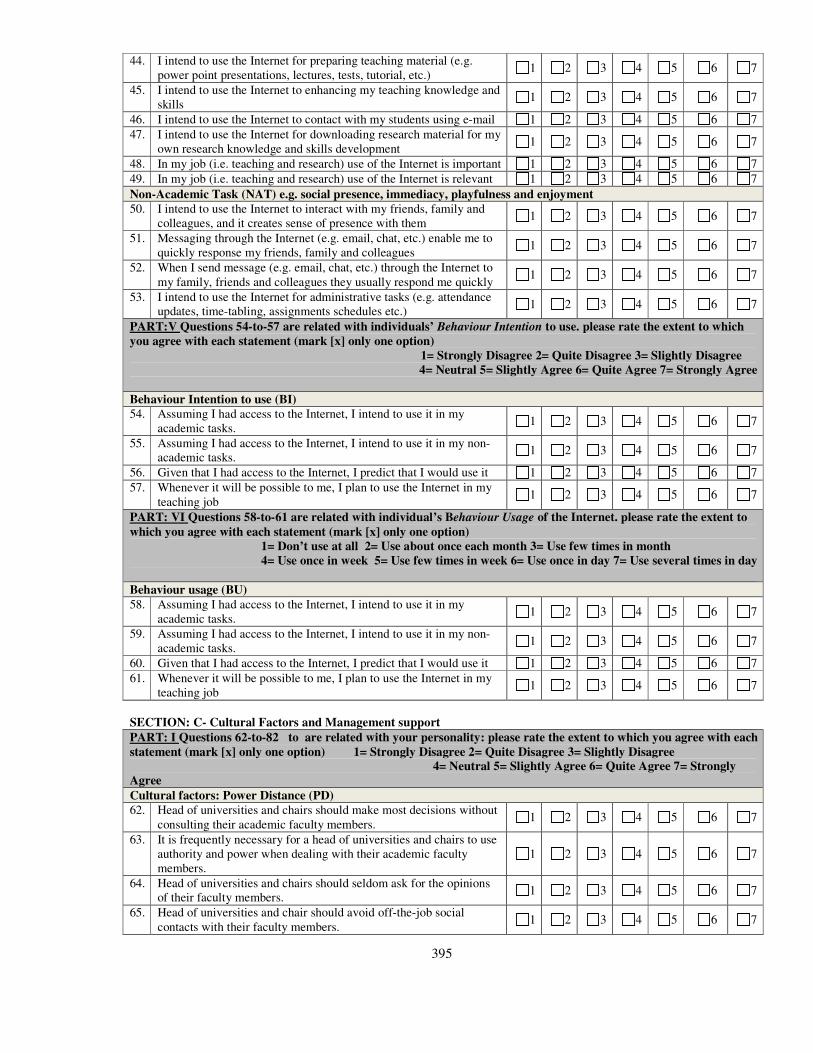
395
44. I intend to use the Internet for preparing teaching material (e.g. power point presentations, lectures, tests, tutorial, etc.)
1 2 3 4 5 6 7
45. I intend to use the Internet to enhancing my teaching knowledge and skills
1 2 3 4 5 6 7
46. I intend to use the Internet to contact with my students using e-mail 1 2 3 4 5 6 7
47. I intend to use the Internet for downloading research material for my own research knowledge and skills development
1 2 3 4 5 6 7
48. In my job (i.e. teaching and research) use of the Internet is important 1 2 3 4 5 6 7
49. In my job (i.e. teaching and research) use of the Internet is relevant 1 2 3 4 5 6 7
Non-Academic Task (NAT) e.g. social presence, immediacy, playfulness and enjoyment 50. I intend to use the Internet to interact with my friends, family and
colleagues, and it creates sense of presence with them 1 2 3 4 5 6 7
51. Messaging through the Internet (e.g. email, chat, etc.) enable me to quickly response my friends, family and colleagues
1 2 3 4 5 6 7
52. When I send message (e.g. email, chat, etc.) through the Internet to my family, friends and colleagues they usually respond me quickly
1 2 3 4 5 6 7
53. I intend to use the Internet for administrative tasks (e.g. attendance updates, time-tabling, assignments schedules etc.)
1 2 3 4 5 6 7
PART:V Questions 54-to-57 are related with individuals’ Behaviour Intention to use. please rate the extent to which
you agree with each statement (mark [x] only one option)
1= Strongly Disagree 2= Quite Disagree 3= Slightly Disagree
4= Neutral 5= Slightly Agree 6= Quite Agree 7= Strongly Agree
Behaviour Intention to use (BI)
54. Assuming I had access to the Internet, I intend to use it in my academic tasks.
1 2 3 4 5 6 7
55. Assuming I had access to the Internet, I intend to use it in my non-academic tasks.
1 2 3 4 5 6 7
56. Given that I had access to the Internet, I predict that I would use it 1 2 3 4 5 6 7
57. Whenever it will be possible to me, I plan to use the Internet in my teaching job
1 2 3 4 5 6 7
PART: VI Questions 58-to-61 are related with individual’s Behaviour Usage of the Internet. please rate the extent to
which you agree with each statement (mark [x] only one option)
1= Don’t use at all 2= Use about once each month 3= Use few times in month
4= Use once in week 5= Use few times in week 6= Use once in day 7= Use several times in day
Behaviour usage (BU)
58. Assuming I had access to the Internet, I intend to use it in my academic tasks.
1 2 3 4 5 6 7
59. Assuming I had access to the Internet, I intend to use it in my non-academic tasks.
1 2 3 4 5 6 7
60. Given that I had access to the Internet, I predict that I would use it 1 2 3 4 5 6 7
61. Whenever it will be possible to me, I plan to use the Internet in my teaching job
1 2 3 4 5 6 7
SECTION: C- Cultural Factors and Management support
PART: I Questions 62-to-82 to are related with your personality: please rate the extent to which you agree with each
statement (mark [x] only one option) 1= Strongly Disagree 2= Quite Disagree 3= Slightly Disagree
4= Neutral 5= Slightly Agree 6= Quite Agree 7= Strongly
Agree
Cultural factors: Power Distance (PD) 62. Head of universities and chairs should make most decisions without
consulting their academic faculty members. 1 2 3 4 5 6 7
63. It is frequently necessary for a head of universities and chairs to use authority and power when dealing with their academic faculty members.
1 2 3 4 5 6 7
64. Head of universities and chairs should seldom ask for the opinions of their faculty members.
1 2 3 4 5 6 7
65. Head of universities and chair should avoid off-the-job social contacts with their faculty members.
1 2 3 4 5 6 7
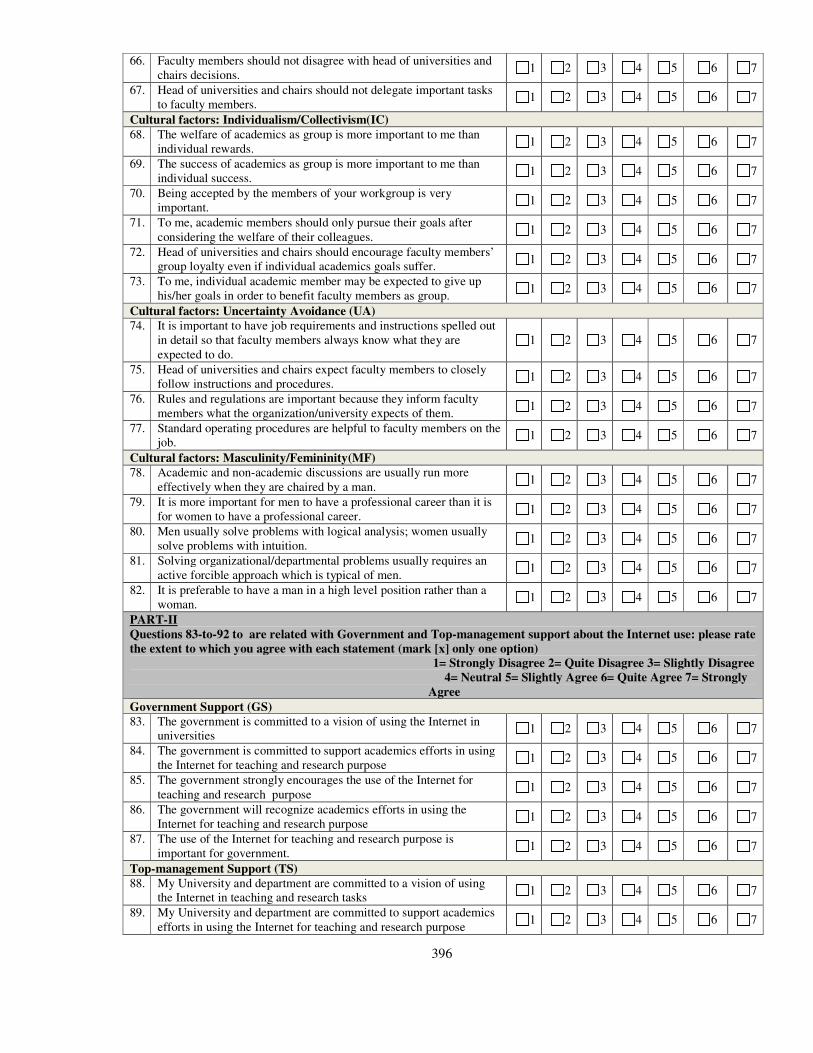
396
66. Faculty members should not disagree with head of universities and chairs decisions.
1 2 3 4 5 6 7
67. Head of universities and chairs should not delegate important tasks to faculty members.
1 2 3 4 5 6 7
Cultural factors: Individualism/Collectivism(IC) 68. The welfare of academics as group is more important to me than
individual rewards. 1 2 3 4 5 6 7
69. The success of academics as group is more important to me than individual success.
1 2 3 4 5 6 7
70. Being accepted by the members of your workgroup is very important.
1 2 3 4 5 6 7
71. To me, academic members should only pursue their goals after considering the welfare of their colleagues.
1 2 3 4 5 6 7
72. Head of universities and chairs should encourage faculty members’ group loyalty even if individual academics goals suffer.
1 2 3 4 5 6 7
73. To me, individual academic member may be expected to give up his/her goals in order to benefit faculty members as group.
1 2 3 4 5 6 7
Cultural factors: Uncertainty Avoidance (UA) 74. It is important to have job requirements and instructions spelled out
in detail so that faculty members always know what they are expected to do.
1 2 3 4 5 6 7
75. Head of universities and chairs expect faculty members to closely follow instructions and procedures.
1 2 3 4 5 6 7
76. Rules and regulations are important because they inform faculty members what the organization/university expects of them.
1 2 3 4 5 6 7
77. Standard operating procedures are helpful to faculty members on the job.
1 2 3 4 5 6 7
Cultural factors: Masculinity/Femininity(MF) 78. Academic and non-academic discussions are usually run more
effectively when they are chaired by a man. 1 2 3 4 5 6 7
79. It is more important for men to have a professional career than it is for women to have a professional career.
1 2 3 4 5 6 7
80. Men usually solve problems with logical analysis; women usually solve problems with intuition.
1 2 3 4 5 6 7
81. Solving organizational/departmental problems usually requires an active forcible approach which is typical of men.
1 2 3 4 5 6 7
82. It is preferable to have a man in a high level position rather than a woman.
1 2 3 4 5 6 7
PART-II
Questions 83-to-92 to are related with Government and Top-management support about the Internet use: please rate
the extent to which you agree with each statement (mark [x] only one option)
1= Strongly Disagree 2= Quite Disagree 3= Slightly Disagree
4= Neutral 5= Slightly Agree 6= Quite Agree 7= Strongly
Agree
Government Support (GS) 83. The government is committed to a vision of using the Internet in
universities 1 2 3 4 5 6 7
84. The government is committed to support academics efforts in using the Internet for teaching and research purpose
1 2 3 4 5 6 7
85. The government strongly encourages the use of the Internet for teaching and research purpose
1 2 3 4 5 6 7
86. The government will recognize academics efforts in using the Internet for teaching and research purpose
1 2 3 4 5 6 7
87. The use of the Internet for teaching and research purpose is important for government.
1 2 3 4 5 6 7
Top-management Support (TS) 88. My University and department are committed to a vision of using
the Internet in teaching and research tasks 1 2 3 4 5 6 7
89. My University and department are committed to support academics efforts in using the Internet for teaching and research purpose
1 2 3 4 5 6 7

397
90. My University and department strongly encourages the use of the Internet for teaching and research purpose
1 2 3 4 5 6 7
91. My University and department will recognize academics efforts in using the Internet for teaching and research purpose
1 2 3 4 5 6 7
92. The use of the Internet for teaching and research purpose is important for my University and department.
1 2 3 4 5 6 7
PART: III
Questions 93-to- 98 are related with E-Reforms launched by Higher Education Commission (HEC)of Pakistan to
promote research culture: 93. What Internet access method is being used at
your working institute? Broadband Dial-up
Wireless Other (specify)
94. Do you think so, currently Internet provided at your institute by HEC is enough to use
Not enough Enough More than Enough
95. At present, overall how often do you use the Internet to visit Digital Library Program started by HEC.
Don’t use at al Use about once in a month
use about few times in a month Use about once in a week
use about few times in a week use about once in a day
use about few times in a day
96. At present, have you registered yourself Pakistan Research Repository (PRR) program to digitalize M.Phil/Ph.D thesis, so it would be accessible through the Internet for research purpose.
Yes No
97. Are you willing to upload your M.Phil/Ph.D thesis over PRR
Yes No
98. Can you please indicate your participation in e-learning program started by HEC.
Never participate 1-5 times
6-10 years > 10 times


![Abbasi MM Lect1 [Compatibility Mode]](https://static.fdocuments.in/doc/165x107/577d33d41a28ab3a6b8bdfc7/abbasi-mm-lect1-compatibility-mode.jpg)