CTS13-27
37
Video Detection and Classification of Pedestrian Events at Roundabouts and Crosswalks Final Report Prepared by: Ted Morris Xinyan Li Vassilios Morellas Nikos Papanikolopoulos Department of Computer Science and Engineering University of Minnesota CTS 13-27
-
Upload
ebinsams007 -
Category
Documents
-
view
220 -
download
0
description
CTS13-27
Transcript of CTS13-27
Video Detection and Classification of Pedestrian Events at Roundabouts and Crosswalks
Final Report
Prepared by:
Ted Morris Xinyan Li
Vassilios Morellas Nikos Papanikolopoulos
Department of Computer Science and Engineering University of Minnesota
CTS 13-27

Technical Report Documentation Page 1. Report No. 2. 3. Recipients Accession No. 13-27 4. Title and Subtitle 5. Report Date
Video Detection and Classification of Pedestrian Events at Roundabouts and Crosswalks
August 2013 6.
7. Author(s) 8. Performing Organization Report No. Ted Morris, Xinyan Li, Vassilios Morellas, Nikos Papanikolopoulos
9. Performing Organization Name and Address 10. Project/Task/Work Unit No.
Department of Computer Science University of Minnesota 200 Union St SE Minneapolis, MN 55455
CTS Project #2012049 11. Contract (C) or Grant (G) No.
12. Sponsoring Organization Name and Address 13. Type of Report and Period Covered
Intelligent Transportation Systems Institute Center for Transportation Studies University of Minnesota 200 Transportation and Safety Building 511 Washington Ave. SE Minneapolis, MN 55455
Final Report 14. Sponsoring Agency Code
15. Supplementary Notes http://www.its.umn.edu/Publications/ResearchReports/ 16. Abstract (Limit: 250 words)
A well-established technique for studying pedestrian safety is based on reducing data from video-based in-situ observation. The extraction and cataloging from recorded video of pedestrian crossing events has largely been achieved manually. Although the manual methods are generally reliable, they are extremely time-consuming. As a result, more detailed, encompassing site studies are not practical unless the mining for these events can be automated. The study investigated such a tool based on utilizing a novel image processing algorithm recently developed for the extraction of human activities in complex scenes. No human intervention other than defining regions of interest for approaching vehicles and the pedestrian crossing areas was required. The output quantified general event indicators—such as pedestrian wait time, and crossing time and vehicle-pedestrian yield behaviors. Such data can then be used to guide more detailed analyses of the events to study potential vehicle-pedestrian conflicts and their causal effects. The evaluation was done using an extensive set of multi-camera video recordings collected at roundabouts. The tool can be used to support other pedestrian safety research where extracting potential pedestrian-vehicle conflicts from video are required, for example at crosswalks at urban signalized and uncontrolled intersections.
17. Document Analysis/Descriptors Computer vision, Learning (Artificial intelligence), Pedestrian flow, Pedestrian safety, Crosswalks, Roundabouts, Pedestrian accessibility
18. Availability Statement No restrictions. Document available from: National Technical Information Services, Alexandria, Virginia 22312
19. Security Class (this report) 20. Security Class (this page) 21. No. of Pages 22. Price 37
Video Detection and Classification of Pedestrian Events at Roundabouts and Crosswalks
Final Report
Prepared by:
Ted Morris Xinyan Li
Vassilios Morellas Nikos Papanikolopoulos
Department of Computer Science and Engineering
University of Minnesota
August 2013
Published by:
Intelligent Transportation Systems Institute Center for Transportation Studies
University of Minnesota 200 Transportation and Safety Building
511 Washington Ave. S.E. Minneapolis, M
innesota 55455
The contents of this report reflect the views of the authors, who are responsible for the facts and the accuracy of the information presented herein. This document is disseminated under the sponsorship of the Department of Transportation University Transportation Centers Program, in the interest of information exchange. The U.S. Government assumes no liability for the contents or use thereof. This report does not necessarily reflect the official views or policies of the University of Minnesota. The authors, the University of Minnesota, and the U.S. Government do not endorse products or manufacturers. Any trade or manufacturers’ names that may appear herein do so solely because they are considered essential to this report.

Acknowledgment
The authors would like to acknowledge individuals and organizations that made this research pos-sible. They study was funded by the Intelligent Transportation Systems Institute, affiliated withthe University of Minnesota’s Center for Transportation Studies (CTS). Financial support was pro-vided by the United States Department of Transportation’s Research and Innovative TechnologiesAdministration (RITA) University Transportation Centers (UTC) program. The authors would alsolike to give special acknowledgement to the Minnesota Traffic Observatory within the Departmentof Civil Engineering for access to their roundabout video database of pedestrian and vehicle activ-ities.

Contents
Contents1 Introduction . . . . . . . . . . . . . . . . . . . . . . . . . . . . . . . . . . . . . . 12 Background . . . . . . . . . . . . . . . . . . . . . . . . . . . . . . . . . . . . . . 33 Pedestrian Event Detection Methodology . . . . . . . . . . . . . . . . . . . . . . . 5
3.1 Vehicle and pedestrian foreground extraction . . . . . . . . . . . . . . . . 53.2 Test Phase . . . . . . . . . . . . . . . . . . . . . . . . . . . . . . . . . . . 93.3 Online Adaptation . . . . . . . . . . . . . . . . . . . . . . . . . . . . . . 103.4 Pedestrian Event Characterization . . . . . . . . . . . . . . . . . . . . . . 12
4 Experimental Testing And Data Reduction . . . . . . . . . . . . . . . . . . . . . . 155 Results . . . . . . . . . . . . . . . . . . . . . . . . . . . . . . . . . . . . . . . . . 17
5.1 Minnehaha Intersection . . . . . . . . . . . . . . . . . . . . . . . . . . . . 175.2 Portland Intersection . . . . . . . . . . . . . . . . . . . . . . . . . . . . . 20
6 Conclusions . . . . . . . . . . . . . . . . . . . . . . . . . . . . . . . . . . . . . . 23References . . . . . . . . . . . . . . . . . . . . . . . . . . . . . . . . . . . . . . . . . . 25

List of Figures
Figure 1 The pedestrian event detection tool algorithm and workflow . . . . . . . . . 5Figure 2 Batch training algorithm for learning the background model. . . . . . . . . 8Figure 3 Foreground detection algorithm for online test phase. . . . . . . . . . . . . 10Figure 4 Pedestrian event detection processing, Minnehaha Ave. . . . . . . . . . . . 16Figure 5 Pedestrian event detection processing, Portland Ave. . . . . . . . . . . . . 16Figure 6 Natural scene crosswalk occlusions at Minnehaha roundabout . . . . . . . 18Figure 7 Forground detection errors, Portland roundabout . . . . . . . . . . . . . . . 21
List of Tables
Table 1 Video data selected for analysis . . . . . . . . . . . . . . . . . . . . . . . . 15Table 2 Event Detection Accuracy, Minnehaha . . . . . . . . . . . . . . . . . . . . 17Table 3 Truth table for Minnehaha traffic detection . . . . . . . . . . . . . . . . . . 18Table 4 Truth table for Minnehaha yielding detection . . . . . . . . . . . . . . . . . 19Table 5 Minnehaha pedestrian-yield wait and crossing times . . . . . . . . . . . . . 20Table 6 Event detection accuracy, Portland Ave. . . . . . . . . . . . . . . . . . . . . 20Table 7 Truth table for Portland Ave. traffic detection . . . . . . . . . . . . . . . . . 21Table 8 Truth table for Portland yielding detection . . . . . . . . . . . . . . . . . . 21Table 9 Portland pedestrian-yield wait and crossing times . . . . . . . . . . . . . . . 22

Executive Summary
A well-established technique for studying pedestrian safety is based on reducing data fromvideo-based in-situ observation. Such video data was recently collected to evaluate pedestriansafety at roundabouts. Video camera sensors are an obvious choice over in-situ manual obser-vational studies, which require tedious, intensive manual labor that is error-prone and cannot berectified after the fact. The amount of data and events to be categorized in the video data canquickly overwhelm manual measurement and extraction techniques. As a result, more detailed,encompassing site studies are not practical unless the mining for these events can be automated.
The objective of this study was to develop and test the feasibility of a novel computer visiontool to extract and categorize pedestrian events at roundabout intersections. Specifically, two dif-ferent urban Roundabout intersections were utilized to categorize yielding behaviors, pedestrianwait-at-curb times, and crossing times. The tool integrated a novel and computationally effi-cient image-processing algorithm that was recently developed for extraction of human activitiesin very complex scenes. The concept is based on adaptive dictionary learning where the chang-ing background scene is learned with assumptions that foreground changes are relatively randomand sparse. Automated tracking was then facilitated to aid crossing event categorization. Theevaluation was done by comparing a subset of videos of multi-camera video recordings that werecollected at roundabouts from a previous study done by other investigators (Minnesota TrafficObservatory). Note that their video data was not initially collected for the purpose of automatedcomputer vision pedestrian event detection. The subset of data consisted of video segments thatprovided the largest subsets of different a priori cataloged pedestrian events. At present, there is nowidely available, portable,‘turn-key’ tool to automate extraction of these events from video record-ings. There have been many proposed systems aimed at pedestrian tracking but their applicationhas been targeted for real-time traffic control and they do not have a flexible, open, architecture toextract and catalog the events.
The output categorized several different pedestrian events that could be compared to manu-ally tabulated ground-truthed data. We examined and characterized pedestrian events based onpedestrian activity times (waiting to cross and crossing times), and vehicle/pedestrian yield events.The results indicate an event detection retrieval rate above 90%, with similar accuracy for cate-gorizing vehicle-pedestrian presence and yielding behavior. Pedestrian event activity times couldnot be directly compared with the independently ground-truthed data but the findings corroboratereasonably with previous studies.
Small background movements and image noise and compression artifact could be handled bythe algorithm, but detection errors were noted due to excessive camera movement and foliageforeground occlusions for several crosswalk scenes. Future studies should consider a differentcamera perspective to avoid the latter problems specifically.
The objective of the tool is to automate cataloging of pedestrian events to significantly stream-line the process for more detailed analyses of vehicle-pedestrian conflicts and their causal ef-fects. The tool can be used to support other pedestrian safety research where extracting poten-tial pedestrian-vehicle conflicts from video is needed. No human intervention was required, otherthan defining regions of interest for approaching vehicles and the pedestrian crossing areas. Once

such information is extracted, user interfaces could then be built on top of the tool for rapid re-trieval and visual inspection of the event to study potential vehicle-pedestrian conflicts and theircausal effects. Robust and computationally efficient foreground detection of moving pedestrians,fed into a tracking algorithm, could be adapted to other applications, such as real-time detectionof pedestrian events at unsignalized or signalized intersections to improve traffic safety, or signaltiming.
The project scope entailed automated identification and categorization of pedestrian events atroundabouts but the extracted measures and set up procedures are applicable to other intersectionsas well. Many jurisdictions place camera sensors (fixed or Pan,Tilt,Zoom systems) located on thesignal cross arm or light pole overhang, giving similar perspectives of the intersection crosswalksand oncoming traffic to the portable system camera locations used for this study at the roundabouts.

1 Introduction
Pedestrian safety has become a growing concern recently as more people choose this mode(perhaps combined with other public and bicycle transit modes) to complete their trips. A 2003NHTSA report estimated 70,000 pedestrians were injured and 4,749 killed from vehicle relatedcrashes [1]. More specifically, pedestrian fatalities in single vehicle crashes accounted for over 90percent of the pedestrian fatalities from all fatal motor vehicle crashes [2]. In 2007, 24.3 percentof all pedestrian fatalities in the United States (1,143 out of 4,699) occurred at intersections. Theconcern among transportation professionals is also supported by a recent rise of 4% in pedestrianfatalities in 2010, after steadily falling numbers up to 2009 [3]. Nationally some states– includingMinnesota– are adopting laws that require planners, MPOs, and engineers to adequately addresssafety and accessibility needs of pedestrians, bicyclists, and motorists [4]. Consequently, engineersand planners have started to implement new road treatment and intersection designs with the aimof reducing the risk of vehicle-pedestrian crashes. Accordingly, there is a growing need to conductobservational studies to understand underlying factors of roadway treatments that may reduce riskof pedestrian crashes. Roundabouts are one such treatment that has gained considerable attentionamong planners and engineers. The objective of this study was to test a computer vision-basedtool to extract and quantify pedestrian events that occur at such intersections, to aid planners andengineers who wish to monitor and characterize their effectiveness and safety for pedestrians. Anoverview of their operation and current issues regarding field assessments is provided below.
Roundabout intersections have been prevalent in Europe and Australia for many years. InFrance and the United Kingdom alone they number about 55,000 of them. Within the last 10 years,popularity of roundabouts has increased dramatically within the United States, after the advent ofmodern designs originating in England in the early 1960’s. Since the first modern roundabout wasbuilt in the US in 1990 in the state of Navada, the estimate of roundabouts has grown to about 3,500(as of the end of 2012) [5]. Modern roundabout designs contain elements to channelize and slowdown drivers, as well as offset designated pedestrian crossings with mid-road refuge islands. Theassertion that they improved traffic safety and operations over the signalized intersections they re-place has been generally supported by various studies over the last decade since their introduction,in addition to costing less to maintain and install.
The traffic speeds have been noted to be less than the main line, and the nature of crashesthat do occur have tended to be less severe because high speed right-angle-left-turn, and head-oncrashes are mitigated. A 2001 Institute study of 23 intersections in the United States reported thatconverting intersections from traffic signals or stop signs to roundabouts reduced injury crashesby 80 percent and all crashes by 40 percent [6]. Similar results were reported by [7]: a 72 per-cent decrease in injury crashes and a 47 percent decrease in total crashes at 33 intersections thatwere converted from traffic signals or stop signs to roundabouts. A study of 17 higher-speed ru-ral intersections (speed limits of 40 mph or higher) found that the average injury crash rate permillion entering vehicles was reduced by 84 percent and fatal crashes were eliminated when theintersections were converted to roundabouts. Studies of intersections in Europe and Australia thatwere converted to roundabouts have reported 25-87 percent reductions in injury crashes and 36-61percent reductions in severe injury crashes.
1

At the onset of this project, despite the noted vehicular traffic safety benefits, observation in-tensive studies were lacking that analyzed more specifically pedestrian safety and accessibility atroundabout intersections. For example there have been questions raised that legally blind individu-als cannot discern the traffic. In [8] investigators attempted to resolve blind pedestrian-vehicle yeildconflicts by adding plastic ’rumble-strips’ on the interior roundabout lanes to make ’click-clack’sound cues. Yields were detected more readily from the blind subjects than the same single-laneroundabout. However, there was a significant increase in the occurrence of false-positives. Two-lane roundabouts were investigated with the same type of pavement treatment but was not effectivesince the majority of vehicles did not reach the rumble-strips before stopping. Other more recentstudies introduced probabilistic models to predict gap crossing selection and wait times for sightedvs. bind populations [9], as well as quantified ’high risk’ gap selections for different pedestriancrossing locations [10]. Note that the data for the aforementioned studies were collected using alimited number of subjects by in-situ observations.
Recently Hourdos et. al [11] completed a much more thorough video observation-based studyamid perceptions from surrounding communities that pedestrian safety was being compromisedat these intersections. In particular, annectodal evidence suggested that drivers do not yield topedestrians at the crosswalks, and in any case there was little understanding of underlying factorsof such designs and ensuing traffic conditions that would indeed impact pedestrian safety or ac-cessibility. Over 1,900 hours were manually ground-truthed to categorize over 12,000 pedestriancrossing events representative of the several weeks of data collection that was completed. In theirresults they noted low yielding rates for pedestrians waiting to cross, particularly for a two-laneroundabout, but otherwise ’close calls’ were extremely rare, and they reported on-average crossingtimes (including the wait-time at the curbs) were better than what is typically observed at high vol-ume urban intersections. Originally their intent, in addition to understanding potential factors thataffect pedestrian safety, was to understand aforementioned blind population pedestrian crossingbehaviors within naturalistic contexts but unfortunately no such observations were found duringtheir study.
The objective of our study was to develop a computer vision tool to automated the extractionof pedestrian events from the two different urban Roundabout intersections utilizing the aforemen-tioned collected video data from Hourdos et. al [11] to evaluate the feasibility of the approach.The tool integrates a novel computer vision foreground detection algorithm, used for extractionof human activities in very complex scenes [12], to extract general yielding behaviors betweenpedestrians and vehicles, pedestrian crossing delays, and level of pedestrian utilization. Note thattheir video data was not initially collected for the purpose of automated computer vision pedes-trian event detection. The tool can be used to automate cataloging of pedestrian events in order tosignificantly stream-line the process for more detailed analyses of vehicle-pedestrian conflicts andtheir causal effects.
The remaining report is organized as follows. Chapter 2 will review the literature on generalmethodologies to pedestrian detection. Chapter 3 will provide an overview of our methodology ofpedestrian detection based on identifying foreground saliency from dictionary learning techniques.The data and experiments for evaluating the tool will be discussed in Chapter 4, with the resultsfrom the experiments presented in Chapter 5. Conclusions of the work will be provided in Chapter6.
2
2 Background
Pedestrian and vehicle video surveillance and analysis from infrastructure-mounted video cam-eras have been a topic of research for many years [13, 14, 15]. Pedestrian safety studies have fre-quently relied on archived video-based field observations to examine pedestrian-vehicle conflictsand interactions. This is because assessing the risk from available crash records alone is incon-clusive since occurrences of these events are relatively scarce. Reliable automated extraction ofpedestrian crossing events has proven to be non-trivial, and consequently many investigations aredone manually. A review of various machine-vision automated techniques and their application topedestrian safety is provided below.
In general, video processing consists of (at least) three steps: segmentation of moving objects,object tracking and object motion recognition or object analysis. Reference [16] developed andtested an automated real-time pedestrian tracking algorithm for pedestrian control at signalizedintersections using an active deformable model to recognize pedestrians. A two-day field test in-dicated a pedestrian detection accuracy of 90%. The study purported that shadows, contrast, andcamera placement affect accuracy. [17] proposed pedestrian crowd tracking through optical flowrather than tracking pedestrians individually; the authors discuss its utility for controlling busy sig-nalized intersections and crowd traffic control. [18] developed a multilevel tracking approach fortracking pedestrians and vehicles at crowded intersections. They presented modules for foregroundseparation of the pedestrians and vehicles from the static scene, blob tracking, Kalman-based pre-dictive filtering for improving tracking when the pedestrian or vehicle is occluded, and finally anincident detection module based on frame-by-frame overlap of principal axis rectilinear bound-ary representations of the vehicles or pedestrians. The segmentation step in these formulationswas based on background suppression techniques which compare the actual pixel values with thecorresponding values in the (statistically) learned model of the static scene [19, 20].
Once objects (e.g. pedestrians) remain static in the image for long periods, they become in-visible with the motion detection because they begin to blend into the background. Gibson et.al [21], utilized horizontally aligned stereo high-resolution digital cameras to track pedestrianswithin the crosswalk in real-time (5 fps) to overcome this problem. Their approach first separatespedestrians from the environment by thresholding disparity images —a gray-scale image whosepixel values represent the distance between corresponding pixels in the L/R (Left/Right) images,projected along the epipolar line. The distance of pedestrian from the stereo camera and loss oftextural information from lighting and pedestrian appearance confounded foreground/backgroundseparation and the authors proposed a disparity layering technique to overcome these issues. Com-mercial vision-based sensors specifically designed for pedestrian presence detection at crosswalksare now available (www.traficon.com). A stereo-camera sensor configuration has the capability totrack pedestrians waiting near the curb-line to cross. These cannot be used as a generalized tool forpedestrian data reduction, because they are closed systems embedding the camera sensors as partof the package, and the proprietary hardware cannot be adapted as a general post-analysis portabletool.
Lately, various groups have proposed and demonstrated machine vision tracking techniques toquantify surrogate pedestrian safety measures from recorded videos. In [22], on-coming vehicletrajectories and pedestrian cross-walk presence counting was extracted and characterized using
3

a blob tracking and calibration algorithms developed by [23, 24]. They recommended furtherstudying the feasibility of their pedestrian detection algorithms to automate crossing warningsrather than utilizing pedestrian-actuated push buttons to initiate the crossings.
Rather than investigating vehicle speed profiles alone as a surrogate risk measure for pedestriancross-walk safety, Ismail et. al [25, 26] quantified pedestrian and vehicle trajectories to estimateseveral traffic conflict indicators at signalized intersection crosswalks, using edge feature a track-ing algorithms to track the pedestrians and vehicles [27, 28]. Specifically, the extracted pedestrianand vehicle trajectories were used to compute Time to Collision (TTC), Post-Encroachment Time(PET), Deceleration-to-Safety Time (DST), and Gap Time (GT). Time to collision (TTC) is theestimate of a time of collision if neither the vehicle or pedestrian changed course. Post Encroach-ment Time (PET) is the observed temporal proximity between the pedestrian and the vehicle (thepoint in time where they were occupying the same location). They defined GT as the PET calcu-lated at each instant before a potential conflict while DST is the required deceleration time in orderfor PET > 0 (avoid a crash). The latter calculation of DST assumes the “movements of the con-flicting road users remain unchanged”. Extensive literature demonstrates the utility of such spatialand temporal proximity measures as surrogates to evaluate severity but are also very challengingto estimate from in-situ observations. Contrast this with longitudinal crash studies that requirecollecting enough crash events for statistically valid analyses (for example, in Lee and Abdel-Aty [29]). The investigators state that such an approach can be viewed as more ‘reactive’ and less‘proactive’ due to the fact that the very crashes needed to conduct the study may have otherwisebeen avoided if another method to quantify severity without waiting for the crashes were insteadused. As an example, their technique was used to conduct a before/after study on the efficacy ofpedestrian scramble phase signal treatments using two hours video for each condition and foundthat there were fewer potential conflicts between pedestrians and vehicles with the scramble-phasecontrol plan [30]. Note that operator observation and correction is necessary in some cases tocorrect tracking inaccuracies, and incorrect grouping and identification of pedestrians.
A limited study by [31] developed a human-assisted trajectory extraction tool to analyze thecrossing behavior of 154 pedestrian crosswalk events extracted from 77 pedestrians at a single-laneroundabout. The image processing consisted of creating several regions of interest (ROI); pedes-trian waiting zones, conflict zone (intersection of cross walk area and roadway), and approachingand passed vehicle zones. Pedestrian crossing speed, gap acceptance, critical gap value, and levelof driver yield behavior were computed and analyzed in order to develop a traffic microsimulationmodel of a roundabout that can consider pedestrian interactions. Effects of changing backgroundand lighting from environmental factors were not considered for these studies.
To conclude, many computer vision-based approaches have been proposed, although there isno widely available, field-proven, turnkey tool that can be used to extract and categorize pedestriancrossing events over long periods where changes in lighting, camera, and background motion oc-cur. The aim of this project was to test the feasibility of such a tool that leverages a recent approachfor robust foreground segmentation of moving objects in static scenes. The output from the toolcompliment the accessibility and general safety Measures Of Effectiveness (MOEs) - for examplewait times, and yielding order – as presented above in [31], [9], [11] and [10]. The next chapterwill summarize the methodology and initial results from previous work and its formulation andadaptation for outdoor pedestrian surveillance.
4

Figure 1: The pedestrian event detection tool algorithm and workflow
5
3 Pedestrian Event Detection Methodology
The tool pedestrian event detection framework which integrates our approach is shown in fig-ure 1. We analyzed the intersections in the context of how they are intended to operate. Sev-eral user-defined Region Of Interests (ROI) are constructed to monitor pedestrian or vehicle pres-ence. The pedestrian crossing is broken into sidewalk/island regions and the crosswalk. RegionOf Interests (ROI) are constructed which encompassed the pedestrian crossing area and adjoiningsidewalk/curb regions. A second ROI defines vehicular traffic movement within, and outside theroundabout: a) traffic inflows leading into the roundabout, and b) traffic outflows coming from theroundabout (figures 4 and 5). Dictionary background learning was used for foreground objectdetection, followed by a blob tracking algorithm to discriminate between vehicles and pedestri-ans and track their locations (differentiation between pedestrians and bicycles was not part of thedetection tool). Then activity time in the defined ROIs are used to output pedestrian detectionevent characterizations: a) vehicle presence, b) vehicle/pedestrian yield, and c) pedestrian delayand crossing times. The background and foreground detection methodology are described next,followed by the subsequent steps to characterize the pedestrian events.
3.1 Vehicle and pedestrian foreground extraction
The basic assumption behind the vehicle and pedestrian foreground segmentation is that theirpresence is transient and occurs infrequently relative to the remaining background, which has amuch lower temporal variance [32, 33]. In particular the foreground objects are modeled as asparse error, and a model of the background can be learned from a sequence of training images
from the camera. More concretely, given a static view of the roundabout approach leg and cross-walk, we modeled the background as a linear combination of dictionary atoms (e.g., columns of adictionary matrix,W), and separate out pedestrians and vehicles as the sparse error produced whena new image is linearly approximated using a linear combination of the dictionary atoms. The firststep is a batch training phase to learn the background model dictionary, and then the online test(or performance) phase where we use the learned model to perform foreground detection of anypedestrians or vehicles within incoming frames. The derivation and algorithm steps are discussedbelow.
Let A∈Rm×n be the data matrix consisting ofn training images as columns, withm= m1×m2,the number of pixels in each image. The model is represented by decomposing the data matrixAas
A=WH+Y, (1)
whereW ∈ Rm×k, H ∈ Rk×n, Y ∈ Rm×n, andk is the number of atoms in the background model,or dictionary,W. Each incoming image is represented as a linear combination of atoms in thebackground model, plus a sparse errorY which represents the foreground. A requirement of themodel is that the image signal dimensionm is very large, whilek< n≪ m.
Given the above model representation of the scene, the training phase then involves estimatingthe matricesW, H andY from A. Only the background modelW is retained from the training phaseto perform foreground detection in incoming frames during the online test phase. The optimizationproblem is posed as:
minW,H,Y
n
∑j=1
‖Yj‖1+λ‖H‖2F , (2)
or substituting for the error term, Y in equation (1),
minW,H
n
∑j=1
‖A j −WHj‖1+λ‖H‖2F , (3)
where the subscriptj denotes thejth column of the matrix, and the subscriptF refers to the Frobe-nius (matrix) norm and‖ · ‖1 is theℓ1 norm (absolute value).
A smoothness constraint is imposed on the coefficient matrixH, so that the different framesuse the atoms similarly. In other words, the frames should not vary drastically in their usage ofa particular atom, which translates into minimizing the variability of pixel intensities across thetraining frames. In this studyλ = 1.
The optimization problem in (3) is not convex in bothW andH, but is convex for one of thevariables as long the other one is fixed. Thus, by alternating the minimization ofW andH, we areguaranteed to arrive at a fixed point(W∗,H∗) which is either a local minimum or a saddle point[34]. Empirical evidence shows that the local optima obtained are sufficient for good backgroundmodeling and foreground detection. Each iteration of the training phase thus consists of two steps,as follows:
6

GIVEN W, FIND H
Given a fixed dictionaryW, we optimize (3) overH:
minH
n
∑j=1
‖A j −WHj‖1+λ‖H‖2F (4)
or, minH,Y
∑j=1
‖Yj‖1+λ‖H‖2F .
n
(5)
Using (1), we get
minY
n
∑j=1
‖Yj‖1+λ‖A−W†Y‖2F , (6)
w ˜ 1here A = W†A, andW† =
(
WTW)−
WT is the pseudo-inverse ofW. Note that sinceWTW isonly a k× k matrix, wherek is small, the matrix inversion is not too computationally expensive.We replacedH in the above minimization using the transformation
WH= A−Y ⇒ H =W†(A−Y) ⇒ H = A−W†Y, (7)
Substituting back into (5), and rewriting this, we get
minY
n
∑j=1
{
12‖A j −W†Yj‖
2F + λ‖Yj‖1
}
, (8)
λwhere = 1/2λ . This is a standard Lasso problem inA, W† andY, and thus can be solved quicklyand efficiently.
GIVEN H, FIND W
Given the coefficient matrixH, we now optimize (3) overW, as follows:
minW
n
∑j=1
‖A j −WHj‖1 =m
∑i=1
n
∑j=1
|Ai j −k
∑l=1
Wil Hl j |. (9)
Our method to learn the optimal dictionaryW is motivated by the K-SVD algorithm of Aharonet al. [35]. We learn the optimalW by optimizing each atomWp at a time. The newWp is computedsuch that the approximation error induced by omitting the atom is minimized in theℓ1-sense:
minW
∑i=1
∑j=1
|Ai j − ∑l=1
Wil Hl j |
= minW
m
∑i=1
n
∑j=1
∣(
Ai j −k
∑l=p
Wil Hl j
)
−WipHp j
∣
.
m n k
(10)
∣
∣
6
∣
∣(11)
7

Figure 2: Batch training algorithm for learning the background model.
m n λGiven : n training frames inA∈ R × , parametersk andInitialization : Start with a random dictionaryW ∈ Rm×k.Repeat until convergence,
Given W, find H:
˜• ComputeW† = pinv(W), A=W†A andλ = 1/2λ .
• Use Lasso, or any other sparse coding algorithm, to computeYj ∈ Rm for j =1,2, . . . ,n
1min ‖A j −W†Y 2 ˜
j‖F +λ‖Yj‖1.Yj 2
• ComputeH = A−W†Y.
Given H, find W: For p= 1,2, . . . ,k,
ComputeY(p) A W(p• = − )H.
• Obtain the new atomW∗p , as
n
W∗ pp = argmin
w∑ ‖Y( )
j −Hp jw‖1.j=1
Upon convergence, compute the sparse errorY = A−WH. The foreground in thetraining frames is given byE = |Y|, where | · | represents the element-wise absolutevalue.
For p = {1,2, ...,k}, we thus compute the matrixY(p) = A − W(p)H, whereW(p) = [W1,W2, ...,Wp−1,0,Wp+1, ...,W ∗
k], and then find the atomWp , where
W∗p = argmin
w
n
∑j=1
‖Y(p)j −Hp jw‖1. (12)
Since the cost function is strictly non-negative and the elementswi are independent of eachother, we can separate the optimization into single variables as
W∗ip = argmin
wi
n
∑j=1
|Y(p)i j −Hp jwi |=
n
∑j=1
|Hp j|∣
∣
Yi j
Hp j−wi
∣
∣
.∣
(p)
∣
8
W∗ip = argmin
wi
n
∑j=1
|Y(p)i j −Hp jwi | (13)
= argminwi
∑j=1
|Hp j|∣
i j
Hp j−wi
∣
.n
∣
∣
Y(p)∣
∣(14)
pY( ) nW∗
ip is the weightedℓ1-norm minimizer of the sequence{
i j}
(formed from the rows ofHp j j=1
Y(p n) and the rowHp), with corresponding weights|Hp j| , i.e. the weighted median. Due toj=1this weighting, data points that do not use the particu
{
lar ato
}
m (i.e.,Hp j = 0) are not included in theoptimization. In this fashion each element ofW∗
p is computed.
The first step in each iteration involves solvingn Lasso problems. The second step involvessolvingmk1-dimensional weighted median problems, each of which can be solved inO(n) time,resulting in a time complexity ofO(mnk). The dictionary update step is therefore relatively in-expensive compared to the coefficient update. Thus, by alternating minimization ofW andH, weobtain a solution(W∗,H∗) to the problem (3). The background modelW∗ obtained from the train-ing is retained for the test phase, where we perform foreground detection on the incoming videoimages.
3.2 Test Phase
Once the background modelW is learned, it can be used to perform foreground detection in theonline test phase, where new images come in. The foreground detection step is the same as step(1) in the batch training phase (Refer to figure 3 for further details).
Given a new imagea∈ Rm, the sparse errory is estimated, with a regularization on the coeffi-cient vectorh∈ Rk. The model is, as before, given by
a=Wh+y. (15)
The optimization problem to perform online foreground detection is given by
minh
‖a−Wh‖1+λ‖h‖22, (16)
which is again convex and is easily solved to get the optimal solution. By a similar change ofvariables as before,h=W†(a−y) = a−W†y, a=W†a, we get
miny
‖y‖1+λ‖a−W†y‖22. (17)
Rewriting this, we get
miny
12‖a−W†y‖2
2+ λ‖y‖1, (18)
λwhere = 1/2λ . This is also a simple Lasso problem, which makes the online foreground detec-tion procedure relatively fast.
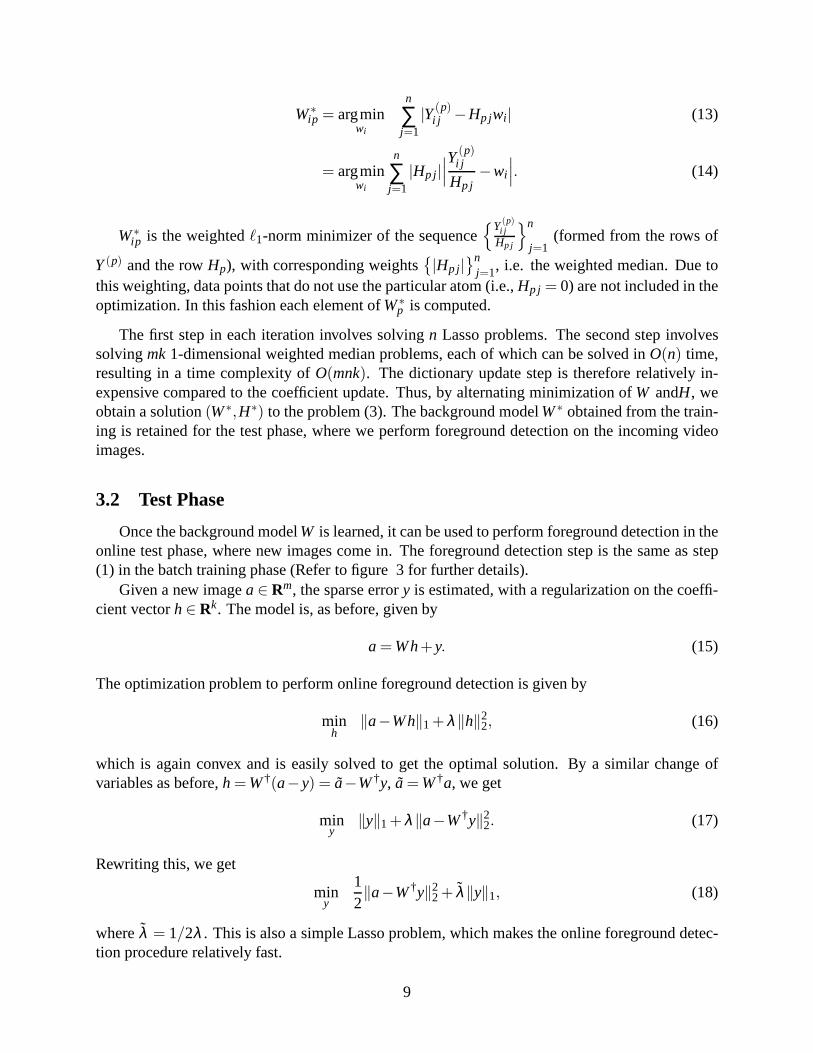
9
Given : A new image framea ∈ Rm, regularization parameterλ , learned backgroundmodelW (W†)
• Computea=W† ˜a andλ = 1/2λ .
• Use Lasso, or any other sparse coding algorithm, to computey m∈ R
1λmin ‖a−W†y 2‖2+ ‖y‖1.
y 2
• Computeh= a W†− y.
From the sparse errory= a−Wh, obtain the foreground ase= |y|.
Figure 3: Foreground detection algorithm for online test phase.
The foreground detection step can operate at a speed of∼ 20–25 frames per second on a120× 160 pixel grayscale image, with an optimized LARS implementation [36]. Further, thereis an extensive body of research on adapting the Lasso algorithm for directly or approximatelysolving large-scale problems efficiently, which our method can benefit from. The Sparse ModelingSoftware C++ toolbox, using the MatLAB mex-file interface was used to carry out the trainingprocess as summarized in figure 2 using a Lassoℓ1 minimization solver [37]. The same librarywas then used for estimating the foreground as summarized in figure 3. A selected foregrounderror threshold value|y| ≥ 0.5 (the intensity range between 0 and 1), provided consistent resultsfor our experiments. For our tests we utilizedn= 50 training images randomly selected from thefirst minute of video, with a dictionary size ofk= 10 atoms with row sizem equal to1 the video2image size (360×240). Since the error term,Y is expressed during the dictionary learning phase,the foreground pedestrian detection is also accomplished during this step (if such an event occurs).
3.3 Online Adaptation
An important characteristic for any background subtraction algorithm is the ability to adapt togradually changing scenes due to for example, changes in sunlight. It should also recover quicklyin cases of more sudden changes in lighting. We outline below the process of adapting the learnedbackground model during the test phase. Since our method fits a linear model to the incomingframe, the coefficientsh would appropriately scale up or down the brightness of the model to fitthe image illumination, in order to handle gradual global illumination changes. At the same time,we wish to ensure that pedestrian events remain as salient foreground errors.
For every incoming framea, we obtain the corresponding coefficient vectorh and the sparseerror y as part of the foreground detection step. We treat the training setA as a first-in-first-outqueue and push in a new frame aftert test images from the video. The training data matrix and thecorresponding coefficient matrix become
Anew= [ A2 . . .An a ] Hnew= [ H2 . . .Hn h ] . (19)
10
We then run one iteration of step (2) of the training phase (givenH update modelW), which is arelatively inexpensive computation and in our case, done infrequently.
As discussed in [12], the algorithm benefits from an arrival rate 1/t for updating the dictionaryW to randomly vary throughout time, rather than be held constant. A Poisson random variablewith the mean arrival rate 1/t was implemented to model the random variation gradual backgroundchanges of the scene occurring at random periods,t ≥ 0 (if t = 0 another random period selectionis generated). The shortest time between updates can be estimated if the distribution of pedestrianwait times were knowna priori. If pedestrian is waiting at the curb line for an extended period oftime, t should be selected such that incoming frames would rarely capture this state, in order toavoid ’learning’ the pedestrian as background information. The study in [9] provides one way toestimate such wait delays. Without going into great detail, a probabilistic log-regression model wasderived from empirical observations to predict average pedestrian crossing delay,dp at roundaboutsexpressed as the following:
dp =−0.78−14.99· ln(Pcross) (20)
where,Pcross, the probability of crossing is computed by:
Pcross= P(YENC) ·P(GO|Yield)+P(CGENC) ·P(GO|CG) (21)
where,P(YENC) =probability of encountering a yielding vehicleP(GO|Yield) =probability of utilizing a yielding vehicleP(CGENC) =probability of encountering a sufficient crossing critical gap,≥ TCG
P(GO|CG) =probability of of utilizing a sufficient crossing gap≥ TCG
As noted in [9], an estimate ofP(CGENC) can be computed assuming hourly traffic volumesare Poisson distributed. Furthermore, the critical crossing gap time,TCG can be estimated fromHighway Capacity Manual using the crosswalk length,Lcw, pedestrian walking speed,Swalk, anda pedestrian start-up delay,Td [38]. Neither the hourly traffic volume counts or Origin/Destinationturning ratios were available for the intersections. From the average daily traffic volumes wespread out between 6AM and 6PM (12 hours) associated with the road crossings tested herein.In addition we hypothesize utilization; for blind subjects utilization was significantly lower thansighted individuals (a good fit was obtained forP(GO|CG) =P(GO|Yield)≈ 50%. Sighted indi-viduals will be considerable higher; suppose we choose utilization levels of 80% forP(GO|Yield)andP(GO|CG), with drivers yielding 30% of the time. Then, for Minnehaha following averagepedestrian wait delay time can then be estimated as:
THW =3600sec./hr
333vph= 10.8sec./veh
TCG =Lcw
Swalk+Td =
14f t.3.5 f t./sec.
+2sec.≈ 6.0 sec.
P(CGENC) = P(headway≥ TCG) = e−
TCG
THW = 0.573
then based on the latter utilization assumptions , using equation 20 results in:
11

dp =−0.78−14.99· ln(0.8 ·0.573+0.8 ·0.3)= 4.6 sec.
A similar calculation (assuming similar utilization characteristics) for the Portland intersectionroundabout will yield:
THW =3600sec./hr
670vph= 5.37sec
TCG =Lcw
Swalk+Td =
23f t.3.5 f t./sec.
+2sec.≈ 8.57
P(CGENC) = P(headway≥ TCG) = e−
TCG
THW =
./veh
sec.
0.20
with an average delay of:
dp =−0.78−14.99· ln(0.8 ·0.2+0.8 ·0.3)= 13 sec.
The analysis gives some general insights on a minimumt frame interval to ensure reliableforeground detection. A reasonable arrival rate value which reflects twice the amount of timesin the above calculations could serve as a minimum boundary ( 10 seconds to 30 seconds). Forour experiments the Poisson arrival parameters was set to 5 minutes with pedestrian detection ratesabove 90%. To test algorithm sensitivity, future experiments could diminish the arrival rates, basedon the pedestrian event rate detection to set the lower boundaries as done above. This implies anadaptive feedback loop for setting minimumt inter-frame arrival times for updating the dictionary,W.
3.4 Pedestrian Event Characterization
Once foreground objects were extracted, tracking is performed to track the progression of ve-hicles within the oncoming traffic region-of-interests, and the pedestrian interactions within thecrosswalk region of interest. After the foreground binary image is obtained, a sequence morpho-logical erosion and dilation operations are performed to filter the noise and fill holes in the blobs.Very small regions are removed by erosion and dilation using a 3×3pixel structured rectangularelement, while aggregating blobs are completed by dilation and then erosion using a 15×15pixelstructured rectangular element. The structured elements sizes were determined empirically. A dis-crete Kalman filter-based predictive tracking algorithm was implemented using the Matlab visiontoolbox. The association of detection to the same object is based completely on motion state. Themotion of each foreground object track is estimated by the Kalman filter, which then predicts thetrack’s location in each frame and is used to determine the likelihood of any given detection beingassigned to an existing track. The measurement state vectorXj , used for the predicted centroid ofblob j, is based on pixel position and velocity, e.g.
Xj = [x,y, x, y[tj (22)
with the state transition prediction,X∗j , with the state matrix,A, at framen defined by:
12

X∗j ,n = A ·Xj ,n−1
=
1 0 1 00 1 0 10 0 1 00 0 0 1
·Xj ,n−1
(23)
The observation measurement update,Z computed directly from the observed blob centroid,Xj :
Z = H ·Xj
=
[
1 0 0 00 1 0 0
]
·Xj(24)
and the initial constant process noise covariance,Q, error covarianceP0, and constant observa-tion measurement noise covariance,R, given as:
P0 =
σ2xx 0 · · · 0
0 σ2yy
...... σ2
xx...
0 · · · · · · σ2yy
Q=
q2xx 0 · · · 0
0 q2yy
...... q2
xx...
0 · · · · · · q2yy
R=
ρ2xx 0 · · · 0
0 ρ2yy
...... 0
...0 · · · · · · 0
σ2xx = σ2
yy = 200 pixels2, σ2xx = σ2
yy = 50 (pixel/ f rame)2,
q2xx = q2
yy = 100 pixels2, q2xx = q2
yy = 25s(pixel/ f rame)2,ρ2xx= ρ2
yy = 100 pixels2.
(25)
where
and
Equations (23), (24), and (25) are then used to obtain predictions to the error covariance andstate described in equation (23) for each blob centroid stateXj :
P∗n = APn−1AT +Q (26)
and measurement state and covariance updates for each blob centroidXj , to the Kalman gain,Kn, a posteriorierror,y j ,n, using a standard discrete Kalman filter:
13

y j ,n = Z j ,n−HX∗j ,n
Kn = P∗nHT(HP∗HT +R)−1
Xj ,n = X∗j ,n+Kny j ,n
Pn = (I −KnH)P∗k
(27a)
(27b)
(27c)
(27d)
When tracks become lost (for example if a pedestrian walks behind another pedestrian) theKalman filter prediction steps in (26) and (23) are used to maintain the trajectory of the object.For every time step a cost matrix of sizeMtracks×Ndetectionsis computed based on the Eu-clidean distance between the Kalman predicted track centroid and the detection. A minimum totalcost assignment calculation between theM tracks andN detections was done using Munkres’ As-signment Algorithm. The cost for not assigning a track (maximum cutoff) is set experimentallybased on expected deviations from motion and pixel noise. A very small value caused the tracks toquickly get lost, while large values tended to force blobs which touch each other (such as multiplepedestrians) to merge; however casual observations of the data indicated the propensity for groupsof people to walk close together, and were hard to differentiate with blobs at such a long distancefrom the camera over different maximum cost cutoff values; 12 pixels produced consistent resultsacross the videos we tested.
When a foreground object (such as a pedestrian reappears), the cost estimation assigns it to anew or existing track based on the minimum cost calculation previously discussed. Pedestriansare identified by the region of interest and tracking the blob area. If a tracked object remains inprediction mode to update position and velocity states with the (e.g., occluded or missing) for 10frames (about 1.25 seconds), then the track is lost. In the same an object must be visible for at least1 second before it is considered to be tracked.
The final step uses the region occupancy logic to decipher a.) vehicle presence, b.) vehiclepassed through the crosswalk while the pedestrian was in a waiting zone, and c.) pedestrian cross-ing and waiting times.
14

4 Experimental Testing And Data Reduction
Eight cameras were housed in a single dome enclosure, suspended approximately 35’ abovethe roadway surface using a trailer crank-up mast, to simultaneously monitor the entire circum-ference of the roundabout. The video data sets were collected on two roundabouts with differentlane geometries and different urban settings. The camera locations for the 66th and Portland Ave.Richfield site, the two lane roundabout intersection adjoining two urban arterials, were approxi-mately 100 ft. (30.5m) from the crosswalks. For the single-lane roundabout intersection, locatedat Minnehaha Parkway and Minnehaha Avenue, in Minneapolis, the cameras were actually locatedfurther from the crosswalk at approximately 120 ft. (36.7m). The trailer was deployed at the Rich-field site from August 7, 2010 until September 4, 2010, totaling 29 days. Recordings were madebetween 7 AM and 9 PM daily. A commercial DVR recorded compressed, proprietary H.264 mpegvideo at 7 fps (variable bit rate at approximately 1 mbps), full 720x480 NTSC video, which wastranscoded into Microsoft AVI files in open standard Xvid (www.xvid.org) MPEG4 format.Thedata separated into 1 hour chunks, represented within the files.
The same video collection set up was followed for the data collection at the Minneapolis round-about. The trailer was deployed September 18, 2010 and remained in this location until October 11,2010. Recording was scheduled between 5 AM to 8 PM daily. The authors noted that not all videocould be manually analyzed due to time and cost constraints but nevertheless 4,730 pedestriancrossing and 7,302 bicycle crossing events were tabulated from 4cameras× 15hours× 16days×2sites= 1,920hours. Further details on the experimental apparatus and sites can be found in [11].
Table 1 summarizes a subset of video data containing pedestrian events were used from [11].In accordance to the original aim of the study, our objective was to find a reasonable subsampleof the data which balanced at-large total pedestrian events with pedestrian-vehicle interactions,and different environmental conditions. This was achieved by building a database using all theground-truthed data, to associate every event back to the original recording files, and times relativeto sunset (if past noon) or sunrise (if before noon). We then searched the database to sort the top12 video sets to meet aforementioned objective. Due to time limitations, 6 of these were used forthe study.
Table 1: Video data selected for analysis
Intersection Video File Total events Ped.-veh. events100926-ch04-161018-171018 205 14
Minnehaha100926-ch02-151018-161018100926-ch04-151018-161018
126162
1414
100919-ch02-150646-160646 137 27
Portland100820-ch01-110415-120415100817-ch01-140400-150400
1112
89
As mentioned previously, Matlab was utilized as the primary interface to implement the ap-proach. For this study, the Dictionary on-line learning and training phases were done separately,with the resulting video stored for subsequent processing. Figures 4 and 5 illustrates the steps andresulting processed object tracks used for the event measurements.
15

(a) (b) (c)
(d) (e) (f)Figure 4: The pedestrian event detection at the Minnehaha Roundabout, inputs: (a) raw videostream, (b) pedestrian crossing and vehicle detection ROI, (c) pedestrian yield ROI; image pro-cessing steps: (d) Foreground dictionary result, (e) thresholding=0.5, and (f) blob-based objecttracking
(a) (b) (c)
(d) (e) (f)Figure 5: The pedestrian event detection at the Portland Roundabout, inputs: (a) raw video stream,(b) pedestrian crossing and vehicle detection ROI, (c) pedestrian yield ROI; image processingsteps: (d) Foreground dictionary result, (e) thresholding=0.5, and (f) blob-based object tracking
16
5 Results
The results will be presented separately for the two roundabouts. The ground-truthed data asdescribed in chapter 4 were reviewed by manual observation to compare our results. We would notexpect the onset (arrival) times between the human observed ground-truthed events and computervision detection events to align exactly. The first level of analysis is pedestrian detection sensitivityand accuracy. Then, we drill down logically to determine if traffic was present during the crossingevent, and if the vehicle yielded. Pedestrian crossing delays were then analyzed. As discussedearlier in the report, the latter two characterizations are useful parameters to aid in understandingaccessibility and utilization of the intersection. Initially we attempted to quantify the number ofpedestrians crossing with blob tracking but they frequently blended together. We also attempted toutilize a HOG appearance (Histogram of Oriented Gradients) tracker by [39] but were unsuccessfuldue to insufficient pixel areas to obtain a robust set of HOG features.
5.1 Minnehaha Intersection
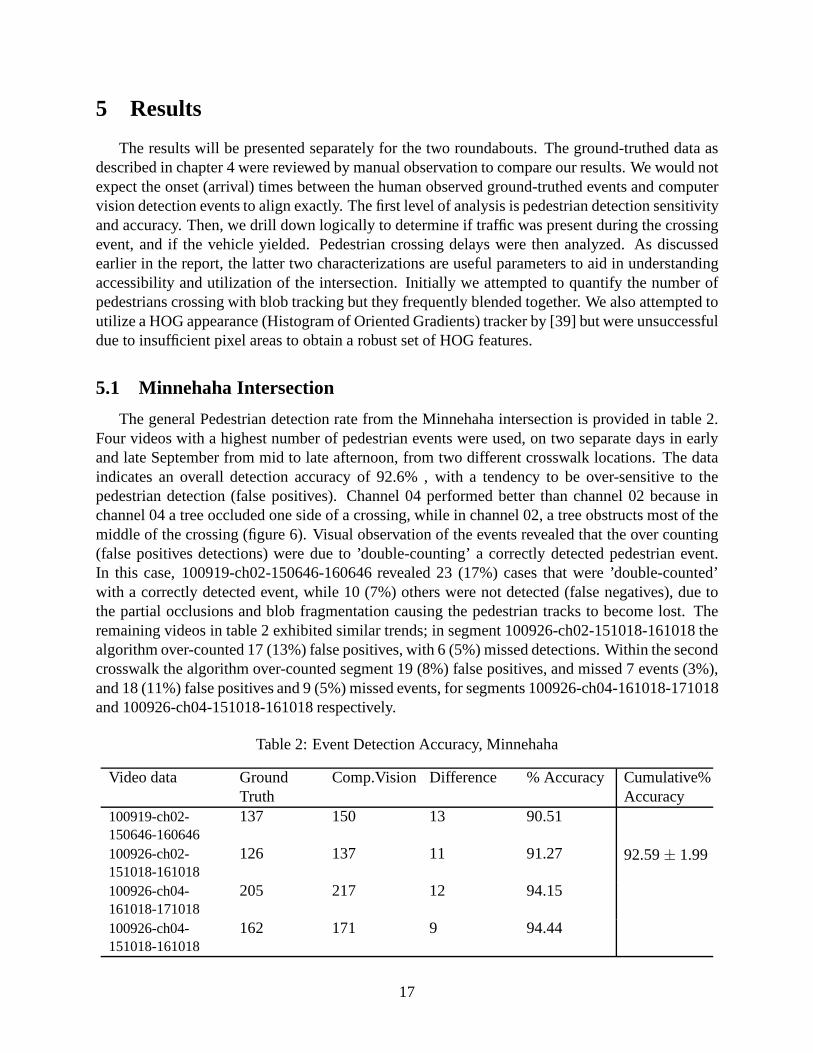
The general Pedestrian detection rate from the Minnehaha intersection is provided in table 2.Four videos with a highest number of pedestrian events were used, on two separate days in earlyand late September from mid to late afternoon, from two different crosswalk locations. The dataindicates an overall detection accuracy of 92.6% , with a tendency to be over-sensitive to thepedestrian detection (false positives). Channel 04 performed better than channel 02 because inchannel 04 a tree occluded one side of a crossing, while in channel 02, a tree obstructs most of themiddle of the crossing (figure 6). Visual observation of the events revealed that the over counting(false positives detections) were due to ’double-counting’ a correctly detected pedestrian event.In this case, 100919-ch02-150646-160646 revealed 23 (17%) cases that were ’double-counted’with a correctly detected event, while 10 (7%) others were not detected (false negatives), due tothe partial occlusions and blob fragmentation causing the pedestrian tracks to become lost. Theremaining videos in table 2 exhibited similar trends; in segment 100926-ch02-151018-161018 thealgorithm over-counted 17 (13%) false positives, with 6 (5%) missed detections. Within the secondcrosswalk the algorithm over-counted segment 19 (8%) false positives, and missed 7 events (3%),and 18 (11%) false positives and 9 (5%) missed events, for segments 100926-ch04-161018-171018and 100926-ch04-151018-161018 respectively.
Table 2: Event Detection Accuracy, Minnehaha
Video data Ground Comp.Vision Difference % Accuracy Cumulative%Truth Accuracy
100919-ch02- 137 150 13 90.51150646-160646100926-ch02- 126 137 11 91.27 92.59± 1.99151018-161018100926-ch04- 205 217 12 94.15161018-171018100926-ch04- 162 171 9 94.44151018-161018
17

For examining yield and traffic interactions for the detected pedestrian events, video 100919-ch02-150646-160646 was examined. Of the 137 ground-truthed event observations, 19 of themhad no traffic. Of the aforementioned 10 missed pedestrian crossing event detections, 2 werewithout any traffic. The algorithm detected 127 events correctly, with 15 of them having no trafficinteractions, and the remaining 112 with traffic interactions. For the 23 aforementioned ’over-detected’ events, 5 of them were observed with traffic but were classified as containing no traffic,and another 9 were observed with traffic and classified as such. Table 4 summarizes only thecomparison with the correctly detected pedestrian events, without considering the ’double-counts’.Table 3 indicates robust event classification for these cases with a miss classification rate of lessthan 2%.
Table 3: Truth table for Minnehaha traffic detection
Observed Ground Truthtraffic no traffic
100919-ch02-150646-160646traffic 110 2
Comp. Visionno traffic 0 15
100926-ch02-151018-161018traffic 105 1
Comp. Visionno traffic 0 14
100926-ch04-161018-171018traffic 146 2
Comp. Visionno traffic 1 49
100926-ch04-151018-161018traffic 85 0
Comp. Visionno traffic 0 68
(a) Channel 04 Crosswalk (b) Channel 02 Crosswalk
Figure 6: The trees created problems breaking up blobs associated with pedestrians utilizing theMinnehaha Roundabout crosswalks.
18

With the properly detected data, the algorithm is used to characterize the order which vehiclesyielded using the aforementioned tracks and ROI to determine the arrival time and presence ofthe pedestrian and vehicles to assess event detection accuracy as indicated in the truth table, 4.For example, with the first video segment in table (2) there were 27 pedestrian-yielded eventsand 91 vehicled-yielded events within the video. Within 8 missed detected events with the trafficinteraction, 6 of them were pedestrian-yielded events with a single pedestrian, with the remaining 2classified as vehicle-yielded events. For the remaining of the 21 pedestrian-yielded events, 19 wereclassified correctly, setting a 3 second (21 frames) threshold. Note that the other 2 events were notconsidered as vehicle-yielded events by the detection algorithm since the pedestrian waited lessthan 3 seconds during the pedestrian-yield cases. The results from the other three video segmentsin table 2 indicated similar trends with the aforementioned yield wait time threshold. To concludethere appears to be subjective variability in the ground truth data which cannot be duplicated bythe algorithm which by definition must determine a fixed criteria for this event categorization.
Table 4: Truth table for Minnehaha yielding detection
Observed Ground TruthNot classified
Vehicle yielded Ped. yielded100919-ch02-150646-160646
Vehicle yielded 3 86 0Comp. Vision
Ped. yielded 2 0 19
100926-ch02-151018-161018Vehicle yielded 3 91 0
Comp. VisionPed. yielded 1 0 10
100926-ch04-161018-171018Vehicle yielded 5 129 0
Comp. VisionPed. yielded 2 0 11
100926-ch04-151018-161018Vehicle yielded 4 69 0
Comp. VisionPed. yielded 4 0 8
Lastly for the aforementioned pedestrian-yield events an approximate waiting time delay iscomputed. The activity ROIs were used to parse wait time at the curb (or island) and the crossingtimes for Minnehaha (table 5 and Portland 9). Unfortunately, the ground-truthed data were notdone to do a valid comparison (a smaller subset of the videos were manually analyzed regardingthese data). The somewhat broad range in crossing times was due to the fact that some pedestrianswere on bicycles and thus the crossing time is reduced compared to walkers. Although we cannotgeneralize too much from these data, it is interesting to note that even the wait times for pedestrian-yeilds would be less than a signal phase cycle, which could be at least 30 seconds (for example 1/2of 60 second cycle, and so on) if this intersection were signalized.
19
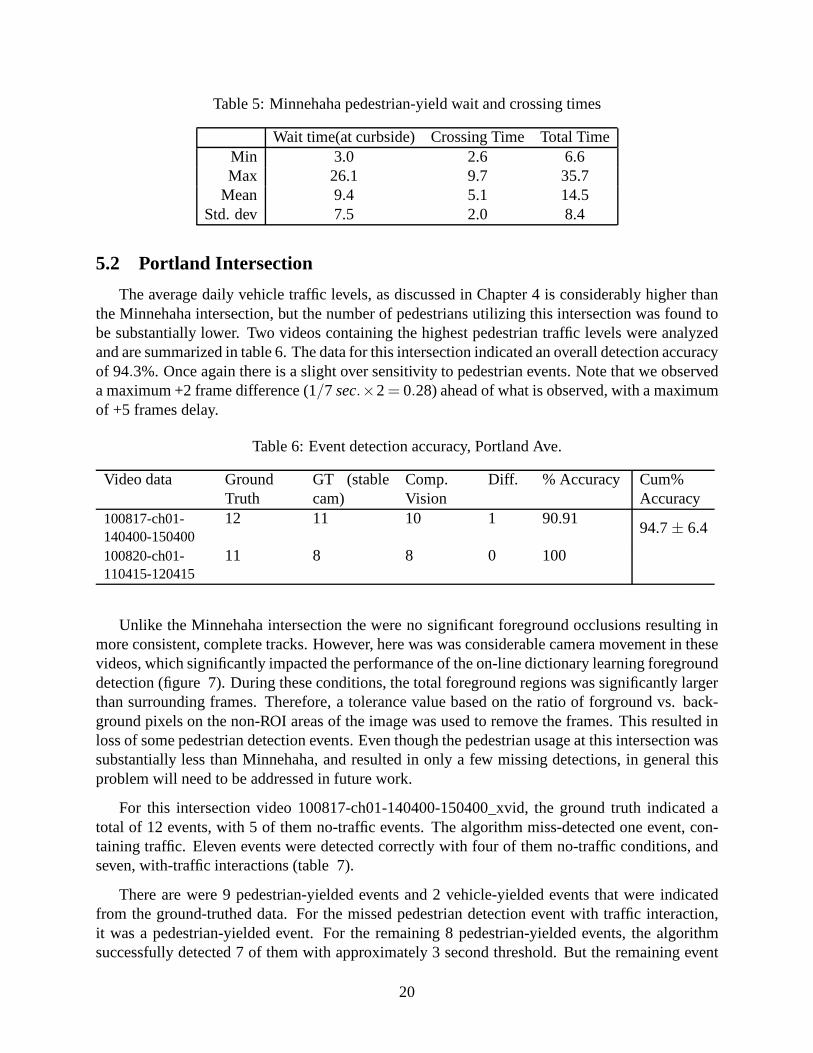
Table 5: Minnehaha pedestrian-yield wait and crossing times
Wait time(at curbside) Crossing Time Total TimeMin 3.0 2.6 6.6Max 26.1 9.7 35.7
Mean 9.4 5.1 14.5Std. dev 7.5 2.0 8.4
5.2 Portland Intersection
The average daily vehicle traffic levels, as discussed in Chapter 4 is considerably higher thanthe Minnehaha intersection, but the number of pedestrians utilizing this intersection was found tobe substantially lower. Two videos containing the highest pedestrian traffic levels were analyzedand are summarized in table 6. The data for this intersection indicated an overall detection accuracyof 94.3%. Once again there is a slight over sensitivity to pedestrian events. Note that we observeda maximum +2 frame difference (1/7 sec.×2= 0.28) ahead of what is observed, with a maximumof +5 frames delay.
Table 6: Event detection accuracy, Portland Ave.
Video data Ground GT (stable Comp. Diff. % Accuracy Cum%Truth cam) Vision Accuracy
100817-ch01-140400-150400
12 11 10 1 90.9194.7± 6.4
100820-ch01- 11 8 8 0 100110415-120415
Unlike the Minnehaha intersection the were no significant foreground occlusions resulting inmore consistent, complete tracks. However, here was was considerable camera movement in thesevideos, which significantly impacted the performance of the on-line dictionary learning foregrounddetection (figure 7). During these conditions, the total foreground regions was significantly largerthan surrounding frames. Therefore, a tolerance value based on the ratio of forground vs. back-ground pixels on the non-ROI areas of the image was used to remove the frames. This resulted inloss of some pedestrian detection events. Even though the pedestrian usage at this intersection wassubstantially less than Minnehaha, and resulted in only a few missing detections, in general thisproblem will need to be addressed in future work.
For this intersection video 100817-ch01-140400-150400_xvid, the ground truth indicated atotal of 12 events, with 5 of them no-traffic events. The algorithm miss-detected one event, con-taining traffic. Eleven events were detected correctly with four of them no-traffic conditions, andseven, with-traffic interactions (table 7).
There are were 9 pedestrian-yielded events and 2 vehicle-yielded events that were indicatedfrom the ground-truthed data. For the missed pedestrian detection event with traffic interaction,it was a pedestrian-yielded event. For the remaining 8 pedestrian-yielded events, the algorithmsuccessfully detected 7 of them with approximately 3 second threshold. But the remaining event
20

Table 7: Truth table for Portland Ave. traffic detection
000817-ch01-140400-150400 Observed Ground Truthtraffic no traffic
traffic 6 1Comp. Vision
no traffic 0 4
was not considered in the ground-truth data as a vehicle-yielded event when the pedestrian waitedless than 3 seconds and a vehicle passed through. The 3 vehicle yielded events were detectedcorrectly (table 8).
Table 8: Truth table for Portland yielding detection
000817-ch01-140400-150400 Observed Ground TruthNot classified
Vehicle yielded Ped. yieldedVehicle yielded 0 2 0
Comp. VisionPed. yielded 1 0 7
(a) (b)
(c) (d)
Figure 7: Failed background subtraction. (7a and 7b the raw and thresholded result); Normalbackground subtraction (7c and 7d the raw and thresholded result)
21

The waiting and pedestrian crossing times for pedestrians shown in 9) generated longer waittimes for yielding pedestrians than Minnehaha. With two lanes, and a larger refuge island thatwas not occluded, it was possible to extract both crossing legs times. As in the case of the Min-nehaha intersection, there were no independently ground-truthed data to use for comparison. Onceagain, with so few samples analyzed one cannot substantiate any claims to pedestrian utility atthis intersection. It is interesting to note however, longer yielding wait times for pedestrians thanthe Minnehaha intersection. This generally corroborates with [11]. Also, the crossing times aregenerally longer which is to be expected due to the fact that this is a two lane roundabout.
Table 9: Portland pedestrian-yield wait and crossing times
Wait time(at curbside) Wait time (at Island) Crossing Time Total TimeMin (sec.) 6.1 3.9 6.6 15.6Max (sec.) 28.4 33.9 12.0 64.0
Mean (sec.) 28.0 12.7 10.3 31.6Std. dev. (Sec.) 10.5 11.5 2.1 16.7
22
6 Conclusions
We tested the feasibility of integrating a novel foreground detection scheme into a tool for ex-tracting pedestrian crossing events. The variability from ground-truthed data are partially due tosubjective variability in manual observations and criteria set forth in our methodology. The ap-proach was generally robust to small changes in the background and noise in the video. Largecamera shifts due to the cameras being hoisted on a crank-up mast and windy conditions couldnot be mitigated with the technique. The investigation focused on such events at urban roundaboutintersections, but the same methodology can be applied at other intersections as well. We posit thatthe methodology could be extended, as part of a roadside sensing system, for real-time pedestrianevent detection for driver warning systems at critical intersections, for example. The basis of de-tecting pedestrian activity relies on building sparse dictionaries that are robust to natural changesin lighting and other natural environmental affects associated with outdoor sensing. For studies orsystems that require long-term deployments and continual, round-the-clock detection, such dictio-naries could first be learned for example over a 24-hour period, hashed with respect to time-of-day,and normalized for sunrise and sunset times, to accommodate general trends in lighting. For thepedestrian events detected, it was not necessary to conduct homography calibration to map imagecoordinates to the road and crosswalk plane.
The study indicated that the approach performed satisfactorily. The classification rates are suit-able for data mining purposes for video-based observational studies (above 90% for the detectionmeasurements and characterizations we considered). Many of the detection error problems arosefrom foreground occlusions (tree foliage at one intersection), which could be avoided by placingthe camera in a different location to avoid it). As noted at the beginning of the report, the orig-inal video data collection was designed for manual observation specifically without consideringoptimal placement for computer vision tracking tasks.
A future direction to this work is to extend the tool to different intersection designs. A GraphicUser Interface could be designed to allow the user to steer pedestrian event classifications for theintersection under study. For example, [40] broke down right-turn permitted and protected vehicle-pedestrian yielding behaviors, on mainline crosswalks; appropriate regions of interests could beentered by the users, as well as categories to define the pedestrian events (vehicle vs. pedestrianyielding, pedestrian wait-time and crossing time, alone vs. groups, and so on). The tool canbe extended to extract pedestrian crossing gap acceptance as done by in-situ manual observationas in [9, 10, 31], to assess probabilistic crossing delays and potentially risky pedestrian crossingbehaviors.
Finally, computational efficiency can be improved with this approach. The learning and updateprocess involve calculations that wereO[mkn]. For a robust real-time monitoring application, thedictionary updates can be performed as an occasional background process as opposed to runningin sequence with the processing steps.
The output characterization and identification of pedestrian events from the tool complimentthe accessibility and general safety Measures Of Effectiveness (MOEs) - crossing gap acceptance,wait times, and yeilding order – as presented above in [31], [9], [11] and [10]– none of whichrequire accurate extrinsic and intrinsic camera calibration.
23

24
References
[1] Traffic Safety Facts 2003: A Compilation of Motor Vehicle Crash Data from the Fatality Anal-ysis Reporting System and the General Estimates System. Technical report, National HighwayTraffic Safety Administration, U.S. Department of Transportation, Washington D.C., 2004.
[2] Umesh Shankar.Pedestrian Roadway Fatalities. Technical report, National Center for Statis-tics and Analysis, FHWA, U.S. Department of Transportation, Wash. D.C., 2003.
[3] National Highway Transportation Safety Administration. NSCA data resource website:Fatality Analysis Reporting System (FARS) Encyclopedia. http://www-fars.nhtsa.dot.gov,1999. (accessed Jan 2013).
[4] Minnesota DOT. MN Complete Streets, sec 52,174.75. http://www.dot.state.mn.us/planning/completestreets/legislation.html, 2010.(Jan 2013).
[5] Bill Baranowski. Roundabouts USA. http://www.roundaboutsusa.com/history.html, 1999.(accessed Dec 2012).
[6] B. N. Persaud, R. A. Retting, P. E. Garder, and D. Lord. "safety effect of roundabout conver-sions in the united states: Empirical bayes observational before-after study".TransportationResearch Record, (1751):1– 8, 2001.
[7] S. Eisenman, J. Josselyn, G. List, B. Persaud, B. Robinson C. Lyon, E. Waltman M. Blogg,and R. Troutbeck.Operational and Safety Performance of Modern Roundabouts and OtherIntersection Types. Technical report, New York State Department of Transportation, 2004.
[8] Vaughan W. Inman, Gregory W. Davis, and Dona Sauerburger. "Roundabout Access forVisually Impaired Pedestrians: Evaluation of a Yielding Vehicle Alerting System for Double-Lane Roundabouts". InNational Roundabout Conference 2005 Proceedings, Vail, Colorado,May 22- 25 2005.
[9] Bastian J. Schroeder and Nagui M. Rouphail. "Mixed-Priority Pedestrian Delay Models atSingle-Lane Roundabouts".Transportation Research Record, (2182):129–138, 2010.
[10] David A. Guth, Richard G. Long, Robert S. Wall Emerson, Paul E. Ponchillia, and Daniel H.Ashmead. "Blind and Sighted Pedestrians’ Road-Crossing Judgments at a Single-LaneRoundabout".Human Factors, Sept 2012.
[11] John Hourdos, Veronica Richfield, and Melissa Shauer.Investigation of Pedestrian/BicyclistRisk in Minnesota Roundabout Crossings. Technical report, Minnesota Department of Trans-portation, St. Paul, MN, Sept. 2012.
[12] R. Sivalingam, A. D’Souza, M. Bazakos, R. Miezianko, V. Morellas, and N. Papanikolopou-los. "Dictionary Learning For Robust Background Modeling". InRobotics and Automation(ICRA), 2011 IEEE International Conference, Shanghai, China, 2011.
25
[13] Tarak Gandhi and Mohan Manubhai Trivedi. "Pedestrian Protection Systems: Issues, Survey,and Challenges".IEEE Transactions On Intelligent Transportation Systems, 8(3):413– 430,2007.
[14] R. Hosie, S. Venkatesh, and G. West. "Detecting Deviations From Known Paths And SpeedsIn A Surveillance Situation". InProc. of the Fourth International Conference on Control,Automation, Robotics and Vision, pages 3–6, Singapore, Dec. 1996.
[15] B. Heisele and C. Wohler. "Motion-Based Recognition of Pedestrians". InProc. of theFourteenth International Conference on Pattern Recognition, pages 1325–1330, Brisbane,Australia, August 1998.
[16] Osama Masoud and N. Papanikolopoulos.Pedestrian Control At Intersections: Phase IV,Final Report. Technical report, Minnesota Department of Transportation, Saint Paul, MN,2000.
[17] B. Maurin, O. Masoud, S. Rogers, and N. Papanikolopoulos.Pedestrian Control Issues AtBusy Intersections And Monitoring Large Crowds. Technical report, Minnesota Departmentof Transportation, St. Paul, MN, March 2002.
[18] Harini Veeraraghavan, Osama Masoud, and Nikolaos P. Papanikolopoulos. "Computer VisionAlgorithms for Intersection Monitoring".IEEE Transactions On Intelligent TransportationSystems, 4(2):78–89, 2003.
[19] C. Stauffer and W. Grimson. "Adaptive Background Mixture Models For Real-Time Track-ing". In IEEE Computer Society Conference on Computer Vision and Pattern Recognition,page 252, Fort Collins, Colorado, June 23 - 25 1999.
[20] C. Wren, A. Azarbayejani, T. Darrell, and A. Pentland. "Pfinder: Realtime Tracking Of TheHuman Body".IEEE Transactions on Pattern Analysis and Machine Intelligence, 19(7):780–785, 1997.
[21] David R. P. Gibson, Bo Ling, Michael Zeifman, Shaoqiang Dong, and Uma Venkataraman."Multipedestrian Tracking".Public Roads, 69(5), Mar-Apr 2006.
[22] Thomas J. Smith, Curtis Hammond, Guruprasad Somasundaram, and Nikolaos Pa-panikolopoulos.Warning Efficacy of Active Versus Passive Warnings for Unsignalized In-tersection and Mid-Block Pedestrian Crosswalks. Technical report, Minnesota Departmentof Transportation, St. Paul, MN, 2009.
[23] O. Masoud and N. Papanikolopoulos. "Using Geometric Primitives to Calibrate TrafficScenes". InProc. of the 2004 IEEE/RJS International Conference on Intelligent Robots andSystems, pages 1878– 1883, Sendai, Japan, 2004.
[24] G. Somasundaram, C. Hammond, T.J. Smith, and N. Papanikolopoulos. "A Vision-BasedSystem for Studying the Efficacy of Pedestrian Crosswalk Warnings". Poster Presentation,University of Minnesota Center for Transportation Studies Nineteenth Annual TransportationResearch Conference, Saint Paul, MN, May 2008.
26

[25] K. Ismail, T. Sayed, and N. Saunier. "Automated Analysis Of Pedestrian-Vehicle ConflictsUsing Video Data".Transportation Research Record, pages 44–54, 2009.
[26] K. Ismail, T. Sayed, and N. Saunier. "automated Analysis of Pedestrian-Vehicle Conflicts".Transportation Research Record: J. of the Transportation Research Board, (2198):52–64,2010.
[27] S. T. Birchfield. KLT: An Implementation of the Kanade-Lucas-Tomasi Feature Tracker.http://www.ces.clemson.edu/~stb/klt/, 2002. (accessed Jan 2013.)
[28] J. Shi and C. Tomasi. Good Features to Track. InProc. IEEE Conference on Computer Visionand Pattern Recognition, pages 593– 600, Seattle, Washington, June 21-23 1994.
[29] Chris Lee and M. Abdel-Aty. "Comprehensive Analysis Of Vehicle-Pedestrian Crashes AtIntersection In Florida".Accident Analysis & Prevention, 37(4):775–786, 2005.
[30] K. Ismail, T. Sayed, N. Saunier, and C. Lim. "Automated Analyisis Of Pedestrian-Vehicle Conflicts: Context For Before-And-After Studies".Transportation Research Record,(2198):52 – 64, 2010.
[31] KoSok Chae and N. Rouphail. "Emperical Study of Pedestrian-Vehicle Interactions in theVicinity of Single-Lane Roundabouts". InProc. Transportation Research Board AnnualMeeting, Washington D.C., January 13-17 2008.
[32] Volkan Cevher, Aswin Sankaranarayanan, Marco F. Duarte, Dikpal Reddy, Richard G. Bara-niuk, and Rama Chellappa. "Compressive Sensing for Background Subtraction". InECCV’08: Proceedings of the 10th European Conference on ComputerVision, pages 155–168, Mar-seille, France, 2008.
[33] M. Dikmen and T.S. Huang. "Robust Estimation of Foreground in Surveillance Videos bySparse Error Estimation". InProc. 19th International Conference on Pattern Recognition,2008, pages 1–4, Tampa, FL, 2008.
[34] James C. Bezdek and Richard J. Hathaway. "Some Notes on Alternating Optimization". InProc. of the 2002 AFSS International Conference on Fuzzy Systems, Calcutta, pages 288–300, London, UK, 2002.
[35] M. Aharon, M. Elad, and A. Bruckstein. "K-SVD: An Algorithm for Designing Overcom-plete Dictionaries for Sparse Representation".IEEE Transactions on Signal Processing,54(11):4311–4322, Nov. 2006.
[36] Bradley Efron, Trevor Hastie, Iain Johnstone, and Robert Tibshirani. "Least Angle Regres-sion". Annals of Statistics, 32(2):407–499, 2004.
[37] Willow Project. SPArse Modeling Software. http://spams-devel.gforge.inria.fr, 2007. (ac-cessed Dec 2012).
[38] Naugi M. Raouphail, Joseph E. Hummer, and Joseph S. Milazzo.Recommanded ProceduresChapter 13, "Pedestrians," of the Highway Capacity Manual. Technical report, Federal High-way Administration, US Department of Transportation, McLean, Virginia, 1998.
27

[39] H. Pirsiavash, D. Ramanan, and C. Fowlkes. "Globally-Optimal Greedy Algorithms forTracking a Variable Number of Objects". InComputer Vision and Pattern Recognition(CVPR) Colorado Springs, Colorado Springs, CO., June 2011.
[40] S. M. L. Hubbard, R. J. Awwad, and D. M. Bullock. Assessing the Impact of Turning Vehicleson Pedestrian Level of Service at Signalized Intersections.Transportation Research Record,(2027):27 – 36, 2007.
28


![[XLS]test.nhb.org.intest.nhb.org.in/Urban_Housing/4041 statutory Towns.xlsx · Web view502 802681 27 502 802682 27 503 802683 27 503 802684 27 503 802685 27 503 802686 27 503 802687](https://static.fdocuments.in/doc/165x107/5ab1742b7f8b9abc2f8cb599/xlstestnhborg-statutory-townsxlsxweb-view502-802681-27-502-802682-27-503-802683.jpg)