CSR LIMITED PRESENTATION 2014 For personal use only · CSR LIMITED 2014 RESULTS PRESENTATION | HALF...
12
CSR LIMITED 2014 RESULTS PRESENTATION | HALF YEAR ENDED 30 SEPTEMBER 2014 RESULTS PRESENTATION HALF YEAR ENDED 30 September 2014 CSR LIMITED PRESENTATION 2014 CSR LIMITED 2014 RESULTS PRESENTATION | HALF YEAR ENDED 30 SEPTEMBER 2014 Agenda 2 1. Overview – Rob Sindel Managing Director, CSR Limited 2. Group Financial Results – Greg Barnes CFO, CSR Limited 3. Business Unit Performance – Rob Sindel 4. Outlook – Rob Sindel For personal use only
Transcript of CSR LIMITED PRESENTATION 2014 For personal use only · CSR LIMITED 2014 RESULTS PRESENTATION | HALF...

CSR LIMITED 2014RESULTS PRESENTATION | HALF YEAR ENDED 30 SEPTEMBER 2014
RESULTSPRESENTATION
HALF YEAR ENDED
30 September 2014
CSR LIMITED PRESENTATION 2014
CSR LIMITED 2014RESULTS PRESENTATION | HALF YEAR ENDED 30 SEPTEMBER 2014
Agenda
2
1. Overview – Rob Sindel Managing Director, CSR Limited
2. Group Financial Results – Greg Barnes CFO, CSR Limited
3. Business Unit Performance – Rob Sindel
4. Outlook – Rob Sindel For
per
sona
l use
onl
y

CSR LIMITED 2014RESULTS PRESENTATION | HALF YEAR ENDED 30 SEPTEMBER 2014
1OVERVIEW
CSR LIMITED PRESENTATION 2014
CSR LIMITED 2014RESULTS PRESENTATION | HALF YEAR ENDED 30 SEPTEMBER 2014
Strong performance across the group
4
TRADINGREVENUE $1.0bn
15%
EBIT1
$114.1m
86%
NPAT1
$70.0m
72%
STATUTORY NET PROFIT $68.4m
48% 72%
DIVIDEND 8.5c
70%
EARNINGS PER SHARE1 13.9c
1 EBIT, net profit and earnings per share are all before significant items. They are non-IFRS measures and are used internally by management to assess the performance of the business and have been extracted or derived from CSR’s financial statements for the six months ended 30 September 2014. All comparisons are to the six months ended 30 September 2013 unless otherwise stated.
For
per
sona
l use
onl
y

CSR LIMITED 2014RESULTS PRESENTATION | HALF YEAR ENDED 30 SEPTEMBER 2014
Good progress on strategy
5
• 25% improvement in safety
• Viridian restructure on trackProtect and invest
• Integration of AFS on schedule
• Launched Gyprock Optimised CoreSmarter, faster, easier
• Permanent formwork
• Hebel walling and flooring
Adapting to changing lifestyles
• Martini integration on track
• Growth in Bradford Energy Solutions
Comfort and energy efficiency
• CSR Connect online portal upgrade
• Improvement in customer service metrics
Customers
CSR LIMITED 2014RESULTS PRESENTATION | HALF YEAR ENDED 30 SEPTEMBER 2014
2GROUP
FINANCIAL RESULTS
CSR LIMITED PRESENTATION 2014
For
per
sona
l use
onl
y

CSR LIMITED 2014RESULTS PRESENTATION | HALF YEAR ENDED 30 SEPTEMBER 2014
Financial results summary
7
Trading revenue of $1.0bn up 15%
– Higher volume and price
– GAF realised aluminium price up 8%
EBIT1 of $114.1m up 86%
– Improved margins and continued cost reductions
Effective tax rate of 29.2% (before sig items)
– Expect effective tax rate of around 28% for the full year
Significant items of $1.6m (after tax), primarily due to change in classification for discount unwind charge
Interim dividend of 8.5 cents unfranked – up 70%
1 All references are before significant items.
A$m (unless stated) HYES14 HYES13 change
Trading revenue 1,005.4 877.1 15%
EBITDA 1 152.9 100.0 53%
EBIT 1 114.1 61.3 86%
Net finance cost 1 (3.2) (4.1)
Tax expense 1 (32.4) (11.3)
Non-controlling interests (8.5) (5.3)
Net profit after tax 1 70.0 40.6 72%
Significant items (1.6) 5.5 (129%)
Statutory net profit after tax attributable to shareholders
68.4 46.1 48%
Earnings per share1 [cents] 13.9 8.1 72%
EPS (after significant items) [cents] 13.6 9.1 49%
Dividends per share [cents] 8.5 5.0 70%
CSR LIMITED 2014RESULTS PRESENTATION | HALF YEAR ENDED 30 SEPTEMBER 2014
EBIT improved across all divisions
8
Building Products
EBIT up 22%
Improvement across all key businesses
Continued focus on operational efficiencies and margin improvement
Viridian
Aluminium Property
Earnings slightly ahead of expectations
8% increase in realised aluminium price
Ingot premiums at record highs
Increased hedge book
Increase in EBIT following settlement of two major transactions
6.8
20.4
EBIT A$m
HYES13 HYES14
24.2
41.4EBIT A$m
HYES13 HYES14
22%
71% 200%
51.863.1
EBIT A$M
HYES13 HYES14
(10.6)
0.5
EBIT A$m
HYES13 HYES14
For
per
sona
l use
onl
y
CSR LIMITED 2014RESULTS PRESENTATION | HALF YEAR ENDED 30 SEPTEMBER 2014
15.112.6
13.7
10.8
HYES14 HYES13
Op capex Dev capex
Operating cash flow up by 98%
9
98% growth in operating cash flows (pre tax, asbestos and sig items)
– Largely due to earnings improvements
– Working capital management
Net Property cash inflows of $29.4m Include Chirnside Park and Pyrmont
Full year capex (ex Property) expected to be around ~$70m (excluding acquisitions) (~90% of depreciation)
Half year capital expenditure (ex Property)
74% of depreciation
A$m HYES14 HYES13
EBITDA 152.9 100.0
Net movement in working capital (7.6) (30.3)
(Profit)/loss on asset disposals (22.5) (5.8)
Movement in provisions/other 13.0 4.7
Operating cashflows (pre tax, asbestos & sig. items)
135.8 68.6
Asbestos payments (13.9) (15.3)
Tax paid (9.8) (6.9)
Significant items (15.1) (21.8)
Operating cashflows (post tax, asbestos & sig. items)
97.0 24.6
CSR LIMITED 2014RESULTS PRESENTATION | HALF YEAR ENDED 30 SEPTEMBER 2014
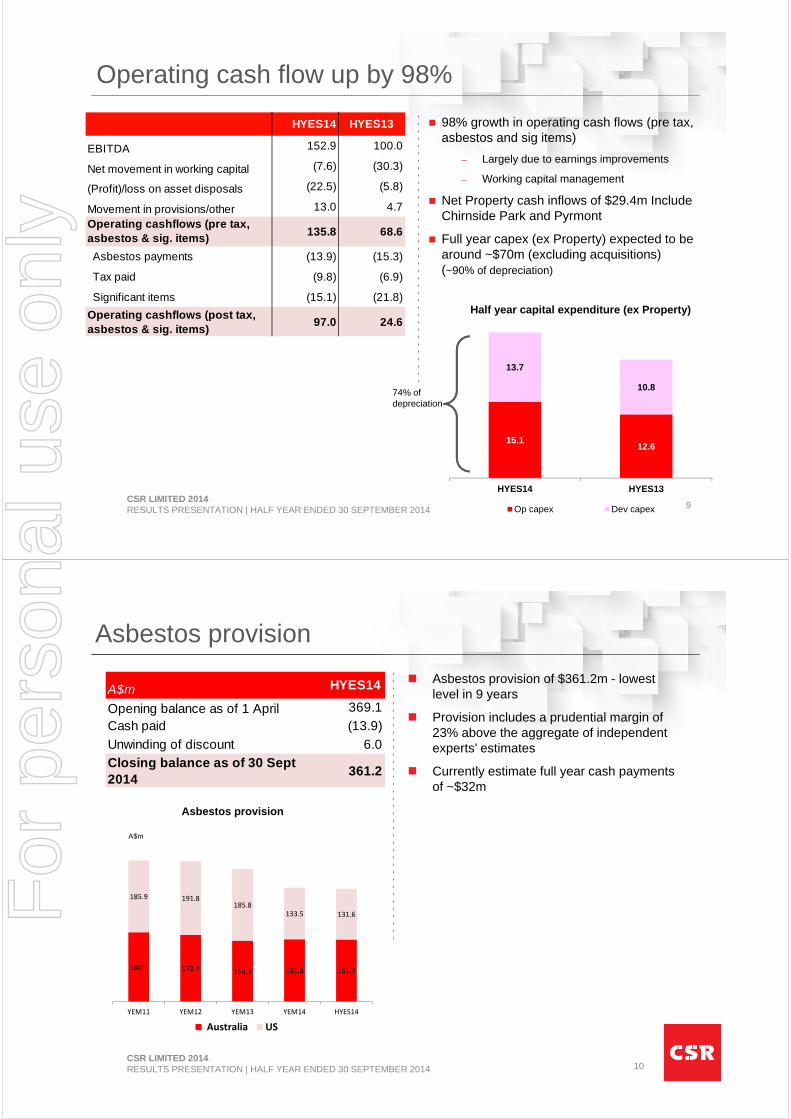
180.1 172.7 158.3 161.8 161.3
185.9 191.8185.8
133.5 131.6
YEM11 YEM12 YEM13 YEM14 HYES14
Australia US
10
Asbestos provision
Asbestos provision of $361.2m - lowest level in 9 years
Provision includes a prudential margin of 23% above the aggregate of independent experts’ estimates
Currently estimate full year cash payments of ~$32m
Asbestos provision
A$m
A$m HYES14
Opening balance as of 1 April 369.1
Cash paid (13.9)
Unwinding of discount 6.0
Closing balance as of 30 Sept 2014
361.2
For
per
sona
l use
onl
y

CSR LIMITED 2014RESULTS PRESENTATION | HALF YEAR ENDED 30 SEPTEMBER 2014
ROFE improving across the group
11
CSR Group Building Products
Viridian Aluminium
11.4
6.8 6.6
13.9
HYES11 HYES12 HYES13 HYES14
ROFE %
All ROFE calculations based on EBIT (before significant items) for the 12 months to 30 September divided by average net assets excluding tax, defined benefit liabilities, hedging and asbestos.
28.4
21.123.7
34.5
ROFE %
11.910.3 10.7
12.6
ROFE %
HYES11 HYES12 HYES13 HYES14
(1.4)
(5.7)
(12.5)
(2.1)
ROFE %
CSR LIMITED 2014RESULTS PRESENTATION | HALF YEAR ENDED 30 SEPTEMBER 2014
3BUSINESS UNIT PERFORMANCE
CSR LIMITED PRESENTATION 2014
For
per
sona
l use
onl
y

CSR LIMITED 2014RESULTS PRESENTATION | HALF YEAR ENDED 30 SEPTEMBER 2014
Residential construction activity leading the market
13
Australia – residential 1
Detached market showing steady growth in all markets up 12%
Multi-res continued strong growth up 21%
New Zealand – residential 3
Australia – A&A 2Australia – non-residential 2
NZ market up 29%
Led by Christchurch and growth in Auckland market
A&A remains flat held back by consumer confidence
Should improve with increased house prices and sales activity
Commercial/industrial activity up 5%
Social/institutional activity down 1%
45.2 50.6
34.141.3
HYES13 HYES14
6m starts000s
Multi Detached
79.391.9
17.8 18.3
A$bn
HYES13 HYES14
21%
1%
29%
3%
1. Source ABS data – (two quarter lag – six months to March)2. Source BIS Shrapnel forecast (value of work done – six months to Sept)3. Source Statistics New Zealand - (residential consents 2 quarter lag - six months to March)
12%
9.0
11.6
6m consents000s
HYES13 HYES14
3.58 3.61
A$bn
HYES13 HYES14
CSR LIMITED 2014RESULTS PRESENTATION | HALF YEAR ENDED 30 SEPTEMBER 2014
Higher revenues from improved market activity
14
Lightweight Systems Bricks & Roofing
21% 10%
137.1 142.8
Revenue A$m
HYES13 HYES14
Viridian
4%
146.0160.3
Revenue A$m
HYES13 HYES14
372.6
449.4
Revenue A$M
HYES13 HYES14
For
per
sona
l use
onl
y

CSR LIMITED 2014RESULTS PRESENTATION | HALF YEAR ENDED 30 SEPTEMBER 2014
51.8
63.1
HYES13 Volume, price andproduct mix
Acquisitions Investment in growthinitiatives
HYES14
Building Products earnings improving
Building Products movement in half year EBIT
A$m
1 EBITDA and EBIT (before significant items)2 Excludes cash and tax balances at 30 September3 Refer footnote on slide 11.
Building Products EBIT up 22%
– Higher sales volumes and operational improvements
EBIT margin improvement
Reinvesting to meet changes in construction trends
– Launched Gyprock Optimised Core Technology stronger, easier to use and 15% lighter
– Pilot plant for offsite construction of walling systems underway
– Enhancement of CSR Connect online customer transactions and service
15
A$m unless stated 1 HYES14 HYES13 changeLightweight Systems 449.4 372.6 21%Bricks and Roofing 160.3 146.0 10%Trading revenue 609.7 518.6 18%EBITDA 82.9 70.5 18%EBIT 63.1 51.8 22%
Funds employed2 831.8 811.7 2%EBIT/trading revenue 10.3% 10.0%
Return on funds employed3
12.6% 10.7%
CSR LIMITED 2014RESULTS PRESENTATION | HALF YEAR ENDED 30 SEPTEMBER 2014
Revenue growth achieved from pricing initiatives and higher volumes
Significant EBIT improvement
– Full benefit of restructuring initiatives
– Improved utilisation of Dandenong plant
Viridian NZ improvement from strong construction activity and operational initiatives
Viridian significant EBIT improvement
16
Viridian movement in half year EBIT
(10.6)
(7.6)
(0.7)
0.5
HYES13 Volume and pricing Restructuring Viridian NZ JV HYES14
A$m
1 EBITDA and EBIT (before significant items)2 Excludes cash and tax balances.3 Refer footnote on slide 11.
A$m unless stated 1 HYES14 HYES13 changeTrading revenue 142.8 137.1 4%EBITDA 5.3 (4.7) NMEBIT 0.5 (10.6) NM
Funds employed2 183.6 180.0 2%EBIT/trading revenue 0.4% NM
Return on funds employed3
(2.1%) (12.5%)
For
per
sona
l use
onl
y

CSR LIMITED 2014RESULTS PRESENTATION | HALF YEAR ENDED 30 SEPTEMBER 2014
$0
$50
$100
$150
$200
$250
$300
$350
$400
$450
Jun‐12Sep‐12Dec‐12Mar‐13Jun‐13Sep‐13Dec‐13Mar‐14Jun‐14Sep‐14Dec‐14
Increase in aluminium realised prices
Higher ingot premiums led to 8% increase in realised aluminium price of A$2,503 p/t
EBIT margin improved to 16.4% due to higher price and stable production costs at Tomago
Continued to increase hedge book for YEM16
Platts - ingot premium (Japan Port ) – US$ p/t
Source: Platts Metals week
YEM13 YEM14
YEM15
17
Aluminium hedge book (as of 31 October 2014)
1 EBITDA and EBIT (before significant items)2 Includes hedging and premiums3 Excludes cash and tax balances.4 Refer footnote on slide 11
A$m unless stated 1 HYES14 HYES13 changeSales (tonnes) 101,038 95,935 5%
A$ realised price2 $2,503 $2,308 8%Trading revenue 252.9 221.4 14%EBITDA 55.1 37.7 46%EBIT 41.4 24.2 71%
Funds employed3 184.4 216.4 (15%)EBIT/trading revenue 16.4% 10.9%
Return on funds employed4
34.5% 23.7%
HYEM15 YEM16
Average hedged aluminium price A$ per tonne (excludes premiums)
$2,143 $2,269
% of net aluminium exposure hedged 90% 50%
CSR LIMITED 2014RESULTS PRESENTATION | HALF YEAR ENDED 30 SEPTEMBER 2014
Property results higher
Property EBIT of $20.4m includes settlement of two transactions:
– Results includes sale of multi-residential development site at Pyrmont
– Surplus industrial land at Ingleburn in Sydney
Chirnside Park, Vic - 533 lot residential development proceeding on schedule
– 174 sales contracts exchanged to date for stages 2 and 3
18
Chirnside Park development
Stage 1 completed homes
A$m unless stated 1 HYES14 HYES13 change
EBIT 20.4 6.8 200%
1 EBIT (before significant items)
For
per
sona
l use
onl
y

CSR LIMITED 2014RESULTS PRESENTATION | HALF YEAR ENDED 30 SEPTEMBER 2014
Brendale, Qld
~30 ha industrial development Site remediation works completed with
civil works underway
Chirnside Park, Vic
533 lot residential development Stage 2 and 3 sales underway
Erskine Park, NSW
Marketing of remaining 2 hectares, DA approved, industrial sub-division
New Lynn, NZ
Existing brick plant – 5.8 ha high density residential area near Auckland
Narangba, Qld
Former clay quarry – 15 ha future residential
Schofields, NSW
Surplus land at existing brick plant –70 ha future residential
Horsley Park, NSW
Surplus land at existing brick plant –50 ha future industrial
Thornton, NSW
Former clay quarry – 40 ha future residential
Cooroy, Qld Former clay quarry – 20 ha future residential
Current Projects Longer-term opportunities
Strong property pipeline
19
CSR LIMITED 2014RESULTS PRESENTATION | HALF YEAR ENDED 30 SEPTEMBER 2014
4OUTLOOK
CSR LIMITED PRESENTATION 2014
For
per
sona
l use
onl
y

CSR LIMITED 2014RESULTS PRESENTATION | HALF YEAR ENDED 30 SEPTEMBER 2014
20000
30000
40000
50000
60000
70000
80000
90000
100000
110000
120000
pipeline Housing approvals Housing starts Housing completions
21
Multi-residential (MAT) Detached (MAT)
Pipeline remains strong in residential construction
Source: ABS - Pipeline includes dwellings approved and under construction, but not yet completed (ABS cat 8752)
Detached starts running ahead of completions –“stronger for longer”
Multi-res pipeline continues to grow as NSW adds to significant backlog in VIC
20000
30000
40000
50000
60000
70000
80000
90000
100000
110000
120000
pipeline Other res approvals Other res starts Other res completions
CSR LIMITED 2014RESULTS PRESENTATION | HALF YEAR ENDED 30 SEPTEMBER 2014
Outlook for year ending 31 March 2015 (YEM15)
22
Similar growth rate expected in second half as seen in the first half
Longer term steady growth in housing activity and other indicators will lead to increased demand for CSR’s products
Building Products
Aluminium
EBIT is expected to be higher in the full year, subject to timing of another transaction expected to settle in the second half
Property
GAF has approximately 90% of its net aluminium exposure for the second half of the year hedged at A$2,143 per tonne (before premiums)
Ingot premiums are expected to stay near record levels for the remainder of the year while physical shortages persist
Group Current analyst forecast range for CSR net profit after tax (pre significant items) is $111 million to $134 million
CSR expects that group net profit after tax (pre significant items) will be towards the upper end of this range, assuming no material deterioration in our markets
Viridian Turnaround in earnings is expected to continue
Tracking slightly ahead of its stated objective to exit the year with an EBIT positive run-rate
For
per
sona
l use
onl
y

CSR LIMITED PRESENTATION 2014
5APPENDIX
CSR LIMITED 2014RESULTS PRESENTATION | HALF YEAR ENDED 30 SEPTEMBER 2014 24
Review of significant items
A$m (unless stated)HYES14
HYES13 (restated)
Unwind of product liability provision (6.0) (6.3)
Reduction in product liability provision --- 17.0
Legal disputes and warranties 1.9 (7.4)
Transaction costs (2.7) ---
Significant items before tax (6.8) 3.3
Income tax benefit on significant items 5.2 2.2
Significant items after tax (1.6) 5.5
For
per
sona
l use
onl
y